SAR Image Filtering Based on the Heavy-Tailed Rayleigh Model · scientifiques de niveau recherche,...
25
HAL Id: inria-00070514 https://hal.inria.fr/inria-00070514 Submitted on 19 May 2006 HAL is a multi-disciplinary open access archive for the deposit and dissemination of sci- entific research documents, whether they are pub- lished or not. The documents may come from teaching and research institutions in France or abroad, or from public or private research centers. L’archive ouverte pluridisciplinaire HAL, est destinée au dépôt et à la diffusion de documents scientifiques de niveau recherche, publiés ou non, émanant des établissements d’enseignement et de recherche français ou étrangers, des laboratoires publics ou privés. SAR Image Filtering Based on the Heavy-Tailed Rayleigh Model Alin Achim, Ercan E. Kuruoglu, Josiane Zerubia To cite this version: Alin Achim, Ercan E. Kuruoglu, Josiane Zerubia. SAR Image Filtering Based on the Heavy-Tailed Rayleigh Model. [Research Report] RR-5493, INRIA. 2006, pp.21. <inria-00070514>
Transcript of SAR Image Filtering Based on the Heavy-Tailed Rayleigh Model · scientifiques de niveau recherche,...
HAL Id: inria-00070514https://hal.inria.fr/inria-00070514
Submitted on 19 May 2006
HAL is a multi-disciplinary open accessarchive for the deposit and dissemination of sci-entific research documents, whether they are pub-lished or not. The documents may come fromteaching and research institutions in France orabroad, or from public or private research centers.
L’archive ouverte pluridisciplinaire HAL, estdestinée au dépôt et à la diffusion de documentsscientifiques de niveau recherche, publiés ou non,émanant des établissements d’enseignement et derecherche français ou étrangers, des laboratoirespublics ou privés.
SAR Image Filtering Based on the Heavy-TailedRayleigh Model
Alin Achim, Ercan E. Kuruoglu, Josiane Zerubia
To cite this version:Alin Achim, Ercan E. Kuruoglu, Josiane Zerubia. SAR Image Filtering Based on the Heavy-TailedRayleigh Model. [Research Report] RR-5493, INRIA. 2006, pp.21. <inria-00070514>
ISS
N 0
249-
6399
ISR
N IN
RIA
/RR
--54
93--
FR
+E
NG
appor t de r ech er ch e
Thème COG
INSTITUT NATIONAL DE RECHERCHE EN INFORMATIQUE ET EN AUTOMATIQUE
SAR Image Filtering Based on theHeavy-Tailed Rayleigh Model
Alin Achim — Ercan E. Kuruoglu — Josiane Zerubia
N° 5493
February 2005

Unité de recherche INRIA Sophia Antipolis2004, route des Lucioles, BP 93, 06902 Sophia Antipolis Cedex (France)
Téléphone : +33 4 92 38 77 77 — Télécopie : +33 4 92 38 77 65
SAR Image Filtering Based on the
Heavy-Tailed Rayleigh Model
Alin Achim ∗ , Ercan E. Kuruoglu † , Josiane Zerubia ‡
Thème COG — Systèmes cognitifsProjet Ariana
Rapport de recherche n° 5493 — February 2005 — 21 pages
Abstract: Synthetic aperture radar (SAR) images are inherently affected by a signal de-pendent noise known as speckle, which is due to the radar wave coherence. In this report,we propose a novel adaptive despeckling filter and derive a maximum a posteriori (MAP)estimator for the radar cross section (RCS). We first employ a logarithmic transformation tochange the multiplicative speckle into additive noise. We model the RCS using the recentlyintroduced heavy-tailed Rayleigh density function, which was derived based on the assump-tion that the real and imaginary parts of the received complex signal are best describedusing the alpha-stable family of distribution. We estimate model parameters from noisyobservations by means of second-kind statistics theory, which relies on the Mellin transform.Finally, we compare our proposed algorithm with several classical speckle filters applied onactual SAR images. Experimental results show that the homomorphic MAP filter based onthe heavy-tailed Rayleigh prior for the RCS is among the best for speckle removal.
Key-words: Synthetic Aperture Radar, MAP estimation, alpha-stable distributions,heavy-tailed Rayleigh model, Mellin transform
∗ Signal Processing Group, Department of Electrical & Electronic Engineering, University of Bristol, BS81UB, Bristol (UK), e-mail: [email protected]
† Signals and Images Laboratory, ISTI-CNR, Area della Ricerca CNR di Pisa, via G. Moruzzi 1, I-56124,Pisa (Italy), e-mail: [email protected]
‡ Projet Ariana, UR INRIA Sophia Antipolis, 2004 Route des Lucioles, B.P. 93, FR-06902, SophiaAntipolis Cedex (France), e-mail: [email protected]
Filtrage d’ Images Radar RSO Fondé sur
le Modèle de Rayleigh à Queue Lourde
Résumé : Les images issues d’un radar à synthèse d’ouverture (RSO) sont affectées demanière inhérente par un bruit dépendant du signal, généralement connu sous le nom debruit de chatoiement et qui est dû à la cohérence de l’onde radar. Dans ce rapport, nousproposons un nouveau filtre adaptatif pour débruiter les images RSO et nous déduisonsun estimateur du maximum a posteriori (MAP) pour la section efficace du diagramme degain en radar. On utilise d’abord une transformée logarithmique afin de changer le bruitmultiplicatif en bruit additif. Nous modélisons la section efficace à l’aide d’une densité deprobabilité récemment introduite - la densité de Rayleigh à queue lourde, qui a été obtenueen supposant que les parties réelles et imaginaires du signal complexe reçu peuvent êtremieux caractérisées à l’aide de la famille des distributions alpha-stables. Nous estimonsles paramètres du modèle à partir d’observations bruitées en faisant appel à la théoriestatistique de deuxième espèce qui est fondée sur la transformée de Mellin. Enfin, nousfaisons la comparaison entre la méthode que nous proposons et d’autres filtres classiquespour le débruitage d’images RSO. Nos résultats expérimentaux démontrent que le filtre MAPhomomorphique fondé sur le modèle de Rayleigh à queue lourde est parmi les meilleurs pourenlever le bruit de chatoiement.
Mots-clés : Radar à Synthèse d’Ouverture (RSO), estimation MAP, distributions alpha-stables, modèle de Rayleigh à queue lourde, transformée de Mellin
SAR Image Filtering Based on the Heavy-Tailed Rayleigh Model 3
Contents
1 Introduction 4
2 Statistical modeling of SAR images 5
2.1 Statistics of log-transformed speckle . . . . . . . . . . . . . . . . . . . . . . . 52.1.1 Intensity Image . . . . . . . . . . . . . . . . . . . . . . . . . . . . . . . 62.1.2 Amplitude Image . . . . . . . . . . . . . . . . . . . . . . . . . . . . . . 7
2.2 The generalized Rayleigh model . . . . . . . . . . . . . . . . . . . . . . . . . . 82.2.1 Symmetric Alpha-Stable Distributions . . . . . . . . . . . . . . . . . . 82.2.2 A Heavy-Tailed Rayleigh model . . . . . . . . . . . . . . . . . . . . . . 8
3 Adaptive MAP filtering of speckle noise 9
3.1 Parameter estimation using Mellin transform . . . . . . . . . . . . . . . . . . 113.1.1 Mellin transform . . . . . . . . . . . . . . . . . . . . . . . . . . . . . . 113.1.2 Log-moment estimation of the generalized Rayleigh model . . . . . . . 12
4 Experimental Results 14
4.1 Synthetic Data Examples . . . . . . . . . . . . . . . . . . . . . . . . . . . . . 144.2 Real SAR Imagery Examples . . . . . . . . . . . . . . . . . . . . . . . . . . . 15
5 Conclusions 18
6 Acknowledgement 18
RR n° 5493
4 A. Achim, E. E. Kuruoglu & J. Zerubia
1 Introduction
Over the last couple of decades, there has been a growing interest in synthetic aperture radar(SAR) imaging on account of its importance in a variety of applications such as remotesensing for mapping, search-and-rescue, mine detection, and target recognition. SAR isan active coherent microwave imaging method that utilizes the motion of a radar physicalaperture antenna mounted on a platform, such as an aircraft or a satellite, to synthesizethe effect of a long aperture in order to achieve the high resolution of a virtual focusedarray system with a much larger aperture [1]. Modern airborne and satellite-borne SARsystems are capable of producing high-quality pictures of the earth’s surface while avoidingsome of the shortcomings of other forms of remote imaging systems. Specifically, SARimaging systems overcome the night-time limitations of optical cameras and the cloud-coverlimitations of infrared imagers.
A major issue in SAR imagery is that basic textures are generally affected by multiplica-tive speckle noise [2]. Speckle noise is a consequence of image formation under coherentradiation. It is not truly a noise in the typical engineering sense, since its texture oftencarries useful information about the scene being imaged. However, the presence of speckleis generally considered undesirable since it damages radiometric resolution and it affects thetasks of human interpretation and scene analysis. Thus, it appears sensible to reduce specklein SAR images, provided that the structural features and textural information are not lost.
Many adaptive filters for SAR image denoising have been proposed in the past. Thesimplest approaches to speckle reduction are based on temporal averaging [2, 3], medianfiltering, and Wiener filtering. The classical Wiener filter, which utilizes the second orderstatistics of the Fourier decomposition, is not adequate for removing speckle since it isdesigned mainly for additive noise suppression. To address the multiplicative nature ofspeckle noise, Jain developed a homomorphic approach, which by taking the logarithm ofthe image, converts the multiplicative into additive noise, and consequently applies theWiener filter [4]. The Frost filter was designed as an adaptive Wiener filter that assumedan autoregressive (AR) exponential model for the scene reflectivity [5]. Kuan considereda multiplicative speckle model and designed a linear filter based on the minimum mean-square error (MMSE) criterion, optimal when both the scene and the detected intensitiesare Gaussian distributed [6]. The Lee MMSE filter was a particular case of the Kuanfilter based on a linear approximation made for the multiplicative noise model [7]. A two-dimensional Kalman filter was developed by Sadjadi and Bannour under the modeling ofthe image as a Markov field satisfying a causal AR model [8]. For the case of co-registeredSAR images, Bruniquel and Lopes [9] developed a speckle reduction method based on pixel-to-pixel summation. The Gamma MAP filter was based on a Bayesian analysis of theimage statistics where both radar cross section (RCS) and speckle noise follow a Gammadistribution [10]. Finally, a number of recently developed filters were based on wavelettransform [11, 12, 13, 14].
Although wavelet-based filters have been shown to generally outperform those basedon single scale representations of signals, the overall performance of the former could beimproved by adopting better statistical models for the later. Indeed, in [14] Solbo and
INRIA
SAR Image Filtering Based on the Heavy-Tailed Rayleigh Model 5
Eltoft developed the Γ−WMAP filter, a filter based on the same statistical assumptions asfor the Gamma MAP but implemented in the wavelet domain. Specifically, they proposedthe use of normal inverse Gaussian (NIG) distributions as a statistical model for the waveletcoefficients of both the reflectance image and the noise. Then, in order to implement a MAPprocessor, they estimate the parameters of the NIG distributions by relating the cumulantsin the wavelet domain to the cumulants of the assumed Gamma distributions in the pixeldomain. We believe, their methodology could further be improved by making use of modelsthat better characterize the statistical properties of the RCS.
In this report we propose the use of an alternative RCS model for designing a speckleremoval filter. Thus, we employ the heavy-tailed Rayleigh distribution [15] that was shownto be well justified by the physics of the radar wave scattering. Specifically, the model wasdeveloped based on the observation that the real and imaginary parts of the received com-plex signal can be accurately modelled using the symmetric alpha-stable family of distribu-tion [16, 17]. The generalized Gaussian Rayleigh model [18, 19] arising from the assumptionthat the real and imaginary parts of the backscattered SAR signal are distributed accord-ing to a generalized Gaussian distribution, could have been an equally appropriate choice.Under the assumption of a multiplicative speckle noise model, we first employ a logarithmictransformation in order to change the noise into an additive one and to differentiate its char-acteristics from the signal characteristics. Then, the general MAP solution for the resultingmodel is derived and the model parameter estimation is presented. The proposed estimationmethod is based on the second-kind statistic theory employing Mellin’s transform [20] asrecently proposed by Nicolas and co-authors [21, 22].
The report is organized as follows. In Section 2 we discuss the statistical properties ofSAR images, as well as those of log-transformed images. In Section 3, we present the designof our MAP estimator based on the heavy-tailed Rayleigh signal model, which includes anovel parameter estimation method based on Mellin transform. In Section 4, we evaluatethe performance of our proposed filter and we compare it with existing speckle removalmethods. Finally, in Section 5 we conclude the report with a short summary.
2 Statistical modeling of SAR images
Parametric Bayesian processing presupposes proper modeling for the prior probability den-sity function (pdf) of both the radar cross section and speckle noise. In this section webriefly review the statistical properties of speckle and we describe the model used for theRCS.
2.1 Statistics of log-transformed speckle
Speckle noise affects all coherent imaging systems including laser, SAR imagery, and ultra-sound. Speckle may appear distinct in different imaging systems but it is always manifestedin a granular pattern due to image formation under coherent waves.
RR n° 5493
6 A. Achim, E. E. Kuruoglu & J. Zerubia
The statistical properties of speckle noise were studied by Goodman [2]. He has shownthat, if the number of scatterers per resolution cell is large, a fully developed speckle patterncan be modeled as the magnitude of a complex Gaussian field with i.i.d. real and imaginarycomponents. Realistic speckle noise models have been developed in the past and includethe K-distribution [23], G-distribution [24], log-normal distribution [13, 25], and correlatedspeckle pattern [23, 26]. A general model for speckle noise proposed by Jain [4] is constantlyemployed when one is concerned with the implementation of a homomorphic filter. Specif-ically, if we denote by y(u, v) a noisy observation (i.e., the recorded SAR image envelope)of the two-dimensional function x(u, v) (i.e., the noise-free SAR image that has to be re-covered) and by η(u, v) and ξ(u, v) the corrupting multiplicative and additive speckle noisecomponents, respectively, one can write:
y(u, v) = x(u, v) · η(u, v) + ξ(u, v), (u, v) ∈ Z2 (1)
Generally, the effect of the additive component of the speckle in SAR images is less significantthan the effect of the multiplicative component. Thus, ignoring the term ξ(u, v), one canrewrite (1) as
y(u, v) = x(u, v) · η(u, v) (2)
To transform the multiplicative noise model into an additive one, we apply the logarithmicfunction on both sides of (2):
log y(u, v) = log x(u, v) + log η(u, v). (3)
Expression (2) can be rewritten as
Y (u, v) = X(u, v) +N(u, v), (4)
where Y (·), X(·), and N(·) are the logarithms of y(·), x(·), and η(·), respectively. In sec-tions 2.1.1 and 2.1.2 , we briefly describe the statistical properties of speckle noise in boththe original and the logarithmic transform domain.
2.1.1 Intensity Image
The statistical properties of speckle noise have been first studied by Arsenault and April [27]who have shown that when the image intensity is logarithmically transformed, speckle isapproximately Gaussian additive noise, and it tends to a normal probability much fasterthan the distribution of the intensity image. Xie et al. employ a distance between cumulativedistributions to measure the deviation of the log-transformed speckle from Gaussianity [28].They confirm the result in [27] and show that even for the amplitude image, although thelog-transformed speckle tends to a Gaussian pdf slightly slower than the original specklenoise, the former is still statistically very close to the Gaussian PDF. Nevertheless, closedform analytical expressions can be obtained for the logarithmically transformed speckle noisestarting from the physics of wave scattering. For a SAR image representing an average of
INRIA
SAR Image Filtering Based on the Heavy-Tailed Rayleigh Model 7
L looks in intensity format, the speckle noise random variable η in (2) follows a Gammadistribution with unit mean and variance 1/L. Its pdf can be written as
pI(η) =LLηL−1e−Lη
Γ(L)(5)
For reasons that will become obvious within the next sections, we also provide here the firstand second orders log-cumulants of a Gamma distribution
kI(1) = Ψ(L) − log(L)
kI(2) = Ψ(1, L) (6)
where Ψ is the Digamma function and Ψ(r, L) is the Polygamma function, i.e. the r-thderivative of the Digamma function. Having in mind that p(η)dη = p(N)dN , one canreadily obtain the pdf of the random variable N = log η
pI(N) =LLeNLe−LeN
Γ(L)(7)
2.1.2 Amplitude Image
For an amplitude image, the pdf and the expressions for the log-cumulants can be obtainedfrom the ones corresponding to the intensity image by recalling that [21]
pA(x) = 2xpI(x2) (8)
kA(r) = (1
2)r
kI(r) (9)
Consequently, using the above expressions with (5) and (6) one obtain respectively
pA(η) =2LLη2L−1e−Lη2
Γ(L)(10)
which is basically the Nakagami distribution and
kA(1) =1
2(Ψ(L) − log(L))
kA(2) =1
4Ψ(1, L) (11)
Finally, the pdf of the random variable N = log(η) for amplitude images is given by
pA(N) =2LLe2NLe−Le2N
Γ(L)(12)
RR n° 5493
8 A. Achim, E. E. Kuruoglu & J. Zerubia
2.2 The generalized Rayleigh model
The SAR image formation theory has been long time dominated by the assumption ofGaussianity for the real and imaginary parts of the received complex signals. Based onthis assumption, the detected amplitude SAR images can be modeled by a Rayleigh dis-tribution. However, as we will show in this section, invoking a generalized version of thecentral limit theorem, the assumption of Gaussianity can be replaced by an assumptionof “alpha-stability” resulting in a more powerful model for the detected amplitude pdf. Inthe following we provide a brief, necessary overview of the alpha-stable statistical model onwhich the generalized Rayleigh pdf is actually based.
2.2.1 Symmetric Alpha-Stable Distributions
The appeal of SαS distributions as a statistical model for signals derives from two maintheoretical reasons. First, stable random variables satisfy the stability property which statesthat linear combinations of jointly stable variables are indeed stable. The word stable is usedbecause the shape of the distribution is unchanged (or stable) under such linear combina-tions. Second, stable processes arise as limiting processes of sums of independent identicallydistributed (i.i.d.) random variables via the generalized central limit theorem. Actually, theonly possible non-trivial limit of normalized sums of i.i.d. terms is stable.
The SαS distribution lacks a compact analytical expression for its probability densityfunction (pdf). Consequently, it is most conveniently represented by its characteristic func-tion
ϕ(ω) = exp(δω − γ|ω|α) (13)
where α is the characteristic exponent, taking values 0 < α ≤ 2, δ (−∞ < δ < ∞) is thelocation parameter, and γ (γ > 0) is the dispersion of the distribution. For values of α in theinterval (1, 2], the location parameter δ corresponds to the mean of the SαS distribution,while for 0 < α ≤ 1, δ corresponds to its median. The dispersion parameter γ determinesthe spread of the distribution around its location parameter δ, similar to the variance of theGaussian distribution.
The characteristic exponent α is the most important parameter of the SαS distributionand it determines the shape of the distribution. The smaller the characteristic exponent α is,the heavier the tails of the SαS density. This implies that random variables following SαSdistributions with small characteristic exponents are highly impulsive. One consequence ofheavy tails is that only moments of order less than α exist for the non-Gaussian alpha-stable family members. As a result, stable laws have infinite variance. Gaussian processesare stable processes with α = 2 while Cauchy processes result when α = 1.
2.2.2 A Heavy-Tailed Rayleigh model
Kuruoglu and Zerubia [15] assumed that the real and imaginary parts of the received SARsignal are jointly SαS. Consequently, they derived the following integral equation for the
INRIA
SAR Image Filtering Based on the Heavy-Tailed Rayleigh Model 9
amplitude pdf of SAR images, which they called the heavy-tailed Rayleigh distribution:
p(x) = x
∫ ∞
0
u exp(−γuα)J0(ux)du (14)
where J0 is the zeroth order Bessel function of the first kind.It is important to note at this point, that by considering the special case α = 2, we
obtain
p(x) =x
2γexp(−x
2
4γ) (15)
which is basically the classical Rayleigh distribution as expected since for α = 2 the SαSdistribution reduces to Gaussian. In fact, in [15] the authors have shown that the heavy-tailed Rayleigh distribution can be expressed as a mixture of Rayleighs. Also, by takingα = 1 in (14), one obtains the following pdf, which we will refer to as the Cauchy-Rayleighmodel
p(x) =xγ
(x2 + γ2)3/2(16)
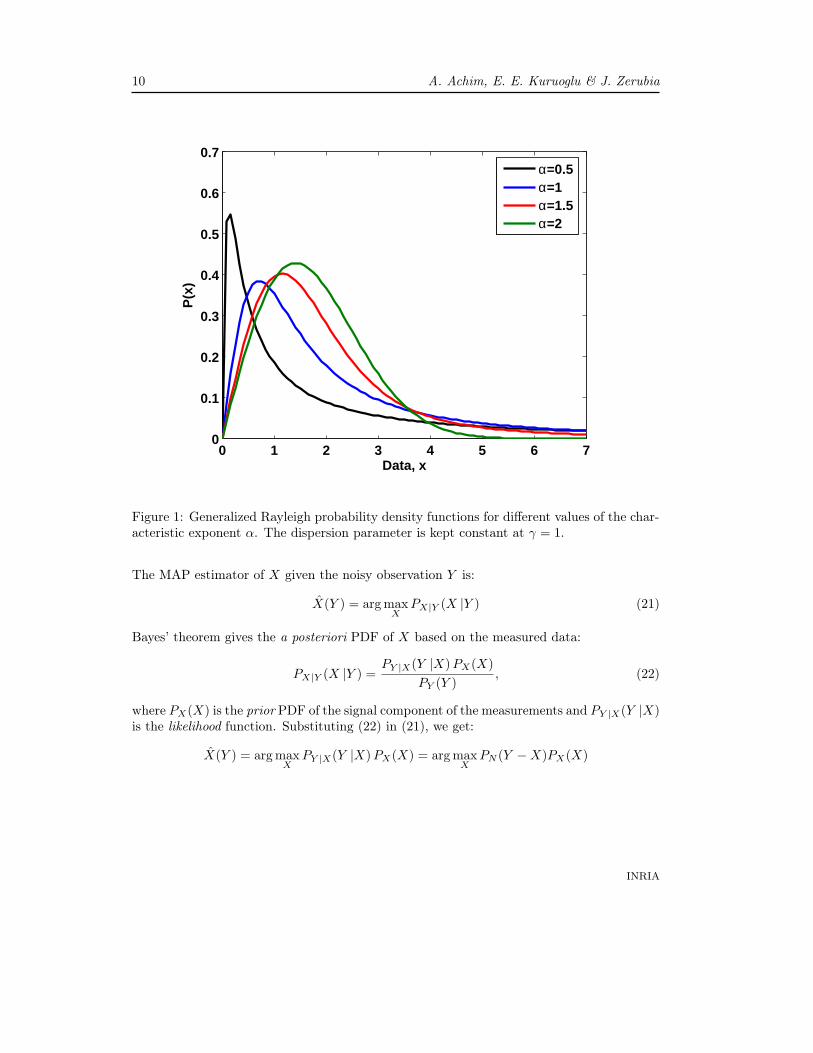
In Fig. 1 we show the tail behavior of several heavy-tailed Rayleigh densities includingthe particular cases corresponding to the Cauchy and the Gaussian distributions. For thecase of images in intensity format the pdf can be readily obtained from (14) recalling thatpA(x) = 2xpI(x
2). Thus, one obtain
pI(x) =1
2
∫ ∞
0
u exp(−γuα)J0(u√x)du (17)
In our further developments we will employ a homomorphic transformation in order totransform the multiplicative speckle noise into an additive one. Consequently, let us alsoprovide here the logarithmic domain pdfs corresponding to the heavy-tailed Rayleigh modelin both amplitude and intensity formats respectively
pA(X) = e2X
∫ ∞
0
u exp(−γuα)J0(ueX)du (18)
pI(X) =eX
2
∫ ∞
0
u exp(−γuα)J0(ueX
2 )du (19)
where X = lnx.
3 Adaptive MAP filtering of speckle noise
After applying a logarithmic transformation to the original data we get an image representedas the sum of the transformations of the signal and of the noise:
Y = X +N (20)
RR n° 5493
10 A. Achim, E. E. Kuruoglu & J. Zerubia
0 1 2 3 4 5 6 70
0.1
0.2
0.3
0.4
0.5
0.6
0.7
Data, x
P(x
)α=0.5α=1α=1.5α=2
Figure 1: Generalized Rayleigh probability density functions for different values of the char-acteristic exponent α. The dispersion parameter is kept constant at γ = 1.
The MAP estimator of X given the noisy observation Y is:
X(Y ) = arg maxX
PX|Y (X |Y ) (21)
Bayes’ theorem gives the a posteriori PDF of X based on the measured data:
PX|Y (X |Y ) =PY |X(Y |X)PX(X)
PY (Y ), (22)
where PX(X) is the prior PDF of the signal component of the measurements and PY |X(Y |X)is the likelihood function. Substituting (22) in (21), we get:
X(Y ) = arg maxX
PY |X(Y |X)PX(X) = arg maxX
PN (Y −X)PX(X)
INRIA
SAR Image Filtering Based on the Heavy-Tailed Rayleigh Model 11
= arg maxX
PN (N)PX(X) (23)
In the above equation we use a heavy-tailed Rayleigh model for the signal component, whilewe use a Gamma or Nakagami model for the noise component depending on whether theimage to be filtered is in intensity or in amplitude format, respectively. Naturally, in orderfor the processor in Eq. (23) to be of any practical use, one should be able to estimate theparameters αX and γX of the signal from the observed data. In the next subsection wederive parameter estimation methods for the generalized Rayleigh pdf based on second-kindcumulants.
3.1 Parameter estimation using Mellin transform
In order to develop a robust MAP filter for SAR images, the heavy-tailed Rayleigh modelparameters characterizing the RCS need to be accurately estimated from noisy observations.Following the arguments in [29] and [30], Nicolas has recently proposed the use of Mellintransform as a powerful tool for deriving novel parameter estimation methods based on log-cumulants for the case of multiplicative noise contamination [21, 22]. In the following, webriefly review the Mellin transform and its main properties that we used in our derivations.
3.1.1 Mellin transform
Let f be a function defined over <+. The integral transform defined by
Φ(s) = M[f(u)](s) =
∫ +∞
0
us−1f(u)du (24)
is called the Mellin transform of f . The inverse transform is given by
f(u) = M−1[Φ(s)](u) =1
2πj
∫ c+j∞
c−j∞
u−sΦ(s)ds (25)
The transform Φ(s) exists if the integral∫ +∞
0|f(x)|xk−1dx is bounded for some k > 0, in
which case the inverse f(u) exists with c>k. The functions Φ(s) and f(u) are called a Mellintransform pair, and either can be computed if the other is known.
By analogy with the way in which common statistics are deducted based on FourierTransform, the following second-kind statistic functions can be defined, based on MellinTransform [21, 22]
• Second-kind first characteristic function
Φ(s) =
∫ +∞
0
xs−1p(x)dx (26)
• Second-kind second characteristic function
Ψ(s) = log(Φ(s)) (27)
RR n° 5493
12 A. Achim, E. E. Kuruoglu & J. Zerubia
• rth order second-kind moments
mr =drΦ(s)
dsr
∣∣s=1
=
∫ +∞
0
(log x)rp(x)dx (28)
• rth order second-kind cumulants
kr =drΨ(s)
dsr
∣∣s=1
(29)
The first two second-kind cumulants can be estimated empirically from N samples yi
as follows
ˆk1 =
1
N
N∑
i=1
[log(yi)]
ˆk2 =
1
N
N∑
i=1
[(log(yi) − ˆk1)
2] (30)
• Finally, for two functions f and g, Mellin’s convolution is defined over the interval[0,∞] as
(f ∗g)(y) =
∫ +∞
0
f(x)g(y
x)dx
x=
∫ +∞
0
f(y
x)g(x)
dx
x(31)
3.1.2 Log-moment estimation of the generalized Rayleigh model
By plugging the expression of the heavy-tailed Rayleigh pdf given by (14) into (26) and aftersome straightforward manipulations, details of which can be found in [15], one gets
Φ(s) =2sΓ( s+1
2 )γs−1
α Γ( 1−sα )
Γ( 1−s2 )α
(32)
which is the second-kind first characteristic function of the heavy-tailed Rayleigh density.Kuruoglu and Zerubia [15, 31] used this expression for two different values of s and sub-sequently solved the resulting system in order to get estimates of the parameters α andγ. However, here we are interested in deriving estimates of the model parameters in thecase of multiplicative noise contamination. Consequently, we settled by plugging the aboveexpression in (27) and subsequently in (29), thus obtaining the following results for thesecond-kind cumulants of the model
kA(1) = −ψ(1)1 − α
α+ log(2γ
1
α )
kA(2) =ψ(1, 1)
α2(33)
INRIA
SAR Image Filtering Based on the Heavy-Tailed Rayleigh Model 13
For the case of intensity images, using the same methodology as above one can obtain thefollowing expressions for the log-cumulants
kI(1) = −2ψ(1)1 − α
α+ log(4γ
2
α )
kI(2) = 4ψ(1, 1)
α2(34)
Using either of the above systems of two equations one can readily solve for the para-meters α and γ of the heavy-tailed Rayleigh distribution. Remember however that ourmeasurement is a mixture of heavy-tailed Rayleigh signal and Nakagami (or Gamma) dis-tributed speckle noise. Under the multiplicative speckle noise model (2), if we denote bypy(y), px(x), and pη(η) the pdfs of y, x, η respectively, it can be shown that the pdf of y isgiven in fact by the Mellin convolution between the pdfs of x and η, since
py(y) =
∫ +∞
0
py|x(y|x)px(x)dx =
∫ +∞
0
pη(y
x)px(x)
dx
x= pη ∗px (35)
Consequently, the second-kind cumulant of any order of y is given by the sum of the second-kind cumulants of the same order of x and η [21]
ky(r) = kx(r) + kη(r) (36)
Using expressions (6) and (34) in the above equation together with the empirical log-cumulants in (30) we obtain the following estimates for the parameters of the heavy-tailedRayleigh model (17) mixed with Gamma distributed speckle noise
α = 2 ·√√√√ ψ(1, 1)
ˆk(2) − ψ(1, L)
γ = [exp(
ˆk(1) + 2ψ(1) 1−α
α − ψ(L) + log(L)
4]α/2 (37)
Similarly, for the case of amplitude images, using expressions (11) and (33) in (36) with theempirical log-cumulants in (30) we get
α =
√√√√ ψ(1, 1)
ˆk(2) − 1
4 · ψ(1, L)
γ = [exp(
ˆk(1) + ψ(1) 1−α
α − 12 (ψ(L) − log(L))
2]α (38)
RR n° 5493
14 A. Achim, E. E. Kuruoglu & J. Zerubia
4 Experimental Results
In this section, we present simulation results obtained by processing several test SAR im-ages using our proposed MAP speckle filter based on the heavy-tailed Rayleigh prior. Wecompared the results of our approach with those obtained using other classical speckle filtersincluding the median, the homomorphic Wiener, the Lee, and the Γ-MAP filter.
4.1 Synthetic Data Examples
We started by first degrading an original “speckleless" image with synthetic speckle in ampli-tude format. For this purpose, an aerial image was chosen due to its identical content withreal SAR images. This image was obtained by cropping the “westaerialconcorde" image thatcan be found in Matlab’s Image Processing Toolbox. In our experiments, we considered fourdifferent levels of simulated speckle noise corresponding to L =1, 3, 9, and 12 (cf. eq. 10).
In order to assess the quality of our proposed filter we computed two different measuresbased on the original and the denoised data. A common way to evaluate the noise suppres-sion in case of multiplicative contamination is to calculate the signal-to-mean squared error(S/MSE) ratio, defined as [25]:
S/MSE = 10 log10(
K∑
i=1
S2i /
K∑
i=1
(Si − Si)2) (39)
where S is the original image, S is the denoised image, and K is the image size. Thismeasure corresponds to the classical SNR in the case of additive noise.
In addition to the above quantitative performance measure, we also consider a qualitativemeasure for edge preservation. Specifically, we used a parameter β originally defined in [32]:
β =Γ(∆S − ∆S, ∆S − ∆S)√
Γ(∆S − ∆S,∆S − ∆S) · Γ(∆S − ∆S, ∆S − ∆S)
(40)
where ∆S and ∆S are the high-pass filtered versions of S and S respectively, obtained witha 3 × 3-pixel standard approximation of the Laplacian operator, and
Γ(S1, S2) =
K∑
i=1
S1i· S2i
. (41)
The correlation measure, β should be close to unity for an optimal effect of edge preservation.For this experiment we chose to compare our filter with the median, the homomorphicWiener and the Lee filters. All these filters were implemented adaptively using a squareshaped sliding window of size 7× 7. The obtained values of S/MSE, and β for all methodsapplied to our test image are given in Table 1. From the table it can be seen that, in mostsituations, our proposed filter exhibits the best performance according to both metrics.
INRIA

SAR Image Filtering Based on the Heavy-Tailed Rayleigh Model 15
Table 1: Image enhancement measures obtained by four denoising methods applied on the“aerial” image. Four levels of noise are considered corresponding to ENL=1, 3, 9, and 12.The S/MSE of each despeckled image is given in dB.
ENL = 1 ENL = 3 ENL = 9 ENL = 12
Method S/MSE β S/MSE β S/MSE β S/MSE β
Median 14.53 0.2421 15.52 0.3309 15.85 0.3639 15.88 0.3677
Wiener 14.23 0.3187 15.27 0.3812 15.56 0.4097 15.60 0.4150
Lee 14.69 0.2118 15.35 0.3540 16.64 0.5417 17.28 0.6186
proposed 15.86 0.2556 16.83 0.3541 18.00 0.5833 18.68 0.6471
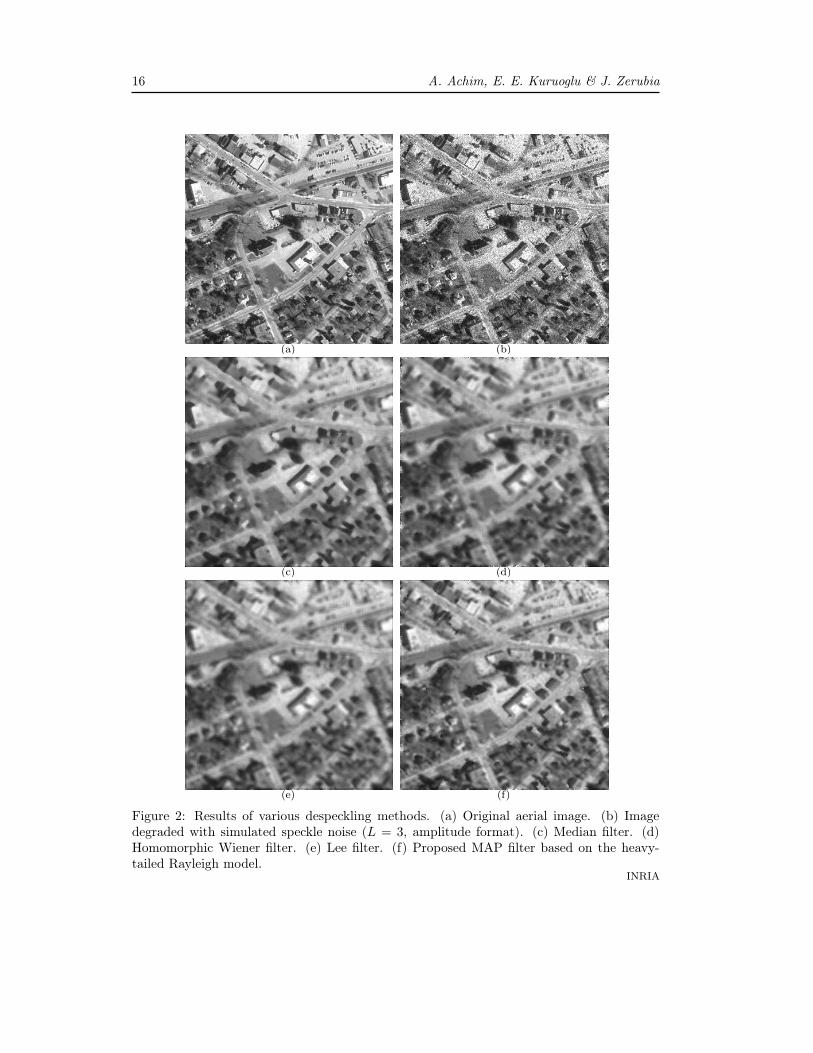
Figure 2 shows a representative result from the processing of the aerial test image. Theimage in Figure 2(b) was obtained by degrading the original test image (2(a)) with Nakagamidistributed speckle noise (cf. eq. 10) with L = 3 looks. From the figure it can be seen thatall the tested filters achieved a good speckle surpressing performance. However, clearly ourhomomorphic MAP filter based on the heavy-tailed Rayleigh signal prior did the best jobin preserving the structural features that can be observed in the original image.
4.2 Real SAR Imagery Examples
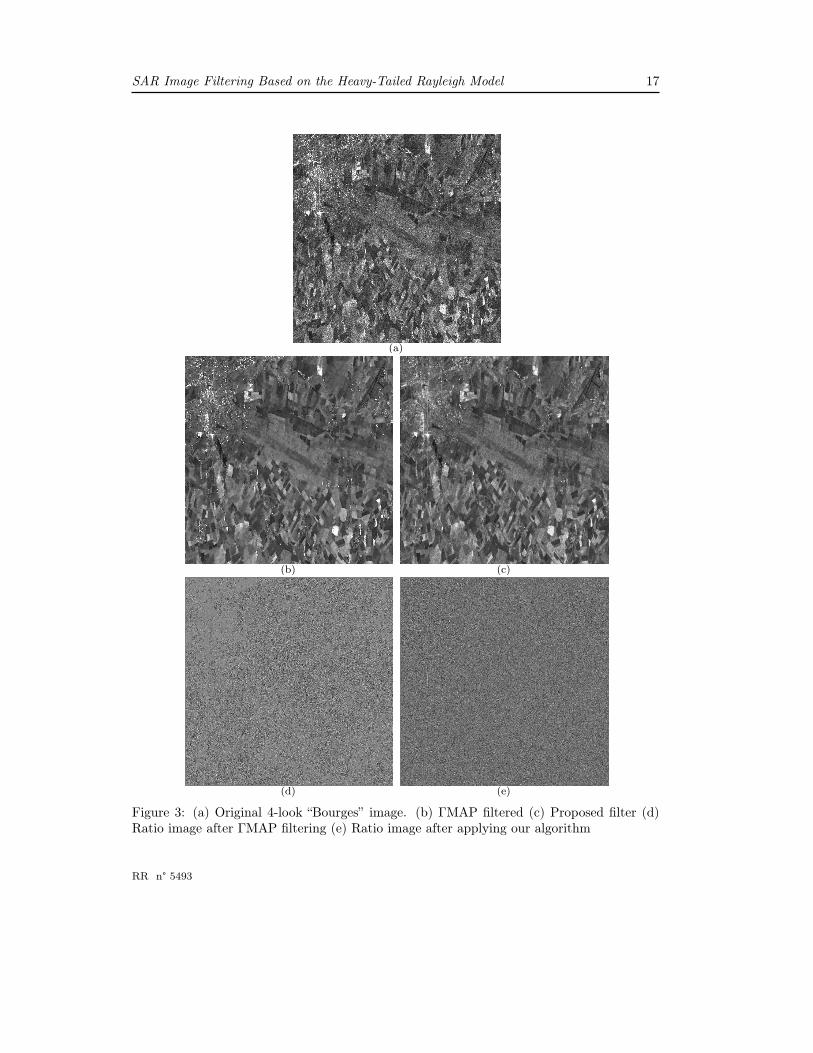
In order to further study the merit of the proposed generalized Rayleigh-based MAP proces-sor, we also chose noisy SAR images, we applied the algorithm without artificially addingnoise, and we visually evaluated the denoised images. The test image, shown in Figure 3(a),depicts mainly a rural scene, but one can also see the city of Bourges and some other villages,forests, an airport, a river and many roads. The image is in 4-looks, amplitude format andwas acquired in April 1993 by ERS.
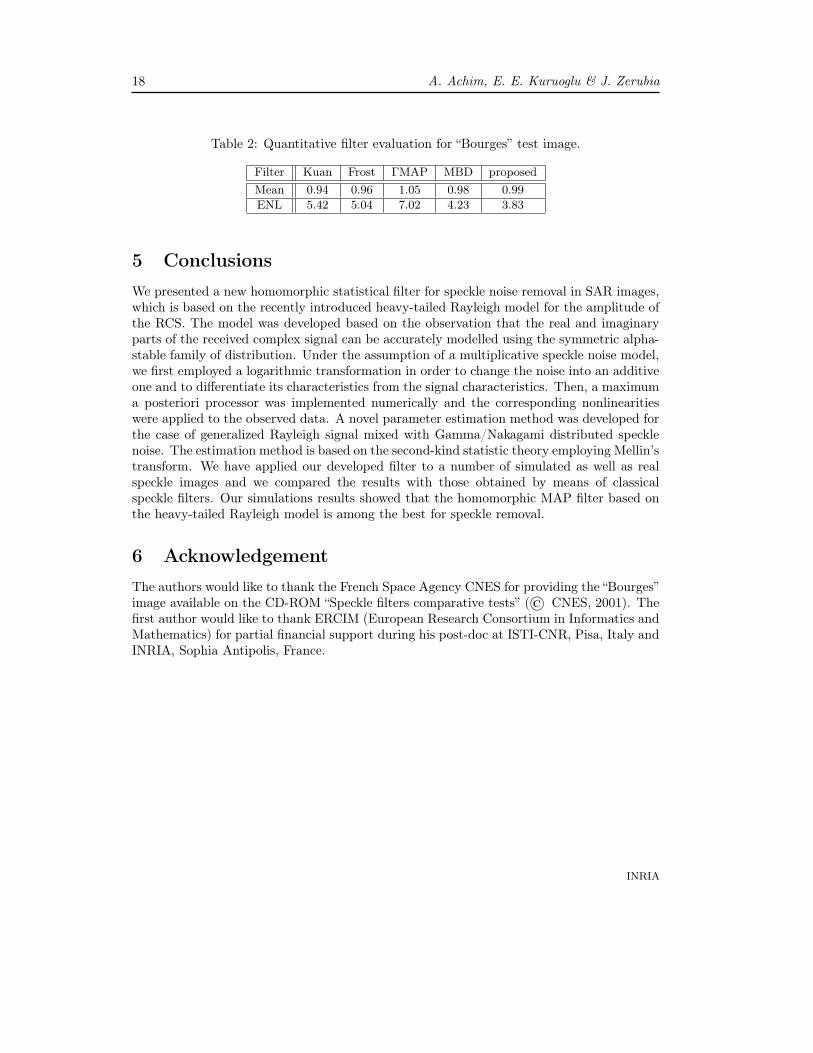
For visually assessing the quality of filtered images, we show results obtained usingthe ΓMAP filter (Figures 3(b)) and the generalized Rayleigh-based MAP (Figures 3(c)).Although qualitative evaluation in this case is highly subjective, i.e., no universal qualitymeasure for filtered SAR data exists, we also chose to study the ratio image [33], which isthe ratio of the original image (speckled) by the denoised image. Ideally, in areas of theimage where speckle is fully developed, this ratio should have the characteristics of purespeckle. Thus, the best filter is the one for which the ratio image has the mean value closerto unity and the equivalent number of looks closer to 4. The results of this experiment areshown in Table 2 together with the results obtained after processing the original image bymeans of Kuan, Frost, ΓMAP and MBD [33] filters.
The results of the above experiment seem to be consistent with the simulation results inthe previous section, the best performance being again achieved by our proposed algorithm.Altough conceptually similar with the ΓMAP filter, we attribute the better performance ofour proposed filter to the better performance of the generalized Rayleigh model in capturingthe heavy-tailed nature of SAR data.
RR n° 5493
16 A. Achim, E. E. Kuruoglu & J. Zerubia
(a) (b)
(c) (d)
(e) (f)
Figure 2: Results of various despeckling methods. (a) Original aerial image. (b) Imagedegraded with simulated speckle noise (L = 3, amplitude format). (c) Median filter. (d)Homomorphic Wiener filter. (e) Lee filter. (f) Proposed MAP filter based on the heavy-tailed Rayleigh model.
INRIA
SAR Image Filtering Based on the Heavy-Tailed Rayleigh Model 17
(a)
(b) (c)
(d) (e)
Figure 3: (a) Original 4-look “Bourges” image. (b) ΓMAP filtered (c) Proposed filter (d)Ratio image after ΓMAP filtering (e) Ratio image after applying our algorithm
RR n° 5493
18 A. Achim, E. E. Kuruoglu & J. Zerubia
Table 2: Quantitative filter evaluation for “Bourges” test image.
Filter Kuan Frost ΓMAP MBD proposed
Mean 0.94 0.96 1.05 0.98 0.99
ENL 5.42 5.04 7.02 4.23 3.83
5 Conclusions
We presented a new homomorphic statistical filter for speckle noise removal in SAR images,which is based on the recently introduced heavy-tailed Rayleigh model for the amplitude ofthe RCS. The model was developed based on the observation that the real and imaginaryparts of the received complex signal can be accurately modelled using the symmetric alpha-stable family of distribution. Under the assumption of a multiplicative speckle noise model,we first employed a logarithmic transformation in order to change the noise into an additiveone and to differentiate its characteristics from the signal characteristics. Then, a maximuma posteriori processor was implemented numerically and the corresponding nonlinearitieswere applied to the observed data. A novel parameter estimation method was developed forthe case of generalized Rayleigh signal mixed with Gamma/Nakagami distributed specklenoise. The estimation method is based on the second-kind statistic theory employing Mellin’stransform. We have applied our developed filter to a number of simulated as well as realspeckle images and we compared the results with those obtained by means of classicalspeckle filters. Our simulations results showed that the homomorphic MAP filter based onthe heavy-tailed Rayleigh model is among the best for speckle removal.
6 Acknowledgement
The authors would like to thank the French Space Agency CNES for providing the “Bourges”image available on the CD-ROM “Speckle filters comparative tests” (© CNES, 2001). Thefirst author would like to thank ERCIM (European Research Consortium in Informatics andMathematics) for partial financial support during his post-doc at ISTI-CNR, Pisa, Italy andINRIA, Sophia Antipolis, France.
INRIA
SAR Image Filtering Based on the Heavy-Tailed Rayleigh Model 19
References
[1] M. Soumekh, Synthetic Aperture Radar Signal Processing. New York: John Wiley and
Sons, 1999.
[2] J. W. Goodman, “Some fundamental properties of speckle,” J. Opt. Soc. Amer., vol. 66,
pp. 1145–1150, November 1976.
[3] J. G. Abbott and F. L. Thurstone, “Acoustic speckle: Theory and experimental analy-
sis,” Ultrason. Imag., vol. 1, pp. 303–324, 1979.
[4] A. K. Jain, Fundamental of Digital Image Processing. NJ: Prentice-Hall, 1989.
[5] V. S. Frost, J. A. Stiles, K. S. Shanmugan, and J. C. Holtzman, “A model for radar
images and its application to adaptive digital filtering of multiplicative noise,” IEEE
Trans. on Pattern Anal. and Machine Intell., vol. 4, pp. 157–166, 1982.
[6] D. T. Kuan, A. A. Sawchuk, T. C. Strand, and P. Chavel, “Adaptive noise smooth-
ing filter for images with signal-dependent noise,” IEEE Trans. on Pattern Anal. and
Machine Intell., vol. 7, pp. 165–177, 1985.
[7] J. S. Lee, “Digital image enhancement and noise filtering by use of local statistics,”
IEEE Trans. on Pattern Anal. and Machine Intell., vol. 2, pp. 165–168, 1980.
[8] M. R. Azimi-Sadjadi and S. Bannour, “Two-dimensional adaptive block Kalman filtering
of SAR imagery,” IEEE Trans. on Geosci. and Remote Sensing, vol. 29, pp. 742–753,
1991.
[9] J. Bruniquel and A. Lopes, “Multi- variate optimal speckle reduction in SAR imagery,”
International Journal of Remote Sensing, vol. 18, pp. 603–627, Feb 1997.
[10] A. Baraldi and F. Parmigiani, “A refined Gamma MAP SAR speckle filter with improved
geometrical adaptivity,” IEEE Trans. on Geosci. and Remote Sensing, vol. 33, pp. 1245–
1257, Sept. 1995.
[11] F. Argenti and L. Alparone, “Speckle removal from SAR images in the undecimated
wavelet domain,” IEEE Trans. on Geosci. and Remote Sensing, vol. 40, pp. 2363–2374,
Nov. 2002.
[12] H. Xie, L. E. Pierce, and F. T. Ulaby, “SAR speckle reduction using wavelet denoising
and Markov random field modeling,” IEEE Trans. on Geosci. and Remote Sensing,
vol. 40, pp. 2196–2212, Oct. 2002.
RR n° 5493
20 A. Achim, E. E. Kuruoglu & J. Zerubia
[13] A. Achim, P. Tsakalides, and A. Bezerianos, “SAR image denoising via Bayesian wavelet
shrinkage based on heavy-tailed modeling,” IEEE Trans. Geosci. and Remote Sensing,
vol. 41, pp. 1773–1784, Aug. 2003.
[14] S. Solbo and T. Eltoft, “Hommomorphic wavelet-based statistical despeckling of SAR
images,” IEEE Trans. on Geosci. and Remote Sensing, vol. 42, pp. 711–721, April 2004.
[15] E. E. Kuruoglu and J. Zerubia, “Modeling SAR images with a generalization of the
Rayleigh distribution,” IEEE Trans. on Image Processing, vol. 13, pp. 527–533, April
2004.
[16] C. L. Nikias and M. Shao, Signal Processing with Alpha-Stable Distributions and Ap-
plications. New York: John Wiley and Sons, 1995.
[17] P. Tsakalides and C. L. Nikias, “High-resolution autofocus techniques for SAR imaging
based on fractional lower order statistics,” IEE Proc.-Radar. Sonar Navig., vol. 148,
pp. 267–276, Oct. 2001.
[18] G. Moser, J. Zerubia, and S. B. Serpico, “SAR amplitude probability density function
estimation based on a generalized Gaussian scattering model,” Research Report 5153,
INRIA, March 2004.
[19] G. Moser, J. Zerubia, and S. B. Serpico, “Dictionary-based stochastic expectation-
maximization for SAR amplitude probability density function estimation,” Research
Report 5154, INRIA, March 2004.
[20] J. Bertrand, P. Bertrand, and J. P. Ovarlez, “The mellin transform,” in The Transforms
and Applications Handbook (A. Poularikas, ed.), CRC Press, 1990.
[21] J. M. Nicolas, “Introduction aux statistiques de deuxième espèce: applications des log-
moments et des log-cumulants à l’analyse des lois d’images radar,” Traitement du Signal,
vol. 19, pp. 139–167, 2002.
[22] C. Tison, J. M. Nicolas, F. Tupin, and H. Maitre, “A new statistical model for Markovian
classification of urban areas in high resolution SAR images,” IEEE Trans. on Geosci.
and Remote Sensing, vol. 42, pp. 2046–2057, Oct. 2004.
[23] C. Oliver and S. Quegan, Understanding Synthetic Aperture Radar Images. Boston:
Artech House, 1998.
INRIA
SAR Image Filtering Based on the Heavy-Tailed Rayleigh Model 21
[24] A. C. Frery, H.-J. Müller, C. C. F. Yanasse, and S. J. S. Sant’Anna, “A model for
extremely heterogeneous clutter,” IEEE Trans. on Geoscience and Remote Sensing,
vol. 35, pp. 648–659, May 1997.
[25] L. Gagnon and A. Jouan, “Speckle filtering of SAR images - a comparative study be-
tween complex-wavelet based and standard filters,” SPIE Proc. #3169, pp. 80–91, 1997.
[26] A. Achim, A. Bezerianos, and P. Tsakalides, “Novel Bayesian multiscale method for
speckle removal in medical ultrasound images,” IEEE Trans. Med. Imag., vol. 20,
pp. 772–783, Aug. 2001.
[27] H. H. Arsenault and G. April, “Properties of speckle integrated with a finite aperture
and logarithmically transformed,” J. Opt. Soc. Amer., vol. 66, pp. 1160–1163, November
1976.
[28] H. Xie, L. E. Pierce, and F. T. Ulaby, “Statistical properties of logarithmically trans-
formed speckle,” IEEE Trans. on Geosci. and Remote Sensing, vol. 40, pp. 721–727,
March 2002.
[29] B. Epstein, “Some applications of the Mellin transform in statistics,” The Annals of
Mathematical Statistics, vol. 19, pp. 370–379, Sep 1948.
[30] V. M. Zolotarev, “Mellin-Stieltjes transforms in probability theory,” Theory of Proba-
bility and its Applications, no. 4, pp. 432–460, 1957.
[31] E. E. Kuruoglu and J. Zerubia, “Modeling SAR images with a generalization of the
Rayleigh distribution,” Proc. Asilomar Conference, Oct. 2000.
[32] F. Sattar, L. Floreby, G. Salomonsson, and B. Lövström, “Image enhancement based
on a nonlinear multiscale method,” IEEE Trans. Image Processing, vol. 6, pp. 888–895,
June 1997.
[33] M. Walessa and M. Datcu, “Model-based despeckling and information extraction from
SAR images,” IEEE Trans. on Geosci. and Remote Sensing, vol. 38, pp. 2258–2269,
Sep. 2000.
RR n° 5493
Unité de recherche INRIA Sophia Antipolis2004, route des Lucioles - BP 93 - 06902 Sophia Antipolis Cedex (France)
Unité de recherche INRIA Futurs : Parc Club Orsay Université - ZAC des Vignes4, rue Jacques Monod - 91893 ORSAY Cedex (France)
Unité de recherche INRIA Lorraine : LORIA, Technopôle de Nancy-Brabois - Campus scientifique615, rue du Jardin Botanique - BP 101 - 54602 Villers-lès-Nancy Cedex (France)
Unité de recherche INRIA Rennes : IRISA, Campus universitaire de Beaulieu - 35042 Rennes Cedex (France)Unité de recherche INRIA Rhône-Alpes : 655, avenue de l’Europe - 38334 Montbonnot Saint-Ismier (France)
Unité de recherche INRIA Rocquencourt : Domaine de Voluceau - Rocquencourt - BP 105 - 78153 Le Chesnay Cedex (France)
ÉditeurINRIA - Domaine de Voluceau - Rocquencourt, BP 105 - 78153 Le Chesnay Cedex (France)
http://www.inria.fr
ISSN 0249-6399