SAR Data Help Improving the Monitoring of Intertidal Flats ...
12
SAR Data Help Improving the Monitoring of Intertidal Flats on the German North Sea Coast Martin Gade (1) , Kerstin Stelzer (2) , and Jörn Kohlus (3) (1) Institut für Meereskunde, Universität Hamburg, Hamburg, Germany, Tel: +49 40 42838-5450, Fax: -7471, Email: [email protected] (2) Brockmann Consult, Geesthacht, Germany, Tel: +49 4152 889-307, Fax: -333, Email: [email protected] (3) LKN, Nationalparkverwaltung, Tönning, Germany, Tel: +49 4861 616-46, Fax: -69, Email: [email protected] Abstract Synthetic Aperture Radar (SAR) data have been included into an existing monitoring system to complement the classification of sediments, macrophytes, and mussels in the German Wadden Sea. Whereas the use of satellite-borne optical sensors in northern latitudes is strongly limited by clouds and haze, SAR data allow earth observation that is independent of cloud coverage and daytime. SAR data acquired at different radar bands (L, C, and X band, from ALOS PALSAR, ERS SAR and ENVISAT ASAR, and TerraSAR-X, respectively) have been used to analyse their potential for crude sediment classification on dry-fallen intertidal flats and for detecting benthic fauna such as blue mussel or oyster beds. In addition, we demonstrate that high-resolution SAR data can be used to detect residuals of historical land use, in intertidal areas that were lost to the sea during major storm surges in the 13 th and 17 th centuries.
Transcript of SAR Data Help Improving the Monitoring of Intertidal Flats ...
SAR Data Help Improving the Monitoring of Intertidal Flats on the German North Sea Coast
Martin Gade(1), Kerstin Stelzer(2), and Jörn Kohlus(3)
(1) Institut für Meereskunde, Universität Hamburg, Hamburg, Germany,
Tel: +49 40 42838-5450, Fax: -7471, Email: [email protected]
(2) Brockmann Consult, Geesthacht, Germany, Tel: +49 4152 889-307, Fax: -333, Email: [email protected]
(3) LKN, Nationalparkverwaltung, Tönning, Germany, Tel: +49 4861 616-46, Fax: -69, Email: [email protected]
Abstract Synthetic Aperture Radar (SAR) data have been included into an existing monitoring system to complement the classification of sediments, macrophytes, and mussels in the German Wadden Sea. Whereas the use of satellite-borne optical sensors in northern latitudes is strongly limited by clouds and haze, SAR data allow earth observation that is independent of cloud coverage and daytime. SAR data acquired at different radar bands (L, C, and X band, from ALOS PALSAR, ERS SAR and ENVISAT ASAR, and TerraSAR-X, respectively) have been used to analyse their potential for crude sediment classification on dry-fallen intertidal flats and for detecting benthic fauna such as blue mussel or oyster beds. In addition, we demonstrate that high-resolution SAR data can be used to detect residuals of historical land use, in intertidal areas that were lost to the sea during major storm surges in the 13th and 17th centuries.
Introduction The increasing requirements of coastal monitoring, to some extend, can be met deploying remote sensing techniques that allow for relatively cheap surveillance of large coastal areas. Optical sensors are already being used for sediment classification on intertidal flats, and promising results have been achieved through the classification of different sediment types, vegetation, and mussel beds. However, because of the strong dependence on daylight and cloud conditions, useful optical data (acquired at low tide, daytime, and sunny weather conditions) from the German North Sea coast are rare. A classification system based on spaceborne remote sensing data would therefore strongly benefit from the utilization of synthetic aperture radar (SAR) data.
The largest intertidal flats can be found on the German and Dutch North Sea coast and on the western coast of South Korea, in a distance of up to 10 Km offshore. Those areas fall dry once during each tidal cycle and consist of fine sediments such as (fine) sand and mud, and they are only partly vegetated. Not only because they are impacted by the stress of a changing world (e.g. through the global sea level rise) a frequent surveillance is of great importance, but is a difficult task by boat, foot, or land vehicles. This is when remote sensing techniques come into play.
Existing classification systems for the different surface types of intertidal flats are usually based upon optical remote sensing data, since the multi-channel (hyperspectral) data allow for a classification based on a large number of surface types (classes). Gade et al. (2008) suggested using multi-frequency SAR data for a sediment classification on exposed intertidal flats. They demonstrated that pairs of simultaneously acquired L-, C- and X-band SAR images from the SIR-C/X-SAR campaigns in 1994 can be used for a crude sediment classification based on the inversion of the Integral Equation Model, IEM (Fung et al. 1992). However, current spaceborne SAR sensors operate at single frequencies, and as a consequence, SAR data from different satellites have to be used for multi-frequency SAR classification purposes. Because they are usually acquired with a considerable time lag in between, a profound knowledge of the radar backscatter properties of the sediment types, and their dependence on weather conditions, tidal cycle, and imaging geometry is needed, which can only be gained from a joint analysis of multi-satellite SAR data and optical remote sensing data, together with a-priori knowledge gained during in-situ campaigns. The sub-project 4 of the German national project DeMarine-Environment (DMU) is particularly devoted to this synergistic approach.
Within DMU’s subproject 4, two main test areas on the German North Sea coast were identified, which represent areas of typical sediment distributions on intertidal flats, but also include vegetated areas and mussel and oyster beds. The test area “Halligenwatt” lies in the German National Park “Schleswig-Holstein Wadden Sea”, in the northern part of the German North Sea coast. The test area “Lütetsburger Plate” is part of the German National Park “Lower Saxonean Wadden Sea”, in the south-western part of the German North Sea coast.
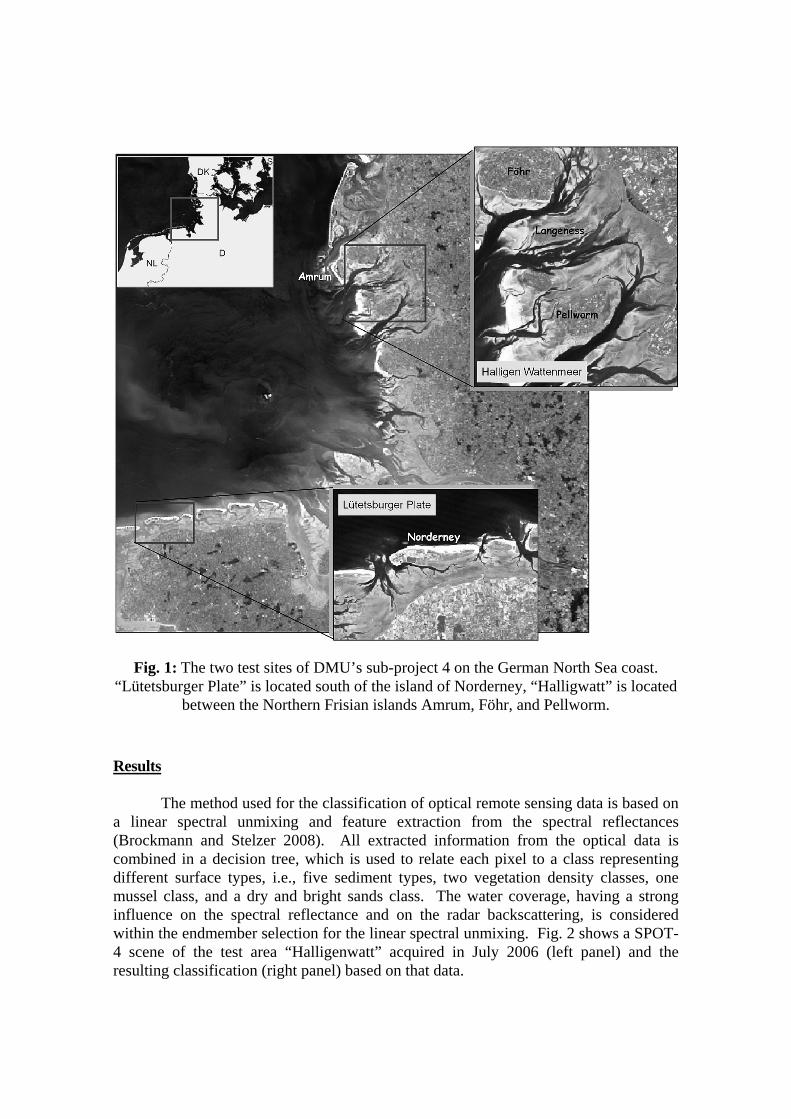
Fig. 1: The two test sites of DMU’s sub-project 4 on the German North Sea coast. “Lütetsburger Plate” is located south of the island of Norderney, “Halligwatt” is located
between the Northern Frisian islands Amrum, Föhr, and Pellworm.
Results
The method used for the classification of optical remote sensing data is based on a linear spectral unmixing and feature extraction from the spectral reflectances (Brockmann and Stelzer 2008). All extracted information from the optical data is combined in a decision tree, which is used to relate each pixel to a class representing different surface types, i.e., five sediment types, two vegetation density classes, one mussel class, and a dry and bright sands class. The water coverage, having a strong influence on the spectral reflectance and on the radar backscattering, is considered within the endmember selection for the linear spectral unmixing. Fig. 2 shows a SPOT-4 scene of the test area “Halligenwatt” acquired in July 2006 (left panel) and the resulting classification (right panel) based on that data.
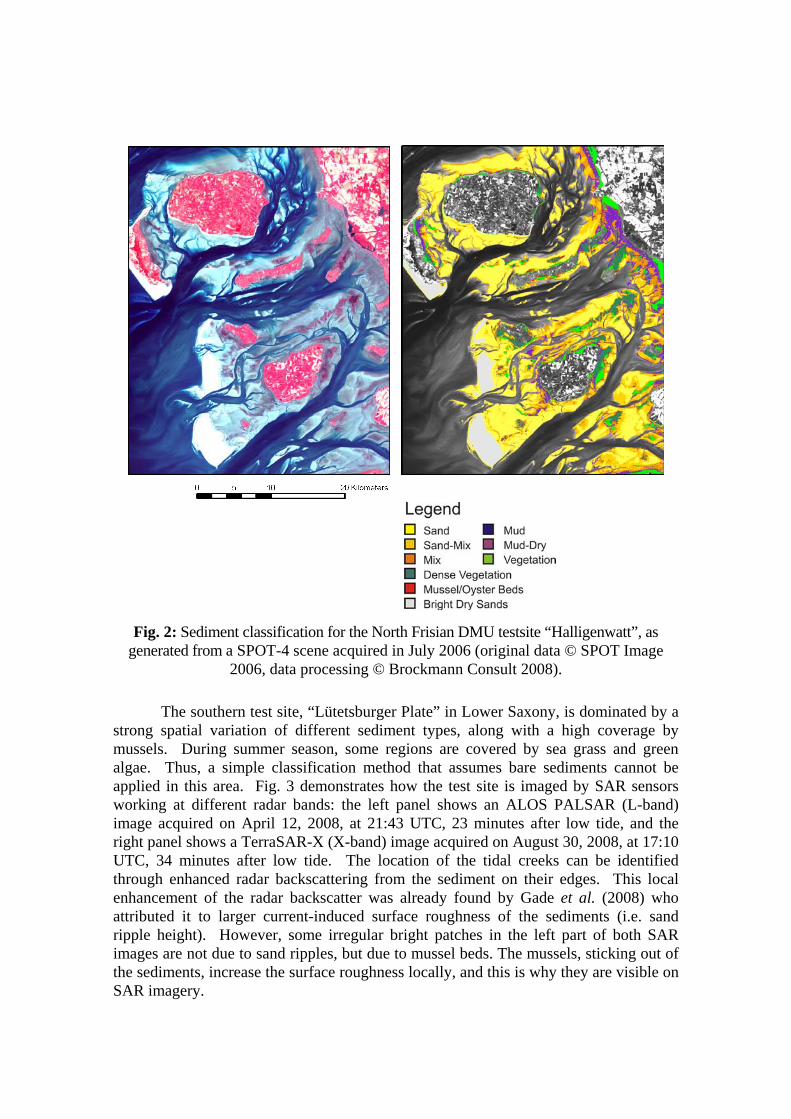
Fig. 2: Sediment classification for the North Frisian DMU testsite “Halligenwatt”, as generated from a SPOT-4 scene acquired in July 2006 (original data © SPOT Image
2006, data processing © Brockmann Consult 2008).
The southern test site, “Lütetsburger Plate” in Lower Saxony, is dominated by a strong spatial variation of different sediment types, along with a high coverage by mussels. During summer season, some regions are covered by sea grass and green algae. Thus, a simple classification method that assumes bare sediments cannot be applied in this area. Fig. 3 demonstrates how the test site is imaged by SAR sensors working at different radar bands: the left panel shows an ALOS PALSAR (L-band) image acquired on April 12, 2008, at 21:43 UTC, 23 minutes after low tide, and the right panel shows a TerraSAR-X (X-band) image acquired on August 30, 2008, at 17:10 UTC, 34 minutes after low tide. The location of the tidal creeks can be identified through enhanced radar backscattering from the sediment on their edges. This local enhancement of the radar backscatter was already found by Gade et al. (2008) who attributed it to larger current-induced surface roughness of the sediments (i.e. sand ripple height). However, some irregular bright patches in the left part of both SAR images are not due to sand ripples, but due to mussel beds. The mussels, sticking out of the sediments, increase the surface roughness locally, and this is why they are visible on SAR imagery.
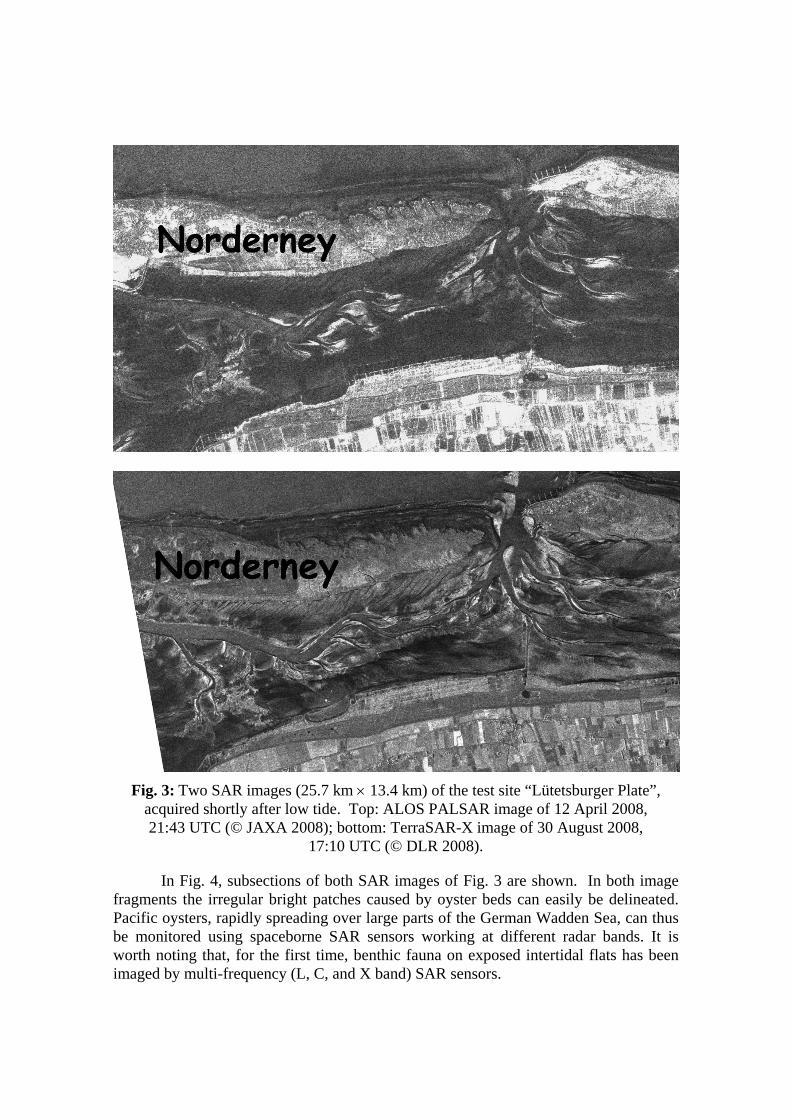
Fig. 3: Two SAR images (25.7 km 13.4 km) of the test site “Lütetsburger Plate”, acquired shortly after low tide. Top: ALOS PALSAR image of 12 April 2008, 21:43 UTC (© JAXA 2008); bottom: TerraSAR-X image of 30 August 2008,
17:10 UTC (© DLR 2008).
In Fig. 4, subsections of both SAR images of Fig. 3 are shown. In both image fragments the irregular bright patches caused by oyster beds can easily be delineated. Pacific oysters, rapidly spreading over large parts of the German Wadden Sea, can thus be monitored using spaceborne SAR sensors working at different radar bands. It is worth noting that, for the first time, benthic fauna on exposed intertidal flats has been imaged by multi-frequency (L, C, and X band) SAR sensors.
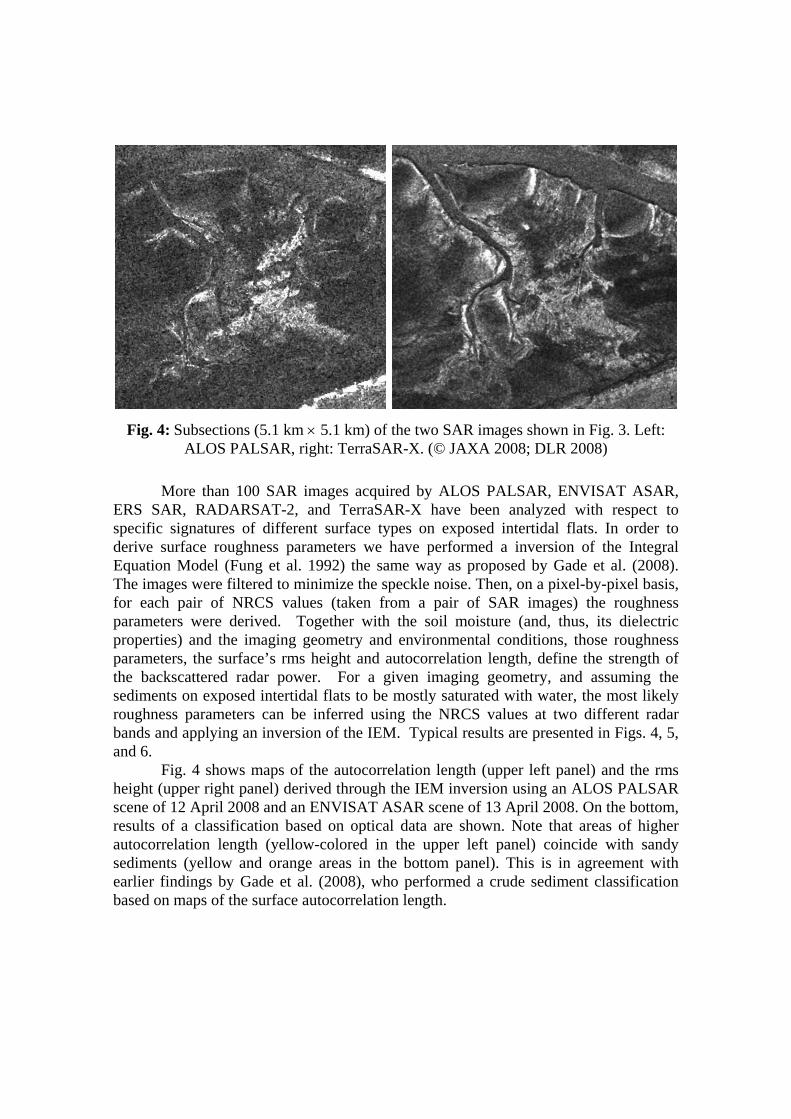
Fig. 4: Subsections (5.1 km 5.1 km) of the two SAR images shown in Fig. 3. Left: ALOS PALSAR, right: TerraSAR-X. (© JAXA 2008; DLR 2008)
More than 100 SAR images acquired by ALOS PALSAR, ENVISAT ASAR, ERS SAR, RADARSAT-2, and TerraSAR-X have been analyzed with respect to specific signatures of different surface types on exposed intertidal flats. In order to derive surface roughness parameters we have performed a inversion of the Integral Equation Model (Fung et al. 1992) the same way as proposed by Gade et al. (2008). The images were filtered to minimize the speckle noise. Then, on a pixel-by-pixel basis, for each pair of NRCS values (taken from a pair of SAR images) the roughness parameters were derived. Together with the soil moisture (and, thus, its dielectric properties) and the imaging geometry and environmental conditions, those roughness parameters, the surface’s rms height and autocorrelation length, define the strength of the backscattered radar power. For a given imaging geometry, and assuming the sediments on exposed intertidal flats to be mostly saturated with water, the most likely roughness parameters can be inferred using the NRCS values at two different radar bands and applying an inversion of the IEM. Typical results are presented in Figs. 4, 5, and 6.
Fig. 4 shows maps of the autocorrelation length (upper left panel) and the rms height (upper right panel) derived through the IEM inversion using an ALOS PALSAR scene of 12 April 2008 and an ENVISAT ASAR scene of 13 April 2008. On the bottom, results of a classification based on optical data are shown. Note that areas of higher autocorrelation length (yellow-colored in the upper left panel) coincide with sandy sediments (yellow and orange areas in the bottom panel). This is in agreement with earlier findings by Gade et al. (2008), who performed a crude sediment classification based on maps of the surface autocorrelation length.
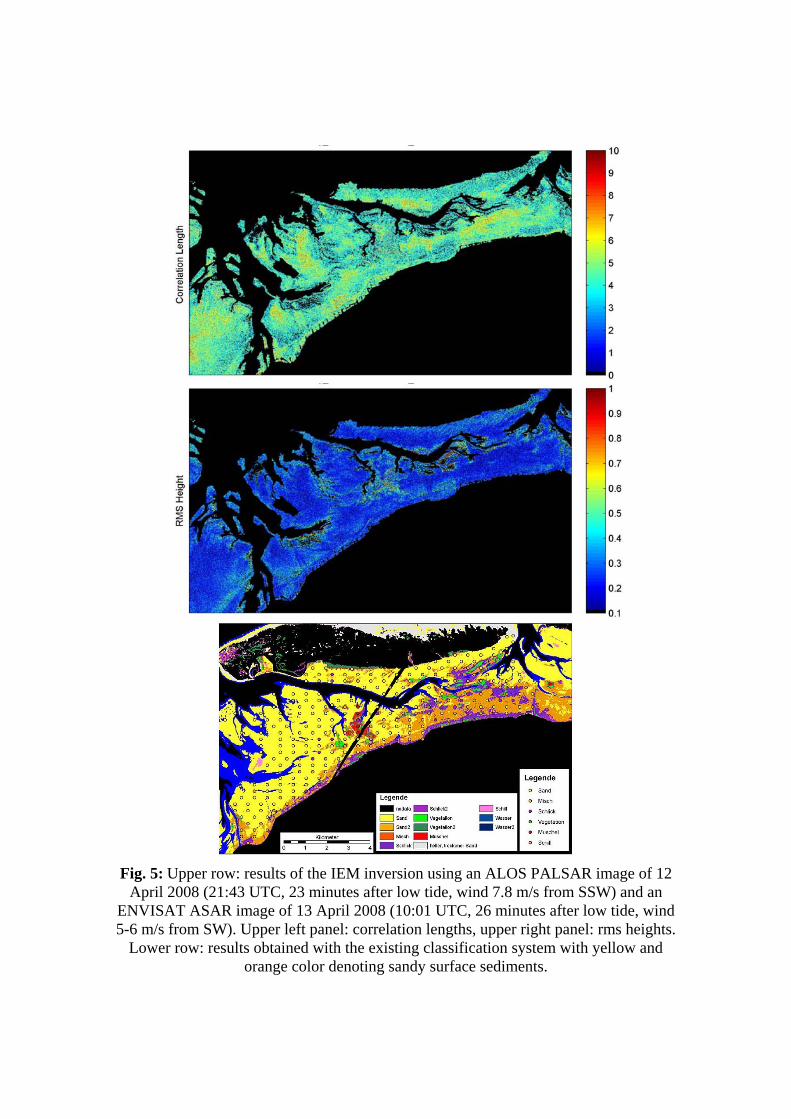
Fig. 5: Upper row: results of the IEM inversion using an ALOS PALSAR image of 12 April 2008 (21:43 UTC, 23 minutes after low tide, wind 7.8 m/s from SSW) and an
ENVISAT ASAR image of 13 April 2008 (10:01 UTC, 26 minutes after low tide, wind 5-6 m/s from SW). Upper left panel: correlation lengths, upper right panel: rms heights.
Lower row: results obtained with the existing classification system with yellow and orange color denoting sandy surface sediments.
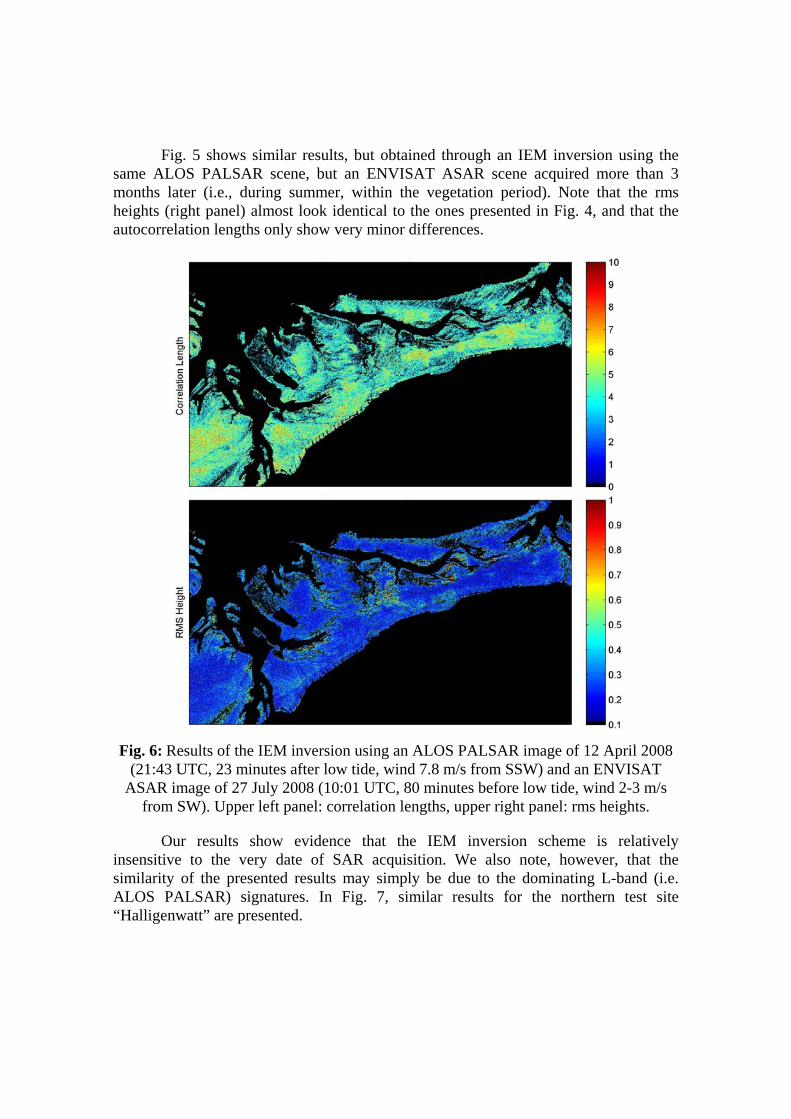
Fig. 5 shows similar results, but obtained through an IEM inversion using the same ALOS PALSAR scene, but an ENVISAT ASAR scene acquired more than 3 months later (i.e., during summer, within the vegetation period). Note that the rms heights (right panel) almost look identical to the ones presented in Fig. 4, and that the autocorrelation lengths only show very minor differences.
Fig. 6: Results of the IEM inversion using an ALOS PALSAR image of 12 April 2008 (21:43 UTC, 23 minutes after low tide, wind 7.8 m/s from SSW) and an ENVISAT
ASAR image of 27 July 2008 (10:01 UTC, 80 minutes before low tide, wind 2-3 m/s from SW). Upper left panel: correlation lengths, upper right panel: rms heights.
Our results show evidence that the IEM inversion scheme is relatively insensitive to the very date of SAR acquisition. We also note, however, that the similarity of the presented results may simply be due to the dominating L-band (i.e. ALOS PALSAR) signatures. In Fig. 7, similar results for the northern test site “Halligenwatt” are presented.
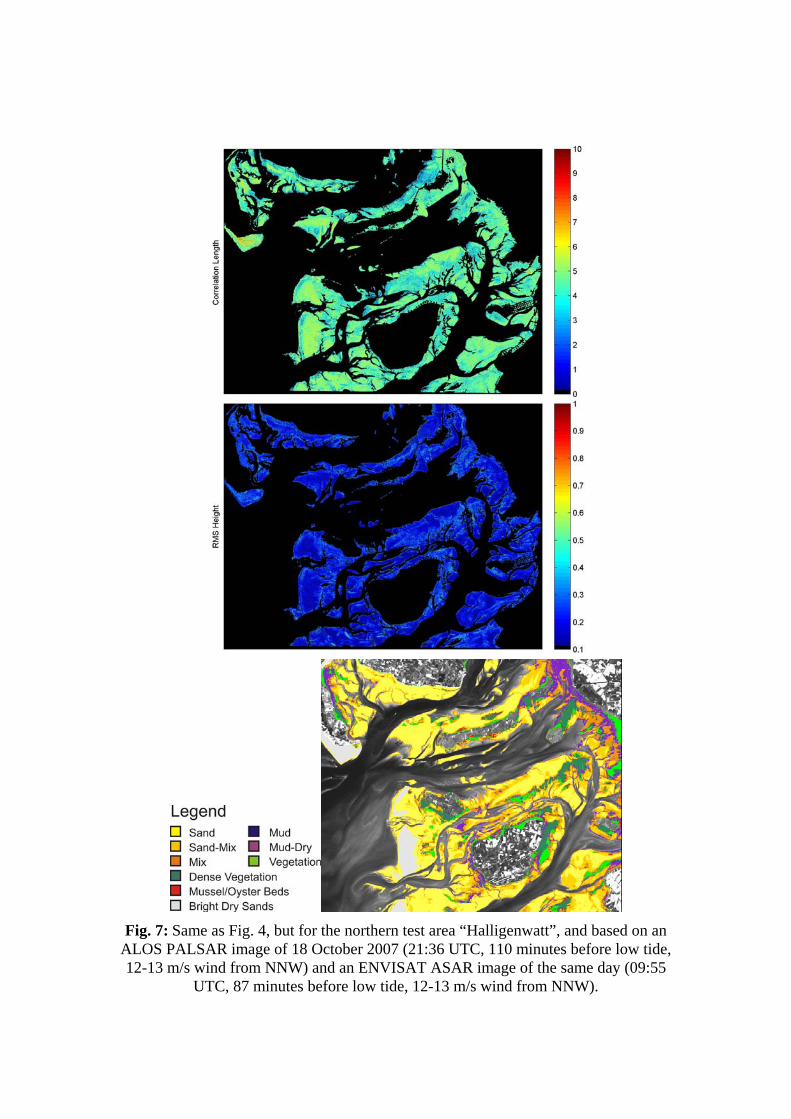
Fig. 7: Same as Fig. 4, but for the northern test area “Halligenwatt”, and based on an ALOS PALSAR image of 18 October 2007 (21:36 UTC, 110 minutes before low tide, 12-13 m/s wind from NNW) and an ENVISAT ASAR image of the same day (09:55
UTC, 87 minutes before low tide, 12-13 m/s wind from NNW).
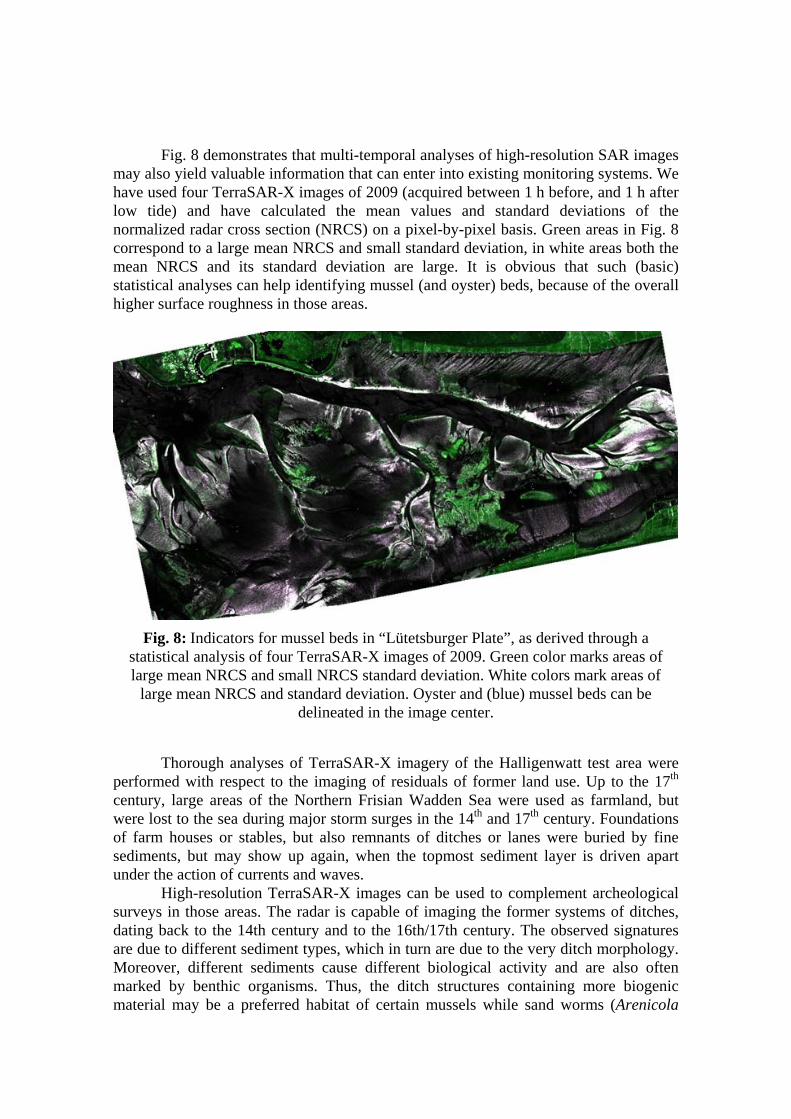
Fig. 8 demonstrates that multi-temporal analyses of high-resolution SAR images may also yield valuable information that can enter into existing monitoring systems. We have used four TerraSAR-X images of 2009 (acquired between 1 h before, and 1 h after low tide) and have calculated the mean values and standard deviations of the normalized radar cross section (NRCS) on a pixel-by-pixel basis. Green areas in Fig. 8 correspond to a large mean NRCS and small standard deviation, in white areas both the mean NRCS and its standard deviation are large. It is obvious that such (basic) statistical analyses can help identifying mussel (and oyster) beds, because of the overall higher surface roughness in those areas.
Fig. 8: Indicators for mussel beds in “Lütetsburger Plate”, as derived through a statistical analysis of four TerraSAR-X images of 2009. Green color marks areas of large mean NRCS and small NRCS standard deviation. White colors mark areas of
large mean NRCS and standard deviation. Oyster and (blue) mussel beds can be delineated in the image center.
Thorough analyses of TerraSAR-X imagery of the Halligenwatt test area were performed with respect to the imaging of residuals of former land use. Up to the 17th century, large areas of the Northern Frisian Wadden Sea were used as farmland, but were lost to the sea during major storm surges in the 14th and 17th century. Foundations of farm houses or stables, but also remnants of ditches or lanes were buried by fine sediments, but may show up again, when the topmost sediment layer is driven apart under the action of currents and waves.
High-resolution TerraSAR-X images can be used to complement archeological surveys in those areas. The radar is capable of imaging the former systems of ditches, dating back to the 14th century and to the 16th/17th century. The observed signatures are due to different sediment types, which in turn are due to the very ditch morphology. Moreover, different sediments cause different biological activity and are also often marked by benthic organisms. Thus, the ditch structures containing more biogenic material may be a preferred habitat of certain mussels while sand worms (Arenicola
marina) are usually found on sandy sediments. Those benthic organisms may cause different surface roughness patterns that can be sensed by the high-resolution X-Band SAR.
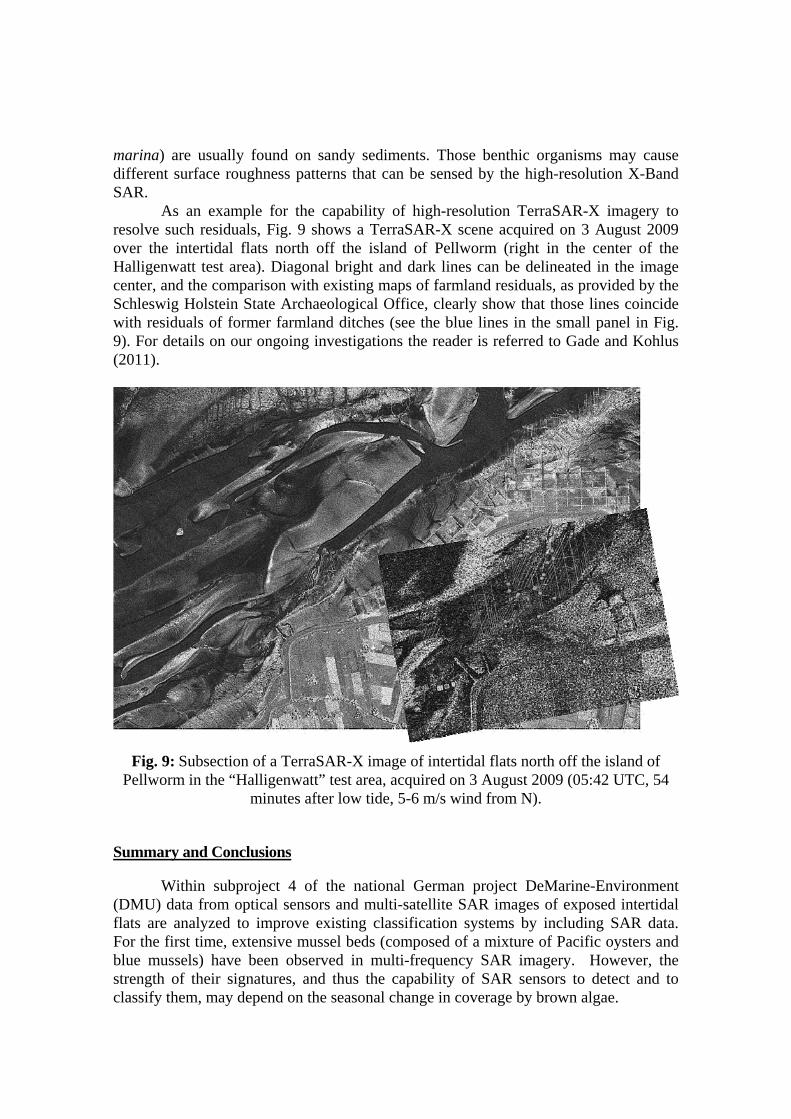
As an example for the capability of high-resolution TerraSAR-X imagery to resolve such residuals, Fig. 9 shows a TerraSAR-X scene acquired on 3 August 2009 over the intertidal flats north off the island of Pellworm (right in the center of the Halligenwatt test area). Diagonal bright and dark lines can be delineated in the image center, and the comparison with existing maps of farmland residuals, as provided by the Schleswig Holstein State Archaeological Office, clearly show that those lines coincide with residuals of former farmland ditches (see the blue lines in the small panel in Fig. 9). For details on our ongoing investigations the reader is referred to Gade and Kohlus (2011).
Fig. 9: Subsection of a TerraSAR-X image of intertidal flats north off the island of Pellworm in the “Halligenwatt” test area, acquired on 3 August 2009 (05:42 UTC, 54
minutes after low tide, 5-6 m/s wind from N).
Summary and Conclusions
Within subproject 4 of the national German project DeMarine-Environment (DMU) data from optical sensors and multi-satellite SAR images of exposed intertidal flats are analyzed to improve existing classification systems by including SAR data. For the first time, extensive mussel beds (composed of a mixture of Pacific oysters and blue mussels) have been observed in multi-frequency SAR imagery. However, the strength of their signatures, and thus the capability of SAR sensors to detect and to classify them, may depend on the seasonal change in coverage by brown algae.
During the second phase of the project, results from in-situ campaigns will be included, along with further classification results derived using optical remote sensing data. Of particular interest will be to investigate how the observed SAR signatures depend not only on radar frequency and polarization, but also on the season, on weather conditions, and on the tidal phase. A profound knowledge of all main factors contributing to the observed SAR signatures is essential for any improvement of existing classification systems, and our preliminary results show evidence that multi-satellite SAR data can be used for an improved sediment classification on exposed intertidal flats.
Acknowledgments
The authors are grateful to the colleagues participating in DeMarine-U’s sub-project 4, who contributed to the results presented herein. DMU receives funding from the German Ministry of Economy (BMWi) under contract 50 EE 0817, TSX data were provided by DLR under contract COA0118. References Brockmann, C., and K. Stelzer, "Optical Remote Sensing of Intertidal Flats", in Remote
Sensing of the European Seas, V. Barale and M. Gade (Eds.), Springer, Heidelberg, 514 pp., 117-128.
Fung, A. K., Z. Li, and K.S. Chen, “Backscattering from a Randomly Rough Dielectic
Surface”, IEEE Trans. Geosci. Remote Sens., 30, 356-369, 1992. Gade, M., W. Alpers, C. Melsheimer, and G. Tanck, ”Classification of sediments on
exposed tidal flats in the German Bight using multi-frequency radar data”, Remote Sens. Environ., 112, 1603-1613, 2008.
Gade, M., and J. Kohlus, “Archeological Sites on Intertidal Flats in the German
Wadden Sea”, Proceed. 4th TSX Science Team Meeting, Oberpfaffenhofen, Germany, 14-16 February 2011, DLR Publications, 2011.