SAP #BOBJ #BI 4.1 Upgrade Webcast Series 6: User Authentication and SSO
8/7/2019 SAP BOBJ Sizing
http://slidepdf.com/reader/full/sap-bobj-sizing 1/35
Enterprise Sizing Guide
OverviewEnterprise System sizing involves the process of determining how many resources are required to support agiven workload.
As input in the sizing process we often have:
• The number of users• A description or understanding of types and percentage of usage types (how many users
are doing what
• What frequency or how often users are interacting
As output in the sizing process we want to understand:
• The number of processors (CPUs) required to support a load
• The amount of memory required to support a load
• The appropriate configuration for a load type (number of services and where to put them)
The General assumption through this document is that each main service or component can be assessed
independently through its capacity to respond to simultaneous requests from users in a time period with acertain amount of hardware resources (CPU and Memory)
12/17/05 Copyr ight © 2005 Business Objects. All rights reserved. Page 1
8/7/2019 SAP BOBJ Sizing
http://slidepdf.com/reader/full/sap-bobj-sizing 2/35
OVERVIEW.......................................................................................................................................................................1
INTRODUCTION.............................................................................................................................................................. 3
HOW TO USE THE SIZING GUIDE FOR WINDOWS AND UNIX ENVIRONMENTS................................................................................ 4
STEP 1: LOAD...................................................................................................................................................................5
A) ESTIMATING POTENTIAL USERS........................................................................................................................................ 5
B) ESTIMATING CONCURRENT ACTIVE USERS......................................................................................................................... 5
C) ESTIMATING SIMULTANEOUS R EQUESTS.............................................................................................................................. 5
STEP 2: SERVICES........................................................................................................................................................... 7
INTELLIGENCE TIER .............................................................................................................................................................. 9
Central Management Server ...................................................................................................................................... 9
Crystal Reports Cache Server .................................................................................................................................. 11
File Repository Servers (FRS).................................................................................................................................. 12
Event Server ............................................................................................................................................................. 14
PROCESSING TIER ............................................................................................................................................................... 14
Desktop Intelligence (DESKi).................................................................................................................................. 14 Performance Manager (PM).................................................................................................................................... 16
Web Intelligence Report Server ................................................................................................................................ 17
Web Intelligence Job Server ..................................................................................................................................... 18
Crystal Reports Page Server ................................................................................................................................... 18 Crystal Reports Job Server ...................................................................................................................................... 22
Report Application Server ........................................................................................................................................ 24
List of Values Job Server .......................................................................................................................................... 25
Connection Server .................................................................................................................................................... 25
APPLICATION TIER ............................................................................................................................................................. 25
Web Application Server ............................................................................................................................................ 25 OLAP Intelligence functionality within the Application Tier ................................................................................... 27
STEP 3: CONFIGURATION & INFRASTRUCTURE CHARACTERISTICS........................................................ 30
BASIC ONE MACHINE CONFIGURATION (VERTICAL SCALING).................................................................................................. 30
MULTIPLE MACHINE CONFIGURATIONS TYPES (HORIZONTAL SCALING).................................................................................... 30
DISK I/O AND NETWORK BANDWIDTH AND LATENCY............................................................................................................. 31
STEP 4: SYSTEM DATABASE TUNING.....................................................................................................................32
SYSTEM DATABASE BACKEND PERFORMANCE........................................................................................................................ 32
CONNECTION BETWEEN BOE XI AND THE DATABASE SYSTEM.................................................................................................. 32 PERFORMANCE CRITERIA..................................................................................................................................................... 32
CALCULATING THE DATABASE FILE SIZE............................................................................................................................... 34
USEFUL R ESOURCES........................................................................................................................................................... 35
FINDING MORE INFORMATION............................................................................................................................... 36
12/17/05 Copyr ight © 2005 Business Objects. All rights reserved. Page 2

8/7/2019 SAP BOBJ Sizing
http://slidepdf.com/reader/full/sap-bobj-sizing 3/35
IntroductionThere are three different aspects to consider when designing a scalable enterprise reporting application: theapplication itself, the security and system data, and the actual hardware and configuration. Largedeployments are often quite complex and it’s critical to recognize the set of factors that can influence thesethree aspects of scalability. This document will focus on the major aspects that influence sizing decisions
including information on actual hardware and configuration of a Business Objects Enterprise XI™ (BOE XI)deployment. This document can be used to estimate requirements for large deployments; however, we dorecommend engaging Business Objects Consulting Services to help with planning in these situations.
A step based methodology for sizing is used in this guide. From start to finish the following 4 steps will helpto plan and estimate the size of a deployment:
STEP 1 Load
In Step 1 of the sizing process the Load is determined. Load defines the amount and types of user/clientactivity, transactions that will interact with the BOE XI System. The results obtained in this step are needed
to perform the necessary calculations in Step 2.
STEP 2 Service Thresholds, CPU and Memory
In Step 2 of the sizing process an analysis is completed looking at the thresholds of each required service inthe system. Services are the BOE XI software components that are required to provide and support theanticipated load and functionality. Also, in Step 2 the number of CPUs and amount of memory required isdetermined. CPUs and Memory address the supporting infrastructure that must support the Services andLoad
STEP 3 Configuration & Infrastructure Characteristics
Step 3 of the sizing process helps to determine the appropriate configuration of machines (e.g. 2 Dual boxesvs. 1 Quad or the configuration that hits the correct balance of reliability and performance.) Additionally, it isimportant to consider minimum Disk I/O speeds and Network Latency measures for various components of the infrastructure.
STEP 4 CMS System Database Tuning
In Step 4 of the sizing process underlying Database Server tuning is addressed. Tuning the DatabaseServer and Network to take full advantage of BOE XI will help to provide optimal performance and reliability.
12/17/05 Copyr ight © 2005 Business Objects. All rights reserved. Page 3

8/7/2019 SAP BOBJ Sizing
http://slidepdf.com/reader/full/sap-bobj-sizing 4/35
How to use the Sizing Guide for Windows and UNIX environments
The Sizing Guide is a “Guide.” BOE XI is a highly flexible system and there are many possible variables thatcould impact how an optimal configuration might look. This guide offers conceptual information andmeasurements that reflect observed BOE XI system and component behavior. Sizing formulas in STEP 2can assist in understanding the nature of relationships between user interactions and Service functionality aswell as how this relates to CPU utilization, memory and/or disk consumption. For the purposes of this guidemost system and performance testing was conducted on machines averaging at 2.5 GHz clock speed with
2GB Memory per CPU.
Use this guide to better understand how each applicable BOE XI Service (Server) behaves, including relativecapacities and thresholds within the overall BOE XI System.
This guide can be used for both Windows and UNIX environments. Acknowledging the myriad of variables(inherent CPU differences, hyper threading, operating system, network, report design, functionality, SDK,etc) that impact sizing and performance, and within the degree of accuracy possible to size a complete BIsystem…the concepts, formulas, configurations and observations can be used universally.
The Sizing Guide is a living document that will be adapted and changed as new and valuablesizing/configuration information become available
12/17/05 Copyr ight © 2005 Business Objects. All rights reserved. Page 4
8/7/2019 SAP BOBJ Sizing
http://slidepdf.com/reader/full/sap-bobj-sizing 5/35
Step 1: Load
What is Load?
Load defines the amount and types of use and activity that will interact with the BOE XI System. Load canbe broken down to various types of user interactions and user types:
Potential users (Named users) - is the number of users that have the ability to logon to the system
Concurrent active users - is an estimate of the number of users who are concurrently logged on tothe system and are actively interacting with the system (clicking of folders, viewing reports,scheduling, etc…). There is a distinction between “concurrent active users” and “concurrent users”as concurrent active users are actively interacting with the system at various rates, rather thansimply logged on but inactive.
Simultaneous requests - is an estimate of the total number of simultaneous requests that are being
made by concurrent active users to the system (logging, clicking of folders, viewing a page reports(from the cache or not), opening a Web Intelligence document, scheduling, refreshing …). Thenumber of simultaneous requests is generally dependent of the usage type and rate.
Concurrent Active Users and Simultaneous Requests are the two load types that will most determine therequired resources and the appropriate configuration to support a high performance and highly reliable BOEXI system. The number of Potential Users is useful in determining these three measurements.
A) Estimating Potential Users
This is the easiest number to calculate as this is the total population of users who have the ability to accessthe BOE XI environment
B) Estimating Concurrent Active Users
When calculating the size and configuration of a deployment, it is important to determine the expectedconcurrent system usage.
In our experience, many customers find that their concurrency ratios are on average from 10% to 20% of their total potential user base (e.g., 1000 total potential users = 100 to 200 concurrent active users). This canvary significantly depending on the nature and breadth of the deployment, but is a reasonable rule of thumbfor planning purposes. If your estimated concurrency rate is higher or lower, you can use this value tocomplete the rest of the calculations in this document.
A guideline for estimating concurrent active users: concurrent active users = anywhere from 10% to 20% of total potentialusers
@ 10%: 1000 potential users = 100 estimated concurrent active users
C) Estimating Simultaneous Requests
The quickest method for estimating the number of Simultaneous Requests is to calculate 10% of ConcurrentActive Users
1000 concurrent active users x 10% = 100 Simultaneous Requests
12/17/05 Copyr ight © 2005 Business Objects. All rights reserved. Page 5

8/7/2019 SAP BOBJ Sizing
http://slidepdf.com/reader/full/sap-bobj-sizing 6/35
The following process is an example of one methodology that might be used to estimate this number in moredetail. If we divide the users into sets of types of users, based on how they use the system, we can moreaccurately assume a number. The percentages used in this example can be adjusted to match the profile of a particular environment.
For the purposes of this calculation we will divide users into 4 types:
• Heavy Users – users who will be constantly logged onto the system viewing reports nearly continuously.
• Active Users – users who are logged into the system frequently throughout the day averaging on request every 4 seconds.
• Moderate Users – users who are logged into the system from time to time throughout the day averaging one request every 8
seconds
• Light Users – users who will log into the system infrequently and will view a couple of reports and logout having an estimate
of one request every 16 seconds.
Divide concurrent active users into these 4 defined categories and then calculate the percentage of eachtype,
Example:
1000 users = 100 concurrent active users (estimating at 10%)
Heavy Users 15 concurrent active users 15%
Active Users 45 concurrent active users 45%
Moderate Users 25 concurrent active users 25%
Light Users 15 concurrent active users 15%
Total 100 concurrent active users 100%
Now that we have determined the percentage breakdown for each User Set we can estimate the totalsimultaneous requests based on the estimated User Type request frequency (i.e. How we define what a"Heavy concurrent active user" means in terms of request frequency or rate)
Following percentages are only assumptions that have been made relating to the rate of simultaneous use based on user grouptype:
• For every 100 Heavy concurrent active users assume 100 simultaneous requests could be made or a 100% rate
• For every 100 Active concurrent active users assume that 25 simultaneous request could be made or a 25% rate
• For every 100 Moderate concurrent active users assume that 12 simultaneous requests could be made or a 12% rate
• For every 100 Light concurrent active users assume that 6 simultaneous requests could be made or a 6% rate
Formula to calculate simultaneous user requests:
(((Concurrent active users X % of Heavy Users) / 100) * (1)) + (((Concurrent active users X % of Active Users) / 100) *(0.25)) +(((Concurrent active users X % of Moderate Users )/ 100) * (0.12)) + (((Concurrent active users X % of Light Users) / 100) *(0.06)) = Calculated Simultaneous Users (rounded up)
- or –
(((100 X 15) / 100) * (1))) + (((100 X 45) / 100) * (0.25)) + (((100 X 25) / 100) * (0.12)) + (((100 X 15) / 100) * (0.06)) = 31
Based on the assumption of 100 concurrent active users and the types of activities each user is likely toperform we have calculated that there will be an average of 31 simultaneous user requests.
12/17/05 Copyr ight © 2005 Business Objects. All rights reserved. Page 6

8/7/2019 SAP BOBJ Sizing
http://slidepdf.com/reader/full/sap-bobj-sizing 7/35
Step 2: ServicesStep 2 assists with estimating the number of BOE XI Services required supporting the user activity (Load)estimated in Step 1
Through intensive mission critical subsystem testing during the development and quality assurance processas well as through large scale end to end user benchmarks executed at our hardware partner labs, specificthresholds and capacities as well as individual services ability to scale are determined for each service. Thissection of the sizing and configuration guide outlines the specific nature of each BOE XI Service asdetermined through this process.
The BOE XI suite consists of many core services, some of which are essential to system operation andothers that are optional. It is during this step that it is determined which services are required and how manyare needed to provide the desired functionality and optimal performance.
12/17/05 Copyr ight © 2005 Business Objects. All rights reserved. Page 7

8/7/2019 SAP BOBJ Sizing
http://slidepdf.com/reader/full/sap-bobj-sizing 8/35
Server Services as seen in the Central Configuration Manager
Services:
Intelligence Tier
• Central Management Server (CMS)
• Crystal Reports Cache Server
• Input/Output File Repository
• Event Server
Processing Tier
•Desktop Intelligence Report Server
• Desktop Intelligence Cache Server
• Desktop Intelligence Job Server
• Enterprise Performance Manager Services
o Dashboard Manager
o Analytics
• Web Intelligence Report Server
• Web Intelligence Job Server
12/17/05 Copyr ight © 2005 Business Objects. All rights reserved. Page 8
8/7/2019 SAP BOBJ Sizing
http://slidepdf.com/reader/full/sap-bobj-sizing 9/35
• Crystal Reports Page Server
• Crystal Reports Job Server
• Report Application Server
• List of Values Job Server
Application Tier
• Web Application Server
• OLAP Intelligence Functionality
Intelligence Tier
Central Management Server
The principle component of the BOE XI system is the Central Management Server. Its primaryresponsibilities include (but are not limited) to the following:
• Management of Users & User Groups
• Management of object security
• Central system configuration
• Management of scheduled tasks
• Management of historical tasks. (e.g., success or failed instances)
• Management of system objects (i.e., Info Objects)
• License management
• System database management
• Name service
• Cluster management
Calculate Number of CMS Services Required
The number of CMS services required in a system depends on:
1) The number of concurrent active users
2) The number of simultaneous user requests involving viewing or querying CMS objects (e.g. viewingdocuments)
3) If there is a high volume of batch scheduling
4) If software fault tolerance is required (clustering.)
The CMS supports clustering capabilities. This capability allows two or more CMS machines to share BOEXI information. This results in an increased number of potential concurrent users and scheduling requests,and provides high availability through machine fail-over support.
The clustering of CMS Services may be advisable under the following conditions:
1) The number of potential concurrent users or scheduling requests exceeds acceptable performancecapacity of a single CMS Service.
12/17/05 Copyr ight © 2005 Business Objects. All rights reserved. Page 9

8/7/2019 SAP BOBJ Sizing
http://slidepdf.com/reader/full/sap-bobj-sizing 10/35
2) A high volume of batch scheduling requests are being made and requests exceed acceptableperformance capacity of a single CMS Service
3) Required Fault Tolerance – if the one CMS Service shuts down, another CMS Service is available toseamlessly take over workload.
A common guideline used to help determine when to consider creating a clustered environment (addadditional CMS service/s) would be when the number of concurrent active users logging on to a CMSapproaches or exceeds 600. This number is only a guideline and as such can be affected by the types of tasks that are most usually performed.
CMS guidelines for Clustering:
1) for every additional 600 concurrent active users2) if software fault tolerance is desired
Example
1) If estimated to have 1400 Concurrent Active Users consider including a cluster of 2 - 3 CMS services in the configuration
2) Include at least 2 CMS services for Required Fault Tolerance – if the one CMS service is shut down, another CMS servicetakes over workload.
CMS Clustering across Subnets
A cluster that has 2 or more CMS cluster members on different subnets is technically possible and has beenQA tested. This configuration is supported by Business Objects, strictly providing that no significantadditional network latency is created as a result of an additional subnet.
The most important factor to ensure efficient CMS clustering performance is to eliminate excessive latencybetween CMS services and the CMS Database.
Example:
CMS1 and the CMS system database are located in the same data center in New York. CMS2 is a member of the same cluster as CMS1 but is located in China and must communicate with the CMS database in New York.
Excessive network latency of CMS2 in China to the CMS database in New York would be problematic.
Assure that all CMS members of a cluster have uniform communication speeds to the system database. For best performance, run each CMS cluster member on a machine that has the same type of CPU. For moredetailed clustering information refer to the online BOE XI Administrator’s guide.
Processor Requirements
The number of CPUs required to support CMS services will be highly dependent on the type of CMS activity.E.g. large updates to the CMS system database (i.e. adding or deleting a large number of users; viewing or querying a large number of objects) will use intensive CPU time. For increased CMS throughput andresponse times allocate additional CPU resources.
Rule of Thumb
a) 1 CPU for every 500 concurrent active users
b) 1 CMS service for every 600 - 700 concurrent active users
- or -
c) 1 CPU for every estimated 100 user simultaneous request: this number may greatly vary depending on the type of actionmade
Example:
12/17/05 Copyr ight © 2005 Business Objects. All rights reserved. Page 10
8/7/2019 SAP BOBJ Sizing
http://slidepdf.com/reader/full/sap-bobj-sizing 11/35
Question: What would be the estimate of how many CMS services and CPUs are required to support 4000concurrent active users in a highly active system?
a) 4000 concurrent active users / 500 concurrent active users per 1 CPU = 8 CPUs
b) 4000 concurrent active users / 700 concurrent active users per 1 CMS service = 5.71 = 6 CMS services
Answer: An estimate of 6 CMS services installed across 8 available CPUs
This Rule of Thumb should be treated as an initial guideline since capacity numbers are highly dependent onother factors such as CPU speed, network, database connectivity, etc.
Memory Requirements
For best performance, run each CMS cluster member on a machine that has the same amount of memory.Memory usage is controlled (roughly) by the number of objects stored in the object cache. This is controlledin by the windows registry key called “MaximumObjectsToKeepInMemory.” Specify the maximum number of objects that the CMS stores in its memory cache. Increasing the number of objects reduces the number of database calls required and greatly improves CMS performance. However, placing too many objects inmemory may result in the CMS having too little memory remaining to process queries. The upper limit is100000 and the default setting is 10000.
For CMS System Database memory requirements please refer to Step 4: System Database Tuning.
Crystal Reports Cache Server
The Cache Server stores report pages generated by the Page Server. By storing report pages in cache, thePage Server and/or database server does not need to be accessed each time the report is requested. TheCache Server is used for viewing of Crystal Reports only, and if viewer’s preference is set to any viewer other than Interactive DHTML.
When a report is requested for viewing, the system will first check the Cache Server to see if there are any
current available cache pages generated for that report. If there are pages, the Cache Server will sendavailable report pages to the Web Application Server. If there are no cached pages, the Cache Server willrequest a Page Server to generate these pages.
The threshold that determines the number of Cache Server services required is the “maximum simultaneousprocessing threads” per Cache Server service. The number of “simultaneous processing threads” is equal tothe number of simultaneous requests. A guideline for the maximum simultaneous processing threads per Cache Server service is 400
400 “maximum simultaneous processing threads” per Cache Server service
Processor Requirements
1 CPU is required for every estimated “200 maximum simultaneous processing threads”
Example 1:
If an environment must service 200 simultaneous Cache Server requests, based on the 400 maximum per Cache Server service one would require only one Cache Server service. And based on the 200 “maximumsimultaneous processing threads” per processor, one would require a single processor.
12/17/05 Copyr ight © 2005 Business Objects. All rights reserved. Page 11

8/7/2019 SAP BOBJ Sizing
http://slidepdf.com/reader/full/sap-bobj-sizing 12/35
1 CPU machine w/one Cache Server service
Example 2:
If an environment must service 800 simultaneous Cache Server requests, based on the 400 maximum per Cache Server service one would require at least two Cache Server services. And based on the 200“maximum simultaneous processing threads” per processor, one would require at least 4 availableprocessors.
1 Quad machine w/2 Cache Server service
Memory Requirements
Estimate 1MB per simultaneous processing thread + 17MB base
Disk Requirements
For the Cache Server service, sufficient hard drive disk space should be available for the generation of cache files as well as in the temp directory for the creation of temp files (C:\Program Files\BusinessObjects\BusinessObjects Enterprise 11\Data\machinename.cacheserver\). The location of Cache Server cache files can be specified from the Central Management Console. The highest volume of cache files willlikely be the “encapsulated page file” or “.epf.” A single .epf file represents one page of a Crystal report andthe size of the individual file is variable dependent on the complexity of the report page (e.g., a single .epf filefrom the sample “Statement of Account” report is 88kb in size). A sufficient amount of disk space should bemade available to support all potential cache pages generated at a given period.
File Repository Servers (FRS)
There is an Input and an Output File Repository Server in every BOE XI implementation.
The Input File Repository Server manages objects (Crystal Reports, OLAP Intelligence reports, WebIntelligence reports, Desktop Intelligence Reports, program objects, Microsoft Excel files, Microsoft Wordfiles, Microsoft PowerPoint files, Adobe Acrobat PDFs, rich text format files, text files, hyperlinks, objectpackages) that have been published to the system by administrators or end users (using the PublishingWizard, the Central Management Console, the Import Wizard, or a Business Objects designer componentsuch as Crystal Reports or the Web Intelligence Java or HTML Report Panels).
The Output FRS maintains all the instances that have been produced from reports (Crystal, Web Intelligenceor Desktop Intelligence), programs, and object packages that have been scheduled.
Repository location
You may have multiple FRS (input) and FRS (output) services on one or several different machines tosupport a high-availability environment, however the FRS services will behave in an Active/Passive fashionwhere the first available FRS will be Active and all other FRS services will remain passive unless the ActiveFRS becomes unavailable.
The Input and Output Repository do not have to reside on the same machine. The location of the FRSrepositories is managed through the CMC in the Servers section under the Properties tab.
12/17/05 Copyr ight © 2005 Business Objects. All rights reserved. Page 12
8/7/2019 SAP BOBJ Sizing
http://slidepdf.com/reader/full/sap-bobj-sizing 13/35
NOTE To optimize system performance on the File Repository Servers, network settings onWindows 2000 Server could be set to "Maximize Throughput for File Sharing". This willgive a higher priority to file sharing applications.
Calculate Number of File Repository Servers (FRS) Required
1 of each Input and Output File Repository Servers are required. In larger deployments, there may be multiple Input andOutput File Repository Servers, for redundancy. In this case, all Input File Repository Servers must share the same directory.Likewise, all Output File Repository Servers must share a directory.
Processor Requirements
The File Repository Servers require higher I/O resources (faster disk, network) and fewer CPU resources.When estimating the number of CPUs in the BOE XI system the File Repository Servers are not considered.
Memory Requirements
The File Repository Servers will have little impact on system memory.
Disk Requirements
Enough disk space must be available to store files. Typically the Output FRS will require more disk spacethan the Input FRS. The Output FRS maintains all the instances (with Saved Data) that have been producedfrom reports (Crystal, Web Intelligence, or Desktop Intelligence), programs, and object packages that havebeen scheduled, and as such will require proportionately more disk space. For both the Input and OutputFRS, the amount of space required will vary from system to system, however, knowing the average file size
and multiplying this by the number of projected instances will assist in estimating total disk needs.
Event Server
The Event Server manages file-based events. When you set up a file-based event within BusinessObjectsEnterprise, the Event Server monitors the directory that you specified. When the appropriate file appears inthe monitored directory, the Event Server triggers your file-based event: that is, the Event Server notifies theCMS that the file-based event has occurred. The CMS then starts any jobs that are dependent upon your file-based event.
Processor and Memory Requirements
The Event Server under normal enterprise usage is not a processing or memory intensive server and assuch will not be weighted in the sizing process. If Event Server functionality is required, allocate this serviceinto the system but do not estimate any additional CPUs for this service.
12/17/05 Copyr ight © 2005 Business Objects. All rights reserved. Page 13

8/7/2019 SAP BOBJ Sizing
http://slidepdf.com/reader/full/sap-bobj-sizing 14/35
Processing Tier
Desktop Intelligence (DESKi)
The Desktop Intelligence Report Server, the Desktop Intelligence Cache Server (in conjunction with a
Desktop Intelligence Job Scheduling Server) are collectively referred to as DESKi ) handles documents of extension-type “rep”, corresponding to document types that were formerly known as Full-Client Documents.
Desktop Intelligence Report Servers
The Desktop Intelligence Report Server is used to view, and analyze Desktop Intelligence documents(formerly known as Full-Client Documents)
Desktop Intelligence Cache Servers
The principal benefit of the Desktop Intelligence Cache Server is to minimize document processing, and thisis achieved by means of intelligent caching of documents, and by sharing cached documents between
various users, in accordance with a preprogrammed logic. This logic takes into account such elements asuser access rights, document access properties, caching parameters such as the specified duration of validity of a cached document, whether a request to explicitly refresh a document should be met by cacheddate or in an immediate update from the database, etc.
Desktop Intelligence Job Server
The Desktop Intelligence Job Server processes scheduling requests it receives from the CMS for DesktopIntelligence documents and generates the instance of the Desktop Intelligence document.
Processor Requirements
Both the DESKi Report server and the DESKi Cache server have to be considered for processing DESKidocuments.
Every user request involving DESKi document will be treated through the DESKI cache server (if preferenceis set to HTML viewer): if the information is already located in the cache, the result will be returned backdirectly to the caller without any further processing. This has been designed in order to improve theperformances of the system.
If the information is not already in the cache, the request will be forwarded to the DESKi Report server. For high reliability, the DESKi Report server creates sub-processes on a per-document basis (instead of handling multiple documents in the same executable). The management of sub-processes is automaticallydone by the report server according to the users’ requests and the compatibility with the currently allocated
sub-processes. The maximum number of sub-processes can be adjusted through configuration settings, inorder to avoid system saturation. Similarly, the way sub processes can be recycled to process differentdocuments can also be adjusted through configuration settings by specifying the inactivity time-out after which the sub process can be released.
Depending on the size and complexity of the documents and the type of action being performed (view vs.refresh), processor requirement will vary, however; the following rule is recommended:
For sizing estimate for the Desktop Intelligence Cache server , it is recommended to plan for 50 maximumsimultaneous user requests per CPU. It will be used mainly for viewing requests.
12/17/05 Copyr ight © 2005 Business Objects. All rights reserved. Page 14

8/7/2019 SAP BOBJ Sizing
http://slidepdf.com/reader/full/sap-bobj-sizing 15/35
1 DESKi Intelligent Cache Server service installed per 200 – 400 simultaneous requests
- and -
1 CPU to support every 50 simultaneous user requests
For sizing estimate for the Desktop Intelligence Report server , it is recommended to use a range of 8 to12 maximum simultaneous user request per cpu. It will be used mainly for populating the cache andrefreshing documents.
1 DESKi Report Server service installed per machine
- and -
1 CPU to support every 8 – 12 maximum simultaneous user requests
Memory Requirements
The amount of main memory required specifically for DESKi will be a function of the number of DESKi reportusers, the volume and size of the documents they use and the actions performed on the documents.
Some points to consider for Desktop Intelligence Cache Server:
• The maximum value of the Desktop Intelligence Cache Server size can be set in the Central
Management Console (CMC). By default it is 100 MB. This value sets the maximum amount of physical memory for the cache within the fccache process. However, the total size of the physicalmemory footprint of the Desktop Intelligence Cache Server process (i.e. the RSS value seen withthe Unix ps command) will be almost twice that amount.
• If the cache size set in the CMC is excessively large, the Desktop Intelligence Cache Server willcontinue to use the space until it reaches the maximum. It will then launch the cache clean-upmechanism. After this clean-up has finished, the cache size (and so naturally the process size)remains the same. In other words, the clean-up mechanism will not reduce the size of the memoryfootprint.
•
If the cache size set in the CMC is too small, then the Desktop Intelligence Cache Server processwill be forced to use temporary files of the disk as part of the cache. The resulting disk-I/O will havea negative impact on performance.
• The “amount of cache to keep when document cache is full” (low water mark) parameter iscalibrated for a good balance between maintaining enough copies of the documents in the cacheand releasing enough space for new ones. However it can be tuned for specific needs if necessary.
For Desktop Intelligence Report Server, the initial memory size is 22Mb. Sub processes have an initial
memory size of 70Mb; the size will grow according to the size and complexity of the processed document.
Performance Manager (PM)
Performance Management uses nine server processes:
AA Alert & Notification Server: alerting services
AA Analytics Server: analytic processing, rendering, and transformation services
AA Dashboard Server: dashboard management services
AA Individual Profiler Server: individual analytic services AA Metric Aggregation server: metrics services AA Predictive Analytic Server: predictive analytic services AA Repository Management Server: AF repository services AA Set Analyzer Server: set analytic services AA Statistical Process Control Server: process control analytic services
12/17/05 Copyr ight © 2005 Business Objects. All rights reserved. Page 15

8/7/2019 SAP BOBJ Sizing
http://slidepdf.com/reader/full/sap-bobj-sizing 16/35
The AA Dashboard and AA Analytic servers are the principle servers required for heavy loads. They can havemultiple servers running at the same time, as they are enabled for load-balancing.
The other servers can also be deployed on several machines, however only one instance can be active at a time.The other instances function as backup.
While analytics can be based on universe queries, performance management analytics interact with metrics torender their information. Because they work with a much smaller amount of data and with significantly less-complex queries, they can run more quickly. In addition, analytics are managed through a process called AAAnalytic, which is a multi-threaded object that can handle the processing required of hundreds of concurrent
analytic requests.
Processor Requirements
Although AA Analytic and AA Dashboard servers may expand to several CPUs, the best throughput will beobtained by running one service (either AA Analytic or AA Dashboard) per CPU
For sizing estimates on AA Analytics, it is recommended to use a range of 18 to 40 Simultaneous Requestsper available CPU. This can be highly dependent on analytics complexity.
For sizing estimates on AA Dashboards, it is recommended to use a maximum of 40 Simultaneous Requestsper available CPU . This can be highly dependent on the number of analytics displayed on the dashboard
and the type of action.
Example Configuration:
If there is an expected 160 concurrent active users accessing a performance management dashboard, andassuming conservatively 40 maximum simultaneous requests per processor, potential configuration is:
1 QUAD machine with 2 AA Analytics and 2 AA Dashboard services where each service is configured to support 40concurrent active users
Memory Requirements
Depending on the design of a report, the types of actions being performed (viewed, modified, refreshed)memory requirements will vary
A general guideline for sizing the AA Analytic server is 200Mb per service.
A general guideline for sizing the AA Dashboard server is a base value of 120Mb per service, In a fashionsimilar to report processing elements, the AA Dashboard server memory footprint will be augmented eachtime an analytic is shown in the dashboard, so it is mostly dependant on the number and complexity of theanalytics presented.
Web Intelligence Report Server
The Web Intelligence Report Server is used to create, edit, view, and analyze Web Intelligence documents(stored in the Input/Output FRS). It also processes scheduled Web Intelligence documents and generatesnew instances of the document, which it stores on the Output File Repository Server (OFRS). Depending on
12/17/05 Copyr ight © 2005 Business Objects. All rights reserved. Page 16
8/7/2019 SAP BOBJ Sizing
http://slidepdf.com/reader/full/sap-bobj-sizing 17/35
the user's access rights and the refresh options of the document, the Web Intelligence Report Server will usecached information, or it will refresh the data in the document and then cache the new information.
Processor Requirements
For sizing estimates based on number of simultaneous jobs per CPU it is recommended to use a range of 25- 40 Maximum Simultaneous Connections per available CPU (simultaneous connection setting can be highlydependent on Report Complexity). Although a Web Intelligence report server may expand to several CPUs,
the best throughput will be obtained by running 1 Web Intelligence report server service per CPU
Run 1 Web Intelligence Server service for every available CPU
1 Web Intelligence Server service having 1 available CPU can support 25 – 40 Maximum Simultaneous Connections
(Caution: Default Web Intelligence Server service “Maximum Simultaneous Connections” of 100 will need to be adjusted inmost cases)
Example Configuration:
If there is an expected 100 concurrent active users viewing or modifying a Web Intelligence document, andassuming conservatively 25 maximum simultaneous connections per processor, potential configuration is:
1 QUAD machine with 4 Web Intelligence Report Server services each configured to support 25 concurrent active users
Memory Requirements
Depending on the design of a report, the types of actions being performed (viewed, modified, refreshed)memory requirements will vary. A “refresh” request demands the greatest amount of memory for a WebIntelligence document as the database is queried and the entire dataset will be transferred to the WebIntelligence server.
Note: When using very large document, it may be necessary to increase the number of Web Intelligence
report server service to more than 1 per CPU, in order to avoid reaching the 2G user process address spacelimit.
Physical Address Extension support (PAE)
QA testing of BOE XI has used the /PAE switch to increase memory access. The /PAE switch changes theaddressing mode to allow the O/S to access more than 4GB of RAM. By using the /PAE switch eachprocess is still limited to 2GB of user addressable space, but now the system can have more of these largeprocess running at once.
Web Intelligence Job Server
The Web Intelligence Job Server processes scheduling requests it receives from the CMS for WebIntelligence documents. It forwards these requests to the Web Intelligence Report Server, which willgenerate the instance of the Web Intelligence document. The Web Intelligence Job Server does not actuallygenerate object instances.
12/17/05 Copyr ight © 2005 Business Objects. All rights reserved. Page 17

8/7/2019 SAP BOBJ Sizing
http://slidepdf.com/reader/full/sap-bobj-sizing 18/35
Processor Requirements
The Web Intelligence Job Server has a comparable function to the Crystal Reports Job Server in that it isresponsible for handling Scheduled Jobs. However, the Web Intelligence Job Server does not actually“process” reports, but only acts as a scheduling manager or “router” sending jobs to be processed by theWeb Intelligence Report Server
Note: One parameter to be aware of is -requestTimeout N - where N is in milliseconds, the default is 600000and lowest allowed value is 30000. If it is expected that reports will run longer than 10 minutes when
scheduled, then this setting will need to be increased
1 available CPU can optimally support 5 maximum jobs (processes) – higher lower depending on report complexity and size
Disk Requirements
For the Web Intelligence Job Server service, sufficient hard drive disk space should be available in the tempdirectory for the creation of temp files during report processing (C:\Program Files\BusinessObjects\BusinessObjects Enterprise 11\Data\procSched\machinename.Web_IntelligenceJobServer \). Thedata from the database server is stored in these files until it can be saved and compressed in the report.
Hard drive access speed to the temp directory may have an impact on the speed at which a reportprocesses.
Crystal Reports Page Server
The Page Server is primarily responsible for responding to page requests by processing crystal reports and
generating Encapsulated Page Format (EPF) pages. A single .epf file represents one page of a Crystalreport. The Page Server retrieves data for the report from the latest instance or directly from the database(depending on the user’s request and user’s security level).
Specifically, the Page Server responds to page requests made by the Cache Server. The Page Server andCache Server interact closely, so cached EPF (encapsulated page files) pages are reused as frequently aspossible, and new pages are generated as soon as they are required. The InfoView portal takes advantageof this behavior by ensuring that the majority of report-viewing requests are made to the Cache Server andPage Server. However, if a user’s default viewer is the Interactive DHTML viewer, the Report ApplicationServer processes the report.
The Crystal Reports Page Server creates Page Server Sub Processes. Each Sub Process loads CRPE andthen instantiates threads or Print Jobs as needed. With the Page Server, if an individual Print Job were tofail for any reason, only those threads contained in the Page Server Sub-Process would be affected. Allother Sub Processes within the Page Server service would be unaffected. In addition, individual SubProcesses are shut down after so many requests and a new Sub Process is started, if required, so as tomaximize resource management.
Definitions used in this section:
Page Server Service – Service that manages Sub Processes
Page Server Service Sub Process – Process responsible for managing Report Jobs
Report Job – Thread responsible for generating report pages requested by report viewers
12/17/05 Copyr ight © 2005 Business Objects. All rights reserved. Page 18

8/7/2019 SAP BOBJ Sizing
http://slidepdf.com/reader/full/sap-bobj-sizing 19/35
Maximum Simultaneous Report Jobs – The total number of Report Jobs that can be contained in a PageServer Service
For the Page Server service, the number of Page Server Sub processes and the total MaximumSimultaneous Report Jobs are determined by the following default algorithm:
Max Simultaneous Report Jobs (threads) = (# CPU's) * (25) [minimum of 50 on a single CPU]
Max # of Sub Processes = (Max Simultaneous Report Jobs) / 10 report jobs per sub-process (rounded up)
Max # of Processes = (Max # of Sub Processes) + 1 Parent Process
(The maximum report jobs per sub-process is set at 10)
By default, the above algorithm is used to determine the Maximum Number of Simultaneous Report Jobs ona particular machine. The algorithm has been purposely tuned conservatively to favor reliability (lower number of Simultaneous Report Jobs per CPU) so as to work optimally in most reporting environments andconfigurations. The default can easily be overridden in the CMC (under Page Server properties) bychanging the radio button from “Unlimited Jobs” to “Jobs limited to:”
The “Jobs limited to:” option gives the administrator the ability to increase or decrease the Maximum Number of Simultaneous Report Jobs that can run on a single Page Server service (parent process). Based oninternal testing, broad guidelines for this setting are outlined below within this section.
IMPORTANT
In BOE XI only 1 Page Server service is required to run on a single machine. The version BOE XI PageServer creates and stops new Page Server sub processes on an as needed basis. The Page Server detects
the number of processors on the machine and will scale accordingly.
For this reason, it is important to not install, and is not necessary to install more than 1 Page Server on asingle machine if the default setting of "Unlimited" is kept.
Dedicated Page Server machine
The newly designed Page Server improves performance, reliability and manageability particularly when amachine is fully dedicated to Page Server processing. Again, there is only need to install 1 Page Server andthis Page Server will dynamically adapt to different loads (by creating and stopping Page Server subprocesses as needed) within its available resources. In the case of a dedicated Page Server machine, it isadvisable to use the default setting of "Unlimited" for "Maximum Simultaneous Report Jobs"
When using the default setting of “Unlimited”, the Crystal Reports Page Server’s *Maximum Number of Simultaneous Report Jobs maximum will be calculated as 25 x Number of CPUs, with a minimum of 50
(25 by calculation, but minimum is always 50)
1 CPU - Maximum Simultaneous Report Jobs = 50
2 CPUs - Maximum Simultaneous Report Jobs = 50
4 CPUs - Maximum Simultaneous Report Jobs = 100
8 CPUs - Maximum Simultaneous Report Jobs = 200
* Maximum Number of Simultaneous Report Jobs is equal to the amount of user simultaneous requests
12/17/05 Copyr ight © 2005 Business Objects. All rights reserved. Page 19

8/7/2019 SAP BOBJ Sizing
http://slidepdf.com/reader/full/sap-bobj-sizing 20/35
Shared Page Server machine
There may be limited cases where it is advisable to change the default setting from unlimited so as to throttleback the maximum number of Page Server Jobs created on a single machine. This might be advisable inthe case where the Page Server is sharing resources with other services (e.g. CMS, Job Server, CacheServer, etc) as would be the case where the complete BOE XI stack is installed on a standalone machine.
The Page Server service can be changed from the default setting of "Unlimited" to a recommended range of 25 - 75 "Maximum Simultaneous Report Jobs" per available CPU. The setting of 25 - 75 can be adjusted
higher or lower depending on the environment (e.g. report complexity, size, etc.) Values below 25 per CPUmay be appropriate if other processes such as CMS, Job Server, Web Intelligence, etc are present on themachine and are sharing the same CPUs.
On-Demand (Live Data) vs. Saved Data Viewing (Pre-Scheduled Instance)
Live Data
On-demand reporting gives users real-time access to live data, straight from the database server. Use livedata to keep users up-to-date on constantly changing data, so they can access information that's accurate to
the second. For instance, if the managers of a large distribution center need to keep track of inventoryshipped on a continual basis, then live reporting is the way to give them the information they need.
Before providing live data for all your reports, however, consider whether or not you want all of your usershitting the database server on a continual basis. If the data isn't rapidly or constantly changing, then all thoserequests to the database do little more than increase network traffic and consume server resources. In suchcases, you may prefer to schedule reports on a recurrent basis so that users can always view recent data(report instances) without hitting the database server.
Saved Data
To reduce the amount of network traffic and the number of hits on your database servers, you can schedulereports to be run at specified times. When the report has been run, users can view that report instance asneeded, without triggering additional hits on the database.Report instances are useful for dealing with data that isn't continually updated. When users navigate throughreport instances, and drill down for details on columns or charts, they don't access the database server directly; instead, they access the saved data. Consequently, reports with saved data not only minimize datatransfer over the network, but also lighten the database server's workload.For example, if your sales database is updated once a day, you can run the report on a similar schedule.Sales representatives then always have access to current sales data, but they are not hitting the databaseevery time they open a report.
CPU utilization and memory consumption will be relatively comparable between Live Data viewing andSaved data viewing, however; viewing Save Data reports on average will decrease viewing response timesand increase throughput and system efficiency.
Crystal Page Server Data Sharing
The "Oldest On-Demand Data Given To a Client (in minutes):" setting controls how long the Page Server uses previously processed data to meet requests. If the Page Server receives a request that can be metusing data that was generated to meet a previous request and the time elapsed since that data wasgenerated is less than the value set here, then the Page Server will reuse this data to meet the subsequentrequest.
12/17/05 Copyr ight © 2005 Business Objects. All rights reserved. Page 20

8/7/2019 SAP BOBJ Sizing
http://slidepdf.com/reader/full/sap-bobj-sizing 21/35
Reusing data in this way significantly improves system performance when multiple users need the sameinformation. When setting the value of the "oldest processed data given to a client" consider how important itis that your users receive up-to-date data. If it is very important that all users receive fresh data (perhapsbecause important data changes very frequently) you may need to disallow this kind of data reuse by settingthe value to 0. The default is always set to 0 meaning that all users will, by default, receive fresh data.
If Data Sharing can be used in a system, this can decrease the number of CPUs required to process (view) areport.
When to use Crystal Reports Job Server vs. Crystal Reports Page Server
The Crystal Report Page Server is designed to process a large set of smaller reports whereas the CrystalReports Job Server is designed to process a smaller set of very large reports. Smaller reports are lesscomplex and contain a smaller set of data. They are suitable for a large group of users to view as “ondemand” reports (Live Data). Larger complex reports that must retrieve and process a very large set of datashould be scheduled (Saved Data)
Processor Requirements
For sizing estimates based on number of simultaneous jobs per CPU it is recommended to use a rangestarting from the default 25 to a recommended maximum of 75
1 Processor = 25 - 75 Maximum Simultaneous Report Jobs
Memory Requirements
Depending on the design of a report, the number of records retrieved from the database, memoryrequirements may vary. When a report is viewed and loaded into memory the report is decompressed andexpanded up to as much as 40 times the original report file size (with saved data/retrieved records).
Example (minimum memory requirements on Page Server machine):
500KB Report File Size (contains saved data) = 500KB * 40 (decompression ratio) = 20MB
25 Reports * 20MB = 500MB of minimum memory required
It is NOT recommended that the /3GB boot.ini switch be used to Increases the size of the user processaddress space from 2 GB to 3GB (therefore reducing the size of the system space from 2GB to 1GB) on aPage Server machine. When the Page Server is rendering reports a high degree of GDI work (GraphicalDevice Interface, a Windows standard for representing graphical objects and transmitting them to outputdevices) is being performed and most GDI memory is allocated in the kernel address space, which is at areal premium with /3GB.
Physical Address Extension support (PAE)
QA testing of BOE XI has used the /PAE switch to increase memory access. The /PAE switch changes theaddressing mode to allow the O/S to access more than 4GB of RAM. By using the /PAE switch eachprocess is still limited to 2GB of user addressable space, but now the system can have more of these largeprocess running at once.
For more advanced configuration/sizing estimates that may include Viewing and Scheduling concurrentlysee Step 3: Configuration
12/17/05 Copyr ight © 2005 Business Objects. All rights reserved. Page 21

8/7/2019 SAP BOBJ Sizing
http://slidepdf.com/reader/full/sap-bobj-sizing 22/35
Disk Requirements
For the Crystal Reports Page Server service, sufficient hard drive disk space should be available in the tempdirectory for the creation of temp files during report processing (C:\Program Files\BusinessObjects\BusinessObjects Enterprise 11\Data\machinename.pageserver\). The data from the database server is stored in these files until it can be saved and compressed in the report. Hard drive access speed to the temp directory may have an impact on the speed at which a reportprocesses
.
Crystal Reports Job Server
The Crystal Reports Job Server processes report files (.rpt) as requested by the CMS and generates reportinstances (versions of the report that contain saved data). To generate a report instance, the Job Server communicates with the database to retrieve the current data. Multiple Job Servers can facilitate large-scaledeployments.
The Job Server has the ability to process both Report files and Packaged objects. Object packages aresimply collections of BOE XI objects (e.g., report files) that can be grouped together and managed by the
BOE XI system as a single object.
When you are scheduling reports, the reports are run through the Job Server. The Job Server servicelaunches a Job Server child process so each report is run in its own process. A single Job Server servicewith 1 available CPU can optimally support 5 maximum jobs (processes). Also, a single Job Server servicecan be used to support up to 20 jobs across 4 CPUs. The default settings for maximum jobs will vary basedon the complexity and size of reports, but the conservative setting of five simultaneous jobs per availableCPU should handle any kind of report.
Processor Requirements
1 available CPU can optimally support 5 maximum jobs (processes) – higher lower depending on report complexity and size
For schedule batch reporting, the number of CPUs required to support the Crystal Reports Job Server service is dependent on the number of concurrent Jobs processing, the complexity and size of reports, andthe time window available to execute reports.
(# of reports) X (Average Report Process Time)______________________________________ = number of required CPUs (Time Window) X (# of simultaneous jobs per CPU)
Example:
How many CPUs are required to process 1000 reports taking 10 minutes each on average, that must be processed in a four-hour (240 min) time window?
(1000 reports) X (10 minutes)_________________________ = 8.4 CPUs (round up to 9 CPUs - i.e. 2 Quad and 1 Single box)
(240 minutes) X (5 simultaneous jobs per CPU)
12/17/05 Copyr ight © 2005 Business Objects. All rights reserved. Page 22

8/7/2019 SAP BOBJ Sizing
http://slidepdf.com/reader/full/sap-bobj-sizing 23/35
Memory Requirements
Depending on the design of a report, the number of records retrieved from the database, memoryrequirements may vary. When a report is executing and loaded into memory the report is decompressedand expanded up to as much as 40 times the original report file size (with saved data/retrieved records).
Example (minimum memory requirements on Crystal Report Job Server machine):
2MB Report File Size (contains saved data) = 2MB * 40 (decompression ratio) = 80MB
5 Reports * 80MB = 400MB minimum memory required
It is NOT recommended that the /3GB boot.ini switch be used to Increases the size of the user processaddress space from 2 GB to 3GB (therefore reducing the size of the system space from 2GB to 1GB) on aCrystal Report Job Server machine. When the Crystal Report Job Server is rendering reports a high degreeof GDI work (Graphical Device Interface, a Windows standard for representing graphical objects andtransmitting them to output devices) is being performed and most GDI memory is allocated in the kerneladdress space, which is at a real premium with /3GB.
Physical Address Extension support (PAE)
QA testing of BOE XI has used the /PAE switch to increase memory access. The /PAE switch changes theaddressing mode to allow the O/S to access more than 4GB of RAM. By using the /PAE switch eachprocess is still limited to 2GB of user addressable space, but now the system can have more of these largeprocess running at once
Disk Requirements
For the Crystal Reports Job Server service, sufficient hard drive disk space should be available in the tempdirectory for the creation of temp files during report processing (C:\Program Files\BusinessObjects\BusinessObjects Enterprise 11\Data\procSched\machinename.reportjobserver\). The data from the
database server is stored in these files until it can be saved and compressed in the report.
Hard drive access speed to the temp directory may have an impact on the speed at which a reportprocesses.
Report Application Server
The Report Application Server (RAS) is very similar to the Page Server. It, too, is primarily responsible for
responding to page requests by processing reports and generating EPF pages. However, the RAS uses aninternal caching mechanism that involves no interaction with the Cache Server. Specifically, the ReportApplication Server (RAS) processes reports that InfoView users view with the Interactive DHTML viewer.The RAS also provides the reporting capabilities that allow InfoView users to create and modify Crystalreports over the web. Additionally, Report Application Server is used at the time of viewing or submittingschedule requests for reports containing dynamic prompts and cascading lists of values
The default Maximum Simultaneous Report Jobs is set at 75 for each RAS service. This value, as with theCrystal Reports Page Server, may be adjusted according to anticipated load and available hardwareresources. The guideline of 25 to 75 (default) Simultaneous Report Jobs per CPU is recommended. Theideal setting for your reporting environment, however, is highly dependent upon your hardware configuration,
12/17/05 Copyr ight © 2005 Business Objects. All rights reserved. Page 23

8/7/2019 SAP BOBJ Sizing
http://slidepdf.com/reader/full/sap-bobj-sizing 24/35
your database software, and your reporting requirements. Additionally, a recommended guideline is to run 1Report Application Server per CPU.
Example:
For each available CPU run 1 RAS service with a setting of 25 to75 Maximum Simultaneous Report Jobs (use 25 for OptimalPerformance)
Processor Requirements
1 Processor = 25 to 75 Maximum Simultaneous Processing Jobs (use 25 for Optimal Performance)
Memory Requirements
Depending on the design of a report, the number of records retrieved from the database, memoryrequirements may vary. When a report is viewed and loaded into memory the report is decompressed andexpanded up to as much as 40 times the original report file size (with saved data/retrieved records).
Example (minimum memory requirements on RAS machine):
500KB Report File Size (contains saved data) = 500KB * 40 (decompression ratio) = 20MB
25 Reports * 20MB = 500MB minimum memory required
It is NOT recommended that the /3GB boot.ini switch be used to Increases the size of the user processaddress space from 2 GB to 3GB (therefore reducing the size of the system space from 2GB to 1GB) on aRAS machine. When the RAS is rendering reports a high degree of GDI work (Graphical Device Interface, aWindows standard for representing graphical objects and transmitting them to output devices) is beingperformed and most GDI memory is allocated in the kernel address space, which is at a real premium with/3GB.
Physical Address Extension support (PAE)
QA testing of BOE XI has used the /PAE switch to increase memory access. The /PAE switch changes theaddressing mode to allow the O/S to access more than 4GB of RAM. By using the /PAE switch each
process is still limited to 2GB of user addressable space, but now the system can have more of these largeprocess running at once
List of Values Job Server
The List of Values Job Server processes scheduled list-of-value objects. These are objects that contain thevalues of specific fields in a Business View. Lists of values are use to implement dynamic prompts andcascading lists of values within Crystal Reports. List-of-value objects do not appear in CMC or InfoView. For more information, see the Business Views Administrator's Guide.
The List of Values Job Server behaves similarly to the Report Job Server in that it retrieves the scheduled
objects from the Input File Repository Server (FRS) and saves the instance it generates to the Output FRS.There is never more than one instance of a list-of-values object. On demand list of value objects areprocessed by the Report Application Server.
Processor Requirements
The number of CPUs required to support the LOV service is dependent on the number of concurrent Jobsprocessing. By default the “Maximum Jobs Allowed:” is set to 5. For most environments this setting will nothave to be changed and a single CPU is sufficient.
12/17/05 Copyr ight © 2005 Business Objects. All rights reserved. Page 24

8/7/2019 SAP BOBJ Sizing
http://slidepdf.com/reader/full/sap-bobj-sizing 25/35
Memory Requirements
This list of values objects are “Group by” Crystal Reports. The file size of the list of values objects (stored inthe Output FRS) can be used to calculate memory requirements. When a report is processed and loadedinto memory the report is decompressed and expanded up to as much as 40 times the original report filesize (with saved data/retrieved records).
Example (minimum memory requirements LOV machine):
100KB Report File Size (contains saved data) = 100KB * 40 (decompression ratio) = 4MB
5 LOV Reports * 4MB = 20MB minimum memory required
Connection Server
Sizing information for the Connection Server is being collected.
Application Tier
Web Application Server
Depending on how the system is being utilized, the Web Application Server (IIS, Apache Tomcat, BEAWebLogic, IBM WebSphere) can manage differing number of concurrent user sessions and simultaneousrequests. The main functions of the Web Application Server within the BOE XI system are:
1) Processing the .NET/Java script2) Translating the Encapsulated Page Files (page on demand) to DHTML pages.3) Communicating with Cache Server for report view requests4) Managing Session state information for the users5) Facilitating OLAP Intelligence view requests6) Communicating with Web Intelligence Report Server for view requests
Processor Requirements
Note: Processor Requirement guidance is generalized and relative requirements may change based on theindividual characteristics of different Web Application Server types. To better understand specific Web
Application Server characteristics, please consult with the specific vendor.
Based on internal performance testing, 1 Web Application Server can manage approximately 400 concurrentuser sessions (user session = 1 logged on user) per processor. And generally, a service can efficientlymanage 100 simultaneous requests (request = e.g., a user clicking on a folder). Under normalcircumstances, it is improbable that all concurrent users would make a request simultaneously; therefore, thefollowing numbers allow for and differentiate between “concurrent user sessions” and “simultaneousrequests.” Because the service deals with two thresholds (Maximum number of Concurrent User Sessionsand Maximum number of Simultaneous Requests), it is important to consider both when determining therequired hardware.
This can be illustrated in the following examples:
12/17/05 Copyr ight © 2005 Business Objects. All rights reserved. Page 25

8/7/2019 SAP BOBJ Sizing
http://slidepdf.com/reader/full/sap-bobj-sizing 26/35
Example 1
1 Single available processor (1 processor) with 1 Web Application Server service running could efficientlyservice 400 concurrent user sessions and can handle 100 simultaneous user requests.
Example 2
1 Dual processor machine (2 processors) with 2 Web Application Server services running could efficientlyservice 800 concurrent user sessions and can handle 200 simultaneous user requests.
Example 3
1 Quad processor machine (4 processors) with 4 Web Application Server services running could efficientlyservice 1600 concurrent user sessions and can handle 400 simultaneous user requests.
Rule of Thumb
1 Web Application Server = 400 concurrent user sessions (user session = 1 logged on user).
1 Web Application Server = 100 simultaneous requests per processor (request = e.g., a user clicking on a folder)
As a base guideline, it is recommended to estimate 1 Web Application Server per 100 simultaneousrequests, however each viewer type will have its own characteristics that will impact the capacity for concurrent users or simultaneous requests and as such this number can be higher and lower.
Viewing in ActiveX or Java Viewers
1 Web Application Server = 100 simultaneous requests per processor (request = e.g. a user interacting with the report)
Viewing in HTML Viewer (Crystal report, WebIntelligence report, Desktop Intelligence report)
1 Web Application Server = 50 simultaneous requests per processor (request = e.g. a user interacting with the report)
OLAP Intelligence functionality within the Application Tier
OLAP Intelligence allows for native access and analysis of OLAP servers from Microsoft, Hyperion, IBM, andSAP. Slice, dice, and drill directly on multidimensional sources and deliver interactive workbooks withprebuilt guided analysis and workflows via the Web, Windows, and Microsoft Excel. It is implementedthrough the Web Component Adapter (WCA) that in turn invokes OLAP intelligence processing(OLAPSESSIONS.EXE).
Processor Requirements
When the OLAP Intelligence DHTML viewer is being used for viewing of reports, the Web Application Server (WAS) can manage a maximum of 5 - 8 simultaneous user requests per processor which equalsapproximately 40 – 60 concurrent active OLAP users.
12/17/05 Copyr ight © 2005 Business Objects. All rights reserved. Page 26
8/7/2019 SAP BOBJ Sizing
http://slidepdf.com/reader/full/sap-bobj-sizing 27/35
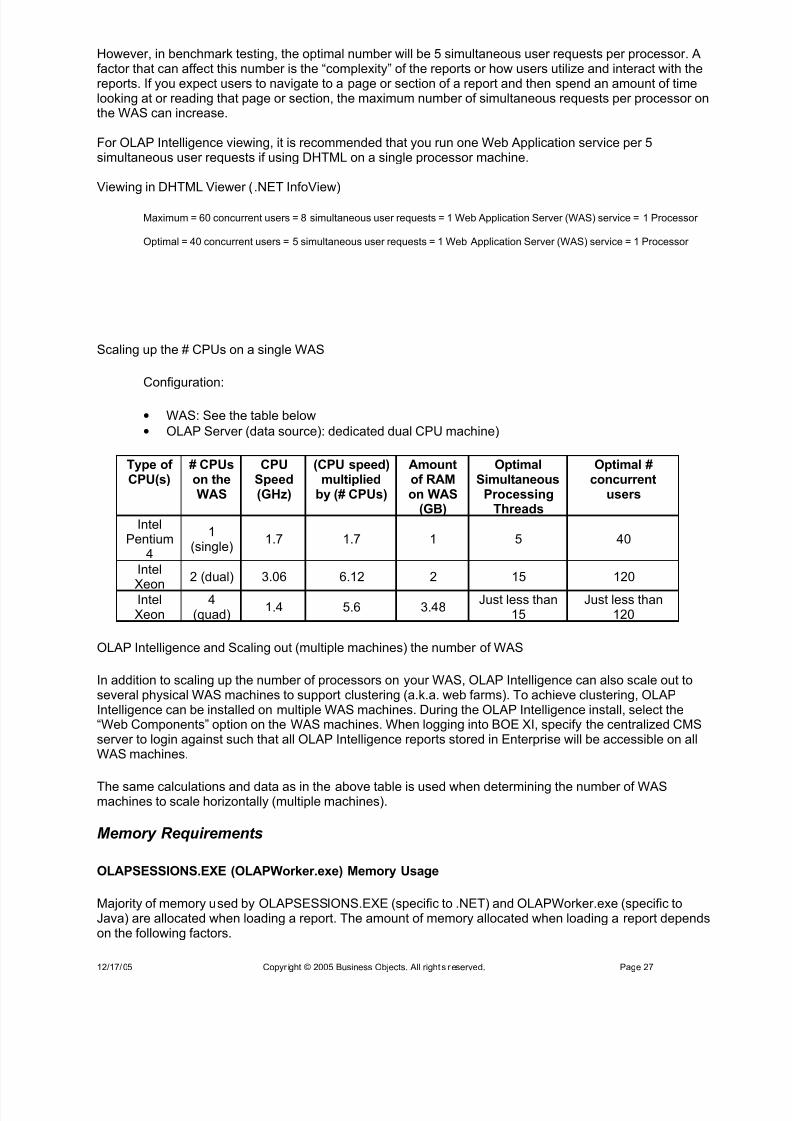
However, in benchmark testing, the optimal number will be 5 simultaneous user requests per processor. Afactor that can affect this number is the “complexity” of the reports or how users utilize and interact with thereports. If you expect users to navigate to a page or section of a report and then spend an amount of timelooking at or reading that page or section, the maximum number of simultaneous requests per processor onthe WAS can increase.
For OLAP Intelligence viewing, it is recommended that you run one Web Application service per 5simultaneous user requests if using DHTML on a single processor machine.
Viewing in DHTML Viewer (.NET InfoView)
Maximum = 60 concurrent users = 8 simultaneous user requests = 1 Web Application Server (WAS) service = 1 Processor
Optimal = 40 concurrent users = 5 simultaneous user requests = 1 Web Application Server (WAS) service = 1 Processor
Scaling up the # CPUs on a single WAS
Configuration:
• WAS: See the table below
• OLAP Server (data source): dedicated dual CPU machine)
Type of CPU(s)
# CPUson theWAS
CPUSpeed(GHz)
(CPU speed)multiplied
by (# CPUs)
Amountof RAMon WAS
(GB)
OptimalSimultaneous
ProcessingThreads
Optimal #concurrent
users
IntelPentium
4
1(single)
1.7 1.7 1 5 40
Intel
Xeon
2 (dual) 3.06 6.12 2 15 120
IntelXeon
4(quad)
1.4 5.6 3.48Just less than
15Just less than
120
OLAP Intelligence and Scaling out (multiple machines) the number of WAS
In addition to scaling up the number of processors on your WAS, OLAP Intelligence can also scale out toseveral physical WAS machines to support clustering (a.k.a. web farms). To achieve clustering, OLAPIntelligence can be installed on multiple WAS machines. During the OLAP Intelligence install, select the“Web Components” option on the WAS machines. When logging into BOE XI, specify the centralized CMSserver to login against such that all OLAP Intelligence reports stored in Enterprise will be accessible on allWAS machines.
The same calculations and data as in the above table is used when determining the number of WASmachines to scale horizontally (multiple machines).
Memory Requirements
OLAPSESSIONS.EXE (OLAPWorker.exe) Memory Usage
Majority of memory used by OLAPSESSIONS.EXE (specific to .NET) and OLAPWorker.exe (specific toJava) are allocated when loading a report. The amount of memory allocated when loading a report dependson the following factors.
12/17/05 Copyr ight © 2005 Business Objects. All rights reserved. Page 27

8/7/2019 SAP BOBJ Sizing
http://slidepdf.com/reader/full/sap-bobj-sizing 28/35
Size of the Report (i.e. Number of Pages)
The bigger the report in terms of pages, the more memory is allocated.
Complexity of Report Pages
The more complex the content of a report, the more memory is allocated.
Number of Concurrent Sessions
When viewing reports, each OLAPSESSIONS.EXE serves up to 10 concurrent sessions. Each additionalsession served requires additional memory allocation and the amount depends on the report requested.Except the first of the 10 sessions, the memory allocated for each additional session is approximately thesame.
Concurrentusers
Simple 1 page(KB)
Complex 1 page(KB)
Complex 15 pages(KB)
1 19,616 20,552 21,720
2 25,288 (+5,671) 26,376 (+5,824) 28,252 (+6,532)
3 30,260 (+4,972) 32,036 (+5,660) 35,736 (+7,484)
4 35,156 (+4,896) 37,552 (+5,516) 42,344 (+6,508)
5 40,148 (+4,992) 43,216 (+5,664) 49,008 (+6,664)
6 45,144 (+4,996) 48,984 (+5,768) 55,472 (+6,464)
7 50,148 (+5,004) 54,676 (+5,692) 62,020 (+6,548)
8 55,088 (+4,940) 60,356 (+5,680) 68,780 (+6,760)
9 60,040 (+4,952) 65,948 (+5,592) 75,284 (+6,504)
10 64,728 (+4,688) 72,612 (+6,664) 81,816 (+6,532)
11* 19,600 20,568 21,696
* The 11
th
concurrent user is served by a new OLAPSESSIONS.EXE, separated from the one serving users 1 to 10.
Temp Space Consumption
OLAP Intelligence makes minimal use of temp space on the file system. Temp files are not used whenopening OLAP Intelligence reports. Temporary .car files are created under the C:\windows\temp directorywhen either the “Save View” or “Save As” operations are performed from the toolbar within the OLAPIntelligence DHTML Viewer. These files are cleaned up right after the operation has been completed.
Compression
Temporary files are not created during report processing. We do not store any of the data from the OLAPServer within the report (.car) files and thus we don’t perform any compression.
12/17/05 Copyr ight © 2005 Business Objects. All rights reserved. Page 28

8/7/2019 SAP BOBJ Sizing
http://slidepdf.com/reader/full/sap-bobj-sizing 29/35
Step 3: Configuration &
Infrastructure Characteristics
Step 3 deals with configuration choices and core characteristics of the infrastructure pertaining to Disk I/Oand Network Bandwidth and Latency. Content in this document outlines the most basic configurationconcepts and helps to expand on the suggested configurations found in the BOE XI Administrator’s Guide.For more specific configuration and tuning information, refer to the section called “Scaling Your System/General scalability considerations“ in the BOE XI Administrator’s Guide.
Note: The following are conceptual illustrations of basic configuration types and are onlyexamples. The number of CPUs on a box is not limited to a specific number of CPUs. Thedistribution of BOE XI Services is highly flexible and can be adjusted to suit any environment.
Basic One Machine Configuration (Vertical Scaling)
The most basic configuration separates the BusinessObjects Enterprise servers from the rest of your reporting environment and from your web server, and installs all BusinessObjects Enterprise servers on asingle machine. This grants the BusinessObjects Enterprise servers their own set of processing resources,which they do not have to share with database and web server processes.
Multiple Machine Configurations Types (Horizontal Scaling)
1) High Redundancy and Fault-Tolerance - Configure for software and hardware redundancy where the
complete BOE XI stack of servers is installed on each of multiple machines (i.e. Datacenter Configuration)
12/17/05 Copyr ight © 2005 Business Objects. All rights reserved. Page 29

8/7/2019 SAP BOBJ Sizing
http://slidepdf.com/reader/full/sap-bobj-sizing 30/35
2) High Performance, Software Redundancy and Fault-Tolerance - Configure so that the environmentdivides the BusinessObjects Enterprise processing load in a logical manner, based on the types of workperformed by each server. (This is the most common multiple machine configuration)
3) High Performance, Software/Hardware Redundancy and Fault-Tolerance - Configure so that theenvironment divides the BusinessObjects Enterprise processing load in a logical manner, based on the typesof work performed by each server, but then duplicates each of these machines to provide for redundancyand fault-tolerance
Disk I/O and Network Bandwidth and Latency
This section will be updated in a future release of this guide
12/17/05 Copyr ight © 2005 Business Objects. All rights reserved. Page 30

8/7/2019 SAP BOBJ Sizing
http://slidepdf.com/reader/full/sap-bobj-sizing 31/35
Step 4: System Database Tuning
System Database Backend Performance
To provide optimal overall performance the network and the database system need to be adequately sizedand configured. Tuning a database system for peak performance is a complex task and involves hundredsof database parameters. Different tuning methodologies have been developed and comprehensiveperformance tuning guides are available.
Connection between BOE XI and the database system
For data storage and retrieval BOE XI exchanges messages with the database system over the network.CE’s data caches ensure minimal network traffic between BOE XI and the database system. Neverthelessgood network performance is critical, for example some operations cannot use BOE XI’s data caches.
The database client software uses the underlying network system. There is no tuning required for the
database client software.
Make sure
Network response times are adequate and network throughput is sufficient.
Performance Criteria
Meeting the following 5 criteria helps to avoid the most common performance bottlenecks.
1) The database system’s cache hit rates are over 90%.2) The optimizer statistics are not older than 24 hours.3) Lock granularity is row locking.4) There are no lock escalations.5) There are no log write waits. The average disk write queue length to the disk drives which contain
the database log files is smaller than 5.
1. 90% or higher cache hit rates…
give us
• Relative low number of physical disk reads and writes
• Relative low number of SQL compiler executions
are important to avoid
• the disk subsystem is unable to keep up with the level of I/O that the database server requests
• long disk read or disk write queues
• unnecessary SQL statement compilations or long SQL statement compilation times
are achieved by
12/17/05 Copyr ight © 2005 Business Objects. All rights reserved. Page 31

8/7/2019 SAP BOBJ Sizing
http://slidepdf.com/reader/full/sap-bobj-sizing 32/35
• providing sufficient physical memory
• configuration of sufficient cache sizes
2. up-to-date optimizer statistics…
give us
•
the Query Optimizer chooses the Query Execution Plan with the minimal cost• good selectivity estimates of predicates in SQL expressions specially for expressions including
columns with unequal or skewed distribution of column values
are important to avoid
• long response times and low throughput
• long execution times for queries specially for queries predicate has high selectivity
• full table scans
• lock escalations
• lock waits or deadlocks
• significant differences between the estimated number of rows for each operator in the query planfrom the actual number of rows
are achieved by
• implementing a procedure to periodically update the statistics or to update the statistics after frequent changes to the database.
• creating all statistics (table, column, index) and the statistics are not stale (underlying object has notbeen modified significantly … more than 10% of the rows)
• setting the sample size (percentage of data that got analyzed to gather statistical information) to avalue which is sufficient for the skewed data distribution
• setting the number of histogram buckets to a value which is sufficient for the skewed datadistribution
3. lock granularity is row locking…
give us
• increased concurrent execution of transactions
• reduced transaction processing time due to less lock waits
is important to avoid
• lock waits or deadlocks
is achieved by
• setting the lock granularity of your database to row level.
4. no lock escalations…
gives us
• increased concurrent execution of transactions
12/17/05 Copyr ight © 2005 Business Objects. All rights reserved. Page 32

8/7/2019 SAP BOBJ Sizing
http://slidepdf.com/reader/full/sap-bobj-sizing 33/35
is important to avoid
• lock waits or deadlocks
are achieved by
• configuration of a sufficient size of the lock list
• setting the lock escalation threshold to an appropriate value
• keeping the optimizer statistics up-to-date
5. no log write waits…
gives us
• increased concurrent execution of transactions
• reduced transaction processing time due to no I/O waits
is important to avoid
• lock waits or deadlocks
is achieved by
• providing an I/O subsystem with sufficient throughput
• providing a Disk Controller Cache and setting the Disk Controller cache to 100% write cache
Calculating the Database File Size
Estimate
Each row stores one BOE XI object. The average size of a BOE XI object is 1024 Byte.
(Size Data + Size Indexes) * (1 + (1 – page fill factor))= ((Number Rows * 1024) + Number Indexes * (32 * number of rows * 2)) * 1.3= 1.3 * number rows * (1024 + number indexes * 64)= 1.3 * number rows * 2624
Number of Objects Database Size Unit
10,000 33,312 KB
100,000 333,125 KB
1,000,000 3,331,250 KB
10,000,000 33,312,500 KB
Sybase (per one lob one data page is allocated)
= ((number rows * 844) + (number rows * page size) + Number Indexes * (32 * number of rows * 2)) * 1.3= 1.3 * number rows * (2624 + page size)
Number of Objects Database Size (page size 4K) Unit
10,000 87,360 KB
100,000 873,600 KB
1,000,000 8,736,000 KB
10,000,000 87,360,000 KB
12/17/05 Copyr ight © 2005 Business Objects. All rights reserved. Page 33
8/7/2019 SAP BOBJ Sizing
http://slidepdf.com/reader/full/sap-bobj-sizing 34/35
Useful Resources
• IBM DB2 8.1 Manuals “Administration Guide: Performance”
• IBM Redbook “DB2 UDB ESE V8 non-DPF Performance Guide for High Performance OLTP and BI”
• Oracle Manual “Performance Tuning Guide and Reference”
• Oracle Manual “Supplied PL/SQL Packages and Types Reference”
12/17/05 Copyr ight © 2005 Business Objects. All rights reserved. Page 34

8/7/2019 SAP BOBJ Sizing
http://slidepdf.com/reader/full/sap-bobj-sizing 35/35
www.businessobjects.com
Business Objects owns the following U.S. patents, which may cover products that are offered and sold by
Business Objects: 5,555,403, 6,247,008 B1, 6,578,027 B2, 6,490,593 and 6,289,352. Business Objects, the
Business Objects logo, Crystal Reports, and Crystal Enterprise are trademarks or registered trademarks of Business Objects SA or its af filiated companies in the United States and other countries. All other namesmentioned herein may be trademarks of their respective owners. Product specifications and program
conditions are subject to change without notice. Copyright © 2005 Business Objects. All rights reserved.
Finding More InformationFor more information and resources, refer to the product documentation and visit the support area of the web site at: http://www.businessobjects.com/