São Paulo, Number 1 State in Brazil - Austrian Business ... · São Paulo, Number 1 State in...
41
Investment Promotion Agency São Paulo, Number 1 State in Brazil Luciano Almeida President March 13 th , 2014
-
Upload
phungnguyet -
Category
Documents
-
view
215 -
download
0
Transcript of São Paulo, Number 1 State in Brazil - Austrian Business ... · São Paulo, Number 1 State in...
Investment
Promotion
Agency
São Paulo,
Number 1 State in Brazil
Luciano Almeida
President
March 13th , 2014

Investment Promotion Agency
Mission
To be the gateway to new investments
or expansion of existing businesses,
generating innovation, employment and income,
in addition to the continuous improvement
of the competitive environment and
of the image of the State of São Paulo
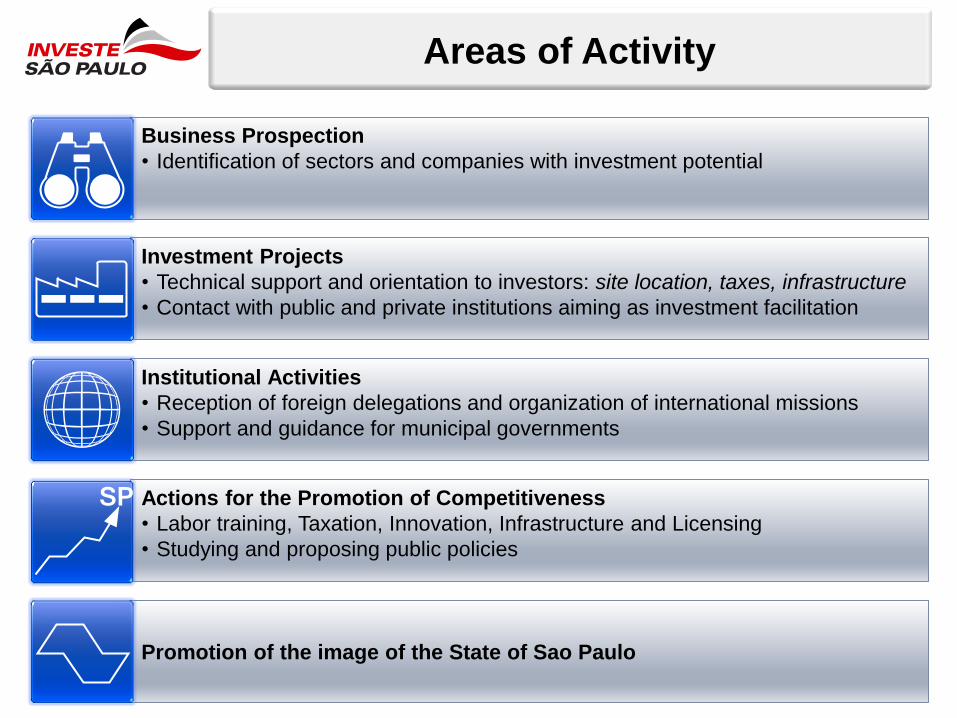
Promotion of the image of the State of Sao Paulo
Actions for the Promotion of Competitiveness
• Labor training, Taxation, Innovation, Infrastructure and Licensing
• Studying and proposing public policies
Institutional Activities
• Reception of foreign delegations and organization of international missions
• Support and guidance for municipal governments
Investment Projects
• Technical support and orientation to investors: site location, taxes, infrastructure
• Contact with public and private institutions aiming as investment facilitation
Business Prospection
• Identification of sectors and companies with investment potential
Areas of Activity
SP

www.investe.sp.gov.br
SP in Maps
Investment Promotion Agency
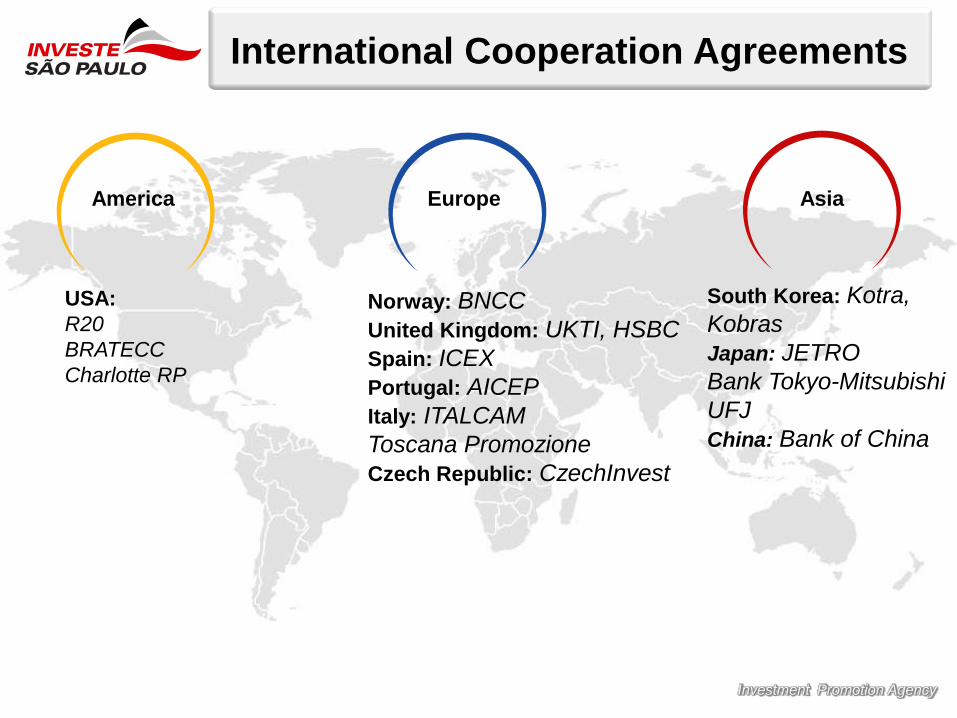
International Cooperation Agreements
America
USA:
R20
BRATECC
Charlotte RP
Europe
Norway: BNCC
United Kingdom: UKTI, HSBC
Spain: ICEX
Portugal: AICEP
Italy: ITALCAM
Toscana Promozione
Czech Republic: CzechInvest
Asia
South Korea: Kotra,
Kobras
Japan: JETRO
Bank Tokyo-Mitsubishi
UFJ
China: Bank of China

Our Customers
Direct jobs
50,468
Investments
US$ 11.77 bi
71 announcements

Brazil on the Worldstage

Investment Promotion Agency
Brazil, the 7th economy of the planet
15,653
8,250
5,984
3,366
2,580
1st USA
3rd Japan
2nd China
4th Germany
5th France
6th UK
8th Italy
7th Brazil
12th Australia
11th Canada
10th India
9th Russia
2,245
1,980
2,433
1,770
1,946
1,953
1,493
Source: IMF - year 2012
GDP - US$ billions
Investment Promotion Agency
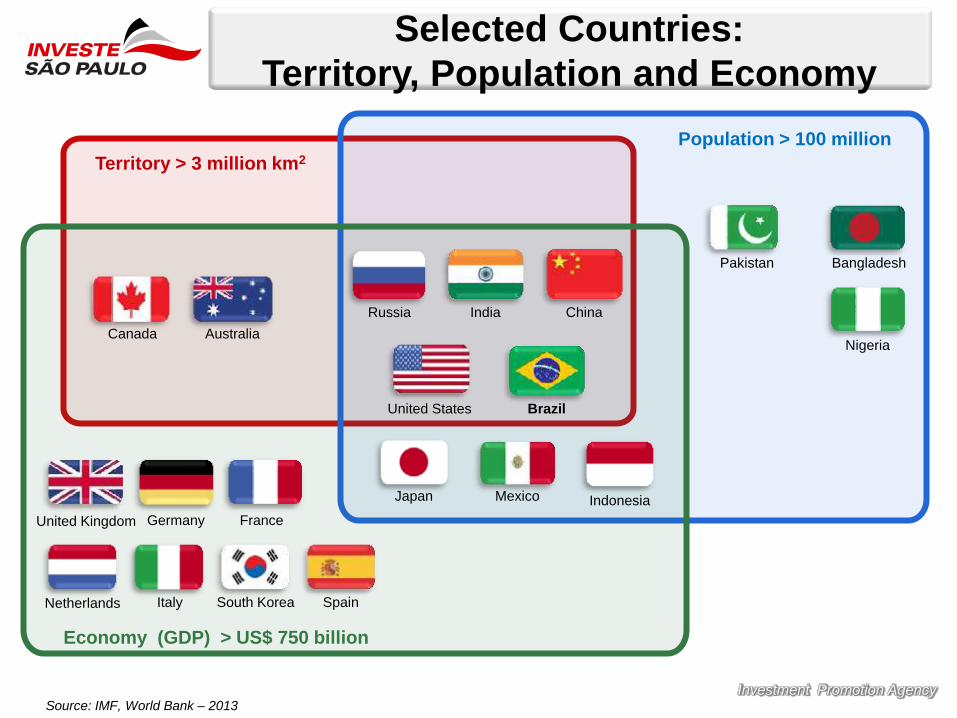
Selected Countries:
Territory, Population and Economy
Territory > 3 million km2
Economy (GDP) > US$ 750 billion
Population > 100 million
Canada Australia
Russia India China
United States Brazil
Indonesia
Nigeria
Bangladesh Pakistan
Japan Mexico
Spain
Germany France United Kingdom
Netherlands Italy South Korea
Source: IMF, World Bank – 2013

Investment Promotion Agency
Brazilian Age Structure
Source: IBGE / Revista Veja, December 2010.
0
30
50
80
2020 2010 2050
Opportunity
Larger contingent of working-age
population = possibility of increasing
productivity
Challenges
Increase on health and social security
expenditures

Investment Promotion Agency
Social Mobility
Year
projection
Percentage of Inhabitants
Source: Banco Central do Brasil/ FGV
7.4%
10.6%
15.5%
37.7%
50.5%
56.5%
26.9%
23.4%
20.0%
28.0%
15.4%
8.0%
2003
2009
2014
A e B C D E

Highlights of Austria-Brazil Relations

Austria-Brazil and SP Economic Relations
Source: Brazilian Central Bank
(1) Considering only stock purchases, excluding intercompany loans
Economic Relations with the Austria
(US$ millions) - 2013 Brazil State of São Paulo
% São
Paulo/Brazil
Austria 's bilateral trade 1.527 711 47%
Exports to the Austria 139 49 35%
Imports from the Austria 1.388 662 48%
Source: Ministry of Development, Industry and Foreign Trade
96 6 16 116 93 48
3.420
1.508
108 89
2004 2005 2006 2007 2008 2009 2010 2011 2012 2013
Austrian FDI into Brazil (US$ million)
Source: Ministry of Development, Industry and Foreign Trade of Brazil
3,5 4,0 4,2
5,3
6,3 6,1
7,8 8,6
8,0
1,5
2004 2005 2006 2007 2008 2009 2010 2011 2012 2013
Bilateral Trade Austria-Brazil (US$ billions)

Investment Promotion Agency
Brazil/SP – Austria Economic Relations
São Paulo’s exports to the Austria (2013) Main Products and percentage of Brazil’s total
•Boilers, machinery and mechanical appliances; Others
(68%)
•Electrical machinery and equipment and parts thereof;
Others (38%)
•Vehicles other than railway or tramway rolling-stock, and
parts and accessories thereof (79%)
•Rubber and articles thereof (78%)
• Miscellaneous edible preparations (100%)
São Paulo’s imports from the Austria (2013) Main Products and percentage of Brazil’s total
•Boilers, machinery and mechanical appliances; Others
(45%)
•Iron and steel (88%)
•Vehicles other than railway or tramway rolling-stock, and
parts and accessories thereof (66%)
•Pharmaceutical products (28%)
•Electrical machinery and equipment and parts thereof;
Other (49%)
Source: Ministry of Development, Industry and Foreign Trade of Brazil

São Paulo state in the
Brazilian Context

Agência Paulista de Promoção
de Investimentos e Competividade
Brasil and São Paulo Comparison
8.515.000
Km² Territory 3%
248.000
Km²
193.9
million Population 22%
41.9
million
US$ 2.475
billion
GDP
nominal 33%
US$ 750
billion
US$ 11,611 GDP
per capita 50% larger US$ 17.908
São Paulo’s
Share
Source: IBGE, Banco Central e SEADE
Exchange Rate: US$ 1 = R$ 1.95

Investment Promotion Agency
São Paulo Competitive Advantages
São Paulo Competitive Advantages
Largest Consumer Market in LATAM
Skilled Workforce
Supply Chain
World-class Infrastructure
Largest Brazilian Investor in R&D
Environmental Responsibility

Investment Promotion Agency
Brazilian State Capitals where the
consumer market grows most
36.59
22.40
8.62 7.78 7.19 6.65 5.75 4.25 4.07 3.65
São Paulo -SP
Rio de Janeiro- RJ
Brasília - DF Belo Horizonte- MG
Curitíba - PR Salvador - BA Fortaleza - CE Recife - PE Porto Alegre -RS
Manaus - AM
Sales increase 2010 - 20201
(US$ billions)
(1) 45 product categories analyzed
Source: Exame Magazine – McKinsey
Exchange rate – US$ 1 = R$ 1.67

Investment Promotion Agency
São Paulo Consumer Market Map
Source: IPC marketing 2012
USD billion
50.2%
49.8%
The largest Brazilian consumer market
USD 390 billion

Investment Promotion Agency
São Paulo’s share of the Brazilian output
33.52% Petroleum products
36.76% Biofuels
47.77% Chemicals
55.28% Machinery and equipment
58.13% Electronic components
58.34% Computer equipment and
peripherals
60% Communications equipment
67.83% Manufacture of pharmaceutical
chemicals and pharmaceuticals
72.92% Electromedical and
electrotherapeutic apparatus
and equipment of irradiation
95.84% Aircraft
Selected Sectors

Investment Promotion Agency
Higher Education
Source: INEP
577 college level
institutions
1,542,415
students enrolled
The State Government is responsible for three of the best universities in Latin America
Largest number of technological students graduated in Brazil
• 59 thousand students
• 56 technology colleges
• 65 courses in the areas industry, services and agribusiness

Investment Promotion Agency
Technical Schools
1274 technical schools
357,000
students enrolled
The largest program of technical education in Brazil: Your company can have specific courses tailored to the project needs
Technical Schools – Etecs
•226 thousand students
•211 technical schools
•124 courses in the fields of industry, services and agriculture
Source: INEP, Centro Paula Souza
Investment Promotion Agency
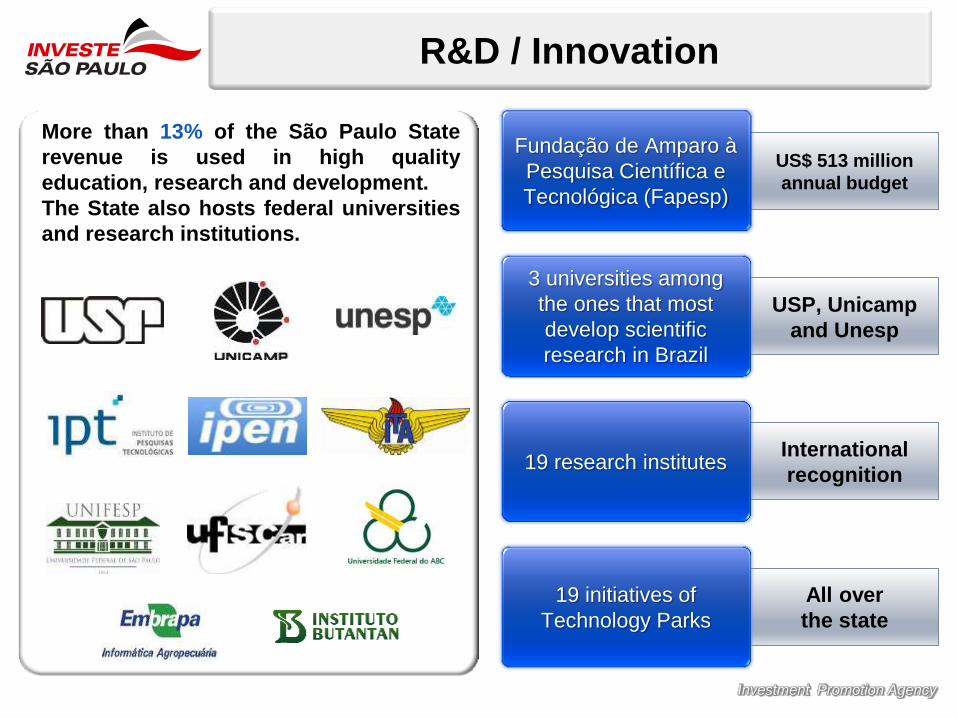
R&D / Innovation
USP, Unicamp
and Unesp
International
recognition
All over
the state
US$ 513 million
annual budget
Fundação de Amparo à
Pesquisa Científica e
Tecnológica (Fapesp)
3 universities among
the ones that most
develop scientific
research in Brazil
19 research institutes
19 initiatives of
Technology Parks
More than 13% of the São Paulo State
revenue is used in high quality
education, research and development.
The State also hosts federal universities
and research institutions.

Investment Promotion Agency
State funds invested in R&D (2010)
Source: Coordenação-Geral de Indicadores(CGIN)- ASCAV/SEXEC - Ministério da Ciência e
Tecnologia
5,012.2
488.9 413.5 213.9 209.9 120.4 92.9 70.3 63.5 58.2
SP RJ PR MG SC BA RS DF CE PE
(R$ millions)
72%
28%
SP Demais 26 EstadosOther 26 states

Investment Promotion Agency
Technology Park System
Source: Secretariat of Development.
19 implementation initiatives
Piracicaba
São José dos
Campos
São Carlos - Damha Campinas
Ribeirão Preto
Sorocaba

19 out of the 20 best
highways in Brazil
5.400 Km of railways 2 international airports
32 domestic airports Largest port
in South America
800 km of Waterways Pipeline
in industrial centers
• 19 out of the 20 best highways
• 5,400 Km of railways
• 2 international airports
• 32 domestic airports
• Largest port in South America
• 800 km of Waterways
• Pipelines in industrial centers
Highway
Railway
Waterway
Pipeline
Home airport
International airport
River port
Sea port
World-Class Infrastructure

Investment Promotion Agency
• Energy matrix with 55% of renewables
• Competitive advantages for energy production from biomass
• New opportunities in environmental technology markets
• Brazil’s most advanced conservation system
• 17.5% of the state area is of
environmental preservation
• 27 State Parks
• 21 Ecological Stations
• 17 Experimental Stations
• 13 State Forests
Environmental Responsibility
Source: Energy Secretariat of State of Sao Paulo, Forest Foundation

Ranking IFDM
Nacional
1º SP Indaiatuba 0,9486 0,9394 0,9585 0,9479
2º SP São José do Rio Preto 0,9357 0,8941 0,9650 0,9479
3º SP Itatiba 0,9276 0,9167 0,9330 0,9332
4º SP Amparo 0,9259 0,8748 0,9525 0,9503
5º SP Barueri 0,9258 0,8865 0,9525 0,9385
6º SP Ribeirão Preto 0,9230 0,9223 0,9258 0,9209
7º SP Marília 0,9195 0,8449 0,9825 0,9311
8º SP Louveira 0,9194 0,8611 0,9681 0,9291
9º SP Jundiaí 0,9171 0,8983 0,9276 0,9252
10º SP Paulínia 0,9159 0,8551 0,9675 0,9250
11º SP Bauru 0,9127 0,8964 0,9402 0,9016
12º SP Campinas 0,9117 0,8954 0,9136 0,9260
13º SP Santos 0,9108 0,8689 0,9400 0,9234
14º SP Valinhos 0,9107 0,9318 0,8916 0,9087
15º RS Bento Gonçalves 0,9102 0,9474 0,8471 0,9360
16º SP Bragança Paulista 0,9097 0,9075 0,9088 0,9129
17º SP Araraquara 0,9092 0,8465 0,9600 0,9210
18º SP Americana 0,9091 0,8453 0,9700 0,9119
19º SP São Caetano do Sul 0,9072 0,8206 0,9675 0,9335
20º SP Atibaia 0,9067 0,9102 0,9286 0,8813
IFDM Income
and jobEducation HealthState
Ranking IFDM
Base year 2010
FIRJAN Index of Municipal Development
19 out of the 20 best ranked
Brazilian municipalities are in the State of São Paulo
Economist Intelligence Unit The Economist
Brazilian Investment
Competitiveness Ranking

Investment Promotion Agency
General Ranking
#1
Source: The Economist, Centro de Liderança Pública e Veja
http://veja.abril.com.br/multimidia/infograficos/ranking-de-gestao-dos-estados-brasileiros
VERY GOOD
GOOD
FAIR
POOR
CLASSIFICATION
77.1 71.8
62.8 60.5 59.5 54.7
47.7 47.1 44.2 43.1 43.1 42.8 42.8 40.8 39.2 36.6 33.8 33 32.8 30.2 29.7 28.8 28.1 27.8 23.5 22.6
17.7
SP RJ MG RS PR SC DF ES BA AM MS GO MT PE CE SE PA PB RO AL RN TO AC RR MA PI AP
Scale – 100 for best, 0 for worst

Investment Promotion Agency
Human Resources
#1
91.7 83.3
75 75 66.7 66.7
58.3 50
41.7 41.7 41.7 41.7 33.3 33.3 33.3 33.3
25 25 16.7 16.7 16.7 16.7 16.7 16.7
8.3 8.3 8.3
SP RJ MG PR RS SC DF ES AM BA GO MT CE MS PE RO PA RN AC AL AP PB RR SE MA PI TO
Source: The Economist, Centro de Liderança Pública e Veja
http://veja.abril.com.br/multimidia/infograficos/ranking-de-gestao-dos-estados-brasileiros
Scale – 100 for best, 0 for worst
VERY GOOD
GOOD
FAIR
POOR
CLASSIFICATION

Investment Promotion Agency
Highways Quality
#1
Source: The Economist, Centro de Liderança Pública e Veja
http://veja.abril.com.br/multimidia/infograficos/ranking-de-gestao-dos-estados-brasileiros
Scale – 100 for best, 0 for worst
VERY GOOD
GOOD
FAIR
POOR
CLASSIFICATION
100
75 75 75
50 50 50 50
25 25 25 25 25 25 25
0 0 0 0 0 0 0 0 0 0 0 0
SP PR RJ RS BA DF PB SC AL ES MG PI RN RO SE AC AM AP CE GO MA MS MT PA PE RR TO

Investment Promotion Agency
Innovation
#1
100
85
65 55
50 45 45
35 35 30 30 30 30 30
25 25 25 20 20 20
15 15 10 10 10 10 10
SP RJ MG RS SC AM PR BA PE CE GO MS MT SE AL DF ES PA PB TO MA RN AC AP PI RO RR
Source: The Economist, Centro de Liderança Pública e Veja
http://veja.abril.com.br/multimidia/infograficos/ranking-de-gestao-dos-estados-brasileiros
Scale – 100 for best, 0 for worst
VERY GOOD
GOOD
FAIR
POOR
CLASSIFICATION

Investment Promotion Agency
One of the lowest national
death rate by gunfire
7,1 8,0 8,5 9,3 10,0 10,5 13,4 13,8 14,5 15,8 16,3
18,9 19,9 20,6 22,0 23,0 23,6 25,0 25,3 26,4 26,4 30,3
32,8 34,4 34,6
39,4
55,3
RR PI SC SP AC TO MG MA MS AP RS AM MT RN GO SE RO CE DF PR RJ PE PB BA PA ES AL
Death rate by gunfire in Brazilian States ( per 100,000 inhabitants - 2010)
Source: Violence Map 2013 ( reference data 2010)
PPPs and MIP

Investment Promotion Agency
Investment with Fiscal and Social
Responsibility
São Paulo State
Investment Plan of US$ 65,8 billion
PPPs 15 projects US$ 18,5 billion
Public Funds Treasury
Financing
State companies US$ 47,3 billion

Investment Promotion Agency
Innovative Fast Track for PPP Projects
State Decree 57.289 dated August 30, 2011 allows interested investors to present
proposals for PPPs Projects
PRIVATE SECTOR INITIATIVE (MIP)
APPROVAL
PUBLIC CALL for detailed technical
studies, including alternatives
CONTRACT (PPP Project winner reimburses selected
technical study author)
EVALUATION by State Commission
EVALUATION by State Commission
Technical studies
PPP Project APPROVAL
PRELIMINARY PPP PROPOSAL
PUBLIC BIDDING for the PPP
REJECTION
REJECTION
Technical studies
Technical studies
$

Current MIP Projects
Prision Units in the State .
Private Investment - R$ 750 mi
Pharmaceutical Factory
Américo Brasiliense – IFAB Studies under evaluation with the
coordination of the Executive Secretariat
of the Managing Council of PPP
Private Investment - R$ 140 mi
Social Interest of Housing
Private Investment - R$ 7,31 bi
Line 18 – Bronze of the
Metropolitan Network of São
Paulo
Private Investment - R$ 3 bi

Major Events

World Cup 2014
•R$ 300 million of state investments in public works around
the arena
•Opening Stadium for 65 thousand spectators
•Increase from 42 thousand hotel rooms to 50 thousand
Olympic Games 2016
•R$ 28.8 billion until 2016
• R$ 23.23 billion in infrastructure
• R$ 5.62 billion for operations
•São Paulo is expected to host selected contests
Major Events
SECRETARIA DE DESENVOLVIMENTO
ECONÔMICO, CIÊNCIA E TECNOLOGIA
Thank You!
Luciano Almeida President
Telephone: + 55 11 3218 6060
E-mail: [email protected]
www.investe.sp.gov.br