Santa MonicaMalibu Unified School District Middle · PDF fileDistrict Middle School...
14
Santa Monica-Malibu Unified School District Middle School Initiative Survey Report Executive Summary May 2012
Transcript of Santa MonicaMalibu Unified School District Middle · PDF fileDistrict Middle School...
SantaMonicaMalibuUnifiedSchoolDistrictMiddleSchoolInitiativeSurveyReport
ExecutiveSummary
May2012
EducationalServices,SMMUSD2
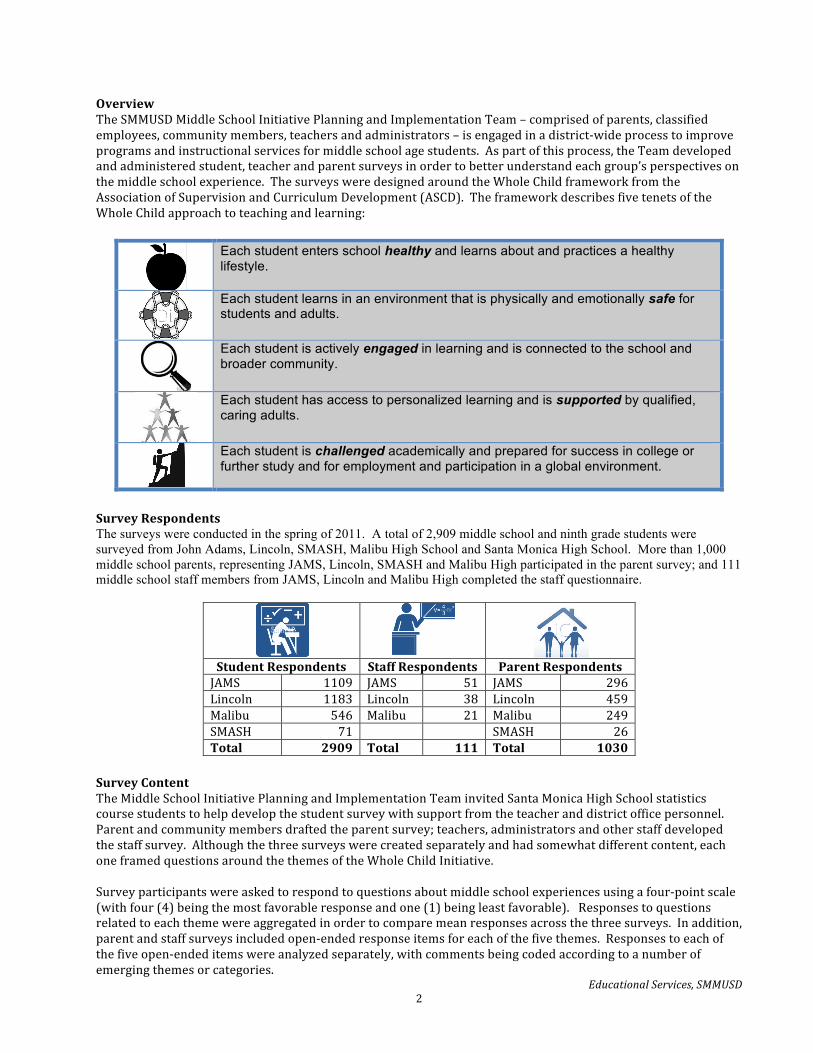
OverviewTheSMMUSDMiddleSchoolInitiativePlanningandImplementationTeam–comprisedofparents,classifiedemployees,communitymembers,teachersandadministrators–isengagedinadistrict‐wideprocesstoimproveprogramsandinstructionalservicesformiddleschoolagestudents.Aspartofthisprocess,theTeamdevelopedandadministeredstudent,teacherandparentsurveysinordertobetterunderstandeachgroup’sperspectivesonthemiddleschoolexperience.ThesurveysweredesignedaroundtheWholeChildframeworkfromtheAssociationofSupervisionandCurriculumDevelopment(ASCD).TheframeworkdescribesfivetenetsoftheWholeChildapproachtoteachingandlearning:
Each student enters school healthy and learns about and practices a healthy lifestyle.
Each student learns in an environment that is physically and emotionally safe for students and adults.
Each student is actively engaged in learning and is connected to the school and broader community.
Each student has access to personalized learning and is supported by qualified, caring adults.
Each student is challenged academically and prepared for success in college or further study and for employment and participation in a global environment.
SurveyRespondentsThe surveys were conducted in the spring of 2011. A total of 2,909 middle school and ninth grade students were surveyed from John Adams, Lincoln, SMASH, Malibu High School and Santa Monica High School. More than 1,000 middle school parents, representing JAMS, Lincoln, SMASH and Malibu High participated in the parent survey; and 111 middle school staff members from JAMS, Lincoln and Malibu High completed the staff questionnaire.
StudentRespondents StaffRespondents ParentRespondentsJAMS 1109 JAMS 51 JAMS 296Lincoln 1183 Lincoln 38 Lincoln 459Malibu 546 Malibu 21 Malibu 249SMASH 71 SMASH 26Total 2909 Total 111 Total 1030
SurveyContentTheMiddleSchoolInitiativePlanningandImplementationTeaminvitedSantaMonicaHighSchoolstatisticscoursestudentstohelpdevelopthestudentsurveywithsupportfromtheteacheranddistrictofficepersonnel.Parentandcommunitymembersdraftedtheparentsurvey;teachers,administratorsandotherstaffdevelopedthestaffsurvey.Althoughthethreesurveyswerecreatedseparatelyandhadsomewhatdifferentcontent,eachoneframedquestionsaroundthethemesoftheWholeChildInitiative.Surveyparticipantswereaskedtorespondtoquestionsaboutmiddleschoolexperiencesusingafour‐pointscale(withfour(4)beingthemostfavorableresponseandone(1)beingleastfavorable).Responsestoquestionsrelatedtoeachthemewereaggregatedinordertocomparemeanresponsesacrossthethreesurveys.Inaddition,parentandstaffsurveysincludedopen‐endedresponseitemsforeachofthefivethemes.Responsestoeachofthefiveopen‐endeditemswereanalyzedseparately,withcommentsbeingcodedaccordingtoanumberofemergingthemesorcategories.

EducationalServices,SMMUSD3
GeneralFindingsEachmiddleschoolhasbeenprovidedwithdetailedreportsoftheirstudent,parentandstaffsurveys.Thereportsincludedisaggregateddataforstudentsbyraceandethnicity,gender,andgradelevel.Inadditioneachschoolhasreceivednarrativereportsonthequalitativeanalysisofbothparentandstaffopen‐endedcomments.Whatfollowsinthisreportaresomeoverall,generalfindingsfromeachoftherespondentgroups.Studentdatahasbeendisaggregatedbyschool,gender,gradelevelandrace/ethnicity. Results are largely positive across all three respondent groups (students, parents and staff) for all five themes. On a
four‐point scale, mean responses range from 2.66 to 3.35. Aggregated results by theme differ by respondent group, with significantly more positive responses for staff in the
area of Academic Challenge, and significantly more positive responses for parents and staff than for students in the area of Health.
Middle school students rate the cleanliness of their bathrooms poorly. This item had the lowest mean score of any
other item on the student survey. Negative responses to the bathroom cleanliness issue cut across all middle school campuses. Though parents and staff did not have a specific question related to bathrooms, many open‐ended parent comments were pointedly critical on this topic.
Survey results differ by middle school, with significantly more positive ratings from SMASH students and parents
across the five themes. There were also statistically significant differences between JAMS and Malibu within the theme of Healthy, with JAMS students responding more favorably to these items than Malibu students. In the area of Safety, JAMS students’ responses were significantly less favorable than the other three middle schools.
Student results differ by grade level with 6th graders reporting more positive experiences than other grade levels. In
general, positive ratings stair‐step downward as middle school students move up the grades. The responses from 9th graders reflecting back on their middle school experiences were very similar to those of 8th graders, with the exception of items related to Academic Challenge. Here, 9th graders reported even more negatively than 8th graders.
Student results differ by gender with girls generally reporting more positive experiences than boys. The differences
are particularly significant within the themes of Safe, Engaged and Challenged. Student results differ by ethnicity, but only significantly within the themes of Safe, Engaged and Supported. White
students generally reported more favorably. Statistically significant differences were more common between white and Latino students and, in some cases, between white and African American students.

EducationalServices,SMMUSD4
Finding:OverallPositiveResultsOverall,surveyresults–bothquantitativeandqualitative–werelargelypositiveacrossallthreerespondentgroupsandacrosseachtheme.Parent,staffandstudentmeanscoresonaggregateditemsacrosseachofthefivethemeswereonthepositivesideofthefour‐pointscale.Manyparentcommentsaffirmedthesegenerallypositiveresults.Teachers’commentstendedtobemorefavorableinthethemesofengagementandacademicchallenge,furtheraffirmingthemorepositiveratingsgivenintheseareas.
“My child loves being at JAMS.” “Lincoln’s been a great experience.” “SMASH is an amazing school.” “We’ve been very happy with Malibu Middle School.”
“Most students are engaged on a daily basis.” “I am always available for my present and former students for academic and personal reasons.”
Allthreerespondentgroups,however,ratedthequestionsrelatedtostudents’emotionalandphysicalhealthlesspositivelythanotherthemes,withstudents’andteachers’responsesinthisareasignificantlylesspositive(p≤.01)thanthoseofparents.Staff’slowestratedthemewasthatof“Supported,”withmanycommentsindicatingthatclasssizeisachallengeinprovidingindividualstudentsupport.
1 2 3 4
3.08
2.93
2.89
3.07
2.71
3.01
3.04
3.04
3.14
2.98
3.35
2.66
3.15
2.77
2.75
MeanLikertScaleValuesfromLeastFavorabletoMostFavorable
2011MiddleSchoolInitiativeMeanCombinedSurveyResponsesbyThemeandRespondentGroup
Staff
Parents
Students
“I am more available with less students...less available with more.” “With larger class sizes, it is definitely more difficult to reach ALL students' individual needs every single day.” “Class size has risen to the point where it is virtually impossible to attend to their individual learning styles and needs… and for students to learn to their maximum potential when we have huge heterogeneous classes.”

EducationalServices,SMMUSD5
Finding:SignificantDifferencesbetweenRespondentGroupsAlthougheachrespondentgroup’smeanscoreswereonthepositivesideofthefour‐pointscaleinallfiveaggregatedthemes,therewerestatisticallysignificantdifferencesbetweenrespondentgroups’meanratingsonparticularitemsthatweresimilaracrosseachsurvey.StaffrateditemsrelatedtoAcademicChallengehigherthandideitherstudentsorparents.Parentsratedstudentsafetyandhealthhigherthanstudentsandstaff.
Representativestaffandparentcommentsreflectthesedifferencesinperspective:
“My class is challenging for all students despite educational disadvantages.” “I hold all the students to a high standard and with encouragement, they all make good progress in their reading.
“I wish my child who does very well academically was more challenged, engaged and excited about what he is learning.” “Would like academics to be more rigorous!”
Asmallernumberofteachercomments,however,expressedaperceptionthatfactorssuchasclasssize,testingandparentpressureforreducedhomeworkloadgreatlyimpactedtheirabilitytoofferrigorousacademicinstruction:
2.962.943.22
1 1.5 2 2.5 3 3.5 4
StudentsParentsTeachers
T:Mycurriculumisrigorousandacademicallychallenging.P:Mychildisacademicallychallengedatschool..S:Myclassesarechallenging;IhavetopushmyselftogetanA.
3.253.013.41
1 1.5 2 2.5 3 3.5 4
StudentsParentsTeachers
T:Mycurriculumpreparesstudentswellforhighschool.
P:Mychild'scurriculumispreparinghim/herwellforhighschool.
S:Myclassespreparemeforthenextgradelevel.
WithinthethemeofChallenged,forexample,eachrespondentgrouphadaquestionrelatedtoacademicrigor.Staff’smeanresponseswerestatisticallysignificantlyhigher(≤.05)thaneitherparentorstudentresponses.AsimilarquestionwithintheChallengedthemewasrelatedthatofpreparationforhighschool.Again,teachers’responsesweremorefavorablethanthoseofparentsandstudentsandthesedifferenceswerestatisticallysignificant.
“Increased focus on standardized testing, as well as the limits imposed by the district homework policy, have forced us to make compromises. Heterogeneous and large classes make it difficult to make it challenging for the top level students.” “We have had so many complaints from parents that we can no longer challenge students. All parents want their child to receive an A so our school is set up so all students can earn an A which means lowering the standards.”
EducationalServices,SMMUSD6
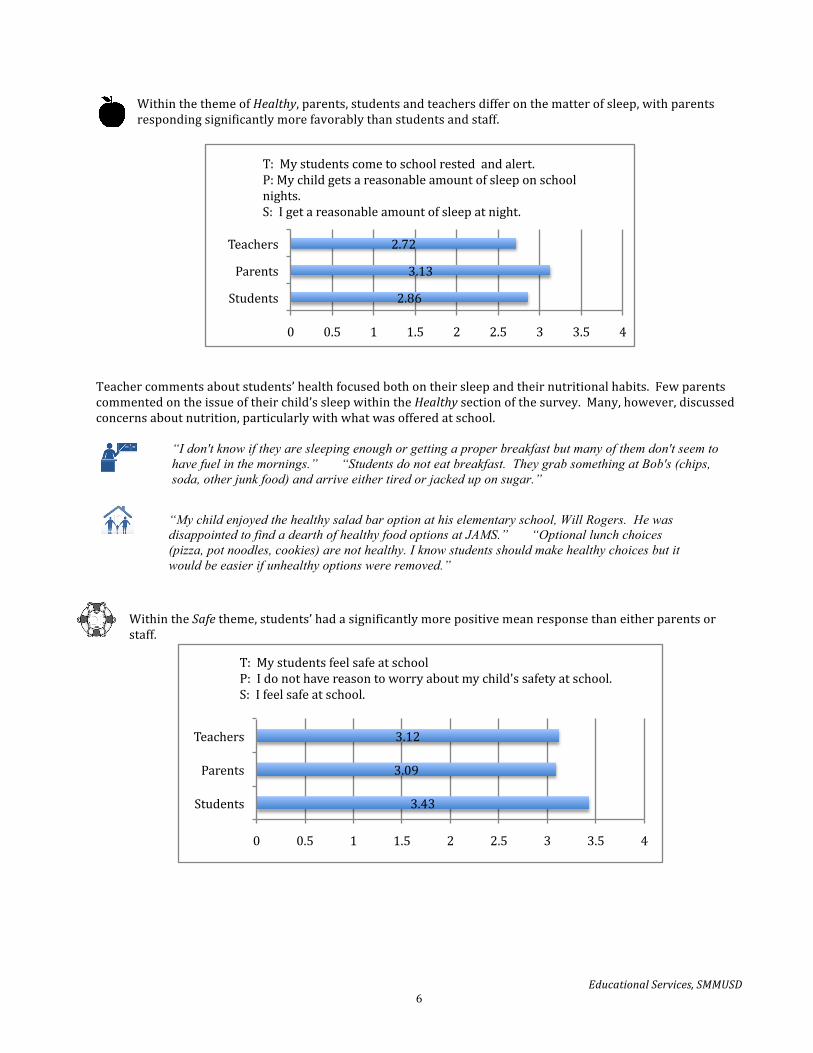
WithinthethemeofHealthy,parents,studentsandteachersdifferonthematterofsleep,withparentsrespondingsignificantlymorefavorablythanstudentsandstaff.
Teachercommentsaboutstudents’healthfocusedbothontheirsleepandtheirnutritionalhabits.Fewparentscommentedontheissueoftheirchild’ssleepwithintheHealthysectionofthesurvey.Many,however,discussedconcernsaboutnutrition,particularlywithwhatwasofferedatschool.
“I don't know if they are sleeping enough or getting a proper breakfast but many of them don't seem to have fuel in the mornings.” “Students do not eat breakfast. They grab something at Bob's (chips, soda, other junk food) and arrive either tired or jacked up on sugar.”
WithintheSafetheme,students’hadasignificantlymorepositivemeanresponsethaneitherparentsorstaff.
2.86
3.13
2.72
0 0.5 1 1.5 2 2.5 3 3.5 4
Students
Parents
Teachers
T:Mystudentscometoschoolrestedandalert.P:Mychildgetsareasonableamountofsleeponschoolnights.S:Igetareasonableamountofsleepatnight.
3.43
3.09
3.12
0 0.5 1 1.5 2 2.5 3 3.5 4
Students
Parents
Teachers
T:MystudentsfeelsafeatschoolP:Idonothavereasontoworryaboutmychild'ssafetyatschool.S:Ifeelsafeatschool.
“My child enjoyed the healthy salad bar option at his elementary school, Will Rogers. He was disappointed to find a dearth of healthy food options at JAMS.” “Optional lunch choices (pizza, pot noodles, cookies) are not healthy. I know students should make healthy choices but it would be easier if unhealthy options were removed.”

EducationalServices,SMMUSD7
Finding:BathroomCleanlinessisanIssueatMiddleSchoolsOneofthefewitemsratednegativelyinthesurveyswasthatofbathroomcleanliness.Herestudentsstronglyindicatethatthisisamajorproblem.Theresponseswerenegativeacrossgenders,thoughboyshadasignificantlylowermeanratingthangirls.Theresponseswerenegativeacrossschools,withJAMSandMalibudemonstratingsignificantlylowermeanratingsthanLincolnorSMASH.
49.6
27.417.5
5.5020406080100
AlmostNever
OnceinaWhile
Often AlmostAlways
PercentofRespondents
S:Thebathroomsatmyschoolareclean,safeandwellstocked.
1 1.5 2 2.5 3 3.5 4
Female
Male
1.97
1.63
S:Thebathroomsatmyschoolareclean,safeandwellstocked.
1 1.5 2 2.5 3 3.5 4
JAMS
Lincoln
Malibu
SMASH
1.58
2.08
1.53
1.93
S:Thebathroomsatmyschoolareclean,safeandwellstocked.
Thoughparentandstaffsurveysdidnothaveaspecificquestionaboutbathroomcleanliness,parentsincludedover30commentsthatrelatedtothisissue.Manyofthesecommentswerestronglyworded.
“The condition of the bathrooms is a constant source of frustration. My child says they are not cleaned on a regular basis. The bathrooms are not properly stocked with toilet paper, paper towels and or soap.”
“He has complained many times that the bathrooms are dirty and unsafe.” “The school is reasonably well maintained with the exception of the bathrooms, which my child often refuses to use.” “My child does not want to EVER go to the bathroom at school. He feels uncomfortable and unsafe in the bathrooms. He reports that they are filthy and stinky. He does not feel safe in them either.”

EducationalServices,SMMUSD8
Finding:SignificantDifferencesacrossMiddleSchoolsSMASHstudents’surveyresponsesweresignificantlymorefavorableacrossallthemes(p<0.1).OtherstatisticallysignificantdifferenceswerefoundintheHealthythemebetweenJAMSandMalibu,andintheSafethemebetweenbothJAMSandLincolnandMalibuandLincoln.
1 2 3 4
Challenged
Supported
Engaged
Safe
Healthy
3.32
3.39
3.31
3.34
2.9
3.07
2.92
2.88
3.03
2.62
3.08
2.92
2.92
3.17
2.71
3.08
2.9
2.85
2.98
2.75
MeanLikertScaleValuesfromLeastFavorabletoMostFavorable
2011MiddleSchoolInitiativeMeanCombinedStudentSurveyResponsesbyThemeandSchool
JAMS
LINCOLN
MALIBU
SMASH
1.5 1.7 2.2 3.88.1 8.4 9.8 3.8
61.2 64.3 63.6
30.8
29.2 24.6 24.4
61.5
0%10%20%30%40%50%60%70%80%90%100%
JAMS Lincoln Malibu SMASH
P:Mychildfeelsapartoftheschoolcommunity.
StronglyAgree
Agree
Disagree
StronglyDisagree
SMASHparents’responseswerealsogenerallymorepositivethanparentsfromtheothermiddleschools,particularlywithinthethemesofEngaged,SupportedandAcademicChallenge.

EducationalServices,SMMUSD9
Finding: Student Responses Differ by Grade Level Across all themes, 6th graders’ mean aggregated responses are more positive than other grade levels and these
differences are statistically significant (p≤.01). Although the sample of 9th graders included in the survey (n = 436) was smaller than the other grade levels, their mean Likert scale responses are very similar to that of 8th graders, except in their responses to items about being challenged in school. Here, 9th graders’ responses are significantly less positive than 8th graders.
2.8 3 2.8 016.1 18 8.5 3.8
53.6 56.1 6346.2
27.4 22.9 25.650
0%10%20%30%40%50%60%70%80%90%100%
P:Mychild'steachershavehighexpectationsforhis/herachievement.
StronglyAgree
Agree
Disagree
StronglyDisagree
1 2 3 4
2.88
2.82
2.76
2.97
2.57
3.01
2.81
2.76
3.02
2.56
3.09
2.96
2.91
3.06
2.77
3.24
3.07
3.09
3.2
2.89
MeanLikertScaleValuesfromLeastFavorabletoMostFavorable
2011MiddleSchoolInitiativeMeanCombinedStudentSurveyResponsesbyThemeandGradeLevel
6thGraders
7thGraders
8thGraders
9thGraders
RepresentativeparentcommentsfromSMASHarealsogenerallypositiveacrossallthemes:
“I feel completely comfortable knowing my child is at SMASH all day! I know that issues have come up in the past but I also feel like the staff is really good at handling it and on top of it.”
“SMASH Middle School excels in this area. There is a both opportunity and encouragement for parent/student engagement at school no matter what the parent/child's schedule, ability, etc. I think this is one of the advantages of a small learning community.”
“We all feel supported by the teachers and the administration at SMASH. I have never had a problem that I didn't feel was handled well by the staff at SMASH.

EducationalServices,SMMUSD10
IntheHealthytheme,forexample,youngermiddleschoolersaremuchmorelikelytoreportgettingareasonableamountofsleepthanolderstudents.
6.1 8.3 14.6 15.114.3 20.625.7 30.7
40.7 38.437.3 35.6
38.9 32.7 22.4 18.6
0%
20%
40%
60%
80%
100%
6thGr 7thGr 8thGr 9thGr
StudentResponses:Igetareasonableamountofsleepeachnight
AlmostAlways
Often
OnceinaWhile
AlmostNever
9.7 17.3 19.2 15.922.5
20.9 24.6 26.4
29 27.3 23.8 27.1
38.8 34.5 32.3 30.6
0%
20%
40%
60%
80%
100%
6thGr 7thGr 8thGr 9thGrPercentofRespondents
S:Ifeelcomfortableaskingmycounselorforhelp.
AlmostAlways
Often
OnceinaWhile
AlmostNever
2.1 4.7 5.8 6.68.7 10.5 13.4 17.833.5 36.5 40.5
44.5
55.7 48.3 40.4 31.1
0%
20%
40%
60%
80%
100%
6thGr 7thGr 8thGr 9thGr
PercentofRespondents
S:Myclassespreparemeforthenextgradelevel.
AlmostAlways
Often
OnceinaWhile
AlmostNever
Intermsoffeelingsupported,6thgradersreportfeelingmorecomfortableaskingtheircounselorsforhelpthanothergradelevels.Thisdifferenceisstatisticallysignificantcomparedtoothergradelevels.AtMalibuandLincoln,thedifferencebetweengradelevelsisevenmorepronounced.
WithintheChallengedtheme,olderstudentsaremuchlesslikelytoreportbeingchallengedthanyoungerstudents.Positiveratingsstair‐stepdownwardbygradelevel,withthedifferencesfor6thand9thgradersstatisticallysignificant(p≥0.1).Only31.1%of9thgradersreportthattheirclasses“AlmostAlways”preparethemforthenextgradelevel,comparedto55.7%of6thgraders.

EducationalServices,SMMUSD11
Finding: Student Responses Differ by Gender Responses for male and female students also differ. Females’ mean responses were more favorable generally than those of males, with statistically significant differences within the themes of Safe, Engaged and Challenged.
1 2 3 4
3.13
3
2.93
3.15
2.73
3.05
2.87
2.88
3.01
2.71
MeanLikertScaleValuesfromLeastFavorabletoMostFavorable
2011MiddleSchoolInitiativeMeanCombinedStudentSurveyResponsesbyThemeandGender
Male
Female
2.6 5.56.9 7.527.9 32.2
62.6 54.9
0%
20%
40%
60%
80%
100%
Females MalesPercentofRespondents
S:Ifeelsafeatschool.
AlmostAlways
Often
OnceinaWhile
AlmostNever
10.4 8.7
29.4 24.9
34.6 37.7
25.6 28.7
0%
20%
40%
60%
80%
100%
Female Male
PercentofRespondents
S:Ifeelcomfortablesharingmyideasinclass.
AlmostAlways
Often
OnceinaWhile
AlmostNever
WithinthethemeofSafe,62.6%ofgirlsreportedfeelingsafeatschool“AlmostAlways,”comparedto54.9%ofboys.
AmongthesurveyitemsrelatedtoEngaged,femalesgenerallyrespondedmorefavorablytoquestionsabouttheirlevelofengagement.Anotableexceptionwasaquestionrelatedtofeelingcomfortablesharinginclass.Here,maleshadasignificantlymorepositive(p≤.01)meanresponsewithahigherpercentageresponding“Often”or“AlmostAlways.”
EducationalServices,SMMUSD12
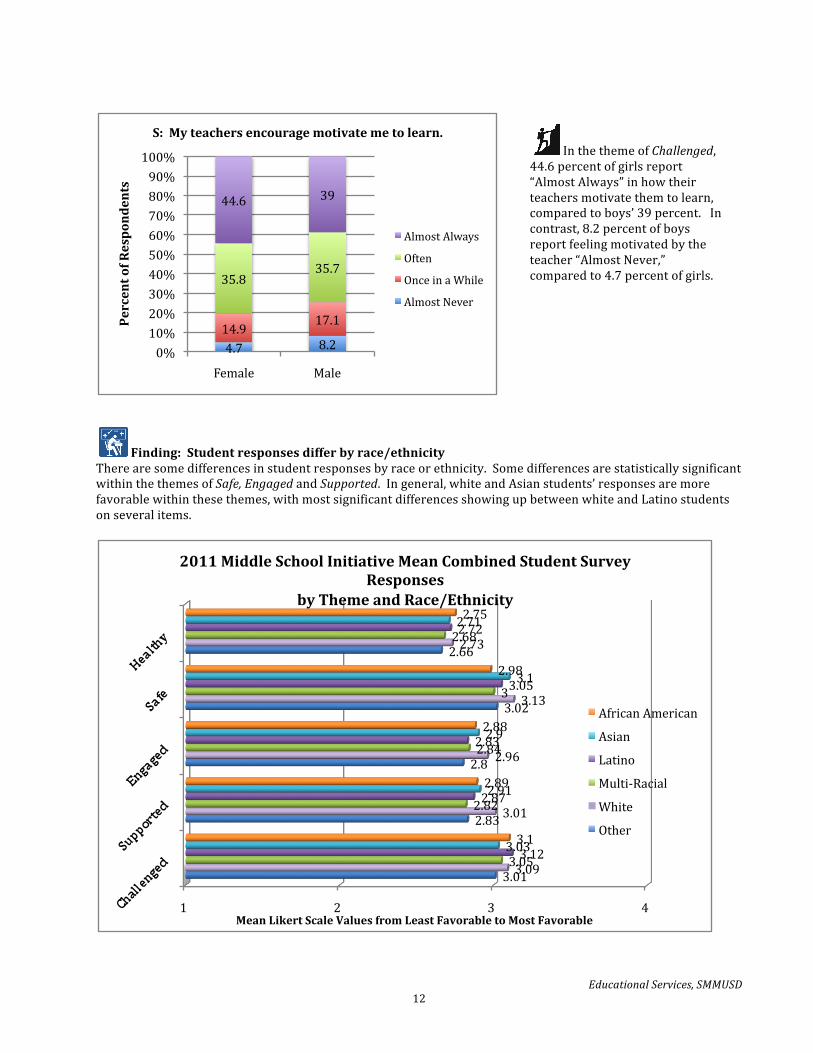
Finding:Studentresponsesdifferbyrace/ethnicityTherearesomedifferencesinstudentresponsesbyraceorethnicity.SomedifferencesarestatisticallysignificantwithinthethemesofSafe,EngagedandSupported.Ingeneral,whiteandAsianstudents’responsesaremorefavorablewithinthesethemes,withmostsignificantdifferencesshowingupbetweenwhiteandLatinostudentsonseveralitems.
4.7 8.214.9
17.1
35.835.7
44.6 39
0%10%20%30%40%50%60%70%80%90%100%
Female Male
PercentofRespondents
S:Myteachersencouragemotivatemetolearn.
AlmostAlways
Often
OnceinaWhile
AlmostNever
1 2 3 4
3.01
2.83
2.8
3.02
2.66
3.09
3.01
2.96
3.13
2.73
3.05
2.82
2.84
3
2.68
3.12
2.87
2.83
3.05
2.72
3.03
2.91
2.9
3.1
2.71
3.1
2.89
2.88
2.98
2.75
MeanLikertScaleValuesfromLeastFavorabletoMostFavorable
2011MiddleSchoolInitiativeMeanCombinedStudentSurveyResponses
byThemeandRace/Ethnicity
AfricanAmerican
Asian
Latino
Multi‐Racial
White
Other
InthethemeofChallenged,44.6percentofgirlsreport“AlmostAlways”inhowtheirteachersmotivatethemtolearn,comparedtoboys’39percent.Incontrast,8.2percentofboysreportfeelingmotivatedbytheteacher“AlmostNever,”comparedto4.7percentofgirls.

EducationalServices,SMMUSD13
Studentsoverallhadveryfavorableresponsestoaquestionaboutbeingtreatedunfairlybecauseoftheirraceorethnicity.Becausethisitemwaswrittennegatively,studentresponseswerereversecoded,with“AlmostNever”receivingfourpointsand“AlmostAlways”receivingonepoint.Meanscoresdemonstrateastatisticallysignificantmorepositiveresponseforwhitestudentsthanforothergroups.
Amongsurveyitemsrelatedtoclassparticipation,students’responsesweresimilaracrossgroups.Whitestudents’responsesweresignificantlymorepositivethanthoseofLatinostudents,however.
72.363.9
76.467.8
86.269.1
15 24.513.7
20.8
8.7
20.9
7.5 6.7 6.2 8.5 2 6.55.2 4.8 3.7 3 3.2 3.5
0%10%20%30%40%50%60%70%80%90%100%
AfricanAmerican
Asian Latino Multi‐Racial White Other
PercentofRespondents
S:Iamtreatedunfairlyatschoolbecauseofmyraceorethnicity.
AlmostAlways
Often
OnceinaWhile
AlmostNever
4.5 5.8 4.6 5.5 2.8 712.5 13 16.1 12.7 10.1
17
34.1 38.5 36 3836.2
32.2
48.9 42.8 43.2 43.9 50.9 43.9
0%10%20%30%40%50%60%70%80%90%100%
AfricanAmerican
Asian Latino Multi‐Racial White Other
PercentofRespondents
S:Myteachersencouragemetoparticipateactivelyinclass.
AlmostAlways
Often
OnceinaWhile
AlmostNever
EducationalServices,SMMUSD14
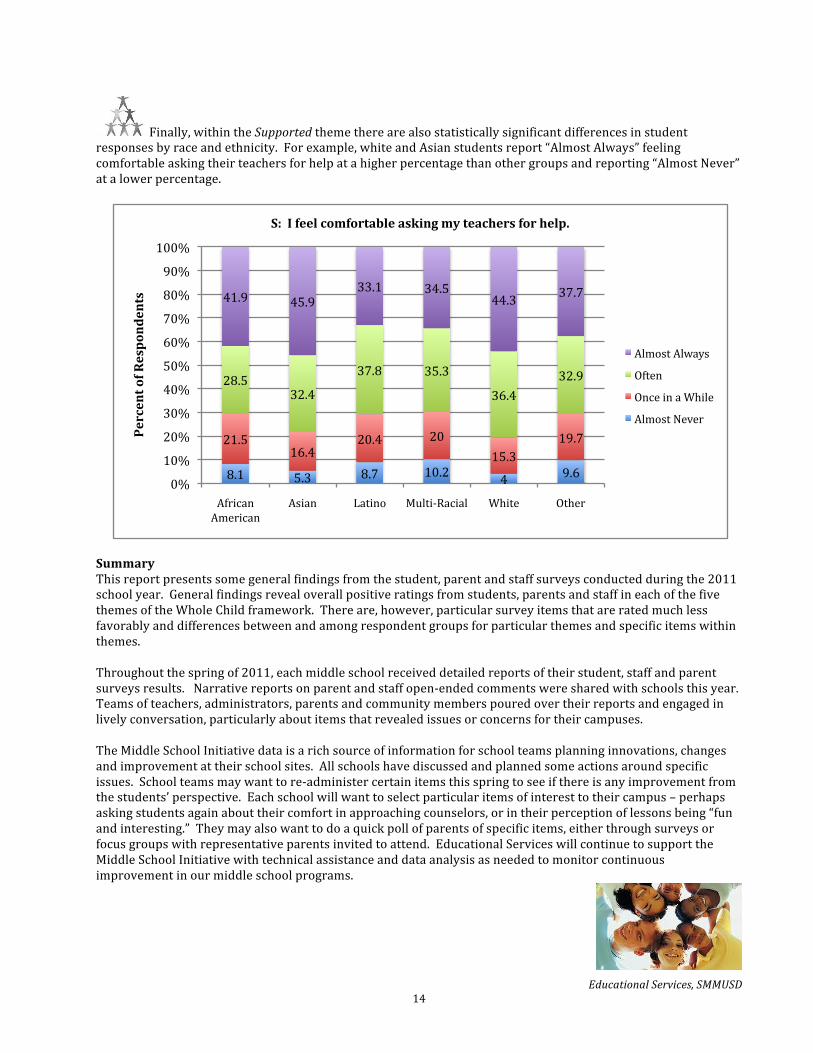
Finally,withintheSupportedthemetherearealsostatisticallysignificantdifferencesinstudentresponsesbyraceandethnicity.Forexample,whiteandAsianstudentsreport“AlmostAlways”feelingcomfortableaskingtheirteachersforhelpatahigherpercentagethanothergroupsandreporting“AlmostNever”atalowerpercentage.
SummaryThisreportpresentssomegeneralfindingsfromthestudent,parentandstaffsurveysconductedduringthe2011schoolyear.Generalfindingsrevealoverallpositiveratingsfromstudents,parentsandstaffineachofthefivethemesoftheWholeChildframework.Thereare,however,particularsurveyitemsthatareratedmuchlessfavorablyanddifferencesbetweenandamongrespondentgroupsforparticularthemesandspecificitemswithinthemes.Throughoutthespringof2011,eachmiddleschoolreceiveddetailedreportsoftheirstudent,staffandparentsurveysresults.Narrativereportsonparentandstaffopen‐endedcommentsweresharedwithschoolsthisyear.Teamsofteachers,administrators,parentsandcommunitymemberspouredovertheirreportsandengagedinlivelyconversation,particularlyaboutitemsthatrevealedissuesorconcernsfortheircampuses.TheMiddleSchoolInitiativedataisarichsourceofinformationforschoolteamsplanninginnovations,changesandimprovementattheirschoolsites.Allschoolshavediscussedandplannedsomeactionsaroundspecificissues.Schoolteamsmaywanttore‐administercertainitemsthisspringtoseeifthereisanyimprovementfromthestudents’perspective.Eachschoolwillwanttoselectparticularitemsofinteresttotheircampus–perhapsaskingstudentsagainabouttheircomfortinapproachingcounselors,orintheirperceptionoflessonsbeing“funandinteresting.”Theymayalsowanttodoaquickpollofparentsofspecificitems,eitherthroughsurveysorfocusgroupswithrepresentativeparentsinvitedtoattend.EducationalServiceswillcontinuetosupporttheMiddleSchoolInitiativewithtechnicalassistanceanddataanalysisasneededtomonitorcontinuousimprovementinourmiddleschoolprograms.
8.1 5.3 8.7 10.2 4 9.6
21.516.4
20.4 2015.3
19.7
28.532.4
37.8 35.3
36.432.9
41.9 45.933.1 34.5
44.3 37.7
0%
10%
20%
30%
40%
50%
60%
70%
80%
90%
100%
AfricanAmerican
Asian Latino Multi‐Racial White Other
PercentofRespondents
S:Ifeelcomfortableaskingmyteachersforhelp.
AlmostAlways
Often
OnceinaWhile
AlmostNever