SANRAL WESTERN REGION WORKSHOP€¦ · Kobus Louw Cape Town - 15 August 2011. Outline of...
64
SANRAL WESTERN REGION WORKSHOP Bituminous binders Suppliers perspective Kobus Louw Cape Town - 15 August 2011
Transcript of SANRAL WESTERN REGION WORKSHOP€¦ · Kobus Louw Cape Town - 15 August 2011. Outline of...

SANRAL WESTERN REGION WORKSHOP
Bituminous binders
Suppliers perspective
Kobus LouwCape Town - 15 August 2011

Outline of presentation
• Revision of specifications
• Product quality control
• Binder properties
• Recent experiences with binders on site
• Future challenges
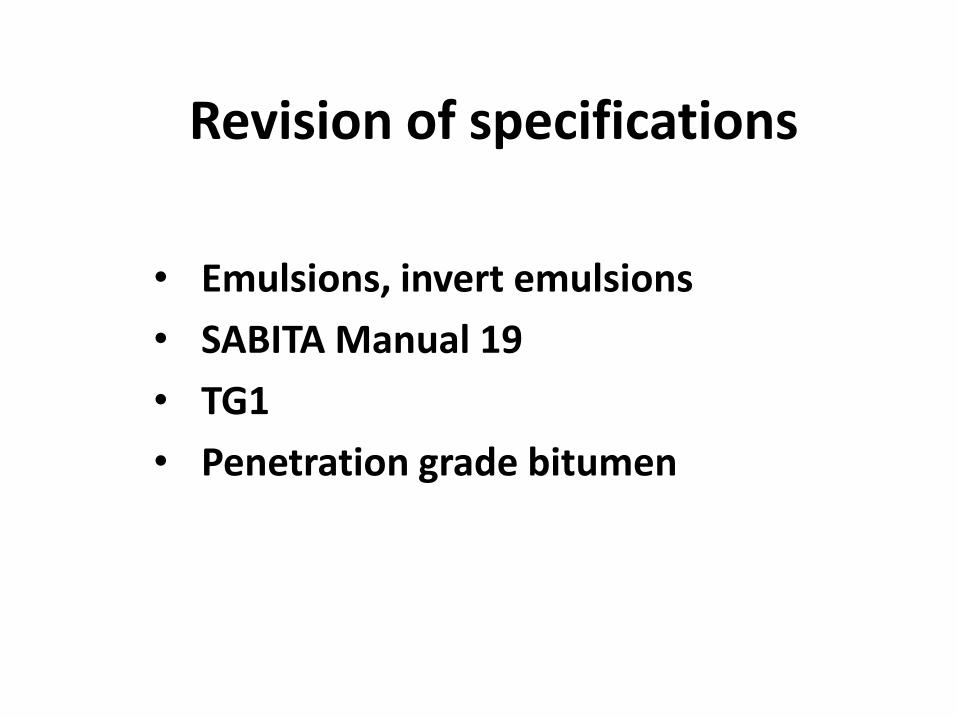
Revision of specifications
• Emulsions, invert emulsions
• SABITA Manual 19
• TG1
• Penetration grade bitumen

PRODUCT QUALITY CONTROL

BITUMEN-RUBBER AND SBS MODIFIED BITUMEN
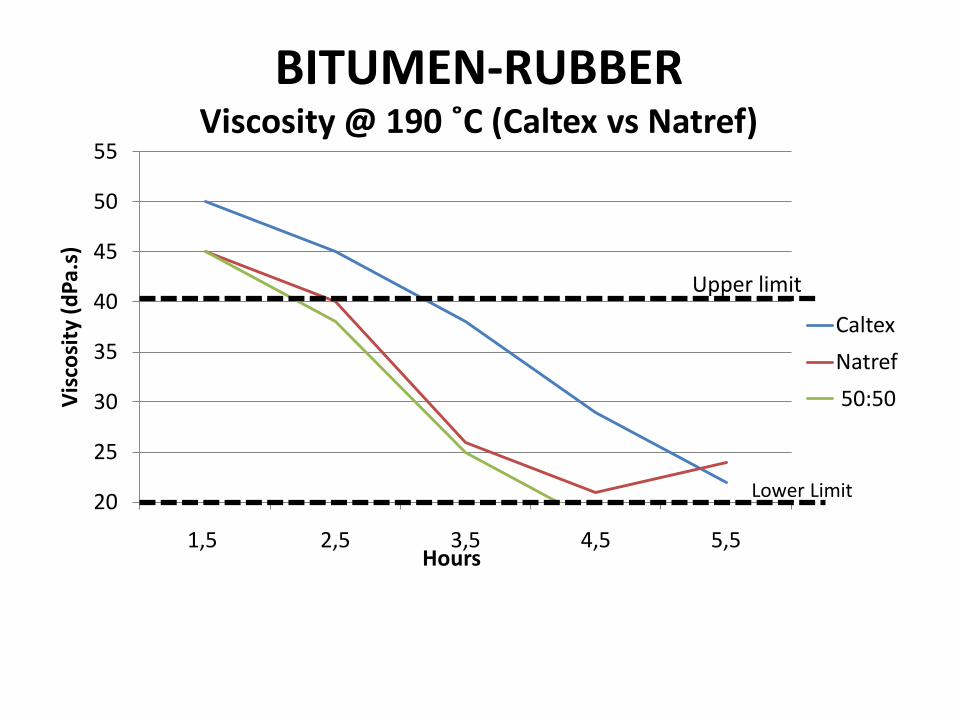
BITUMEN-RUBBERViscosity @ 190 ˚C (Caltex vs Natref)
20
25
30
35
40
45
50
55
1,5 2,5 3,5 4,5 5,5
Vis
cosi
ty (
dP
a.s)
Hours
Caltex
Natref
50:50
Lower Limit
Upper limit
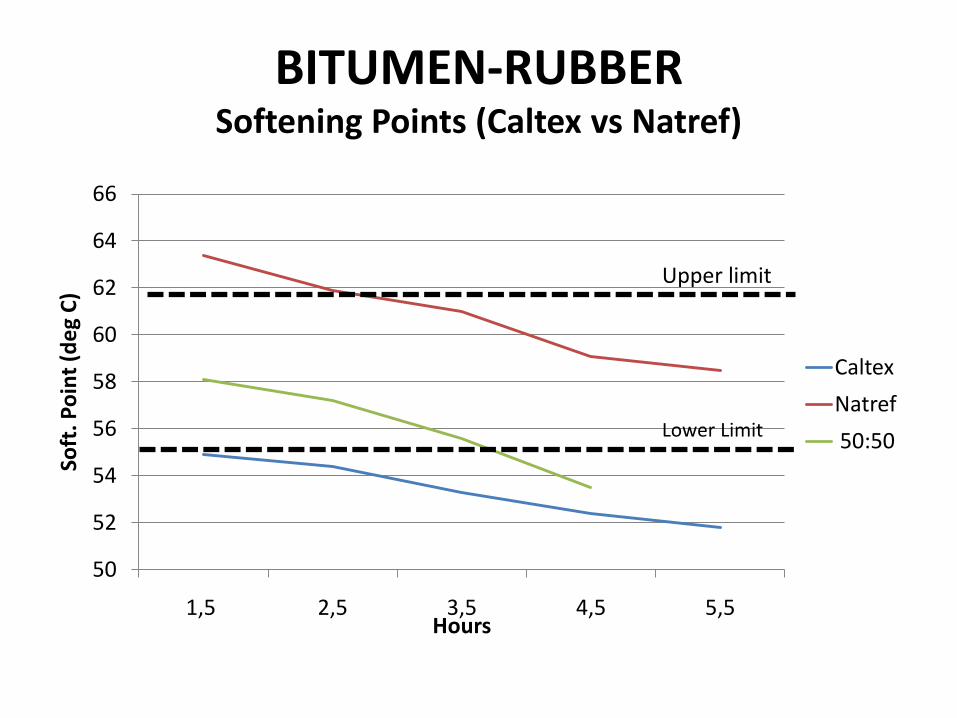
BITUMEN-RUBBERSoftening Points (Caltex vs Natref)
50
52
54
56
58
60
62
64
66
1,5 2,5 3,5 4,5 5,5
Soft
. Po
int
(de
gC
)
Hours
Caltex
Natref
50:50Lower Limit
Upper limit
SBS MODIFIED BITUMEN
S-E1, S-E2, A-E1 and A-E2
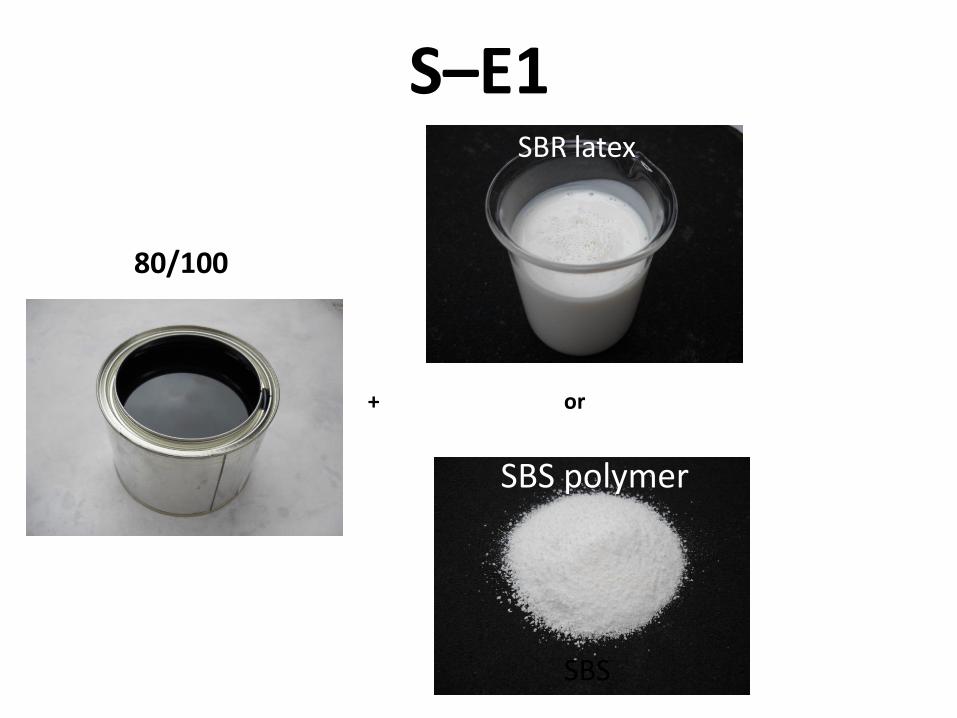
S–E1SBR latex
SBS
or+
80/100
SBS polymer

VISCOSITY TEMPERATURE RELATIONSHIP
0
50
100
150
200
250
300
350
400
450
170 180 190 200 210
Vis
cosi
ty (
mP
a.s)
Temperature (deg C)
80/100
3% SBR
3% SBS
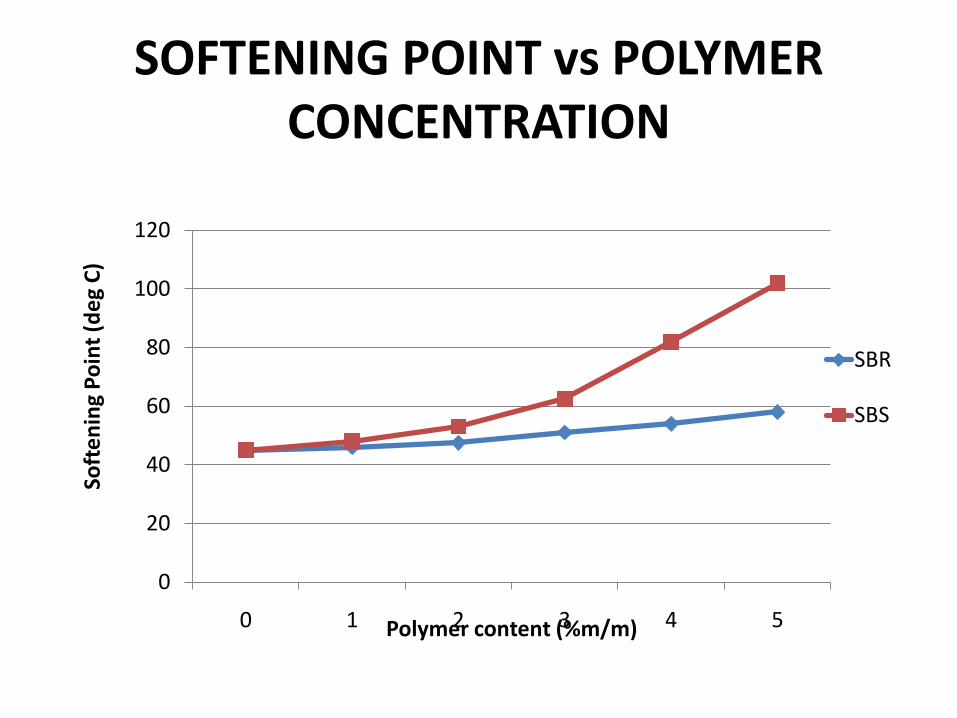
SOFTENING POINT vs POLYMER CONCENTRATION
0
20
40
60
80
100
120
0 1 2 3 4 5
Soft
en
ing
Po
int
(de
gC
)
Polymer content (%m/m)
SBR
SBS
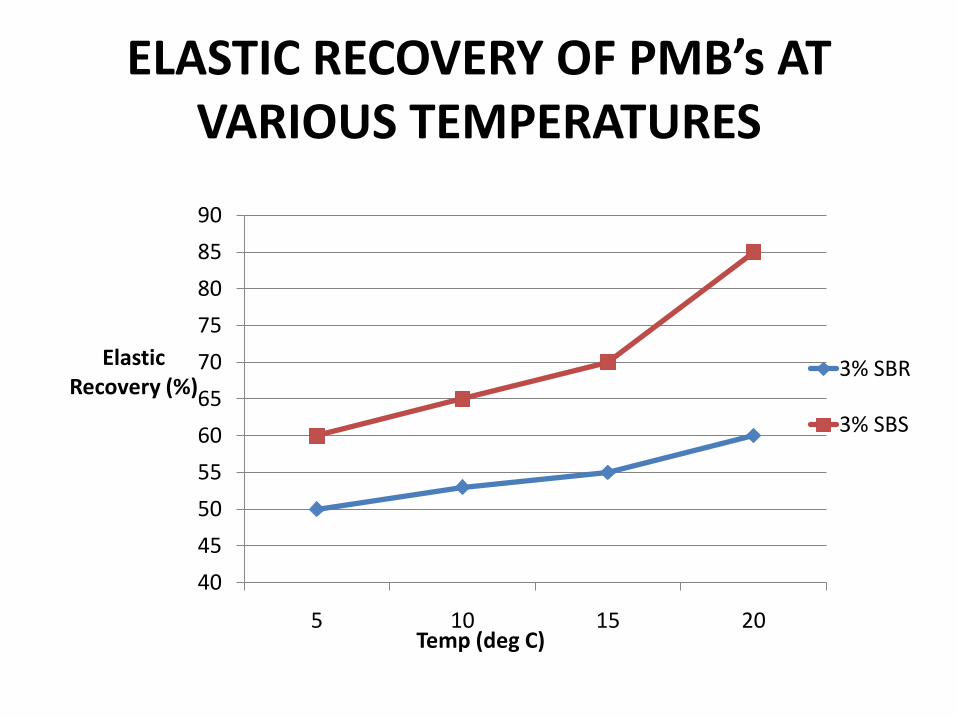
ELASTIC RECOVERY OF PMB’s AT VARIOUS TEMPERATURES
40
45
50
55
60
65
70
75
80
85
90
5 10 15 20
Elastic Recovery (%)
Temp (deg C)
3% SBR
3% SBS
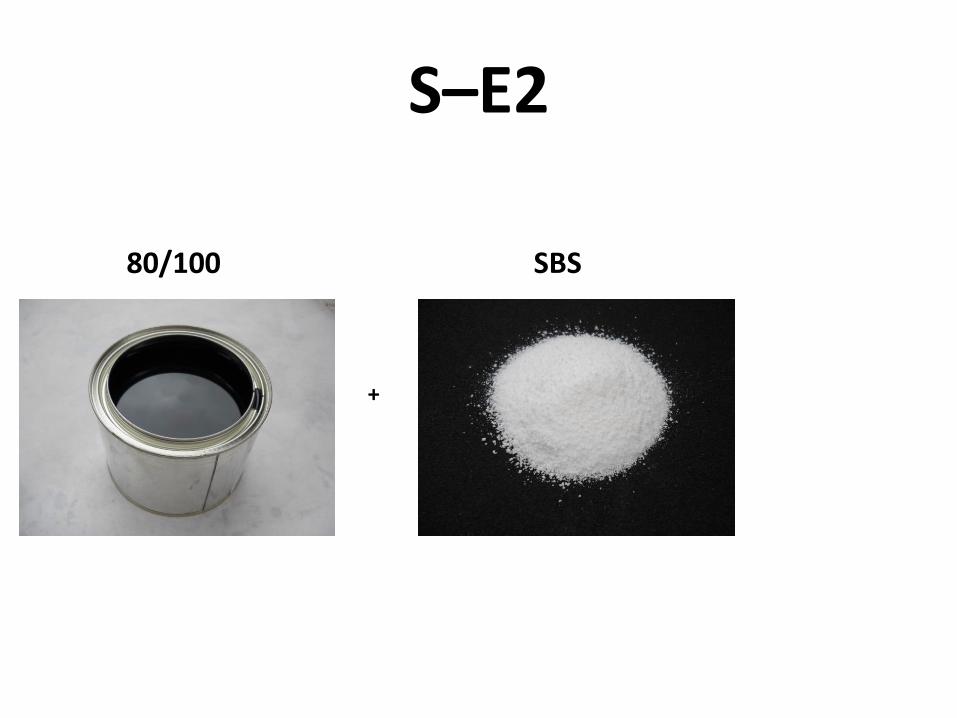
S–E2
SBS80/100
+
45
50
55
60
65
70
75
80
85
90
SO
FT
EN
ING
PO
INT
(d
eg
C)
% SBS
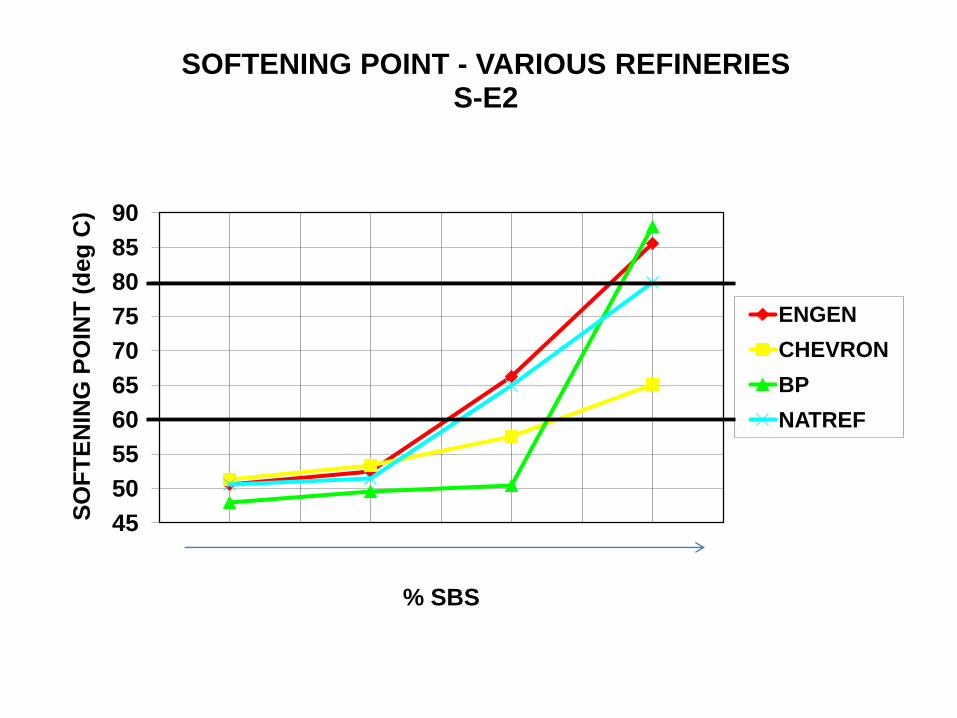
SOFTENING POINT - VARIOUS REFINERIES S-E2
ENGEN
CHEVRON
BP
NATREF
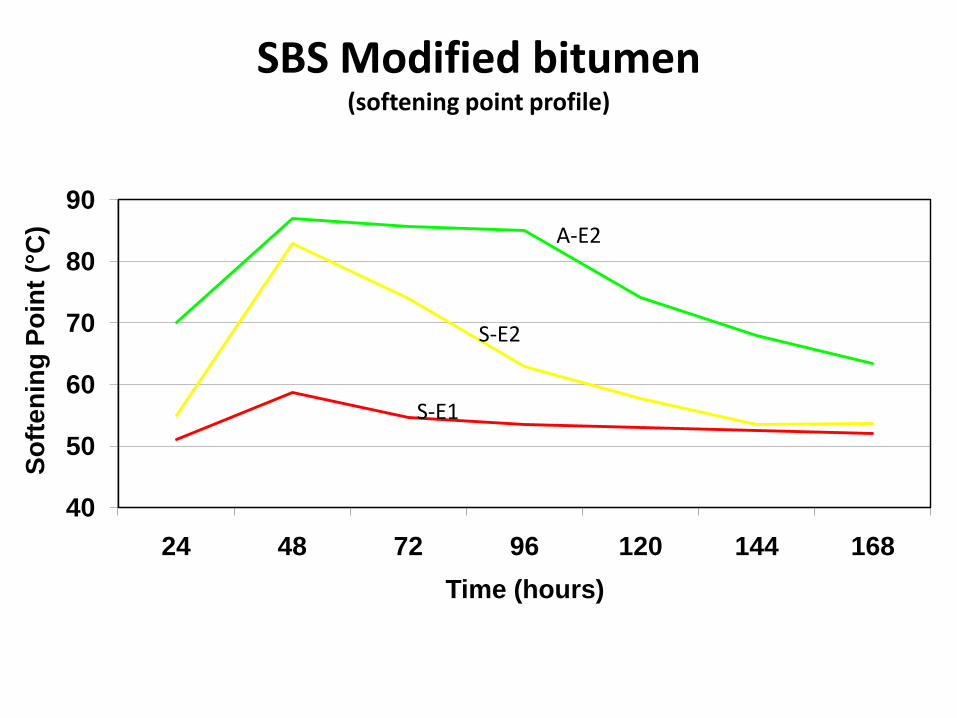
SBS Modified bitumen(softening point profile)
40
50
60
70
80
90
24 48 72 96 120 144 168
So
fte
nin
g P
oin
t (°
C)
Time (hours)
S-E2
A-E2
S-E1
THREE MAJOR ISSUES WITH SBS MODIFIED BITUMEN
• Softening point – upper limits• Softening point after ageing• Poor correlation between laboratories

Sample NumberSoftening Point Softening Point Softening Point
before ageing (°C) after ageing (°C) difference (°C)
1 77 76.8 -0.2
2 75 72.2 -2.8
3 89 76.8 -12.2
4 85.6 72 -13.6
5 81.8 65 -16.8
6 80.2 64 -16.2
7 82.6 79.8 -2.8
8 84.8 75.4 -9.4
9 76.6 64.8 -11.8
10 79.2 64.4 -14.8
11 83 67 -16
12 74.2 68 -6.2
13 77.2 65.4 -11.8
14 78 63 -15
15 89 72.4 -16.6
16 84 73.2 -10.8
17 81.2 75.4 -5.8
Requirement TG1 65 to 85 - -2 to +8 °C
Results obtained by the Council of Scientific and Industrial Researchon A-E2 binder

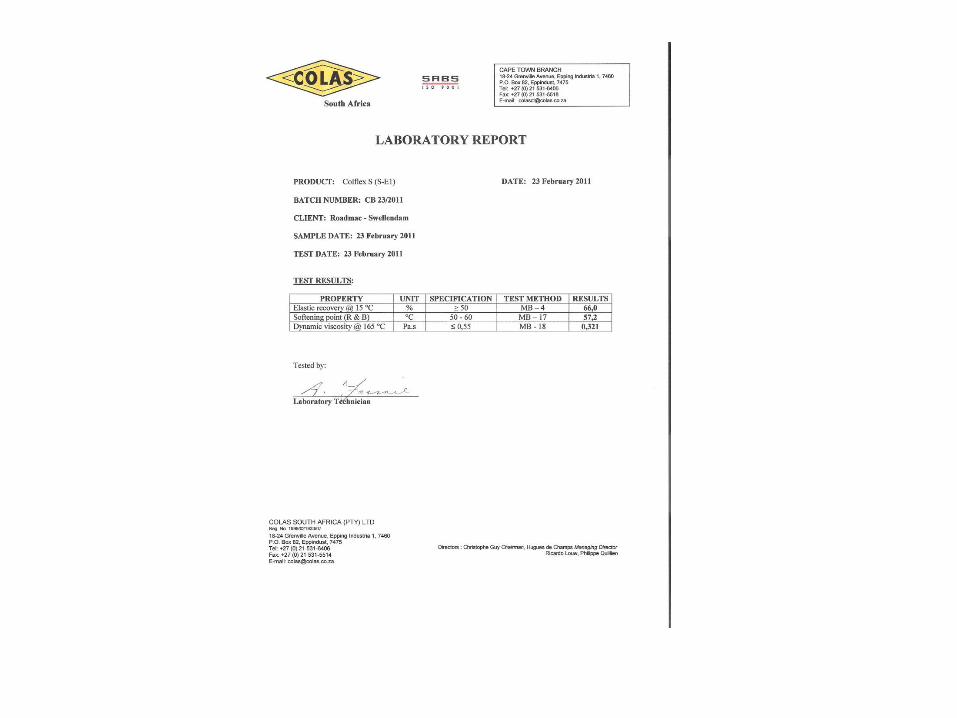
Comparative testing (SBS modified bitumen)
Property UnitSample 1
Colas Commercial Lab
Before ageing
Softening Point ˚C 71,0 71,8
Elastic Recovery @ 15 ˚C % 80 79,3
Dynamic Viscosity @ 165 ˚C Pa.s 0,336 0,321
Stability @ 160 ˚C ˚C 8,3 0,5
After ageing
Mass change % 0,078 0,039
Diff. in Softening Point ˚C 3,0 1,0
Elastic Recovery @ 15 ˚C % 78 74,8
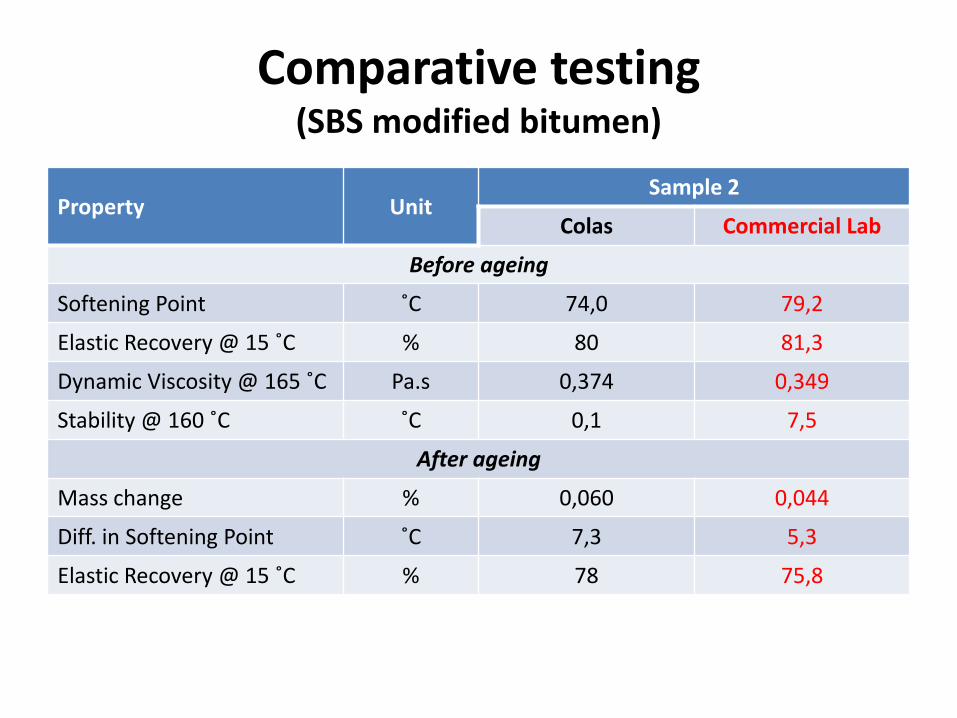
Comparative testing (SBS modified bitumen)
Property UnitSample 2
Colas Commercial Lab
Before ageing
Softening Point ˚C 74,0 79,2
Elastic Recovery @ 15 ˚C % 80 81,3
Dynamic Viscosity @ 165 ˚C Pa.s 0,374 0,349
Stability @ 160 ˚C ˚C 0,1 7,5
After ageing
Mass change % 0,060 0,044
Diff. in Softening Point ˚C 7,3 5,3
Elastic Recovery @ 15 ˚C % 78 75,8

Comparative testing (SBS modified bitumen)
Property UnitSample 3
Colas Commercial Lab
Before ageing
Softening Point ˚C 71,6 74,8
Elastic Recovery @ 15 ˚C % 80 81,8
Dynamic Viscosity @ 165 ˚C Pa.s 0,392 0,372
Stability @ 160 ˚C ˚C 4,3 10,6
After ageing
Mass change % 0,12 0,06
Diff. in Softening Point ˚C -2,3 2,0
Elastic Recovery @ 15 ˚C % 78 77,0

Comparative testing (SBS modified bitumen)
Property UnitSample 4
Colas Commercial Lab
Before ageing
Softening Point ˚C 99,3 83,5
Elastic Recovery @ 15 ˚C % 82 79,0
Dynamic Viscosity @ 165 ˚C Pa.s 0,392 0,405
Stability @ 160 ˚C ˚C 5,7 0,2
After ageing
Mass change % - 0,146
Diff. in Softening Point ˚C -12,0 8,0
Elastic Recovery @ 15 ˚C % 80 76,3
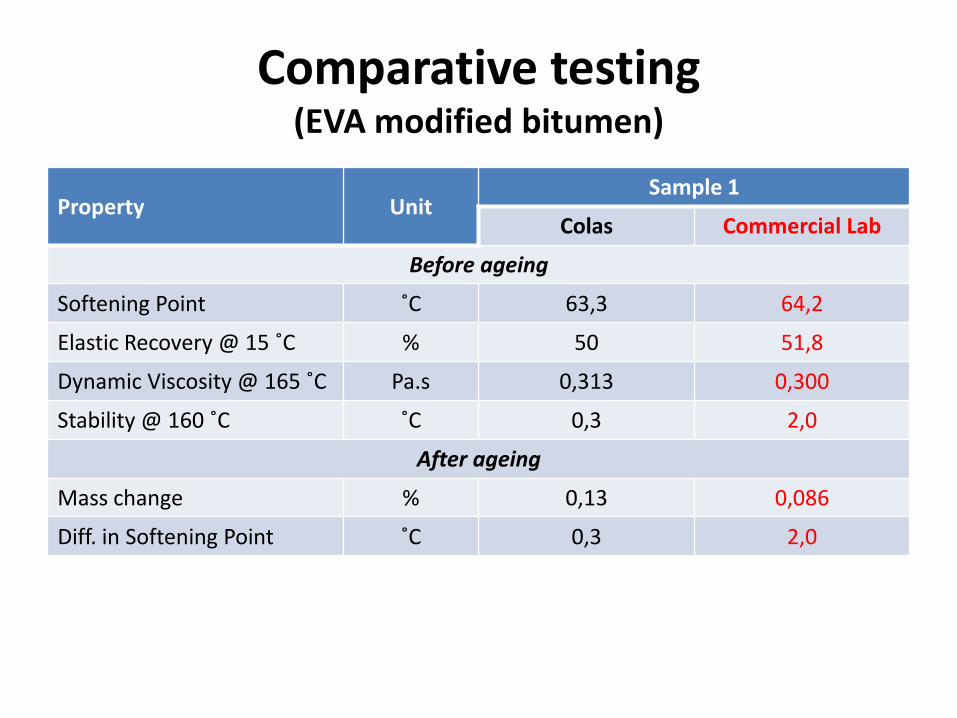
Comparative testing (EVA modified bitumen)
Property UnitSample 1
Colas Commercial Lab
Before ageing
Softening Point ˚C 63,3 64,2
Elastic Recovery @ 15 ˚C % 50 51,8
Dynamic Viscosity @ 165 ˚C Pa.s 0,313 0,300
Stability @ 160 ˚C ˚C 0,3 2,0
After ageing
Mass change % 0,13 0,086
Diff. in Softening Point ˚C 0,3 2,0

Comparative testing (EVA modified bitumen)
Property UnitSample 2
Colas Commercial Lab
Before ageing
Softening Point ˚C 62,9 64,2
Elastic Recovery @ 15 ˚C % 50 52,8
Dynamic Viscosity @ 165 ˚C Pa.s 0,299 0,290
Stability @ 160 ˚C ˚C 0,9 1,1
After ageing
Mass change % 0,158 0,079
Diff. in Softening Point ˚C 0,3 2,6

Comparative testing (EVA modified bitumen)
Property UnitSample 3
Colas Commercial Lab
Before ageing
Softening Point ˚C 64,7 65,8
Elastic Recovery @ 15 ˚C % 60 47,8
Dynamic Viscosity @ 165 ˚C Pa.s 0,360 0,336
Stability @ 160 ˚C ˚C 1,0 0,1
After ageing
Mass change % 0,188 0,095
Diff. in Softening Point ˚C 2,3 2,0
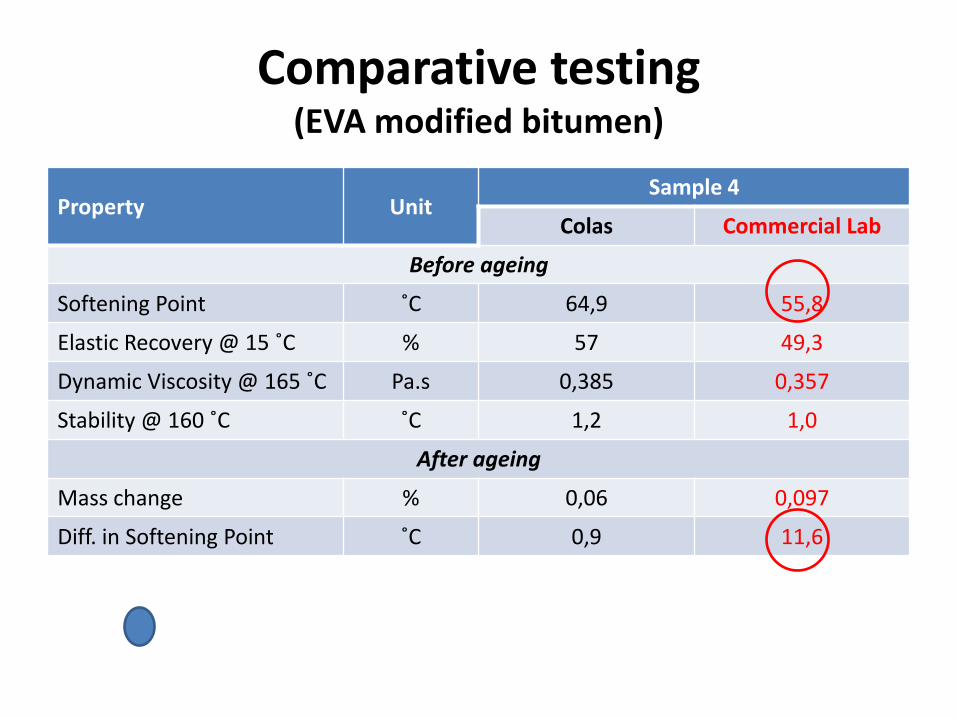
Comparative testing (EVA modified bitumen)
Property UnitSample 4
Colas Commercial Lab
Before ageing
Softening Point ˚C 64,9 55,8
Elastic Recovery @ 15 ˚C % 57 49,3
Dynamic Viscosity @ 165 ˚C Pa.s 0,385 0,357
Stability @ 160 ˚C ˚C 1,2 1,0
After ageing
Mass change % 0,06 0,097
Diff. in Softening Point ˚C 0,9 11,6
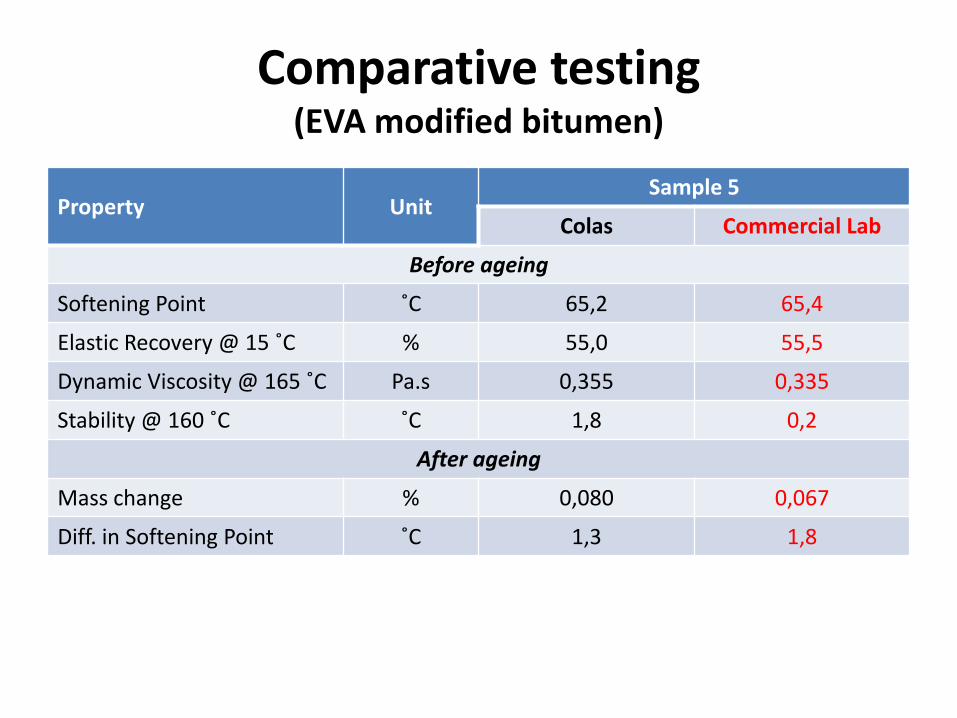
Comparative testing (EVA modified bitumen)
Property UnitSample 5
Colas Commercial Lab
Before ageing
Softening Point ˚C 65,2 65,4
Elastic Recovery @ 15 ˚C % 55,0 55,5
Dynamic Viscosity @ 165 ˚C Pa.s 0,355 0,335
Stability @ 160 ˚C ˚C 1,8 0,2
After ageing
Mass change % 0,080 0,067
Diff. in Softening Point ˚C 1,3 1,8
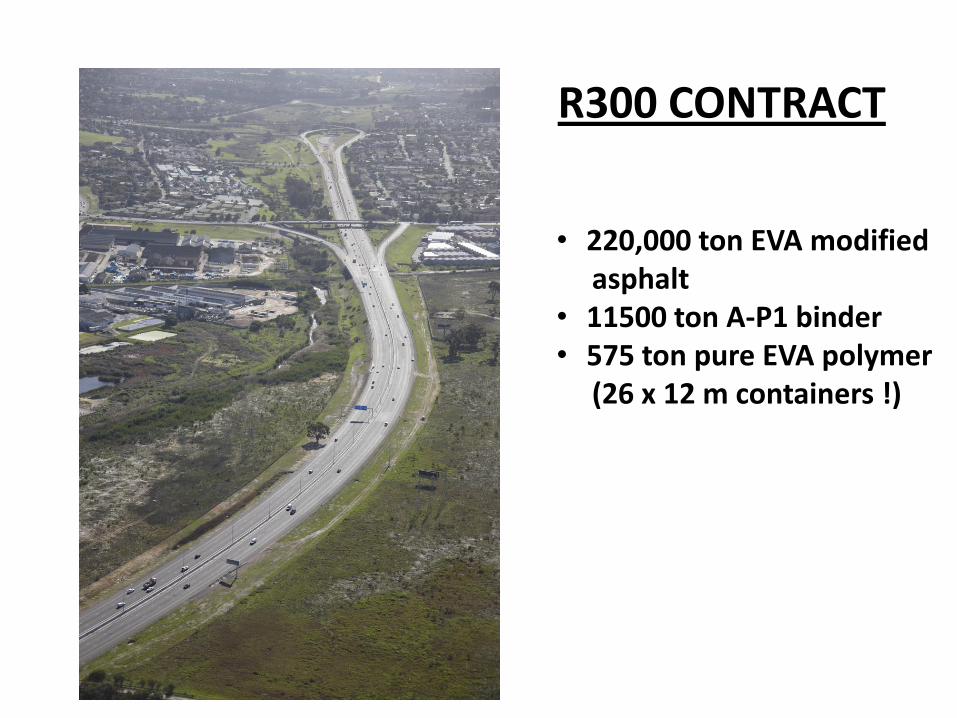
R300 CONTRACT
• 220,000 ton EVA modifiedasphalt
• 11500 ton A-P1 binder• 575 ton pure EVA polymer
(26 x 12 m containers !)

SOFTENING POINTS A-E2 vs A-P1
60
65
70
75
80
85
90
1 3 5 7 9 11 13 15 17 19 21 23 25 27 29 31 33 35 37 39
Soft
en
ing
Po
int
(de
gC
)
Sample no.
A-E2
A-P1

REHEATING OF SBS MODIFIED BITUMEN SAMPLES
DAY SOFT. POINT (˚C) VISCOSITY @ 165 ˚C (Pa.s)ELASTIC RECOVERY@15 ˚C (%)
Monday 65,2 0,288 69,0
Tuesday 59,5 0,292 68,5
Wednesday 67,1 0,302 65,0
Thursday 61,1 0,331 70,0
Friday 58,7 0,392 70,0

OTHER COUNTRIESSoftening point before and after ageing
requirements
CountryBefore ageing After ageing
Min. R + B ? Max. R + B ? Soft. Point ?
South Africa yes yes - 2 to + 8
Japan Yes - no
China yes - no
Thailand yes - - 4 to +6
India yes - Increase < 7
Vietnam yes - no
Australia yes yes (Dec 2010) no
Europe (CEN)(31 countries)
yes - Increase 8 to 12
LOW EMPERATURE PROPERTIES OF ELASTOMERIC PMB’S (SBR and SBS)

Relation essai/comportement In Situ Mouton pendule EN 13588
Choc d’un pendule sur un cube collé par un film de liant provoque sa rupture
Mesure de l’angle de remontée du pendule
La cohésion du liant est proportionnelle à l’énergie nécessaire pour chasser le cube collé par le liant
La mesure répétée à différentes températures (au moins 6) et exprimée en J/cm²


COHESION PROPERTIES OF PMB’s vs80/100 PEN. BITUMEN
0
0.2
0.4
0.6
0.8
1
1.2
1.4
10 20 30 35 40 45 50 60
Co
he
sio
n (
J/cm
2)
Temperature (deg C)
80/100
3% SBR
3% SBS

EFFECT OF CUTTER ON PROPERTIES OF 3% SBS MODIFIED BITUMEN
% Flux Soft. PointDynamic viscosity
@ 165 ˚CPenetration @ 25 ˚C
Minimum road surface
temperature
% v/v ˚C mPa.s 1/10 mm ˚C
0 60 401 65 25
2 54 331 99 23
3 53 292 124 21
4 52 270 145 20
5 51 227 190 18
Viscosity of 80/100 @ 165 ˚C = 100 mPa.sSoftening point 80/100 = 42 to 51 ˚C
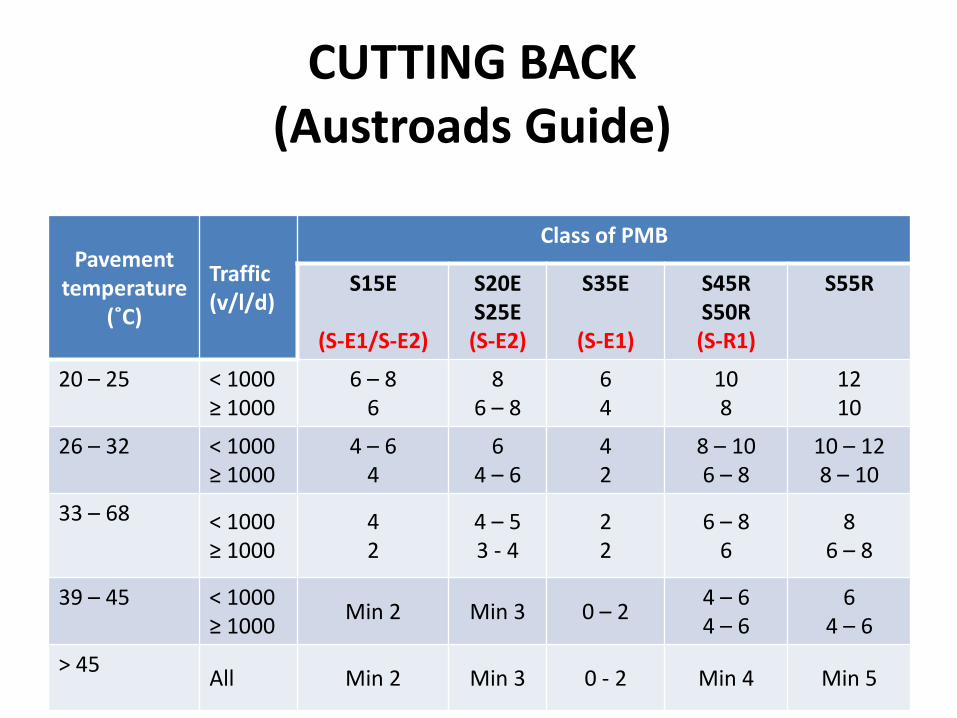
CUTTING BACK(Austroads Guide)
Pavement temperature
(˚C)
Traffic(v/l/d)
Class of PMB
S15E
(S-E1/S-E2)
S20ES25E(S-E2)
S35E
(S-E1)
S45RS50R(S-R1)
S55R
20 – 25 < 1000≥ 1000
6 – 86
86 – 8
64
108
1210
26 – 32 < 1000≥ 1000
4 – 64
64 – 6
42
8 – 106 – 8
10 – 128 – 10
33 – 68 < 1000≥ 1000
42
4 – 53 - 4
22
6 – 86
86 – 8
39 – 45 < 1000≥ 1000
Min 2 Min 3 0 – 24 – 64 – 6
64 – 6
> 45All Min 2 Min 3 0 - 2 Min 4 Min 5
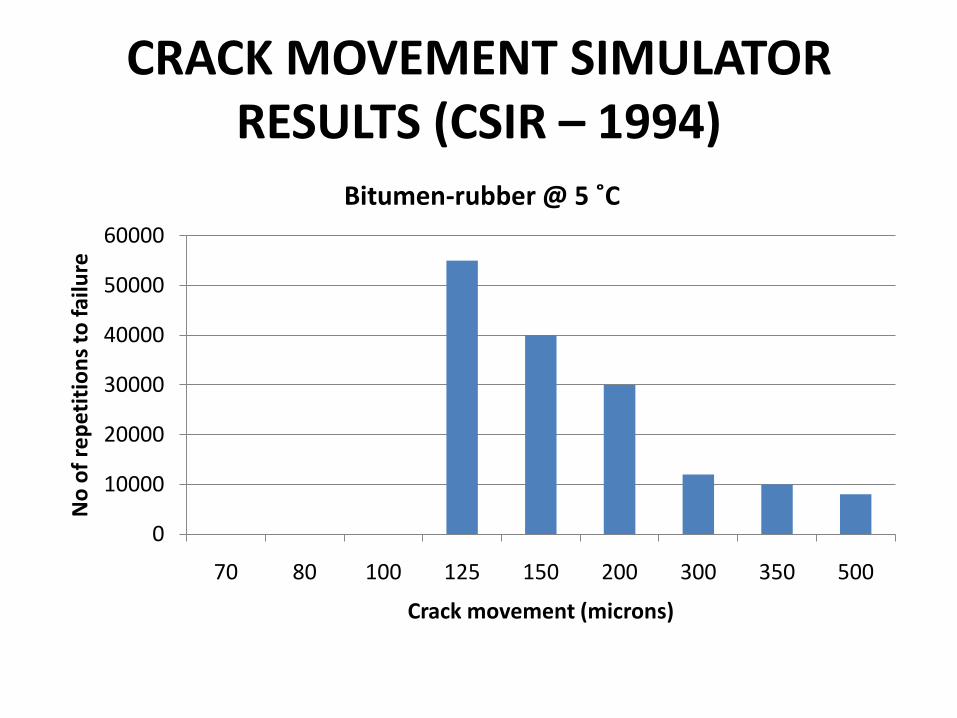
CRACK MOVEMENT SIMULATOR RESULTS (CSIR – 1994)
0
10000
20000
30000
40000
50000
60000
70 80 100 125 150 200 300 350 500
No
of
rep
etit
ion
s to
fai
lure
Crack movement (microns)
Bitumen-rubber @ 5 ˚C
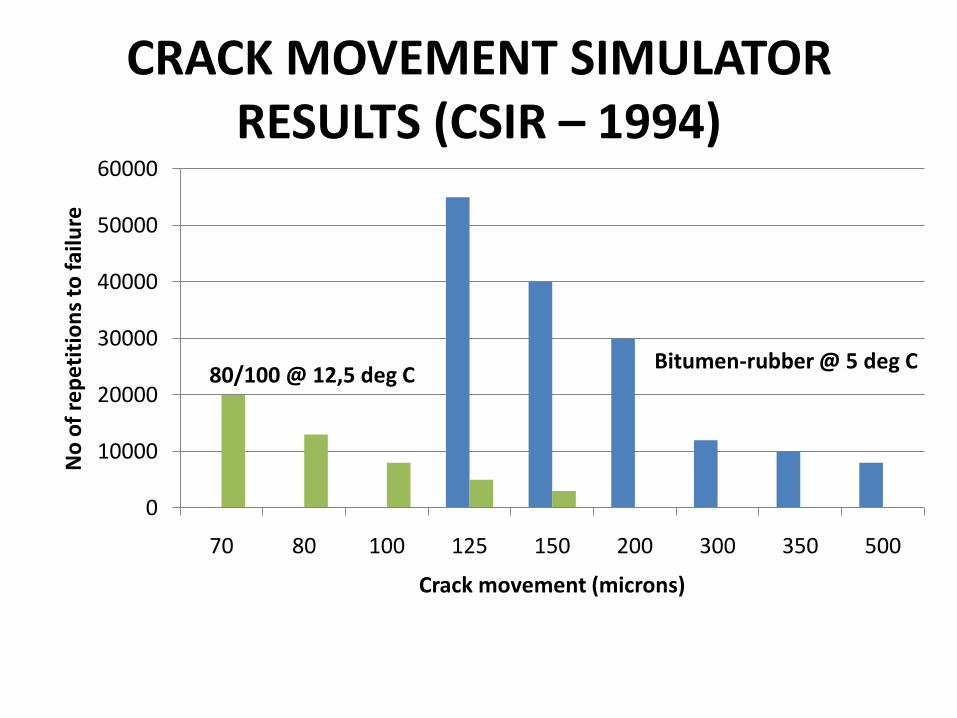
CRACK MOVEMENT SIMULATOR RESULTS (CSIR – 1994)
0
10000
20000
30000
40000
50000
60000
70 80 100 125 150 200 300 350 500
No
of
rep
eti
tio
ns
to f
ailu
re
Crack movement (microns)
Bitumen-rubber @ 5 deg C80/100 @ 12,5 deg C
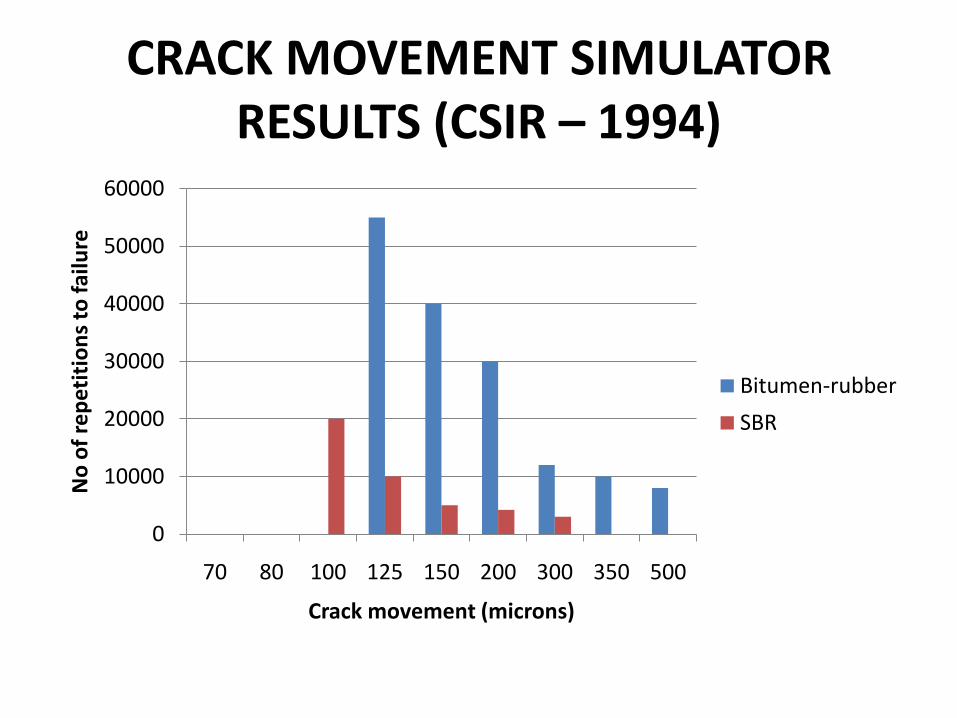
CRACK MOVEMENT SIMULATOR RESULTS (CSIR – 1994)
0
10000
20000
30000
40000
50000
60000
70 80 100 125 150 200 300 350 500
No
of
rep
etit
ion
s to
fai
lure
Crack movement (microns)
Bitumen-rubber
SBR
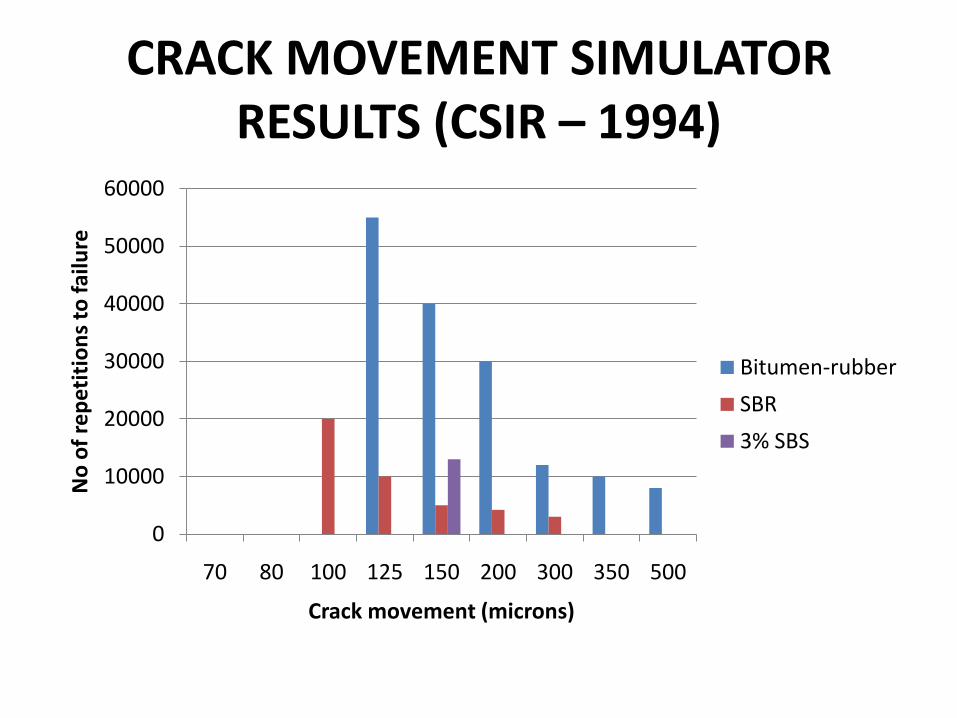
CRACK MOVEMENT SIMULATOR RESULTS (CSIR – 1994)
0
10000
20000
30000
40000
50000
60000
70 80 100 125 150 200 300 350 500
No
of
rep
etit
ion
s to
fai
lure
Crack movement (microns)
Bitumen-rubber
SBR
3% SBS
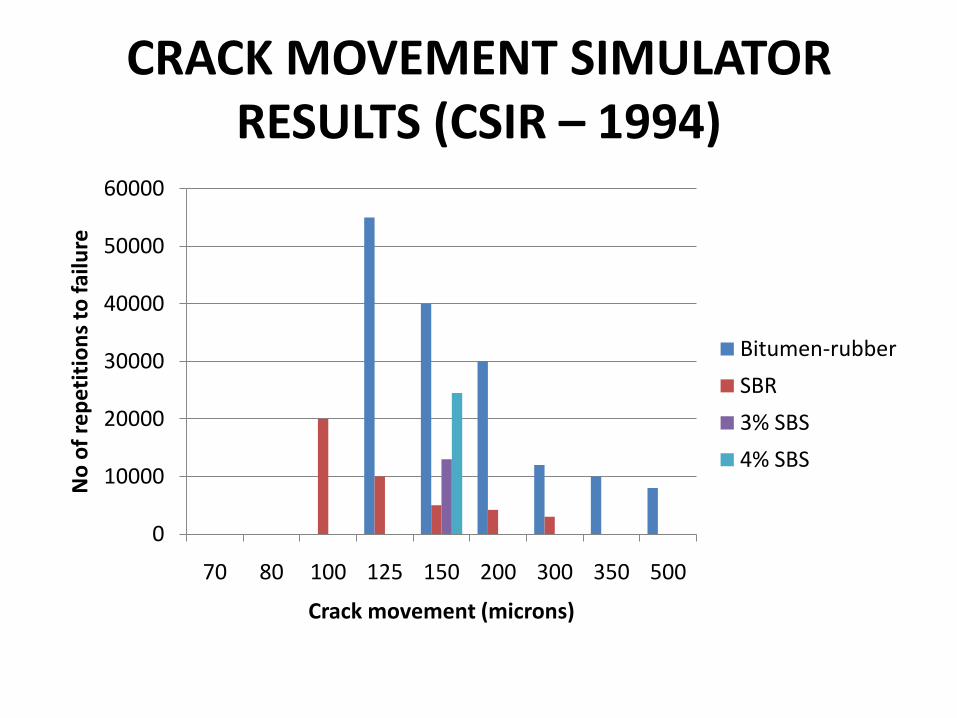
CRACK MOVEMENT SIMULATOR RESULTS (CSIR – 1994)
0
10000
20000
30000
40000
50000
60000
70 80 100 125 150 200 300 350 500
No
of
rep
etit
ion
s to
fai
lure
Crack movement (microns)
Bitumen-rubber
SBR
3% SBS
4% SBS
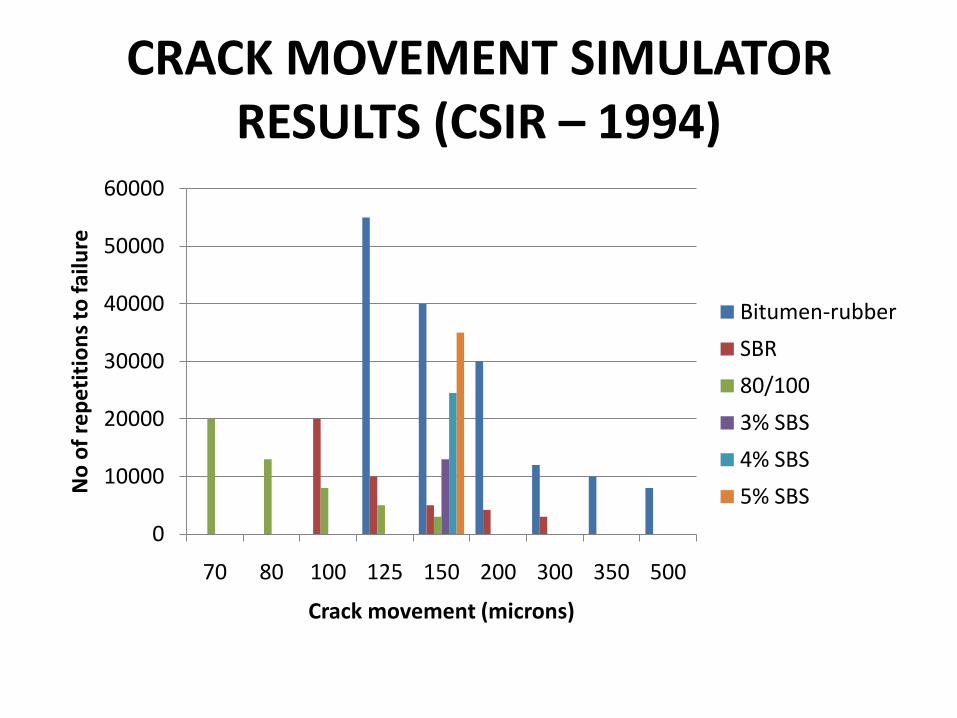
CRACK MOVEMENT SIMULATOR RESULTS (CSIR – 1994)
0
10000
20000
30000
40000
50000
60000
70 80 100 125 150 200 300 350 500
No
of
rep
etit
ion
s to
fai
lure
Crack movement (microns)
Bitumen-rubber
SBR
80/100
3% SBS
4% SBS
5% SBS

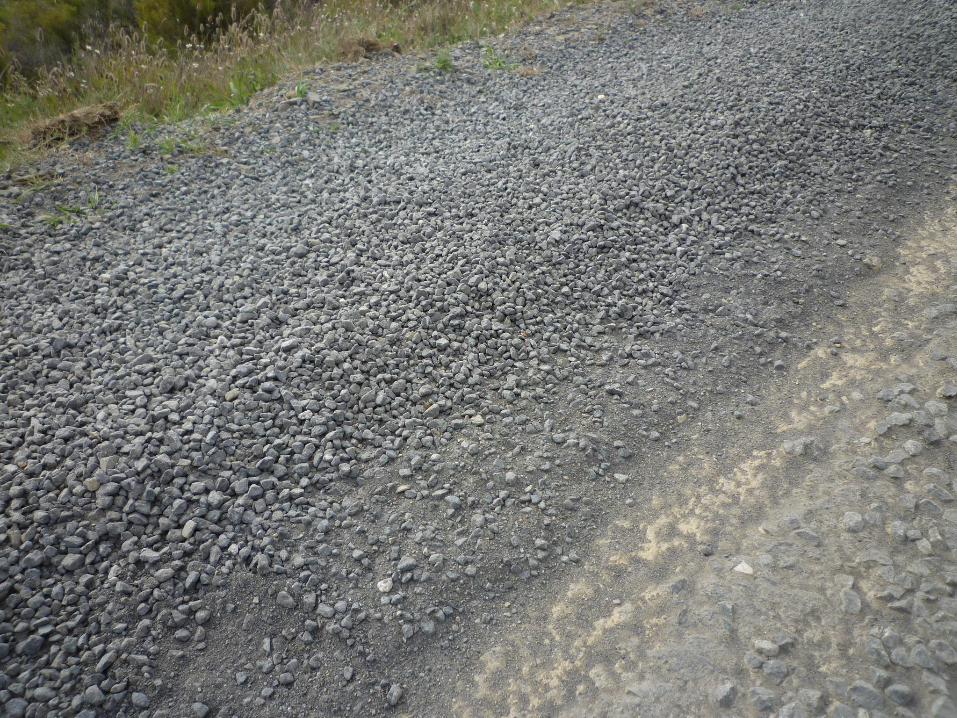
PROBLEMS WITH SEALS

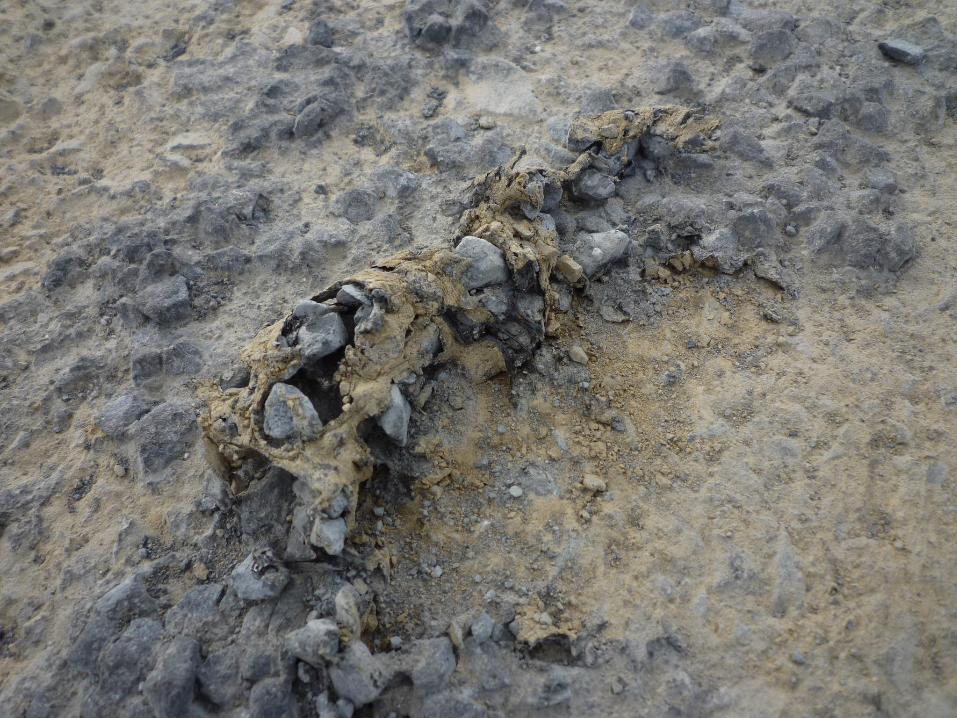
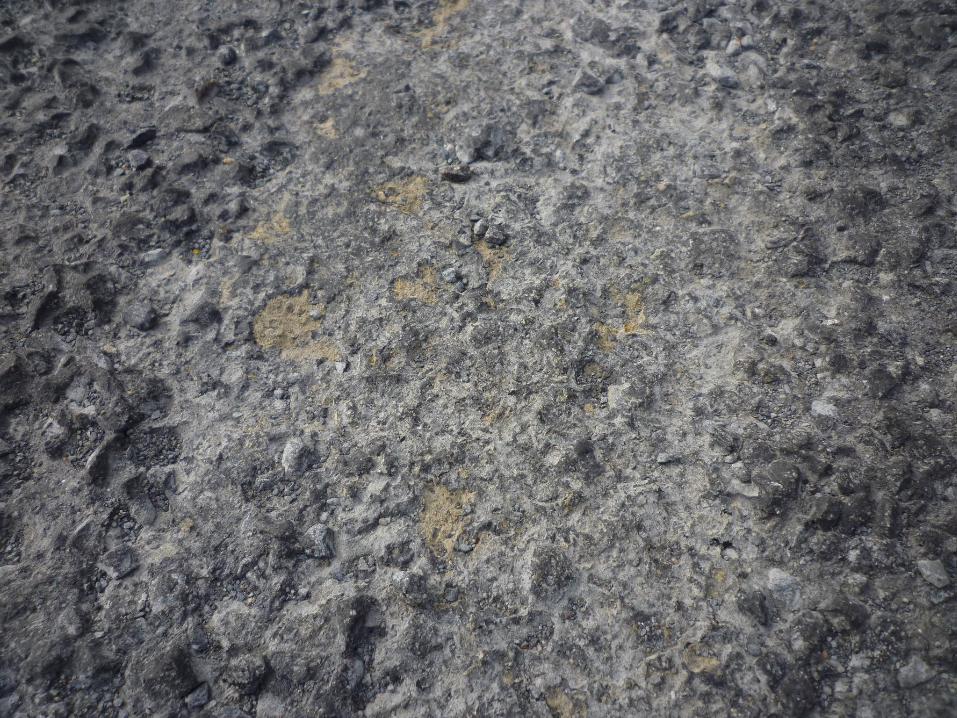

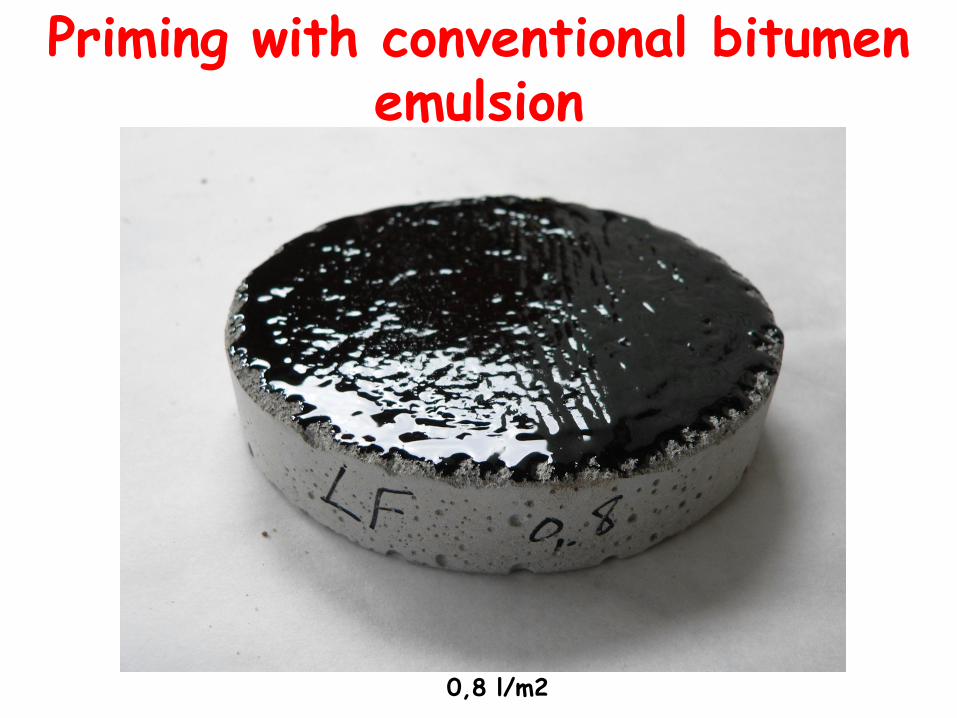
Priming with conventional bitumen emulsion
0,8 l/m2

0,8 l/m2
No penetration

Priming with conventional bitumen emulsion
Before emulsion breaks After emulsion has broken
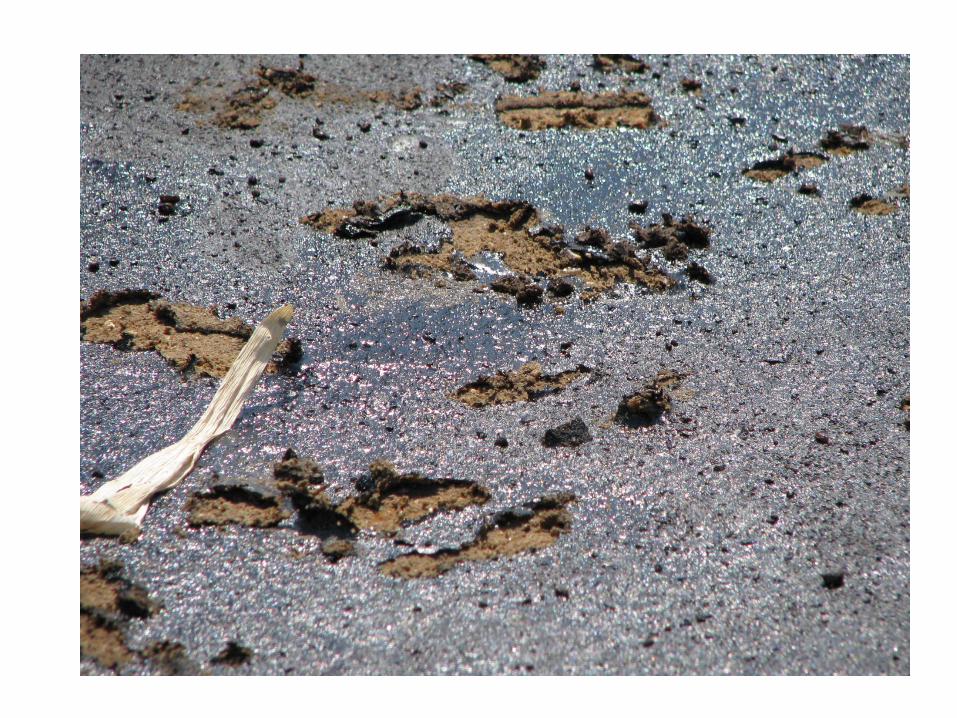

Emulsion Prime (0,8 l/m2)
Emulsion Prime(1,43 l/m2)
MC 30
Inverted Prime MC 10 Cationic Spray 65%

FUTURE INNOVATIONS

FUTURE INNOVATIONS
• Manufacture of cutback bitumen
• Manufacture of SBS emulsions
• Manufacture of emulsions with hard bitumens
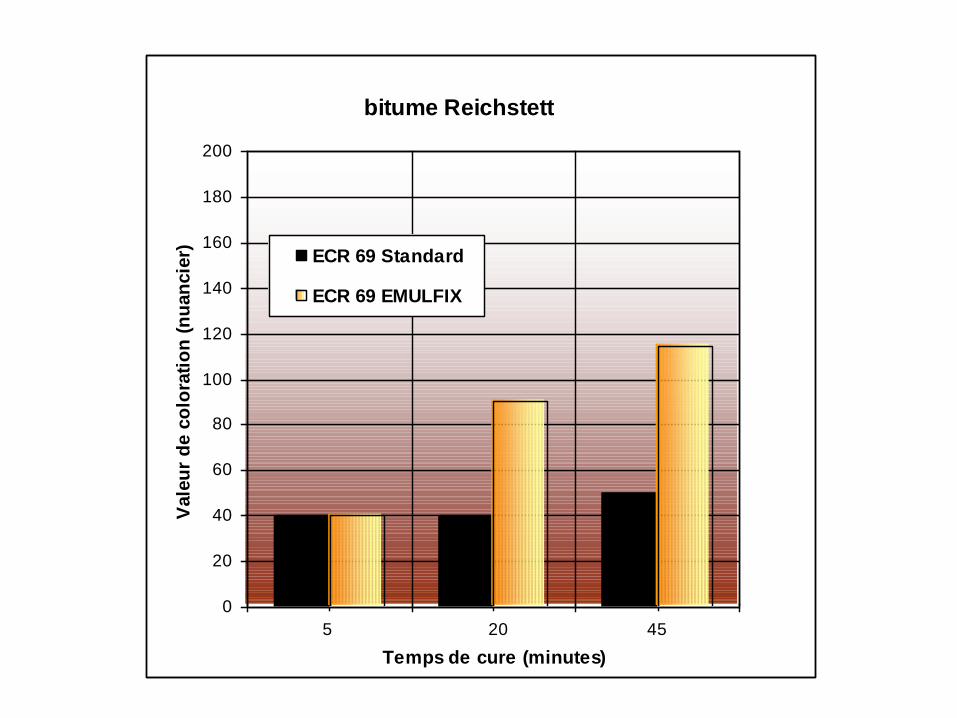
• Emulfix

EMULFIX

40
50
60
70
80
90
100
0 20 40 60 80 100 120 140
Temps de cure (minutes)
% d
e m
até
riau
x r
ete
nu
s
ECR 69 Standard
ECR 69 EMULFIX
Breaking Time - Emulfix
0
20
40
60
80
100
120
140
160
180
200
Temps de cure (minutes)
Vale
ur
de c
olo
rati
on
(n
uan
cie
r) ECR 69 Standard
ECR 69 EMULFIX
bitume Reichstett
5 20 45