Sanlam Collective Investments (RF) (Pty) Ltd Annual … Media Centre... · Tresor SCI Stable Fund:...
310
Sanlam Collective Investments (RF) (Pty) Ltd Annual Report I 2015
Transcript of Sanlam Collective Investments (RF) (Pty) Ltd Annual … Media Centre... · Tresor SCI Stable Fund:...

1
Sanlam Collective Investments (RF) (Pty) Ltd
Annual Report I 2015

Sanlam Collective Investment Scheme
AUDITED ANNUAL FINANCIAL STATEMENTS
31 DECEMBER 2015

CONTENTS Page
REPORT OF THE TRUSTEE FOR THE SANLAM COLLECTIVE INVESTMENT SCHEME 3STATEMENT OF DIRECTORS' RESPONSIBILITY 5CEO'S REPORT 6INDEPENDENT AUDITORS' REPORT 10NOTES TO THE ANNUAL FINANCIAL STATEMENTS OF THE SANLAM COLLECTIVE INVESTMENT FUNDS 11FINANCIAL STATEMENTS AND NOTES
Brackenham SCI Managed Fund 32First Avenue SCI Equity Fund 34Graviton SCI Balanced Fund 36Graviton SCI Capital Growth Fund 38Graviton SCI Flexible Income Fund 40Graviton SCI Low Equity Fund 42Lynx SCI Balanced Fund of Funds 44Lynx SCI Cautious Fund of Funds 46Lynx SCI Global Diversified Fund of Funds 48Lynx SCI Opportunities Fund of Funds 50Megafin SCI Balanced Fund of Funds 52Megafin SCI Growth Fund of Funds 54Megafin SCI Stable Fund of Funds 56Obsidian SCI Balanced Fund 58Obsidian SCI Equity Fund 60Sanlam African Frontier Markets Feeder Fund 62Sanlam Alternative Income Fund 64Sanlam Asia Pacific Fund of Funds 66Sanlam Diversified Income Fund of funds 68Sanlam Global Balanced Fund of Funds 70Sanlam Global Cautious Fund of Funds 72Sanlam Global Equity Fund 74Sanlam Global Index Fund of Funds 76Sanlam Growth Institutional Fund 78Sanlam India Opportunities Feeder Fund 80Sanlam Institutional Special Opportunities Fund 82Sanlam Market Allocator Fund 84Sanlam Multi Managed Absolute Solution 5 Fund of Funds 86Sanlam Multi Managed Aggressive Fund of Funds 88Sanlam Multi Managed Balanced Fund of Funds 90Sanlam Multi Managed Cautious Fund of Funds 92Sanlam Multi Managed Conservative Fund of Funds 94Sanlam Multi Managed Defensive Fund Of Funds 96Sanlam Multi Managed Equity Fund 98Sanlam Multi Managed Equity Fund of Funds 100Sanlam Multi Managed Equity Index Fund 102Sanlam Multi Managed Flexible Equity Fund 104Sanlam Multi Managed Inflation Linked Bond Fund 106Sanlam Multi Managed Institutional Aggressive Equity Fund One 108Sanlam Multi Managed Institutional General Equity Fund Two 110Sanlam Multi Managed Long Term Growth Solution 7 Fund Of Funds 112Sanlam Multi Managed Institutional Positive Return Fund Four 114Sanlam Multi Managed Institutional Positive Return Fund Three 116Sanlam Multi Managed Institutional Positive Return Fund Two 118Sanlam Multi Managed Institutional Prudential Balanced Fund One 120Sanlam Multi Managed Institutional Prudential Income Provider Fund Two 122Sanlam Multi Managed Institutional Yield Plus Fund Two 124Sanlam Multi Managed Moderate Aggressive Fund of Funds 126Sanlam Multi Managed Moderate Fund of Funds 128Sanlam Multi Managed Property Fund 130Sanlam Multi Managed Protection Solution 3 Fund of Funds 132Sanlam Optimised Income Fund 134Sanlam Pan-Europe Fund 136Sanlam Select Absolute Fund 138Sanlam Select Bond Plus Fund 140Sanlam Select Defensive Balanced Fund 142Sanlam Select Flexible Equity Fund 144Sanlam Select Managed Fund 146Sanlam Select Optimised Equity Fund 148Sanlam Select Strategic Income Fund 150
1

CONTENTS (continued) Page
Sanlam Select Thematic Equity Fund 152Sanlam Stable Growth Fund 154Sanlam Value Institutional Fund 156Sesfikile SCI Property Fund 158SIM Absolute Return Income Fund 160SIM Active Income Fund 162SIM Balanced Fund 164SIM Bond Plus Fund 166SIM Enhanced Yield Fund 168SIM Financial Fund 170SIM General Equity Fund 172SIM Global Best Ideas Feeder Fund 174SIM Global Equity Income Feeder Fund 176SIM Global Financial Feeder Fund 178SIM Index Fund 180SIM Industrial Fund 182SIM Inflation Plus Fund 184SIM Low Equity Fund 186SIM Managed Aggressive Fund of Funds 188SIM Managed Cautious Fund of Funds 190SIM Managed Conservative Fund of Funds 192SIM Managed Moderate Aggressive Fund of Funds 194SIM Managed Moderate Fund of Funds 196SIM Money Market Fund 198SIM Property Fund 200SIM Resources Fund 202SIM Small Cap Fund 204SIM Top Choice Equity Fund 206SIM Value Fund 208SMMI Bond Fund 210SPI Equity Fund 212Tresor SCI Balanced Fund 214Tresor SCI Flexible Fund 216Tresor SCI Income Fund 218Tresor SCI Stable Fund 220
STATUTORY INFORMATION
2

3
Corporate and Investment Banking 20th Floor Main Tower Standardbank Centre Heerengracht Cape Town 8001 PO Box 54 Cape Town 8000 South Africa www.standardbank.co.za Tel. Switchboard: +27 (0)21 401-2002 Direct: +27 (0)21 441-4100 Fax: +27 (0)21 401-3887 email: [email protected] The Standard Bank of South Africa Limited (Reg.No. 1962/000738/06) Authorised financial services provider and registered credit provider (NCRCP15) Directors: TS Gcabashe (Chairman) SK Tshabalala* (Chief Executive) RMW Dunne# BJ Kruger* Adv. KD Moroka Dr. ML Oduor-Otieno## AC Parker ANA Peterside CON### SP Ridley* MJD Ruck PD Sullivan#### BS Tshabalala EM Woods Company Secretary: Z Stephen 01/01/2016 *Executive Director #British ##Kenyan ###Nigerian ####Australian
The Manager Sanlam Collective Investments (RF) Proprietary Limited 55 Willie Van Schoor Avenue Bellville 7530 REPORT OF THE TRUSTEE FOR THE SANLAM COLLECTIVE INVESTMENT SCHEME We, the Standard Bank of South Africa Limited, in our capacity as Trustee of the Sanlam Collective Investments Scheme (“the Scheme”) have prepared a report in terms of Section 70(1)(f) of the Collective Investment Schemes Control Act, 45 of 2002, as amended (“the Act”), for the financial year ended 31 December 2015. In support of our report we have adopted certain processes and procedures that allow us to form a reasonable conclusion on whether the Manager has administered the Scheme in accordance with the Act and the Scheme Deed. As Trustees of the Scheme we are also obliged to in terms of Section 70(3) of the Act to satisfy ourselves that every statement of comprehensive income, statement of financial position or other return prepared by the Manager of the Scheme as required by Section 90 of the Act fairly represents the assets and liabilities, as well as the income and distribution of income, of every portfolio of the Scheme. The Manager is responsible for maintaining the accounting records and preparing the annual financial statements of the Scheme in conformity with International Financial Reporting Standards. This responsibility also includes appointing an external auditor to the Scheme to ensure that the financial statements are properly drawn up so as to fairly represent the financial position of every portfolio of its collective investment scheme are in accordance with International Financial Reporting Standards and in the manner required by the Act. Our enquiry into the administration of the Scheme by the Manager does not cover a review of the annual financial statements and hence we do not provide an opinion thereon. Based on our records, internal processes and procedures we report that nothing has come to our attention that causes us to believe that the accompanying financial statements do not fairly represent the assets and liabilities, as well as the income and distribution of income, of every portfolio of the Scheme administered by the Manager. We confirm that according to the records available to us, no losses were suffered in the portfolios and no investor was prejudiced as a result thereof.
Corporate and Investment Banking

4
We conclude our report by stating that we reasonably believe that the Manager has administered the Scheme in accordance with:
(i) the limitations imposed on the investment and borrowing powers of the manager by this Act;
(ii) and the provisions of this Act and the deed;
Melinda Mostert Seggie Moodley Head: Trustee Services Head: Risk and Legal (Trustee Services) Standard Bank of South Africa Limited Standard Bank of South Africa Limited 22 March 2016
Corporate and Investment Banking 20th Floor Main Tower Standardbank Centre Heerengracht Cape Town 8001 PO Box 54 Cape Town 8000 South Africa www.standardbank.co.za Tel. Switchboard: +27 (0)21 401-2002 Direct: +27 (0)21 441-4100 Fax: +27 (0)21 401-3887 email: [email protected] The Standard Bank of South Africa Limited (Reg.No. 1962/000738/06) Authorised financial services provider and registered credit provider (NCRCP15) Directors: TS Gcabashe (Chairman) SK Tshabalala* (Chief Executive) RMW Dunne# BJ Kruger* Adv. KD Moroka Dr. ML Oduor-Otieno## AC Parker ANA Peterside CON### SP Ridley* MJD Ruck PD Sullivan#### BS Tshabalala EM Woods Company Secretary: Z Stephen 01/01/2016 *Executive Director #British ##Kenyan ###Nigerian ####Australian
Corporate and Investment Banking 20th Floor Main Tower Standardbank Centre Heerengracht Cape Town 8001 PO Box 54 Cape Town 8000 South Africa www.standardbank.co.za Tel. Switchboard: +27 (0)21 401-2002 Direct: +27 (0)21 441-4100 Fax: +27 (0)21 401-3887 email: [email protected] The Standard Bank of South Africa Limited (Reg.No. 1962/000738/06) Authorised financial services provider and registered credit provider (NCRCP15) Directors: TS Gcabashe (Chairman) SK Tshabalala* (Chief Executive) RMW Dunne# BJ Kruger* Adv. KD Moroka Dr. ML Oduor-Otieno## AC Parker ANA Peterside CON### SP Ridley* MJD Ruck PD Sullivan#### BS Tshabalala EM Woods Company Secretary: Z Stephen 01/01/2016 *Executive Director #British ##Kenyan ###Nigerian ####Australian
The Manager Sanlam Collective Investments (RF) Proprietary Limited 55 Willie Van Schoor Avenue Bellville 7530 REPORT OF THE TRUSTEE FOR THE SANLAM COLLECTIVE INVESTMENT SCHEME We, the Standard Bank of South Africa Limited, in our capacity as Trustee of the Sanlam Collective Investments Scheme (“the Scheme”) have prepared a report in terms of Section 70(1)(f) of the Collective Investment Schemes Control Act, 45 of 2002, as amended (“the Act”), for the financial year ended 31 December 2015. In support of our report we have adopted certain processes and procedures that allow us to form a reasonable conclusion on whether the Manager has administered the Scheme in accordance with the Act and the Scheme Deed. As Trustees of the Scheme we are also obliged to in terms of Section 70(3) of the Act to satisfy ourselves that every statement of comprehensive income, statement of financial position or other return prepared by the Manager of the Scheme as required by Section 90 of the Act fairly represents the assets and liabilities, as well as the income and distribution of income, of every portfolio of the Scheme. The Manager is responsible for maintaining the accounting records and preparing the annual financial statements of the Scheme in conformity with International Financial Reporting Standards. This responsibility also includes appointing an external auditor to the Scheme to ensure that the financial statements are properly drawn up so as to fairly represent the financial position of every portfolio of its collective investment scheme are in accordance with International Financial Reporting Standards and in the manner required by the Act. Our enquiry into the administration of the Scheme by the Manager does not cover a review of the annual financial statements and hence we do not provide an opinion thereon. Based on our records, internal processes and procedures we report that nothing has come to our attention that causes us to believe that the accompanying financial statements do not fairly represent the assets and liabilities, as well as the income and distribution of income, of every portfolio of the Scheme administered by the Manager. We confirm that according to the records available to us, no losses were suffered in the portfolios and no investor was prejudiced as a result thereof.
Corporate and Investment Banking

STATEMENT OF DIRECTORS' RESPONSIBILITY
FOR THE YEAR ENDED 31 DECEMBER 2015
The board of the management company takes responsibility for the integrity, objectivity and reliabilityof the annual financial statements in accordance with International Financial Reporting Standardsand the Companies Act of South Africa. Adequate accounting records have been maintained. Theboard endorses the principle of transparency in financial reporting. The responsibility for thepreparation and presentation of the annual financial statements has been delegated to management.
The responsibility of the external auditors is to express an independent opinion on the fairpresentation of the annual financial statements based on their audit of the schemes. The Audit,Actuarial and Finance Committee of Sanlam Ltd has satisfied itself that the external auditors wereindependent of the company during the period under review.
The board has confirmed that effective systems of internal control and risk management are beingmaintained. There were no breakdowns in the functioning of the internal financial control systemsduring the year. The board is satisfied that the annual financial statements fairly present the financialposition, the results of operations and cash flows in accordance with International FinancialReporting Standards and the Companies Act of South Africa and supported by reasonable andprudent judgements consistently applied.
The board is of the opinion that the Collective Investment Schemes are financially sound andoperate as going concerns. The annual financial statements have accordingly been prepared on thisbasis.
The audited annual financial statements on pages 11 to 307 were approved by the board of directorsand are signed on its behalf:
5

6
Dear investor
I am pleased to share some of Sanlam Collective Investments’ 2015 highlights with you.
We remain focused on offering our clients an extensive range of funds designed to help them and their advisers construct portfolios that suit their needs and help them meet their long-term investment goals.
Fund performance highlightsA snapshot of some our top-performing funds for 2015 includes:
ceo’sreport
A brief overview of 20152015 proved to be an especially hard year for emerging markets. South Africa was no exception, with local economic headwinds adding to an already unfriendly global environment.
Like several other commodity-exporting emerging market countries, South Africa and its currency have been hit by continued commodity price weakness. The US Federal Reserve raised its interest rate for the first time since 2006 and this, together with China’s slowdown, further contributed to the weakening of the rand.
Despite some encouraging signs of economic resilience in the US and Europe, concerns regarding the slowdown in China continued to impact world economic growth. As the world’s largest consumer of natural resources, the slowdown in China is expected to have a more pronounced impact on resource-dependent emerging economies. Stalling economic growth has resulted in a slowdown in foreign flows into emerging economies, worsening an already difficult situation.
In light of the uncertain environment, global growth expectations have been revised downward, adding to disinflationary pressures in developed markets.
Locally, a persistent drought and rand weakness are among the inflationary pressures contributing to a rising interest rate cycle. President Zuma’s unexpected sacking of Finance Minister Nene in December and the resulting loss of investor confidence had far-reaching consequences for the bond market, the equity market and the rand.
With the South African sovereign rating only one notch above non-investment grade and bond yields appearing to be pricing in a further downgrade, rand volatility is expected to continue for some time.
*SIM Global Equity Income FF A141.49%
Sanlam Global Balanced FoF32.05%
Sanlam Global Cautious FoF31.41%
Sanlam India Opportunities FF A31.21%
Sanlam Asia Pacific FoF A28.25%
Source: Morningstar | 1-year annualised return to 31 December 2015 | Past performance is not an indication of future performance. The return is calculated on a NAV-NAV basis, with income reinvested on a lump sum invested at the start of the measurement period. *SIM is the abbreviation for Sanlam Investment Management.

Asset class returnsAfter four exceptional years in which all asset classes delivered positive returns for SA investors, 2015 brought the first underdog in a while: SA bonds, which tumbled by 3.93% over the calendar year. The top-performing asset class for 2015 was Foreign Equity (32.7%), with Foreign Bonds trailing only slightly behind at 30.4%. The superior return of foreign asset classes was largely fuelled by the rand’s depreciation over this period, with the rand depreciating by 25.31% against the US dollar and 16.81% against the euro. In dollar terms, Foreign Equity ended the year slightly down at 0.87% for the year.
2015 Asset Class Returns
Index 12 Months (R)
12 Months (US$)
MSCI Global Equities 32.78% -0.87%
MSCI Emerging Market Equities
13.96% -14.92%
JPM Global Bonds 30.45% -2.61%
JPM Emerging Market Bonds
35.59% 1.23%
Barclays Global Inflation-Linked Bonds
27.28% -4.97%
BarCap Global Corporate Bond Index
29.17% -3.56%
SA JSE All Share Index 5.13% -21.51%
SA Beassa All Bond Index
-3.93% -28.28%
SA Barclay’s Inflation-Linked Bond Index
3.68% -22.59%
SBK SA Corporate Credit Index
-12.15% -34.41%
STeFI Composite Index 6.46% -20.52%
Total returns for South African asset classes for 2015 were as follows:
Listed property 7.99%
Equities 5.13%
Bonds -3.93%
Cash 6.46%
Source: Morningstar and I-Net | 1-year return to 31 December 2015 | Past performance is not an indication of future performance.
Not surprisingly then, portfolios that included a substantial offshore component fared best, again underlining the need for a carefully diversified portfolio.
7

8
What lies ahead in 2016?2016 is expected to be a riskier year for investors, and a greater degree of portfolio diversification will be key. The year certainly got off to a volatile start, with the Dow Jones Industrial Average having its weakest calendar-year start since 1897, falling by more than 5% in its first four days of trading.
The investment outlook is likely to be dominated by the pace of US interest rate hikes, yuan devaluation, the economic and political costs of integrating immigrants into the Eurozone economy, and the prospects of a recovery in oil and commodity prices.
The possibility of further dollar appreciation cannot be ruled out, and will partly depend on the extent of the European Central Bank and Bank of Japan’s actions in terms of further quantitative easing. With the Eurozone running large current account surpluses along with expected capital inflows, the balance of payments will be supportive of the euro.
The risk to the Eurozone from the surge in immigration will be both political and economic as anti-Eurozone and anti-immigrant political parties gain in upcoming elections. A political shift to the left or the right could be the catalyst for a break-up of the Eurozone, while a British vote to exit the Eurozone could accelerate the timing of a break-up in the event of a “yes” vote.
The further devaluation of the yuan poses a material headwind for emerging market currencies as competitive currency devaluations intensify among China’s trading partners, further fuelling capital flight.
South Africa’s macroeconomic fundamentals and fiscal policy will be in the spotlight in 2016 as the potential downgrade to sub-investment status looms. Economic growth is unlikely to exceed 2% in 2016 (it may possibly not even exceed 1.5%), and interest rates are likely to rise by 100-200 basis points as inflation pressures build.
In addition, South Africa’s debt-to-GDP ratio will be watched closely as it approaches 50% by 2018. While the slump in the oil price has dampened the inflationary effects of the collapse of the rand, the severity of the drought may put upward pressure on food prices. Inflation could rise to around 6% in 2016, compared to the approximate 2015 figure of 4.5%. This does not bode well for South Africa’s already muted economic growth prospects.

9
Regulatory changesDuring 2015 we saw some important changes in the regulatory environment.
Hedge funds are now regulated under the Collective Investment Schemes Control Act (CISCA) and Sanlam Collective Investments is looking forward to offering investors access to a selection of hedge funds later this year.
Board Notice 92 of 2014 came into effect during the latter part of the year, aiming to further enhance investor protection and the standardisation of disclosure requirements. As part of this process, fund fact sheets were replaced by Minimum Disclosure Documents, which are regulated by the Financial Services Board. These are available on our website at www.sanlamunittrusts.co.za.
Developments at Sanlam Collective InvestmentsSanlam Collective Investments made the transition to its new administrator, Silica, on 23 October 2015. As a result, we are now able to offer clients access to an improved online portfolio viewing and transactional capabilities, and faster turn-around times on payouts. The transfer also saw the introduction of new business rules and processes aimed at standardising the investor experience. We are actively working to improve the current experience and have earmarked a number of focus areas to ensure continued improvements in 2016 and beyond. In line with our philosophy of ensuring we offer our investors a relevant fund range, we made changes to a number of funds during the year:
The Sanlam Investment Management Index Fund merged with the Sanlam Investment Management General Equity Fund.
The Sanlam Global Index Fund of Funds merged with the Sanlam Global Balanced Fund of Funds.
In line with changes to the business unit’s name, the Sanlam Private Equity Fund was renamed the Sanlam Private Wealth Equity Fund.
The Sanlam African Frontier Markets Feeder Fund was closed on 28 August 2015.
The Sanlam Investment Management Property Fund was capped to retail investors in December 2015.
In addition, we introduced a tax-free savings product that offers South African investors the opportunity to save without incurring taxes on the growth in their investment portfolio, in line with the legislated limits.
We will persist in our endeavours to further enhance your client experience and hope your investment outcome will meet your expectations in 2016. Thank you for your continued support.
Yours sincerely
Liezl MyburghChief Executive Officer


SANLAM COLLECTIVE INVESTMENT SCHEME (for the year ended 31 December 2015)
11
SANLAM COLLECTIVE INVESTMENT FUNDS
Notes to the Annual Financial Statements at 31 December 2015
1. ACCOUNTING POLICIES
1.1 Significant accounting policies
The Collective Investment Funds (“Funds”) are open-ended investment funds created in terms of the Collective Investment Schemes Control Act No. 45 of 2002 (“Act”). The Funds operate as individual entities in South Africa.
1.2 Basis of preparation
The annual financial statements are prepared in accordance with the going concern principal (for Funds that are still in existence) on the historical cost basis, except for investments that are reflected at either fair value or amortized cost as detailed below, and are in accordance with International Financial Reporting Standards (IFRS) and the SAICA Financial Reporting Guides as issued by the Financial Reporting Standards Council in South Africa.
1.3 Accounting standards adopted
The Collective Investment Funds adopted all new and revised Standards and Interpretations issued by the International Accounting Standards Board (the IASB) and the International Financial Reporting Interpretations Committee (IFRIC) of the IASB that are relevant to its operations and effective for accounting periods ended 31 December 2015. These standards and interpretations had no impact on the financial statements for the financial year ended 31 December 2015. Except for otherwise stated, the accounting policies are therefore consistent with those applied in the prior year. All accounting policies also comply with the Trust Deeds (where applicable). Standards, interpretations and amendments to published standards that are effective
There are no new or revised IFRS statements and interpretations that have effective dates applicable to the Funds’ 2015 financial year.
Standards, interpretations and amendments to published standards that are not yet effective
Certain new standards, interpretations and amendments to existing standards have been published that are mandatory for the Funds’ future accounting periods, but which the Funds’ have not early adopted, as detailed below. Effective dates refer to financial years starting on or after the specified date.
IFRS 9 - Financial Instruments (effective date is 1 January 2018)
IFRS 15 – Revenue from Contracts with Customers (effective date is 1 January 2018)
The application of the revised IFRS 9 may have an impact on the classification of financial instruments at initial recognition, which will impact the subsequent measurement and accounting of gains and losses. The application of IFRS 15 in future financial reporting periods is not expected to have an impact on the Funds’ reported results, financial position and cash flows.
1.4 Use of estimates, assumptions and judgments
The preparation of the annual financial statements necessitates the use of judgments, estimates and assumptions that affect the application of policies and the reported amounts of assets, liabilities and contingent liabilities at the statement of financial position date, as well as affecting the reported income and expenses for the year. The estimates and associated assumptions are based on historical experience and various other factors that are believed to be reasonable under the circumstances. Actual results may differ from these estimates.
Major items subject to the application of judgments include:
The classification of financial instruments and valuation methods adopted are disclosed in notes 1.10 and 4.
The functional currency which is denoted in South African Rand. Judgment was applied in determining the functional currency of a Fund that holds investments that are denominated in foreign currencies. This judgment was reached because all funds are raised and distributed in South African Rand and performance evaluated in South African Rand.
There are no significant assumptions or sources of estimation certainty included in the financial statements for the current or comparative year.
1.5 Foreign currency translation
The financial statements are presented in South African Rand which is the Portfolios’ functional and presentation currency. Foreign currency purchase and sale transactions are recorded at the closing exchange rate ruling at the date of the transaction. Dividend income is translated at the rate ruling on the last day to register and interest income at the weighted average exchange rate for the period. Monetary items, such as foreign accrued income and debtors and creditors denominated in foreign currencies are translated at the closing exchange rates ruling at the financial year-end and realised and unrealised differences on translation are recognised in profit or loss in the statement of comprehensive income in the period in which they arise.

SANLAM COLLECTIVE INVESTMENT SCHEME (for the year ended 31 December 2015)
12
1.5 Foreign currency translation (continued)
Non-monetary items measured at fair value in a foreign currency are translated using the exchange rates at the date when the fair value is determined. Unrealised translation differences on non-monetary items, such as investments classified as at fair value through profit or loss are included with the fair value movement in profit or loss in the statement of comprehensive income.
1.6 Revenue recognition
Revenue is recognised to the extent that it is probable that the economic benefits will flow to the Fund and that the amount can be reliably measured. The following specific recognition criteria must also be met before revenue is recognised:
Dividend income
Dividend income comprises dividends received from and accrued on investments, including scrip dividends where there is a cash option, for which the last date to register falls within the accounting period. Foreign dividend income is accrued gross of withholding taxes, where applicable. Interest income
Interest income is recognised in profit or loss as it accrues, using the effective interest method. Interest income is recognised on a gross basis. Premiums or discounts arising on acquisition of fixed interest securities are included in the effective interest rate. Gains on cash and cash equivalents arise through the amortisation process and when items are derecognised. Distribution income
Funds recognise income distributions on the accrual basis. Distribution income is recognised as either interest revenue, dividend revenue or both based on the nature of the underlying instrument.
1.7 Net income adjustment on creation and
cancellation of units
An adjustment to income arises on the creation and cancellation of units since the price of a unit includes accrued income and expenses.
The income adjustment on creation or cancellation of units is recognised when units on which it arises are either purchased or sold.
1.8 Expenses
The nature of operating and administration expenses carried by the Funds is determined by regulation and is accrued for on a daily basis. The following applies in respect of the significant items of expenditure:
Performance fees
Performance fees are calculated and accrued for on a daily basis with reference to the Funds’ out - performance of the relevant benchmark (and high water mark, where applicable). The payment to the management company is made monthly based on a rolling calculation. Management charges
The Funds pay the management company a monthly management charge based on the daily market value of the Fund at an agreed annual rate which is payable in arrears.
1.9 Distributions paid
Distributions paid represent net income paid to unit holders at each distribution date, which is determined in accordance with each Fund’s Supplemental Trust Deed. Distributable profits are determined by deducting operating expenses incurred from the income earned by the Fund since the last distribution. Any undistributed income is intended to be distributed at the next distribution date.
In cases where distributions are reinvested, the Fund recognises the reinvested portion as an increase in net assets attributable to unit holders.
1.10 Financial instruments
Recognition Financial instruments are recognised when the Fund becomes a party to a contractual arrangement that constitutes a financial asset or financial liability for the Fund that is not subject to suspensive conditions. Purchase or sales of financial assets are recognised on the trade date, i.e. the date that the Fund commits to purchase or sell the asset. Measurement
The classification of financial instruments is determined at initial recognition based on the purpose for which the financial assets are acquired or liabilities assumed. Financial instruments at fair value through profit or loss are initially recognised at fair value. Costs directly attributable to the acquisition of financial assets classified as at fair value through profit or loss are recognised in the statement of comprehensive income as transaction costs.
Other financial instruments are recognised at the fair value of the consideration given or received in exchange for the instrument plus transaction costs that are directly attributable to their acquisition. Subsequent to initial recognition, these instruments are measured as set out below. Investments The Funds invest in equities, bonds, derivatives and other collective investment schemes, which are publically tradable in the open market, as well

SANLAM COLLECTIVE INVESTMENT SCHEME (for the year ended 31 December 2015)
13
1.10 Financial Instruments (continued)
as money market instruments. These are generally settled in cash within seven days. These assets, except for those instruments held by Sanlam Alternative Income Fund, Sanlam Diversified Income Fund of Funds and SIM Money Market Fund are designated as financial instruments at fair value through profit or loss, as they are managed and their performance is evaluated on a fair value basis. Information on these assets is presented to the asset managers of the Funds on a fair value basis. The investments held by Sanlam Alternative Income Fund, Sanlam Diversified Income Fund of Funds and SIM Money Market Fund are classified as loans and receivables. Fair value is the price that would be received to sell an asset or paid to transfer a liability in an orderly transaction between market participants at the measurement date. The following bases are used to determine fair value, for those instruments that are classified at fair value through profit or loss:
The fair value of publicly traded equities, derivatives and bonds and investments in other collective investment schemes is determined by reference to the quoted open market price per unit prevailing at the reporting date, in an organised financial market.
Gilts, longer-term Negotiable Certificates of Deposit, Promissory Notes and Treasury Bills (money market instruments) are valued by discounting the expected future cash flows using current interest rates.
Financial futures and option contracts are valued daily at fair value at listed SAFEX closing prices.
Any fair value gain or loss is recognised directly in profit or loss. Gains or losses on derecognition are also included in profit or loss. Money market instruments held by Sanlam Alternative Income Fund, Sanlam Diversified Income Fund of Funds and SIM Money Market Fund are classified as loans and receivables and are subsequently measured at amortised cost using the effective interest method. Gains and losses are recognised in income when loans and receivables are derecognised or impaired, as well as through the amortisation process. Net gains for these Funds consist of interest income less impairment losses.
Accrued income and debtors
Accrued income and debtors are classified as loans and receivables and include debtors resulting from asset sales as well as accrued interest on cash and cash equivalents and dividend receivables. Settlement terms of debtors relating to asset sales are generally less than 7 days and are recognised and carried at original invoice amount due to their short-term nature. Receivables relating to accrued income are current and receivable in cash. No interest is charged on amounts due beyond normal credit terms.
Subsequent to initial recognition, accrued income and debtors are carried at amortised cost using the effective interest method. Gains and losses are recognised in income when loans and receivables are derecognised or impaired, as well as through the amortisation process using the effective interest method.
Cash and bank balances
Cash and bank balances in the statement of financial position comprise current accounts, deposits held on call with banks that is highly liquid and readily convertible to cash and margin deposits. These current accounts, cash on call and deposits are net of outstanding bank overdrafts where the Fund currently has a legally enforceable right to set off the recognised amounts and intends to settle on a net basis. Margin accounts represent the exchange traded future contracts’ margin deposit amounts held with brokers and are pledged as collateral. Current accounts, cash on call, deposits and margin deposits are classified as loans and receivables and are measured at amortised cost, based on the relevant closing exchange rates at the statement of financial position date, where applicable. Creditors (including trade and other payables and related party payables) Creditors include payables resulting from the purchase of assets as well as accrued expenses and are classified as other financial liabilities at amortised cost. Settlement terms of payables relating to asset purchases are generally less than 7 days and are recognised and carried at original invoice amount due to their short-term nature. Accrued expenses payable are due within 30 days. No interest is charged on amounts due beyond normal credit terms. Subsequent to initial recognition, creditors are carried at amortised cost using the effective interest method. Creditors are categorised as financial liabilities at amortised cost. Gains and losses are recognised in profit or loss when creditors are derecognised as well as through the amortisation process.
Distributions payable
Distributions are determined as per note 1.9 and are classified as financial liabilities at amortised cost, using the effective interest method. Amounts are paid within 30 days of their declaration date. Distributions are categorised as financial liabilities at amortised cost. Net assets attributable to unit holders Net assets attributable to unit holders are carried at fair value, being the redemption amount representing the unit holders’ right to a residual interest in the Funds’ assets, and gains or losses are recognised through profit or loss. The change in net assets attributable to unit holders is the profit or loss movement on the financial liabilities at fair value through profit or loss.

SANLAM COLLECTIVE INVESTMENT SCHEME (for the year ended 31 December 2015)
14
1.10 Financial Instruments (continued)
Offsetting financial instruments Where a legally enforceable right of offset exists for recognised financial assets and liabilities and there is an intention to settle the liability and realise the asset simultaneously or to settle on a net basis, all related financial effects are offset. Derecognition of financial assets and liabilities
A financial asset (or, where applicable, a part of a financial asset or part of a group of similar financial assets) is derecognised when:
The rights to receive cash flows from the asset have expired.
The Fund has transferred its rights to receive cash flows from the asset and either (a) the Fund has transferred substantially all the risks and rewards of the asset, or (b) the Fund has neither transferred nor retained substantially all the risks and rewards of the asset, but has transferred control of the asset.
A financial liability is derecognised when the obligation under the liability is discharged or cancelled or expires. Where an existing financial liability is replaced by another from the same lender on substantially different terms, or the terms of an existing liability are substantially modified, such an exchange or modification is treated as a derecognition of the original liability and the recognition of a new liability, and the difference in the respective carrying amounts is recognised in profit or loss. Impairment of financial assets The carrying amounts of the Funds’ financial assets classified as loans and receivables carried at amortised cost are assessed at each statement of financial position date to determine whether there is any indication of impairment. If there is evidence of impairment such as the probability of insolvency, changes in the current economic condition that correlate with defaults or significant financial difficulties of the counter party, that an impairment loss on a financial asset carried at amortised cost has been incurred, the amount of such loss is measured as the difference between the asset’s carrying amount and the present value of estimated future cash flows discounted at the financial asset’s original effective interest rate. The carrying amount of the asset is reduced and the loss is recognised in profit or loss. If, in a subsequent period, the amount of the estimated impairment loss increases or decreases due to event occurring after the impairment was recognised, the previously recognised impairment loss is increased or reduced through profit or loss to the extent that the carrying value of the asset does not exceed its amortised cost, measured as if the financial asset was not impaired previously, at the reversal date based on the original effective interest rate.
1.11 Taxation
Under the current system of taxation in South Africa the Funds are exempt from paying taxes provided the net income, excluding realised capital gains, is distributed to unit holders. Income is taxed in the hands of the unit holders, while capital gains realised by the Funds are exempt. Withholding taxes are measured at the amount expected to be paid to the relevant tax authorities in the country from which dividend income originates. The tax rates and tax laws used to compute the amount are those that are enacted when the income was earned. Withholding taxes on distributions made are included in trade and other payables.
1.12 Fund mergers
Fund mergers are accounted for at fair value. In a fund merger the acquiring Fund will issue units to the fair value of assets acquired. The change in net assets attributable to unit holders in the acquirer Fund includes the combined income and expenses of the merged Funds from the effective date of the merger. Directly attributable costs incurred in the fund merger are expensed when incurred.
2. SIGNIFICANT EVENTS
2.1 During the current year:
The following Funds merged during the current financial year:
SIM Index Fund into SIM General Equity Fund
Sanlam Global Index Fund of Funds into Sanlam Global Balanced Fund of Funds
The Sanlam African Frontier Feeder Fund was closed during the current financial year. During the course of 2015 Sanlam Collective Investments (RF) (Pty) Ltd ceased to be the management company for the following Fund as it moved to different management company:
Sesfikile SCI Property Fund
The financial statements for the financial year ended 31 December 2015 of this fund has been prepared until the effective transfer date. Subsequent to this date transactions have been recorded by the new administration company. The move was effected and accounted for by closing the respective Fund managed by Sanlam Collective Investments RF (Pty) Ltd.
2.2 Financial year 2016:
It is anticipated that the following Funds will be merged during the 2016 financial year:
SIM Absolute Return Fund into SIM Active Income Fund
SIM Low Equity Fund into SIM Inflation Plus Fund
2.2 Financial year 2016 (continued)
SANLAM COLLECTIVE INVESTMENT SCHEME (for the year ended 31 December 2015)
15
There may be a cessation of the Sanlam Optimized Income Fund in 2016. We are currently still awaiting the cessation deed before the closure of this fund can be finalised. During the course of 2016 Sanlam Collective Investments (RF) (Pty) Ltd will cease to be the management company for the following Funds due to regulatory changes and corporate structure changes in the industry and the Sanlam Group:
Lynx SCI Balanced Fund of Funds
Lync SCI Cautious Fund of Funds
Lynx SCI Global Diversified Fund of Funds
Lynx SCI Opportunities Fund of Funds 3. RELATED PARTY TRANSACTIONS
All transactions with related parties are conducted at arm’s length and are made at normal market terms. Outstanding balances at year end are unsecured and interest free.
Manager
Sanlam Collective Investments (RF) (Pty) Limited (the "Manager") earns a management and performance fee for managing and administering the Funds. Management fees are charged as a percentage of the assets under management, as disclosed in note 2 of the Funds’ financial statements, and the performance fee is determined either on a fixed or on a performance basis. As a consequence of the performance fee orientation, performance fees will typically be higher following periods where the Funds’ total investment performance (income plus capital appreciation) have outperformed their respective benchmarks and lower in the case of underperformance. This ensures that the Manager’s interests are aligned with those of investors.
During the year, the Funds collectively paid and accrued management and performance fees of R642.4m, excluding VAT (2014: R603.7m) to Sanlam Collective Investments (RF) (Pty) Limited. The management and performance fees per individual Fund are disclosed on the face of the statement of comprehensive income and any outstanding balances in respect of these fees are disclosed on the face of the statement of financial position of each Fund.
The following information (in respect of all Funds) is reported in the financial report of Sanlam Collective Investments (RF) (Pty) Limited.
Total seed capital held - refer to note 4.1 of the Manager’s Financial Statements.
Total unit trading stock – refer to note 4.2 of the Manager’s Financial Statements.
Sales and repurchases – refer to note 23 of the Manager’s Financial Statements.
Key management of the Manager (including directors) or any of their close family members did not hold any significant units in managed or administered funds.

SANLAM COLLECTIVE INVESTMENT SCHEME (for the year ended 31 December 2015)
16
3. RELATED PARTY TRANSACTIONS (continued)
Sanlam Life Insurance Ltd:
Sanlam Life Insurance Ltd held the following controlling interest in Funds as at 31 December:
% interest held by
Sanlam Life Insurance Ltd
Company Name in company
2015 2014
First Avenue Sanlam Collective Investments Equity Fund 76% 80%
Graviton SCI Balanced Fund 82% 73%
Graviton SCI Capital Growth Fund 30% 42%
Graviton SCI Flexible Income Fund 93% 89%
Graviton SCI Low Equity Fund 94% 78%
Sanlam African Frontier Markets Feeder Fund 0% 94%
Sanlam Diversified Income Fund of Funds 0% 58%
Sanlam Global Balanced Fund of Funds 38% 44%
Sanlam Global Cautious Fund of Funds 26% 38%
Sanlam Global Index Fund of Funds 0% 87%
Sanlam Growth Institutional Fund 97% 97%
Sanlam Institutional Special Opportunities Fund 93% 90%
Sanlam Market Allocator Fund 73% 84%
Sanlam Multi Managed Aggressive Fund of Funds 70% 71%
Sanlam Multi Managed Balanced Fund of Funds 47% 42%
Sanlam Multi Managed Bond Fund 91% 93%
Sanlam Multi Managed Cautious Fund of Funds 65% 68%
Sanlam Multi Managed Conservative Fund of Funds 55% 55%
Sanlam Multi Managed Defensive Fund of Funds 45% 0%
Sanlam Multi Managed Equity Fund 100% 94%
Sanlam Multi Managed Equity Index Fund 59% 94%
Sanlam Multi Managed Flexible Equity Fund 53% 64%
Sanlam Multi Managed Inflation Linked Bond Fund 86% 93%
Sanlam Multi Managed Absolute Solution 5 Fund of Funds 0% 24%
Sanlam Multi Managed Institutional Aggressive Equity Fund One 95% 0%
Sanlam Multi Managed Institutional All Bond Fund One 0% 100%
Sanlam Multi Managed Institutional All Bond Fund Three 0% 98%
Sanlam Multi Managed Institutional Balanced Fund of Funds 0% 42%
Sanlam Multi Managed Institutional Bond Fund 0% 93%
Sanlam Multi Managed Institutional Equity Fund of Funds 0% 24%
Sanlam Multi Managed Institutional General Equity Fund One 0% 100%
Sanlam Multi Managed Institutional General Equity Fund Two 83% 81%
Sanlam Multi Managed Institutional Long-Term Growth Solution 7 Fund of Funds 0% 20%
Sanlam Multi Managed Institutional Positive Return Fund One 0% 64%
Sanlam Multi Managed Institutional Positive Return Fund Two 65% 81%
Sanlam Multi Managed Institutional Positive Return Fund Three 53% 66%
Sanlam Multi Managed Institutional Positive Return Fund Four 54% 64%
Sanlam Multi Managed Institutional Protection Solution 3 Fund of Funds 0% 31%

SANLAM COLLECTIVE INVESTMENT SCHEME (for the year ended 31 December 2015)
17
3. RELATED PARTY TRANSACTIONS (continued)
Sanlam Life Insurance (Continued)
% interest held by
Sanlam Life Insurance Ltd
Company Name in company
2015 2014
Sanlam Multi Managed Institutional Prudential Balanced Fund One 72% 64%
Sanlam Multi Managed Institutional Prudential Income Provider Fund One 0% 100%
Sanlam Multi Managed Institutional Prudential Income Provider Fund Two 67% 84%
Sanlam Multi Managed Institutional Prudential Low Equity One 0% 72%
Sanlam Multi Managed Moderate Aggressive Fund of Funds 59% 59%
Sanlam Multi Managed Moderate Fund of Funds 75% 77%
Sanlam Multi Managed Property Fund 79% 87%
Sanlam Multi Managed Protection Solution 3 Fund of Funds 37% 0%
Sanlam Multi Managed Yield Plus Fund 99% 98%
Sanlam Optimised Income Fund 0% 91%
Sanlam Select Absolute Fund 51% 100%
Sanlam Select Bond Plus Fund 100% 98%
Sanlam Select Defensive Balanced Fund 92% 72%
Sanlam Select Flexible Equity Fund 54% 100%
Sanlam Select Managed Fund 100% 100%
Sanlam Select Optimised Equity Fund 92% 100%
Sanlam Select Strategic Income Fund 21% 100%
Sanlam Select Thematic Equity Fund 98% 100%
Sanlam Stable Growth Fund 100% 100%
Sanlam Value Institutional Fund 100% 100%
SIM Absolute Return Income Fund 71% 72%
SIM Active Income Fund 44% 46%
SIM Balanced Fund 64% 64%
SIM Bond Plus Fund 94% 93%
SIM Enhanced Yield Fund 59% 67%
SIM Equally Weighted Top40 Index Fund 0% 22%
SIM Financial Fund 21% 22%
SIM General Equity Fund 44% 56%
SIM Global Best Ideas Feeder Fund 29% 28%
SIM Global Equity Income Feeder Fund 36% 38%
SIM Inflation Plus Fund 45% 46%
SIM Low Equity Fund 36% 37%
SIM Managed Aggressive Fund of Funds 80% 78%
SIM Managed Cautious Fund of Funds 70% 72%
SIM Managed Conservative Fund of Funds 59% 57%
SIM Managed Moderate Aggressive Fund of Funds 78% 78%
SIM Managed Moderate Fund of Funds 82% 82%
SIM Property Fund 88% 86%
SIM Small Cap Fund 27% 30%
SIM Top Choice Equity Fund 83% 82%
SIM Value Fund 49% 45%
SPI Equity Fund 38% 32%
Key management of Sanlam Life Insurance Ltd (including directors) or any of their close family members did not hold any significant units in terms of Funds controlled, (i.e. greater than 50% ownership) by Sanlam Life Insurance Ltd.
SANLAM COLLECTIVE INVESTMENT SCHEME (for the year ended 31 December 2015)
18
4. RISK MANAGEMENT
The Fund’s objective in managing risk is the protection of unit holder value. Risk is inherent in the Fund’s activities resulting mainly from the type of instrument in which it invests.
The financial risk is limited firstly by the regulatory environment of the Collective Investment Schemes Control Act which has strict and specific regulations as to what instruments may or may not be held. Secondly, each Fund is governed by a Trust Deed which commits to a specific investment objective. The objective is then translated into an investment mandate which governs the manner in which the investment manager manages the Fund. The investment manager limits the loss potential by reviewing the portfolio on a daily basis, and based on current and future predicted events, structures the portfolio in such a manner so as to limit loss and maximise gains, within the parameters of the risks identified.
NON-FINANCIAL RISK MANAGEMENT
4.1 General risks
Operational risk is the risk that there is a loss as a result of inadequate or failed internal processes, people, systems or external events. The Funds mitigate these risks through the outsourcing of the fund administration to Curo Fund Services, which has comprehensive systems of internal controls, internal audit, forensic and compliance functions and other measures such as back-up facilities, contingency planning and insurance. With effect from 23 October 2015, the client data on the SUTUWA system migrated to the new Silica system. The initiation of transactions and their administration is conducted on the basis of the segregation of duties, designed to ensure the correctness, completeness and validity of all transactions. Control is further strengthened by the settlement of transactions through the trustee and custodian who is Standard Bank of South Africa Limited. The custodian is also responsible for the safe custody of the Funds’ securities. To ensure validity, all transactions are confirmed with counterparties independently from the initial executors. The Sanlam group has a risk-based internal audit approach, in terms of which priority is given to the audit of higher risk areas, as identified in the planning phase of the audit process. The internal control systems and procedures are subject to regular internal audit reviews.
Operational risks include: Information and technology risk:
This is the risk of obsolescence of infrastructure, deficiency in integration, failures/inadequacies in systems/networks and the loss of accuracy, confidentiality, availability and integrity of data. This risk is mitigated by virtue of the outsourcing of the administration.
Legal risk:
This is the risk that the Funds will be exposed to contractual obligations which have not been provided. For material transactions entered into by the Funds, the legal resources of Sanlam Investments monitor the drafting of the contract documents to ensure that rights and obligations of all parties are clearly set out. Compliance risk:
This is the risk of not complying with laws and regulations. The Funds consider compliance with
4.1 General risks (continued)
applicable laws, industry regulations and codes, an integral part of doing business. The compliance function of Sanlam Collective Investments facilitates the management of compliance through the analysis of statutory and regulatory requirements, and monitoring the implementation and execution thereof. Fraud risk:
This is the risk of financial crime and unlawful conduct occurring within the Funds. The Manager recognises that financial crime and unlawful conduct are in conflict with the principles of ethical behaviour and that it undermines organisational integrity. The financial crime combating policy for the Manager is designed to counter the threat of financial crime and unlawful conduct. A zero-tolerance approach is applied in combating financial crime and all offenders will be prosecuted. The forensic services function at the Sanlam group level oversees the prevention, detection and investigation of incidents of unlawful conduct that could impact the Funds. The Sanlam Group Forensic Services is also responsible for the formulation of Group standards in respect of the combating of unlawful conduct and the implementation of measures to monitor compliance with these standards. Legislation risk:
The risk that unanticipated new Acts or Regulations will result in the need to change business practices that may lead to potential financial loss. The Funds draw on the expertise of Sanlam Investments, which monitors and influences events to the extent possible by participation in discussions with legislators, directly and through industry organisations.

SANLAM COLLECTIVE INVESTMENT SCHEME (for the year ended 31 December 2015)
19
FINANCIAL RISK MANAGEMENT
Financial instruments held by the Funds expose the Funds to financial risks. Any movement in the fair value or carrying value of asset and liabilities recorded on the statement of financial position impacts the obligation to unit holders, the net assets attributable to unit holders. From the perspective of the Fund as a legal entity there is no net exposure to these risks as the risks are passed on to the unit holder. There has been no change to the manner in which Funds manage and measure the risks. The security selection and asset allocation within each Fund is monitored by the Manager in terms of each Fund’s stated investment objectives, investment mandates and applicable regulations (Board Notice 80 of the Collective Investment Schemes Control Act).
4.2 Market risk
The Funds’ investing activities expose unit holders to various types of risk that are associated with the financial instruments and markets in which the Funds invest. Market risk is the risk that the fair value or future cash flows of a financial instrument will fluctuate as a result of changes in market prices. Market risk embodies the potential for both losses and gains to the investor and includes price risk, interest rate risk and currency risk. The Funds’ strategy on the management of market risk is driven by the Funds’ investment objective as described in the Supplementary Trust Deeds. Derivative instruments may be used by the Investment managers for the purpose of reducing
market risk enabling diversification of asset allocations and the interest rate exposures without having to divest from the instruments in the portfolio. The derivative contracts included in some portfolios serve as components of a portfolio’s investment strategy and are utilised primarily to structure and hedge investments to reduce risk to the portfolio. The derivative contracts that the portfolios trade in are exchange-traded futures and options, equity warrants and over-the-counter interest rate swap agreements. Exchange-traded futures and options are marked to market and settled in cash daily and exposure to these instruments is disclosed in the table below. The primary difference in the risk associated with over-the-counter contracts and exchange-traded contracts is credit risk. The portfolios have credit risk from derivative exposure equal to the fair value of the instruments at year-end. The credit risk related to exchange traded contracts is minimal because the exchange ensures that their contracts are always honoured. The table below shows the exposure to derivative instruments at year end. Financial risk information for the Funds moved to another administrator were not included in the 2015 financial statements as the Funds were not administered by Sanlam Collective Investments (RF) (Pty) Ltd at 31 December 2015.

SANLAM COLLECTIVE INVESTMENT SCHEME (for the year ended 31 December 2015)
20
4.2 Market risk (continued) (The table below shows the exposure to derivative instruments at year end.)
Exposure
to long
positions
Exposure
to short
positions
Exposure
to long
positions
Exposure
to short
positions
R'000 R'000 R'000 R'000
Graviton SCI Balanced Fund - - 14,953 (9,071)
Graviton SCI Capital Growth Fund - - 596 (27,511)
Graviton SCI Flexible Income Fund 2,937 (1,303) 1,853 (28,772)
Graviton SCI Low Equity Fund - - 18,289 (33,543)
Obsidian SCI Balanced Fund - - 15,499 (16,883)
Sanlam Growth Institutional Fund - - 68,954 -
Sanlam Multi Managed Equity Fund 3,255 - 3,241 -
Sanlam Multi Managed Equity Index Fund - - 3,524 -
Sanlam Multi Managed Flexible Equity Fund 2,680 (2,680) - -
Sanlam Multi Managed Institutional Positive Return Fund One - - 757 (573)
Sanlam Multi Managed Institutional Positive Return Fund Three - - 3,767 (1,410)
Sanlam Multi Managed Institutional Prudential Balanced Fund One - - 3,541 -
Sanlam Multi Managed Institutional Prudential Balanced Fund Two - - 33,614 (14,342)
Sanlam Multi Managed Instituional Prudential Income Provider Fund
Two - - - (611,813)
Sanlam Multi Managed Institutional Prudential Low Equity Two - - 9,480 (5,344)
Sanlam Select Bond Plus Fund 1 (2,804) - -
Sanlam Select Managed Fund 234,523 (28,296) - -
Sanlam Select Optimised Equity Fund 32 (32) - -
Sanlam Stable Growth Fund - - 8,226 (226,678)
SIM Index Fund - - 16,365 (2)
SIM Inflation Plus Fund 2,993,879 (19,746,850) 2,667 (267,887)
SIM Low Equity Fund 279,698 (2,018,017) 475 (14,316)
SIM Managed Moderate Fund of Funds 605,663 (17,692,965) - -
SIM Market Allocator Fund 10 (6,536) - (5,235)
SIM Value Fund 6,521,310 (39,221,375) 4,027 (4,072)
SMMI Bond Fund 16,279 (6,945) 11 -
SMMI Prudential Income Provider Fund Two - (34,702) - -
2015 2014
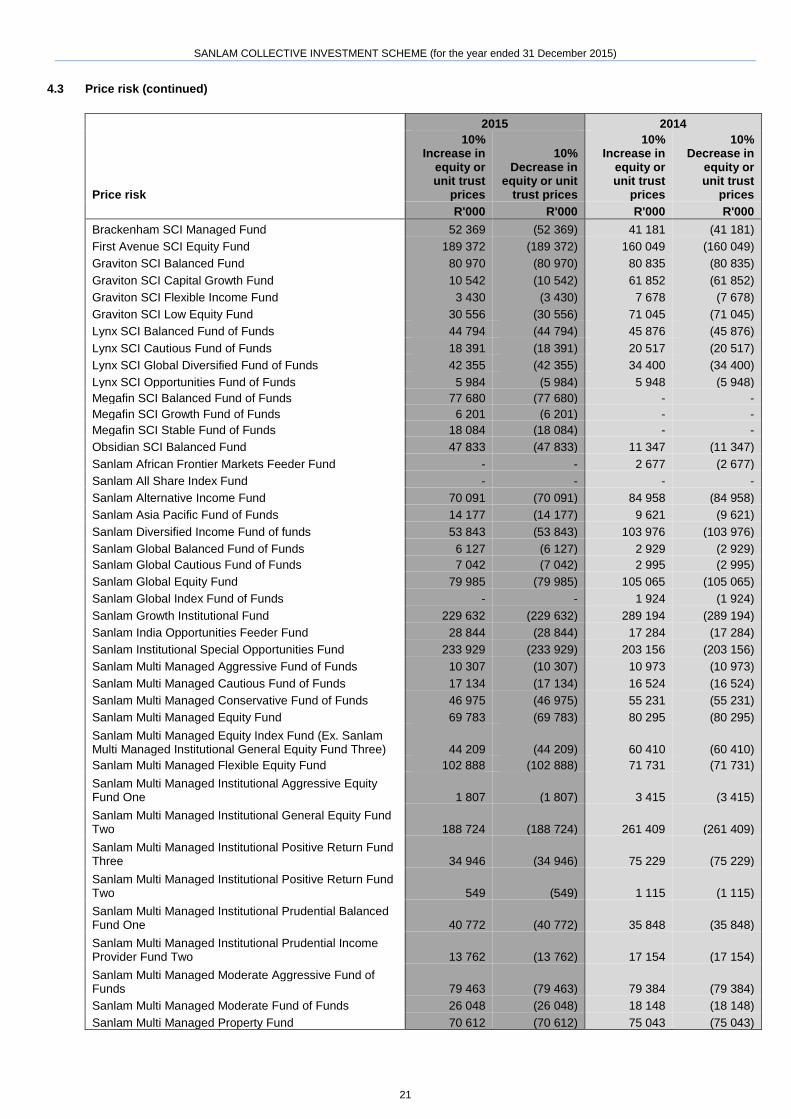
4.3 Price risk
Price risk is the risk that the fair value or future cash flows of the instrument will fluctuate as a result of changes in market prices other than those caused by interest rate risk and currency risk, whether caused by factors specific to an individual investment, its issuer or all factors affecting all similar instruments traded in the market. The Funds' investments in the following instruments as disclosed on the face of the statement of financial position are subject to price risk:
Equities and specialist securities - local
Equities and specialist securities - foreign
Participatory interest in collective investment schemes - local
Participatory interest in collective investment schemes – foreign
Price risk is mitigated by constructing a diversified portfolio of investments. Funds that invest primarily in a specific industry will have an increased exposure to market risk factors specific to that industry sector.
The table below illustrates the effect of possible changes in the fair value of investments for price risks on profit or loss for the year. The sensitivity analysis is prepared with all other variables held constant, and is based on the balances at year end taking into account the reasonable possible changes in the next 12 months. It follows that the actual results may differ from the sensitivity analysis below and the difference could be material. The disclosure provides information on the risks to which unit holders are exposed and it is not indicative of future performance. The movement in risk has been disclosed for a 10% increase and decrease in the value of the Funds equities and unit trusts. Management considered this to be a reasonable change in the market based on the current economic environment.
SANLAM COLLECTIVE INVESTMENT SCHEME (for the year ended 31 December 2015)
21
4.3 Price risk (continued)
2015 2014
Price risk
10% Increase in
equity or unit trust
prices
10% Decrease in
equity or unit trust prices
10% Increase in
equity or unit trust
prices
10% Decrease in
equity or unit trust
prices
R'000 R'000 R'000 R'000
Brackenham SCI Managed Fund 52 369 (52 369) 41 181 (41 181)
First Avenue SCI Equity Fund 189 372 (189 372) 160 049 (160 049)
Graviton SCI Balanced Fund 80 970 (80 970) 80 835 (80 835)
Graviton SCI Capital Growth Fund 10 542 (10 542) 61 852 (61 852)
Graviton SCI Flexible Income Fund 3 430 (3 430) 7 678 (7 678)
Graviton SCI Low Equity Fund 30 556 (30 556) 71 045 (71 045)
Lynx SCI Balanced Fund of Funds 44 794 (44 794) 45 876 (45 876)
Lynx SCI Cautious Fund of Funds 18 391 (18 391) 20 517 (20 517)
Lynx SCI Global Diversified Fund of Funds 42 355 (42 355) 34 400 (34 400)
Lynx SCI Opportunities Fund of Funds 5 984 (5 984) 5 948 (5 948)
Megafin SCI Balanced Fund of Funds 77 680 (77 680) - -
Megafin SCI Growth Fund of Funds 6 201 (6 201) - -
Megafin SCI Stable Fund of Funds 18 084 (18 084) - -
Obsidian SCI Balanced Fund 47 833 (47 833) 11 347 (11 347)
Sanlam African Frontier Markets Feeder Fund - - 2 677 (2 677)
Sanlam All Share Index Fund - - - -
Sanlam Alternative Income Fund 70 091 (70 091) 84 958 (84 958)
Sanlam Asia Pacific Fund of Funds 14 177 (14 177) 9 621 (9 621)
Sanlam Diversified Income Fund of funds 53 843 (53 843) 103 976 (103 976)
Sanlam Global Balanced Fund of Funds 6 127 (6 127) 2 929 (2 929)
Sanlam Global Cautious Fund of Funds 7 042 (7 042) 2 995 (2 995)
Sanlam Global Equity Fund 79 985 (79 985) 105 065 (105 065)
Sanlam Global Index Fund of Funds - - 1 924 (1 924)
Sanlam Growth Institutional Fund 229 632 (229 632) 289 194 (289 194)
Sanlam India Opportunities Feeder Fund 28 844 (28 844) 17 284 (17 284)
Sanlam Institutional Special Opportunities Fund 233 929 (233 929) 203 156 (203 156)
Sanlam Multi Managed Aggressive Fund of Funds 10 307 (10 307) 10 973 (10 973)
Sanlam Multi Managed Cautious Fund of Funds 17 134 (17 134) 16 524 (16 524)
Sanlam Multi Managed Conservative Fund of Funds 46 975 (46 975) 55 231 (55 231)
Sanlam Multi Managed Equity Fund 69 783 (69 783) 80 295 (80 295)
Sanlam Multi Managed Equity Index Fund (Ex. Sanlam Multi Managed Institutional General Equity Fund Three) 44 209 (44 209) 60 410 (60 410)
Sanlam Multi Managed Flexible Equity Fund 102 888 (102 888) 71 731 (71 731)
Sanlam Multi Managed Institutional Aggressive Equity Fund One 1 807 (1 807) 3 415 (3 415)
Sanlam Multi Managed Institutional General Equity Fund Two 188 724 (188 724) 261 409 (261 409)
Sanlam Multi Managed Institutional Positive Return Fund Three 34 946 (34 946) 75 229 (75 229)
Sanlam Multi Managed Institutional Positive Return Fund Two 549 (549) 1 115 (1 115)
Sanlam Multi Managed Institutional Prudential Balanced Fund One 40 772 (40 772) 35 848 (35 848)
Sanlam Multi Managed Institutional Prudential Income Provider Fund Two 13 762 (13 762) 17 154 (17 154)
Sanlam Multi Managed Moderate Aggressive Fund of Funds 79 463 (79 463) 79 384 (79 384)
Sanlam Multi Managed Moderate Fund of Funds 26 048 (26 048) 18 148 (18 148)
Sanlam Multi Managed Property Fund 70 612 (70 612) 75 043 (75 043)

SANLAM COLLECTIVE INVESTMENT SCHEME (for the year ended 31 December 2015)
22
4.3 Price risk (continued)
2015 2014
Price risk
10% Increase in
equity or unit trust prices
10% Decrease in
equity or unit trust prices
10% Increase in equity or unit trust
prices
10% Decrease in
equity or unit trust
prices
R'000 R'000 R'000 R'000
Sanlam Multi Manged Institutional Positive Return Fund Four 74 183 (74 183) 75 081 (75 081)
Sanlam Multi-Managed Balanced Fund of Funds 183 986 (183 986) 26 801 (26 801)
Sanlam Optimised Income Fund 86 (86) 26 792 (26 792)
Sanlam Pan-Europe Fund 12 340 (12 340) 10 040 (10 040)
Sanlam Select Absolute Fund 81 766 (81 766) 20 145 (20 145)
Sanlam Select Defensive Balanced Fund 20 115 (20 115) 14 750 (14 750)
Sanlam Select Flexible Equity Fund 85 182 (85 182) 17 492 (17 492)
Sanlam Select Managed Fund 47 611 (47 611) 24 786 (24 786)
Sanlam Select Optimised Equity Fund 25 759 (25 759) 23 092 (23 092)
Sanlam Select Strategic Income Fund 15 722 (15 722) 2 121 (2 121)
Sanlam Select Thematic Equity Fund 101 464 (101 464) 23 130 (23 130)
Sanlam Stable Growth Fund 40 321 (40 321) 39 173 (39 173)
Sanlam Value Institutional Fund 160 415 (160 415) 168 100 (168 100)
Sesfikile SCI Property Fund - - 40 848 (40 848)
SIM Absolute Return Income Fund 1 249 (1 249) 1 963 (1 963)
SIM Active Income Fund 7 875 (7 875) 10 672 (10 672)
SIM Balanced Fund 1 001 022 (1 001 022) 842 638 (842 638)
SIM Financial Fund 27 968 (27 968) 28 383 (28 383)
SIM General Equity Fund 743 495 (743 495) 516 579 (516 579)
SIM Global Best Ideas Feeder Fund 69 784 (69 784) 64 846 (64 846)
SIM Global Equity Income Feeder Fund 4 312 (4 312) 2 185 (2 185)
SIM Global Financial Feeder Fund 12 460 (12 460) 11 255 (11 255)
SIM Index Fund - - 191 732 (191 732)
SIM Industrial Fund 187 069 (187 069) 153 798 (153 798)
SIM Inflation Plus Fund 343 410 (343 410) 211 850 (211 850)
SIM Low Equity Fund 34 692 (34 692) 35 789 (35 789)
SIM Managed Aggressive Fund of Funds 74 619 (74 619) 62 012 (62 012)
SIM Managed Cautious Fund of Funds 122 893 (122 893) 123 951 (123 951)
SIM Managed Conservative Fund of Funds 35 598 (35 598) 37 390 (37 390)
SIM Managed Moderate Aggressive Fund of Funds 148 493 (148 493) 128 695 (128 695)
SIM Managed Moderate Fund of Funds 388 894 (388 894) 369 028 (369 028)
SIM Market Allocator Fund 4 065 (4 065) 6 036 (6 036)
SIM Property Fund 515 244 (515 244) 497 135 (497 135)
SIM Resources Fund 3 596 (3 596) 5 612 (5 612)
SIM Small Cap Fund 38 849 (38 849) 33 599 (33 599)
SIM Top Choice Equity Fund 98 839 (98 839) 83 138 (83 138)
SIM Value Fund 286 283 (286 283) 362 117 (362 117)
SMMI Absolute Solution 5 Fund of Funds 73 775 (73 775) 42 937 (42 937)
SMMI Defensive Fund of Funds 64 477 (64 477) 24 456 (24 456)
SMMI Equity Fund of Funds 5 902 (5 902) 6 692 (6 692)
SMMI Long-Term Growth Solution 7 Fund of Funds 42 898 (42 898) 38 006 (38 006)
SMMI Protection Solution 3 Fund of Funds 15 871 (15 871) 15 574 (15 574)
SPI Equity Fund 9 489 (9 489) 7 256 (7 256)
Tresor SCI Balanced Fund 34 048 (34 048) - -
Tresor SCI Flexible Fund 14 965 (14 965) - -
Tresor SCI Income Fund 5 739 (5 739) - -
Tresor SCI Stable Fund 20 008 (20 008) - -

SANLAM COLLECTIVE INVESTMENT SCHEME (for the year ended 31 December 2015)
23
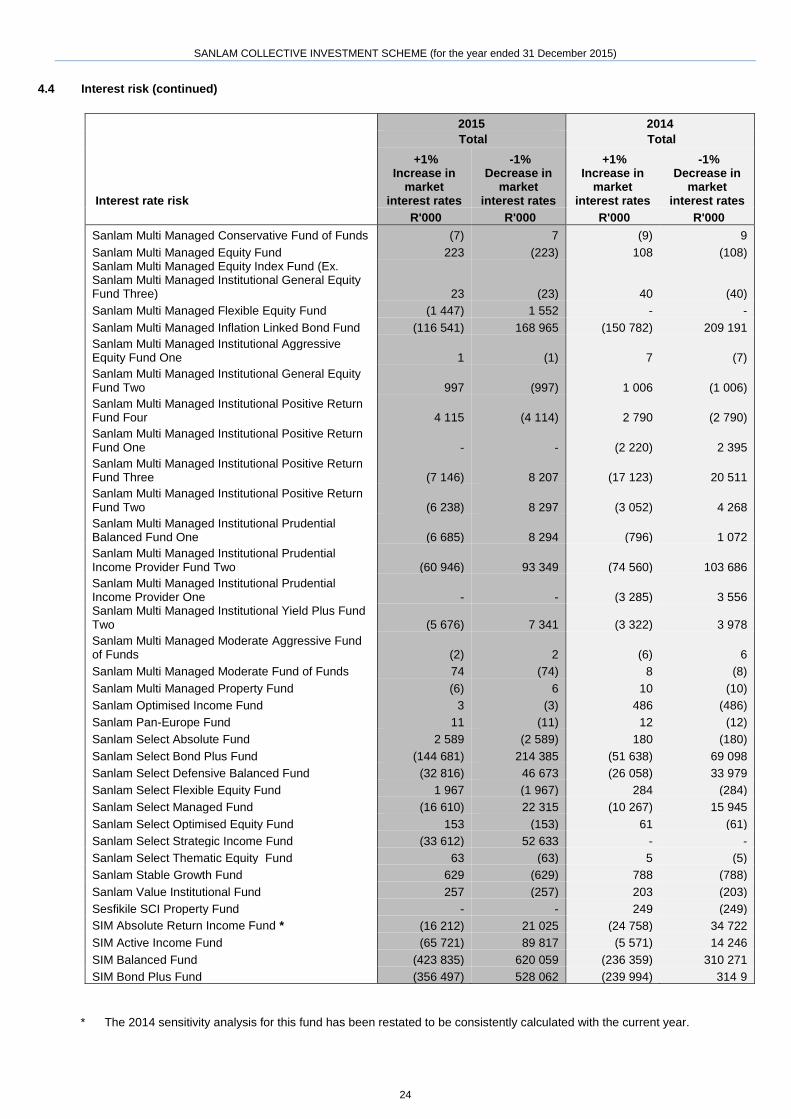
4.4 Interest risk
Interest rate risk is the risk that the fair value or future cash flows of a financial instrument will fluctuate as a result of changes in interest rates. Certain Funds’ mandates permit investment in interest bearing instruments. The fair values of fixed rate interest instruments are susceptible to changes in the prevailing level of interest rates. The impact of interest rate changes on the fair values of fixed rate interest instruments is more significant the longer the term of the instrument. Where Funds invest in variable rate instruments, the interest income is susceptible to interest rate movements. The Funds' investments in the following instruments as disclosed on the face of the statement of financial position are subject to interest rate risk:
Bonds - local
Bonds – foreign
Money market instruments
Cash and bank balances
The table below illustrates the effect of possible changes in prevailing interest rates on profit or loss for the year. The sensitivity analysis is prepared with all other variables held constant, and is based on the balances at year end taking into account the reasonable possible changes in the next 12 months. The actual results may differ from the sensitivity analysis and the difference could be material. The disclosure provides information on the risks to which unit holders are exposed and is not indicative of future performance. The movement has been disclosed for a 1% increase and decrease in interest rate risk. Management considered this to be a reasonable change in the market based on the current economic environment.
4.4 Interest risk
2015 2014
Total Total
Interest rate risk
+1% Increase in
market interest rates
-1% Decrease in
market interest rates
+1% Increase in
market interest rates
-1% Decrease in
market interest rates
R'000 R'000 R'000 R'000
Brackenham SCI Managed Fund 61 (61) 363 (363)
First Avenue SCI Equity Fund 532 (532) 633 (633)
Graviton SCI Balanced Fund (87) 109 (9 595) 12 379
Graviton SCI Capital Growth Fund (454) 584 (12 689) 16 212
Graviton SCI Flexible Income Fund (5 401) 6 835 (8 175) 9 498
Graviton SCI Low Equity Fund 148 60 (27 572) 35 158
Lynx SCI Balanced Fund of Funds 35 (35) 78 (78)
Lynx SCI Cautious Fund of Funds 35 (35) 35 (35)
Lynx SCI Global Diversified Fund of Funds 191 (191) 48 (48)
Lynx SCI Opportunities Fund of Funds 23 (23) 12 (12)
Megafin SCI Balanced Fund of Funds 48 (48) - -
Megafin SCI Growth Fund of Funds 10 (10) - -
Megafin SCI Stable Fund of Funds 17 (17) - -
Obsidian SCI Balanced Fund (8 706) 10 943 (2 640) 3 166
Sanlam African Frontier Markets Feeder Fund - - 4 (4)
Sanlam Alternative Income Fund 73 309 (73 309) 66 128 (66 128)
Sanlam Asia Pacific Fund of Funds 1 (1) 9 (9)
Sanlam Diversified Income Fund of funds 19 (19) 9 (9)
Sanlam Global Balanced Fund of Funds 17 (17) 11 (11)
Sanlam Global Cautious Fund of Funds 23 (23) 11 (11)
Sanlam Global Equity Fund 189 (189) 128 (128)
Sanlam Global Index Fund of Funds - - 5 (5)
Sanlam Growth Institutional Fund 438 (438) 887 (887)
Sanlam Growth Institutional Fund 438 (438) 887 (887)
Sanlam India Opportunities Feeder Fund 10 (10) 25 (25)
Sanlam Institutional Special Opportunities Fund 173 (173) 508 (508)
Sanlam Multi Managed Aggressive Fund of Funds 22 (22) 10 (10)
Sanlam Multi Managed Cautious Fund of Funds (1) 1 - -
SANLAM COLLECTIVE INVESTMENT SCHEME (for the year ended 31 December 2015)
24
4.4 Interest risk (continued)
2015 2014
Total Total
Interest rate risk
+1% Increase in
market interest rates
-1% Decrease in
market interest rates
+1% Increase in
market interest rates
-1% Decrease in
market interest rates
R'000 R'000 R'000 R'000
Sanlam Multi Managed Conservative Fund of Funds (7) 7 (9) 9
Sanlam Multi Managed Equity Fund 223 (223) 108 (108) Sanlam Multi Managed Equity Index Fund (Ex. Sanlam Multi Managed Institutional General Equity Fund Three) 23 (23) 40 (40)
Sanlam Multi Managed Flexible Equity Fund (1 447) 1 552 - -
Sanlam Multi Managed Inflation Linked Bond Fund (116 541) 168 965 (150 782) 209 191
Sanlam Multi Managed Institutional Aggressive Equity Fund One 1 (1) 7 (7)
Sanlam Multi Managed Institutional General Equity Fund Two 997 (997) 1 006 (1 006)
Sanlam Multi Managed Institutional Positive Return Fund Four 4 115 (4 114) 2 790 (2 790)
Sanlam Multi Managed Institutional Positive Return Fund One - - (2 220) 2 395
Sanlam Multi Managed Institutional Positive Return Fund Three (7 146) 8 207 (17 123) 20 511
Sanlam Multi Managed Institutional Positive Return Fund Two (6 238) 8 297 (3 052) 4 268
Sanlam Multi Managed Institutional Prudential Balanced Fund One (6 685) 8 294 (796) 1 072
Sanlam Multi Managed Institutional Prudential Income Provider Fund Two (60 946) 93 349 (74 560) 103 686
Sanlam Multi Managed Institutional Prudential Income Provider One - - (3 285) 3 556 Sanlam Multi Managed Institutional Yield Plus Fund Two (5 676) 7 341 (3 322) 3 978
Sanlam Multi Managed Moderate Aggressive Fund of Funds (2) 2 (6) 6
Sanlam Multi Managed Moderate Fund of Funds 74 (74) 8 (8)
Sanlam Multi Managed Property Fund (6) 6 10 (10)
Sanlam Optimised Income Fund 3 (3) 486 (486)
Sanlam Pan-Europe Fund 11 (11) 12 (12)
Sanlam Select Absolute Fund 2 589 (2 589) 180 (180)
Sanlam Select Bond Plus Fund (144 681) 214 385 (51 638) 69 098
Sanlam Select Defensive Balanced Fund (32 816) 46 673 (26 058) 33 979
Sanlam Select Flexible Equity Fund 1 967 (1 967) 284 (284)
Sanlam Select Managed Fund (16 610) 22 315 (10 267) 15 945
Sanlam Select Optimised Equity Fund 153 (153) 61 (61)
Sanlam Select Strategic Income Fund (33 612) 52 633 - -
Sanlam Select Thematic Equity Fund 63 (63) 5 (5)
Sanlam Stable Growth Fund 629 (629) 788 (788)
Sanlam Value Institutional Fund 257 (257) 203 (203)
Sesfikile SCI Property Fund - - 249 (249)
SIM Absolute Return Income Fund * (16 212) 21 025 (24 758) 34 722
SIM Active Income Fund (65 721) 89 817 (5 571) 14 246
SIM Balanced Fund (423 835) 620 059 (236 359) 310 271
SIM Bond Plus Fund (356 497) 528 062 (239 994) 314 9
* The 2014 sensitivity analysis for this fund has been restated to be consistently calculated with the current year.
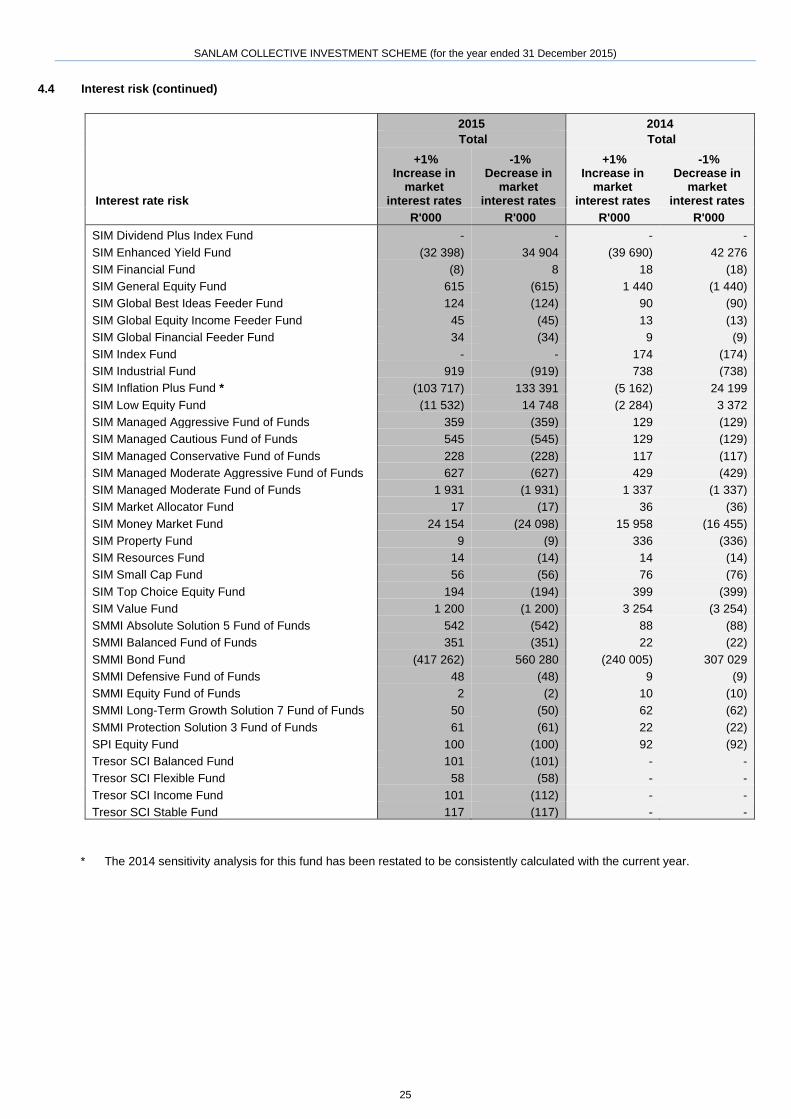
SANLAM COLLECTIVE INVESTMENT SCHEME (for the year ended 31 December 2015)
25
4.4 Interest risk (continued)
2015 2014
Total Total
Interest rate risk
+1% Increase in
market interest rates
-1% Decrease in
market interest rates
+1% Increase in
market interest rates
-1% Decrease in
market interest rates
R'000 R'000 R'000 R'000
SIM Dividend Plus Index Fund - - - -
SIM Enhanced Yield Fund (32 398) 34 904 (39 690) 42 276
SIM Financial Fund (8) 8 18 (18)
SIM General Equity Fund 615 (615) 1 440 (1 440)
SIM Global Best Ideas Feeder Fund 124 (124) 90 (90)
SIM Global Equity Income Feeder Fund 45 (45) 13 (13)
SIM Global Financial Feeder Fund 34 (34) 9 (9)
SIM Index Fund - - 174 (174)
SIM Industrial Fund 919 (919) 738 (738)
SIM Inflation Plus Fund * (103 717) 133 391 (5 162) 24 199
SIM Low Equity Fund (11 532) 14 748 (2 284) 3 372
SIM Managed Aggressive Fund of Funds 359 (359) 129 (129)
SIM Managed Cautious Fund of Funds 545 (545) 129 (129)
SIM Managed Conservative Fund of Funds 228 (228) 117 (117)
SIM Managed Moderate Aggressive Fund of Funds 627 (627) 429 (429)
SIM Managed Moderate Fund of Funds 1 931 (1 931) 1 337 (1 337)
SIM Market Allocator Fund 17 (17) 36 (36)
SIM Money Market Fund 24 154 (24 098) 15 958 (16 455)
SIM Property Fund 9 (9) 336 (336)
SIM Resources Fund 14 (14) 14 (14)
SIM Small Cap Fund 56 (56) 76 (76)
SIM Top Choice Equity Fund 194 (194) 399 (399)
SIM Value Fund 1 200 (1 200) 3 254 (3 254)
SMMI Absolute Solution 5 Fund of Funds 542 (542) 88 (88)
SMMI Balanced Fund of Funds 351 (351) 22 (22)
SMMI Bond Fund (417 262) 560 280 (240 005) 307 029
SMMI Defensive Fund of Funds 48 (48) 9 (9)
SMMI Equity Fund of Funds 2 (2) 10 (10)
SMMI Long-Term Growth Solution 7 Fund of Funds 50 (50) 62 (62)
SMMI Protection Solution 3 Fund of Funds 61 (61) 22 (22)
SPI Equity Fund 100 (100) 92 (92)
Tresor SCI Balanced Fund 101 (101) - -
Tresor SCI Flexible Fund 58 (58) - -
Tresor SCI Income Fund 101 (112) - -
Tresor SCI Stable Fund 117 (117) - -
* The 2014 sensitivity analysis for this fund has been restated to be consistently calculated with the current year.
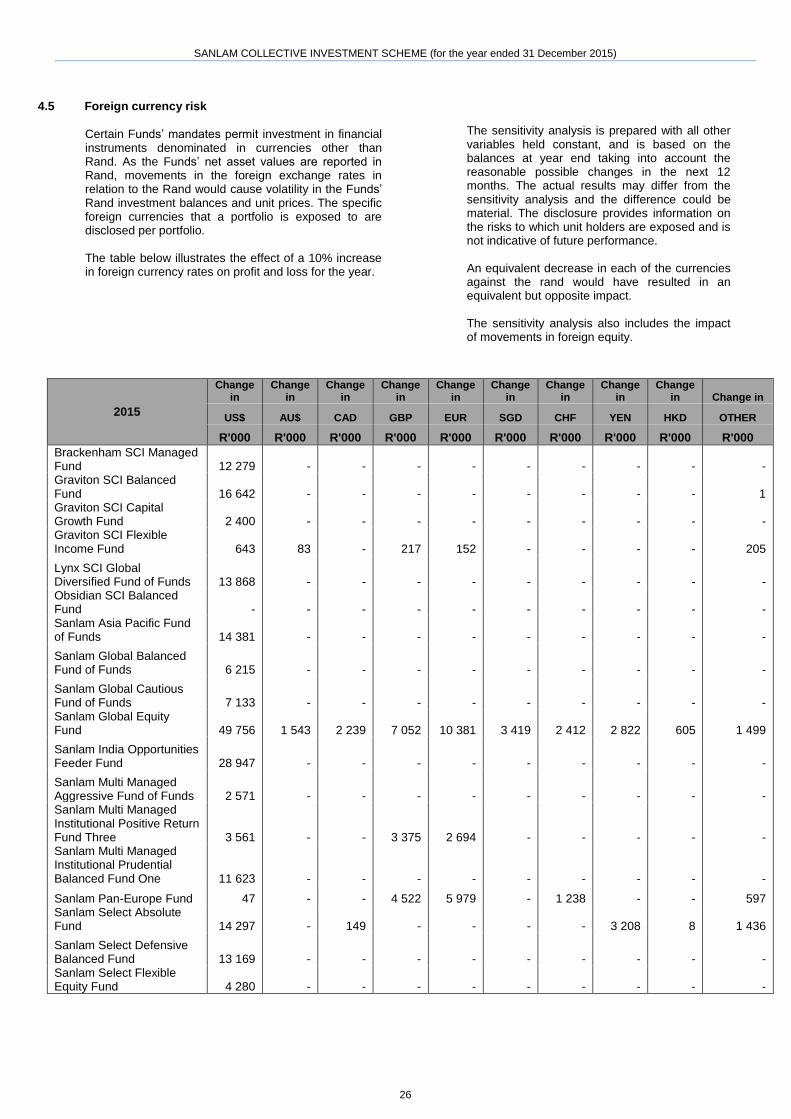
SANLAM COLLECTIVE INVESTMENT SCHEME (for the year ended 31 December 2015)
26
4.5 Foreign currency risk
Certain Funds’ mandates permit investment in financial instruments denominated in currencies other than Rand. As the Funds’ net asset values are reported in Rand, movements in the foreign exchange rates in relation to the Rand would cause volatility in the Funds’ Rand investment balances and unit prices. The specific foreign currencies that a portfolio is exposed to are disclosed per portfolio.
The table below illustrates the effect of a 10% increase in foreign currency rates on profit and loss for the year.
The sensitivity analysis is prepared with all other variables held constant, and is based on the balances at year end taking into account the reasonable possible changes in the next 12 months. The actual results may differ from the sensitivity analysis and the difference could be material. The disclosure provides information on the risks to which unit holders are exposed and is not indicative of future performance.
An equivalent decrease in each of the currencies against the rand would have resulted in an equivalent but opposite impact.
The sensitivity analysis also includes the impact of movements in foreign equity.
2015
Change in
Change in
Change in
Change in
Change in
Change in
Change in
Change in
Change in Change in
US$ AU$ CAD GBP EUR SGD CHF YEN HKD OTHER
R'000 R'000 R'000 R'000 R'000 R'000 R'000 R'000 R'000 R'000
Brackenham SCI Managed Fund 12 279 - - - - - - - - - Graviton SCI Balanced Fund 16 642 - - - - - - - - 1 Graviton SCI Capital Growth Fund 2 400 - - - - - - - - - Graviton SCI Flexible Income Fund 643 83 - 217 152 - - - - 205
Lynx SCI Global Diversified Fund of Funds 13 868 - - - - - - - - - Obsidian SCI Balanced Fund - - - - - - - - - - Sanlam Asia Pacific Fund of Funds 14 381 - - - - - - - - -
Sanlam Global Balanced Fund of Funds 6 215 - - - - - - - - -
Sanlam Global Cautious Fund of Funds 7 133 - - - - - - - - - Sanlam Global Equity Fund 49 756 1 543 2 239 7 052 10 381 3 419 2 412 2 822 605 1 499
Sanlam India Opportunities Feeder Fund 28 947 - - - - - - - - -
Sanlam Multi Managed Aggressive Fund of Funds 2 571 - - - - - - - - - Sanlam Multi Managed Institutional Positive Return Fund Three 3 561 - - 3 375 2 694 - - - - - Sanlam Multi Managed Institutional Prudential Balanced Fund One 11 623 - - - - - - - - -
Sanlam Pan-Europe Fund 47 - - 4 522 5 979 - 1 238 - - 597 Sanlam Select Absolute Fund 14 297 - 149 - - - - 3 208 8 1 436
Sanlam Select Defensive Balanced Fund 13 169 - - - - - - - - - Sanlam Select Flexible Equity Fund 4 280 - - - - - - - - -

SANLAM COLLECTIVE INVESTMENT SCHEME (for the year ended 31 December 2015)
27
4.5 Foreign currency risk (continued)
2015
Change in
Change in
Change in
Change in
Change in
Change in
Change in
Change in
Change in
Change in
US$ AU$ CAD GBP EUR SGD CHF YEN HKD OTHER
R'000 R'000 R'000 R'000 R'000 R'000 R'000 R'000 R'000 R'000
Sanlam Select Optimised Equity Fund 3 190 - 394 - - - - 922 231 542
SIM Balanced Fund 288 599 4 397 - 31 33 352 4 065 4 658 - - -
SIM Bond Plus Fund - - - - - - - - - -
SIM Financial Fund 1 457 - - 3 867 238 - - - - - SIM General Equity Fund 28 858 - - 25 028 8 340 - - 2 127 - 1 723
SIM Global Best Ideas Feeder Fund 69 784 - - - - - - - - -
SIM Global Equity Income Feeder Fund 4 619 - - - - - - - - - SIM Global Financial Feeder Fund 12 460 - - - - - - - - -
SIM Industrial Fund 8 129 - - 233 3 777 - - - - 4 678
SIM Inflation Plus Fund 168 397 2 460 - 236 20 185 2 357 2 398 - - -
SIM Low Equity Fund 15 221 264 - 40 2 556 257 256 - - - SIM Managed Aggressive Fund of Funds 13 476 - - - - - - - - -
SIM Managed Cautious Fund of Funds 19 759 - - - - - - - - - SIM Managed Conservative Fund of Funds 6 269 - - - - - - - - - SIM Managed Moderate Aggressive Fund of Funds 28 352 - - - - - - - - - SIM Managed Moderate Fund of Funds 77 232 - - - - - - - - - SIM Market Allocator Fund 689 - - - - - - - - -
SIM Resources Fund 217 - - 503 - - 1 - - 1
SIM Small Cap Fund - - - 46 - - - - - 2
SIM Value Fund 62 714 1 - 18 454 13 - - - 5 399 - SMMI Absolute Solution 5 Fund of Funds 19 156 - - - - - - - - - SMMI Defensive Fund of Funds - - - - - - - - - - SMMI Long-Term Growth Solution 7 Fund of Funds 10 122 - - - - - - - - - SMMI Protection Solution 3 Fund of Funds 3 510 - - - - - - - - - SMMI Prudential Income Provider Fund Two 2 894 716 - 5 212 1 210 - - - - 1 113

SANLAM COLLECTIVE INVESTMENT SCHEME (for the year ended 31 December 2015)
28
4.5 Foreign currency risk (continued)
2014
Change in
Change in
Change in
Change in
Change in
Change in
Change in
Change in
Change in
Change in
US$ AU$ CAD GBP EUR SGD CHF YEN HKD OTHER
R'000 R'000 R'000 R'000 R'000 R'000 R'000 R'000 R'000 R'000
Brackenham SCI Managed Fund 5 030 - - 1 797 18 - 1 206 - - 551.94 Graviton SCI Balanced Fund 12107 67 - 72 7 003 - 64 - - - Graviton SCI Capital Growth Fund
16 941 0.00 - 24 - - - - - -
Graviton SCI Flexible Income Fund (32) 239 - 333 257 - - - - - Graviton SCI Low Equity Fund 12 107 67 - 72 7 003 - 64 - - -
Lynx SCI Global Diversified Fund of Funds 12 935 - - - - - - - - -
Sanlam African Frontier Markets Feeder Fund 2 678 - - - - - - - - -
Sanlam Asia Pacific Fund of Funds 7 859 - - - - - - 1 789 - - Sanlam Global Cautious Fund of Funds (ex: Sanlam International Cautious Fund of Funds) 3 034 - - - - - - - - -
Sanlam Global Equity Fund 66 861 - 2 129 8 391 12 779 3 088 2 636 5 655 1 610 4 176
Sanlam Global Index Fund of Funds 1 954 - - - - - - - - -
Sanlam India Opportunities Feeder Fund 17 623 - - - - - - - - - Sanlam Multi Managed Aggressive Fund of Funds 2 455 - - - - - - - - -
Sanlam Multi Managed Cautious Fund of Funds 2 - - - - - - - - -
Sanlam Multi Managed Conservative Fund of Funds 3 - - - - - - - - - Sanlam Multi Managed Institutional General Equity Fund One 1 463 - 344 - - - - - 523 - Sanlam Multi Managed Institutional Prudential Balanced Fund One 9 347 - - - - - - - - - Sanlam Multi Managed Institutional Prudential Income Provider Fund Two 2 963 2 114 - 3 721 1 873 - - - - 1 584 Sanlam Select Absolute Fund (Ex Sanlam Multi Managed Institutional Prudential Low Equity Two) 2 595 - 486 - - - - - 507 - Sanlam Multi Managed Moderate Aggressive Fund of Funds 3 - - - - - - - - -
Sanlam Multi Managed Moderate Fund of Funds 1 - - - - - - - - - Sanlam Pan-Europe Fund 53 - - 3 907 4 727 - 968 - - 475 Sanlam Select Defensive Balanced Fund (Sanlam Multi Managed Institutional Prudential Low Equity One) 8 649 - - - - - - - - -
SIM Balanced Fund 224 506 2 935 - 4 016 25 845 - 3 069 - - - SIM Financial Fund 2 119 - - 3 241 173 - - - - - SIM General Equity Fund 25 994 - - 10 550 1 910 - 4 207 - - 2 043 SIM Global Best Ideas Feeder Fund 64 846 - - - - - - - - -
SIM Global Equity Income Feeder Fund 2 242 - - - - - - - - -
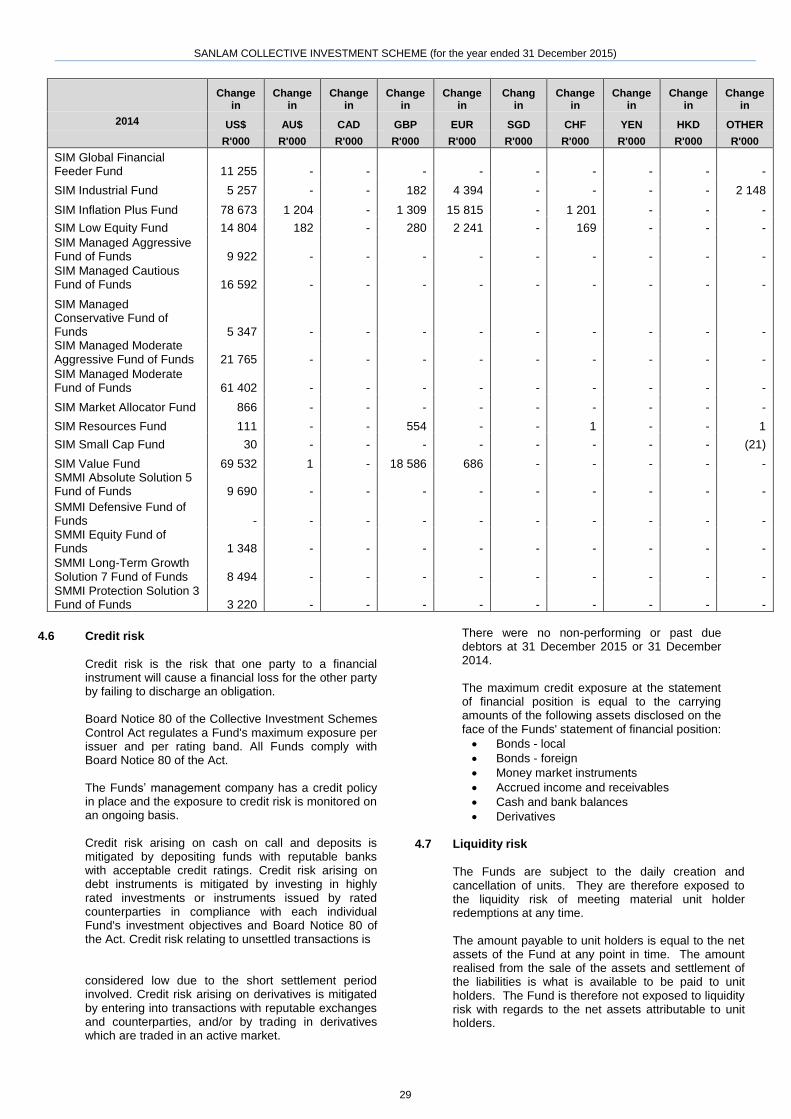
SANLAM COLLECTIVE INVESTMENT SCHEME (for the year ended 31 December 2015)
29
Change in
Change in
Change in
Change in
Change in
Chang in
Change in
Change in
Change in
Change in
2014 US$ AU$ CAD GBP EUR SGD CHF YEN HKD OTHER
R'000 R'000 R'000 R'000 R'000 R'000 R'000 R'000 R'000 R'000
SIM Global Financial Feeder Fund 11 255 - - - - - - - - -
SIM Industrial Fund 5 257 - - 182 4 394 - - - - 2 148
SIM Inflation Plus Fund 78 673 1 204 - 1 309 15 815 - 1 201 - - -
SIM Low Equity Fund 14 804 182 - 280 2 241 - 169 - - -
SIM Managed Aggressive Fund of Funds 9 922 - - - - - - - - -
SIM Managed Cautious Fund of Funds 16 592 - - - - - - - - -
SIM Managed Conservative Fund of Funds 5 347 - - - - - - - - - SIM Managed Moderate Aggressive Fund of Funds 21 765 - - - - - - - - -
SIM Managed Moderate Fund of Funds 61 402 - - - - - - - - -
SIM Market Allocator Fund 866 - - - - - - - - -
SIM Resources Fund 111 - - 554 - - 1 - - 1
SIM Small Cap Fund 30 - - - - - - - - (21)
SIM Value Fund 69 532 1 - 18 586 686 - - - - - SMMI Absolute Solution 5 Fund of Funds 9 690 - - - - - - - - -
SMMI Defensive Fund of Funds - - - - - - - - - - SMMI Equity Fund of Funds 1 348 - - - - - - - - -
SMMI Long-Term Growth Solution 7 Fund of Funds 8 494 - - - - - - - - -
SMMI Protection Solution 3 Fund of Funds 3 220 - - - - - - - - -
4.6 Credit risk
Credit risk is the risk that one party to a financial instrument will cause a financial loss for the other party by failing to discharge an obligation.
Board Notice 80 of the Collective Investment Schemes Control Act regulates a Fund's maximum exposure per issuer and per rating band. All Funds comply with Board Notice 80 of the Act. The Funds’ management company has a credit policy in place and the exposure to credit risk is monitored on an ongoing basis. Credit risk arising on cash on call and deposits is mitigated by depositing funds with reputable banks with acceptable credit ratings. Credit risk arising on debt instruments is mitigated by investing in highly rated investments or instruments issued by rated counterparties in compliance with each individual Fund's investment objectives and Board Notice 80 of the Act. Credit risk relating to unsettled transactions is considered low due to the short settlement period involved. Credit risk arising on derivatives is mitigated by entering into transactions with reputable exchanges and counterparties, and/or by trading in derivatives which are traded in an active market.
There were no non-performing or past due debtors at 31 December 2015 or 31 December 2014. The maximum credit exposure at the statement of financial position is equal to the carrying amounts of the following assets disclosed on the face of the Funds' statement of financial position:
Bonds - local
Bonds - foreign
Money market instruments
Accrued income and receivables
Cash and bank balances
Derivatives
4.7 Liquidity risk
The Funds are subject to the daily creation and cancellation of units. They are therefore exposed to the liquidity risk of meeting material unit holder redemptions at any time.
The amount payable to unit holders is equal to the net assets of the Fund at any point in time. The amount realised from the sale of the assets and settlement of the liabilities is what is available to be paid to unit holders. The Fund is therefore not exposed to liquidity risk with regards to the net assets attributable to unit holders.

SANLAM COLLECTIVE INVESTMENT SCHEME (for the year ended 31 December 2015)
30
4.7 Liquidity risk (continued)
Liquidity risk is defined as the risk that an entity will encounter difficulty in meeting obligations associated with financial liabilities. Liquidity risk includes the risk that the Funds may not be able to liquidate investments quickly enough at an amount close to their fair values in order to meet their liquidity requirements, or to respond to specific events such as deterioration in the credit worthiness of any particular issuer. Liquidity risk also arises due to the risk that Funds may not be able to pay trade and other payables and distributions payable, in the ordinary course of business. The fund manager is allowed to borrow up to 10% of the market value of the portfolio to bridge insufficient liquidity. The Funds’ financial instruments are considered to be readily realisable. The management company of the Funds is protected by the Act against a dispute with investors of the Funds. Liquidity risk can also occur if a unit holder redeems a significant portion of a Fund. In terms of the Act, the company may ring-fence one or all of the Funds against any redemption that may disadvantage any other holder of participatory interests in those Funds. Each Fund is structured to carry a portion of its investments in cash or cash equivalents in order to provide the necessary liquidity. With the exception of net assets attributed to unit holders, which are payable on demand, all liabilities are payable within 30 days at the carrying value as reported on the statement of financial position.
5. FAIR VALUE OF FINANCIAL INSTRUMENTS
Management considers that the carrying values of financial instruments of all the Funds approximate fair values for the following reasons:
Equities, bonds and investments in other Collective Investment Schemes are valued at quoted closing prices in an active market.
The fair value of money market instruments, including Gilts, longer term Negotiable Certificates of Deposit, Promissory Notes and Treasury Bills, subject to fixed interest rates is determined by discounting the estimated cash flows from the maturity date to the reporting date by the appropriate Money Market Yield Curve adjusted for credit risk of the financial institution.
Debtors’ balances represent debtors for investment sales. These amounts are interest free and are due in cash within the short-term.
Accrued income represents interest and dividends receivable from investments. These investments are either listed on a recognised exchange or with a high quality financial institution and the dividends and interest will be settled in the short-term.
Cash and bank balances represent current and call accounts at highly rated financial institutions, at variable market related interest rates and are available on call to the Funds.
Liabilities’ balances such as trade, fees and distribution payables are interest free and are payable within the short-term.
Net assets attributable to unit holders are payable on demand. The carrying value is the amount that can be called on immediately and is therefore the fair value.
The carrying values of the floating rate money market instruments of Sanlam Money Market Fund approximate the fair values due to the short-term nature of the instruments.
5.1 Fair Value hierarchy
IFRS 13 require fair value measurements to be disclosed by the source of inputs, using a three-level hierarchy. The Funds use the following hierarchy in determining and disclosing the fair value of financial instruments by valuation technique:
Level 1: Quoted (unadjusted) prices in active markets for identical assets and liabilities. This includes the following investment categories as disclosed on the face of the Fund statements of financial position.
Equities and specialist securities – Local
Equities and specialist securities – Foreign
Participatory Interest in Collective Investment Schemes – Local
Participatory Interest in Collective Investment Schemes - Foreign
Bonds - Local
Bonds - Foreign
Level 2: Inputs other than quoted prices (level 1) that are observable for the asset or liability, either directly or indirectly.
This includes the following investment categories as disclosed on the face of the Fund statements of financial position.
Money market instruments
Level 3: Inputs for the asset and liability that are not based on observable market data.
There are no level 3 financial instruments.

SANLAM COLLECTIVE INVESTMENT SCHEME (for the year ended 31 December 2015)
31
6. SCRIPLENDING
Certain Funds engaged in scriplending activities during the year under review. A summary of open positions per portfolio, at 31 December 2015 and 2014 respectively, is listed in the tables below:
Fund nameShare
Code
Price
(cents)Loans Value
SANLAM INSTITUTIONAL SPECIAL
OPPORTUNITIES FUND LEW 54.92 138,030 7,580,608
SANLAM INSTITUTIONAL SPECIAL
OPPORTUNITIES FUND AWA 8.44 30,672 258,872
SANLAM INSTITUTIONAL SPECIAL
OPPORTUNITIES FUND CLR 17 102,179 1,737,043
SANLAM INSTITUTIONAL SPECIAL
OPPORTUNITIES FUND HAR 15.6 1,518,795 23,693,202
SANLAM INSTITUTIONAL SPECIAL
OPPORTUNITIES FUND PNC 12.4 45,000 558,000
SANLAM INSTITUTIONAL SPECIAL
OPPORTUNITIES FUND RFG 23.4 29,757 696,314
1,864,433 34,524,038
SIM PROPERTY FUND FFB 34.83 449,634 15,660,752
SIM PROPERTY FUND RES 115.5 244,633 28,255,112
SIM PROPERTY FUND SAC 4.6 7,340,000 33,764,000
8,034,267 77,679,864
SIM GENERAL EQUITY FUND AVL 2.32 495 1,148
495 1,148
SANLAM STABLE GROWTH FUND KIO 41.2 22,000 906,400
22,000 906,400
SIM BALANCED FUND EXX 44.04 395,202 17,404,696
SIM BALANCED FUND R 186 1.05362 100,000,000 105,362,040
100,395,202 122,766,736
TOTAL 110,316,397 235,878,186
Total collateral placed with Standard
Trustees in respect of securities lent: Cash 247,672,096
Collateral % 105%
2015
Fund nameShare
CodePrice (cents) Loans Value
SANLAM INSTITUTIONAL SPECIAL
OPPORTUNITIES FUND LEW 7 401 400,000 29,604,000
400,000 29,604,000
SIM PROPERTY FUND HYP 9 750 271,000 26,422,500
SIM PROPERTY FUND NEP 11 400 50,000 5,700,000
SIM PROPERTY FUND RDF 1 070 2,602,934 27,851,394
SIM PROPERTY FUND RES 8 399 617,255 51,843,247
3,541,189 111,817,141
SIM BALANCED FUND AIP 4 900 100,000 4,900,000
SIM BALANCED FUND LEW 7 401 200,000 14,802,000
300,000 19,702,000
TOTAL 4,241,189 161,123,141
Total collateral placed with Standard
Trustees in respect of securities lent: Cash 193,957,000
Collateral % 120%
2014

BRACKENHAM SCI MANAGED FUND
2015 2014
R'000 R'000
STATEMENT OF COMPREHENSIVE INCOME FOR THE YEAR ENDED 31 DECEMBER 2015
Income 52 354 8 801
Dividend revenue 7 935 648 Interest revenue 9 533 1 272 Rebates earned 21 2 Income adjustment due to creation and cancellation of participatory interests 290 109 Net fair value gains on financial instruments 34 575 6 770
Expenses 9 370 1 352
Service fees 8 450 1 228 Audit fees 60 22 Withholding tax 170 30 Custodian, trustee and bank charges 106 10 Transaction costs 584 62
Operating profit 42 984 7 449
Finance costs 11 224 700
Distributions to unit holders 11 224 700
Change in net assets attributable to unit holders 31 760 6 749
STATEMENT OF FINANCIAL POSITION AS AT 31 DECEMBER 2015
Assets
Investments 523 691 411 811
Equities and specialist securities - Local 227 426 192 838 Equities and specialist securities - Foreign - 63 004 Participatory Interest in Collective Investment Schemes - Local 173 471 155 969 Participatory Interest in Collective Investment Schemes - Foreign 122 794 -
Accrued income and debtors 716 784
Cash and bank balances 6 060 36 264
Total assets 530 467 448 859
Liabilities 5 229 1 415
Trade and other payables 54 20 Related parties payable 756 644 Distributions payable 4 419 751
Net assets attributable to unit holders 525 238 447 444
Balance at the beginning of the year 447 444 - Change in net assets attributable to unit holders 31 760 6 749 Creation of participatory interests 87 375 447 377 Liquidation of participatory interests (41 341) (6 682)
Balance at the end of the year 525 238 447 444
STATEMENT OF CHANGES IN NET ASSETS ATTRIBUTABLE TO UNIT HOLDERS FOR THE
YEAR ENDED 31 DECEMBER 2015
32
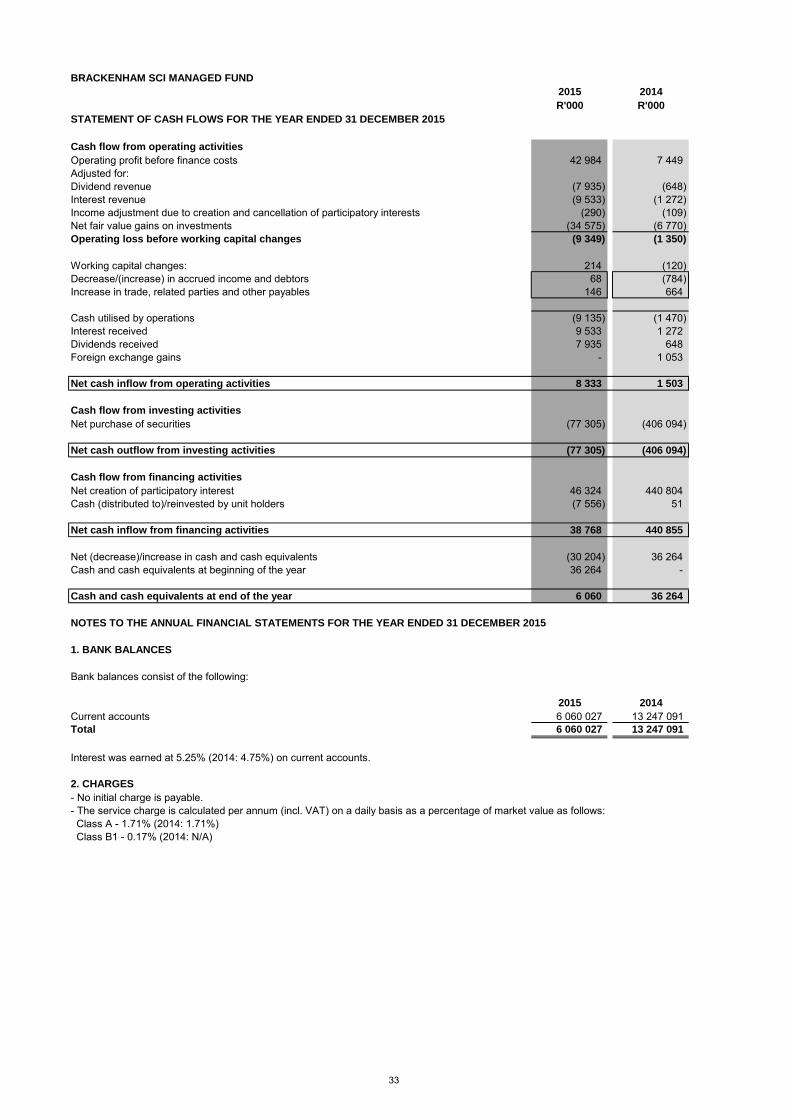
BRACKENHAM SCI MANAGED FUND
2015 2014
R'000 R'000
STATEMENT OF CASH FLOWS FOR THE YEAR ENDED 31 DECEMBER 2015
Cash flow from operating activities
Operating profit before finance costs 42 984 7 449 Adjusted for:Dividend revenue (7 935) (648) Interest revenue (9 533) (1 272) Income adjustment due to creation and cancellation of participatory interests (290) (109) Net fair value gains on investments (34 575) (6 770) Operating loss before working capital changes (9 349) (1 350)
Working capital changes: 214 (120) Decrease/(increase) in accrued income and debtors 68 (784) Increase in trade, related parties and other payables 146 664
Cash utilised by operations (9 135) (1 470) Interest received 9 533 1 272 Dividends received 7 935 648 Foreign exchange gains - 1 053
Net cash inflow from operating activities 8 333 1 503
Cash flow from investing activities
Net purchase of securities (77 305) (406 094)
Net cash outflow from investing activities (77 305) (406 094)
Cash flow from financing activities
Net creation of participatory interest 46 324 440 804 Cash (distributed to)/reinvested by unit holders (7 556) 51
Net cash inflow from financing activities 38 768 440 855
Net (decrease)/increase in cash and cash equivalents (30 204) 36 264 Cash and cash equivalents at beginning of the year 36 264 -
Cash and cash equivalents at end of the year 6 060 36 264
NOTES TO THE ANNUAL FINANCIAL STATEMENTS FOR THE YEAR ENDED 31 DECEMBER 2015
1. BANK BALANCES
Bank balances consist of the following:
2015 2014
Current accounts 6 060 027 13 247 091 Total 6 060 027 13 247 091
Interest was earned at 5.25% (2014: 4.75%) on current accounts.
2. CHARGES
- No initial charge is payable.- The service charge is calculated per annum (incl. VAT) on a daily basis as a percentage of market value as follows: Class A - 1.71% (2014: 1.71%) Class B1 - 0.17% (2014: N/A)
33

FIRST AVENUE SCI EQUITY FUND
2015 2014
R'000 R'000
STATEMENT OF COMPREHENSIVE INCOME FOR THE YEAR ENDED 31 DECEMBER 2015
Income 176 363 195 478
Dividend revenue 58 932 43 167 Interest revenue 3 962 1 899 Income adjustment due to creation and cancellation of participatory interests 1 009 1 596 Net fair value gains on financial instruments 112 460 148 816
Expenses 11 836 5 280
Service fees 4 948 2 213 Performance fees 475 436 Audit fees 98 52 Withholding tax 228 292 Custodian, trustee and bank charges 242 195 Transaction costs 5 845 2 092
Operating profit 164 527 190 198
Finance costs 57 902 43 469
Distributions to unit holders 57 902 43 469
Change in net assets attributable to unit holders 106 625 146 729
STATEMENT OF FINANCIAL POSITION AS AT 31 DECEMBER 2015
Assets
Investments 1 893 718 1 600 486
Equities and specialist securities - Local 1 893 718 1 600 486
Accrued income and debtors 61 67
Cash and bank balances 53 229 63 278
Total assets 1 947 008 1 663 831
Liabilities 21 882 20 828
Trade and other payables 109 62 Related parties payable 738 277 Distributions payable 21 035 20 489
Net assets attributable to unit holders 1 925 126 1 643 003
Balance at the beginning of the year 1 643 003 936 102 Change in net assets attributable to unit holders 106 625 146 729 Creation of participatory interests 428 721 793 005 Liquidation of participatory interests (253 223) (232 833)
Balance at the end of the year 1 925 126 1 643 003
STATEMENT OF CHANGES IN NET ASSETS ATTRIBUTABLE TO UNIT HOLDERS FOR THE
YEAR ENDED 31 DECEMBER 2015
34

FIRST AVENUE SCI EQUITY FUND
2015 2014
R'000 R'000
STATEMENT OF CASH FLOWS FOR THE YEAR ENDED 31 DECEMBER 2015
Cash flow from operating activities
Operating profit before finance costs 164 527 190 198 Adjusted for:Dividend revenue (58 932) (43 167) Interest revenue (3 962) (1 899) Income adjustment due to creation and cancellation of participatory interests (1 009) (1 596) Net fair value gains on investments (112 460) (148 816) Operating loss before working capital changes (11 836) (5 280)
Working capital changes: 514 866 Decrease in accrued income and debtors 6 1 690 Increase/(decrease) in trade, related parties and other payables 508 (824)
Cash utilised by operations (11 322) (4 414) Interest received 3 962 1 899 Dividends received 58 932 43 167
Net cash inflow from operating activities 51 572 40 652
Cash flow from investing activities
Net purchase of securities (180 772) (547 137)
Net cash outflow from investing activities (180 772) (547 137)
Cash flow from financing activities
Net creation of participatory interest 176 507 525 533 Cash (distributed to)/reinvested by units holders (57 356) 7
Net cash inflow from financing activities 119 151 525 540
Net (decrease)/increase in cash and cash equivalents (10 049) 19 055 Cash and cash equivalents at beginning of the year 63 278 44 223
Cash and cash equivalents at end of the year 53 229 63 278
NOTES TO THE ANNUAL FINANCIAL STATEMENTS FOR THE YEAR ENDED 31 DECEMBER 2015
1. BANK BALANCES
Bank balances consist of the following:
2015 2014
Current accounts 53 229 074 63 277 707 Total 53 229 074 63 277 707
Interest was earned at 5.25% (2014: 4.75%) on current accounts.
2. CHARGES
No initial charge is payable.- The service charge is calculated per annum (incl. VAT) on a daily basis as a percentage of market value as follows:
Class B1 - 1.42% (2014: 1.42%)Class B2 - 1.02% (2014: 1.02%)Class B3 - 0% (2014: 0%)Class B4 - 0% (2014: N/A)
35

GRAVITON SCI BALANCED FUND
2015 2014
R'000 R'000
STATEMENT OF COMPREHENSIVE INCOME FOR THE YEAR ENDED 31 DECEMBER 2015
Income 101 555 62 252
Dividend revenue 12 337 6 669 Interest revenue 18 972 8 959 Other income 50 14 Income adjustment due to creation and cancellation of participatory interests (2 556) 4 478 Net fair value gains on financial instruments 72 752 42 132
Expenses 5 129 6 294
Service fees 3 356 4 824 Audit fees 89 67 Withholding tax 122 105 Custodian, trustee and bank charges 476 460 Transaction costs 1 086 838
Operating profit 96 426 55 958
Finance costs 36 037 17 046
Distributions to unit holders 36 037 17 046
Change in net assets attributable to unit holders 60 389 38 912
STATEMENT OF FINANCIAL POSITION AS AT 31 DECEMBER 2015
Assets
Investments 815 035 898 784
Equities and specialist securities - Local 49 918 380 006 Participatory Interest in Collective Investment Schemes - Local 593 267 245 582 Participatory Interest in Collective Investment Schemes - Foreign 166 421 182 772 Bonds - Local 5 295 81 018 Money market instruments 134 9 406
Accrued income and debtors 185 2 645
Cash and bank balances 19 357 48 117
Total assets 834 577 949 546
Liabilities 22 807 14 102
Trade and other payables 1 027 66 Related parties payable 254 923 Distributions payable 21 526 13 113
Net assets attributable to unit holders 811 770 935 444
Balance at the beginning of the year 935 444 317 673 Change in net assets attributable to unit holders 60 389 38 912 Creation of participatory interests 796 126 640 317 Liquidation of participatory interests (980 189) (61 458)
Balance at the end of the year 811 770 935 444
STATEMENT OF CHANGES IN NET ASSETS ATTRIBUTABLE TO UNIT HOLDERS FOR THE
YEAR ENDED 31 DECEMBER 2015
36
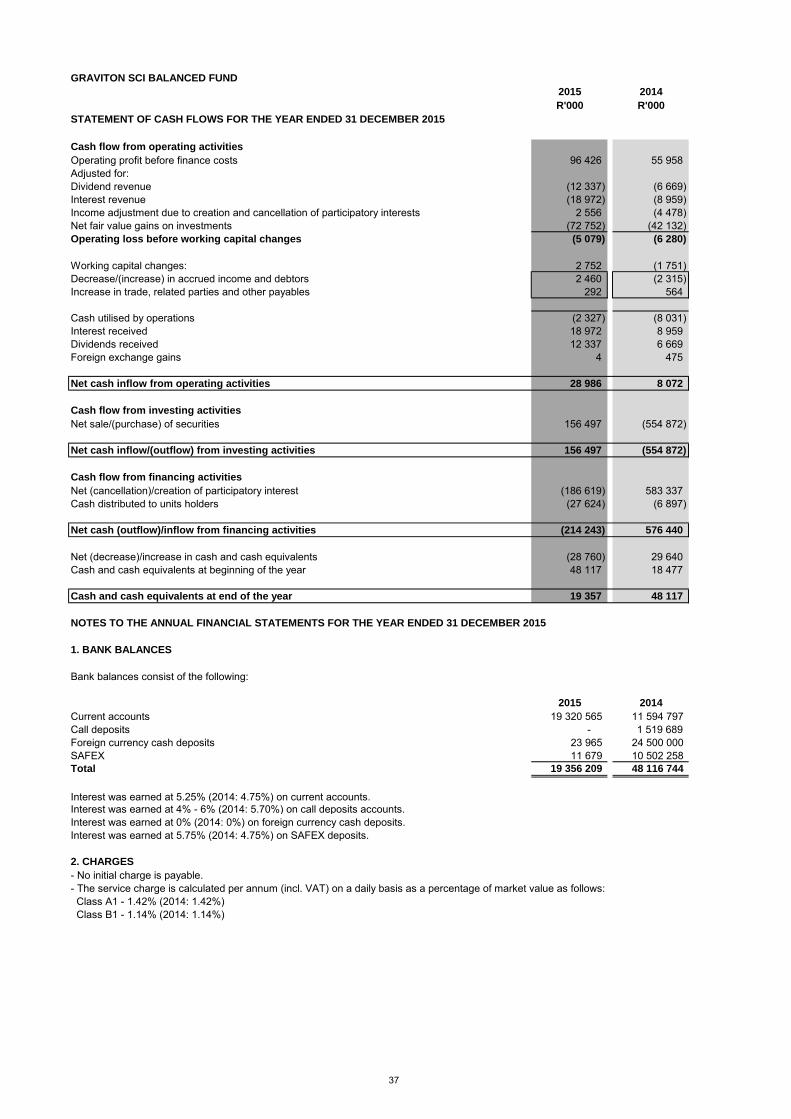
GRAVITON SCI BALANCED FUND
2015 2014
R'000 R'000
STATEMENT OF CASH FLOWS FOR THE YEAR ENDED 31 DECEMBER 2015
Cash flow from operating activities
Operating profit before finance costs 96 426 55 958 Adjusted for:Dividend revenue (12 337) (6 669) Interest revenue (18 972) (8 959) Income adjustment due to creation and cancellation of participatory interests 2 556 (4 478) Net fair value gains on investments (72 752) (42 132) Operating loss before working capital changes (5 079) (6 280)
Working capital changes: 2 752 (1 751) Decrease/(increase) in accrued income and debtors 2 460 (2 315) Increase in trade, related parties and other payables 292 564
Cash utilised by operations (2 327) (8 031) Interest received 18 972 8 959 Dividends received 12 337 6 669 Foreign exchange gains 4 475
Net cash inflow from operating activities 28 986 8 072
Cash flow from investing activities
Net sale/(purchase) of securities 156 497 (554 872)
Net cash inflow/(outflow) from investing activities 156 497 (554 872)
Cash flow from financing activities
Net (cancellation)/creation of participatory interest (186 619) 583 337 Cash distributed to units holders (27 624) (6 897)
Net cash (outflow)/inflow from financing activities (214 243) 576 440
Net (decrease)/increase in cash and cash equivalents (28 760) 29 640 Cash and cash equivalents at beginning of the year 48 117 18 477
Cash and cash equivalents at end of the year 19 357 48 117
NOTES TO THE ANNUAL FINANCIAL STATEMENTS FOR THE YEAR ENDED 31 DECEMBER 2015
1. BANK BALANCES
Bank balances consist of the following:
2015 2014
Current accounts 19 320 565 11 594 797 Call deposits - 1 519 689 Foreign currency cash deposits 23 965 24 500 000 SAFEX 11 679 10 502 258 Total 19 356 209 48 116 744
Interest was earned at 5.25% (2014: 4.75%) on current accounts.Interest was earned at 4% - 6% (2014: 5.70%) on call deposits accounts.Interest was earned at 0% (2014: 0%) on foreign currency cash deposits.Interest was earned at 5.75% (2014: 4.75%) on SAFEX deposits.
2. CHARGES
- No initial charge is payable.- The service charge is calculated per annum (incl. VAT) on a daily basis as a percentage of market value as follows: Class A1 - 1.42% (2014: 1.42%) Class B1 - 1.14% (2014: 1.14%)
37

GRAVITON SCI CAPITAL GROWTH FUND
2015 2014
R'000 R'000
STATEMENT OF COMPREHENSIVE INCOME FOR THE YEAR ENDED 31 DECEMBER 2015
Income 55 656 70 829
Dividend revenue 7 964 8 834 Interest revenue 12 515 14 964 Other income 39 7 Income adjustment due to cancellation of participatory interests (10 184) (249) Net fair value gains on financial instruments 45 322 47 273
Expenses 6 734 7 179
Service fees 5 953 6 603 Audit fees 72 46 Withholding tax 76 71 Custodian, trustee and bank charges 154 204 Transaction costs 479 255
Operating profit 48 922 63 650
Finance costs 12 674 16 534
Distributions to unit holders 12 674 16 534
Change in net assets attributable to unit holders 36 248 47 116
STATEMENT OF FINANCIAL POSITION AS AT 31 DECEMBER 2015
Assets
Investments 109 259 722 435
Equities and specialist securities - Local 11 899 266 356 Participatory Interest in Collective Investment Schemes - Local 68 631 182 761 Participatory Interest in Collective Investment Schemes - Foreign 24 003 169 407 Bonds - Local 4 726 100 906 Money market instruments - 3 005
Accrued income and debtors 149 1 948
Cash and bank balances 9 464 25 229
Total assets 118 872 749 612
Liabilities 4 745 9 171
Trade and other payables 78 56 Related parties payable 114 723 Distributions payable 4 553 8 392
Net assets attributable to unit holders 114 127 740 441
Balance at the beginning of the year 740 441 656 200 Change in net assets attributable to unit holders 36 248 47 116 Creation of participatory interests 117 012 221 866 Liquidation of participatory interests (779 574) (184 741)
Balance at the end of the year 114 127 740 441
STATEMENT OF CHANGES IN NET ASSETS ATTRIBUTABLE TO UNIT HOLDERS FOR THE
YEAR ENDED 31 DECEMBER 2015
38
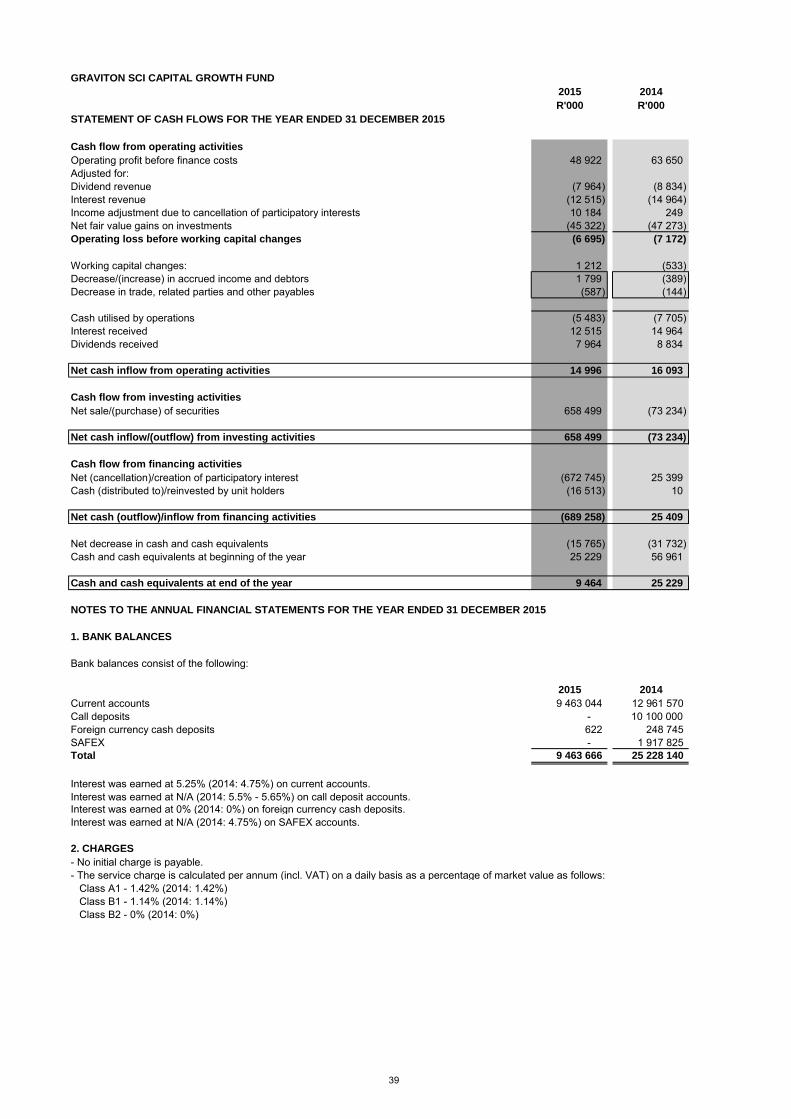
GRAVITON SCI CAPITAL GROWTH FUND
2015 2014
R'000 R'000
STATEMENT OF CASH FLOWS FOR THE YEAR ENDED 31 DECEMBER 2015
Cash flow from operating activities
Operating profit before finance costs 48 922 63 650 Adjusted for:Dividend revenue (7 964) (8 834) Interest revenue (12 515) (14 964) Income adjustment due to cancellation of participatory interests 10 184 249 Net fair value gains on investments (45 322) (47 273) Operating loss before working capital changes (6 695) (7 172)
Working capital changes: 1 212 (533) Decrease/(increase) in accrued income and debtors 1 799 (389) Decrease in trade, related parties and other payables (587) (144)
Cash utilised by operations (5 483) (7 705) Interest received 12 515 14 964 Dividends received 7 964 8 834
Net cash inflow from operating activities 14 996 16 093
Cash flow from investing activities
Net sale/(purchase) of securities 658 499 (73 234)
Net cash inflow/(outflow) from investing activities 658 499 (73 234)
Cash flow from financing activities
Net (cancellation)/creation of participatory interest (672 745) 25 399 Cash (distributed to)/reinvested by unit holders (16 513) 10
Net cash (outflow)/inflow from financing activities (689 258) 25 409
Net decrease in cash and cash equivalents (15 765) (31 732) Cash and cash equivalents at beginning of the year 25 229 56 961
Cash and cash equivalents at end of the year 9 464 25 229
NOTES TO THE ANNUAL FINANCIAL STATEMENTS FOR THE YEAR ENDED 31 DECEMBER 2015
1. BANK BALANCES
Bank balances consist of the following:
2015 2014
Current accounts 9 463 044 12 961 570 Call deposits - 10 100 000 Foreign currency cash deposits 622 248 745 SAFEX - 1 917 825 Total 9 463 666 25 228 140
Interest was earned at 5.25% (2014: 4.75%) on current accounts.Interest was earned at N/A (2014: 5.5% - 5.65%) on call deposit accounts.Interest was earned at 0% (2014: 0%) on foreign currency cash deposits.Interest was earned at N/A (2014: 4.75%) on SAFEX accounts.
2. CHARGES
- No initial charge is payable.- The service charge is calculated per annum (incl. VAT) on a daily basis as a percentage of market value as follows: Class A1 - 1.42% (2014: 1.42%) Class B1 - 1.14% (2014: 1.14%) Class B2 - 0% (2014: 0%)
39
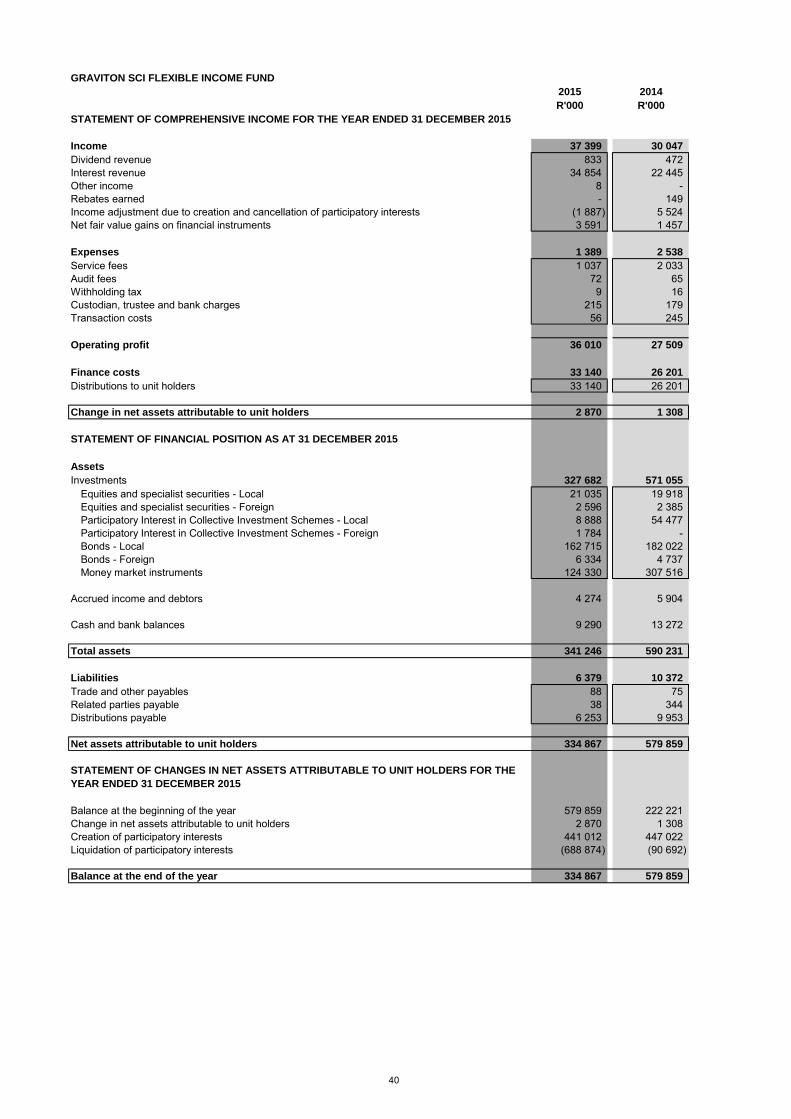
GRAVITON SCI FLEXIBLE INCOME FUND
2015 2014
R'000 R'000
STATEMENT OF COMPREHENSIVE INCOME FOR THE YEAR ENDED 31 DECEMBER 2015
Income 37 399 30 047
Dividend revenue 833 472 Interest revenue 34 854 22 445 Other income 8 - Rebates earned - 149 Income adjustment due to creation and cancellation of participatory interests (1 887) 5 524 Net fair value gains on financial instruments 3 591 1 457
Expenses 1 389 2 538
Service fees 1 037 2 033 Audit fees 72 65 Withholding tax 9 16 Custodian, trustee and bank charges 215 179 Transaction costs 56 245
Operating profit 36 010 27 509
Finance costs 33 140 26 201
Distributions to unit holders 33 140 26 201
Change in net assets attributable to unit holders 2 870 1 308
STATEMENT OF FINANCIAL POSITION AS AT 31 DECEMBER 2015
Assets
Investments 327 682 571 055
Equities and specialist securities - Local 21 035 19 918 Equities and specialist securities - Foreign 2 596 2 385 Participatory Interest in Collective Investment Schemes - Local 8 888 54 477 Participatory Interest in Collective Investment Schemes - Foreign 1 784 - Bonds - Local 162 715 182 022 Bonds - Foreign 6 334 4 737 Money market instruments 124 330 307 516
Accrued income and debtors 4 274 5 904
Cash and bank balances 9 290 13 272
Total assets 341 246 590 231
Liabilities 6 379 10 372
Trade and other payables 88 75 Related parties payable 38 344 Distributions payable 6 253 9 953
Net assets attributable to unit holders 334 867 579 859
Balance at the beginning of the year 579 859 222 221 Change in net assets attributable to unit holders 2 870 1 308 Creation of participatory interests 441 012 447 022 Liquidation of participatory interests (688 874) (90 692)
Balance at the end of the year 334 867 579 859
STATEMENT OF CHANGES IN NET ASSETS ATTRIBUTABLE TO UNIT HOLDERS FOR THE
YEAR ENDED 31 DECEMBER 2015
40

GRAVITON SCI FLEXIBLE INCOME FUND
2015 2014
R'000 R'000
STATEMENT OF CASH FLOWS FOR THE YEAR ENDED 31 DECEMBER 2015
Cash flow from operating activities
Operating profit before finance costs 36 010 27 509 Adjusted for:Dividend revenue (833) (472) Interest revenue (34 854) (22 445) Income adjustment due to creation and cancellation of participatory interests 1 887 (5 524) Net fair value gains on investments (3 591) (1 457) Operating loss before working capital changes (1 381) (2 389)
Working capital changes: 1 337 (4 552) Decrease/(increase) in accrued income and debtors 1 630 (4 737) (Decrease)/increase in trade, related parties and other payables (293) 185
Cash utilised by operations (44) (6 941) Interest received 34 854 22 445 Dividends received 833 472 Foreign exchange gains/(losses) 175 (4)
Net cash inflow from operating activities 35 818 15 972
Cash flow from investing activities
Net sale/(purchase) of securities 246 789 (354 965)
Net cash inflow/(outflow) from investing activities 246 789 (354 965)
Cash flow from financing activities
Net (cancellation)/creation of participatory interest (249 749) 342 388 Cash distributed to unit holders (36 840) (108)
Net cash (outflow)/inflow from financing activities (286 589) 342 280
Net (decrease)/increase in cash and cash equivalents (3 982) 3 287 Cash and cash equivalents at beginning of the year 13 272 9 985
Cash and cash equivalents at end of the year 9 290 13 272
NOTES TO THE ANNUAL FINANCIAL STATEMENTS FOR THE YEAR ENDED 31 DECEMBER 2015
1. BANK BALANCES
Bank balances consist of the following:
2015 2014
Current accounts 2 647 558 5 604 157 Call deposits 837 902 616 719 Foreign currency cash deposits 2 930 771 6 200 000 SAFEX 2 872 671 851 154 Total 9 288 902 13 272 030
Interest was earned at 5.25% (2014: 4.75%) on current accounts.Interest was earned at 6.20% (2014: 5.70%) on call deposit accounts.Interest was earned at 0% (2014: 0%) on foreign currency cash deposits.Interest was earned at 5.75% (2014: 4.75%) on SAFEX deposits.
2. CHARGES
- No initial charge is payable.- The service charge is calculated per annum (incl. VAT) on a daily basis as a percentage of market value as follows: Class A1 - 1.08% (2014: 1.08%) Class B1 - 0.68% (2014: 0.68%) Class B2 - 0% (2014: 0%)
41

GRAVITON SCI LOW EQUITY FUND
2015 2014
R'000 R'000
STATEMENT OF COMPREHENSIVE INCOME FOR THE YEAR ENDED 31 DECEMBER 2015
Income 84 742 80 206
Dividend revenue 5 839 5 629 Interest revenue 29 136 23 511 Other income 16 2 Rebates earned 615 527 Income adjustment due to creation and cancellation of participatory interests (10 189) 2 334 Net fair value gains on financial instruments 59 325 48 203
Expenses 5 090 7 858
Service fees 4 112 6 930 Audit fees 73 57 Withholding tax 49 151 Custodian, trustee and bank charges 473 346 Transaction costs 383 374
Operating profit 79 652 72 348
Finance costs 33 302 26 965
Distributions to unit holders 33 302 26 965
Change in net assets attributable to unit holders 46 350 45 383
STATEMENT OF FINANCIAL POSITION AS AT 31 DECEMBER 2015
Assets
Investments 327 066 975 497
Equities and specialist securities - Local 14 500 184 813 Equities and specialist securities - Foreign - 1 658 Participatory Interest in Collective Investment Schemes - Local 244 763 346 575 Participatory Interest in Collective Investment Schemes - Foreign 46 314 177 403 Bonds - Local 9 186 241 385 Money market instruments 12 303 23 663
Accrued income and debtors 396 4 780
Cash and bank balances 94 340 57 837
Total assets 421 802 1 038 114
Liabilities 16 614 18 291
Trade and other payables 78 63 Related parties payable 50 1 007 Distributions payable 16 486 17 221
Net assets attributable to unit holders 405 188 1 019 823
Balance at the beginning of the year 1 019 823 722 286 Change in net assets attributable to unit holders 46 350 45 383 Creation of participatory interests 454 840 403 201 Liquidation of participatory interests (1 115 825) (151 047)
Balance at the end of the year 405 188 1 019 823
STATEMENT OF CHANGES IN NET ASSETS ATTRIBUTABLE TO UNIT HOLDERS FOR THE
YEAR ENDED 31 DECEMBER 2015
42

GRAVITON SCI LOW EQUITY FUND
2015 2014
R'000 R'000
STATEMENT OF CASH FLOWS FOR THE YEAR ENDED 31 DECEMBER 2015
Cash flow from operating activities
Operating profit before finance costs 79 652 72 348 Adjusted for:Dividend revenue (5 839) (5 629) Interest revenue (29 136) (23 511) Income adjustment due to creation and cancellation of participatory interests 10 189 (2 334) Net fair value gains on investments (59 325) (48 203) Operating loss before working capital changes (4 459) (7 329)
Working capital changes: 3 442 (1 754) Decrease/(increase) in accrued income and debtors 4 384 (1 927) (Decrease)/increase in trade, related parties and other payables (942) 173
Cash utilised by operations (1 017) (9 083) Interest received 29 136 23 511 Dividends received 5 839 5 629 Foreign exchange gains 1 644 308
Net cash inflow from operating activities 35 602 20 365
Cash flow from investing activities
Net sale/(purchase) of securities 706 112 (212 332)
Net cash inflow/(outflow) from investing activities 706 112 (212 332)
Cash flow from financing activities
Net (cancellation)/creation of participatory interest (671 174) 236 159 Cash (distributed to)/reinvested by unit holders (34 037) 17
Net cash (outflow)/inflow from financing activities (705 211) 236 176
Net increase in cash and cash equivalents 36 503 44 209 Cash and cash equivalents at beginning of the year 57 837 13 628
Cash and cash equivalents at end of the year 94 340 57 837
NOTES TO THE ANNUAL FINANCIAL STATEMENTS FOR THE YEAR ENDED 31 DECEMBER 2015
1. BANK BALANCES
Bank balances consist of the following:
2015 2014
Current accounts 65 772 182 20 379 578 Call deposits 145 743 20 817 547 Foreign currency cash deposits 28 421 988 14 073 741 SAFEX - 2 566 292 Total 94 339 913 57 837 158
Interest was earned at 5.25% (2014: 4.75%) on current accounts.Interest was earned at N/A (2014: 5-6%) on call deposit accounts.Interest was earned at 0% (2014: 0%) on foreign currency cash deposits.Interest was earned at 5.75% (2014: 4.75%) on SAFEX accounts.
2. CHARGES
- No initial charge is payable.- The service charge is calculated per annum (incl. VAT) on a daily basis as a percentage of market value as follows: Class A1 - 1.42% (2014: 1.42%) Class B1 - 1.14% (2014: 1.14%) Class B2 - 0% (2014: 0%)
43

LYNX SCI BALANCED FUND OF FUNDS
2015 2014
R'000 R'000
STATEMENT OF COMPREHENSIVE INCOME FOR THE YEAR ENDED 31 DECEMBER 2015
Income 52 858 62 699
Dividend revenue 3 852 6 726 Interest revenue 11 665 12 014 Other income - 4 Rebates earned 823 826 Income adjustment due to creation and cancellation of participatory interests (182) (149) Net fair value gains on financial instruments 36 700 43 278
Expenses 10 038 17 928
Service fees 9 522 11 952 Performance fees 369 5 664 Audit fees 50 65 Withholding tax 58 202 Custodian, trustee and bank charges 39 45
Operating profit 42 820 44 771
Finance costs 6 116 1 513
Distributions to unit holders 6 116 1 513
Change in net assets attributable to unit holders 36 704 43 258
STATEMENT OF FINANCIAL POSITION AS AT 31 DECEMBER 2015
Assets
Investments 447 937 458 764
Participatory Interest in Collective Investment Schemes - Local 447 937 458 764
Accrued income and debtors 4 7
Cash and bank balances 3 531 7 818
Total assets 451 472 466 589
Liabilities 4 296 1 058
Trade and other payables 58 68 Related parties payable 788 828 Distributions payable 3 450 162
Net assets attributable to unit holders 447 176 465 531
Balance at the beginning of the year 465 531 654 917 Change in net assets attributable to unit holders 36 704 43 258 Creation of participatory interests 27 689 40 925 Liquidation of participatory interests (82 748) (273 569)
Balance at the end of the year 447 176 465 531
STATEMENT OF CHANGES IN NET ASSETS ATTRIBUTABLE TO UNIT HOLDERS FOR THE
YEAR ENDED 31 DECEMBER 2015
44

LYNX SCI BALANCED FUND OF FUNDS
2015 2014
R'000 R'000
STATEMENT OF CASH FLOWS FOR THE YEAR ENDED 31 DECEMBER 2015
Cash flow from operating activities
Operating profit before finance costs 42 820 44 771 Adjusted for:Dividend revenue (3 852) (6 726) Interest revenue (11 665) (12 014) Income adjustment due to creation and cancellation of participatory interests 182 149 Net fair value gains on investments (36 700) (43 278) Operating loss before working capital changes (9 215) (17 098)
Working capital changes: (47) (1 254) Decrease in accrued income and debtors 3 68 Decrease in trade, related parties and other payables (50) (1 322)
Cash utilised by operations (9 262) (18 352) Interest received 11 665 12 014 Dividends received 3 852 6 726
Net cash inflow from operating activities 6 255 388
Cash flow from investing activities
Net sale of securities 47 527 155 578
Net cash inflow from investing activities 47 527 155 578
Cash flow from financing activities
Net cancellation of participatory interest (55 241) (234 097) Cash distributed to unit holders (2 828) (47)
Net cash outflow from financing activities (58 069) (234 144)
Net decrease in cash and cash equivalents (4 287) (78 178) Cash and cash equivalents at beginning of the year 7 818 85 996
Cash and cash equivalents at end of the year 3 531 7 818
NOTES TO THE ANNUAL FINANCIAL STATEMENTS FOR THE YEAR ENDED 31 DECEMBER 2015
1. BANK BALANCES
Bank balances consist of the following:
2015 2014
Current accounts 3 530 557 7 818 192 Total 3 530 557 7 818 192
Interest was earned at 5.25% (2014: 4.75%) on current accounts.
2. CHARGES
- No initial charge is payable.- The service charge is calculated per annum (incl. VAT) on a daily basis as a percentage of market value as follows: Class A1 - 0.79% (2014: 0.79%) Class A2 - 0.79% (2014: 0.79%) Class B1 - 1.14% (2014: 1.14%) Class C1 - 2.16% (2014: 2.16%) Class C2 - 2.16% (2014: 2.16%)
45

LYNX SCI CAUTIOUS FUND OF FUNDS
2015 2014
R'000 R'000
STATEMENT OF COMPREHENSIVE INCOME FOR THE YEAR ENDED 31 DECEMBER 2015
Income 25 017 33 243
Dividend revenue 1 260 2 104 Interest revenue 7 131 15 471 Other income - 6 Rebates earned 470 991 Income adjustment due to creation and cancellation of participatory interests (203) (519) Net fair value gains on financial instruments 16 359 15 190
Expenses 4 042 10 099
Service fees 3 876 8 395 Performance fees 86 1 489 Audit fees 49 65 Withholding tax 6 116 Custodian, trustee and bank charges 25 34
Operating profit 20 975 23 144
Finance costs 4 618 7 954
Distributions to unit holders 4 618 7 954
Change in net assets attributable to unit holders 16 357 15 190
STATEMENT OF FINANCIAL POSITION AS AT 31 DECEMBER 2015
Assets
Investments 183 912 205 175
Participatory Interest in Collective Investment Schemes - Local 183 912 205 175
Accrued income and debtors 4 3
Cash and bank balances 3 538 3 548
Total assets 187 454 208 726
Liabilities 2 670 1 998
Trade and other payables 57 67 Related parties payable 304 369 Distributions payable 2 309 1 562
Net assets attributable to unit holders 184 784 206 728
Balance at the beginning of the year 206 728 491 114 Change in net assets attributable to unit holders 16 357 15 190 Creation of participatory interests 27 743 73 750 Liquidation of participatory interests (66 044) (373 326)
Balance at the end of the year 184 784 206 728
STATEMENT OF CHANGES IN NET ASSETS ATTRIBUTABLE TO UNIT HOLDERS FOR THE
YEAR ENDED 31 DECEMBER 2015
46

LYNX SCI CAUTIOUS FUND OF FUNDS
2015 2014
R'000 R'000
STATEMENT OF CASH FLOWS FOR THE YEAR ENDED 31 DECEMBER 2015
Cash flow from operating activities
Operating profit before finance costs 20 975 23 144 Adjusted for:Dividend revenue (1 260) (2 104) Interest revenue (7 131) (15 471) Income adjustment due to creation and cancellation of participatory interests 203 519 Net fair value gains on investments (16 359) (15 190) Operating loss before working capital changes (3 572) (9 102)
Working capital changes: (76) (854) (Increase)/decrease in accrued income and debtors (1) 34 Decrease in trade, related parties and other payables (75) (888)
Cash utilised by operations (3 648) (9 956) Interest received 7 131 15 471 Dividends received 1 260 2 104
Net cash inflow from operating activities 4 743 7 619
Cash flow from investing activities
Net sale of securities 37 622 260 573
Net cash inflow from investing activities 37 622 260 573
Cash flow from financing activities
Net cancellation of participatory interest (38 504) (300 095) Cash distributed to unit holders (3 871) (7 159)
Net cash outflow from financing activities (42 375) (307 254)
Net decrease in cash and cash equivalents (10) (39 062) Cash and cash equivalents at beginning of the year 3 548 42 610
Cash and cash equivalents at end of the year 3 538 3 548
NOTES TO THE ANNUAL FINANCIAL STATEMENTS FOR THE YEAR ENDED 31 DECEMBER 2015
1. BANK BALANCES
Bank balances consist of the following:
2015 2014
Current accounts 3 537 521 3 547 714 Total 3 537 521 3 547 714
Interest was earned at 5.25% (2014: 4.75%) on current accounts.
2. CHARGES
No initial charge is payable.- The service charge is calculated per annum (incl. VAT) on a daily basis as a percentage of market value as follows: Class A1 - 0.79% (2014: 0.79%) Class A2 - 0.79% (2014: 0.79%) Class B1 - 1.14% (2014: 1.14%) Class C1 - 2.16% (2014: 2.16%) Class C2 - 2.16% (2014: 2.16%)
47

LYNX SCI GLOBAL DIVERSIFIED FUND OF FUNDS
2015 2014
R'000 R'000
STATEMENT OF COMPREHENSIVE INCOME FOR THE YEAR ENDED 31 DECEMBER 2015
Income 96 620 34 923
Dividend revenue 1 732 1 061 Interest revenue 1 170 1 508 Other income (254) - Rebates earned 423 210 Income adjustment due to creation and cancellation of participatory interests (293) (120) Net fair value gains on financial instruments 93 842 32 264
Expenses 5 963 6 374
Service fees 5 576 4 822 Performance fees - 1 213 Audit fees 50 59 Withholding tax 275 192 Custodian, trustee and bank charges 38 35 Transaction costs 24 53
Operating profit 90 657 28 549
Finance costs - 35
Distributions to unit holders - 35
Change in net assets attributable to unit holders 90 657 28 514
STATEMENT OF FINANCIAL POSITION AS AT 31 DECEMBER 2015
Assets
Investments 423 546 344 002
Equities and specialist securities - Local 83 443 52 834 Participatory Interest in Collective Investment Schemes - Local 201 657 161 824 Participatory Interest in Collective Investment Schemes - Foreign 138 446 129 344
Accrued income and debtors 29 4
Cash and bank balances 19 148 4 781
Total assets 442 723 348 787
Liabilities 634 529
Trade and other payables 57 61 Related parties payable 577 432 Distributions payable - 36
Net assets attributable to unit holders 442 089 348 258
Balance at the beginning of the year 348 258 335 698 Change in net assets attributable to unit holders 90 657 28 514 Creation of participatory interests 77 504 98 394 Liquidation of participatory interests (74 330) (114 348)
Balance at the end of the year 442 089 348 258
STATEMENT OF CHANGES IN NET ASSETS ATTRIBUTABLE TO UNIT HOLDERS FOR THE
YEAR ENDED 31 DECEMBER 2015
48

LYNX SCI GLOBAL DIVERSIFIED FUND OF FUNDS
2015 2014
R'000 R'000
STATEMENT OF CASH FLOWS FOR THE YEAR ENDED 31 DECEMBER 2015
Cash flow from operating activities
Operating profit before finance costs 90 657 28 549 Adjusted for:Dividend revenue (1 732) (1 061) Interest revenue (1 170) (1 508) Income adjustment due to creation and cancellation of participatory interests 293 120 Net fair value gains on investments (93 842) (32 264) Operating loss before working capital changes (5 794) (6 164)
Working capital changes: 116 (591) Increase in accrued income and debtors (25) (4) Increase/(decrease) in trade, related parties and other payables 141 (587)
Cash utilised by operations (5 678) (6 755) Interest received 1 170 1 508 Dividends received 1 732 1 061 Foreign exchange gains 32 -
Net cash outflow from operating activities (2 744) (4 186)
Cash flow from investing activities
Net sale of securities 14 266 17 580
Net cash inflow from investing activities 14 266 17 580
Cash flow from financing activities
Net creation/(cancellation) of participatory interest 2 881 (16 700) Cash (distributed to)/reinvested by unit holders (36) 1
Net cash inflow/(outflow) from financing activities 2 845 (16 699)
Net increase/(decrease) in cash and cash equivalents 14 367 (3 305) Cash and cash equivalents at beginning of the year 4 781 8 086
Cash and cash equivalents at end of the year 19 148 4 781
NOTES TO THE ANNUAL FINANCIAL STATEMENTS FOR THE YEAR ENDED 31 DECEMBER 2015
1. BANK BALANCES
Bank balances consist of the following:
2015 2014
Current accounts 18 912 027 4 773 601 Foreign currency cash deposits 235 658 7 039 Total 19 147 685 4 780 640
Interest was earned at 5.25% (2014: 4.75%) on current accounts.Interest was earned at 0% (2014: 0%) on foreign currency cash deposits.
2. CHARGES
- No initial charge is payable.- The service charge is calculated per annum (incl. VAT) on a daily basis as a percentage of market value as follows: Class A1 - 1.65% (2014: 1.65%) Class B - 0.79% (2014: 0.79%) Class B1 - 1.14% (2014: 1.14%) Class C1 - 2.16% (2014: 2.16%)
49

LYNX SCI OPPORTUNITIES FUND OF FUNDS
2015 2014
R'000 R'000
STATEMENT OF COMPREHENSIVE INCOME FOR THE YEAR ENDED 31 DECEMBER 2015
Income 4 838 7 378
Dividend revenue 1 098 950 Interest revenue 242 180 Rebates earned 14 53 Income adjustment due to creation and cancellation of participatory interests 27 (1) Net fair value gains on financial instruments 3 457 6 196
Expenses 1 352 1 391
Service fees 1 276 1 286 Performance fees 2 - Audit fees 35 52 Withholding tax 15 12 Custodian, trustee and bank charges 24 25 Transaction costs - 16
Operating profit 3 486 5 987
Finance costs 66 41
Distributions to unit holders 66 41
Change in net assets attributable to unit holders 3 420 5 946
STATEMENT OF FINANCIAL POSITION AS AT 31 DECEMBER 2015
Assets
Investments 59 837 59 480
Participatory Interest in Collective Investment Schemes - Local 59 837 59 480
Accrued income and debtors 3 1
Cash and bank balances 2 340 1 209
Total assets 62 180 60 690
Liabilities 186 165
Trade and other payables 41 54 Related parties payable 105 105 Distributions payable 40 6
Net assets attributable to unit holders 61 994 60 525
Balance at the beginning of the year 60 525 63 113 Change in net assets attributable to unit holders 3 420 5 946 Creation of participatory interests 3 427 564 Liquidation of participatory interests (5 378) (9 098)
Balance at the end of the year 61 994 60 525
STATEMENT OF CHANGES IN NET ASSETS ATTRIBUTABLE TO UNIT HOLDERS FOR THE
YEAR ENDED 31 DECEMBER 2015
50

LYNX SCI OPPORTUNITIES FUND OF FUNDS
2015 2014
R'000 R'000
STATEMENT OF CASH FLOWS FOR THE YEAR ENDED 31 DECEMBER 2015
Cash flow from operating activities
Operating profit before finance costs 3 486 5 987 Adjusted for:Dividend revenue (1 098) (950) Interest revenue (242) (180) Income adjustment due to creation and cancellation of participatory interests (27) 1 Net fair value gains on investments (3 457) (6 196) Operating loss before working capital changes (1 338) (1 338)
Working capital changes: (15) 6 (Increase)/decrease in accrued income and debtors (2) 1 (Decrease)/increase in trade, related parties and other payables (13) 5
Cash utilised by operations (1 353) (1 332) Interest received 242 180 Dividends received 1 098 950
Net cash outflow from operating activities (13) (202)
Cash flow from investing activities
Net sale of securities 3 100 8 272
Net cash inflow from investing activities 3 100 8 272
Cash flow from financing activities
Net cancellation of participatory interest (1 924) (8 569) Cash distributed to unit holders (32) (1)
Net cash outflow from financing activities (1 956) (8 570)
Net increase/(decrease) in cash and cash equivalents 1 131 (500) Cash and cash equivalents at beginning of the year 1 209 1 709
Cash and cash equivalents at end of the year 2 340 1 209
NOTES TO THE ANNUAL FINANCIAL STATEMENTS FOR THE YEAR ENDED 31 DECEMBER 2015
1. BANK BALANCES
Bank balances consist of the following:
2015 2014
Current accounts 2 339 737 1 209 466 Total 2 339 737 1 209 466
Interest was earned at 5.25% (2014: 4.75%) on current accounts.
2. CHARGES
- No initial charge is payable.- The service charge is calculated per annum (incl. VAT) on a daily basis as a percentage of market value as follows: Class A1 - 0.79% (2014: 0.79%) Class A2 - 0.79% (2014: 0.79%) Class B1 - 1.14% (2014: 1.14%) Class C1 - 2.16% (2014: 2.16%) Class C2 - 2.16% (2014: 2.16%)
51
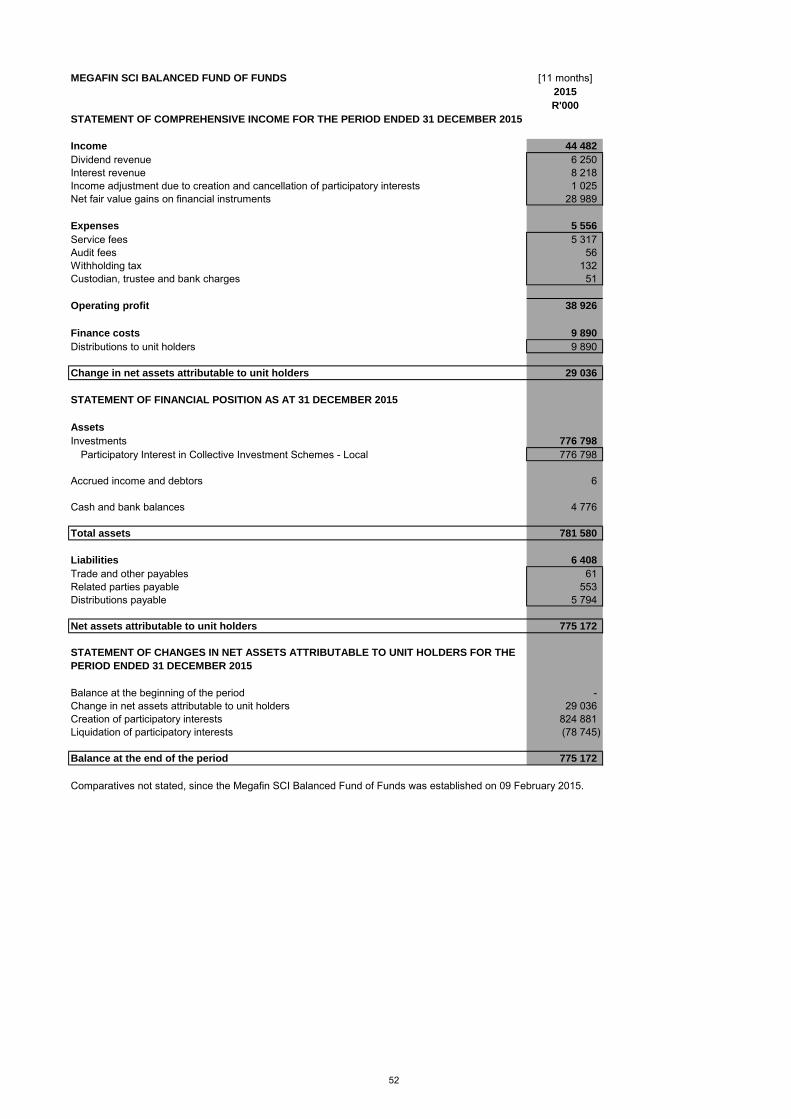
MEGAFIN SCI BALANCED FUND OF FUNDS [11 months]2015
R'000
STATEMENT OF COMPREHENSIVE INCOME FOR THE PERIOD ENDED 31 DECEMBER 2015
Income 44 482
Dividend revenue 6 250 Interest revenue 8 218 Income adjustment due to creation and cancellation of participatory interests 1 025 Net fair value gains on financial instruments 28 989
Expenses 5 556
Service fees 5 317 Audit fees 56 Withholding tax 132 Custodian, trustee and bank charges 51
Operating profit 38 926
Finance costs 9 890
Distributions to unit holders 9 890
Change in net assets attributable to unit holders 29 036
STATEMENT OF FINANCIAL POSITION AS AT 31 DECEMBER 2015
Assets
Investments 776 798
Participatory Interest in Collective Investment Schemes - Local 776 798
Accrued income and debtors 6
Cash and bank balances 4 776
Total assets 781 580
Liabilities 6 408
Trade and other payables 61 Related parties payable 553 Distributions payable 5 794
Net assets attributable to unit holders 775 172
Balance at the beginning of the period - Change in net assets attributable to unit holders 29 036 Creation of participatory interests 824 881 Liquidation of participatory interests (78 745)
Balance at the end of the period 775 172
Comparatives not stated, since the Megafin SCI Balanced Fund of Funds was established on 09 February 2015.
STATEMENT OF CHANGES IN NET ASSETS ATTRIBUTABLE TO UNIT HOLDERS FOR THE
PERIOD ENDED 31 DECEMBER 2015
52

MEGAFIN SCI BALANCED FUND OF FUNDS [11 months]2015
R'000
STATEMENT OF CASH FLOWS FOR THE PERIOD ENDED 31 DECEMBER 2015
Cash flow from operating activities
Operating profit before finance costs 38 926 Adjusted for:Dividend revenue (6 250) Interest revenue (8 218) Income adjustment due to creation and cancellation of participatory interests (1 025) Net fair value gains on investments (28 989) Operating loss before working capital changes (5 556)
Working capital changes: 608 Increase in accrued income and debtors (6) Increase in trade, related parties and other payables 614
Cash utilised by operations (4 948) Interest received 8 218 Dividends received 6 250
Net cash inflow from operating activities 9 520
Cash flow from investing activities
Net purchase of securities (747 809)
Net cash outflow from investing activities (747 809)
Cash flow from financing activities
Net creation of participatory interest 747 161 Cash distributed to units holders (4 096)
Net cash inflow from financing activities 743 065
Net increase in cash and cash equivalents 4 776 Cash and cash equivalents at beginning of the period -
Cash and cash equivalents at end of the period 4 776
NOTES TO THE ANNUAL FINANCIAL STATEMENTS FOR THE PERIOD ENDED 31 DECEMBER 2015
1. BANK BALANCES
Bank balances consist of the following:
2015
Current accounts 4 775 845 Total 4 775 845
Interest was earned at 5.25% (2014: N/A) on current accounts.
2. CHARGES
- No initial charge is payable.- The service charge is calculated per annum (incl. VAT) on a daily basis as a percentage of market value as follows: Class A1 - 1.19% (2014: N/A) Class B1 - 0.85% (2014: N/A)
53
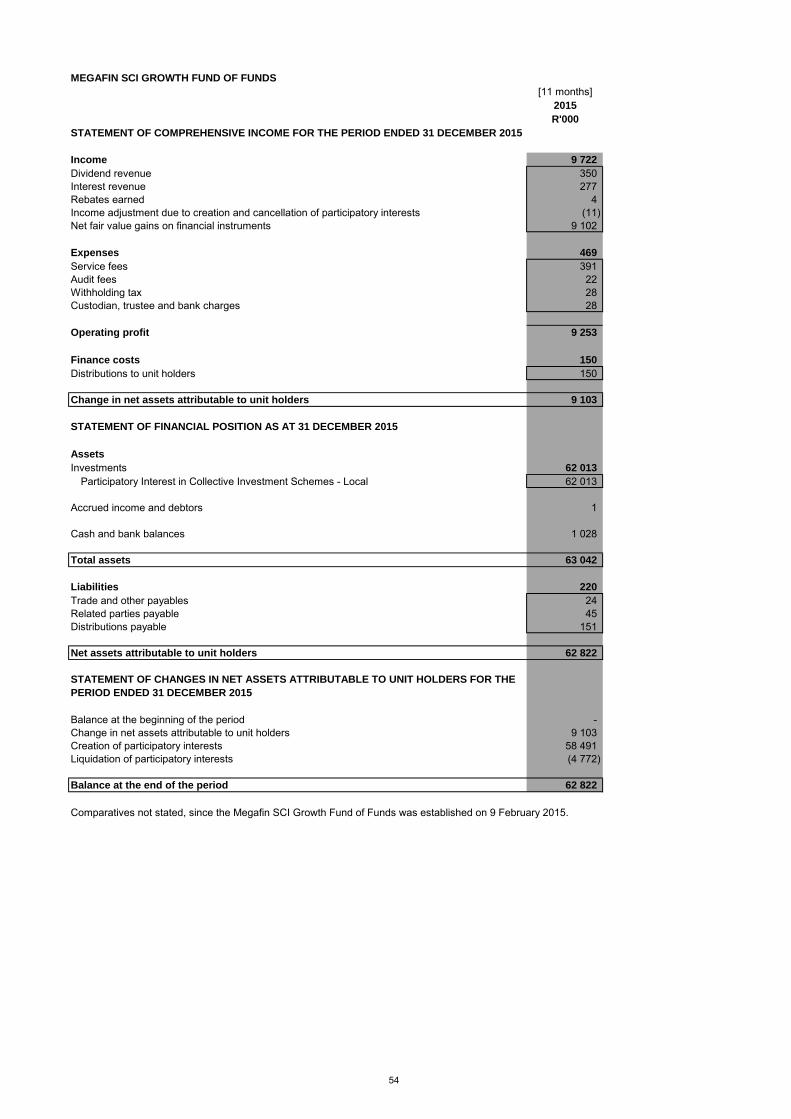
MEGAFIN SCI GROWTH FUND OF FUNDS
[11 months]2015
R'000
STATEMENT OF COMPREHENSIVE INCOME FOR THE PERIOD ENDED 31 DECEMBER 2015
Income 9 722
Dividend revenue 350 Interest revenue 277 Rebates earned 4 Income adjustment due to creation and cancellation of participatory interests (11) Net fair value gains on financial instruments 9 102
Expenses 469
Service fees 391 Audit fees 22 Withholding tax 28 Custodian, trustee and bank charges 28
Operating profit 9 253
Finance costs 150
Distributions to unit holders 150
Change in net assets attributable to unit holders 9 103
STATEMENT OF FINANCIAL POSITION AS AT 31 DECEMBER 2015
Assets
Investments 62 013
Participatory Interest in Collective Investment Schemes - Local 62 013
Accrued income and debtors 1
Cash and bank balances 1 028
Total assets 63 042
Liabilities 220
Trade and other payables 24 Related parties payable 45 Distributions payable 151
Net assets attributable to unit holders 62 822
Balance at the beginning of the period - Change in net assets attributable to unit holders 9 103 Creation of participatory interests 58 491 Liquidation of participatory interests (4 772)
Balance at the end of the period 62 822
Comparatives not stated, since the Megafin SCI Growth Fund of Funds was established on 9 February 2015.
STATEMENT OF CHANGES IN NET ASSETS ATTRIBUTABLE TO UNIT HOLDERS FOR THE
PERIOD ENDED 31 DECEMBER 2015
54
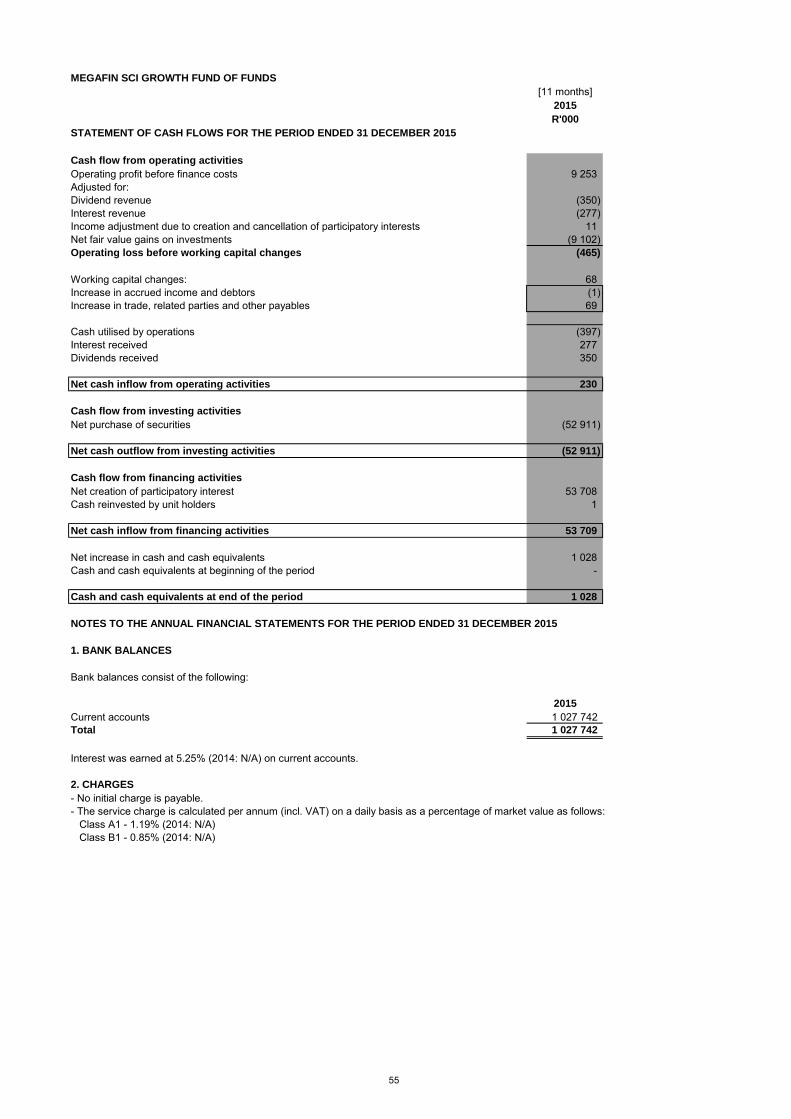
MEGAFIN SCI GROWTH FUND OF FUNDS
[11 months]2015
R'000
STATEMENT OF CASH FLOWS FOR THE PERIOD ENDED 31 DECEMBER 2015
Cash flow from operating activities
Operating profit before finance costs 9 253 Adjusted for:Dividend revenue (350) Interest revenue (277) Income adjustment due to creation and cancellation of participatory interests 11 Net fair value gains on investments (9 102) Operating loss before working capital changes (465)
Working capital changes: 68 Increase in accrued income and debtors (1) Increase in trade, related parties and other payables 69
Cash utilised by operations (397) Interest received 277 Dividends received 350
Net cash inflow from operating activities 230
Cash flow from investing activities
Net purchase of securities (52 911)
Net cash outflow from investing activities (52 911)
Cash flow from financing activities
Net creation of participatory interest 53 708 Cash reinvested by unit holders 1
Net cash inflow from financing activities 53 709
Net increase in cash and cash equivalents 1 028 Cash and cash equivalents at beginning of the period -
Cash and cash equivalents at end of the period 1 028
NOTES TO THE ANNUAL FINANCIAL STATEMENTS FOR THE PERIOD ENDED 31 DECEMBER 2015
1. BANK BALANCES
Bank balances consist of the following:
2015
Current accounts 1 027 742 Total 1 027 742
Interest was earned at 5.25% (2014: N/A) on current accounts.
2. CHARGES
- No initial charge is payable.- The service charge is calculated per annum (incl. VAT) on a daily basis as a percentage of market value as follows: Class A1 - 1.19% (2014: N/A) Class B1 - 0.85% (2014: N/A)
55

MEGAFIN SCI STABLE FUND OF FUNDS
[11 months]2015
R'000
STATEMENT OF COMPREHENSIVE INCOME FOR THE PERIOD ENDED 31 DECEMBER 2015
Income 12 084
Dividend revenue 679 Interest revenue 3 055 Income adjustment due to creation and cancellation of participatory interests 54 Net fair value gains on financial instruments 8 296
Expenses 1 369
Service fees 1 297 Audit fees 39 Withholding tax 11 Custodian, trustee and bank charges 22
Operating profit 10 715
Finance costs 2 408
Distributions to unit holders 2 408
Change in net assets attributable to unit holders 8 307
STATEMENT OF FINANCIAL POSITION AS AT 31 DECEMBER 2015
Assets
Investments 180 840
Participatory Interest in Collective Investment Schemes - Local 180 840
Accrued income and debtors 2
Cash and bank balances 1 670
Total assets 182 512
Liabilities 2 581
Trade and other payables 41 Related parties payable 130 Distributions payable 2 410
Net assets attributable to unit holders 179 931
Balance at the beginning of the period - Change in net assets attributable to unit holders 8 307 Creation of participatory interests 208 573 Liquidation of participatory interests (36 949)
Balance at the end of the period 179 931
Comparatives not stated, since the Megafin SCI Stable Fund of Funds was established on 09 February 2015.
STATEMENT OF CHANGES IN NET ASSETS ATTRIBUTABLE TO UNIT HOLDERS FOR THE
PERIOD ENDED 31 DECEMBER 2015
56

MEGAFIN SCI STABLE FUND OF FUNDS
[11 months]2015
R'000
STATEMENT OF CASH FLOWS FOR THE PERIOD ENDED 31 DECEMBER 2015
Cash flow from operating activities
Operating profit before finance costs 10 715 Adjusted for:Dividend revenue (679) Interest revenue (3 055) Income adjustment due to creation and cancellation of participatory interests (54) Net fair value gains on investments (8 296) Operating loss before working capital changes (1 369)
Working capital changes: 169 Increase in accrued income and debtors (2) Increase in trade, related parties and other payables 171
Cash utilised by operations (1 200) Interest received 3 055 Dividends received 679
Net cash inflow from operating activities 2 534
Cash flow from investing activities
Net purchase of securities (172 544)
Net cash outflow from investing activities (172 544)
Cash flow from financing activities
Net creation of participatory interest 171 678 Cash reinvested by unit holders 2
Net cash inflow from financing activities 171 680
Net increase in cash and cash equivalents 1 670 Cash and cash equivalents at beginning of the period -
Cash and cash equivalents at end of the period 1 670
NOTES TO THE ANNUAL FINANCIAL STATEMENTS FOR THE PERIOD ENDED 31 DECEMBER 2015
1. BANK BALANCES
Bank balances consist of the following:
2015
Current accounts 1 670 376 Total 1 670 376
Interest was earned at 5.25% (2014: N/A) on current accounts.
2. CHARGES
- No initial charge is payable.- The service charge is calculated per annum (incl. VAT) on a daily basis as a percentage of market value as follows: Class A1 - 1.19% (2014: N/A) Class B1 - 0.85% (2014: N/A)
57

OBSIDIAN SCI BALANCED FUND
2015 2014
R'000 R'000
STATEMENT OF COMPREHENSIVE INCOME FOR THE YEAR ENDED 31 DECEMBER 2015
Income 35 512 9 524
Dividend revenue 7 857 993 Interest revenue 6 821 1 147 Other income (96) - Income adjustment due to creation and cancellation of participatory interests 3 910 738 Net fair value gains on financial instruments 17 020 6 646
Expenses 6 696 1 141
Service fees 1 956 234 Audit fees 55 52 Withholding tax 141 9 Custodian, trustee and bank charges 53 100 Transaction costs 4 491 746
Operating profit 28 816 8 383
Finance costs 16 260 2 481
Distributions to unit holders 16 260 2 481
Change in net assets attributable to unit holders 12 556 5 902
STATEMENT OF FINANCIAL POSITION AS AT 31 DECEMBER 2015
Assets
Investments 536 334 131 045
Equities and specialist securities - Local 478 330 113 470 Bonds - Local 58 004 17 575
Accrued income and debtors 919 60
Cash and bank balances 162 039 14 789
Total assets 699 292 145 894
Liabilities 10 228 2 193
Trade and other payables 59 54 Related parties payable 362 54 Distributions payable 9 807 2 085
Net assets attributable to unit holders 689 064 143 701
Balance at the beginning of the year 143 701 14 143 Change in net assets attributable to unit holders 12 556 5 902 Creation of participatory interests 605 598 125 136 Liquidation of participatory interests (72 791) (1 480)
Balance at the end of the year 689 064 143 701
STATEMENT OF CHANGES IN NET ASSETS ATTRIBUTABLE TO UNIT HOLDERS FOR THE
YEAR ENDED 31 DECEMBER 2015
58

OBSIDIAN SCI BALANCED FUND
2015 2014
R'000 R'000
STATEMENT OF CASH FLOWS FOR THE YEAR ENDED 31 DECEMBER 2015
Cash flow from operating activities
Operating profit before finance costs 28 816 8 383 Adjusted for:Dividend revenue (7 857) (993) Interest revenue (6 821) (1 147) Income adjustment due to creation and cancellation of participatory interests (3 910) (738) Net fair value gains on investments (17 020) (6 646) Operating loss before working capital changes (6 792) (1 141)
Working capital changes: (546) 61 Increase in accrued income and debtors (859) (42) Increase in trade, related parties and other payables 313 103
Cash utilised by operations (7 338) (1 080) Interest received 6 821 1 147 Dividends received 7 857 993
Net cash inflow from operating activities 7 340 1 060
Cash flow from investing activities
Net purchase of securities (388 269) (114 548)
Net cash outflow from investing activities (388 269) (114 548)
Cash flow from financing activities
Net creation of participatory interest 536 717 123 964 Cash distributed to units holders (8 538) (39)
Net cash inflow from financing activities 528 179 123 925
Net increase in cash and cash equivalents 147 250 10 437 Cash and cash equivalents at beginning of the year 14 789 4 352
Cash and cash equivalents at end of the year 162 039 14 789
NOTES TO THE ANNUAL FINANCIAL STATEMENTS FOR THE YEAR ENDED 31 DECEMBER 2015
1. BANK BALANCES
Bank balances consist of the following:
2015 2014
Current accounts 137 822 794 12 865 312 SAFEX 24 215 826 1 924 114 Total 162 038 620 14 789 426
Interest was earned at 5.25% (2014: 4.75%) on current accounts.Interest was earned at 5.75% (2014: 4.75%) on SAFEX deposits.
2. CHARGES
- No initial charge is payable.- The service charge is calculated per annum (incl. VAT) on a daily basis as a percentage of market value as follows: Class B1 - 1.14% (2014: 1.14%) Class B2 - 0.79% (2014: 0.79%) Class B3 - 0.22% (2014: 0.22%) Class B4 - 0.57% (2014: 0.57%)
59

OBSIDIAN SCI EQUITY FUND
[1 month]2015
R'000
STATEMENT OF COMPREHENSIVE INCOME FOR THE PERIOD ENDED 31 DECEMBER 2015
Income 1
Interest revenue 1
Expenses 6
Custodian, trustee and bank charges 2 Transaction costs 4
Operating loss (5)
Finance costs -
Distributions to unit holders -
Change in net assets attributable to unit holders (5)
STATEMENT OF FINANCIAL POSITION AS AT 31 DECEMBER 2015
Assets
Investments 982
Equities and specialist securities - Local 982
Accrued income and debtors 1
Cash and bank balances 1 003
Total assets 1 986
Liabilities 988
Trade and other payables 988 Related parties payable - Distributions payable -
Net assets attributable to unit holders 998
Balance at the beginning of the period - Change in net assets attributable to unit holders (5) Creation of participatory interests 1 003 Liquidation of participatory interests -
Balance at the end of the period 998
Comparatives not stated, since the Obsidian SCI Equity Fund was established on 28 December 2015.
STATEMENT OF CHANGES IN NET ASSETS ATTRIBUTABLE TO UNIT HOLDERS FOR THE
PERIOD ENDED 31 DECEMBER 2015
60

OBSIDIAN SCI EQUITY FUND
[1 month]2015
R'000
STATEMENT OF CASH FLOWS FOR THE PERIOD ENDED 31 DECEMBER 2015
Cash flow from operating activities
Operating loss before finance costs (5) Adjusted for:Interest revenue (1) Operating loss before working capital changes (6)
Working capital changes: 987 Increase in accrued income and debtors (1) Increase in trade, related parties and other payables 998
Cash generated by operations 981 Interest received 1
Net cash inflow from operating activities 982
Cash flow from investing activities
Net purchase of securities (982)
Net cash outflow from investing activities (982)
Cash flow from financing activities
Net creation of participatory interest 1 003 Cash distributed to unit holders -
Net cash inflow from financing activities 1 003
Net increase in cash and cash equivalents 1 003 Cash and cash equivalents at beginning of the period -
Cash and cash equivalents at end of the period 1 003
NOTES TO THE ANNUAL FINANCIAL STATEMENTS FOR THE PERIOD ENDED 31 DECEMBER 2015
1. BANK BALANCES
Bank balances consist of the following:
2015
Current accounts 1 003 000 Total 1 003 000
Interest was earned at 5.25% (2014: N/A) on current accounts.
2. CHARGES
- No initial charge is payable.- The service charge is calculated per annum (incl. VAT) on a daily basis as a percentage of market value as follows: Class B1 - 1.14% (2014: N/A ) Class B2 - 0.79% (2014: N/A ) Class B3 - 0.14% (2014: N/A ) Class B4 - 0.57% (2014: N/A )
61

STATEMENT OF COMPREHENSIVE INCOME FOR THE PERIOD ENDED 31 DECEMBER 2015
[8 Months] [12 Months]2015 2014
R'000 R'000
Income (2 608) 542
Interest revenue 23 15Income adjustment due to creation and cancellation of participatory interests (501) (4) Net fair value (losses)/gains on financial instruments (2 130) 531
Expenses 58 96
Service fees 5 7Audit fees 31 52Custodian, trustee and bank charges 22 37
Operating (loss)/profit (2 666) 446
Finance costs - -
Distributions to unit holders - -
Change in net assets attributable to unit holders (2 666) 446
STATEMENT OF FINANCIAL POSITION AS AT 31 DECEMBER 2015
R'000
Assets
Investments - 26 774
Participatory Interest in Collective Investment Schemes - Foreign - 26 774
Cash and bank balances - 435 Total assets - 27 209
Liabilities - 54
Trade and other payables - 53 Related parties payable - 1
Net assets attributable to unit holders - 27 155
STATEMENT OF CHANGES IN NET ASSETS ATTRIBUTABLE TO UNIT HOLDERS FOR THE
PERIOD ENDED 31 DECEMBER 2015
Balance at the beginning of the period 27 155 1 234Change in net assets attributable to unit holders (2 666) 446Creation of participatory interests 1 535 27 135Liquidation of participatory interests (26 024) (1 660)
Balance at the end of the period - 27 155
The fund was closed on 28 August 2015.
SANLAM AFRICAN FRONTIER MARKETS FEEDER FUND
62

SANLAM AFRICAN FRONTIER MARKETS FEEDER FUND
STATEMENT OF CASH FLOWS FOR THE PERIOD ENDED 31 DECEMBER 2015
[8 Months] [12 Months]2015 2014
R'000 R'000
Cash flow from operating activities
Operating (loss)/profit before finance costs (2 666) 446Adjusted for:Interest revenue (23) (15) Income adjustment due to creation and cancellation of participatory interests 501 4Net fair value losses/(gains) on investments 2 130 (531) Operating loss before working capital changes (58) (96)
Working capital changes: (54) 53(Decrease)/increase in trade, related parties and other payables (54) 53
Cash utilised by operations (112) (43) Interest received 23 15Foreign exchange gains - -
Net cash outflow from operating activities (89) (28)
Cash flow from investing activities
Net sale/(purchase) of securities 24 644 (25 049)
Net cash inflow/(outflow) from investing activities 24 644 (25 049)
Cash flow from financing activities
Net (cancellation)/creation of participatory interest (24 990) 25 471
Net cash (outflow)/inflow from financing activities (24 990) 25 471
Net (decrease)/increase in cash and cash equivalents (435) 394Cash and cash equivalents at beginning of the period 435 41
Cash and cash equivalents at end of the period - 435
NOTES TO THE ANNUAL FINANCIAL STATEMENTS FOR THE PERIOD ENDED 31 DECEMBER 2015
1. BANK BALANCES
Bank balances consist of the following:
2015 2014
Current accounts - 434 395Foreign currency cash deposits - 1 081Total - 435 476
Interest was earned at 5.25% (2014: 4.75%) on current accounts.Interest was earned at 0% (2014: 0%) on foreign currency cash deposits.
2. CHARGES
No initial charge is payable.- The service charge is calculated per annum (incl. VAT) on a daily basis as a percentage of market value as follows: Class A1. - 0.57% (2014: 0.57%) Class B1 - 0.39% (2014: 0.39%) Class B2- 0.28% (2014: 0.28%) Class B3- 0% (2014: 0 %)
63
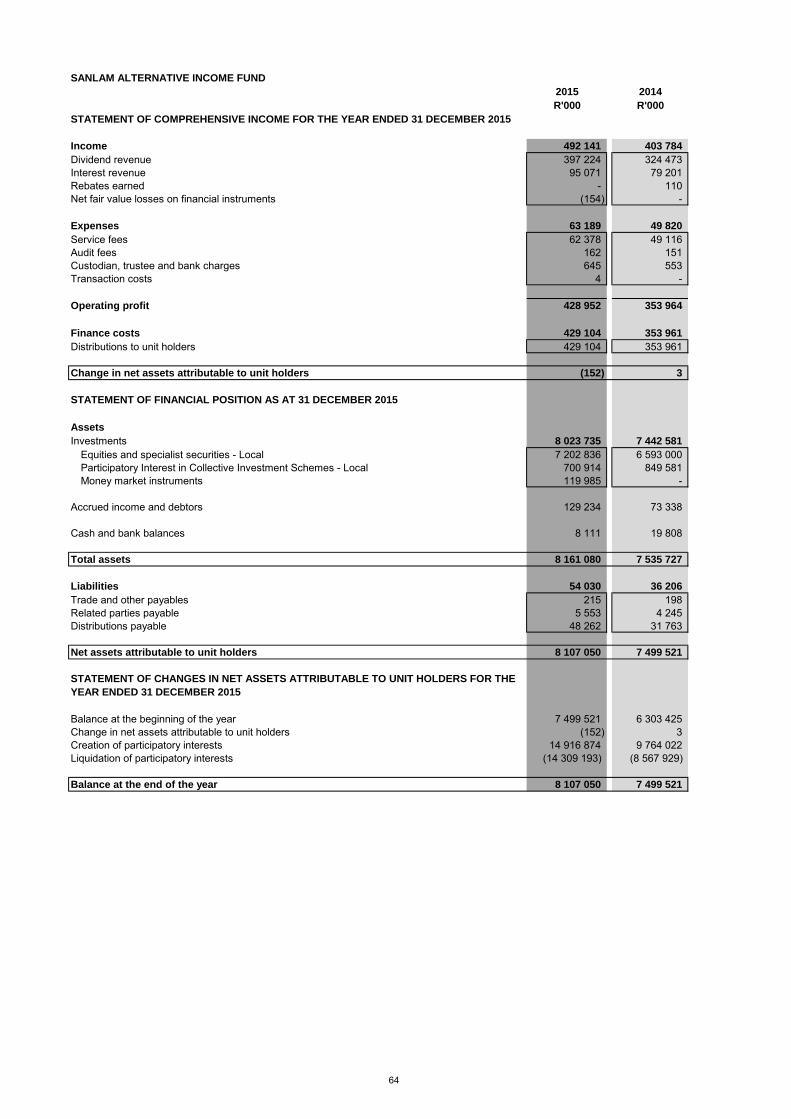
SANLAM ALTERNATIVE INCOME FUND
2015 2014
R'000 R'000
STATEMENT OF COMPREHENSIVE INCOME FOR THE YEAR ENDED 31 DECEMBER 2015
Income 492 141 403 784
Dividend revenue 397 224 324 473 Interest revenue 95 071 79 201 Rebates earned - 110 Net fair value losses on financial instruments (154) -
Expenses 63 189 49 820
Service fees 62 378 49 116 Audit fees 162 151 Custodian, trustee and bank charges 645 553 Transaction costs 4 -
Operating profit 428 952 353 964
Finance costs 429 104 353 961
Distributions to unit holders 429 104 353 961
Change in net assets attributable to unit holders (152) 3
STATEMENT OF FINANCIAL POSITION AS AT 31 DECEMBER 2015
Assets
Investments 8 023 735 7 442 581
Equities and specialist securities - Local 7 202 836 6 593 000 Participatory Interest in Collective Investment Schemes - Local 700 914 849 581 Money market instruments 119 985 -
Accrued income and debtors 129 234 73 338
Cash and bank balances 8 111 19 808
Total assets 8 161 080 7 535 727
Liabilities 54 030 36 206
Trade and other payables 215 198 Related parties payable 5 553 4 245 Distributions payable 48 262 31 763
Net assets attributable to unit holders 8 107 050 7 499 521
Balance at the beginning of the year 7 499 521 6 303 425 Change in net assets attributable to unit holders (152) 3 Creation of participatory interests 14 916 874 9 764 022 Liquidation of participatory interests (14 309 193) (8 567 929)
Balance at the end of the year 8 107 050 7 499 521
STATEMENT OF CHANGES IN NET ASSETS ATTRIBUTABLE TO UNIT HOLDERS FOR THE
YEAR ENDED 31 DECEMBER 2015
64

SANLAM ALTERNATIVE INCOME FUND
2015 2014
R'000 R'000
STATEMENT OF CASH FLOWS FOR THE YEAR ENDED 31 DECEMBER 2015
Cash flow from operating activities
Operating profit before finance costs 428 952 353 964 Adjusted for:Dividend revenue (397 224) (324 473) Interest revenue (95 071) (79 201) Net fair value loss on investments 154 - Operating loss before working capital changes (63 189) (49 710)
Working capital changes: (54 571) (39 452) Decrease in accrued income and debtors (55 896) (39 343) Increase/(decrease) in trade, related parties and other payables 1 325 (109)
Cash utilised by operations (117 760) (89 162) Interest received 95 071 79 201 Dividends received 397 224 324 473
Net cash inflow from operating activities 374 535 314 512
Cash flow from investing activities
Net purchase of securities (581 308) (1 168 339)
Net cash outflow from investing activities (581 308) (1 168 339)
Cash flow from financing activities
Net creation of participatory interest 607 681 980 620 Cash distributed to units holders (412 605) (131 553)
Net cash inflow from financing activities 195 076 849 067
Net decrease in cash and cash equivalents (11 697) (4 760) Cash and cash equivalents at beginning of the year 19 808 24 568
Cash and cash equivalents at end of the year 8 111 19 808
NOTES TO THE ANNUAL FINANCIAL STATEMENTS FOR THE YEAR ENDED 31 DECEMBER 2015
1. BANK BALANCES
Bank balances consist of the following:
2015 2014
Current accounts 8 111 347 19 808 144 Total 8 111 347 19 808 144
Interest was earned at 5.25% (2014: 4.75%) on current accounts.
2. CHARGES
- No initial charge is payable.- The service charge is calculated per annum (incl. VAT) on a daily basis as a percentage of market value as follows: Class A1 – 1.31% (2014: 1.31%) Class B1 – 0.96% (2014: 0.96%) Class B2 – 0.85% (2014: 0.85%) Class B3 – 0.68% (2014: 0.68%) Class B4 – 1.31% (2014: 1.31%) Class B5 – 0.45% (2014: 0.45%) Class B6 – 0% (2014: 0%) Class B7 – 0.57% (2014: 0.57%) Class B8 – 1.02% (2014: N/A)
65
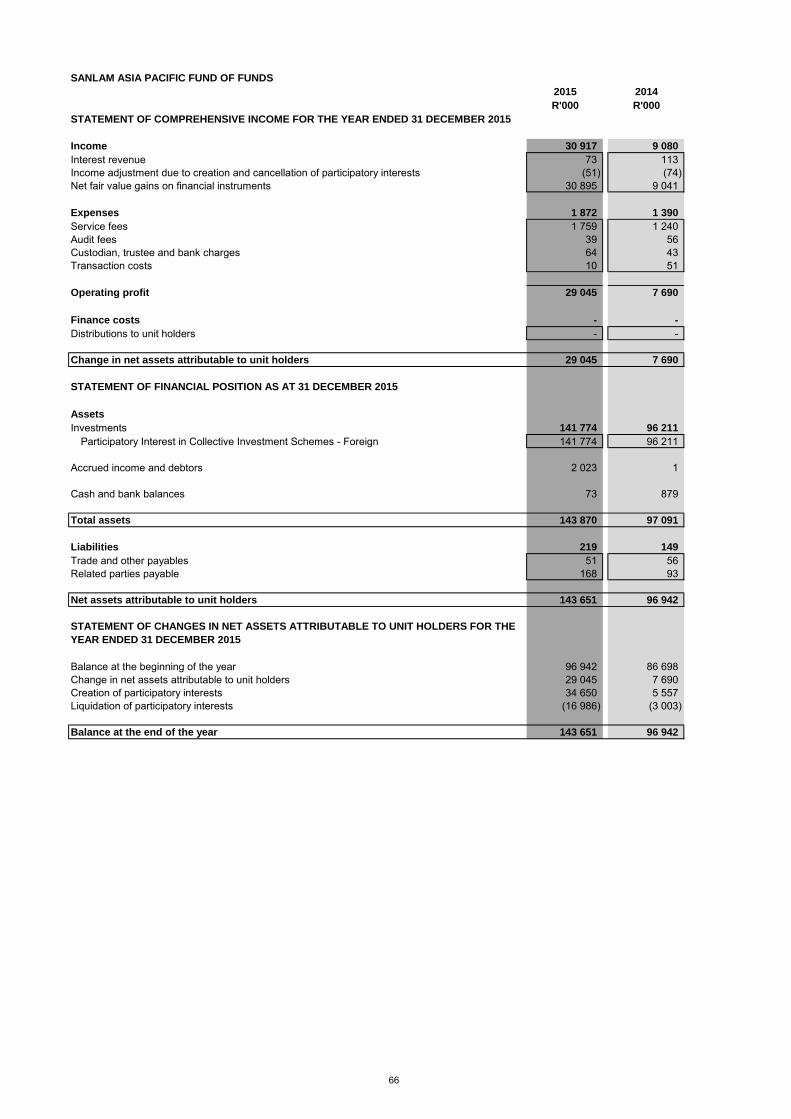
SANLAM ASIA PACIFIC FUND OF FUNDS
2015 2014
R'000 R'000
STATEMENT OF COMPREHENSIVE INCOME FOR THE YEAR ENDED 31 DECEMBER 2015
Income 30 917 9 080
Interest revenue 73 113 Income adjustment due to creation and cancellation of participatory interests (51) (74) Net fair value gains on financial instruments 30 895 9 041
Expenses 1 872 1 390
Service fees 1 759 1 240 Audit fees 39 56 Custodian, trustee and bank charges 64 43 Transaction costs 10 51
Operating profit 29 045 7 690
Finance costs - -
Distributions to unit holders - -
Change in net assets attributable to unit holders 29 045 7 690
STATEMENT OF FINANCIAL POSITION AS AT 31 DECEMBER 2015
Assets
Investments 141 774 96 211
Participatory Interest in Collective Investment Schemes - Foreign 141 774 96 211
Accrued income and debtors 2 023 1
Cash and bank balances 73 879
Total assets 143 870 97 091
Liabilities 219 149
Trade and other payables 51 56 Related parties payable 168 93
Net assets attributable to unit holders 143 651 96 942
Balance at the beginning of the year 96 942 86 698 Change in net assets attributable to unit holders 29 045 7 690 Creation of participatory interests 34 650 5 557 Liquidation of participatory interests (16 986) (3 003)
Balance at the end of the year 143 651 96 942
STATEMENT OF CHANGES IN NET ASSETS ATTRIBUTABLE TO UNIT HOLDERS FOR THE
YEAR ENDED 31 DECEMBER 2015
66

SANLAM ASIA PACIFIC FUND OF FUNDS
2015 2014
R'000 R'000
STATEMENT OF CASH FLOWS FOR THE YEAR ENDED 31 DECEMBER 2015
Cash flow from operating activities
Operating profit before finance costs 29 045 7 690 Adjusted for:Interest revenue (73) (113) Income adjustment due to creation and cancellation of participatory interests 51 74 Net fair value gains on investments (30 895) (9 041) Operating loss before working capital changes (1 872) (1 390)
Working capital changes: (1 952) (6) Increase in accrued income and debtors (2 022) - Increase/(decrease) in trade, related parties and other payables 70 (6)
Cash utilised by operations (3 824) (1 396) Interest received 73 113
Net cash outflow from operating activities (3 751) (1 283)
Cash flow from investing activities
Net purchase of securities (14 668) (1 376)
Net cash outflow from investing activities (14 668) (1 376)
Cash flow from financing activities
Net creation of participatory interest 17 613 2 480
Net cash inflow from financing activities 17 613 2 480
Net decrease in cash and cash equivalents (806) (179) Cash and cash equivalents at beginning of the year 879 1 058
Cash and cash equivalents at end of the year 73 879
NOTES TO THE ANNUAL FINANCIAL STATEMENTS FOR THE YEAR ENDED 31 DECEMBER 2015
1. BANK BALANCES
Bank balances consist of the following:
2015 2014
Current accounts 64 138 631 810 Foreign currency cash deposits 8 963 247 484 Total 73 101 879 294
Interest was earned at 5.25% (2014: 4.75%) on current accounts.Interest was earned at 0% (2014: 0%) on foreign currency cash deposits.
2. CHARGES
- No initial charge is payable.- The service charge is calculated per annum (incl. VAT) on a daily basis as a percentage of market value as follows: Class A1 - 1.42% (2014: 1.42%) Class B1 - 0.85% (2014: 0.85%)
67

SANLAM DIVERSIFIED INCOME FUND OF FUNDS
2015 2014
R'000 R'000
STATEMENT OF COMPREHENSIVE INCOME FOR THE YEAR ENDED 31 DECEMBER 2015
Income 47 349 55 563
Dividend revenue 28 917 33 169 Interest revenue 7 727 6 730 Other income - 1 338 Rebates earned 272 324 Income adjustment due to creation and cancellation of participatory interests (1 388) (17) Net fair value gains on financial instruments 11 821 14 019
Expenses 3 312 3 750
Service fees 3 190 3 622 Audit fees 56 49 Custodian, trustee and bank charges 66 79
Operating profit 44 037 51 813
Finance costs 32 310 37 823
Distributions to unit holders 32 310 37 823
Change in net assets attributable to unit holders 11 727 13 990
STATEMENT OF FINANCIAL POSITION AS AT 31 DECEMBER 2015
Assets
Investments 538 431 1 039 770
Equities and specialist securities - Local 398 346 - Participatory Interest in Collective Investment Schemes - Local 140 085 1 039 770
Accrued income and debtors 2 141 3 698
Cash and bank balances 1 883 868
Total assets 542 455 1 044 336
Liabilities 2 290 3 723
Trade and other payables 58 55 Related parties payable 256 271 Distributions payable 1 976 3 397
Net assets attributable to unit holders 540 165 1 040 613
Balance at the beginning of the year 1 040 613 937 699 Change in net assets attributable to unit holders 11 727 13 990 Creation of participatory interests 861 848 604 007 Liquidation of participatory interests (1 374 023) (515 083)
Balance at the end of the year 540 165 1 040 613
STATEMENT OF CHANGES IN NET ASSETS ATTRIBUTABLE TO UNIT HOLDERS FOR THE
YEAR ENDED 31 DECEMBER 2015
68
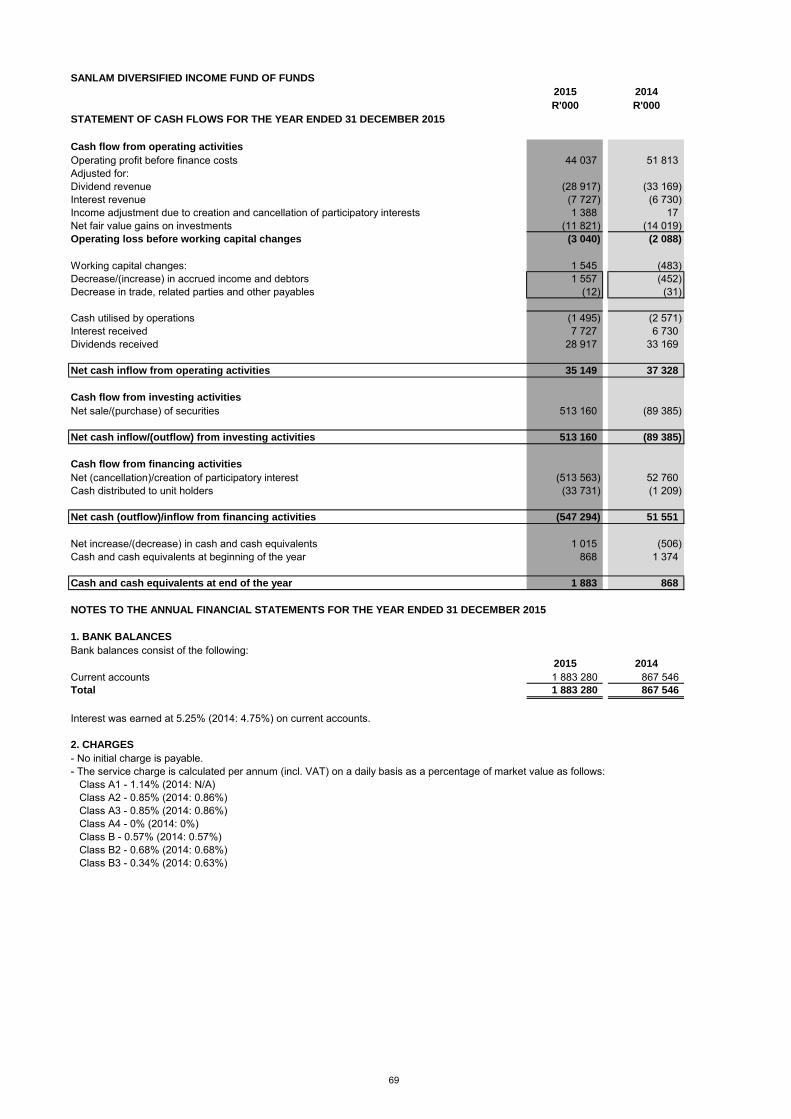
SANLAM DIVERSIFIED INCOME FUND OF FUNDS
2015 2014
R'000 R'000
STATEMENT OF CASH FLOWS FOR THE YEAR ENDED 31 DECEMBER 2015
Cash flow from operating activities
Operating profit before finance costs 44 037 51 813 Adjusted for:Dividend revenue (28 917) (33 169) Interest revenue (7 727) (6 730) Income adjustment due to creation and cancellation of participatory interests 1 388 17 Net fair value gains on investments (11 821) (14 019) Operating loss before working capital changes (3 040) (2 088)
Working capital changes: 1 545 (483) Decrease/(increase) in accrued income and debtors 1 557 (452) Decrease in trade, related parties and other payables (12) (31)
Cash utilised by operations (1 495) (2 571) Interest received 7 727 6 730 Dividends received 28 917 33 169
Net cash inflow from operating activities 35 149 37 328
Cash flow from investing activities
Net sale/(purchase) of securities 513 160 (89 385)
Net cash inflow/(outflow) from investing activities 513 160 (89 385)
Cash flow from financing activities
Net (cancellation)/creation of participatory interest (513 563) 52 760 Cash distributed to unit holders (33 731) (1 209)
Net cash (outflow)/inflow from financing activities (547 294) 51 551
Net increase/(decrease) in cash and cash equivalents 1 015 (506) Cash and cash equivalents at beginning of the year 868 1 374
Cash and cash equivalents at end of the year 1 883 868
NOTES TO THE ANNUAL FINANCIAL STATEMENTS FOR THE YEAR ENDED 31 DECEMBER 2015
1. BANK BALANCES
Bank balances consist of the following:2015 2014
Current accounts 1 883 280 867 546 Total 1 883 280 867 546
Interest was earned at 5.25% (2014: 4.75%) on current accounts.
2. CHARGES
- No initial charge is payable.- The service charge is calculated per annum (incl. VAT) on a daily basis as a percentage of market value as follows: Class A1 - 1.14% (2014: N/A) Class A2 - 0.85% (2014: 0.86%) Class A3 - 0.85% (2014: 0.86%) Class A4 - 0% (2014: 0%) Class B - 0.57% (2014: 0.57%) Class B2 - 0.68% (2014: 0.68%) Class B3 - 0.34% (2014: 0.63%)
69

SANLAM GLOBAL BALANCED FUND OF FUNDS
2015 2014
R'000 R'000
STATEMENT OF COMPREHENSIVE INCOME FOR THE YEAR ENDED 31 DECEMBER 2015
Income 13 768 3 363
Interest revenue 56 33 Income adjustment due to creation and cancellation of participatory interests (52) (29) Net fair value gains on financial instruments 13 764 3 359
Expenses 409 310
Service fees 309 174 Audit fees 39 66 Custodian, trustee and bank charges 61 70
Operating profit 13 359 3 053
Finance costs 349 -
Distributions to unit holders 349 -
Change in net assets attributable to unit holders 13 010 3 053
STATEMENT OF FINANCIAL POSITION AS AT 31 DECEMBER 2015
Assets
Investments 61 269 29 293
Participatory Interest in Collective Investment Schemes - Foreign 61 269 29 293
Accrued income and debtors 1 1
Cash and bank balances 1 696 1 103
Total assets 62 966 30 397
Liabilities 174 82
Trade and other payables 40 64 Related parties payable 34 18 Distributions payable 100 -
Net assets attributable to unit holders 62 792 30 315
Balance at the beginning of the year 30 315 20 516 Change in net assets attributable to unit holders 13 010 3 053 Creation of participatory interests 55 071 10 652 Liquidation of participatory interests (35 604) (3 906)
Balance at the end of the year 62 792 30 315
STATEMENT OF CHANGES IN NET ASSETS ATTRIBUTABLE TO UNIT HOLDERS FOR THE
YEAR ENDED 31 DECEMBER 2015
70
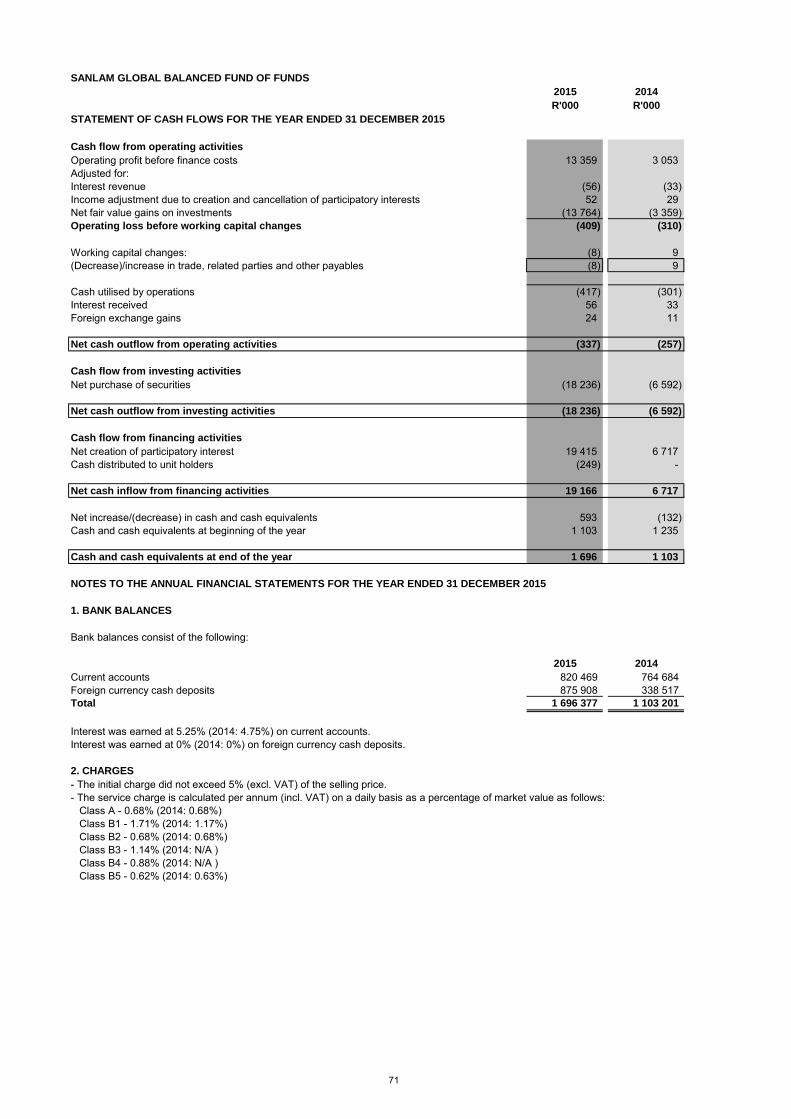
SANLAM GLOBAL BALANCED FUND OF FUNDS
2015 2014
R'000 R'000
STATEMENT OF CASH FLOWS FOR THE YEAR ENDED 31 DECEMBER 2015
Cash flow from operating activities
Operating profit before finance costs 13 359 3 053 Adjusted for:Interest revenue (56) (33) Income adjustment due to creation and cancellation of participatory interests 52 29 Net fair value gains on investments (13 764) (3 359) Operating loss before working capital changes (409) (310)
Working capital changes: (8) 9 (Decrease)/increase in trade, related parties and other payables (8) 9
Cash utilised by operations (417) (301) Interest received 56 33 Foreign exchange gains 24 11
Net cash outflow from operating activities (337) (257)
Cash flow from investing activities
Net purchase of securities (18 236) (6 592)
Net cash outflow from investing activities (18 236) (6 592)
Cash flow from financing activities
Net creation of participatory interest 19 415 6 717 Cash distributed to unit holders (249) -
Net cash inflow from financing activities 19 166 6 717
Net increase/(decrease) in cash and cash equivalents 593 (132) Cash and cash equivalents at beginning of the year 1 103 1 235
Cash and cash equivalents at end of the year 1 696 1 103
NOTES TO THE ANNUAL FINANCIAL STATEMENTS FOR THE YEAR ENDED 31 DECEMBER 2015
1. BANK BALANCES
Bank balances consist of the following:
2015 2014
Current accounts 820 469 764 684 Foreign currency cash deposits 875 908 338 517 Total 1 696 377 1 103 201
Interest was earned at 5.25% (2014: 4.75%) on current accounts.Interest was earned at 0% (2014: 0%) on foreign currency cash deposits.
2. CHARGES
- The initial charge did not exceed 5% (excl. VAT) of the selling price.- The service charge is calculated per annum (incl. VAT) on a daily basis as a percentage of market value as follows: Class A - 0.68% (2014: 0.68%) Class B1 - 1.71% (2014: 1.17%) Class B2 - 0.68% (2014: 0.68%) Class B3 - 1.14% (2014: N/A ) Class B4 - 0.88% (2014: N/A ) Class B5 - 0.62% (2014: 0.63%)
71

SANLAM GLOBAL CAUTIOUS FUND OF FUNDS
2015 2014
R'000 R'000
STATEMENT OF COMPREHENSIVE INCOME FOR THE YEAR ENDED 31 DECEMBER 2015
Income 14 567 4 061
Interest revenue 59 26 Income adjustment due to creation and cancellation of participatory interests (139) - Net fair value gains on financial instruments 14 647 4 035
Expenses 409 301
Service fees 306 196 Audit fees 38 56 Custodian, trustee and bank charges 65 49
Operating profit 14 158 3 760
Finance costs - -
Distributions to unit holders - -
Change in net assets attributable to unit holders 14 158 3 760
STATEMENT OF FINANCIAL POSITION AS AT 31 DECEMBER 2015
Assets
Investments 70 421 29 955
Participatory Interest in Collective Investment Schemes - Foreign 70 421 29 955
Accrued income and debtors 2 1
Cash and bank balances 2 250 1 060
Total assets 72 673 31 016
Liabilities 80 74
Trade and other payables 40 57 Related parties payable 40 17
Net assets attributable to unit holders 72 593 30 942
Balance at the beginning of the year 30 942 27 235 Change in net assets attributable to unit holders 14 158 3 760 Creation of participatory interests 31 936 6 627 Liquidation of participatory interests (4 443) (6 680)
Balance at the end of the year 72 593 30 942
STATEMENT OF CHANGES IN NET ASSETS ATTRIBUTABLE TO UNIT HOLDERS FOR THE
YEAR ENDED 31 DECEMBER 2015
72

SANLAM GLOBAL CAUTIOUS FUND OF FUNDS
2015 2014
R'000 R'000
STATEMENT OF CASH FLOWS FOR THE YEAR ENDED 31 DECEMBER 2015
Cash flow from operating activities
Operating profit before finance costs 14 158 3 760 Adjusted for:Interest revenue (59) (26) Income adjustment due to creation and cancellation of participatory interests 139 - Net fair value gains on investments (14 647) (4 035) Operating loss before working capital changes (409) (301)
Working capital changes: 5 106 (Increase)/decrease in accrued income and debtors (1) 100 Increase in trade, related parties and other payables 6 6
Cash utilised by operations (404) (195) Interest received 59 26 Foreign exchange gains - 18
Net cash outflow from operating activities (345) (151)
Cash flow from investing activities
Net (purchase)/sale of securities (25 819) 273
Net cash (outflow)/inflow from investing activities (25 819) 273
Cash flow from financing activities
Net creation/(cancellation) of participatory interest 27 354 (53)
Net cash inflow/(outflow) from financing activities 27 354 (53)
Net increase in cash and cash equivalents 1 190 69 Cash and cash equivalents at beginning of the year 1 060 991
Cash and cash equivalents at end of the year 2 250 1 060
NOTES TO THE ANNUAL FINANCIAL STATEMENTS FOR THE YEAR ENDED 31 DECEMBER 2015
1. BANK BALANCES
Bank balances consist of the following:
2015 2014
Current accounts 2 245 400 675 670 Foreign currency cash deposits 5 175 384 175 Total 2 250 575 1 059 845
Interest was earned at 5.25% (2014: 4.75%) on current accounts.Interest was earned at 0% (2014: 0%) on foreign currency cash deposits.
2. CHARGES
- No initial charge is payable.- The service charge is calculated per annum (incl. VAT) on a daily basis as a percentage of market value as follows: Class A - 0.68% (2014: 0.68%)
73

SANLAM GLOBAL EQUITY FUND
2015 2014
R'000 R'000
STATEMENT OF COMPREHENSIVE INCOME FOR THE YEAR ENDED 31 DECEMBER 2015
Income 203 970 97 454
Dividend revenue 20 040 17 579 Interest revenue 21 520 Income adjustment due to creation and cancellation of participatory interests (859) 243 Net fair value gains on financial instruments 184 768 79 112
Expenses 16 663 17 311
Service fees 12 010 12 282 Audit fees 72 66 Withholding tax 3 037 3 040 Custodian, trustee and bank charges 509 601 Transaction costs 1 035 1 322
Operating profit 187 307 80 143
Finance costs 9 565 3 974
Distributions to unit holders 9 565 3 974
Change in net assets attributable to unit holders 177 742 76 169
STATEMENT OF FINANCIAL POSITION AS AT 31 DECEMBER 2015
Assets
Investments 799 849 1 050 649
Equities and specialist securities - Foreign 799 849 852 106 Participatory Interest in Collective Investment Schemes - Foreign - 198 543
Accrued income and debtors 880 2 554
Cash and bank balances 25 439 12 752
Total assets 826 168 1 065 955
Liabilities 11 824 4 665
Cash and bank balances 6 306 - Trade and other payables 77 1 714 Related parties payable 873 1 104 Distributions payable 4 568 1 847
Net assets attributable to unit holders 814 344 1 061 290
Balance at the beginning of the year 1 061 290 760 598 Change in net assets attributable to unit holders 177 742 76 169 Creation of participatory interests 1 315 331 1 279 618 Liquidation of participatory interests (1 740 019) (1 055 095)
Balance at the end of the year 814 344 1 061 290
STATEMENT OF CHANGES IN NET ASSETS ATTRIBUTABLE TO UNIT HOLDERS FOR THE
YEAR ENDED 31 DECEMBER 2015
74
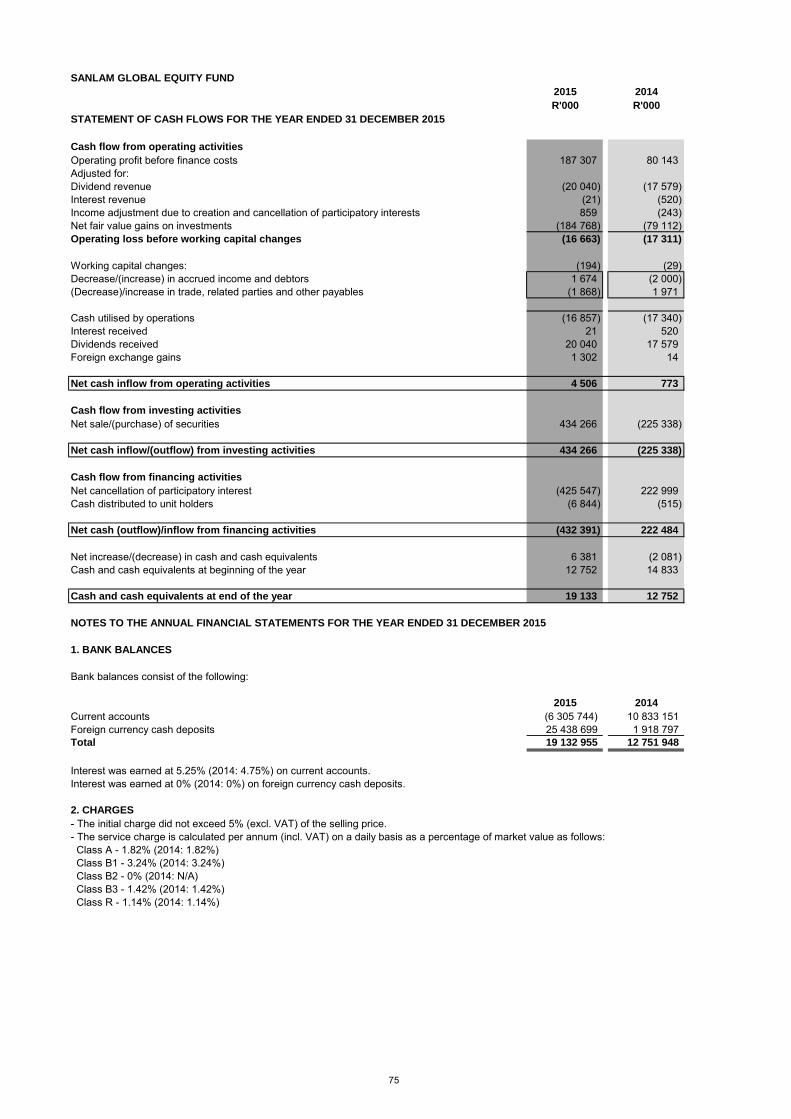
SANLAM GLOBAL EQUITY FUND
2015 2014
R'000 R'000
STATEMENT OF CASH FLOWS FOR THE YEAR ENDED 31 DECEMBER 2015
Cash flow from operating activities
Operating profit before finance costs 187 307 80 143 Adjusted for:Dividend revenue (20 040) (17 579) Interest revenue (21) (520) Income adjustment due to creation and cancellation of participatory interests 859 (243) Net fair value gains on investments (184 768) (79 112) Operating loss before working capital changes (16 663) (17 311)
Working capital changes: (194) (29) Decrease/(increase) in accrued income and debtors 1 674 (2 000) (Decrease)/increase in trade, related parties and other payables (1 868) 1 971
Cash utilised by operations (16 857) (17 340) Interest received 21 520 Dividends received 20 040 17 579 Foreign exchange gains 1 302 14
Net cash inflow from operating activities 4 506 773
Cash flow from investing activities
Net sale/(purchase) of securities 434 266 (225 338)
Net cash inflow/(outflow) from investing activities 434 266 (225 338)
Cash flow from financing activities
Net cancellation of participatory interest (425 547) 222 999 Cash distributed to unit holders (6 844) (515)
Net cash (outflow)/inflow from financing activities (432 391) 222 484
Net increase/(decrease) in cash and cash equivalents 6 381 (2 081) Cash and cash equivalents at beginning of the year 12 752 14 833
Cash and cash equivalents at end of the year 19 133 12 752
NOTES TO THE ANNUAL FINANCIAL STATEMENTS FOR THE YEAR ENDED 31 DECEMBER 2015
1. BANK BALANCES
Bank balances consist of the following:
2015 2014
Current accounts (6 305 744) 10 833 151 Foreign currency cash deposits 25 438 699 1 918 797 Total 19 132 955 12 751 948
Interest was earned at 5.25% (2014: 4.75%) on current accounts.Interest was earned at 0% (2014: 0%) on foreign currency cash deposits.
2. CHARGES
- The initial charge did not exceed 5% (excl. VAT) of the selling price.- The service charge is calculated per annum (incl. VAT) on a daily basis as a percentage of market value as follows: Class A - 1.82% (2014: 1.82%) Class B1 - 3.24% (2014: 3.24%) Class B2 - 0% (2014: N/A) Class B3 - 1.42% (2014: 1.42%) Class R - 1.14% (2014: 1.14%)
75
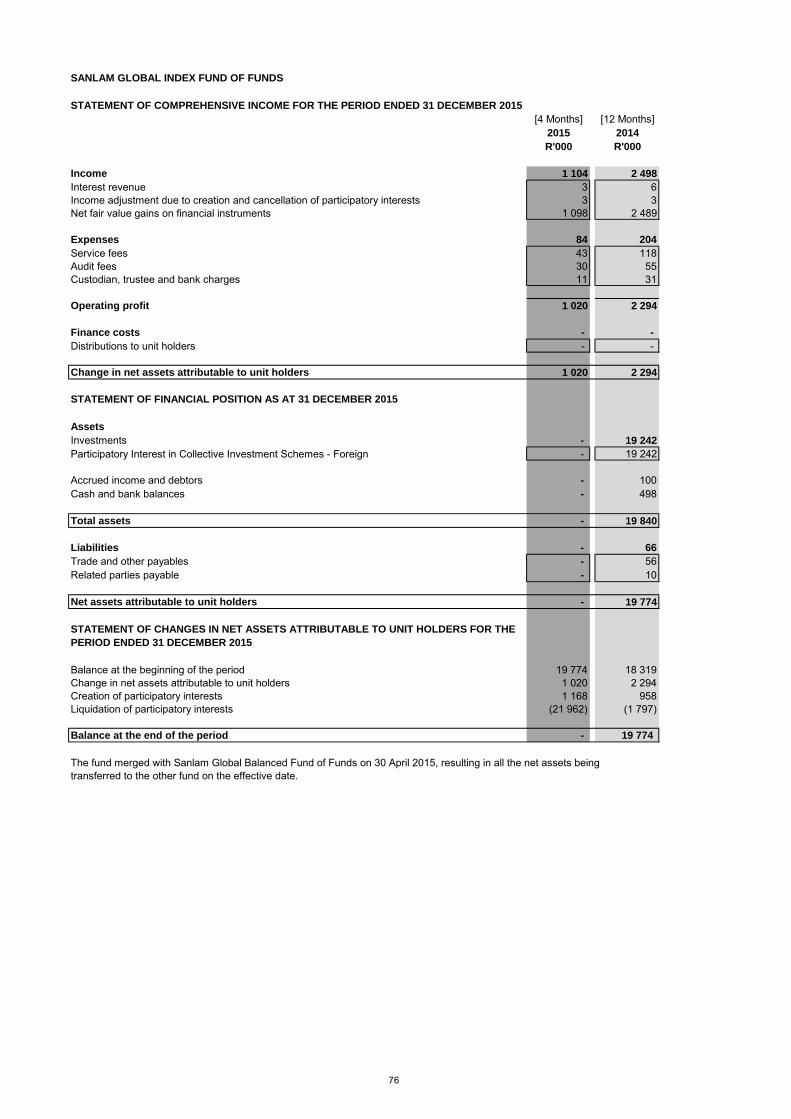
[4 Months] [12 Months]2015 2014
R'000 R'000
Income 1 104 2 498
Interest revenue 3 6Income adjustment due to creation and cancellation of participatory interests 3 3Net fair value gains on financial instruments 1 098 2 489
Expenses 84 204
Service fees 43 118Audit fees 30 55Custodian, trustee and bank charges 11 31
Operating profit 1 020 2 294
Finance costs - -
Distributions to unit holders - -
Change in net assets attributable to unit holders 1 020 2 294
STATEMENT OF FINANCIAL POSITION AS AT 31 DECEMBER 2015
Assets
Investments - 19 242
Participatory Interest in Collective Investment Schemes - Foreign - 19 242
Accrued income and debtors - 100Cash and bank balances - 498
Total assets - 19 840
Liabilities - 66
Trade and other payables - 56Related parties payable - 10
Net assets attributable to unit holders - 19 774
STATEMENT OF CHANGES IN NET ASSETS ATTRIBUTABLE TO UNIT HOLDERS FOR THE
PERIOD ENDED 31 DECEMBER 2015
Balance at the beginning of the period 19 774 18 319Change in net assets attributable to unit holders 1 020 2 294Creation of participatory interests 1 168 958Liquidation of participatory interests (21 962) (1 797)
Balance at the end of the period - 19 774
The fund merged with Sanlam Global Balanced Fund of Funds on 30 April 2015, resulting in all the net assets beingtransferred to the other fund on the effective date.
SANLAM GLOBAL INDEX FUND OF FUNDS
STATEMENT OF COMPREHENSIVE INCOME FOR THE PERIOD ENDED 31 DECEMBER 2015
76

SANLAM GLOBAL INDEX FUND OF FUNDS
[4 Months] [12 Months]2015 2014
R'000 R'000
Cash flow from operating activities
Operating profit before finance costs 1 020 2 294Adjusted for:Interest revenue (3) (6) Income adjustment due to creation and cancellation of participatory interests (3) (3) Net fair value gains on investments (1 098) (2 489)
Operating loss before working capital changes (84) (204)
Working capital changes: 34 (97)Increase in accrued income and debtors 100 (100)Increase in trade, related parties and other payables (66) 3
Cash utilised by operations (50) (301)Interest received 3 6Foreign exchange gains - 3
Net cash outflow from operating activities (47) (292)
Cash flow from investing activities
Net sale of securities 20 340 1 217
Net cash inflow from investing activities 20 340 1 217
Cash flow from financing activities
Net cancellation of participatory interest (20 791) (836)
Net cash outflow from financing activities (20 791) (836)
Net (decrease)/increase in cash and cash equivalents (498) 89Cash and cash equivalents at beginning of the period 498 409
Cash and cash equivalents at end of the period - 498
NOTES TO THE ANNUAL FINANCIAL STATEMENTS FOR THE PERIOD ENDED 31 DECEMBER 2015
1. BANK BALANCES
Bank balances consist of the following:
2015 2014
Current accounts - 196 569Foreign currency cash deposits - 301 282Total - 497 851
Interest was earned at 5.25% (2014: 4.75%) on current accounts.Interest was earned at 0% (2014: 0%) on foreign currency deposits.
2. CHARGES
No initial charge is payable.- The service charge is calculated per annum (incl. VAT) on a daily basis as a percentage of market value as follows:
Class B1 - 0.62% (2014: 0.62%)
STATEMENT OF CASH FLOWS FOR THE PERIOD ENDED 31 DECEMBER 2015
77

SANLAM GROWTH INSTITUTIONAL FUND
2015 2014
R'000 R'000
STATEMENT OF COMPREHENSIVE INCOME FOR THE YEAR ENDED 31 DECEMBER 2015
Income 78 813 254 988
Dividend revenue 71 363 77 213 Interest revenue 3 019 4 266 Income adjustment due to creation and cancellation of participatory interests (1 909) 1 027 Net fair value gains on financial instruments 6 340 172 482
Expenses 5 182 6 581
Service fees 457 688 Audit fees 58 69 Custodian, trustee and bank charges 463 786 Transaction costs 4 204 5 038
Operating profit 73 631 248 407
Finance costs 71 497 80 964
Distributions to unit holders 71 497 80 964
Change in net assets attributable to unit holders 2 134 167 443
STATEMENT OF FINANCIAL POSITION AS AT 31 DECEMBER 2015
Assets
Investments 2 300 420 2 891 942
Equities and specialist securities - Local 2 300 420 2 891 942
Accrued income and debtors 8 940 10 243
Cash and bank balances 43 830 88 691
Total assets 2 353 190 2 990 876
Liabilities 6 414 12 538
Trade and other payables 294 311 Distributions payable 6 120 12 227
Net assets attributable to unit holders 2 346 776 2 978 338
Balance at the beginning of the year 2 978 338 1 850 098 Change in net assets attributable to unit holders 2 134 167 443 Creation of participatory interests 351 959 1 430 650 Liquidation of participatory interests (985 655) (469 853)
Balance at the end of the year 2 346 776 2 978 338
STATEMENT OF CHANGES IN NET ASSETS ATTRIBUTABLE TO UNIT HOLDERS FOR THE
YEAR ENDED 31 DECEMBER 2015
78

SANLAM GROWTH INSTITUTIONAL FUND
2015 2014
R'000 R'000
STATEMENT OF CASH FLOWS FOR THE YEAR ENDED 31 DECEMBER 2015
Cash flow from operating activities
Operating profit before finance costs 73 631 248 407 Adjusted for:Dividend revenue (71 363) (77 213) Interest revenue (3 019) (4 266) Income adjustment due to creation and cancellation of participatory interests 1 909 (1 027) Net fair value gains on investments (6 340) (172 482) Operating loss before working capital changes (5 182) (6 581)
Working capital changes: 1 286 (5 889) Decrease/(increase) in accrued income and debtors 1 303 (6 054) (Decrease)/increase in trade, related parties and other payables (17) 165
Cash utilised by operations (3 896) (12 470) Interest received 3 019 4 266 Dividends received 71 363 77 213
Net cash inflow from operating activities 70 486 69 009
Cash flow from investing activities
Net sale/(purchase) of securities 597 861 (908 424)
Net cash inflow/(outflow) from investing activities 597 861 (908 424)
Cash flow from financing activities
Net (cancellation)/creation of participatory interest (713 205) 887 353 Cash distributed to by units holders (3) (40)
Net cash (outflow)/inflow from financing activities (713 208) 887 313
Net (decrease)/increase in cash and cash equivalents (44 861) 47 898 Cash and cash equivalents at beginning of the year 88 691 40 793
Cash and cash equivalents at end of the year 43 830 88 691
NOTES TO THE ANNUAL FINANCIAL STATEMENTS FOR THE YEAR ENDED 31 DECEMBER 2015
1. BANK BALANCES
Bank balances consist of the following:
2015 2014
Current accounts 1 383 825 1 523 842 Call deposits 39 600 000 82 600 000 SAFEX 2 846 175 4 567 158 Total 43 830 000 88 691 000
Interest was earned at 5.25% (2014: 4.75%) on current accounts.Interest was earned between 6%-6.15% (2014: 5.5%) on call deposit accounts.Interest was earned at 5.75% (2014: 4.75%) on SAFEX deposits.
2. CHARGES
- No initial charge is payable.- The service charge is calculated per annum (incl. VAT) on a daily basis as a percentage of market value as follows: Class B1 - 0% (2014: 0%) Class B2 - 0% (2014: 0%) Class B4 - 0.39% (2014: 0.39%) Class B5 - 0.93% (2014: 0.93%) Class B6 - 0.64% (2014: 0.64%) Class B8 - 0.79% (2014: 0.79%)
79

SANLAM INDIA OPPORTUNITIES FEEDER FUND
2015 2014
R'000 R'000
STATEMENT OF COMPREHENSIVE INCOME FOR THE YEAR ENDED 31 DECEMBER 2015
Income 63 481 30 106
Interest revenue (45) 101 Income adjustment due to creation and cancellation of participatory interests 74 (591) Net fair value gains on financial instruments 63 452 30 596
Expenses 3 093 1 140
Service fees 2 932 1 030 Audit fees 55 56 Custodian, trustee and bank charges 106 54
Operating profit 60 388 28 966
Finance costs - -
Distributions to unit holders - -
Change in net assets attributable to unit holders 60 388 28 966
STATEMENT OF FINANCIAL POSITION AS AT 31 DECEMBER 2015
Assets
Investments 288 440 172 838
Participatory Interest in Collective Investment Schemes - Foreign 288 440 172 838
Accrued income and debtors - 4
Cash and bank balances 1 032 5 846
Total assets 289 472 178 688
Liabilities 7 325 223
Cash and bank balances 6 963 - Trade and other payables 92 55 Related parties payable 270 168 Distributions payable - -
Net assets attributable to unit holders 282 147 178 465
Balance at the beginning of the year 178 465 59 710 Change in net assets attributable to unit holders 60 388 28 966 Creation of participatory interests 138 576 93 396 Liquidation of participatory interests (95 282) (3 607)
Balance at the end of the year 282 147 178 465
STATEMENT OF CHANGES IN NET ASSETS ATTRIBUTABLE TO UNIT HOLDERS FOR THE
YEAR ENDED 31 DECEMBER 2015
80

SANLAM INDIA OPPORTUNITIES FEEDER FUND
2015 2014
R'000 R'000
STATEMENT OF CASH FLOWS FOR THE YEAR ENDED 31 DECEMBER 2015
Cash flow from operating activities
Operating profit before finance costs 60 388 28 966 Adjusted for:Interest revenue 45 (101) Income adjustment due to creation and cancellation of participatory interests (74) 591 Net fair value gains on investments (63 452) (30 596) Operating loss before working capital changes (3 093) (1 140)
Working capital changes: 143 110 Decrease/(increase) in accrued income and debtors 4 (4) Increase in trade, related parties and other payables 139 114
Cash utilised by operations (2 950) (1 030) Interest (paid)/received (45) 101 Foreign exchange gains 32 9
Net cash outflow from operating activities (2 963) (920)
Cash flow from investing activities
Net purchase of securities (52 182) (83 387)
Net cash outflow from investing activities (52 182) (83 387)
Cash flow from financing activities
Net creation of participatory interest 43 368 89 198 Cash distributed to unit holders - -
Net cash inflow from financing activities 43 368 89 198
Net (decrease)/increase in cash and cash equivalents (11 777) 4 891 Cash and cash equivalents at beginning of the year 5 846 955
Cash and cash equivalents at end of the year (5 931) 5 846
NOTES TO THE ANNUAL FINANCIAL STATEMENTS FOR THE YEAR ENDED 31 DECEMBER 2015
1. BANK BALANCES
Bank balances consist of the following:
2015 2014
Current accounts (6 963 017) 2 458 021 Foreign currency cash deposits 1 032 458 3 388 128 Total (5 930 559) 5 846 149
Interest was earned at 5.25% (2014: 4.75%) on current accounts.Interest was earned at 0% (2014: 0%) on foreign currency cash deposits.
2. CHARGES
- The initial charge did not exceed 5% (excl. VAT) of the selling price.- The service charge is calculated per annum (incl. VAT) on a daily basis as a percentage of market value as follows: Class A - 1.14% (2014: 1.14%) Class B1 - 0.57% (2014: N/A)
81

SANLAM INSTITUTIONAL SPECIAL OPPORTUNITIES FUND
2015 2014
R'000 R'000
STATEMENT OF COMPREHENSIVE INCOME FOR THE YEAR ENDED 31 DECEMBER 2015
Income (33 267) 339 121
Dividend revenue 57 412 39 404 Interest revenue 44 419 29 079 Other income 84 113 Income adjustment due to creation and cancellation of participatory interests (2 042) (773) Net fair value (losses)/gains on financial instruments (133 140) 271 298
Expenses 7 320 6 316
Audit fees 90 49 Withholding tax 24 - Custodian, trustee and bank charges 303 387 Transaction costs 6 903 5 880
Operating (loss)/profit (40 587) 332 805
Finance costs 99 440 67 381
Distributions to unit holders 99 440 67 381
Change in net assets attributable to unit holders (140 027) 265 424
STATEMENT OF FINANCIAL POSITION AS AT 31 DECEMBER 2015
Assets
Investments 2 339 293 2 031 557
Equities and specialist securities - Local 2 339 293 2 031 557
Accrued income and debtors 2 902 9 710
Cash and bank balances 17 252 50 767
Total assets 2 359 447 2 092 034
Liabilities 53 720 58 483
Trade and other payables 2 139 23 167 Distributions payable 51 581 35 316
Net assets attributable to unit holders 2 305 727 2 033 551
Balance at the beginning of the year 2 033 551 1 824 870 Change in net assets attributable to unit holders (140 027) 265 424 Creation of participatory interests 655 895 111 165 Liquidation of participatory interests (243 692) (167 908)
Balance at the end of the year 2 305 727 2 033 551
STATEMENT OF CHANGES IN NET ASSETS ATTRIBUTABLE TO UNIT HOLDERS FOR THE
YEAR ENDED 31 DECEMBER 2015
82

SANLAM INSTITUTIONAL SPECIAL OPPORTUNITIES FUND
2015 2014
R'000 R'000
STATEMENT OF CASH FLOWS FOR THE YEAR ENDED 31 DECEMBER 2015
Cash flow from operating activities
Operating (loss)/profit before finance costs (40 587) 332 805 Adjusted for:Dividend revenue (57 412) (39 404) Interest revenue (44 419) (29 079) Income adjustment due to creation and cancellation of participatory interests 2 042 773 Net fair value losses/(gains) on investments 133 140 (271 298) Operating loss before working capital changes (7 236) (6 203)
Working capital changes: (14 220) 16 572 Decrease/(increase) in accrued income and debtors 6 808 (6 538) (Decrease)/increase in trade, related parties and other payables (21 028) 23 110
Cash (utilised)/generated by operations (21 456) 10 369 Interest received 44 419 29 079 Dividends received 57 412 39 404
Net cash inflow from operating activities 80 375 78 852
Cash flow from investing activities
Net (purchase)/sale of securities (440 876) 51 277
Net cash (outflow)/inflow from investing activities (440 876) 51 277
Cash flow from financing activities
Net creation/(cancellation) of participatory interest 410 161 (129 212) Cash distributed to unit holders (83 175) (291)
Net cash inflow/(outflow) from financing activities 326 986 (129 503)
Net (decrease)/increase in cash and cash equivalents (33 515) 626 Cash and cash equivalents at beginning of the year 50 767 50 141
Cash and cash equivalents at end of the year 17 252 50 767
NOTES TO THE ANNUAL FINANCIAL STATEMENTS FOR THE YEAR ENDED 31 DECEMBER 2015
1. BANK BALANCES
Bank balances consist of the following:
2015 2014
Current accounts 17 251 877 50 766 977 Total 17 251 877 50 766 977
Interest was earned at 5.25% (2014: 4.75%) on current accounts.
2. CHARGES
- No initial and service charges are payable.
83

SANLAM MARKET ALLOCATOR FUND
2015 2014
R'000 R'000
STATEMENT OF COMPREHENSIVE INCOME FOR THE YEAR ENDED 31 DECEMBER 2015
Income 4 610 6 288
Dividend revenue 1 251 1 200 Interest revenue 1 223 932 Rebates earned 102 - Income adjustment due to creation and cancellation of participatory interests (156) (26) Net fair value gains on financial instruments 2 190 4 182
Expenses 194 213
Service fees 89 34 Audit fees 38 59 Withholding tax 9 9 Custodian, trustee and bank charges 36 73 Transaction costs 22 38
Operating profit 4 416 6 075
Finance costs 2 249 1 930
Distributions to unit holders 2 249 1 930
Change in net assets attributable to unit holders 2 167 4 145
STATEMENT OF FINANCIAL POSITION AS AT 31 DECEMBER 2015
Assets
Investments 40 646 60 372
Equities and specialist securities - Local 24 780 38 175 Participatory Interest in Collective Investment Schemes - Local 8 975 13 537 Participatory Interest in Collective Investment Schemes - Foreign 6 891 8 660
Accrued income and debtors 20 12
Cash and bank balances 1 692 3 577
Total assets 42 358 63 961
Liabilities 483 551
Trade and other payables 40 64 Related parties payable 8 4 Distributions payable 435 483
Net assets attributable to unit holders 41 875 63 410
Balance at the beginning of the year 63 410 55 858 Change in net assets attributable to unit holders 2 167 4 145 Creation of participatory interests 5 314 12 389 Liquidation of participatory interests (29 016) (8 982)
Balance at the end of the year 41 875 63 410
STATEMENT OF CHANGES IN NET ASSETS ATTRIBUTABLE TO UNIT HOLDERS FOR THE
YEAR ENDED 31 DECEMBER 2015
84

SANLAM MARKET ALLOCATOR FUND
2015 2014
R'000 R'000
STATEMENT OF CASH FLOWS FOR THE YEAR ENDED 31 DECEMBER 2015
Cash flow from operating activities
Operating profit before finance costs 4 416 6 075 Adjusted for:Dividend revenue (1 251) (1 200) Interest revenue (1 223) (932) Income adjustment due to creation and cancellation of participatory interests 156 26 Net fair value gains on investments (2 190) (4 182) Operating loss before working capital changes (92) (213)
Working capital changes: (28) 1 493 (Increase)/decrease in accrued income and debtors (8) 1 488 (Decrease)/increase in trade, related parties and other payables (20) 5
Cash (utilised)/generated by operations (120) 1 280 Interest received 1 223 932 Dividends received 1 251 1 200
Net cash inflow from operating activities 2 354 3 412
Cash flow from investing activities
Net sale/(purchase) of securities 21 916 (2 280)
Net cash inflow/(outflow) from investing activities 21 916 (2 280)
Cash flow from financing activities
Net (cancellation)/creation of participatory interest (23 858) 1 426 Cash distributed to unit holders (2 297) (2)
Net cash (outflow)/inflow from financing activities (26 155) 1 424
Net (decrease)/increase in cash and cash equivalents (1 885) 2 556 Cash and cash equivalents at beginning of the year 3 577 1 021
Cash and cash equivalents at end of the year 1 692 3 577
NOTES TO THE ANNUAL FINANCIAL STATEMENTS FOR THE YEAR ENDED 31 DECEMBER 2015
1. BANK BALANCES
Bank balances consist of the following:
2015 2014
Current accounts 1 226 787 3 236 769 Foreign currency cash deposits 33 25 SAFEX 465 129 340 340 Total 1 691 949 3 577 134
Interest was earned at 5.25% (2014: 4.75%) on current accounts.Interest was earned at 0% (2014: 0%) on foreign currency cash deposits.Interest was earned at 4.75% (2014: 4.75%) on SAFEX deposits.
2. CHARGES
- The initial charge did not exceed 4% (excl. VAT) of the selling price.- The service charge is calculated per annum (incl. VAT) on a daily basis as a percentage of market value as follows: Class A1- 1.14% (2014: 1.14%) Class B1 - 0% (2014: 0%) Class B2 - 0.68% (2014: 0.68%) Class B3 - 0.68% (2014: 0.68%)
85

SANLAM MULTI MANAGED ABSOLUTE SOLUTION 5 FUND OF FUNDS
2015 2014
R'000 R'000
STATEMENT OF COMPREHENSIVE INCOME FOR THE YEAR ENDED 31 DECEMBER 2015
Income 62 933 46 016
Dividend revenue 5 331 2 624 Interest revenue 13 639 8 727 Other income 2 - Rebates earned 140 83 Income adjustment due to creation and cancellation of participatory interests 1 674 265 Net fair value gains on financial instruments 42 147 34 317
Expenses 6 420 3 730
Service fees 6 266 3 560 Audit fees 55 57 Withholding tax 23 18 Custodian, trustee and bank charges 50 45 Transaction costs 26 50
Operating profit 56 513 42 286
Finance costs 15 268 9 784
Distributions to unit holders 15 268 9 784
Change in net assets attributable to unit holders 41 245 32 502
STATEMENT OF FINANCIAL POSITION AS AT 31 DECEMBER 2015
Assets
Investments 737 751 429 448
Participatory Interest in Collective Investment Schemes - Local 563 516 333 269 Participatory Interest in Collective Investment Schemes - Foreign 174 235 96 179
Accrued income and debtors 43 8
Cash and bank balances 54 227 8 821
Total assets 792 021 438 277
Liabilities 4 252 3 383
Trade and other payables 60 57 Related parties payable 633 338 Distributions payable 3 559 2 988
Net assets attributable to unit holders 787 769 434 894
Balance at the beginning of the year 434 894 354 079 Change in net assets attributable to unit holders 41 245 32 502 Creation of participatory interests 412 259 80 929 Liquidation of participatory interests (100 629) (32 616)
Balance at the end of the year 787 769 434 894
STATEMENT OF CHANGES IN NET ASSETS ATTRIBUTABLE TO UNIT HOLDERS FOR THE
YEAR ENDED 31 DECEMBER 2015
86

SANLAM MULTI MANAGED ABSOLUTE SOLUTION 5 FUND OF FUNDS
2015 2014
R'000 R'000
STATEMENT OF CASH FLOWS FOR THE YEAR ENDED 31 DECEMBER 2015
Cash flow from operating activities
Operating profit before finance costs 56 513 42 286 Adjusted for:Dividend revenue (5 331) (2 624) Interest revenue (13 639) (8 727) Income adjustment due to creation and cancellation of participatory interests (1 674) (265) Net fair value gains on investments (42 147) (34 317) Operating loss before working capital changes (6 278) (3 647)
Working capital changes: 263 65 Increase in accrued income and debtors (35) (5) Increase in trade, related parties and other payables 298 70
Cash utilised by operations (6 015) (3 582) Interest received 13 639 8 727 Dividends received 5 331 2 624 Foreign exchange gains 452 40
Net cash inflow from operating activities 13 407 7 809
Cash flow from investing activities
Net purchase of securities (266 608) (59 364)
Net cash outflow from investing activities (266 608) (59 364)
Cash flow from financing activities
Net creation of participatory interest 313 304 40 731 Cash distributed to by unit holders (14 697) (750)
Net cash inflow from financing activities 298 607 39 981
Net increase/(decrease) in cash and cash equivalents 45 406 (11 574) Cash and cash equivalents at beginning of the year 8 821 20 395
Cash and cash equivalents at end of the year 54 227 8 821
NOTES TO THE ANNUAL FINANCIAL STATEMENTS FOR THE YEAR ENDED 31 DECEMBER 2015
1. BANK BALANCES
Bank balances consist of the following:
2015 2014
Current accounts 36 900 616 7 993 413 Foreign currency cash deposits 17 326 120 828 482 Total 54 226 736 8 821 895
Interest was earned at 5.25% (2014: 4.75%) on current accounts.Interest was earned at 0% (2014: 0%) on foreign currency cash deposits.
2. CHARGES
- The initial charge did not exceed 4.1% (excl. VAT) of the selling price.- The service charge is calculated per annum (incl. VAT) on a daily basis as a percentage of market value as follows: Class A - 1.02% (2014: 1.02%) Class A2 - 0.85% (2014: 0.85%) Class B1 - 0.74% (2014: 0.74%) Class B2 - 0.74% (2014: 0.74%) Class B3 - 0.88% (2014: 0.88%) Class B4 - 1.02% (2014: 1.02%) Class B9 - 1.14% (2014: 1.14%) Class C - 2.16% (2014: 2.16%) Class C2 - 2.49% (2014: 2.49%)
87

SANLAM MULTI MANAGED AGGRESSIVE FUND OF FUNDS
2015 2014
R'000 R'000
STATEMENT OF COMPREHENSIVE INCOME FOR THE YEAR ENDED 31 DECEMBER 2015
Income 6 196 11 735
Dividend revenue 1 860 1 675 Interest revenue 1 802 1 809 Other income 3 1 Rebates earned 6 - Income adjustment due to creation and cancellation of participatory interests (65) (54) Net fair value gains on financial instruments 2 590 8 304
Expenses 1 299 1 487
Service fees 1 218 1 372 Audit fees 38 59 Withholding tax 9 2 Custodian, trustee and bank charges 34 35 Transaction costs - 19
Operating profit 4 897 10 248
Finance costs 2 329 1 958
Distributions to unit holders 2 329 1 958
Change in net assets attributable to unit holders 2 568 8 290
STATEMENT OF FINANCIAL POSITION AS AT 31 DECEMBER 2015
Assets
Investments 103 065 109 727
Participatory Interest in Collective Investment Schemes - Local 78 895 85 607 Participatory Interest in Collective Investment Schemes - Foreign 24 170 24 120
Accrued income and debtors 1 1
Cash and bank balances 2 158 959
Total assets 105 224 110 687
Liabilities 1 547 1 179
Trade and other payables 40 59 Related parties payable 107 145 Distributions payable 1 400 975
Net assets attributable to unit holders 103 677 109 508
Balance at the beginning of the year 109 508 108 721 Change in net assets attributable to unit holders 2 568 8 290 Creation of participatory interests 18 535 18 031 Liquidation of participatory interests (26 934) (25 534)
Balance at the end of the year 103 677 109 508
STATEMENT OF CHANGES IN NET ASSETS ATTRIBUTABLE TO UNIT HOLDERS FOR THE
YEAR ENDED 31 DECEMBER 2015
88

SANLAM MULTI MANAGED AGGRESSIVE FUND OF FUNDS
2015 2014
R'000 R'000
STATEMENT OF CASH FLOWS FOR THE YEAR ENDED 31 DECEMBER 2015
Cash flow from operating activities 4 897 10 248 Operating profit before finance costsAdjusted for: (1 860) (1 675) Dividend revenue (1 802) (1 809) Interest revenue 65 54 Income adjustment due to creation and cancellation of participatory interests (2 590) (8 304) Net fair value gains on investmentsOperating loss before working capital changes (1 290) (1 486)
Working capital changes: (57) 21 (Decrease)/increase in trade, related parties and other payables (57) 21
Cash utilised by operations (1 347) (1 465) Interest received 1 802 1 809 Dividends received 1 860 1 675 Foreign exchange gains 114 16
Net cash inflow from operating activities 2 429 2 035
Cash flow from investing activities
Net sale of securities 9 138 5 308
Net cash inflow from investing activities 9 138 5 308
Cash flow from financing activities
Net cancellation of participatory interest (8 464) (9 449) Cash (distributed to)/reinvested by unit holders (1 904) 42
Net cash outflow from financing activities (10 368) (9 407)
Net increase/(decrease) in cash and cash equivalents 1 199 (2 064) Cash and cash equivalents at beginning of the year 959 3 023
Cash and cash equivalents at end of the year 2 158 959
NOTES TO THE ANNUAL FINANCIAL STATEMENTS FOR THE YEAR ENDED 31 DECEMBER 2015
1. BANK BALANCES
Bank balances consist of the following:
2015 2014
Current accounts 617 567 533 188 Foreign currency cash deposits 1 540 591 425 839 Total 2 158 158 959 027
Interest was earned at 5.25% (2014: 4.75%) on current accounts.Interest was earned at 0% (2014: 0%) on foreign currency cash deposits.
2. CHARGES
- The initial charge did not exceed 4.25% (excl. VAT) of the selling price.- The service charge is calculated per annum (incl. VAT) on a daily basis as a percentage of market value as follows: Class A1 - 1.08% (2014: 1.08%) Class A2 - 1.19% (2014: 1.19%) Class B1 - 0.74% (2014: 0.74%) Class B9 - 1.53% (2014: 1.53%) Class C1 - 3.02% (2014: 3.02%)
89

SANLAM MULTI MANAGED BALANCED FUND OF FUNDS
2015 2014
R'000 R'000
STATEMENT OF COMPREHENSIVE INCOME FOR THE YEAR ENDED 31 DECEMBER 2015
Income 105 139 30 241
Dividend revenue 13 782 2 342 Interest revenue 13 278 2 746 Other income - 1 Rebates earned 1 140 23 Income adjustment due to creation and cancellation of participatory interests 17 679 (52) Net fair value gains on financial instruments 59 260 25 181
Expenses 7 668 2 401
Service fees 7 289 2 204 Audit fees 56 54 Withholding tax 233 - Custodian, trustee and bank charges 90 39 Transaction costs - 104
Operating profit 97 471 27 840
Finance costs 38 200 3 135
Distributions to unit holders 38 200 3 135
Change in net assets attributable to unit holders 59 271 24 705
STATEMENT OF FINANCIAL POSITION AS AT 31 DECEMBER 2015
Assets
Investments 1 839 863 268 007
Participatory Interest in Collective Investment Schemes - Local 1 839 863 268 007
Accrued income and debtors 36 2
Cash and bank balances 35 127 2 182
Total assets 1 875 026 270 191
Liabilities 27 151 1 963
Trade and other payables 71 55 Related parties payable 981 495 Distributions payable 26 099 1 413
Net assets attributable to unit holders 1 847 875 268 228
Balance at the beginning of the year 268 228 250 415 Change in net assets attributable to unit holders 59 271 24 705 Creation of participatory interests 1 753 459 31 214 Liquidation of participatory interests (233 083) (38 106)
Balance at the end of the year 1 847 875 268 228
STATEMENT OF CHANGES IN NET ASSETS ATTRIBUTABLE TO UNIT HOLDERS FOR THE
YEAR ENDED 31 DECEMBER 2015
90

SANLAM MULTI MANAGED BALANCED FUND OF FUNDS
2015 2014
R'000 R'000
STATEMENT OF CASH FLOWS FOR THE YEAR ENDED 31 DECEMBER 2015
Cash flow from operating activities
Operating profit before finance costs 97 471 27 840 Adjusted for:Dividend revenue (13 782) (2 342) Interest revenue (13 278) (2 746) Income adjustment due to creation and cancellation of participatory interests (17 679) 52 Net fair value gains on investments (59 260) (25 181) Operating loss before working capital changes (6 528) (2 377)
Working capital changes: 468 259 Decrease in accrued income and debtors (34) - Increase in trade, related parties and other payables 502 259
Cash utilised by operations (6 060) (2 118) Interest received 13 278 2 746 Dividends received 13 782 2 342
Net cash inflow from operating activities 21 000 2 970
Cash flow from investing activities
Net (purchase)/sale of securities (1 512 596) 4 763
Net cash (outflow)/inflow from investing activities (1 512 596) 4 763
Cash flow from financing activities
Net creation/(cancellation) of participatory interest 1 538 055 (10 529) Cash distributed to units holders (13 514) (24)
Net cash inflow/(outflow) from financing activities 1 524 541 (10 553)
Net increase/(decrease) in cash and cash equivalents 32 945 (2 820) Cash and cash equivalents at beginning of the year 2 182 5 002
Cash and cash equivalents at end of the year 35 127 2 182
NOTES TO THE ANNUAL FINANCIAL STATEMENTS FOR THE YEAR ENDED 31 DECEMBER 2015
1. BANK BALANCES
Bank balances consist of the following:
2015 2014
Current accounts 35 126 923 2 182 061 Total 35 126 923 2 182 061
Interest was earned at 5.25% (2014: 4.75%) on current accounts.
2. CHARGES
- The initital charge did not exceed 5% (excl. VAT) of the selling price.- The service charge is calculated per annum (incl. VAT) on a daily basis as a percentage of market value as follows: Class A - 1.42% (2014: 1.42%) Class A2 - 0.85% (2014: 0.85%) Class B - 0.85% (2014: 0.85%) Class B1 - 0.39% (2014: N/A) Class B2 - 0.57% (2014: 0.68%) Class B3 - 0.87% (2014: 0.88%) Class B9 - 1.14% (2014: 1.14%) Class C1 - 2.16% (2014: 2.16%)
91

SANLAM MULTI MANAGED CAUTIOUS FUND OF FUNDS
2015 2014
R'000 R'000
STATEMENT OF COMPREHENSIVE INCOME FOR THE YEAR ENDED 31 DECEMBER 2015
Income 17 195 16 556
Dividend revenue 1 114 595 Interest revenue 5 371 5 412 Other income 2 - Rebates earned 106 - Income adjustment due to creation and cancellation of participatory interests 111 (87) Net fair value gains on financial instruments 10 491 10 636
Expenses 3 292 3 408
Service fees 3 197 3 293 Audit fees 55 66 Withholding tax 15 1 Custodian, trustee and bank charges 25 33 Transaction costs - 15
Operating profit 13 903 13 148
Finance costs 4 180 3 851
Distributions to unit holders 4 180 3 851
Change in net assets attributable to unit holders 9 723 9 297
STATEMENT OF FINANCIAL POSITION AS AT 31 DECEMBER 2015
Assets
Investments 171 345 165 235
Participatory Interest in Collective Investment Schemes - Local 171 345 165 235
Accrued income and debtors - -
Cash and bank balances - 9
Total assets 171 345 165 244
Liabilities 414 525
Cash and bank balances 93 -
Trade and other payables 57 67 Related parties payable 264 274 Distributions payable - 184
Net assets attributable to unit holders 170 931 164 719
Balance at the beginning of the year 164 719 171 163 Change in net assets attributable to unit holders 9 723 9 297 Creation of participatory interests 40 901 17 198 Liquidation of participatory interests (44 412) (32 939)
Balance at the end of the year 170 931 164 719
STATEMENT OF CHANGES IN NET ASSETS ATTRIBUTABLE TO UNIT HOLDERS FOR THE
YEAR ENDED 31 DECEMBER 2015
92

SANLAM MULTI MANAGED CAUTIOUS FUND OF FUNDS
2015 2014
R'000 R'000
STATEMENT OF CASH FLOWS FOR THE YEAR ENDED 31 DECEMBER 2015
Cash flow from operating activities
Operating profit before finance costs 13 903 13 148 Adjusted for:Dividend revenue (1 114) (595) Interest revenue (5 371) (5 412) Income adjustment due to creation and cancellation of participatory interests (111) 87 Net fair value gains on investments (10 491) (10 636) Operating loss before working capital changes (3 184) (3 408)
Working capital changes: (20) (5) Decrease in trade, related parties and other payables (20) (5)
Cash utilised by operations (3 204) (3 413) Interest received 5 371 5 412 Dividends received 1 114 595
Net cash inflow from operating activities 3 281 2 594
Cash flow from investing activities
Net sale of securities 4 381 8 632
Net cash inflow from investing activities 4 381 8 632
Cash flow from financing activities
Net cancellation of participatory interest (3 400) (20 590) Cash (distributed to)/reinvested by unit holders (4 364) 2
Net cash outflow from financing activities (7 764) (20 588)
Net decrease in cash and cash equivalents (102) (9 362) Cash and cash equivalents at beginning of the year 9 9 371
Cash and cash equivalents at end of the year (93) 9
NOTES TO THE ANNUAL FINANCIAL STATEMENTS FOR THE YEAR ENDED 31 DECEMBER 2015
1. BANK BALANCES
Bank balances consist of the following:
2015 2014
Current accounts (92 681) (6 037) Foreign currency cash deposits - 15 374 Total (92 681) 9 337
Interest was earned at 5.25% (2014: 4.75%) on current accounts.Interest was earned at N/A (2014: 0%) on foreign currency cash deposits.
2. CHARGES
The initial charge did not exceed 4.25% (excl. VAT) of the selling price.- The service charge is calculated per annum (incl. VAT) on a daily basis as a percentage of market value as follows: Class A1- 1.08% (2014: 1.08%) Class A2 - 1.19% (2014: 1.19%) Class B1- 0.74% (2014: 0.74%) Class B9 - 1.53% (2014: 1.53%) Class C1 - 3.02% (2014: 3.02%)
93

SANLAM MULTI MANAGED CONSERVATIVE FUND OF FUNDS
2015 2014
R'000 R'000
STATEMENT OF COMPREHENSIVE INCOME FOR THE YEAR ENDED 31 DECEMBER 2015
Income 42 555 51 576
Dividend revenue 1 531 1 106 Interest revenue 28 309 31 166 Other income 6 - Rebates earned 328 - Income adjustment due to creation and cancellation of participatory interests (1 074) (1 305) Net fair value gains on financial instruments 13 455 20 609
Expenses 9 150 11 173
Service fees 9 037 11 017 Audit fees 55 66 Withholding tax 13 7 Custodian, trustee and bank charges 45 56 Transaction costs - 27
Operating profit 33 405 40 403
Finance costs 19 954 21 580
Distributions to unit holders 19 954 21 580
Change in net assets attributable to unit holders 13 451 18 823
STATEMENT OF FINANCIAL POSITION AS AT 31 DECEMBER 2015
Assets
Investments 469 754 552 305
Participatory Interest in Collective Investment Schemes - Local 469 754 552 305
Accrued income and debtors - -
Cash and bank balances - -
Total assets 469 754 552 305
Liabilities 4 659 6 126
Cash and bank balances 686 905 Trade and other payables 61 69 Related parties payable 703 838 Distributions payable 3 209 4 314
Net assets attributable to unit holders 465 095 546 179
Balance at the beginning of the year 546 179 668 413 Change in net assets attributable to unit holders 13 451 18 823 Creation of participatory interests 29 508 30 850 Liquidation of participatory interests (124 043) (171 907)
Balance at the end of the year 465 095 546 179
STATEMENT OF CHANGES IN NET ASSETS ATTRIBUTABLE TO UNIT HOLDERS FOR THE
YEAR ENDED 31 DECEMBER 2015
94

SANLAM MULTI MANAGED CONSERVATIVE FUND OF FUNDS
2015 2014
R'000 R'000
STATEMENT OF CASH FLOWS FOR THE YEAR ENDED 31 DECEMBER 2015
Cash flow from operating activities
Operating profit before finance costs 33 405 40 403 Adjusted for:Dividend revenue (1 531) (1 106) Interest revenue (28 309) (31 166) Income adjustment due to creation and cancellation of participatory interests 1 074 1 305 Net fair value gains on investments (13 455) (20 609) Operating loss before working capital changes (8 816) (11 173)
Working capital changes: (143) (190) Decrease in accrued income and debtors - 1 Decrease in trade, related parties and other payables (143) (191)
Cash utilised by operations (8 959) (11 363) Interest received 28 309 31 166 Dividends received 1 531 1 106
Net cash inflow from operating activities 20 881 20 909
Cash flow from investing activities
Net sale of securities 96 006 122 998
Net cash inflow from investing activities 96 006 122 998
Cash flow from financing activities
Net cancellation of participatory interest (95 609) (164 280) Cash distributed to unit holders (21 059) -
Net cash outflow from financing activities (116 668) (164 280)
Net increase/(decrease) in cash and cash equivalents 219 (20 373) Cash and cash equivalents at beginning of the year (905) 19 468
Cash and cash equivalents at end of the year (686) (905)
NOTES TO THE ANNUAL FINANCIAL STATEMENTS FOR THE YEAR ENDED 31 DECEMBER 2015
1. BANK BALANCES
Bank balances consist of the following:
2015 2014
Current accounts (686 313) (932 956) Total (686 313) (932 956)
Interest was earned at 5.25% (2014: 4.75%) on current accounts.
2. CHARGES
- The initial charge did not exceed 4.25% (excl. VAT) of the selling price.- The service charge is calculated per annum (incl. VAT) on a daily basis as a percentage of market value as follows: Class A1 - 1.08% (2014: 1.08%) Class A2 - 1.19% (2014: 1.19%) Class B1 - 0.74% (2014: 0.74%) Class B9 - 1.48% (2014: 1.48%) Class C1 - 2.96% (2014: 2.96%)
95

SANLAM MULTI MANAGED DEFENSIVE FUND OF FUNDS
2015 2014
R'000 R'000
STATEMENT OF COMPREHENSIVE INCOME FOR THE YEAR ENDED 31 DECEMBER 2015
Income 42 106 19 275
Dividend revenue 2 142 883 Interest revenue 11 238 6 198 Rebates earned 303 - Income adjustment due to creation and cancellation of participatory interests 3 921 (120) Net fair value gains on financial instruments 24 502 12 314
Expenses 4 278 3 203
Service fees 4 078 3 070 Audit fees 55 52 Withholding tax 105 - Custodian, trustee and bank charges 40 38 Transaction costs - 43
Operating profit 37 828 16 072
Finance costs 13 351 4 491
Distributions to unit holders 13 351 4 491
Change in net assets attributable to unit holders 24 477 11 581
STATEMENT OF FINANCIAL POSITION AS AT 31 DECEMBER 2015
Assets
Investments 644 774 244 565
Participatory Interest in Collective Investment Schemes - Local 644 774 244 565
Accrued income and debtors 4 1
Cash and bank balances 4 808 895
Total assets 649 586 245 461
Liabilities 9 202 2 331
Trade and other payables 63 51 Related parties payable 471 280 Distributions payable 8 668 2 000
Net assets attributable to unit holders 640 384 243 130
Balance at the beginning of the year 243 130 244 924 Change in net assets attributable to unit holders 24 477 11 581 Creation of participatory interests 426 835 14 168 Liquidation of participatory interests (54 058) (27 543)
Balance at the end of the year 640 384 243 130
STATEMENT OF CHANGES IN NET ASSETS ATTRIBUTABLE TO UNIT HOLDERS FOR THE
YEAR ENDED 31 DECEMBER 2015
96

SANLAM MULTI MANAGED DEFENSIVE FUND OF FUNDS
2015 2014
R'000 R'000
STATEMENT OF CASH FLOWS FOR THE YEAR ENDED 31 DECEMBER 2015
Cash flow from operating activities
Operating profit before finance costs 37 828 16 072 Adjusted for:Dividend revenue (2 142) (883) Interest revenue (11 238) (6 198) Income adjustment due to creation and cancellation of participatory interests (3 921) 120 Net fair value gains on investments (24 502) (12 314) Operating loss before working capital changes (3 975) (3 203)
Working capital changes: 200 (1) Increase in accrued income and debtors (3) - Increase/(decrease) in trade, related parties and other payables 203 (1)
Cash utilised by operations (3 775) (3 204) Interest received 11 238 6 198 Dividends received 2 142 883 Foreign exchange gains 1 -
Net cash inflow from operating activities 9 606 3 877
Cash flow from investing activities
Net (purchase)/sale of securities (375 708) 4 035
Net cash (outflow)/inflow from investing activities (375 708) 4 035
Cash flow from financing activities
Net creation/(cancellation) of participatory interest 376 698 (18 767) Cash distributed to units holders (6 683) (39)
Net cash inflow/(outflow) from financing activities 370 015 (18 806)
Net increase/(decrease) in cash and cash equivalents 3 913 (10 894) Cash and cash equivalents at beginning of the year 895 11 789
Cash and cash equivalents at end of the year 4 808 895
NOTES TO THE ANNUAL FINANCIAL STATEMENTS FOR THE YEAR ENDED 31 DECEMBER 2015
1. BANK BALANCES
Bank balances consist of the following:
2015 2014
Current accounts 4 806 284 893 877 Foreign currency cash deposits 1 764 1 395 Total 4 808 048 895 272
Interest was earned at 5.25% (2014: 4.75%) on current accounts.Interest was earned at 0% (2014: 0%) on foreign currency cash deposits.
2. CHARGES
- The initial charge did not exceed 5% (excl. VAT) of the selling price.- The service charge is calculated per annum (incl. VAT) on a daily basis as a percentage of market value as follows: Class A1 - 0.91% (2014: 1.42%) Class A2 - N/A (2014: 0.85%) Class B1 - 0% (2014: N/A) Class B2 - 0% (2014: 0.68%) Class B3 - 0.79% (2014: 0.88%) Class B4 - 1.02% (2014: N/A) Class B9 - N/A (2014: 1.14%) Class C1 - N/A (2014: 2.16%)
97

SANLAM MULTI MANAGED EQUITY FUND
2015 2014
R'000 R'000
STATEMENT OF COMPREHENSIVE INCOME FOR THE YEAR ENDED 31 DECEMBER 2015
Income (7 793) 145 585
Dividend revenue 24 459 38 211 Interest revenue 1 194 1 550 Other income 42 19 Income adjustment due to creation and cancellation of participatory interests (152) (4 943) Net fair value (losses)/gains on financial instruments (33 336) 110 748
Expenses 2 374 5 272
Service fees 78 1 578 Performance fees 180 - Audit fees 72 58 Withholding tax 57 170 Custodian, trustee and bank charges 229 756 Transaction costs 1 758 2 710
Operating (loss)/profit (10 167) 140 313
Finance costs 24 929 32 299
Distributions to unit holders 24 929 32 299
Change in net assets attributable to unit holders (35 096) 108 014
STATEMENT OF FINANCIAL POSITION AS AT 31 DECEMBER 2015
Assets
Investments 697 834 802 948
Equities and specialist securities - Local 591 675 802 948 Participatory Interest in Collective Investment Schemes - Local 106 159 -
Accrued income and debtors 875 1 269
Cash and bank balances 22 264 10 763
Total assets 720 973 814 980
Liabilities 11 927 11 809
Trade and other payables 103 135 Related parties payable 95 40 Distributions payable 11 729 11 634
Net assets attributable to unit holders 709 046 803 171
Balance at the beginning of the year 803 171 1 532 466 Change in net assets attributable to unit holders (35 096) 108 014 Creation of participatory interests 62 242 100 459 Liquidation of participatory interests (121 271) (937 768)
Balance at the end of the year 709 046 803 171
STATEMENT OF CHANGES IN NET ASSETS ATTRIBUTABLE TO UNIT HOLDERS FOR THE
YEAR ENDED 31 DECEMBER 2015
98

SANLAM MULTI MANAGED EQUITY FUND
2015 2014
R'000 R'000
STATEMENT OF CASH FLOWS FOR THE YEAR ENDED 31 DECEMBER 2015
Cash flow from operating activities
Operating (loss)/profit before finance costs (10 167) 140 313 Adjusted for:Dividend revenue (24 459) (38 211) Interest revenue (1 194) (1 550) Income adjustment due to creation and cancellation of participatory interests 152 4 943 Net fair value losses/(gains) on investments 33 336 (110 748) Operating loss before working capital changes (2 332) (5 253)
Working capital changes: 417 122 083 Decrease in accrued income and debtors 394 134 861 Increase/(decrease) in trade, related parties and other payables 23 (12 778)
Cash (utilised)/generated by operations (1 915) 116 830 Interest received 1 194 1 550 Dividends received 24 459 38 211
Net cash inflow from operating activities 23 738 156 591
Cash flow from investing activities
Net sale of securities 71 778 683 197
Net cash inflow from investing activities 71 778 683 197
Cash flow from financing activities
Net cancellation of participatory interest (59 181) (885 136) Cash (distributed to)/reinvested by unit holders (24 834) 41
Net cash outflow from financing activities (84 015) (885 095)
Net increase/(decrease) in cash and cash equivalents 11 501 (45 307) Cash and cash equivalents at beginning of the year 10 763 56 070
Cash and cash equivalents at end of the year 22 264 10 763
NOTES TO THE ANNUAL FINANCIAL STATEMENTS FOR THE YEAR ENDED 31 DECEMBER 2015
1. BANK BALANCES
Bank balances consist of the following:
2015 2014
Current accounts 19 639 843 6 449 246 Foreign currency cash deposits 2 400 000 4 100 000 SAFEX 223 827 213 923 Total 22 263 670 10 763 169
Interest was earned at 5.25% (2014: 4.75%) on current accounts.Interest was earned at 0% (2014: 0%) on foreign currency cash deposits.Interest was earned at 5.75% (2014: 4.75%) on SAFEX deposits.
2. CHARGES
- No initial charge is payable.- The service charge is calculated per annum (incl. VAT) on a daily basis as a percentage of market value as follows: Class B1 - 0% (2014: 0%) Class B4 - 1.02% (2014: 1.02%) Class B6 - 0.91% (2014: 0.91%) Class B8 - 1.25% (2014: 1.25%) Class B9 - 0.85% (2014: 0.85%) Class B10 - 0.96% (2014: 0.96%)
99

SANLAM MULTI MANAGED EQUITY FUND OF FUNDS
2015 2014
R'000 R'000
STATEMENT OF COMPREHENSIVE INCOME FOR THE YEAR ENDED 31 DECEMBER 2015
Income 1 583 10 199
Dividend revenue 1 440 1 614 Interest revenue 120 157 Rebates earned 2 - Income adjustment due to cancellation of participatory interests (59) (256) Net fair value gains on financial instruments 80 8 684
Expenses 1 082 1 175
Service fees 842 945 Audit fees 37 49 Withholding tax 21 - Custodian, trustee and bank charges 178 159 Transaction costs 4 22
Operating profit 501 9 024
Finance costs 488 469
Distributions to unit holders 488 469
Change in net assets attributable to unit holders 13 8 555
STATEMENT OF FINANCIAL POSITION AS AT 31 DECEMBER 2015
Assets
Investments 59 020 66 883
Participatory Interest in Collective Investment Schemes - Local 59 020 53 490 Participatory Interest in Collective Investment Schemes - Foreign - 13 393
Accrued income and debtors - 1
Cash and bank balances 179 952
Total assets 59 199 67 836
Liabilities 405 294
Trade and other payables 51 39 Related parties payable 66 114 Distributions payable 288 141
Net assets attributable to unit holders 58 794 67 542
Balance at the beginning of the year 67 542 93 819 Change in net assets attributable to unit holders 13 8 555 Creation of participatory interests 3 621 28 057 Liquidation of participatory interests (12 382) (62 889)
Balance at the end of the year 58 794 67 542
STATEMENT OF CHANGES IN NET ASSETS ATTRIBUTABLE TO UNIT HOLDERS FOR THE
YEAR ENDED 31 DECEMBER 2015
100

SANLAM MULTI MANAGED EQUITY FUND OF FUNDS
2015 2014
R'000 R'000
STATEMENT OF CASH FLOWS FOR THE YEAR ENDED 31 DECEMBER 2015
Cash flow from operating activities
Operating profit before finance costs 501 9 024 Adjusted for:Dividend revenue (1 440) (1 614) Interest revenue (120) (157) Income adjustment due to cancellation of participatory interests 59 256 Net fair value gains on investments (80) (8 684) Operating loss before working capital changes (1 080) (1 175)
Working capital changes: (35) 2 210 Decrease in accrued income and debtors 1 2 199 (Decrease)/increase in trade, related parties and other payables (36) 11
Cash (utilised)/generated by operations (1 115) 1 035 Interest received 120 157 Dividends received 1 440 1 614 Foreign exchange gains - 3
Net cash inflow from operating activities 445 2 809
Cash flow from investing activities
Net sale of securities 7 943 32 160
Net cash inflow from investing activities 7 943 32 160
Cash flow from financing activities
Net cancellation of participatory interest (8 820) (35 594) Cash distributed to units holders (341) (13)
Net cash outflow from financing activities (9 161) (35 607)
Net decrease in cash and cash equivalents (773) (638) Cash and cash equivalents at beginning of the year 952 1 590
Cash and cash equivalents at end of the year 179 952
NOTES TO THE ANNUAL FINANCIAL STATEMENTS FOR THE YEAR ENDED 31 DECEMBER 2015
1. BANK BALANCES
Bank balances consist of the following:
2015 2014
Current accounts 178 582 894 751 Foreign currency cash deposits - 56 847 Total 178 582 951 598
Interest was earned at 5.25% (2014: 4.75%) on current accounts.Interest was earned at 0% (2014: 0%) on foreign currency cash deposits.
2. CHARGES
The initial charge did not exceed 5% (excl. VAT) of the selling price.- The service charge is calculated per annum (incl. VAT) on a daily basis as a percentage of market value as follows: Class A1 - 1.42% (2014: 1.42%) Class A2 - 0.85% (2014: 0.85%) Class B1 - 0.39% (2014: N/A) Class B2 - 0.68% (2014: 0.68%) Class B3 - 0.87% (2014: 0.88%) Class B9 - 1.14% (2014: 1.14%) Class C1 - 2.16% (2014: 2.16%)
101

SANLAM MULTI MANAGED EQUITY INDEX FUND
2015 2014
R'000 R'000
STATEMENT OF COMPREHENSIVE INCOME FOR THE YEAR ENDED 31 DECEMBER 2015
Income 24 302 74 714
Dividend revenue 14 679 14 529 Interest revenue 1 370 1 484 Income adjustment due to creation and cancellation of participatory interests (2 887) 781 Net fair value gains on financial instruments 11 140 57 920
Expenses 1 265 970
Service fees 261 248 Audit fees 56 49 Withholding tax 69 70 Custodian, trustee and bank charges 39 72 Transaction costs 840 531
Operating profit 23 037 73 744
Finance costs 12 737 16 353
Distributions to unit holders 12 737 16 353
Change in net assets attributable to unit holders 10 300 57 391
STATEMENT OF FINANCIAL POSITION AS AT 31 DECEMBER 2015
Assets
Investments 442 095 604 104
Equities and specialist securities - Local 442 095 604 104
Accrued income and debtors 1 74
Cash and bank balances 2 253 3 996
Total assets 444 349 608 174
Liabilities 6 600 8 597
Trade and other payables 58 53 Related parties payable 21 22 Distributions payable 6 521 8 522
Net assets attributable to unit holders 437 749 599 577
Balance at the beginning of the year 599 577 485 152 Change in net assets attributable to unit holders 10 300 57 391 Creation of participatory interests 231 845 110 056 Liquidation of participatory interests (403 973) (53 022)
Balance at the end of the year 437 749 599 577
STATEMENT OF CHANGES IN NET ASSETS ATTRIBUTABLE TO UNIT HOLDERS FOR THE
YEAR ENDED 31 DECEMBER 2015
102

SANLAM MULTI MANAGED EQUITY INDEX FUND
2015 2014
R'000 R'000
STATEMENT OF CASH FLOWS FOR THE YEAR ENDED 31 DECEMBER 2015
Cash flow from operating activities
Operating profit before finance costs 23 037 73 744 Adjusted for:Dividend revenue (14 679) (14 529) Interest revenue (1 370) (1 484) Income adjustment due to creation and cancellation of participatory interests 2 887 (781) Net fair value gains on investments (11 140) (57 920) Operating loss before working capital changes (1 265) (970)
Working capital changes: 77 (1 068) Decrease in accrued income and debtors 73 1 154 Increase/(decrease) in trade, related parties and other payables 4 (2 222)
Cash utilised by operations (1 188) (2 038) Interest received 1 370 1 484 Dividends received 14 679 14 529
Net cash inflow from operating activities 14 861 13 975
Cash flow from investing activities
Net sale of securities 173 149 (57 514)
Net cash inflow/(outflow) from investing activities 173 149 (57 514)
Cash flow from financing activities
Net (cancellation)/creation of participatory interest (175 015) 57 309 Cash distributed to unit holders (14 738) (14 535)
Net cash (outflow)/inflow from financing activities (189 753) 42 774
Net decrease in cash and cash equivalents (1 743) (765) Cash and cash equivalents at beginning of the year 3 996 4 761
Cash and cash equivalents at end of the year 2 253 3 996
NOTES TO THE ANNUAL FINANCIAL STATEMENTS FOR THE YEAR ENDED 31 DECEMBER 2015
1. BANK BALANCES
Bank balances consist of the following:2015 2014
Current accounts 2 142 373 3 800 055 SAFEX 110 745 196 350 Total 2 253 118 3 996 405
Interest was earned at 5.25% (2014: 4.75%) on current accounts.Interest was earned at 5.75% (2014: 5.25%) on SAFEX accounts.
2. CHARGES
- No initial charge is payable.- The service charge is calculated per annum (incl. VAT) on a daily basis as a percentage of market value as follows: Class B1 - 0% (2014: 0%) Class B2 - 0.64% (2014: N/A) Class B3 - 0.09% (2014: N/A) Class B4 - 0.39% (2014: 0.39%) Class B5 - 0.57% (2014: 0.57%)
103

SANLAM MULTI MANAGED FLEXIBLE EQUITY FUND
2015 2014
R'000 R'000
STATEMENT OF COMPREHENSIVE INCOME FOR THE YEAR ENDED 31 DECEMBER 2015
Income 133 154 122 710
Dividend revenue 21 677 16 798 Interest revenue 13 397 13 923 Income adjustment due to creation and cancellation of participatory interests 281 285 Net fair value gains on financial instruments 97 799 91 704
Expenses 7 725 6 670
Service fees 1 894 1 431 Audit fees 98 73 Withholding tax (37) 83 Custodian, trustee and bank charges 148 218 Transaction costs 5 622 4 865
Operating profit 125 429 116 040
Finance costs 33 257 29 198
Distributions to unit holders 33 257 29 198
Change in net assets attributable to unit holders 92 172 86 842
STATEMENT OF FINANCIAL POSITION AS AT 31 DECEMBER 2015
Assets
Investments 1 093 413 777 313
Equities and specialist securities - Local 1 021 067 709 810 Participatory Interest in Collective Investment Schemes - Local 7 808 7 496 Bonds - Local 64 538 60 007
Accrued income and debtors 877 528
Cash and bank balances 99 472 86 749
Total assets 1 193 762 864 590
Liabilities 3 931 2 362
Trade and other payables 216 319 Related parties payable 164 151 Distributions payable 3 551 1 892
Net assets attributable to unit holders 1 189 831 862 228
Balance at the beginning of the year 862 228 603 519 Change in net assets attributable to unit holders 92 172 86 842 Creation of participatory interests 387 953 356 860 Liquidation of participatory interests (152 522) (184 993)
Balance at the end of the year 1 189 831 862 228
STATEMENT OF CHANGES IN NET ASSETS ATTRIBUTABLE TO UNIT HOLDERS FOR THE
YEAR ENDED 31 DECEMBER 2015
104

SANLAM MULTI MANAGED FLEXIBLE EQUITY FUND
2015 2014
R'000 R'000
STATEMENT OF CASH FLOWS FOR THE YEAR ENDED 31 DECEMBER 2015
Cash flow from operating activities
Operating profit before finance costs 125 429 116 040 Adjusted for:Dividend revenue (21 677) (16 798) Interest revenue (13 397) (13 923) Income adjustment due to creation and cancellation of participatory interests (281) (285) Net fair value gains on investments (97 799) (91 704) Operating loss before working capital changes (7 725) (6 670)
Working capital changes: (439) 1 029 (Increase)/decrease in accrued income and debtors (349) 758 (Decrease)/increase in trade, related parties and other payables (90) 271
Cash utilised by operations (8 164) (5 641) Interest received 13 397 13 923 Dividends received 21 677 16 798
Net cash inflow from operating activities 26 910 25 080
Cash flow from investing activities
Net purchase of securities (218 301) (153 653)
Net cash outflow from investing activities (218 301) (153 653)
Cash flow from financing activities
Net creation of participatory interest 235 712 143 398 Cash distributed to units holders (31 598) (9)
Net cash inflow from financing activities 204 114 143 389
Net increase in cash and cash equivalents 12 723 14 816 Cash and cash equivalents at beginning of the year 86 749 71 933
Cash and cash equivalents at end of the year 99 472 86 749
NOTES TO THE ANNUAL FINANCIAL STATEMENTS FOR THE YEAR ENDED 31 DECEMBER 2015
1. BANK BALANCES
Bank balances consist of the following:
2015 2014
Current accounts 90 785 868 84 992 988 SAFEX 8 686 205 1 755 663 Total 99 472 073 86 748 651
Interest was earned at 5.25% (2014: 4.75%) on current accounts.Interest was earned at 5.75% (2014: 4.75%) on SAFEX deposits.
2. CHARGES
- No initial charge is payable.- The service charge is calculated per annum (incl. VAT) on a daily basis as a percentage of market value as follows: Class B3 - 0% (2014: 0%) Class B4 - 0.79% (2014: 0.79%) Class B7 - 0.53% (2014: 0.53%) Class B9 - 1.02% (2014: 1.02%)
105

SANLAM MULTI MANAGED INFLATION LINKED BOND FUND
2015 2014
R'000 R'000
STATEMENT OF COMPREHENSIVE INCOME FOR THE YEAR ENDED 31 DECEMBER 2015
Income 12 747 108 237
Interest revenue 10 907 23 165 Income adjustment due to creation and cancellation of participatory interests (239) (2 468) Net fair value gains on financial instruments 2 079 87 540
Expenses 293 671
Service fees 188 407 Audit fees 55 66 Custodian, trustee and bank charges 48 193 Transaction costs 2 5
Operating profit 12 454 107 566
Finance costs 10 379 20 039
Distributions to unit holders 10 379 20 039
Change in net assets attributable to unit holders 2 075 87 527
STATEMENT OF FINANCIAL POSITION AS AT 31 DECEMBER 2015
Assets
Investments 545 023 766 282
Bonds - Local 545 023 766 282
Accrued income and debtors 2 850 3 903
Cash and bank balances 4 404 1 413
Total assets 552 277 771 598
Liabilities 3 689 4 312
Trade and other payables 58 72 Related parties payable 14 19 Distributions payable 3 617 4 221
Net assets attributable to unit holders 548 588 767 286
Balance at the beginning of the year 767 286 1 553 806 Change in net assets attributable to unit holders 2 075 87 527 Creation of participatory interests 232 858 143 886 Liquidation of participatory interests (453 631) (1 017 933)
Balance at the end of the year 548 588 767 286
STATEMENT OF CHANGES IN NET ASSETS ATTRIBUTABLE TO UNIT HOLDERS FOR THE
YEAR ENDED 31 DECEMBER 2015
106

SANLAM MULTI MANAGED INFLATION LINKED BOND FUND
2015 2014
R'000 R'000
STATEMENT OF CASH FLOWS FOR THE YEAR ENDED 31 DECEMBER 2015
Cash flow from operating activities
Operating profit before finance costs 12 454 107 566 Adjusted for:Interest revenue (10 907) (23 165) Income adjustment due to creation and cancellation of participatory interests 239 2 468 Net fair value gains on investments (2 079) (87 540) Operating loss before working capital changes (293) (671)
Working capital changes: 1 034 3 441 Decrease in accrued income and debtors 1 053 3 475 Decrease in trade, related parties and other payables (19) (34)
Cash generated by operations 741 2 770 Interest received 10 907 23 165
Net cash inflow from operating activities 11 648 25 935
Cash flow from investing activities
Net sale of securities 223 338 845 334
Net cash inflow from investing activities 223 338 845 334
Cash flow from financing activities
Net cancellation of participatory interest (221 012) (900 588) Cash distributed to by unit holders (10 983) -
Net cash outflow from financing activities (231 995) (900 588)
Net increase in cash and cash equivalents 2 991 (29 319) Cash and cash equivalents at beginning of the year 1 413 30 732
Cash and cash equivalents at end of the year 4 404 1 413
NOTES TO THE ANNUAL FINANCIAL STATEMENTS FOR THE YEAR ENDED 31 DECEMBER 2015
1. BANK BALANCES
Bank balances consist of the following:
2015 2014
Current accounts 4 404 475 1 412 928 Total 4 404 475 1 412 928
Interest was earned at 5.25% (2014: 4.75%) on current accounts.
2. CHARGES
No initial charge is payable.- The service charge is calculated per annum (incl. VAT) on a daily basis as a percentage of market value as follows: Class B1 - 0.39% (2014: 0.39%) Class B2 - 0.57% (2014: 0.57%) Class B3 - 0% (2014: 0%)
107

SANLAM MULTI MANAGED INSTITUTIONAL AGGRESSIVE EQUITY FUND ONE
2015 2014
R'000 R'000
STATEMENT OF COMPREHENSIVE INCOME FOR THE YEAR ENDED 31 DECEMBER 2015
Income 2 327 6 057
Dividend revenue 838 787 Interest revenue 73 15 Income adjustment due to creation and cancellation of participatory interests (216) - Net fair value gains on financial instruments 1 632 5 255
Expenses 159 140
Audit fees 21 49 Withholding tax - (3) Custodian, trustee and bank charges 33 29 Transaction costs 105 65
Operating profit 2 168 5 917
Finance costs 641 728
Distributions to unit holders 641 728
Change in net assets attributable to unit holders 1 527 5 189
STATEMENT OF FINANCIAL POSITION AS AT 31 DECEMBER 2015
Assets
Investments 18 065 34 151
Equities and specialist securities - Local 18 065 34 151
Accrued income and debtors - 1
Cash and bank balances 122 692
Total assets 18 187 34 844
Liabilities 285 545
Trade and other payables 23 50 Distributions payable 262 495
Net assets attributable to unit holders 17 902 34 299
Balance at the beginning of the year 34 299 28 473 Change in net assets attributable to unit holders 1 527 5 189 Creation of participatory interests 3 867 777 Liquidation of participatory interests (21 791) (140)
Balance at the end of the year 17 902 34 299
STATEMENT OF CHANGES IN NET ASSETS ATTRIBUTABLE TO UNIT HOLDERS FOR THE
YEAR ENDED 31 DECEMBER 2015
108

SANLAM MULTI MANAGED INSTITUTIONAL AGGRESSIVE EQUITY FUND ONE
2015 2014
R'000 R'000
STATEMENT OF CASH FLOWS FOR THE YEAR ENDED 31 DECEMBER 2015
Cash flow from operating activities
Operating profit before finance costs 2 168 5 917 Adjusted for:Dividend revenue (838) (787) Interest revenue (73) (15) Income adjustment due to creation and cancellation of participatory interests 216 - Net fair value gains on investments (1 632) (5 255) Operating loss before working capital changes (159) (140)
Working capital changes: (26) 4 Decrease in accrued income and debtors 1 - (Decrease)/Increase in trade, related parties and other payables (27) 4
Cash utilised by operations (185) (136)Interest received 73 15 Dividends received 838 787
Net cash inflow from operating activities 726 666
Cash flow from investing activities
Net sale/(purchase) of securities 17 718 (357)
Net cash inflow/(outflow) from investing activities 17 718 (357)
Cash flow from financing activities
Net cancellation of participatory interest (18 140) (4 111) Cash (distributed to)/reinvested by unit holders (874) 4 111
Net cash outflow from financing activities (19 014) -
Net (decrease)/increase in cash and cash equivalents (570) 309 Cash and cash equivalents at beginning of the year 692 383
Cash and cash equivalents at end of the year 122 692
NOTES TO THE ANNUAL FINANCIAL STATEMENTS FOR THE YEAR ENDED 31 DECEMBER 2015
1. BANK BALANCES
Bank balances consist of the following:
2015 2014
Current accounts 121 780 692 462 Total 121 780 692 462
Interest was earned at 5.25% (2014: 4.75%) on current accounts.
2. CHARGES
- No initial charge is payable.- The service charge is calculated per annum (incl. VAT) on a daily basis as a percentage of market value as follows: Class B4 - N/A (2014: 0.93%) Class B6 - N/A (2014: 0.53%) Class B10 - 0% (2014: 0%)
109

SANLAM MULTI MANAGED INSTITUTIONAL GENERAL EQUITY FUND TWO
2015 2014
R'000 R'000
STATEMENT OF COMPREHENSIVE INCOME FOR THE YEAR ENDED 31 DECEMBER 2015
Income (238 491) 200 827
Dividend revenue 97 645 80 318 Interest revenue 4 336 5 637 Income adjustment due to creation and cancellation of participatory interests (7 389) 6 367 Net fair value (losses)/gains on financial instruments (333 083) 108 505
Expenses 13 235 12 056
Service fees 5 136 2 937 Audit fees 90 59 Withholding tax 6 - Custodian, trustee and bank charges 117 196 Transaction costs 7 886 8 864
Operating (loss)/profit (251 726) 188 771
Finance costs 89 238 89 125
Distributions to unit holders 89 238 89 125
Change in net assets attributable to unit holders (340 964) 99 646
STATEMENT OF FINANCIAL POSITION AS AT 31 DECEMBER 2015
Assets
Investments 1 887 239 2 614 089
Equities and specialist securities - Local 1 887 239 2 614 089
Accrued income and debtors 112 1 278
Cash and bank balances 99 672 100 618
Total assets 1 987 023 2 715 985
Liabilities 42 745 89 011
Trade and other payables 254 40 434 Related parties payable 258 416 Distributions payable 42 233 48 161
Net assets attributable to unit holders 1 944 278 2 626 974
Balance at the beginning of the year 2 626 974 1 386 873 Change in net assets attributable to unit holders (340 964) 99 646 Creation of participatory interests 615 475 1 501 523 Liquidation of participatory interests (957 207) (361 068)
Balance at the end of the year 1 944 278 2 626 974
STATEMENT OF CHANGES IN NET ASSETS ATTRIBUTABLE TO UNIT HOLDERS FOR THE
YEAR ENDED 31 DECEMBER 2015
110

SANLAM MULTI MANAGED INSTITUTIONAL GENERAL EQUITY FUND TWO
2015 2014
R'000 R'000
STATEMENT OF CASH FLOWS FOR THE YEAR ENDED 31 DECEMBER 2015
Cash flow from operating activities
Operating (loss)/profit before finance costs (251 726) 188 771 Adjusted for:Dividend revenue (97 645) (80 318) Interest revenue (4 336) (5 637) Income adjustment due to creation and cancellation of participatory interests 7 389 (6 367) Net fair value losses/ (gains) on investments 333 083 (108 505) Operating loss before working capital changes (13 235) (12 056)
Working capital changes: (39 172) 39 343 Decrease/(increase) in accrued income and debtors 1 166 (1 241) (Decrease)/increase in trade, related parties and other payables (40 338) 40 584
Cash utilised by operations (52 407) 27 287 Interest received 4 336 5 637 Dividends received 97 645 80 318
Net cash inflow from operating activities 49 574 113 242
Cash flow from investing activities
Net sale/(purchase) of securities 393 767 (1 131 347)
Net cash inflow/(outflow) from investing activities 393 767 (1 131 347)
Cash flow from financing activities
Net (cancellation)/creation of participatory interest (349 121) 1 077 967 Cash distributed to units holders (95 166) (47)
Net cash (outflow)/inflow from financing activities (444 287) 1 077 920
Net (decrease)/increase in cash and cash equivalents (946) 59 815 Cash and cash equivalents at beginning of the year 100 618 40 803
Cash and cash equivalents at end of the year 99 672 100 618
NOTES TO THE ANNUAL FINANCIAL STATEMENTS FOR THE YEAR ENDED 31 DECEMBER 2015
1. BANK BALANCES
Bank balances consist of the following:
2015 2014
Current accounts 99 672 447 100 617 859 Total 99 672 447 100 617 859
Interest was earned at 5.25% (2014: 4.75%) on current accounts.
2. CHARGES
- No initial charge is payable.- The service charge is calculated per annum (incl. VAT) on a daily basis as a percentage of market value as follows: Class B2 - 0% (2014: 0%) Class B3 - 0% (2014: 0%) Class B5 - 0.70% (2014: N/A) Class B6 - 0.51% (2014: 0.51%) Class B7 - 0.53% (2014: N/A) Class B9 - 1.02% (2014: 1.03%) Class B10 - 0.93% (2014: 0.93%) Class B11 - 0.93% (2014: 0.93%)
111

SANLAM MULTI MANAGED INSTITUTIONAL LONG TERM GROWTH SOLUTION 7 FUND OF FUNDS
2015 2014
R'000 R'000
STATEMENT OF COMPREHENSIVE INCOME FOR THE YEAR ENDED 31 DECEMBER 2015
Income 45 554 45 332
Dividend revenue 4 564 2 970 Interest revenue 6 311 7 923 Other income 1 - Rebates earned 98 77 Income adjustment due to creation and cancellation of participatory interests 56 155 Net fair value gains on financial instruments 34 524 34 207
Expenses 3 730 3 182
Service fees 3 608 3 025 Audit fees 56 54 Withholding tax 22 20 Custodian, trustee and bank charges 32 41 Transaction costs 12 42
Operating profit 41 824 42 150
Finance costs 7 717 9 471
Distributions to unit holders 7 717 9 471
Change in net assets attributable to unit holders 34 107 32 679
STATEMENT OF FINANCIAL POSITION AS AT 31 DECEMBER 2015
Assets
Investments 428 984 380 059
Participatory Interest in Collective Investment Schemes - Local 328 042 295 811 Participatory Interest in Collective Investment Schemes - Foreign 100 942 84 248
Accrued income and debtors 3 5
Cash and bank balances 4 970 6 194
Total assets 433 957 386 258
Liabilities 1 774 3 291
Trade and other payables 58 56 Related parties payable 297 276 Distributions payable 1 419 2 959
Net assets attributable to unit holders 432 183 382 967
Balance at the beginning of the year 382 967 324 856 Change in net assets attributable to unit holders 34 107 32 679 Creation of participatory interests 99 783 53 415 Liquidation of participatory interests (84 674) (27 983)
Balance at the end of the year 432 183 382 967
STATEMENT OF CHANGES IN NET ASSETS ATTRIBUTABLE TO UNIT HOLDERS FOR THE
YEAR ENDED 31 DECEMBER 2015
112

SANLAM MULTI MANAGED INSTITUTIONAL LONG-TERM GROWTH SOLUTION FUND 7
2015 2014
R'000 R'000
STATEMENT OF CASH FLOWS FOR THE YEAR ENDED 31 DECEMBER 2015
Cash flow from operating activities
Operating profit before finance costs 41 824 42 150 Adjusted for:Dividend revenue (4 564) (2 970) Interest revenue (6 311) (7 923) Income adjustment due to creation and cancellation of participatory interests (56) (155) Net fair value gains on investments (34 524) (34 207) Operating loss before working capital changes (3 631) (3 105)
Working capital changes: 25 41 Decrease/(increase) in accrued income and debtors 2 (3) Increase in trade, related parties and other payables 23 44
Cash utilised by operations (3 606) (3 064) Interest received 6 311 7 923 Dividends received 4 564 2 970 Foreign exchange gains 7 34
Net cash inflow from operating activities 7 276 7 863
Cash flow from investing activities
Net purchase of securities (14 408) (37 713)
Net cash outflow from investing activities (14 408) (37 713)
Cash flow from financing activities
Net creation of participatory interest 15 165 19 207 Cash distributed to by unit holders (9 257) (1 572)
Net cash inflow from financing activities 5 908 17 635
Net decrease in cash and cash equivalents (1 224) (12 215) Cash and cash equivalents at beginning of the year 6 194 18 409
Cash and cash equivalents at end of the year 4 970 6 194
NOTES TO THE ANNUAL FINANCIAL STATEMENTS FOR THE YEAR ENDED 31 DECEMBER 2015
1. BANK BALANCES
Bank balances consist of the following:
2015 2014
Current accounts 4 688 839 5 497 325 Foreign currency cash deposits 280 586 696 723 Total 4 969 425 6 194 048
Interest was earned at 5.25% (2014: 4.75%) on current accounts.Interest was earned at 0% (2014: 0%) on foreign currency cash deposits.
2. CHARGES
No initial charge is payable.- The service charge is calculated per annum (incl. VAT) on a daily basis as a percentage of market value as follows: Class A - 1.02% (2014: 1.02%) Class A2 - 0.85% (2014:0.85%) Class B1 - 0.68% (2014: 0.68%) Class B2 - 0.68% (2014: 0.68%) Class B3 - 0.88% (2014: 0.88%) Class B4 - 1.02% (2014: 1.14%) Class B9 - 1.14% (2014: 1.14%) Class C - 2.16% (2014: 2.16%) Class C2 - 2.45% (2014: 2.45%)
113
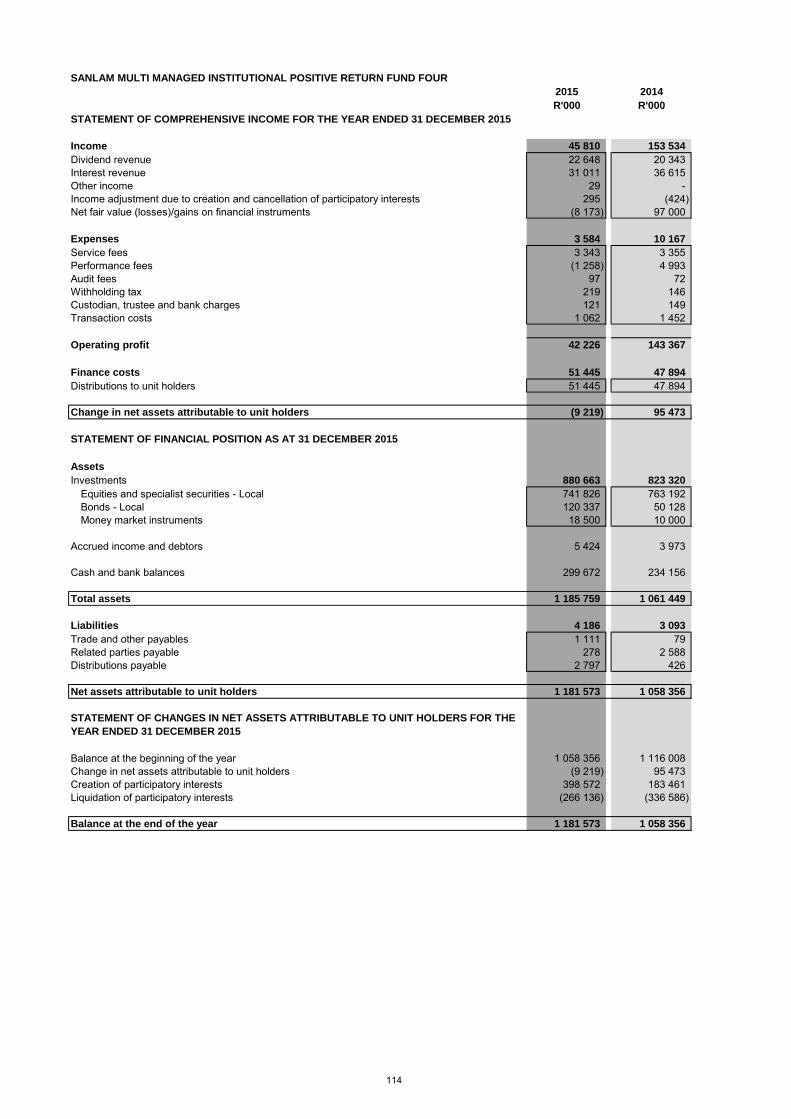
SANLAM MULTI MANAGED INSTITUTIONAL POSITIVE RETURN FUND FOUR
2015 2014
R'000 R'000
STATEMENT OF COMPREHENSIVE INCOME FOR THE YEAR ENDED 31 DECEMBER 2015
Income 45 810 153 534
Dividend revenue 22 648 20 343 Interest revenue 31 011 36 615 Other income 29 - Income adjustment due to creation and cancellation of participatory interests 295 (424) Net fair value (losses)/gains on financial instruments (8 173) 97 000
Expenses 3 584 10 167
Service fees 3 343 3 355 Performance fees (1 258) 4 993 Audit fees 97 72 Withholding tax 219 146 Custodian, trustee and bank charges 121 149 Transaction costs 1 062 1 452
Operating profit 42 226 143 367
Finance costs 51 445 47 894
Distributions to unit holders 51 445 47 894
Change in net assets attributable to unit holders (9 219) 95 473
STATEMENT OF FINANCIAL POSITION AS AT 31 DECEMBER 2015
Assets
Investments 880 663 823 320
Equities and specialist securities - Local 741 826 763 192 Bonds - Local 120 337 50 128 Money market instruments 18 500 10 000
Accrued income and debtors 5 424 3 973
Cash and bank balances 299 672 234 156
Total assets 1 185 759 1 061 449
Liabilities 4 186 3 093
Trade and other payables 1 111 79 Related parties payable 278 2 588 Distributions payable 2 797 426
Net assets attributable to unit holders 1 181 573 1 058 356
Balance at the beginning of the year 1 058 356 1 116 008 Change in net assets attributable to unit holders (9 219) 95 473 Creation of participatory interests 398 572 183 461 Liquidation of participatory interests (266 136) (336 586)
Balance at the end of the year 1 181 573 1 058 356
STATEMENT OF CHANGES IN NET ASSETS ATTRIBUTABLE TO UNIT HOLDERS FOR THE
YEAR ENDED 31 DECEMBER 2015
114

SANLAM MULTI MANAGED INSTITUTIONAL POSITIVE RETURN FUND FOUR
2015 2014
R'000 R'000
STATEMENT OF CASH FLOWS FOR THE YEAR ENDED 31 DECEMBER 2015
Cash flow from operating activities
Operating profit before finance costs 42 226 143 367 Adjusted for:Dividend revenue (22 648) (20 343) Interest revenue (31 011) (36 615) Income adjustment due to creation and cancellation of participatory interests (295) 424 Net fair value losses/(gains) on investments 8 173 (97 000) Operating loss before working capital changes (3 555) (10 167)
Working capital changes: (2 729) (101) Increase in accrued income and debtors (1 451) (1 187) (Decrease)/increase in trade, related parties and other payables (1 278) 1 086
Cash utilised by operations (6 284) (10 268) Interest received 31 011 36 615 Dividends received 22 648 20 343
Net cash inflow from operating activities 47 375 46 690
Cash flow from investing activities
Net (purchase)/sale of securities (65 516) 362 519
Net cash (outflow)/inflow from investing activities (65 516) 362 519
Cash flow from financing activities
Net creation/(cancellation) of participatory interest 132 731 (203 412) Cash distributed to unit holders (49 074) (43)
Net cash inflow/(outflow) from financing activities 83 657 (203 455)
Net increase in cash and cash equivalents 65 516 205 754 Cash and cash equivalents at beginning of the year 234 156 28 402
Cash and cash equivalents at end of the year 299 672 234 156
NOTES TO THE ANNUAL FINANCIAL STATEMENTS FOR THE YEAR ENDED 31 DECEMBER 2015
1. BANK BALANCES
Bank balances consist of the following:
2015 2014
Current accounts 5 672 212 2 156 283 Call deposit accounts 294 000 000 232 000 000 Total 299 672 212 234 156 283
Interest was earned at 5.25% (2014: 4.75%) on current accounts.Interest was earned between 5.18% - 7.50% (2014: 5.50% - 5.65% ) on call deposit accounts.
2. CHARGES
- No initial charge is payable.- The service charge is calculated per annum (incl. VAT) on a daily basis as a percentage of market value as follows: Class B3 - 0% (2014: 0%) Class B5 - 0.95% (2014: 0.95%) Class B7 - 1.08% (2014: 1.08%) Class B9 - 0.79% (2014: 0.79%)
115

SANLAM MULTI MANAGED INSTITUTIONAL POSITIVE RETURN FUND THREE
2015 2014
R'000 R'000
STATEMENT OF COMPREHENSIVE INCOME FOR THE YEAR ENDED 31 DECEMBER 2015
Income 62 103 111 623
Dividend revenue 16 547 24 546 Interest revenue 20 400 20 471 Income adjustment due to creation and cancellation of participatory interests (598) (344) Net fair value gains on financial instruments 25 754 66 950
Expenses 4 451 9 877
Service fees (1 070) 2 536 Performance fees 3 727 5 693 Audit fees 58 87 Custodian, trustee and bank charges 223 216 Transaction costs 1 513 1 345
Operating profit 57 652 101 746
Finance costs 26 991 27 597
Distributions to unit holders 26 991 27 597
Change in net assets attributable to unit holders 30 661 74 149
STATEMENT OF FINANCIAL POSITION AS AT 31 DECEMBER 2015
Assets
Investments 456 762 957 827
Equities and specialist securities - Local 302 480 752 287 Equities and specialist securities - Foreign 46 979 - Bonds - Local 88 063 205 540 Bonds - Foreign 19 240 -
Accrued income and debtors 1 377 2 716
Cash and bank balances 115 992 93 998
Total assets 574 131 1 054 541
Liabilities 2 724 5 540
Trade and other payables - 3 028 Related parties payable 75 - Distributions payable 2 649 2 512
Net assets attributable to unit holders 571 407 1 049 001
Balance at the beginning of the year 1 049 001 1 069 154 Change in net assets attributable to unit holders 30 661 74 149 Creation of participatory interests 186 583 226 732 Liquidation of participatory interests (694 838) (321 034)
Balance at the end of the year 571 407 1 049 001
STATEMENT OF CHANGES IN NET ASSETS ATTRIBUTABLE TO UNIT HOLDERS FOR THE
YEAR ENDED 31 DECEMBER 2015
116

SANLAM MULTI MANAGED INSTITUTIONAL POSITIVE RETURN FUND THREE
2015 2014
R'000 R'000
STATEMENT OF CASH FLOWS FOR THE YEAR ENDED 31 DECEMBER 2015
Cash flow from operating activities
Operating profit before finance costs 57 652 101 746 Adjusted for:Dividend revenue (16 547) (24 546) Interest revenue (20 400) (20 471) Income adjustment due to creation and cancellation of participatory interests 598 344 Net fair value gains on investments (25 754) (66 950) Operating loss before working capital changes (4 451) (9 877)
Working capital changes: (1 614) (1 828) Increase in accrued income and debtors 1 339 (200) Increase/(decrease) in trade, related parties and other payables (2 953) (1 628)
Cash utilised by operations (6065) (11 705) Interest received 20 400 20 471 Dividends received 16 547 24 546 Foreign exchange gains 2 600 -
Net cash inflow from operating activities 33 482 33 312
Cash flow from investing activities
Net (purchase)/sale of securities 524 219 125 666
Net cash (outflow)/inflow from investing activities 524 219 125 666
Cash flow from financing activities
Net creation/(cancellation) of participatory interest (508 853) (124 434) Cash distributed to unit holders (26 854) (11)
Net cash inflow/(outflow) from financing activities (535 707) (124 445)
Net increase in cash and cash equivalents 21 994 34 533 Cash and cash equivalents at beginning of the year 93 998 59 465
Cash and cash equivalents at end of the year 115 992 93 998
NOTES TO THE ANNUAL FINANCIAL STATEMENTS FOR THE YEAR ENDED 31 DECEMBER 2015
1. BANK BALANCES
Bank balances consist of the following:
2015 2014
Current accounts 85 911 862 1 280 875 Call deposits 30 079 531 79 317 250 Foreign currency cash deposits - - SAFEX - 13 400 000 Total 115 991 393 93 998 125
Interest was earned at 5.25% (2014: 4.75%) on current accounts.Interest was earned at N/A (2014: 5.70%) on call accounts.Interest was earned at 0% (2014: N/A) on foreign currency cash deposits.Interest was earned at N/A (2014: 4.75%) on SAFEX deposits.
2. CHARGES
- No initial charge is payable.- The service charge is calculated per annum (incl. VAT) on a daily basis as a percentage of market value as follows: Class B3 - 0.79% (2014: 0%) Class B5 - 1.14% (2014: 0.73%) Class B6 - 1.14% (2014: 1.14%) Class B7 - 0% (2014: 0.55%) Class B9 - 0.55% (2014: 0.91%) Class B10 - 0.72% (2014: 0.8%)
117

SANLAM MULTI MANAGED INSTITUTIONAL POSITIVE RETURN FUND TWO
2015 2014
R'000 R'000
STATEMENT OF COMPREHENSIVE INCOME FOR THE YEAR ENDED 31 DECEMBER 2015
Income 35 029 47 243
Dividend revenue 7 19 Interest revenue 35 479 50 889 Income adjustment due to creation and cancellation of participatory interests (678) (1 609) Net fair value gains/(losses) on financial instruments 221 (2 056)
Expenses 999 1 291
Service fees 860 1 042 Audit fees 73 65 Withholding tax - (1) Custodian, trustee and bank charges 60 148 Transaction costs 6 37
Operating profit 34 030 45 952
Finance costs 33 826 48 040
Distributions to unit holders 33 826 48 040
Change in net assets attributable to unit holders 204 (2 088)
STATEMENT OF FINANCIAL POSITION AS AT 31 DECEMBER 2015
Assets
Investments 395 415 521 006
Equities and specialist securities - Local 3 174 3 057 Participatory Interest in Collective Investment Schemes - Local 2 321 8 090 Bonds - Local 71 011 76 905 Money market instruments 318 909 432 954
Accrued income and debtors 5 972 6 802
Cash and bank balances 6 340 41 555
Total assets 407 727 569 363
Liabilities 2 614 3 368
Trade and other payables 75 96 Related parties payable 56 73 Distributions payable 2 483 3 199
Net assets attributable to unit holders 405 113 565 995
Balance at the beginning of the year 565 995 1 037 112 Change in net assets attributable to unit holders 204 (2 088) Creation of participatory interests 163 971 170 939 Liquidation of participatory interests (325 057) (639 968)
Balance at the end of the year 405 113 565 995
STATEMENT OF CHANGES IN NET ASSETS ATTRIBUTABLE TO UNIT HOLDERS FOR THE
YEAR ENDED 31 DECEMBER 2015
118
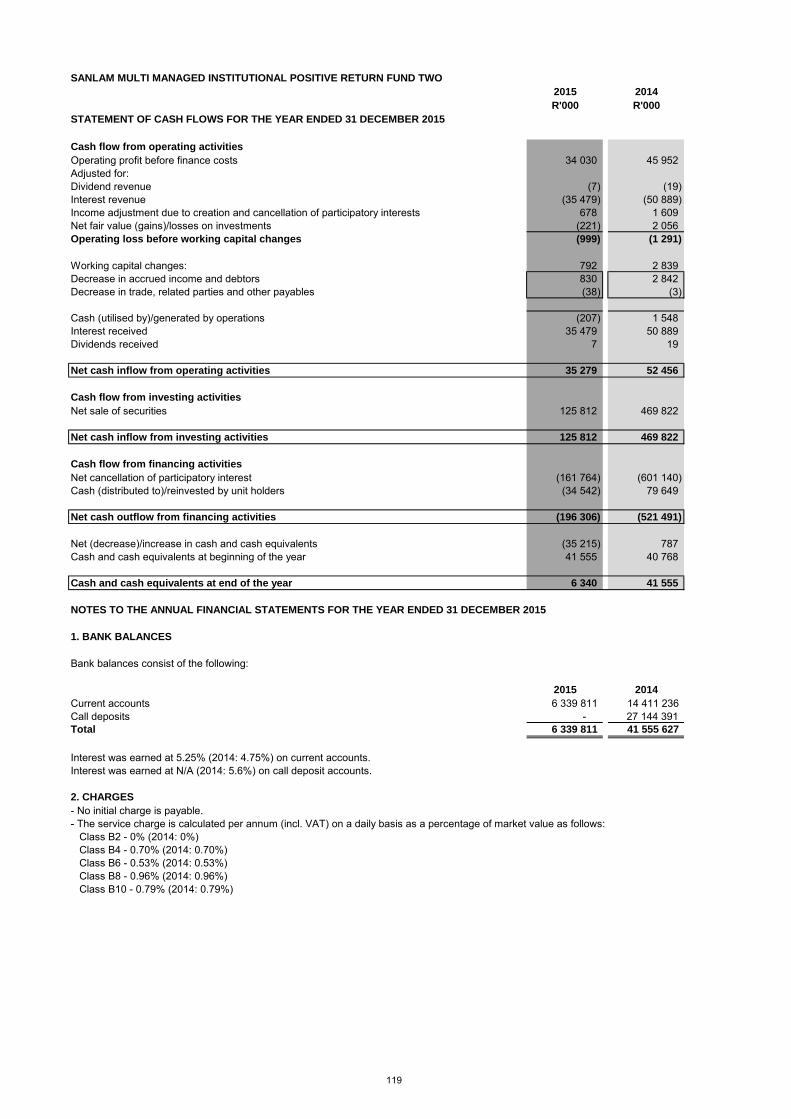
SANLAM MULTI MANAGED INSTITUTIONAL POSITIVE RETURN FUND TWO
2015 2014
R'000 R'000
STATEMENT OF CASH FLOWS FOR THE YEAR ENDED 31 DECEMBER 2015
Cash flow from operating activities
Operating profit before finance costs 34 030 45 952 Adjusted for:Dividend revenue (7) (19) Interest revenue (35 479) (50 889) Income adjustment due to creation and cancellation of participatory interests 678 1 609 Net fair value (gains)/losses on investments (221) 2 056 Operating loss before working capital changes (999) (1 291)
Working capital changes: 792 2 839 Decrease in accrued income and debtors 830 2 842 Decrease in trade, related parties and other payables (38) (3)
Cash (utilised by)/generated by operations (207) 1 548 Interest received 35 479 50 889 Dividends received 7 19
Net cash inflow from operating activities 35 279 52 456
Cash flow from investing activities
Net sale of securities 125 812 469 822
Net cash inflow from investing activities 125 812 469 822
Cash flow from financing activities
Net cancellation of participatory interest (161 764) (601 140) Cash (distributed to)/reinvested by unit holders (34 542) 79 649
Net cash outflow from financing activities (196 306) (521 491)
Net (decrease)/increase in cash and cash equivalents (35 215) 787 Cash and cash equivalents at beginning of the year 41 555 40 768
Cash and cash equivalents at end of the year 6 340 41 555
NOTES TO THE ANNUAL FINANCIAL STATEMENTS FOR THE YEAR ENDED 31 DECEMBER 2015
1. BANK BALANCES
Bank balances consist of the following:
2015 2014
Current accounts 6 339 811 14 411 236 Call deposits - 27 144 391 Total 6 339 811 41 555 627
Interest was earned at 5.25% (2014: 4.75%) on current accounts.Interest was earned at N/A (2014: 5.6%) on call deposit accounts.
2. CHARGES
- No initial charge is payable.- The service charge is calculated per annum (incl. VAT) on a daily basis as a percentage of market value as follows: Class B2 - 0% (2014: 0%) Class B4 - 0.70% (2014: 0.70%) Class B6 - 0.53% (2014: 0.53%) Class B8 - 0.96% (2014: 0.96%) Class B10 - 0.79% (2014: 0.79%)
119

SANLAM MULTI MANAGED INSTITUTIONAL PRUDENTIAL BALANCED FUND ONE
2015 2014
R'000 R'000
STATEMENT OF COMPREHENSIVE INCOME FOR THE YEAR ENDED 31 DECEMBER 2015
Income 61 160 43 328
Dividend revenue 5 349 4 960 Interest revenue 10 259 5 629 Other income - 25 Income adjustment due to creation and cancellation of participatory interests 477 489 Net fair value gains on financial instruments 45 075 32 225
Expenses 4 105 3 576
Service fees 3 193 2 768 Audit fees 55 54 Withholding tax 49 28 Custodian, trustee and bank charges 71 164 Transaction costs 737 562
Operating profit 57 055 39 752
Finance costs 12 785 8 056
Distributions to unit holders 12 785 8 056
Change in net assets attributable to unit holders 44 270 31 696
STATEMENT OF FINANCIAL POSITION AS AT 31 DECEMBER 2015
Assets
Investments 450 818 364 561
Equities and specialist securities - Local 142 337 156 891 Participatory Interest in Collective Investment Schemes - Local 149 146 108 019 Participatory Interest in Collective Investment Schemes - Foreign 116 233 93 395 Bonds - Local 43 102 6 256
Accrued income and debtors 1 463 802
Cash and bank balances 14 933 4 413
Total assets 467 214 369 776
Liabilities 8 106 4 090
Trade and other payables 739 59 Related parties payable 272 249 Distributions payable 7 095 3 782
Net assets attributable to unit holders 459 108 365 686
Balance at the beginning of the year 365 686 273 884 Change in net assets attributable to unit holders 44 270 31 696 Creation of participatory interests 150 868 76 129 Liquidation of participatory interests (101 716) (16 023)
Balance at the end of the year 459 108 365 686
STATEMENT OF CHANGES IN NET ASSETS ATTRIBUTABLE TO UNIT HOLDERS FOR THE
YEAR ENDED 31 DECEMBER 2015
120
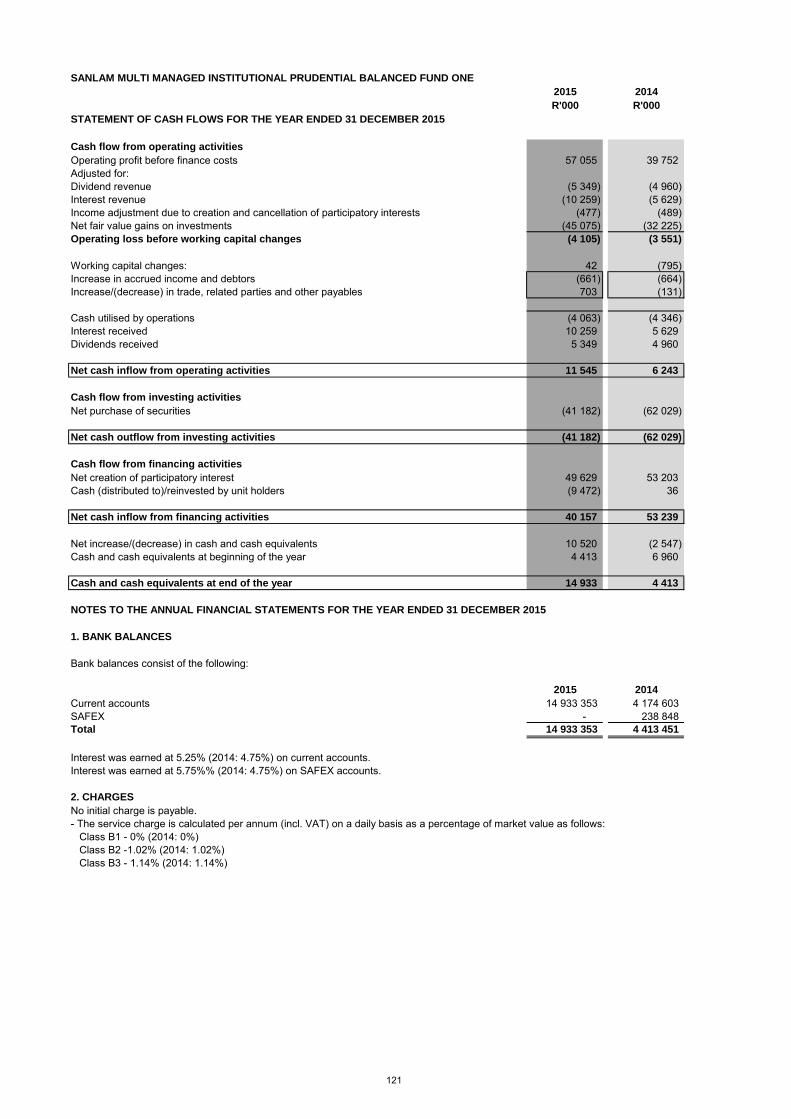
SANLAM MULTI MANAGED INSTITUTIONAL PRUDENTIAL BALANCED FUND ONE
2015 2014
R'000 R'000
STATEMENT OF CASH FLOWS FOR THE YEAR ENDED 31 DECEMBER 2015
Cash flow from operating activities
Operating profit before finance costs 57 055 39 752 Adjusted for:Dividend revenue (5 349) (4 960) Interest revenue (10 259) (5 629) Income adjustment due to creation and cancellation of participatory interests (477) (489) Net fair value gains on investments (45 075) (32 225) Operating loss before working capital changes (4 105) (3 551)
Working capital changes: 42 (795) Increase in accrued income and debtors (661) (664) Increase/(decrease) in trade, related parties and other payables 703 (131)
Cash utilised by operations (4 063) (4 346) Interest received 10 259 5 629 Dividends received 5 349 4 960
Net cash inflow from operating activities 11 545 6 243
Cash flow from investing activities
Net purchase of securities (41 182) (62 029)
Net cash outflow from investing activities (41 182) (62 029)
Cash flow from financing activities
Net creation of participatory interest 49 629 53 203 Cash (distributed to)/reinvested by unit holders (9 472) 36
Net cash inflow from financing activities 40 157 53 239
Net increase/(decrease) in cash and cash equivalents 10 520 (2 547) Cash and cash equivalents at beginning of the year 4 413 6 960
Cash and cash equivalents at end of the year 14 933 4 413
NOTES TO THE ANNUAL FINANCIAL STATEMENTS FOR THE YEAR ENDED 31 DECEMBER 2015
1. BANK BALANCES
Bank balances consist of the following:
2015 2014
Current accounts 14 933 353 4 174 603 SAFEX - 238 848 Total 14 933 353 4 413 451
Interest was earned at 5.25% (2014: 4.75%) on current accounts.Interest was earned at 5.75%% (2014: 4.75%) on SAFEX accounts.
2. CHARGES
No initial charge is payable.- The service charge is calculated per annum (incl. VAT) on a daily basis as a percentage of market value as follows: Class B1 - 0% (2014: 0%) Class B2 -1.02% (2014: 1.02%) Class B3 - 1.14% (2014: 1.14%)
121

SANLAM MULTI MANAGED INSTITUTIONAL PRUDENTIAL INCOME PROVIDER FUND TWO
2015 2014
R'000 R'000
STATEMENT OF COMPREHENSIVE INCOME FOR THE YEAR ENDED 31 DECEMBER 2015
Income 99 402 130 803
Dividend revenue 5 681 7 678 Interest revenue 93 490 106 658 Other income 45 14 Income adjustment due to creation and cancellation of participatory interests (4 456) (6 410) Net fair value gains on financial instruments 4 642 22 863
Expenses 1 533 2 068
Service fees 849 1 190 Audit fees 90 52 Withholding tax 30 186 Custodian, trustee and bank charges 384 374 Transaction costs 180 266
Operating profit 97 869 128 735
Finance costs 97 000 107 456
Distributions to unit holders 97 000 107 456
Change in net assets attributable to unit holders 869 21 279
STATEMENT OF FINANCIAL POSITION AS AT 31 DECEMBER 2015
Assets
Investments 1 148 880 1 423 278
Equities and specialist securities - Local 117 165 150 400 Equities and specialist securities - Foreign 20 451 21 139 Bonds - Local 652 077 612 332 Bonds - Foreign 85 187 101 407 Money market instruments 274 000 538 000
Accrued income and debtors 19 187 19 877
Cash and bank balances 52 125 102 595
Total assets 1 220 192 1 545 750
Liabilities 22 530 24 090
Trade and other payables 97 52 Related parties payable 72 68 Distributions payable 22 361 23 970
Net assets attributable to unit holders 1 197 662 1 521 660
Balance at the beginning of the year 1 521 660 2 181 425 Change in net assets attributable to unit holders 869 21 279 Creation of participatory interests 428 071 477 555 Liquidation of participatory interests (752 938) (1 158 599)
Balance at the end of the year 1 197 662 1 521 660
STATEMENT OF CHANGES IN NET ASSETS ATTRIBUTABLE TO UNIT HOLDERS FOR THE
YEAR ENDED 31 DECEMBER 2015
122

SANLAM MULTI MANAGED INSTITUTIONAL PRUDENTIAL INCOME PROVIDER FUND TWO
2015 2014
R'000 R'000
STATEMENT OF CASH FLOWS FOR THE YEAR ENDED 31 DECEMBER 2015
Cash flow from operating activities
Operating profit before finance costs 97 869 128 735 Adjusted for:Dividend revenue (5 681) (7 678) Interest revenue (93 490) (106 658) Income adjustment due to creation and cancellation of participatory interests 4 456 6 410 Net fair value gains on investments (4 642) (22 863) Operating loss before working capital changes (1 488) (2 054)
Working capital changes: 739 3 194 Decrease in accrued income and debtors 690 3 246 Increase/(decrease) in trade, related parties and other payables 49 (52)
Cash utilised by operations (749) 1 140 Interest received 93 490 106 658 Dividends received 5 681 7 678 Foreign exchange gains 199 -
Net cash inflow from operating activities 98 621 115 476
Cash flow from investing activities
Net purchase of securities 278 841 713 329
Net cash outflow from investing activities 278 841 713 329
Cash flow from financing activities
Net creation of participatory interest (329 323) (803 384) Cash distributed to unit holders (98 609) (2)
Net cash inflow from financing activities (427 932) (803 386)
Net (decrease)/increase in cash and cash equivalents (50 470) 25 418 Cash and cash equivalents at beginning of the year 102 595 77 177
Cash and cash equivalents at end of the year 52 125 102 595
NOTES TO THE ANNUAL FINANCIAL STATEMENTS FOR THE YEAR ENDED 31 DECEMBER 2015
1. BANK BALANCES
Bank balances consist of the following:
2015 2014
Current accounts 3 420 982 2 221 552 Call deposit accounts 35 600 000 95 100 000 Foreign currency cash deposits 5 701 874 12 SAFEX 7 402 010 5 271 860 Total 52 124 866 102 593 424
Interest was earned at 5.25% (2014: 4%) on current accounts.Interest was earned at 4-6% (2014: 4-6%) on call deposit accounts.Interest was earned at 0% (2014: 0%) on foreign currency cash deposits.Interest was earned at 5.75% (2014: 4.75%) on SAFEX deposits.
2. CHARGES
- No initial charge is payable.- The service charge is calculated per annum (incl. VAT) on a daily basis as a percentage of market value as follows: Class B1 - 0.00% (2014: 0.00%) Class B2 - 0.51% (2014: 0.51%) Class B3 - 0.68% (2014: 0.68%)
123

SANLAM MULTI MANAGED INSTITUTIONAL YIELD PLUS FUND TWO
2015 2014
R'000 R'000
STATEMENT OF COMPREHENSIVE INCOME FOR THE YEAR ENDED 31 DECEMBER 2015
Income 24 142 29 527
Interest revenue 24 782 28 761 Income adjustment due to creation and cancellation of participatory interests (372) (492) Net fair value (losses)/gains on financial instruments (268) 1 258
Expenses 275 442
Service fees 89 147 Audit fees 55 53 Custodian, trustee and bank charges 130 241 Transaction costs 1 1
Operating profit 23 867 29 085
Finance costs 24 131 27 824
Distributions to unit holders 24 131 27 824
Change in net assets attributable to unit holders (264) 1 261
STATEMENT OF FINANCIAL POSITION AS AT 31 DECEMBER 2015
Assets
Investments 295 591 362 959
Bonds - Local 216 154 176 033 Money market instruments 79 437 186 926
Accrued income and debtors 3 674 3 876
Cash and bank balances 16 323 23 645
Total assets 315 588 390 480
Liabilities 2 095 2 241
Trade and other payables 112 56 Related parties payable 6 8 Distributions payable 1 977 2 177
Net assets attributable to unit holders 313 493 388 239
Balance at the beginning of the year 388 239 537 865 Change in net assets attributable to unit holders (264) 1 261 Creation of participatory interests 31 482 53 301 Liquidation of participatory interests (105 964) (204 188)
Balance at the end of the year 313 493 388 239
STATEMENT OF CHANGES IN NET ASSETS ATTRIBUTABLE TO UNIT HOLDERS FOR THE
YEAR ENDED 31 DECEMBER 2015
124

SANLAM MULTI MANAGED INSTITUTIONAL YIELD PLUS FUND TWO
2015 2014
R'000 R'000
STATEMENT OF CASH FLOWS FOR THE YEAR ENDED 31 DECEMBER 2015
Cash flow from operating activities
Operating profit before finance costs 23 867 29 085 Adjusted for:Interest revenue (24 782) (28 761) Income adjustment due to creation and cancellation of participatory interests 372 492 Net fair value gains/(losses) on investments 268 (1 258) Operating loss before working capital changes (275) (442)
Working capital changes: 256 1 926 Decrease in accrued income and debtors 202 1 927 Increase/(decrease) in trade, related parties and other payables 54 (1)
Cash (utilised)/generated by operations (19) 1 484 Interest received 24 782 28 761
Net cash inflow from operating activities 24 763 30 245
Cash flow from investing activities
Net sale of securities 67 100 156 019
Net cash inflow from investing activities 67 100 156 019
Cash flow from financing activities
Net cancellation of participatory interest (74 854) (179 720) Cash distributed to unit holders (24 331) (1)
Net cash outflow from financing activities (99 185) (179 721)
Net (decrease)/increase in cash and cash equivalents (7 322) 6 543 Cash and cash equivalents at beginning of the year 23 645 17 102
Cash and cash equivalents at end of the year 16 323 23 645
NOTES TO THE ANNUAL FINANCIAL STATEMENTS FOR THE YEAR ENDED 31 DECEMBER 2015
1. BANK BALANCES
Bank balances consist of the following:
2015 2014
Current accounts 10 323 156 10 644 920 Call deposit accounts 6 000 000 13 000 000 Total 16 323 156 23 644 920
Interest was earned at 5.25% (2014: 4.75%) on current accounts.Interest was earned at 5.25% (2014: 5.5%) on call deposit accounts.
2. CHARGES
- No initial charge is payable.- The service charge is calculated per annum (incl. VAT) on a daily basis as a percentage of market value as follows: Class B2 - 0% (2014: 0%) Class B4 - 0.34% (2014: N/A) Class B6 - 0.39% (2014: 0.40%) Class B8 - 0.68% (2014: 0.68%)
125

SANLAM MULTI MANAGED MODERATE AGGRESSIVE FUND OF FUNDS
2015 2014
R'000 R'000
STATEMENT OF COMPREHENSIVE INCOME FOR THE YEAR ENDED 31 DECEMBER 2015
Income 81 002 85 268
Dividend revenue 10 735 9 900 Interest revenue 15 464 16 677 Other income 10 - Rebates earned 410 4 Income adjustment due to creation and cancellation of participatory interests (280) (844) Net fair value gains on financial instruments 54 663 59 531
Expenses 15 020 15 488
Service fees 14 779 15 060 Audit fees 73 56 Withholding tax 99 11 Custodian, trustee and bank charges 69 80 Transaction costs - 281
Operating profit 65 982 69 780
Finance costs 11 314 12 128
Distributions to unit holders 11 314 12 128
Change in net assets attributable to unit holders 54 668 57 652
STATEMENT OF FINANCIAL POSITION AS AT 31 DECEMBER 2015
Assets
Investments 794 633 793 940
Participatory Interest in Collective Investment Schemes - Local 794 633 793 940
Accrued income and debtors - -
Cash and bank balances - -
Total assets 794 633 793 940
Liabilities 7 566 7 060
Cash and bank balances 233 601 Trade and other payables 77 58 Related parties payable 1 200 1 387 Distributions payable 6 056 5 014
Net assets attributable to unit holders 787 067 786 880
Balance at the beginning of the year 786 880 835 559 Change in net assets attributable to unit holders 54 668 57 652 Creation of participatory interests 82 664 37 463 Liquidation of participatory interests (137 145) (143 794)
Balance at the end of the year 787 067 786 880
STATEMENT OF CHANGES IN NET ASSETS ATTRIBUTABLE TO UNIT HOLDERS FOR THE
YEAR ENDED 31 DECEMBER 2015
126
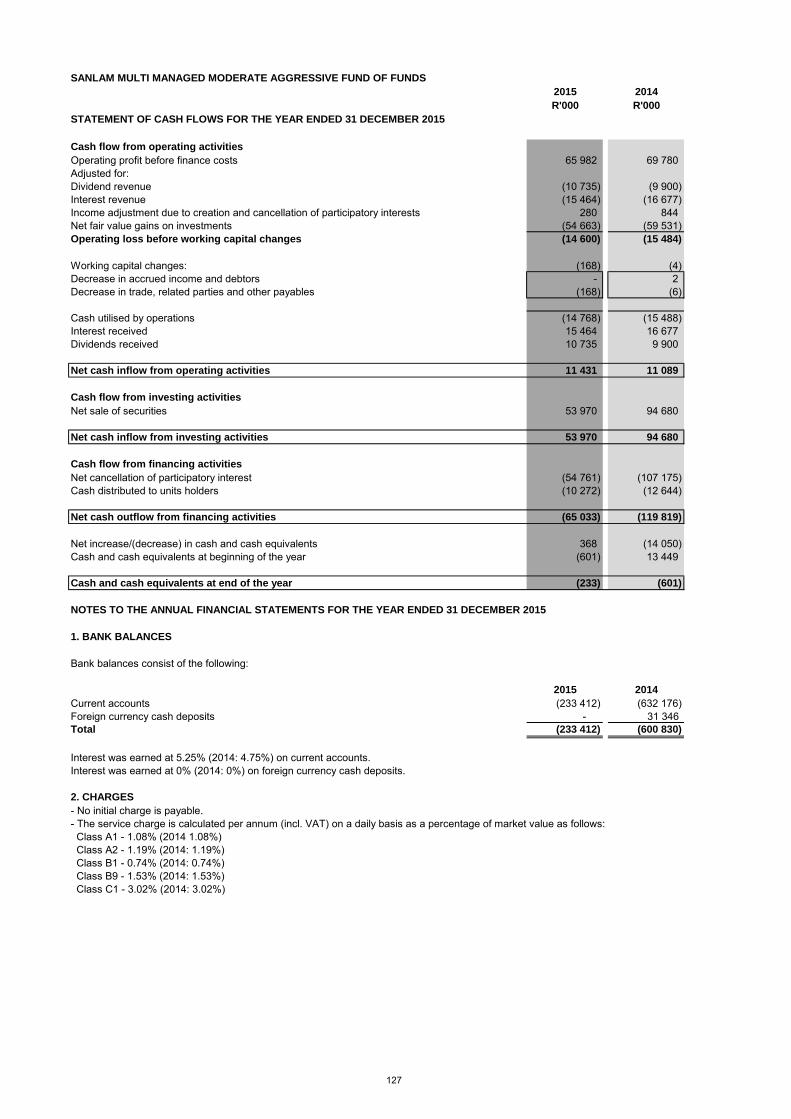
SANLAM MULTI MANAGED MODERATE AGGRESSIVE FUND OF FUNDS
2015 2014
R'000 R'000
STATEMENT OF CASH FLOWS FOR THE YEAR ENDED 31 DECEMBER 2015
Cash flow from operating activities
Operating profit before finance costs 65 982 69 780 Adjusted for:Dividend revenue (10 735) (9 900) Interest revenue (15 464) (16 677) Income adjustment due to creation and cancellation of participatory interests 280 844 Net fair value gains on investments (54 663) (59 531) Operating loss before working capital changes (14 600) (15 484)
Working capital changes: (168) (4) Decrease in accrued income and debtors - 2 Decrease in trade, related parties and other payables (168) (6)
Cash utilised by operations (14 768) (15 488) Interest received 15 464 16 677 Dividends received 10 735 9 900
Net cash inflow from operating activities 11 431 11 089
Cash flow from investing activities
Net sale of securities 53 970 94 680
Net cash inflow from investing activities 53 970 94 680
Cash flow from financing activities
Net cancellation of participatory interest (54 761) (107 175) Cash distributed to units holders (10 272) (12 644)
Net cash outflow from financing activities (65 033) (119 819)
Net increase/(decrease) in cash and cash equivalents 368 (14 050) Cash and cash equivalents at beginning of the year (601) 13 449
Cash and cash equivalents at end of the year (233) (601)
NOTES TO THE ANNUAL FINANCIAL STATEMENTS FOR THE YEAR ENDED 31 DECEMBER 2015
1. BANK BALANCES
Bank balances consist of the following:
2015 2014
Current accounts (233 412) (632 176) Foreign currency cash deposits - 31 346 Total (233 412) (600 830)
Interest was earned at 5.25% (2014: 4.75%) on current accounts.Interest was earned at 0% (2014: 0%) on foreign currency cash deposits.
2. CHARGES
- No initial charge is payable.- The service charge is calculated per annum (incl. VAT) on a daily basis as a percentage of market value as follows: Class A1 - 1.08% (2014 1.08%) Class A2 - 1.19% (2014: 1.19%) Class B1 - 0.74% (2014: 0.74%) Class B9 - 1.53% (2014: 1.53%) Class C1 - 3.02% (2014: 3.02%)
127

SANLAM MULTI MANAGED MODERATE FUND OF FUNDS
2015 2014
R'000 R'000
STATEMENT OF COMPREHENSIVE INCOME FOR THE YEAR ENDED 31 DECEMBER 2015
Income 22 493 16 307
Dividend revenue 1 872 1 244 Interest revenue 5 263 4 027 Other income 4 - Rebates earned 130 - Income adjustment due to creation and cancellation of participatory interests 874 318 Net fair value gains on financial instruments 14 350 10 718
Expenses 2 350 1 480
Service fees 2 252 1 326 Audit fees 55 66 Withholding tax 14 2 Custodian, trustee and bank charges 29 36 Transaction costs - 50
Operating profit 20 143 14 827
Finance costs 5 787 4 692
Distributions to unit holders 5 787 4 692
Change in net assets attributable to unit holders 14 356 10 135
STATEMENT OF FINANCIAL POSITION AS AT 31 DECEMBER 2015
Assets
Investments 260 484 181 475
Participatory Interest in Collective Investment Schemes - Local 260 484 181 475
Accrued income and debtors 8 1
Cash and bank balances 7 377 766
Total assets 267 869 182 242
Liabilities 3 422 2 288
Trade and other payables 57 66 Related parties payable 239 158 Distributions payable 3 126 2 064
Net assets attributable to unit holders 264 447 179 954
Balance at the beginning of the year 179 954 141 249 Change in net assets attributable to unit holders 14 356 10 135 Creation of participatory interests 104 053 47 631 Liquidation of participatory interests (33 916) (19 061)
Balance at the end of the year 264 447 179 954
STATEMENT OF CHANGES IN NET ASSETS ATTRIBUTABLE TO UNIT HOLDERS FOR THE
YEAR ENDED 31 DECEMBER 2015
128

SANLAM MULTI MANAGED MODERATE FUND OF FUNDS
2015 2014
R'000 R'000
STATEMENT OF CASH FLOWS FOR THE YEAR ENDED 31 DECEMBER 2015
Cash flow from operating activities
Operating profit before finance costs 20 143 14 827 Adjusted for:Dividend revenue (1 872) (1 244) Interest revenue (5 263) (4 027) Income adjustment due to creation and cancellation of participatory interests (874) (318) Net fair value gains on investments (14 350) (10 718) Operating loss before working capital changes (2 216) (1 480)
Working capital changes: 65 57 (Increase)/decrease in accrued income and debtors (7) 2 Increase in trade, related parties and other payables 72 55
Cash utilised by operations (2 151) (1 423)
Interest received 5 263 4 027 Dividends received 1 872 1 244
Net cash inflow from operating activities 4 984 3 848
Cash flow from investing activities
Net purchase of securities (64 659) (31 509)
Net cash outflow from investing activities (64 659) (31 509)
Cash flow from financing activities
Net creation of participatory interest 71 011 24 140 Cash (distributed to)/reinvested by unit holders (4 725) 36
Net cash inflow from financing activities 66 286 24 176
Net increase/(decrease) in cash and cash equivalents 6 611 (3 485) Cash and cash equivalents at beginning of the year 766 4 251
Cash and cash equivalents at end of the year 7 377 766
NOTES TO THE ANNUAL FINANCIAL STATEMENTS FOR THE YEAR ENDED 31 DECEMBER 2015
1. BANK BALANCES
Bank balances consist of the following:
2015 2014
Current accounts 7 377 281 760 359 Foreign currency cash deposits - 5 760 Total 7 377 281 766 119
Interest was earned at 5.25% (2014: 4.75%) on current accounts.Interest was earned at N/A (2014: 0%) on foreign currency cash deposits.
2. CHARGES
- The initial charge did not exceed 4.25% (excl. VAT) of the selling price.- The service charge is calculated per annum (incl. VAT) on a daily basis as a percentage of market value as follows: Class A1 - 1.08% (2014: 1.08%) Class A2 - 1.19% (2014: 1.19%) Class B1 - 0.74% (2014: 0.74%) Class B9 - 1.53% (2014: 1.53%) Class C1 - 2.62% (2014: 2.62%)
129

SANLAM MULTI MANAGED PROPERTY FUND
2015 2014
R'000 R'000
STATEMENT OF COMPREHENSIVE INCOME FOR THE YEAR ENDED 31 DECEMBER 2015
Income 73 655 162 062
Dividend revenue 3 691 1 794 Interest revenue 49 810 41 322 Income adjustment due to creation and cancellation of participatory interests (5 105) 133 Net fair value gains on financial instruments 25 259 118 813
Expenses 1 697 1 036
Service fees 570 429 Audit fees 72 61 Custodian, trustee and bank charges 150 232 Transaction costs 905 314
Operating profit 71 958 161 026
Finance costs 47 599 42 526
Distributions to unit holders 47 599 42 526
Change in net assets attributable to unit holders 24 359 118 500
STATEMENT OF FINANCIAL POSITION AS AT 31 DECEMBER 2015
Assets
Investments 706 116 750 426
Equities and specialist securities - Local 706 116 750 426
Accrued income and debtors 2 691 1
Cash and bank balances - 983
Total assets 708 807 751 410
Liabilities 19 143 21 536
Cash and bank balances 571 - Trade and other payables 76 67 Related parties payable 45 42 Distributions payable 18 451 21 427
Net assets attributable to unit holders 689 664 729 874
Balance at the beginning of the year 729 874 581 188 Change in net assets attributable to unit holders 24 359 118 500 Creation of participatory interests 396 665 163 726 Liquidation of participatory interests (461 234) (133 540)
Balance at the end of the year 689 664 729 874
STATEMENT OF CHANGES IN NET ASSETS ATTRIBUTABLE TO UNIT HOLDERS FOR THE
YEAR ENDED 31 DECEMBER 2015
130
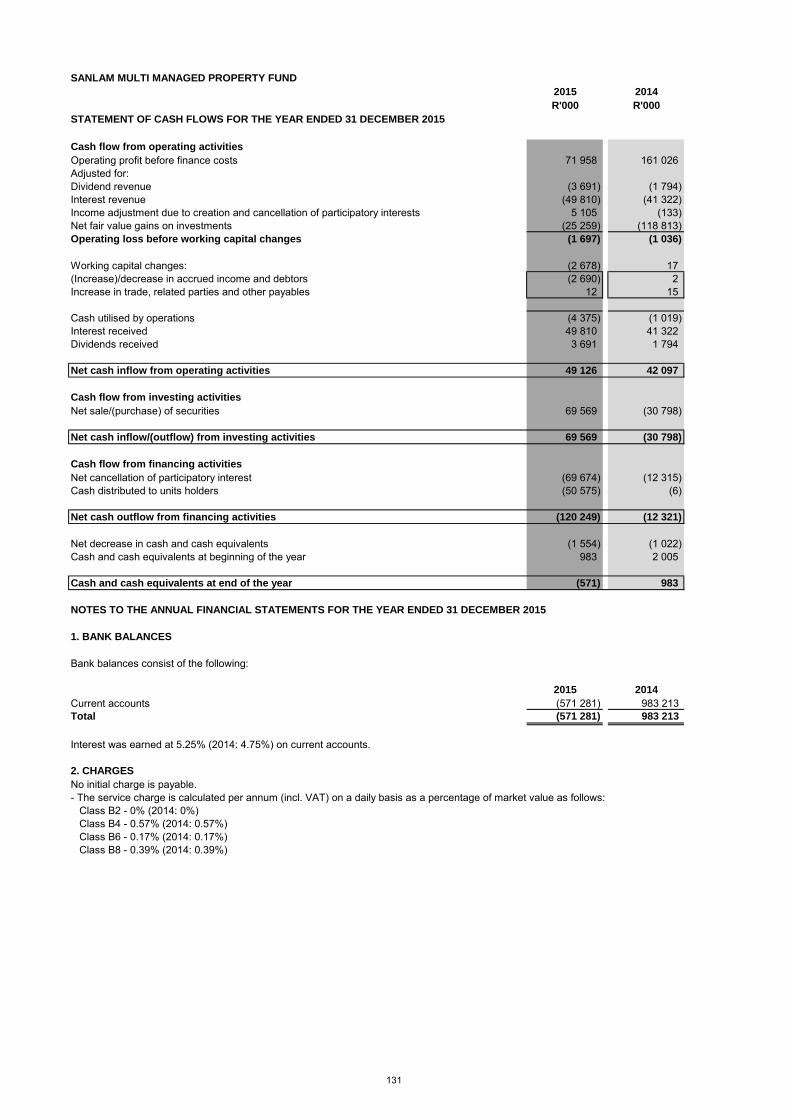
SANLAM MULTI MANAGED PROPERTY FUND
2015 2014
R'000 R'000
STATEMENT OF CASH FLOWS FOR THE YEAR ENDED 31 DECEMBER 2015
Cash flow from operating activities
Operating profit before finance costs 71 958 161 026 Adjusted for:Dividend revenue (3 691) (1 794) Interest revenue (49 810) (41 322) Income adjustment due to creation and cancellation of participatory interests 5 105 (133) Net fair value gains on investments (25 259) (118 813) Operating loss before working capital changes (1 697) (1 036)
Working capital changes: (2 678) 17 (Increase)/decrease in accrued income and debtors (2 690) 2 Increase in trade, related parties and other payables 12 15
Cash utilised by operations (4 375) (1 019) Interest received 49 810 41 322 Dividends received 3 691 1 794
Net cash inflow from operating activities 49 126 42 097
Cash flow from investing activities
Net sale/(purchase) of securities 69 569 (30 798)
Net cash inflow/(outflow) from investing activities 69 569 (30 798)
Cash flow from financing activities
Net cancellation of participatory interest (69 674) (12 315) Cash distributed to units holders (50 575) (6)
Net cash outflow from financing activities (120 249) (12 321)
Net decrease in cash and cash equivalents (1 554) (1 022) Cash and cash equivalents at beginning of the year 983 2 005
Cash and cash equivalents at end of the year (571) 983
NOTES TO THE ANNUAL FINANCIAL STATEMENTS FOR THE YEAR ENDED 31 DECEMBER 2015
1. BANK BALANCES
Bank balances consist of the following:
2015 2014
Current accounts (571 281) 983 213 Total (571 281) 983 213
Interest was earned at 5.25% (2014: 4.75%) on current accounts.
2. CHARGES
No initial charge is payable.- The service charge is calculated per annum (incl. VAT) on a daily basis as a percentage of market value as follows: Class B2 - 0% (2014: 0%) Class B4 - 0.57% (2014: 0.57%) Class B6 - 0.17% (2014: 0.17%) Class B8 - 0.39% (2014: 0.39%)
131

SANLAM MULTI MANAGED PROTECTION SOLUTION 3 FUND OF FUNDS
2015 2014
R'000 R'000
STATEMENT OF COMPREHENSIVE INCOME FOR THE YEAR ENDED 31 DECEMBER 2015
Income 16 369 15 576
Dividend revenue 1 042 572 Interest revenue 5 391 4 368 Rebates earned 40 36 Income adjustment due to creation and cancellation of participatory interests (43) 57 Net fair value gains on financial instruments 9 939 10 543
Expenses 1 722 1 525
Service fees 1 634 1 413 Audit fees 55 55 Withholding tax 5 4 Custodian, trustee and bank charges 26 32 Transaction costs 2 21
Operating profit 14 647 14 051
Finance costs 4 947 3 541
Distributions to unit holders 4 947 3 541
Change in net assets attributable to unit holders 9 700 10 510
STATEMENT OF FINANCIAL POSITION AS AT 31 DECEMBER 2015
Assets
Investments 158 706 155 740
Participatory Interest in Collective Investment Schemes - Local 125 543 124 046 Participatory Interest in Collective Investment Schemes - Foreign 33 163 31 694
Accrued income and debtors 5 2
Cash and bank balances 6 116 2 242
Total assets 164 827 157 984
Liabilities 1 488 1 071
Trade and other payables 57 57 Related parties payable 133 129 Distributions payable 1 298 885
Net assets attributable to unit holders 163 339 156 913
Balance at the beginning of the year 156 913 135 124 Change in net assets attributable to unit holders 9 700 10 510 Creation of participatory interests 43 924 31 658 Liquidation of participatory interests (47 198) (20 379)
Balance at the end of the year 163 339 156 913
STATEMENT OF CHANGES IN NET ASSETS ATTRIBUTABLE TO UNIT HOLDERS FOR THE
YEAR ENDED 31 DECEMBER 2015
132
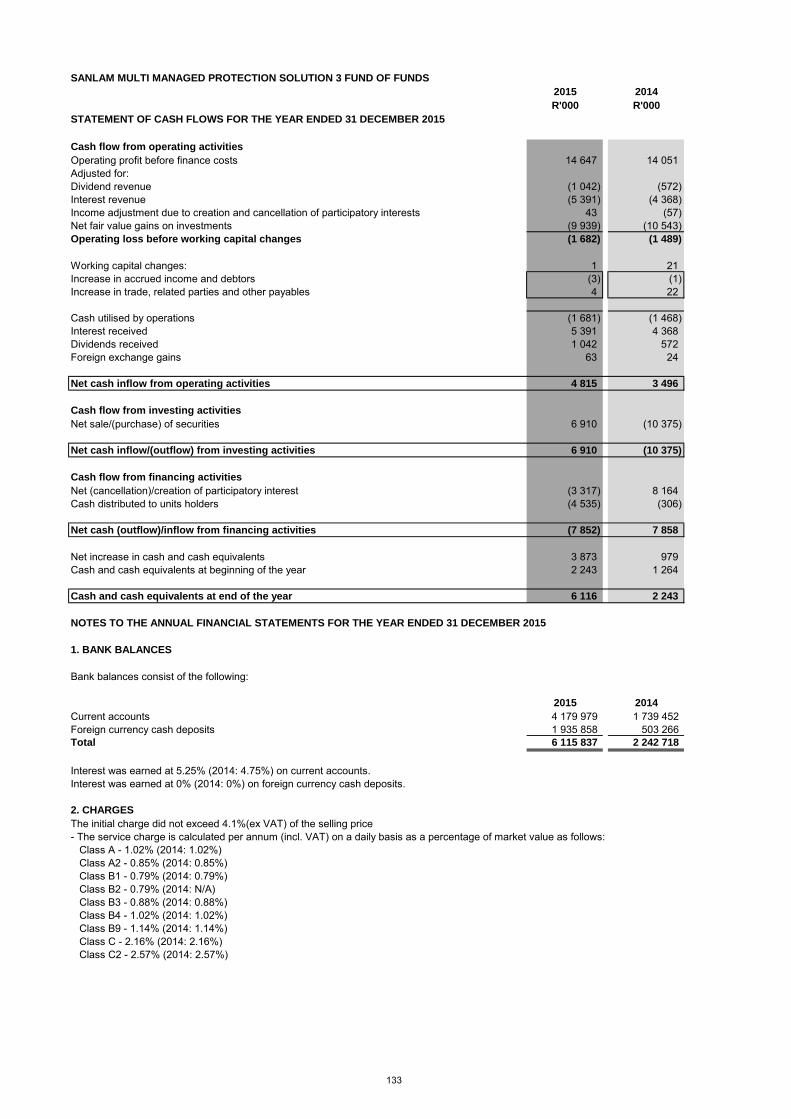
SANLAM MULTI MANAGED PROTECTION SOLUTION 3 FUND OF FUNDS
2015 2014
R'000 R'000
STATEMENT OF CASH FLOWS FOR THE YEAR ENDED 31 DECEMBER 2015
Cash flow from operating activities
Operating profit before finance costs 14 647 14 051 Adjusted for:Dividend revenue (1 042) (572) Interest revenue (5 391) (4 368) Income adjustment due to creation and cancellation of participatory interests 43 (57) Net fair value gains on investments (9 939) (10 543) Operating loss before working capital changes (1 682) (1 489)
Working capital changes: 1 21 Increase in accrued income and debtors (3) (1) Increase in trade, related parties and other payables 4 22
Cash utilised by operations (1 681) (1 468) Interest received 5 391 4 368 Dividends received 1 042 572 Foreign exchange gains 63 24
Net cash inflow from operating activities 4 815 3 496
Cash flow from investing activities
Net sale/(purchase) of securities 6 910 (10 375)
Net cash inflow/(outflow) from investing activities 6 910 (10 375)
Cash flow from financing activities
Net (cancellation)/creation of participatory interest (3 317) 8 164 Cash distributed to units holders (4 535) (306)
Net cash (outflow)/inflow from financing activities (7 852) 7 858
Net increase in cash and cash equivalents 3 873 979 Cash and cash equivalents at beginning of the year 2 243 1 264
Cash and cash equivalents at end of the year 6 116 2 243
NOTES TO THE ANNUAL FINANCIAL STATEMENTS FOR THE YEAR ENDED 31 DECEMBER 2015
1. BANK BALANCES
Bank balances consist of the following:
2015 2014
Current accounts 4 179 979 1 739 452 Foreign currency cash deposits 1 935 858 503 266 Total 6 115 837 2 242 718
Interest was earned at 5.25% (2014: 4.75%) on current accounts.Interest was earned at 0% (2014: 0%) on foreign currency cash deposits.
2. CHARGES
The initial charge did not exceed 4.1%(ex VAT) of the selling price- The service charge is calculated per annum (incl. VAT) on a daily basis as a percentage of market value as follows: Class A - 1.02% (2014: 1.02%) Class A2 - 0.85% (2014: 0.85%) Class B1 - 0.79% (2014: 0.79%) Class B2 - 0.79% (2014: N/A) Class B3 - 0.88% (2014: 0.88%) Class B4 - 1.02% (2014: 1.02%) Class B9 - 1.14% (2014: 1.14%) Class C - 2.16% (2014: 2.16%) Class C2 - 2.57% (2014: 2.57%)
133

SANLAM OPTIMISED INCOME FUND
2015 2014
R'000 R'000
STATEMENT OF COMPREHENSIVE INCOME FOR THE YEAR ENDED 31 DECEMBER 2015
Income 4 481 7 868
Dividend revenue 4 224 14 477 Interest revenue 809 1 826 Other income - 23 Rebates earned 58 113 Income adjustment due to creation and cancellation of participatory interests (880) (4) Net fair value gains/(losses) on financial instruments 270 (8 567)
Expenses 387 1 930
Service fees 63 1 727 Audit fees 81 63 Withholding tax (1) 1 Custodian, trustee and bank charges 44 37 Transaction costs 200 102
Operating profit 4 094 5 938
Finance costs 4 070 14 627
Distributions to unit holders 4 070 14 627
Change in net assets attributable to unit holders 24 (8 689)
STATEMENT OF FINANCIAL POSITION AS AT 31 DECEMBER 2015
Assets
Investments 860 314 995
Equities and specialist securities - Local 218 174 207 Participatory Interest in Collective Investment Schemes - Local 642 140 788
Accrued income and debtors 5 1 466
Cash and bank balances 290 1 537
Total assets 1 155 317 998
Liabilities 96 972
Trade and other payables 32 67 Related parties payable - 142 Distributions payable 64 763
Net assets attributable to unit holders 1 059 317 026
Balance at the beginning of the year 317 026 345 850 Change in net assets attributable to unit holders 24 (8 689) Creation of participatory interests 5 782 17 061 Liquidation of participatory interests (321 773) (37 196)
Balance at the end of the year 1 059 317 026
STATEMENT OF CHANGES IN NET ASSETS ATTRIBUTABLE TO UNIT HOLDERS FOR THE
YEAR ENDED 31 DECEMBER 2015
134

SANLAM OPTIMISED INCOME FUND
2015 2014
R'000 R'000
STATEMENT OF CASH FLOWS FOR THE YEAR ENDED 31 DECEMBER 2015
Cash flow from operating activities
Operating profit before finance costs 4 094 5 938 Adjusted for:Dividend revenue (4 224) (14 477) Interest revenue (809) (1 826) Income adjustment due to creation and cancellation of participatory interests 880 4 Net fair value (losses)/gains on investments (270) 8 567 Operating loss before working capital changes (329) (1 794)
Working capital changes: 1 284 (453) Decrease/(increase) in accrued income and debtors 1 461 (441) Decrease in trade, related parties and other payables (177) (12)
Cash generated/(utilised) by operations 955 (2 247) Interest received 809 1 826 Dividends received 4 224 14 477
Net cash inflow from operating activities 5 988 14 056
Cash flow from investing activities
Net sale of securities 314 405 21 632
Net cash inflow from investing activities 314 405 21 632
Cash flow from financing activities
Net cancellation of participatory interest (316 871) (35 038) Cash distributed to unit holders (4 769) (116)
Net cash outflow from financing activities (321 640) (35 154)
Net (decrease)/increase in cash and cash equivalents (1 247) 534 Cash and cash equivalents at beginning of the year 1 537 1 003
Cash and cash equivalents at end of the year 290 1 537
NOTES TO THE ANNUAL FINANCIAL STATEMENTS FOR THE YEAR ENDED 31 DECEMBER 2015
1. BANK BALANCES
Bank balances consist of the following:
2015 2014
Current accounts 289 646 1 536 975 Total 289 646 1 536 975
Interest was earned at 5.25% (2014: 4.75%) on current accounts.
2. CHARGES
- No initial charge is payable.- The service charge is calculated per annum (incl. VAT) on a daily basis as a percentage of market value as follows: Class B1 - 1.31% (2014: 1.31%) Class B2 - 0.00% (2014: 0.45%) Class B3 - 1.31% (2014: 1.31%) Class B4 - 0.79% (2014: 0.79%) Class B5 - 1.02% (2014: 1.02%)
3. SUBSEQUENT EVENTS
There may be a cessation of the Sanlam Optimised Income Fund in 2016. We are currently still awaiting the cessation deed before the closure of this fund can be finalised.
135

SANLAM PAN-EUROPE FUND
2015 2014
R'000 R'000
STATEMENT OF COMPREHENSIVE INCOME FOR THE YEAR ENDED 31 DECEMBER 2015
Income 29 543 1 634
Dividend revenue 2 288 2 316 Interest revenue 29 23 Income adjustment due to creation and cancellation of participatory interests 2 58 Net fair value gains/(losses) on financial instruments 27 224 (763)
Expenses 2 762 3 034
Service fees 2 030 1 994 Audit fees 40 56 Withholding tax 435 463 Custodian, trustee and bank charges 253 429 Transaction costs 4 92
Operating profit/(loss) 26 781 (1 400)
Finance costs 67 729
Distributions to unit holders 67 729
Change in net assets attributable to unit holders 26 714 (2 129)
STATEMENT OF FINANCIAL POSITION AS AT 31 DECEMBER 2015
Assets
Investments 123 401 100 402
Equities and specialist securities - Foreign 78 397 63 460 Participatory Interest in Collective Investment Schemes - Foreign 45 004 36 942
Accrued income and debtors 62 42
Cash and bank balances 1 120 1 235
Total assets 124 583 101 679
Liabilities 226 196
Trade and other payables 41 37 Related parties payable 185 159
Net assets attributable to unit holders 124 357 101 483
Balance at the beginning of the year 101 483 108 226 Change in net assets attributable to unit holders 26 714 (2 129) Creation of participatory interests 6 703 11 174 Liquidation of participatory interests (10 543) (15 788)
Balance at the end of the year 124 357 101 483
STATEMENT OF CHANGES IN NET ASSETS ATTRIBUTABLE TO UNIT HOLDERS FOR THE
YEAR ENDED 31 DECEMBER 2015
136

SANLAM PAN-EUROPE FUND
2015 2014
R'000 R'000
STATEMENT OF CASH FLOWS FOR THE YEAR ENDED 31 DECEMBER 2015
Cash flow from operating activities
Operating profit/(loss) before finance costs 26 781 (1 400) Adjusted for:Dividend revenue (2 288) (2 316) Interest revenue (29) (23) Income adjustment due to creation and cancellation of participatory interests (2) (58) Net fair value gains on investments (27 224) 763 Operating loss before working capital changes (2 762) (3 034)
Working capital changes: 10 (11) (Increase)/decrease in accrued income and debtors (20) 20 Increase/(decrease) in trade, related parties and other payables 30 (31)
Cash utilised by operations (2 752) (3 045) Interest received 29 23 Dividends received 2 288 2 316 Foreign exchange gains 38 (3)
Net cash outflow from operating activities (397) (709)
Cash flow from investing activities
Net sale of securities 4 187 4 669
Net cash inflow from investing activities 4 187 4 669
Cash flow from financing activities
Net cancellation of participatory interest (3 838) (4 556) Cash distributed to unit holders (67) (729)
Net cash outflow from financing activities (3 905) (5 285)
Net decrease in cash and cash equivalents (115) (1 325) Cash and cash equivalents at beginning of the year 1 235 2 560
Cash and cash equivalents at end of the year 1 120 1 235
NOTES TO THE ANNUAL FINANCIAL STATEMENTS FOR THE YEAR ENDED 31 DECEMBER 2015
1. BANK BALANCES
Bank balances consist of the following:
2015 2014
Current accounts 671 315 (62 218) Foreign currency cash deposits 449 092 1 297 392 Total 1 120 407 1 235 174
Interest was earned at 5.25% (2014: 4.75%) on current accounts.Interest was earned at 0% (2014: 0%) on foreign currency cash deposits.
2. CHARGES
- The initial charge did not exceed 5% of the selling price.- The service charge is calculated per annum (incl. VAT) on a daily basis as a percentage of market value as follows: Class A1- 1.82% (2014: 1.82%)
137

SANLAM SELECT ABSOLUTE FUND
2015 2014
R'000 R'000
STATEMENT OF COMPREHENSIVE INCOME FOR THE YEAR ENDED 31 DECEMBER 2015
Income 46 090 33 274
Dividend revenue 7 691 2 626 Interest revenue 7 651 3 384 Income adjustment due to creation and cancellation of participatory interests 2 658 (117) Net fair value gains on financial instruments 28 090 27 381
Expenses 7 952 1 992
Service fees 849 (3) Performance fees 1 775 - Audit fees 72 55 Withholding tax 470 95 Custodian, trustee and bank charges 123 102 Transaction costs 4 663 1 743
Operating profit 38 138 31 282
Finance costs 14 834 4 381
Distributions to unit holders 14 834 4 381
Change in net assets attributable to unit holders 23 304 26 901
STATEMENT OF FINANCIAL POSITION AS AT 31 DECEMBER 2015
Assets
Investments 817 657 201 439
Equities and specialist securities - Local 660 335 168 009 Equities and specialist securities - Foreign 157 322 33 430
Accrued income and debtors 6 464 340
Cash and bank balances 258 866 17 976
Total assets 1 082 987 219 755
Liabilities 11 732 2 479
Trade and other payables 79 58 Related parties payable 1 943 - Distributions payable 9 710 2 421
Net assets attributable to unit holders 1 071 255 217 276
Balance at the beginning of the year 217 276 203 880 Change in net assets attributable to unit holders 23 304 26 901 Creation of participatory interests 937 278 7 878 Liquidation of participatory interests (106 603) (21 383)
Balance at the end of the year 1 071 255 217 276
STATEMENT OF CHANGES IN NET ASSETS ATTRIBUTABLE TO UNIT HOLDERS FOR THE
YEAR ENDED 31 DECEMBER 2015
138

SANLAM SELECT ABSOLUTE FUND
2015 2014
R'000 R'000
STATEMENT OF CASH FLOWS FOR THE YEAR ENDED 31 DECEMBER 2015
Cash flow from operating activities
Operating profit before finance costs 38 138 31 282 Adjusted for:Dividend revenue (7 691) (2 626) Interest revenue (7 651) (3 384) Income adjustment due to creation and cancellation of participatory interests (2 658) 117 Net fair value gains on investments (28 090) (27 381) Operating loss before working capital changes (7 952) (1 992)
Working capital changes: (4 160) (753) Increase in accrued income and debtors (6 124) (314) Increase/(decrease) in trade, related parties and other payables 1 964 (439)
Cash utilised by operations (12 112) (2 745) Interest received 7 651 3 384 Dividends received 7 691 2 626 Foreign exchange gains 253 152
Net cash inflow from operating activities 3 483 3 417
Cash flow from investing activities
Net (purchase)/sale of securities (588 381) 9 075
Net cash (outflow)/inflow from investing activities (588 381) 9 075
Cash flow from financing activities
Net creation/(cancellation) of participatory interest 833 333 (16 002) Cash distributed to units holders (7 545) (2)
Net cash inflow/(outflow) from financing activities 825 788 (16 004)
Net increase/(decrease) in cash and cash equivalents 240 890 (3 512) Cash and cash equivalents at beginning of the year 17 976 21 488
Cash and cash equivalents at end of the year 258 866 17 976
NOTES TO THE ANNUAL FINANCIAL STATEMENTS FOR THE YEAR ENDED 31 DECEMBER 2015
1. BANK BALANCES
Bank balances consist of the following:
2015 2014
Current accounts 204 136 829 6 120 765 Foreign currency cash deposits 33 654 276 2 451 920 SAFEX 21 075 111 9 403 228 Total 258 866 216 17 975 913
Interest was earned at 5.25% (2014: 4.75%) on current accounts.Interest was earned at 0% (2014: 0%) on foreign currency cash deposits.Interest was earned at 5.75% (2014: 4.75%) on SAFEX accounts.
2. CHARGES
- No initial charge is payable.- The service charge is calculated per annum (incl. VAT) on a daily basis as a percentage of market value as follows: Class A1 - 0.91% (2014: 0.91%) Class B1 - 0% (2014: 0%) Class B2 - 0% (2014: 0%) Class B3 - 0.79% (2014: 0.80%) Class B4 - 1.02% (2014: 1.03%)
139

SANLAM SELECT BOND PLUS FUND
2015 2014
R'000 R'000
STATEMENT OF COMPREHENSIVE INCOME FOR THE YEAR ENDED 31 DECEMBER 2015
Income (32 235) 36 533
Interest revenue 42 375 28 748 Income adjustment due to creation and cancellation of participatory interests 1 265 (406) Net fair value (losses)/gains on financial instruments (75 875) 8 191
Expenses 117 213
Service fees 10 116 Audit fees 72 63 Custodian, trustee and bank charges 35 34
Operating (loss)/profit (32 352) 36 320
Finance costs 43 520 28 130
Distributions to unit holders 43 520 28 130
Change in net assets attributable to unit holders (75 872) 8 190
STATEMENT OF FINANCIAL POSITION AS AT 31 DECEMBER 2015
Assets
Investments 680 329 312 379
Bonds - Local 602 329 282 379 Money market instruments 78 000 30 000
Accrued income and debtors 18 105 7 397
Cash and bank balances 15 589 3 472
Total assets 714 023 323 248
Liabilities 5 411 2 231
Trade and other payables 67 65 Related parties payable 1 2 Distributions payable 5 343 2 164
Net assets attributable to unit holders 708 612 321 017
Balance at the beginning of the year 321 017 386 773 Change in net assets attributable to unit holders (75 872) 8 190 Creation of participatory interests 482 224 97 189 Liquidation of participatory interests (18 757) (171 135)
Balance at the end of the year 708 612 321 017
STATEMENT OF CHANGES IN NET ASSETS ATTRIBUTABLE TO UNIT HOLDERS FOR THE
YEAR ENDED 31 DECEMBER 2015
140

SANLAM SELECT BOND PLUS FUND
2015 2014
R'000 R'000
STATEMENT OF CASH FLOWS FOR THE YEAR ENDED 31 DECEMBER 2015
Cash flow from operating activities
Operating (loss)/profit before finance costs (32 352) 36 320 Adjusted for:Interest revenue (42 375) (28 748) Income adjustment due to creation and cancellation of participatory interests (1 265) 406 Net fair value losses/(gains) on investments 75 875 (8 191) Operating loss before working capital changes (117) (213)
Working capital changes: (10 707) 64 (Increase)/decrease in accrued income and debtors (10 708) 68 Increase/(decrease) in trade, related parties and other payables 1 (4)
Cash utilised by operations (10 824) (149) Interest received 42 375 28 748
Net cash inflow from operating activities 31 551 28 599
Cash flow from investing activities
Net (purchase)/sale of securities (443 825) 71 439
Net cash (outflow)/inflow from investing activities (443 825) 71 439
Cash flow from financing activities
Net creation/(cancellation) of participatory interest 464 732 (102 750) Cash distributed to unit holders (40 341) -
Net cash inflow/(outflow) from financing activities 424 391 (102 750)
Net increase/(decrease) in cash and cash equivalents 12 117 (2 712) Cash and cash equivalents at beginning of the year 3 472 6 184
Cash and cash equivalents at end of the year 15 589 3 472
NOTES TO THE ANNUAL FINANCIAL STATEMENTS FOR THE YEAR ENDED 31 DECEMBER 2015
1. BANK BALANCES
Bank balances consist of the following:
2015 2014
Current accounts 14 101 917 3 472 373 SAFEX 1 487 174 - Total 15 589 091 3 472 373
Interest was earned at 5.25% (2014: 4.75%) on current accounts.Interest was earned at 5.75% (2014: N/A) on SAFEX accounts.
2. CHARGES
- No initial charge is payable.- The service charge is calculated per annum (incl. VAT) on a daily basis as a percentage of market value as follows: Class B1 - 0% (2014: 0%) Class B2 - 0% (2014: N/A) Class B3 - 0.57% (2014: 0.57%) Class B4 - 0.39% (2014: N/A) Class B6 - 0.51% (2014: 0.51%) Class B8 - 0.68% (2014: 0.68%)
141

SANLAM SELECT DEFENSIVE BALANCED FUND
2015 2014
R'000 R'000
STATEMENT OF COMPREHENSIVE INCOME FOR THE YEAR ENDED 31 DECEMBER 2015
Income 47 389 20 869
Dividend revenue 4 701 1 313 Interest revenue 22 803 5 933 Income adjustment due to creation and cancellation of participatory interests 595 5 503 Net fair value gains on financial instruments 19 290 8 120
Expenses 4 892 1 244
Service fees 1 424 104 Performance fees 1 114 38 Audit fees 55 55 Withholding tax 620 231 Custodian, trustee and bank charges 136 121 Transaction costs 1 543 695
Operating profit 42 497 19 625
Finance costs 28 730 10 304
Distributions to unit holders 28 730 10 304
Change in net assets attributable to unit holders 13 767 9 321
STATEMENT OF FINANCIAL POSITION AS AT 31 DECEMBER 2015
Assets
Investments 554 304 395 389
Equities and specialist securities - Local 100 093 75 303 Equities and specialist securities - Foreign 96 131 72 200 Participatory Interest in Collective Investment Schemes - Foreign 4 921 - Bonds - Local 167 159 163 901 Money market instruments 186 000 83 985
Accrued income and debtors 12 995 10 857
Cash and bank balances 48 088 35 120
Total assets 615 387 441 366
Liabilities 20 442 12 387
Trade and other payables 3 390 4 373 Related parties payable 742 127 Distributions payable 16 310 7 887
Net assets attributable to unit holders 594 945 428 979
Balance at the beginning of the year 428 979 1 003 Change in net assets attributable to unit holders 13 767 9 321 Creation of participatory interests 422 164 421 146 Liquidation of participatory interests (269 965) (2 491)
Balance at the end of the year 594 945 428 979
STATEMENT OF CHANGES IN NET ASSETS ATTRIBUTABLE TO UNIT HOLDERS FOR THE
YEAR ENDED 31 DECEMBER 2015
142

SANLAM SELECT DEFENSIVE BALANCED FUND
2015 2014
R'000 R'000
STATEMENT OF CASH FLOWS FOR THE YEAR ENDED 31 DECEMBER 2015
Cash flow from operating activities
Operating profit before finance costs 42 497 19 625 Adjusted for:Dividend revenue (4 701) (1 313) Interest revenue (22 803) (5 933) Income adjustment due to creation and cancellation of participatory interests (595) (5 503) Net fair value gains on investments (19 290) (8 120) Operating loss before working capital changes (4 892) (1 244)
Working capital changes: (2 506) (6 358) Increase in accrued income and debtors (2 138) (10 856) (Decrease)/increase in trade, related parties and other payables (368) 4 498
Cash utilised by operations (7 398) (7 602) Interest received 22 803 5 933 Dividends received 4 701 1 313 Foreign exchange gains 5 023 150
Net cash inflow/(outflow) from operating activities 25 129 (206)
Cash flow from investing activities
Net purchase of securities (144 648) (387 419)
Net cash outflow from investing activities (144 648) (387 419)
Cash flow from financing activities
Net creation of participatory interest 152 794 421 742 Cash distributed to units holders (20 307) (2)
Net cash inflow from financing activities 132 487 421 740
Net increase in cash and cash equivalents 12 968 34 115 Cash and cash equivalents at beginning of the year 35 120 1 005
Cash and cash equivalents at end of the year 48 088 35 120
NOTES TO THE ANNUAL FINANCIAL STATEMENTS FOR THE YEAR ENDED 31 DECEMBER 2015
1. BANK BALANCES
Bank balances consist of the following:
2015 2014
Current accounts 17 448 082 20 827 593 Foreign curreny cash deposits 30 639 653 14 292 012 Total 48 087 735 35 119 605
Interest was earned at 5.25% (2014: 4.75%) on current accounts.Interest was earned at 0% (2014: 0%) on foreign currency cash deposits.
2. CHARGES
- No initial charge is payable.- The service charge is calculated per annum (incl. VAT) on a daily basis as a percentage of market value as follows: Class A1 - 0.91% (2014: 0.91%) Class B1 - 0% (2014: 0%) Class B2 - 0% (2014: 0%) Class B3 - 0.79% (2014: 0.91%) Class B4 - 1.02% (2014: 1.02%)
143

SANLAM SELECT FLEXIBLE EQUITY FUND
2015 2014
R'000 R'000
STATEMENT OF COMPREHENSIVE INCOME FOR THE YEAR ENDED 31 DECEMBER 2015
Income 67 575 36 140
Dividend revenue 6 220 919 Interest revenue 3 764 18 814 Income adjustment due to creation and cancellation of participatory interests (2 392) (226) Net fair value gains on financial instruments 59 983 16 633
Expenses 15 395 811
Service fees 1 558 86 Performance fees 11 031 - Audit fees 55 84 Withholding tax 33 37 Custodian, trustee and bank charges (8) 29 Transaction costs 2 726 575
Operating profit 52 180 35 329
Finance costs 3 501 19 269
Distributions to unit holders 3 501 19 269
Change in net assets attributable to unit holders 48 679 16 060
STATEMENT OF FINANCIAL POSITION AS AT 31 DECEMBER 2015
Assets
Investments 851 816 174 919
Equities and specialist securities - Local 809 014 174 919 Equities and specialist securities - Foreign 32 809 - Participatory Interest in Collective Investment Schemes - Foreign 9 993 -
Accrued income and debtors 245 29
Cash and bank balances 230 602 28 401
Total assets 1 082 663 203 349
Liabilities 8 755 367
Trade and other payables 3 176 85 Related parties payable 5 353 - Distributions payable 226 282
Net assets attributable to unit holders 1 073 908 202 982
Balance at the beginning of the year 202 982 340 069 Change in net assets attributable to unit holders 48 679 16 060 Creation of participatory interests 853 090 347 049 Liquidation of participatory interests (30 843) (500 196)
Balance at the end of the year 1 073 908 202 982
STATEMENT OF CHANGES IN NET ASSETS ATTRIBUTABLE TO UNIT HOLDERS FOR THE
YEAR ENDED 31 DECEMBER 2015
144
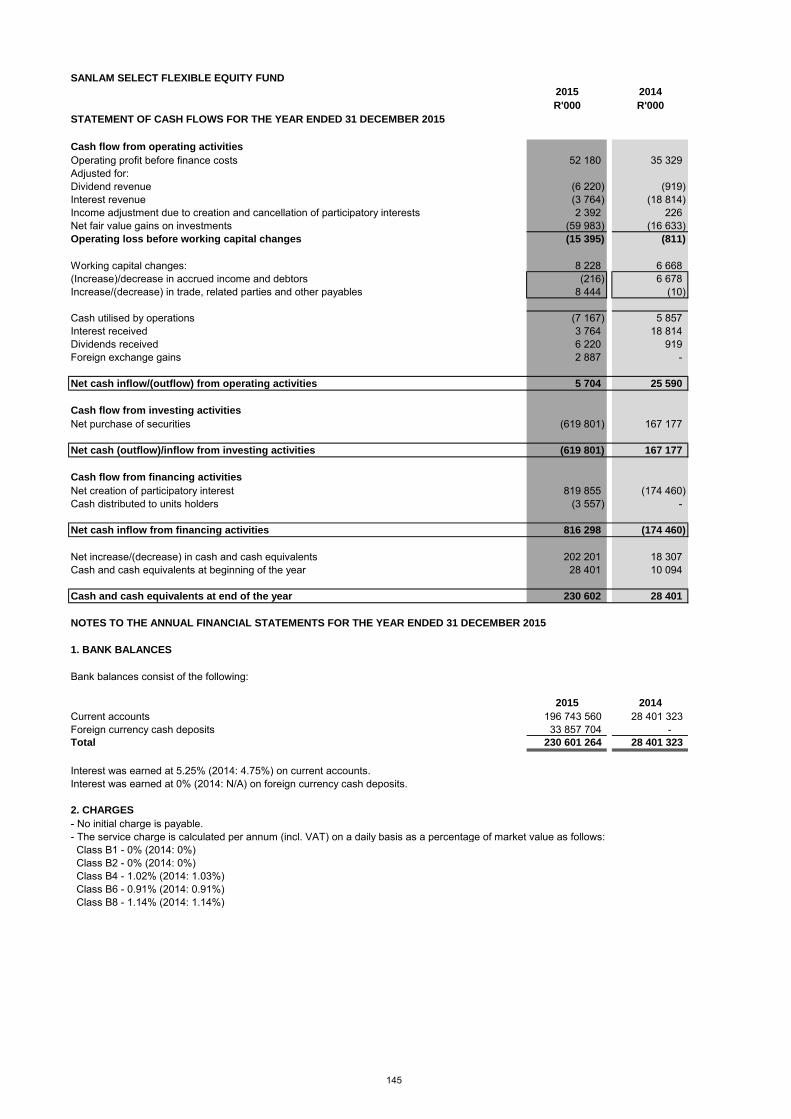
SANLAM SELECT FLEXIBLE EQUITY FUND
2015 2014
R'000 R'000
STATEMENT OF CASH FLOWS FOR THE YEAR ENDED 31 DECEMBER 2015
Cash flow from operating activities
Operating profit before finance costs 52 180 35 329 Adjusted for:Dividend revenue (6 220) (919) Interest revenue (3 764) (18 814) Income adjustment due to creation and cancellation of participatory interests 2 392 226 Net fair value gains on investments (59 983) (16 633) Operating loss before working capital changes (15 395) (811)
Working capital changes: 8 228 6 668 (Increase)/decrease in accrued income and debtors (216) 6 678 Increase/(decrease) in trade, related parties and other payables 8 444 (10)
Cash utilised by operations (7 167) 5 857 Interest received 3 764 18 814 Dividends received 6 220 919 Foreign exchange gains 2 887 -
Net cash inflow/(outflow) from operating activities 5 704 25 590
Cash flow from investing activities
Net purchase of securities (619 801) 167 177
Net cash (outflow)/inflow from investing activities (619 801) 167 177
Cash flow from financing activities
Net creation of participatory interest 819 855 (174 460) Cash distributed to units holders (3 557) -
Net cash inflow from financing activities 816 298 (174 460)
Net increase/(decrease) in cash and cash equivalents 202 201 18 307 Cash and cash equivalents at beginning of the year 28 401 10 094
Cash and cash equivalents at end of the year 230 602 28 401
NOTES TO THE ANNUAL FINANCIAL STATEMENTS FOR THE YEAR ENDED 31 DECEMBER 2015
1. BANK BALANCES
Bank balances consist of the following:
2015 2014
Current accounts 196 743 560 28 401 323 Foreign currency cash deposits 33 857 704 - Total 230 601 264 28 401 323
Interest was earned at 5.25% (2014: 4.75%) on current accounts.Interest was earned at 0% (2014: N/A) on foreign currency cash deposits.
2. CHARGES
- No initial charge is payable.- The service charge is calculated per annum (incl. VAT) on a daily basis as a percentage of market value as follows: Class B1 - 0% (2014: 0%) Class B2 - 0% (2014: 0%) Class B4 - 1.02% (2014: 1.03%) Class B6 - 0.91% (2014: 0.91%) Class B8 - 1.14% (2014: 1.14%)
145

SANLAM SELECT MANAGED FUND
2015 2014
R'000 R'000
STATEMENT OF COMPREHENSIVE INCOME FOR THE YEAR ENDED 31 DECEMBER 2015
Income 60 862 20 753
Dividend revenue 11 381 5 051 Interest revenue 16 696 4 117 Income adjustment due to creation and cancellation of participatory interests 2 618 1 476 Net fair value gains on financial instruments 30 167 10 109
Expenses 8 905 2 764
Service fees 2 762 268 Performance fees 2 591 - Audit fees 72 55 Withholding tax 136 20 Custodian, trustee and bank charges 104 123 Transaction costs 3 240 2 298
Operating profit 51 957 17 989
Finance costs 26 067 10 164
Distributions to unit holders 26 067 10 164
Change in net assets attributable to unit holders 25 890 7 825
STATEMENT OF FINANCIAL POSITION AS AT 31 DECEMBER 2015
Assets
Investments 607 219 282 817
Equities and specialist securities - Local 476 109 247 872 Bonds - Local 121 260 34 945 Money market instruments 9 850 -
Accrued income and debtors 4 969 1 779
Cash and bank balances 263 891 95 789
Total assets 876 079 380 385
Liabilities 20 026 6 277
Trade and other payables 4 870 83 Related parties payable 1 988 62 Distributions payable 13 168 6 132
Net assets attributable to unit holders 856 053 374 108
Balance at the beginning of the year 374 108 1 003 Change in net assets attributable to unit holders 25 890 7 825 Creation of participatory interests 827 663 370 685 Liquidation of participatory interests (371 608) (5 405)
Balance at the end of the year 856 053 374 108
STATEMENT OF CHANGES IN NET ASSETS ATTRIBUTABLE TO UNIT HOLDERS FOR THE
YEAR ENDED 31 DECEMBER 2015
146

SANLAM SELECT MANAGED FUND
2015 2014
R'000 R'000
STATEMENT OF CASH FLOWS FOR THE YEAR ENDED 31 DECEMBER 2015
Cash flow from operating activities
Operating profit before finance costs 51 957 17 989 Adjusted for:Dividend revenue (11 381) (5 051) Interest revenue (16 696) (4 117) Income adjustment due to creation and cancellation of participatory interests (2 618) (1 476) Net fair value gains on investments (30 167) (10 109) Operating loss before working capital changes (8 905) (2 764)
Working capital changes: 3 523 (1 635) Increase in accrued income and debtors (3 190) (1 778) Increase in trade, related parties and other payables 6 713 143
Cash utilised by operations (5 382) (4 399) Interest received 16 696 4 117 Dividends received 11 381 5 051
Net cash inflow from operating activities 22 695 4 769
Cash flow from investing activities
Net purchase of securities (294 235) (272 708)
Net cash outflow from investing activities (294 235) (272 708)
Cash flow from financing activities
Net creation of participatory interest 458 673 362 724 Cash distributed to unit holders (19 031) (1)
Net cash inflow from financing activities 439 642 362 723
Net increase in cash and cash equivalents 168 102 94 784 Cash and cash equivalents at beginning of the year 95 789 1 005
Cash and cash equivalents at end of the year 263 891 95 789
NOTES TO THE ANNUAL FINANCIAL STATEMENTS FOR THE YEAR ENDED 31 DECEMBER 2015
1. BANK BALANCES
Bank balances consist of the following:
2015 2014
Current accounts 59 382 117 21 952 111 Call deposits 117 057 001 56 474 965 SAFEX 87 451 550 17 361 943 Total 263 890 668 95 789 019
Interest was earned at 5.25% (2014: 4.75%) on current accounts.Interest was earned at 4 - 6% (2014: 4 - 6%) on call deposit accounts.Interest was earned at 5.75% (2014: 4.75%) on SAFEX deposits.
2. CHARGES
- No initial charge is payable.- The service charge is calculated per annum (incl. VAT) on a daily basis as a percentage of market value as follows: Class A1 - 0.91% (2014: 0.91%) Class B1 - 0% (2014: 0%) Class B2 - 0% (2014: 0%) Class B3 - 0.79% (2014: 0.80%) Class B4 - 1.02% (2014: 1.03%)
147

SANLAM SELECT OPTIMISED EQUITY FUND
2015 2014
R'000 R'000
STATEMENT OF COMPREHENSIVE INCOME FOR THE YEAR ENDED 31 DECEMBER 2015
Income 22 234 80 783
Dividend revenue 7 870 7 057 Interest revenue 470 576 Income adjustment due to creation and cancellation of participatory interests (33) (1 310) Net fair value gains on financial instruments 13 927 74 460
Expenses 4 054 3 128
Service fees 183 - Performance fees 1 585 - Audit fees 55 70 Withholding tax 131 (40) Custodian, trustee and bank charges 279 617 Transaction costs 1 821 2 481
Operating profit 18 180 77 655
Finance costs 6 119 5 382
Distributions to unit holders 6 119 5 382
Change in net assets attributable to unit holders 12 061 72 273
STATEMENT OF FINANCIAL POSITION AS AT 31 DECEMBER 2015
Assets
Investments 257 595 230 917
Equities and specialist securities - Local 212 834 208 351 Equities and specialist securities - Foreign 44 761 22 566
Accrued income and debtors 2 484 252
Cash and bank balances 15 250 6 146
Total assets 275 329 237 315
Liabilities 3 594 3 112
Trade and other payables 360 125 Related parties payable 1 604 1 Distributions payable 1 630 2 986
Net assets attributable to unit holders 271 735 234 203
Balance at the beginning of the year 234 203 2 309 801 Change in net assets attributable to unit holders 12 061 72 273 Creation of participatory interests 43 609 1 673 611 Liquidation of participatory interests (18 138) (3 821 482)
Balance at the end of the year 271 735 234 203
STATEMENT OF CHANGES IN NET ASSETS ATTRIBUTABLE TO UNIT HOLDERS FOR THE
YEAR ENDED 31 DECEMBER 2015
148

SANLAM SELECT OPTIMISED EQUITY FUND
2015 2014
R'000 R'000
STATEMENT OF CASH FLOWS FOR THE YEAR ENDED 31 DECEMBER 2015
Cash flow from operating activities
Operating profit before finance costs 18 180 77 655 Adjusted for:Dividend revenue (7 870) (7 057) Interest revenue (470) (576) Income adjustment due to creation and cancellation of participatory interests 33 1 310 Net fair value gains on investments (13 927) (74 460) Operating loss before working capital changes (4 054) (3 128)
Working capital changes: (394) 261 510 (Increase)/decrease in accrued income and debtors (2 232) 269 628 Increase/(decrease) in trade, related parties and other payables 1 838 (8 118)
Cash (utilised)/generated by operations (4 448) 258 382 Interest received 470 576 Dividends received 7 870 7 057 Foreign exchange gains 821 30
Net cash inflow from operating activities 4 713 266 045
Cash flow from investing activities
Net (purchase)/sale of securities (13 572) 1 879 499
Net cash (outflow)/inflow from investing activities (13 572) 1 879 499
Cash flow from financing activities
Net creation/(cancellation) of participatory interest 25 438 (2 189 628) Cash (distributed to)/reinvested by unit holders (7 475) 96
Net cash inflow/(outflow) from financing activities 17 963 (2 189 532)
Net increase/(decrease) in cash and cash equivalents 9 104 (43 988) Cash and cash equivalents at beginning of the year 6 146 50 134
Cash and cash equivalents at end of the year 15 250 6 146
NOTES TO THE ANNUAL FINANCIAL STATEMENTS FOR THE YEAR ENDED 31 DECEMBER 2015
1. BANK BALANCES
Bank balances consist of the following:
2015 2014
Current accounts 5 811 330 5 080 530 Call deposit accounts - 11 060 Foreign currency cash deposits 8 030 070 732 828 SAFEX 1 408 819 321 730 Total 15 250 219 6 146 148
Interest was earned at 5.25% (2014: 4.75%) on current accounts.Interest was earned at N/A (2014: 0%) on call deposit accounts.Interest was earned at 0% (2014: 0%) on foreign currency cash deposits.Interest was earned at 5.75% (2014: 4.75%) on SAFEX accounts.
2. CHARGES
- No initial charge is payable.- The service charge is calculated per annum (incl. VAT) on a daily basis as a percentage of market value as follows: Class B2 - 0% (2014: 0%) Class B3 - 0% (2014: 0%) Class B4 - 0.93% (2014: 0.93%) Class B5 - 0.70% (2014: 0.70%) Class B6 - 0.71% (2014: 0.71%) Class B7 - 0.91% (2014: 0.53%) Class B9 - 0.79% (2014: 0.79%) Class B10 - 0% (2014: 0%)
149
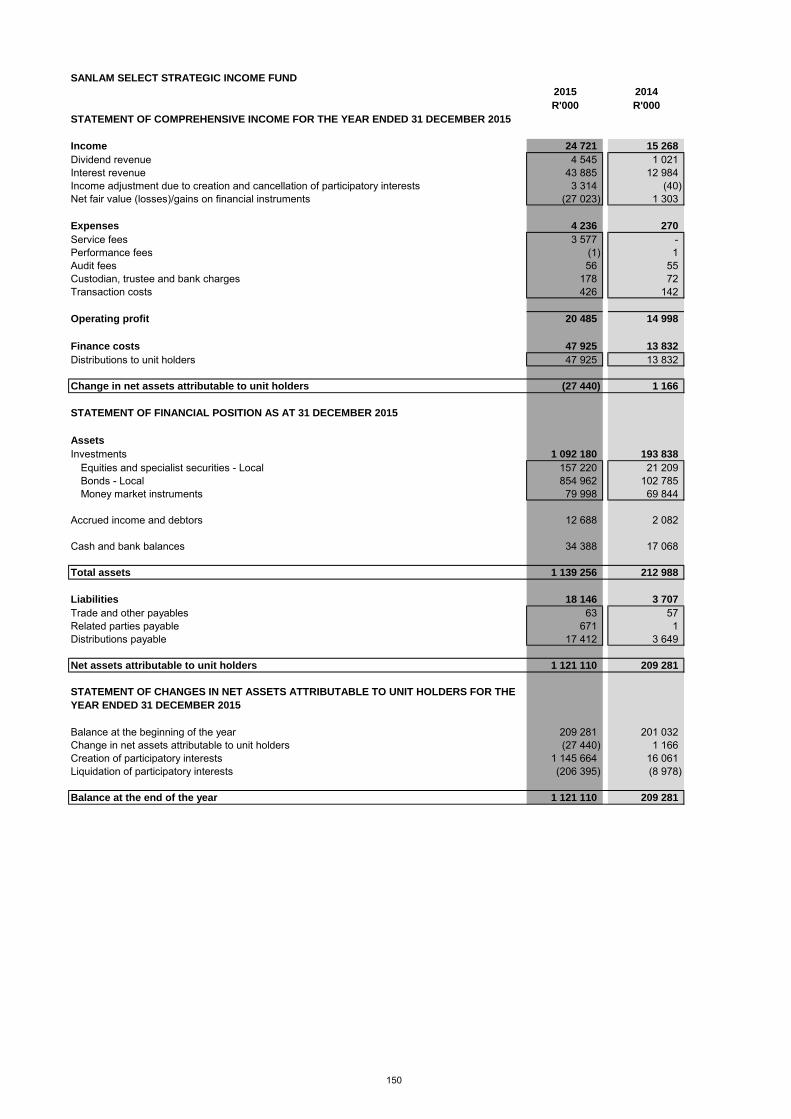
SANLAM SELECT STRATEGIC INCOME FUND
2015 2014
R'000 R'000
STATEMENT OF COMPREHENSIVE INCOME FOR THE YEAR ENDED 31 DECEMBER 2015
Income 24 721 15 268
Dividend revenue 4 545 1 021 Interest revenue 43 885 12 984 Income adjustment due to creation and cancellation of participatory interests 3 314 (40) Net fair value (losses)/gains on financial instruments (27 023) 1 303
Expenses 4 236 270
Service fees 3 577 - Performance fees (1) 1 Audit fees 56 55 Custodian, trustee and bank charges 178 72 Transaction costs 426 142
Operating profit 20 485 14 998
Finance costs 47 925 13 832
Distributions to unit holders 47 925 13 832
Change in net assets attributable to unit holders (27 440) 1 166
STATEMENT OF FINANCIAL POSITION AS AT 31 DECEMBER 2015
Assets
Investments 1 092 180 193 838
Equities and specialist securities - Local 157 220 21 209 Bonds - Local 854 962 102 785 Money market instruments 79 998 69 844
Accrued income and debtors 12 688 2 082
Cash and bank balances 34 388 17 068
Total assets 1 139 256 212 988
Liabilities 18 146 3 707
Trade and other payables 63 57 Related parties payable 671 1 Distributions payable 17 412 3 649
Net assets attributable to unit holders 1 121 110 209 281
Balance at the beginning of the year 209 281 201 032 Change in net assets attributable to unit holders (27 440) 1 166 Creation of participatory interests 1 145 664 16 061 Liquidation of participatory interests (206 395) (8 978)
Balance at the end of the year 1 121 110 209 281
STATEMENT OF CHANGES IN NET ASSETS ATTRIBUTABLE TO UNIT HOLDERS FOR THE
YEAR ENDED 31 DECEMBER 2015
150

SANLAM SELECT STRATEGIC INCOME FUND
2015 2014
R'000 R'000
STATEMENT OF CASH FLOWS FOR THE YEAR ENDED 31 DECEMBER 2015
Cash flow from operating activities
Operating profit before finance costs 20 485 14 998 Adjusted for:Dividend revenue (4 545) (1 021) Interest revenue (43 885) (12 984) Income adjustment due to creation and cancellation of participatory interests (3 314) 40 Net fair value losses/(gains) on investments 27 023 (1 303) Operating loss before working capital changes (4 236) (270)
Working capital changes: (9 930) (1 278) Increase in accrued income and debtors (10 606) (1 335) Increase in trade, related parties and other payables 676 57
Cash utilised by operations (14 166) (1 548) Interest received 43 885 12 984 Dividends received 4 545 1 021
Net cash inflow from operating activities 34 264 12 457
Cash flow from investing activities
Net purchase of securities (925 366) (137 250)
Net cash outflow from investing activities (925 366) (137 250)
Cash flow from financing activities
Net creation of participatory interest 942 583 (3 812) Cash distributed to unit holders (34 161) (3)
Net cash inflow from financing activities 908 422 (3 815)
Net increase/(decrease) in cash and cash equivalents 17 320 (128 608) Cash and cash equivalents at beginning of the year 17 068 145 676
Cash and cash equivalents at end of the year 34 388 17 068
NOTES TO THE ANNUAL FINANCIAL STATEMENTS FOR THE YEAR ENDED 31 DECEMBER 2015
1. BANK BALANCES
Bank balances consist of the following:
2015 2014
Current accounts 7 869 057 3 067 650 Call deposits 25 198 814 14 000 000 SAFEX 1 320 000 - Total 34 387 871 17 067 650
Interest was earned at 5.25% (2014: 4.75%) on current accounts.Interest was earned at 0% (2014: 5.6%) on call deposit accounts.Interest was earned at 5.75% (2014: 4.75%) on SAFEX accounts.
2. CHARGES
No initial charge is payable.- The service charge is calculated per annum (incl. VAT) on a daily basis as a percentage of market value as follows: Class A1 - 0.68% (2014: 0.68%) Class B1 - 0% (2014: 0%) Class B2 - 0% (2014: 0%) Class B3 - 0.62% (2014: 0.63%) Class B4 - 0.79% (2014: 0.80%) Class B5 - 0.80% (2014: N/A) Class B6 - 0.77% (2014: N/A)
151

SANLAM SELECT THEMATIC EQUITY FUND
2015 2014
R'000 R'000
STATEMENT OF COMPREHENSIVE INCOME FOR THE YEAR ENDED 31 DECEMBER 2015
Income (91 685) 15 268
Dividend revenue 22 577 1 040 Interest revenue 3 725 457 Income adjustment due to creation and cancellation of participatory interests 4 781 3 324 Net fair value (losses)/gains on financial instruments (122 768) 10 447
Expenses 8 543 1 093
Service fees 203 - Audit fees 96 71 Withholding tax (9) 7 Custodian, trustee and bank charges 149 32 Transaction costs 8 104 983
Operating (loss)/ profit (100 228) 14 175
Finance costs 30 638 4 711
Distributions to unit holders 30 638 4 711
Change in net assets attributable to unit holders (130 866) 9 464
STATEMENT OF FINANCIAL POSITION AS AT 31 DECEMBER 2015
Assets
Investments 1 014 639 231 296
Equities and specialist securities - Local 1 014 639 231 296
Accrued income and debtors 9 100
Cash and bank balances 6 288 486
Total assets 1 020 936 231 882
Liabilities 7 549 1 582
Trade and other payables 103 70 Related parties payable 16 - Distributions payable 7 430 1 512
Net assets attributable to unit holders 1 013 387 230 300
Balance at the beginning of the year 230 300 2 Change in net assets attributable to unit holders (130 866) 9 464 Creation of participatory interests 997 830 220 835 Liquidation of participatory interests (83 877) (1)
Balance at the end of the year 1 013 387 230 300
STATEMENT OF CHANGES IN NET ASSETS ATTRIBUTABLE TO UNIT HOLDERS FOR THE
YEAR ENDED 31 DECEMBER 2015
152
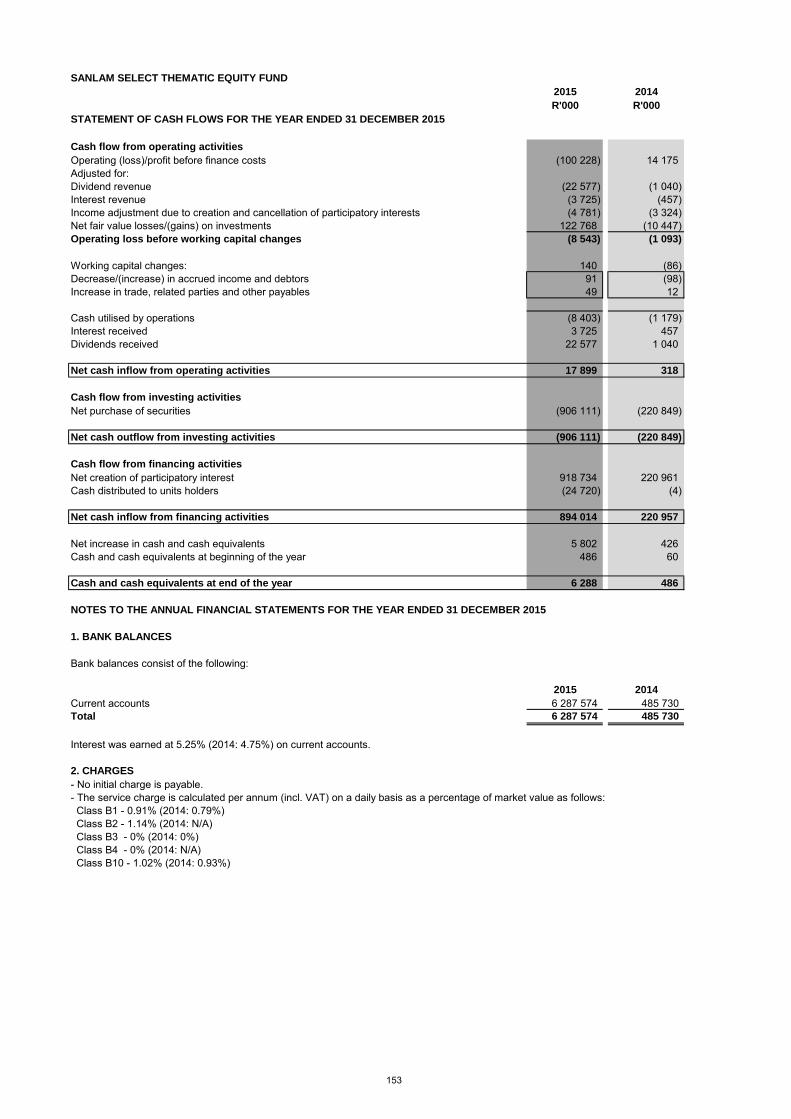
SANLAM SELECT THEMATIC EQUITY FUND
2015 2014
R'000 R'000
STATEMENT OF CASH FLOWS FOR THE YEAR ENDED 31 DECEMBER 2015
Cash flow from operating activities
Operating (loss)/profit before finance costs (100 228) 14 175 Adjusted for:Dividend revenue (22 577) (1 040) Interest revenue (3 725) (457) Income adjustment due to creation and cancellation of participatory interests (4 781) (3 324) Net fair value losses/(gains) on investments 122 768 (10 447) Operating loss before working capital changes (8 543) (1 093)
Working capital changes: 140 (86) Decrease/(increase) in accrued income and debtors 91 (98) Increase in trade, related parties and other payables 49 12
Cash utilised by operations (8 403) (1 179) Interest received 3 725 457 Dividends received 22 577 1 040
Net cash inflow from operating activities 17 899 318
Cash flow from investing activities
Net purchase of securities (906 111) (220 849)
Net cash outflow from investing activities (906 111) (220 849)
Cash flow from financing activities
Net creation of participatory interest 918 734 220 961 Cash distributed to units holders (24 720) (4)
Net cash inflow from financing activities 894 014 220 957
Net increase in cash and cash equivalents 5 802 426 Cash and cash equivalents at beginning of the year 486 60
Cash and cash equivalents at end of the year 6 288 486
NOTES TO THE ANNUAL FINANCIAL STATEMENTS FOR THE YEAR ENDED 31 DECEMBER 2015
1. BANK BALANCES
Bank balances consist of the following:
2015 2014
Current accounts 6 287 574 485 730 Total 6 287 574 485 730
Interest was earned at 5.25% (2014: 4.75%) on current accounts.
2. CHARGES
- No initial charge is payable.- The service charge is calculated per annum (incl. VAT) on a daily basis as a percentage of market value as follows: Class B1 - 0.91% (2014: 0.79%) Class B2 - 1.14% (2014: N/A) Class B3 - 0% (2014: 0%) Class B4 - 0% (2014: N/A) Class B10 - 1.02% (2014: 0.93%)
153

SANLAM STABLE GROWTH FUND
2015 2014
R'000 R'000
STATEMENT OF COMPREHENSIVE INCOME FOR THE YEAR ENDED 31 DECEMBER 2015
Income 13 829 27 397
Dividend revenue 15 316 14 707 Interest revenue 3 308 3 073 Income adjustment due to creation and cancellation of participatory interests (8) 169 Net fair value (losses)/gains on financial instruments (4 787) 9 448
Expenses 1 830 1 930
Service fees 1 309 1 267 Audit fees 55 62 Withholding tax 158 113 Custodian, trustee and bank charges 53 82 Transaction costs 255 406
Operating profit 11 999 25 467
Finance costs 17 037 16 421
Distributions to unit holders 17 037 16 421
Change in net assets attributable to unit holders (5 038) 9 046
STATEMENT OF FINANCIAL POSITION AS AT 31 DECEMBER 2015
Assets
Investments 403 212 391 730
Equities and specialist securities - Local 400 636 356 211 Participatory Interest in Collective Investment Schemes - Local 2 576 35 519
Accrued income and debtors 1 136 336
Cash and bank balances 62 934 78 782
Total assets 467 282 470 848
Liabilities 8 668 9 883
Trade and other payables 58 1 023 Related parties payable 110 112 Distributions payable 8 500 8 748
Net assets attributable to unit holders 458 614 460 965
Balance at the beginning of the year 460 965 433 390 Change in net assets attributable to unit holders (5 038) 9 046 Creation of participatory interests 18 485 31 627 Liquidation of participatory interests (15 798) (13 098)
Balance at the end of the year 458 614 460 965
STATEMENT OF CHANGES IN NET ASSETS ATTRIBUTABLE TO UNIT HOLDERS FOR THE
YEAR ENDED 31 DECEMBER 2015
154

SANLAM STABLE GROWTH FUND
2015 2014
R'000 R'000
STATEMENT OF CASH FLOWS FOR THE YEAR ENDED 31 DECEMBER 2015
Cash flow from operating activities
Operating profit before finance costs 11 999 25 467 Adjusted for:Dividend revenue (15 316) (14 707) Interest revenue (3 308) (3 073) Income adjustment due to creation and cancellation of participatory interests 8 (169) Net fair value losses/(gains) on investments 4 787 (9 448) Operating loss before working capital changes (1 830) (1 930)
Working capital changes: (1 767) 44 Increase in accrued income and debtors (800) (87) (Decrease)/increase in trade, related parties and other payables (967) 131
Cash utilised by operations (3 597) (1 886) Interest received 3 308 3 073 Dividends received 15 316 14 707
Net cash inflow from operating activities 15 027 15 894
Cash flow from investing activities
Net (purchase)/sale of securities (16 269) 15 908
Net cash (outflow)/inflow from investing activities (16 269) 15 908
Cash flow from financing activities
Net creation of participatory interest 2 679 2 172 Cash (distributed to)/reinvested by unit holders (17 285) 49
Net cash (outflow)/inflow from financing activities (14 606) 2 221
Net (decrease)/increase in cash and cash equivalents (15 848) 34 023 Cash and cash equivalents at beginning of the year 78 782 44 759
Cash and cash equivalents at end of the year 62 934 78 782
NOTES TO THE ANNUAL FINANCIAL STATEMENTS FOR THE YEAR ENDED 31 DECEMBER 2015
1. BANK BALANCES
Bank balances consist of the following:
2015 2014
Current accounts 37 364 256 54 360 313 SAFEX 25 569 767 24 421 487 Total 62 934 023 78 781 800
Interest was earned at 5.25% (2014: 4.75%) on current accounts.Interest was earned at 5.75% (2014: 4.75%) on SAFEX deposits.
2. CHARGES
- No initial charge is payable.- The service charge is calculated per annum (incl. VAT) on a daily basis as a percentage of market value as follows: Class A1 - 1.39% (2014: 1.39%) Class B1 - 1.02% (2014: 1.03%) Class B2 - 0.99% (2014: 0.99%) Class B3 - 0.28% (2014: 0.29%) Class B4 - 0.79% (2014: 0.80%) Class B5 - 0.45% (2014: 0.45%)
155

SANLAM VALUE INSTITUTIONAL FUND
2015 2014
R'000 R'000
STATEMENT OF COMPREHENSIVE INCOME FOR THE YEAR ENDED 31 DECEMBER 2015
Income 79 249 237 683
Dividend revenue 51 705 49 834 Interest revenue 2 346 3 824 Income adjustment due to creation and cancellation of participatory interests (696) (585) Net fair value gains on financial instruments 25 894 184 610
Expenses 1 305 1 514
Performance fees - (1 219) Audit fees 90 49 Withholding tax (7) (66) Custodian, trustee and bank charges 244 303 Transaction costs 978 2 447
Operating profit 77 944 236 169
Finance costs 53 035 53 998
Distributions to unit holders 53 035 53 998
Change in net assets attributable to unit holders 24 909 182 171
STATEMENT OF FINANCIAL POSITION AS AT 31 DECEMBER 2015
Assets
Investments 1 604 151 1 680 998
Equities and specialist securities - Local 1 604 151 1 680 998
Accrued income and debtors 2 073 3 224
Cash and bank balances 25 737 20 302
Total assets 1 631 961 1 704 524
Liabilities 11 138 9 902
Trade and other payables 103 62 Distributions payable 11 035 9 840
Net assets attributable to unit holders 1 620 823 1 694 622
Balance at the beginning of the year 1 694 622 1 596 442 Change in net assets attributable to unit holders 24 909 182 171 Creation of participatory interests 132 700 112 559 Liquidation of participatory interests (231 408) (196 550)
Balance at the end of the year 1 620 823 1 694 622
STATEMENT OF CHANGES IN NET ASSETS ATTRIBUTABLE TO UNIT HOLDERS FOR THE
YEAR ENDED 31 DECEMBER 2015
156

SANLAM VALUE INSTITUTIONAL FUND
2015 2014
R'000 R'000
STATEMENT OF CASH FLOWS FOR THE YEAR ENDED 31 DECEMBER 2015
Cash flow from operating activities
Operating profit before finance costs 77 944 236 169 Adjusted for:Dividend revenue (51 705) (49 834) Interest revenue (2 346) (3 824) Income adjustment due to creation and cancellation of participatory interests 696 585 Net fair value gains on investments (25 894) (184 610) Operating loss before working capital changes (1 305) (1 514)
Working capital changes: 1 192 4 048 Decrease in accrued income and debtors 1 151 4 045 Increase in trade, related parties and other payables 41 3
Cash (utilised)/generated by operations (113) 2 534 Interest received 2 346 3 824 Dividends received 51 705 49 834 Foreign exchange gains - -
Net cash inflow from operating activities 53 938 56 192
Cash flow from investing activities
Net sale of securities 102 741 62 010
Net cash inflow from investing activities 102 741 62 010
Cash flow from financing activities
Net cancellation of participatory interest (99 404) (138 568) Cash distributed to units holders (51 840) (1 710)
Net cash outflow from financing activities (151 244) (140 278)
Net increase/(decrease) in cash and cash equivalents 5 435 (22 076) Cash and cash equivalents at beginning of the year 20 302 42 378
Cash and cash equivalents at end of the year 25 737 20 302
NOTES TO THE ANNUAL FINANCIAL STATEMENTS FOR THE YEAR ENDED 31 DECEMBER 2015
1. BANK BALANCES
Bank balances consist of the following:
2015 2014
Current accounts 23 737 049 20 302 075 Total 23 737 049 20 302 075
Interest was earned at 5.25% (2014: 4.75%) on current accounts.
2. CHARGES
- No initial charge is payable.- The service charge is calculated per annum (incl. VAT) on a daily basis as a percentage of market value as follows: Class B1 - 0% (2014: 0%) Class B2 - 0% (2014: 0%) Class B3 - 0.79% (2014: 0.80%) Class B4 - 0% (2014: N/A) Class B5 - 0.93% (2014: 0.93%) Class B6 - 0.64% (2014: N/A) Class B8 -1.14 % (2014: N/A) Class B10 -0.99 % (2014: N/A)
157
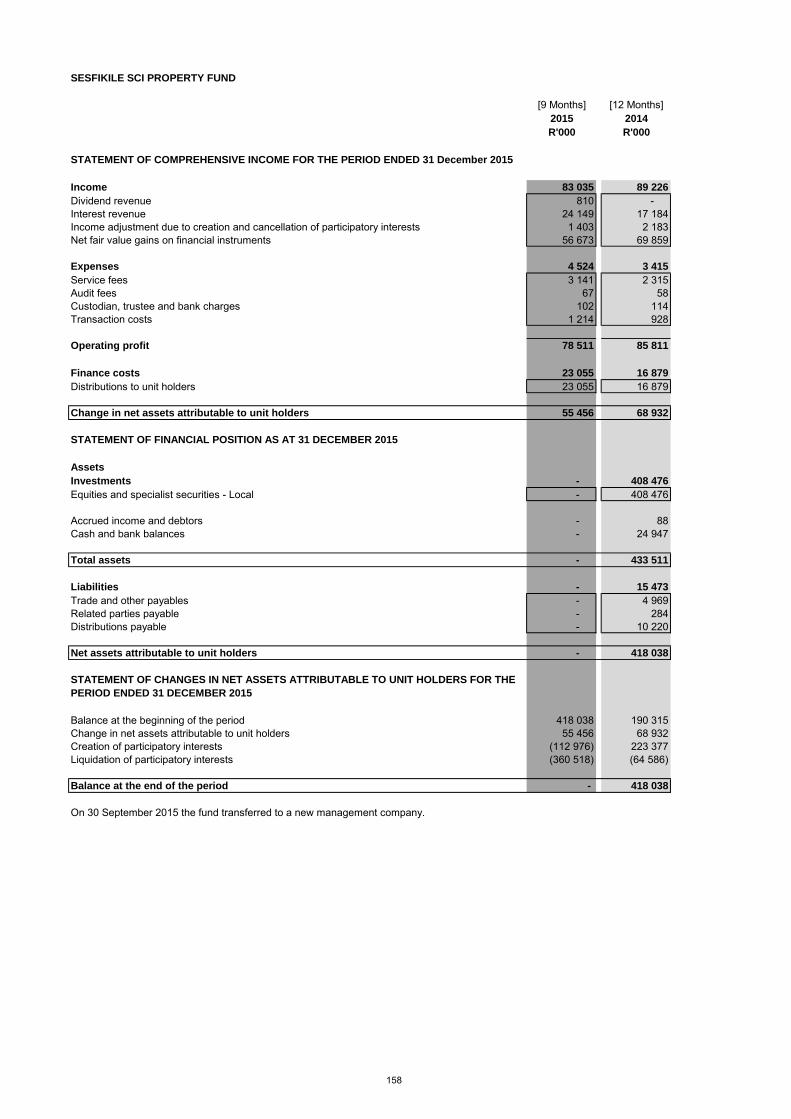
SESFIKILE SCI PROPERTY FUND
[9 Months] [12 Months]2015 2014
R'000 R'000
STATEMENT OF COMPREHENSIVE INCOME FOR THE PERIOD ENDED 31 December 2015
Income 83 035 89 226
Dividend revenue 810 - Interest revenue 24 149 17 184Income adjustment due to creation and cancellation of participatory interests 1 403 2 183Net fair value gains on financial instruments 56 673 69 859
Expenses 4 524 3 415
Service fees 3 141 2 315Audit fees 67 58Custodian, trustee and bank charges 102 114Transaction costs 1 214 928
Operating profit 78 511 85 811
Finance costs 23 055 16 879
Distributions to unit holders 23 055 16 879
Change in net assets attributable to unit holders 55 456 68 932
STATEMENT OF FINANCIAL POSITION AS AT 31 DECEMBER 2015
Assets
Investments - 408 476
Equities and specialist securities - Local - 408 476
Accrued income and debtors - 88Cash and bank balances - 24 947
Total assets - 433 511
Liabilities - 15 473
Trade and other payables - 4 969Related parties payable - 284Distributions payable - 10 220
Net assets attributable to unit holders - 418 038
STATEMENT OF CHANGES IN NET ASSETS ATTRIBUTABLE TO UNIT HOLDERS FOR THE
PERIOD ENDED 31 DECEMBER 2015
Balance at the beginning of the period 418 038 190 315Change in net assets attributable to unit holders 55 456 68 932Creation of participatory interests (112 976) 223 377Liquidation of participatory interests (360 518) (64 586)
Balance at the end of the period - 418 038
On 30 September 2015 the fund transferred to a new management company.
158

SESFIKILE SCI PROPERTY FUND
STATEMENT OF CASH FLOWS FOR THE PERIOD ENDED 31 DECEMBER 2015
[9 Months] [12 Months]2015 2014
R'000 R'000
Cash flow from operating activities
Operating profit before finance costs 78 511 85 811Adjusted for:Dividend revenue (810) - Interest revenue (24 149) (17 184) Income adjustment due to creation and cancellation of participatory interests (1 403) (2 183) Net fair value gains on investments (56 673) (69 859)
Operating loss before working capital changes (4 524) (3 415)
Working capital changes: (5 165) 4 024 Decrease/(increase) in accrued income and debtors 88 351 (Decrese)/Increase in trade, related parties and other payables (5 253) 3 673
Cash (utilised)/generated by operations (9 689) 609 Interest received 24 149 17 184Dividends received 810
Net cash inflow from operating activities 15 270 17 793
Cash flow from investing activities
Net purchase of securities 465 149 (148 631)
Net cash inflow/(outflow) from investing activities 465 149 (148 631)
Cash flow from financing activities
Net (cancellation)/creation of participatory interest (472 091) 149 096Cash distributed to unit holders (33 275) (40)
Net cash (outflow)/inflow from financing activities (505 366) 149 056
Net increase in cash and cash equivalents (24 947) 18 218Cash and cash equivalents at beginning of the period 24 947 6 729
Cash and cash equivalents at end of period - 24 947
NOTES TO THE ANNUAL FINANCIAL STATEMENTS FOR THE PERIOD ENDED 31 DECEMBER 2015
1. BANK BALANCES
Bank balances consist of the following:2015 2014
Current accounts - 24 946 557Total - 24 946 557
Interest was earned at 5.25% (2014: 4.75%) on current accounts.
2. CHARGES
- No initial charge is payable.- The service charge is calculated per annum (incl. VAT) on a daily basis as a percentage of market value as follows: Class A1 - 1.25% (2014: 1.25%) Class B1 - 1.02% (2014: 1.02%) Class B2 - 0.74% (2014: 0.74%)
159

SIM ABSOLUTE RETURN INCOME FUND
2015 2014
R'000 R'000
STATEMENT OF COMPREHENSIVE INCOME FOR THE YEAR ENDED 31 DECEMBER 2015
Income 60 200 71 245
Dividend revenue 17 28 Interest revenue 61 799 78 363 Other income - 1 Income adjustment due to creation and cancellation of participatory interests (3 825) (3 885) Net fair value gains/(losses) on financial instruments 2 209 (3 262)
Expenses 3 427 3 923
Service fees 3 222 3 669 Audit fees 73 79 Withholding tax - (16) Custodian, trustee and bank charges 120 159 Transaction costs 12 32
Operating profit 56 773 67 322
Finance costs 54 555 70 650
Distributions to unit holders 54 555 70 650
Change in net assets attributable to unit holders 2 218 (3 328)
STATEMENT OF FINANCIAL POSITION AS AT 31 DECEMBER 2015
Assets
Investments 785 833 935 830
Equities and specialist securities - Local 6 241 5 367 Participatory Interest in Collective Investment Schemes - Local 6 245 14 258 Bonds - Local 149 296 148 907 Money market instruments 624 051 767 298
Accrued income and debtors 9 871 12 026
Cash and bank balances 41 346 55 859
Total assets 837 050 1 003 715
Liabilities 28 827 33 226
Trade and other payables 77 134 Related parties payable 238 288 Distributions payable 28 512 32 804
Net assets attributable to unit holders 808 223 970 489
Balance at the beginning of the year 970 489 1 088 455 Change in net assets attributable to unit holders 2 218 (3 328) Creation of participatory interests 923 525 526 900 Liquidation of participatory interests (1 088 009) (641 538)
Balance at the end of the year 808 223 970 489
STATEMENT OF CHANGES IN NET ASSETS ATTRIBUTABLE TO UNIT HOLDERS FOR THE
YEAR ENDED 31 DECEMBER 2015
160

SIM ABSOLUTE RETURN INCOME FUND
2015 2014
R'000 R'000
STATEMENT OF CASH FLOWS FOR THE YEAR ENDED 31 DECEMBER 2015
Cash flow from operating activities
Operating profit before finance costs 56 773 67 322 Adjusted for:Dividend revenue (17) (28) Interest revenue (61 799) (78 363) Income adjustment due to creation and cancellation of participatory interests 3 825 3 885 Net fair value (gains)/losses on investments (2 209) 3 262 Operating loss before working capital changes (3 427) (3 922)
Working capital changes: 2 048 (835) Decrease/(increase) in accrued income and debtors 2 155 (848) (Decrease)/increase in trade, related parties and other payables (107) 13
Cash utilised by operations (1 379) (4 757) Interest received 61 799 78 363 Dividends received 17 28
Net cash inflow from operating activities 60 437 73 634
Cash flow from investing activities
Net sale of securities 152 206 134 832
Net cash inflow from investing activities 152 206 134 832
Cash flow from financing activities
Net creation of participatory interest (168 309) (194 529) Cash distributed to units holders (58 847) (292)
Net cash outflow from financing activities (227 156) (194 821)
Net (decrease)/increase in cash and cash equivalents (14 513) 13 645 Cash and cash equivalents at beginning of the year 55 859 42 214
Cash and cash equivalents at end of the year 41 346 55 859
NOTES TO THE ANNUAL FINANCIAL STATEMENTS FOR THE YEAR ENDED 31 DECEMBER 2015
1. BANK BALANCES
Bank balances consist of the following:
2015 2014
Current accounts 31 372 481 27 546 114 Call deposit accounts 9 973 702 28 312 443 Total 41 346 183 55 858 557
Interest was earned at 5.25% (2014: 4.75%) on current accounts.Interest was earned at 5.49% (2014: 5.6%) on call deposit accounts.
2. CHARGES
- The initial charge did not exceed 2% (excl. VAT) of the selling price.- The service charge is calculated per annum (incl. VAT) on a daily basis as a percentage of market value as follows: Class A - 1.41% (2014: 1.41%) Class A1 - 1.25% (2014: 1.25%) Class B1 - 0% (2014: 0%) Class B2 - 2.39% (2014: 2.39%) Class B3 - 0.91% (2014: 0.91%) Class B4 - 0.68% (2014: 0.68%) Class B5 - 0.45% (2014: 0.46%)
161

SIM ACTIVE INCOME FUND
2015 2014
R'000 R'000
STATEMENT OF COMPREHENSIVE INCOME FOR THE YEAR ENDED 31 DECEMBER 2015
Income 376 962 400 117
Dividend revenue 76 160 Interest revenue 422 201 355 765 Other income 1 5 Income adjustment due to creation and cancellation of participatory interests (1 567) (2 036) Net fair value (losses)/gains on financial instruments (43 749) 46 223
Expenses 46 719 44 502
Service fees 45 857 43 695 Audit fees 98 84 Withholding tax - (49) Custodian, trustee and bank charges 703 655 Transaction costs 61 117
Operating profit 330 243 355 615
Finance costs 373 957 309 448
Distributions to unit holders 373 957 309 448
Change in net assets attributable to unit holders (43 714) 46 167
STATEMENT OF FINANCIAL POSITION AS AT 31 DECEMBER 2015
Assets
Investments 5 741 533 5 075 039
Equities and specialist securities - Local 40 634 29 195 Participatory Interest in Collective Investment Schemes - Local 38 115 77 524 Bonds - Local 882 952 673 458 Money market instruments 4 779 832 4 294 862
Accrued income and debtors 71 203 59 090
Cash and bank balances 84 052 275 157
Total assets 5 896 788 5 409 286
Liabilities 103 607 86 605
Trade and other payables 137 381 Related parties payable 3 835 3 757 Distributions payable 99 635 82 467
Net assets attributable to unit holders 5 793 181 5 322 681
Balance at the beginning of the year 5 322 681 5 299 524 Change in net assets attributable to unit holders (43 714) 46 167 Creation of participatory interests 2 532 367 1 901 576 Liquidation of participatory interests (2 018 153) (1 924 586)
Balance at the end of the year 5 793 181 5 322 681
STATEMENT OF CHANGES IN NET ASSETS ATTRIBUTABLE TO UNIT HOLDERS FOR THE
YEAR ENDED 31 DECEMBER 2015
162

SIM ACTIVE INCOME FUND
2015 2014
R'000 R'000
STATEMENT OF CASH FLOWS FOR THE YEAR ENDED 31 DECEMBER 2015
Cash flow from operating activities
Operating profit before finance costs 330 243 355 615 Adjusted for:Dividend revenue (76) (160) Interest revenue (422 201) (355 765) Income adjustment due to creation and cancellation of participatory interests 1 567 2 036 Net fair value gains on investments 43 749 (46 223) Operating loss before working capital changes (46 718) (44 497)
Working capital changes: (12 279) (3 338) Increase in accrued income and debtors (12 113) (3 290) Decrease in trade, related parties and other payables (166) (48)
Cash utilised by operations (58 997) (47 835) Interest received 422 201 355 765 Dividends received 76 160
Net cash inflow from operating activities 363 280 308 090
Cash flow from investing activities
Net (purchase)/sale of securities (710 243) 195 802
Net cash (outflow)/inflow from investing activities (710 243) 195 802
Cash flow from financing activities
Net creation/(cancellation) of participatory interest 512 647 (327 384) Cash distributed to units holders (356 789) (4 805)
Net cash inflow/(outflow) from financing activities 155 858 (332 189)
Net (decrease)/increase in cash and cash equivalents (191 105) 171 703 Cash and cash equivalents at beginning of the year 275 157 103 454
Cash and cash equivalents at end of the year 84 052 275 157
NOTES TO THE ANNUAL FINANCIAL STATEMENTS FOR THE YEAR ENDED 31 DECEMBER 2015
1. BANK BALANCES
Bank balances consist of the following:
2015 2014
Current accounts 41 012 507 54 126 319 Call deposit accounts 43 039 475 221 030 978 Total 84 051 982 275 157 297
Interest was earned at 5.25% (2014: 4.75%) on current accounts.Interest was earned at 5.25% (2014: 5.60%) on call deposit accounts.
2. CHARGES
The initial charge did not exceed 1.5% (excl. VAT) of the selling price- The service charge is calculated per annum (incl. VAT) on a daily basis as a percentage of market value as follows: Class A1 - 0.91% (2014: 0.91%) Class B1 - 0% (2014: 0%) Class B2 - 0.45% (2014: 0.46%) Class B3 - 0.85% (2014: 0.86%) Class B4 - 0.68% (2014: 0.68%) Class B5 - 0.51% (2014: 0.51%) Class B6 - 0.57% (2014: 0.57%) Class B7 - 1.42% (2014: 1.43%) Class B8 - 1.31% (2014: N/A) Class B9 - 1.14% (2014: 1.14%) Class B10 - 0.43% (2014: 0.43%) Class C - 2.39% (2014: 2.39%)
163

SIM BALANCED FUND
2015 2014
R'000 R'000
STATEMENT OF COMPREHENSIVE INCOME FOR THE YEAR ENDED 31 DECEMBER 2015
Income 745 140 946 308
Dividend revenue 200 516 133 600 Interest revenue 288 186 217 531 Other income 96 332 Income adjustment due to creation and cancellation of participatory interests 11 584 21 425 Net fair value gains on financial instruments 244 758 573 420
Expenses 105 318 100 603
Service fees 81 788 67 055 Performance fees 2 121 17 728 Audit fees 97 85 Withholding tax 4 024 3 563 Custodian, trustee and bank charges 1 837 1 465 Transaction costs 15 451 10 707
Operating profit 639 822 845 705
Finance costs 471 225 292 914
Distributions to unit holders 471 225 292 914
Change in net assets attributable to unit holders 168 597 552 791
STATEMENT OF FINANCIAL POSITION AS AT 31 DECEMBER 2015
Assets
Investments 11 992 097 9 909 224
Equities and specialist securities - Local 5 466 602 4 647 515 Equities and specialist securities - Foreign 437 488 313 192 Participatory Interest in Collective Investment Schemes - Local 1 481 060 1 502 787 Participatory Interest in Collective Investment Schemes - Foreign 2 625 068 1 962 885 Bonds - Local 1 981 879 1 482 845
Accrued income and debtors 93 252 59 905
Cash and bank balances 485 275 520 816
Total assets 12 570 624 10 489 945
Liabilities 360 365 185 134
Trade and other payables 99 339 23 812 Related parties payable 7 005 7 035 Distributions payable 254 021 154 287
Net assets attributable to unit holders 12 210 259 10 304 811
Balance at the beginning of the year 10 304 811 7 337 046 Change in net assets attributable to unit holders 168 597 552 791 Creation of participatory interests 2 687 034 2 802 499 Liquidation of participatory interests (950 183) (387 525)
Balance at the end of the year 12 210 259 10 304 811
STATEMENT OF CHANGES IN NET ASSETS ATTRIBUTABLE TO UNIT HOLDERS FOR THE
YEAR ENDED 31 DECEMBER 2015
164

SIM BALANCED FUND
2015 2014
R'000 R'000
STATEMENT OF CASH FLOWS FOR THE YEAR ENDED 31 DECEMBER 2015
Cash flow from operating activities
Operating profit before finance costs 639 822 845 705 Adjusted for:Dividend revenue (200 516) (133 600) Interest revenue (288 186) (217 531) Income adjustment due to creation and cancellation of participatory interests (11 584) (21 425) Net fair value gains on investments (244 758) (573 420) Operating loss before working capital changes (105 222) (100 271)
Working capital changes: 42 150 (17 485) Increase in accrued income and debtors (33 347) (38 236) Increase in trade, related parties and other payables 75 497 20 751
Cash utilised by operations (63 072) (117 756) Interest received 288 186 217 531 Dividends received 200 516 133 600 Foreign exchange gains 37 294 10 568
Net cash inflow from operating activities 462 924 243 943
Cash flow from investing activities
Net purchase of securities (1 875 409) (2 291 278)
Net cash outflow from investing activities (1 875 409) (2 291 278)
Cash flow from financing activities
Net creation of participatory interest 1 748 435 2 184 211 Cash distributed to units holders (371 491) (4 157)
Net cash inflow from financing activities 1 376 944 2 180 054
Net (decrease)/increase in cash and cash equivalents (35 541) 132 719 Cash and cash equivalents at beginning of the year 520 816 388 097
Cash and cash equivalents at end of the year 485 275 520 816
NOTES TO THE ANNUAL FINANCIAL STATEMENTS FOR THE YEAR ENDED 31 DECEMBER 2015
1. BANK BALANCES
Bank balances consist of the following:
2015 2014
Current accounts 179 485 758 193 172 247 Call deposits 287 977 391 - Foreign currency cash deposits 17 812 337 327 644 185 Total 485 275 486 520 816 432
Interest was earned at 5.25% (2014: 4.75%) on current accounts.Interest was earned at 5.25% (2014: 4.75%) on call deposit accounts.Interest was earned at 0% (2014: 0%) on foreign currency cash deposits.
2. CHARGES
- The initial charge did not exceed 5% (excl. VAT) of the selling price- The service charge is calculated per annum (incl. VAT) on a daily basis as a percentage of market value as follows: Class A - 1.25% (2014: 1.25%) Class B9 - 1.25% (2014: 1.25%) Class A1 - 1.42% (2014: 1.42%) Class B10 - 0% (2014: 0%) Class B - 0.85% (2014: 0.85%) Class B11 - 0.85% (2014: 0.86%) Class B1 - 2.39% (2014: 2.39%) Class R - 1.14% (2014: 1.14%) Class B2 - 0.39% (2014: N/A) Class B3 - 0.68 % (2014: 0.68%) Class B4 - 0.39% (2014: 0.39%) Class B5 - 0.91% (2014: N/A) Class B6 - 0.22% (2014: 0.22%) Class B7 - 0.68% (2014: 0.68%) Class B8 - 0.68% (2014: 0.68%)
165

SIM BOND PLUS FUND
2015 2014
R'000 R'000
STATEMENT OF COMPREHENSIVE INCOME FOR THE YEAR ENDED 31 DECEMBER 2015
Income (71 769) 147 392
Interest revenue 132 494 112 149 Income adjustment due to creation and cancellation of participatory interests 2 847 2 140 Net fair value (losses)/gains on financial instruments (207 110) 33 103
Expenses 1 340 1 452
Service fees 1 022 1 099 Audit fees 90 57 Custodian, trustee and bank charges 218 288 Transaction costs 10 8
Operating (loss)/profit (73 109) 145 940
Finance costs 134 008 112 845
Distributions to unit holders 134 008 112 845
Change in net assets attributable to unit holders (207 117) 33 095
STATEMENT OF FINANCIAL POSITION AS AT 31 DECEMBER 2015
Assets
Investments 1 510 951 1 463 894
Bonds - Local 1 510 951 1 463 894
Accrued income and debtors 40 606 31 436
Cash and bank balances 6 185 10 297
Total assets 1 557 742 1 505 627
Liabilities 70 684 59 555
Trade and other payables 99 67 Related parties payable 79 93 Distributions payable 70 506 59 395
Net assets attributable to unit holders 1 487 058 1 446 072
Balance at the beginning of the year 1 446 072 1 152 508 Change in net assets attributable to unit holders (207 117) 33 095 Creation of participatory interests 356 909 314 334 Liquidation of participatory interests (108 806) (53 865)
Balance at the end of the year 1 487 058 1 446 072
STATEMENT OF CHANGES IN NET ASSETS ATTRIBUTABLE TO UNIT HOLDERS FOR THE
YEAR ENDED 31 DECEMBER 2015
166
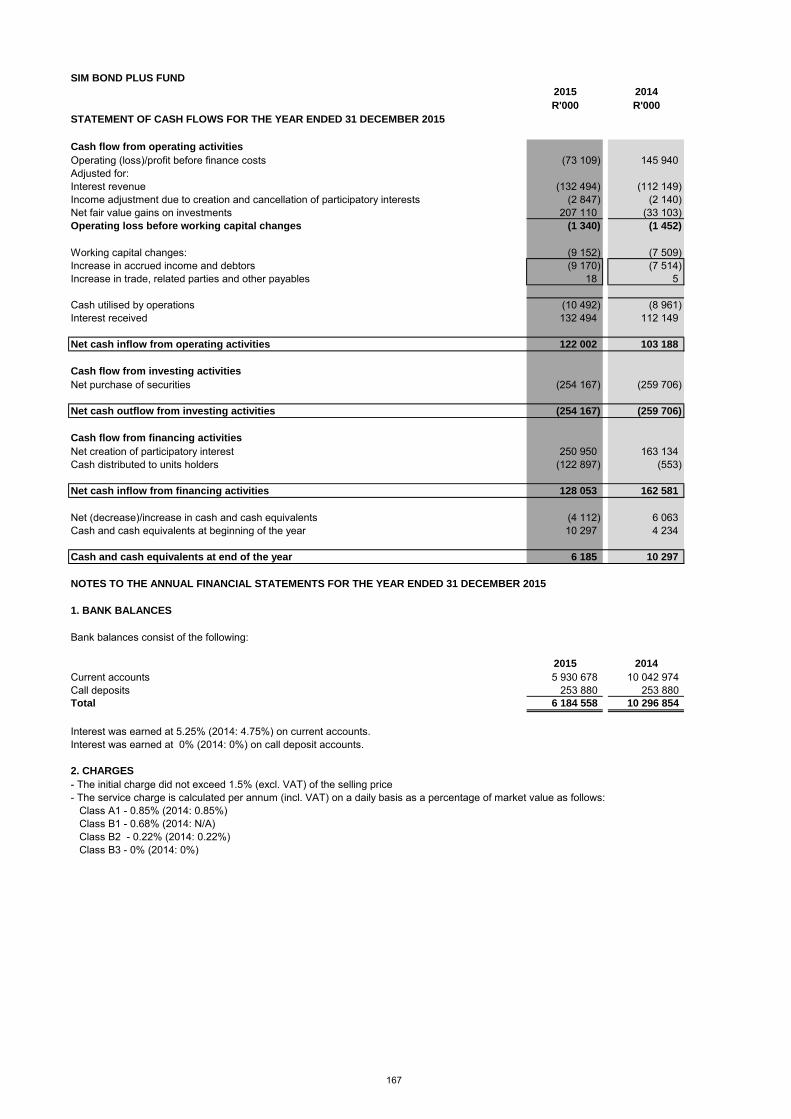
SIM BOND PLUS FUND
2015 2014
R'000 R'000
STATEMENT OF CASH FLOWS FOR THE YEAR ENDED 31 DECEMBER 2015
Cash flow from operating activities
Operating (loss)/profit before finance costs (73 109) 145 940 Adjusted for:Interest revenue (132 494) (112 149) Income adjustment due to creation and cancellation of participatory interests (2 847) (2 140) Net fair value gains on investments 207 110 (33 103) Operating loss before working capital changes (1 340) (1 452)
Working capital changes: (9 152) (7 509) Increase in accrued income and debtors (9 170) (7 514) Increase in trade, related parties and other payables 18 5
Cash utilised by operations (10 492) (8 961) Interest received 132 494 112 149
Net cash inflow from operating activities 122 002 103 188
Cash flow from investing activities
Net purchase of securities (254 167) (259 706)
Net cash outflow from investing activities (254 167) (259 706)
Cash flow from financing activities
Net creation of participatory interest 250 950 163 134 Cash distributed to units holders (122 897) (553)
Net cash inflow from financing activities 128 053 162 581
Net (decrease)/increase in cash and cash equivalents (4 112) 6 063 Cash and cash equivalents at beginning of the year 10 297 4 234
Cash and cash equivalents at end of the year 6 185 10 297
NOTES TO THE ANNUAL FINANCIAL STATEMENTS FOR THE YEAR ENDED 31 DECEMBER 2015
1. BANK BALANCES
Bank balances consist of the following:
2015 2014
Current accounts 5 930 678 10 042 974 Call deposits 253 880 253 880 Total 6 184 558 10 296 854
Interest was earned at 5.25% (2014: 4.75%) on current accounts.Interest was earned at 0% (2014: 0%) on call deposit accounts.
2. CHARGES
- The initial charge did not exceed 1.5% (excl. VAT) of the selling price- The service charge is calculated per annum (incl. VAT) on a daily basis as a percentage of market value as follows: Class A1 - 0.85% (2014: 0.85%) Class B1 - 0.68% (2014: N/A) Class B2 - 0.22% (2014: 0.22%) Class B3 - 0% (2014: 0%)
167

SIM ENHANCED YIELD FUND
2015 2014
R'000 R'000
STATEMENT OF COMPREHENSIVE INCOME FOR THE YEAR ENDED 31 DECEMBER 2015
Income 166 024 175 342
Interest revenue 199 680 176 905 Income adjustment due to creation and cancellation of participatory interests 1 036 (476) Net fair value losses on financial instruments (34 692) (1 087)
Expenses 1 919 2 039
Service fees 1 471 1 589 Audit fees 89 67 Custodian, trustee and bank charges 348 370 Transaction costs 11 13
Operating profit 164 105 173 303
Finance costs 198 837 174 500
Distributions to unit holders 198 837 174 500
Change in net assets attributable to unit holders (34 732) (1197)
STATEMENT OF FINANCIAL POSITION AS AT 31 DECEMBER 2015
Assets
Investments 2 756 879 2 499 695
Bonds - Local 1 259 217 1 288 808 Money market instruments 1 497 662 1 210 887
Accrued income and debtors 45 107 40 804
Cash and bank balances 27 282 11 512
Total assets 2 829 268 2 552 011
Liabilities 18 182 15 985
Trade and other payables 109 84 Related parties payable 180 97 Distributions payable 17 893 15 804
Net assets attributable to unit holders 2 811 086 2 536 026
Balance at the beginning of the year 2 536 026 2 363 716 Change in net assets attributable to unit holders (34 732) (1 197) Creation of participatory interests 1 428 399 1 152 287 Liquidation of participatory interests (1 118 607) (978 780)
Balance at the end of the year 2 811 086 2 536 026
STATEMENT OF CHANGES IN NET ASSETS ATTRIBUTABLE TO UNIT HOLDERS FOR THE
YEAR ENDED 31 DECEMBER 2015
168

SIM ENHANCED YIELD FUND
2015 2014
R'000 R'000
STATEMENT OF CASH FLOWS FOR THE YEAR ENDED 31 DECEMBER 2015
Cash flow from operating activities
Operating profit before finance costs 164 105 173 303 Adjusted for:Interest revenue (199 680) (176 905) Income adjustment due to creation and cancellation of participatory interests (1 036) 476 Net fair value gains on investments 34 692 1 087 Operating loss before working capital changes (1 919) (2 039)
Working capital changes: (4 195) (12 927) Increase in accrued income and debtors (4 303) (12 907) Increase/(decrease) in trade, related parties and other payables 108 (20)
Cash utilised by operations (6 114) (14 966) Interest received 199 680 176 905
Net cash inflow from operating activities 193 566 161 939
Cash flow from investing activities
Net purchase of securities (291 876) (166 751)
Net cash outflow from investing activities (291 876) (166 751)
Cash flow from financing activities
Net creation of participatory interest 310 828 964 Cash distributed to units holders (196 748) (395)
Net cash inflow from financing activities 114 080 569
Net increase/(decrease) in cash and cash equivalents 15 770 (4 243) Cash and cash equivalents at beginning of the year 11 512 15 755
Cash and cash equivalents at end of the year 27 282 11 512
NOTES TO THE ANNUAL FINANCIAL STATEMENTS FOR THE YEAR ENDED 31 DECEMBER 2015
1. BANK BALANCES
Bank balances consist of the following:
2015 2014
Current accounts 25 798 709 11 185 540 Call deposits accounts 1 483 328 326 079 Total 27 282 037 11 511 619
Interest was earned at 5.25% (2014: 4.75%) on current accounts.interest was earned at 0% (2014: 0%) on call deposit accounts
2. CHARGES
- The initial charge did not exceed 0.3% (excl. VAT) of the selling price.- The service charge is calculated per annum (incl. VAT) on a daily basis as a percentage of market value as follows: Class A1 - 0.47% (2014: 0.47%) Class B1 - 0.47 % (2014: 0.47%) Class B2 - 0.34 % (2014: 0.34%) Class B3 - 0% (2014: 0%)
169

SIM FINANCIAL FUND
2015 2014
R'000 R'000
STATEMENT OF COMPREHENSIVE INCOME FOR THE YEAR ENDED 31 DECEMBER 2015
Income 5 128 59 185
Dividend revenue 12 078 10 531 Interest revenue 898 580 Other income - 41 Income adjustment due to creation and cancellation of participatory interests 15 236 Net fair value (losses)/gains on financial instruments (7 863) 47 797
Expenses 5 286 4 708
Service fees 4 740 4 006 Audit fees 55 56 Withholding tax 206 239 Custodian, trustee and bank charges 70 71 Transaction costs 215 336
Operating profit (158) 54 477
Finance costs 8 453 7 083
Distributions to unit holders 8 453 7 083
Change in net assets attributable to unit holders (8 611) 47 394
STATEMENT OF FINANCIAL POSITION AS AT 31 DECEMBER 2015
Assets
Investments 279 678 283 826
Equities and specialist securities - Local 224 891 228 575 Equities and specialist securities - Foreign 54 787 43 738 Participatory Interest in Collective Investment Schemes - Foreign - 11 513
Accrued income and debtors 2 3
Cash and bank balances 834 1 804
Total assets 280 514 285 633
Liabilities 6 651 3 621
Cash and bank balances 1 596 - Trade and other payables 69 55 Related parties payable 370 361 Distributions payable 4 616 3 205
Net assets attributable to unit holders 273 863 282 012
Balance at the beginning of the year 282 012 245 477 Change in net assets attributable to unit holders (8 611) 47 394 Creation of participatory interests 90 119 101 526 Liquidation of participatory interests (89 657) (112 385)
Balance at the end of the year 273 863 282 012
STATEMENT OF CHANGES IN NET ASSETS ATTRIBUTABLE TO UNIT HOLDERS FOR THE
YEAR ENDED 31 DECEMBER 2015
170
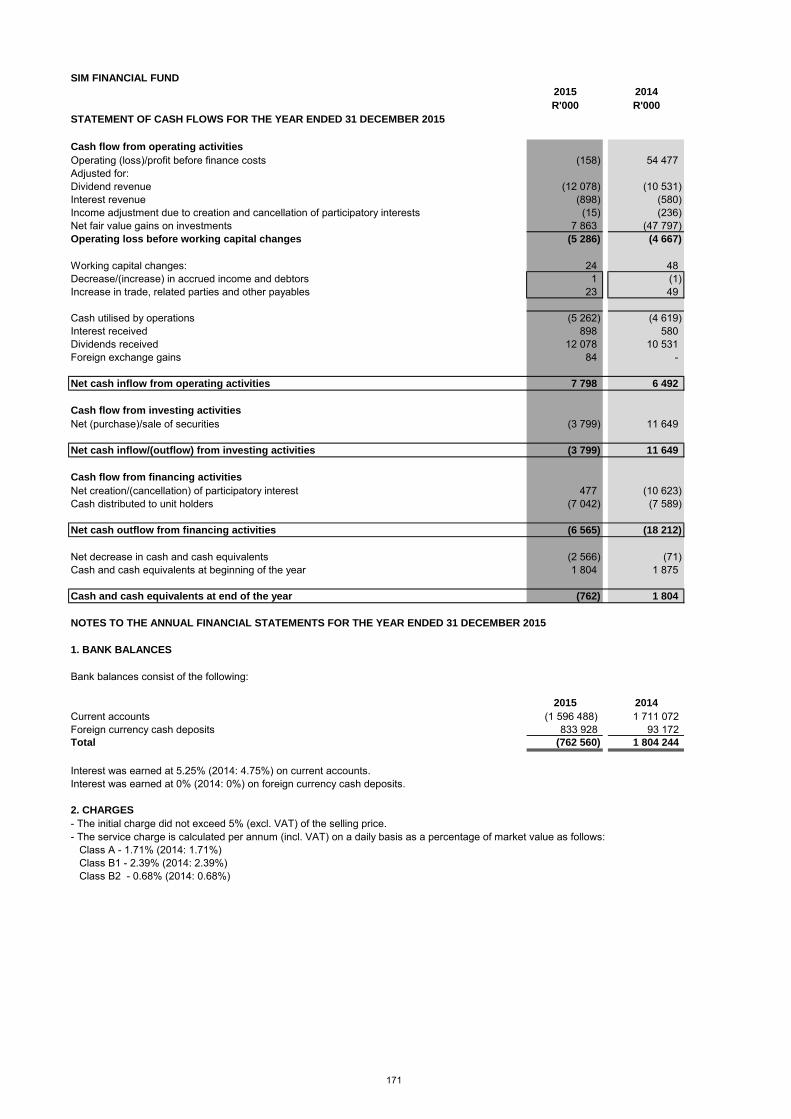
SIM FINANCIAL FUND
2015 2014
R'000 R'000
STATEMENT OF CASH FLOWS FOR THE YEAR ENDED 31 DECEMBER 2015
Cash flow from operating activities
Operating (loss)/profit before finance costs (158) 54 477 Adjusted for:Dividend revenue (12 078) (10 531) Interest revenue (898) (580) Income adjustment due to creation and cancellation of participatory interests (15) (236) Net fair value gains on investments 7 863 (47 797) Operating loss before working capital changes (5 286) (4 667)
Working capital changes: 24 48 Decrease/(increase) in accrued income and debtors 1 (1) Increase in trade, related parties and other payables 23 49
Cash utilised by operations (5 262) (4 619) Interest received 898 580 Dividends received 12 078 10 531 Foreign exchange gains 84 -
Net cash inflow from operating activities 7 798 6 492
Cash flow from investing activities
Net (purchase)/sale of securities (3 799) 11 649
Net cash inflow/(outflow) from investing activities (3 799) 11 649
Cash flow from financing activities
Net creation/(cancellation) of participatory interest 477 (10 623) Cash distributed to unit holders (7 042) (7 589)
Net cash outflow from financing activities (6 565) (18 212)
Net decrease in cash and cash equivalents (2 566) (71) Cash and cash equivalents at beginning of the year 1 804 1 875
Cash and cash equivalents at end of the year (762) 1 804
NOTES TO THE ANNUAL FINANCIAL STATEMENTS FOR THE YEAR ENDED 31 DECEMBER 2015
1. BANK BALANCES
Bank balances consist of the following:
2015 2014
Current accounts (1 596 488) 1 711 072 Foreign currency cash deposits 833 928 93 172 Total (762 560) 1 804 244
Interest was earned at 5.25% (2014: 4.75%) on current accounts.Interest was earned at 0% (2014: 0%) on foreign currency cash deposits.
2. CHARGES
- The initial charge did not exceed 5% (excl. VAT) of the selling price.- The service charge is calculated per annum (incl. VAT) on a daily basis as a percentage of market value as follows: Class A - 1.71% (2014: 1.71%) Class B1 - 2.39% (2014: 2.39%) Class B2 - 0.68% (2014: 0.68%)
171

SIM GENERAL EQUITY FUND
2015 2014
R'000 R'000
STATEMENT OF COMPREHENSIVE INCOME FOR THE YEAR ENDED 31 DECEMBER 2015
Income 256 838 597 699
Dividend revenue 201 388 147 693 Interest revenue 19 071 10 475 Other income 20 207 Income adjustment due to creation and cancellation of participatory interests (332) 636 Net fair value gains on financial instruments 36 691 438 688
Expenses 82 756 87 386
Service fees 62 728 55 759 Performance fees 5 046 15 914 Audit fees 98 69 Withholding tax 1 806 2 319 Custodian, trustee and bank charges 943 796 Transaction costs 12 135 12 529
Operating profit 174 082 510 313
Finance costs 154 288 84 801
Distributions to unit holders 154 288 84 801
Change in net assets attributable to unit holders 19 794 425 512
STATEMENT OF FINANCIAL POSITION AS AT 31 DECEMBER 2015
Assets
Investments 7 434 954 5 165 792
Equities and specialist securities - Local 6 792 957 4 720 155 Equities and specialist securities - Foreign 434 436 340 012 Participatory Interest in Collective Investment Schemes - Foreign 207 561 105 625
Accrued income and debtors 5 792 7 183
Cash and bank balances 61 282 144 008
Total assets 7 502 028 5 316 983
Liabilities 93 969 60 279
Trade and other payables 144 9 808 Related parties payable 4 579 5 759 Distributions payable 89 246 44 712
Net assets attributable to unit holders 7 408 059 5 256 704
Balance at the beginning of the year 5 256 704 4 573 956 Change in net assets attributable to unit holders 19 794 425 512 Creation of participatory interests 5 243 257 805 611 Liquidation of participatory interests (3 111 696) (548 375)
Balance at the end of the year 7 408 059 5 256 704
On 30 April 2015, SIM Index Fund merged into SIM General Equity Fund, resulting in all the assets being transferred into the fund at the effective date.
STATEMENT OF CHANGES IN NET ASSETS ATTRIBUTABLE TO UNIT HOLDERS
FOR THE YEAR ENDED 31 DECEMBER 2015
172
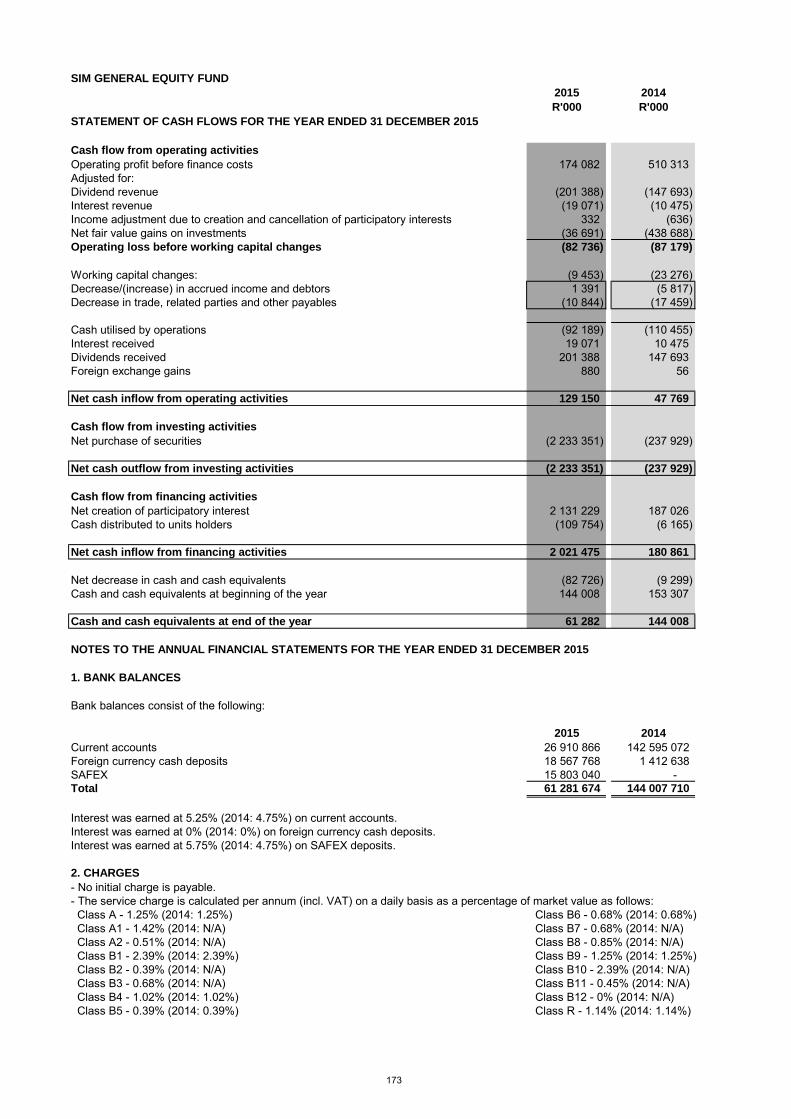
SIM GENERAL EQUITY FUND
2015 2014
R'000 R'000
STATEMENT OF CASH FLOWS FOR THE YEAR ENDED 31 DECEMBER 2015
Cash flow from operating activities
Operating profit before finance costs 174 082 510 313 Adjusted for:Dividend revenue (201 388) (147 693) Interest revenue (19 071) (10 475) Income adjustment due to creation and cancellation of participatory interests 332 (636) Net fair value gains on investments (36 691) (438 688) Operating loss before working capital changes (82 736) (87 179)
Working capital changes: (9 453) (23 276) Decrease/(increase) in accrued income and debtors 1 391 (5 817) Decrease in trade, related parties and other payables (10 844) (17 459)
Cash utilised by operations (92 189) (110 455) Interest received 19 071 10 475 Dividends received 201 388 147 693 Foreign exchange gains 880 56
Net cash inflow from operating activities 129 150 47 769
Cash flow from investing activities
Net purchase of securities (2 233 351) (237 929)
Net cash outflow from investing activities (2 233 351) (237 929)
Cash flow from financing activities
Net creation of participatory interest 2 131 229 187 026 Cash distributed to units holders (109 754) (6 165)
Net cash inflow from financing activities 2 021 475 180 861
Net decrease in cash and cash equivalents (82 726) (9 299) Cash and cash equivalents at beginning of the year 144 008 153 307
Cash and cash equivalents at end of the year 61 282 144 008
NOTES TO THE ANNUAL FINANCIAL STATEMENTS FOR THE YEAR ENDED 31 DECEMBER 2015
1. BANK BALANCES
Bank balances consist of the following:
2015 2014
Current accounts 26 910 866 142 595 072 Foreign currency cash deposits 18 567 768 1 412 638 SAFEX 15 803 040 - Total 61 281 674 144 007 710
Interest was earned at 5.25% (2014: 4.75%) on current accounts.Interest was earned at 0% (2014: 0%) on foreign currency cash deposits.Interest was earned at 5.75% (2014: 4.75%) on SAFEX deposits.
2. CHARGES
- No initial charge is payable.- The service charge is calculated per annum (incl. VAT) on a daily basis as a percentage of market value as follows: Class A - 1.25% (2014: 1.25%) Class B6 - 0.68% (2014: 0.68%) Class A1 - 1.42% (2014: N/A) Class B7 - 0.68% (2014: N/A) Class A2 - 0.51% (2014: N/A) Class B8 - 0.85% (2014: N/A) Class B1 - 2.39% (2014: 2.39%) Class B9 - 1.25% (2014: 1.25%) Class B2 - 0.39% (2014: N/A) Class B10 - 2.39% (2014: N/A) Class B3 - 0.68% (2014: N/A) Class B11 - 0.45% (2014: N/A) Class B4 - 1.02% (2014: 1.02%) Class B12 - 0% (2014: N/A) Class B5 - 0.39% (2014: 0.39%) Class R - 1.14% (2014: 1.14%)
173
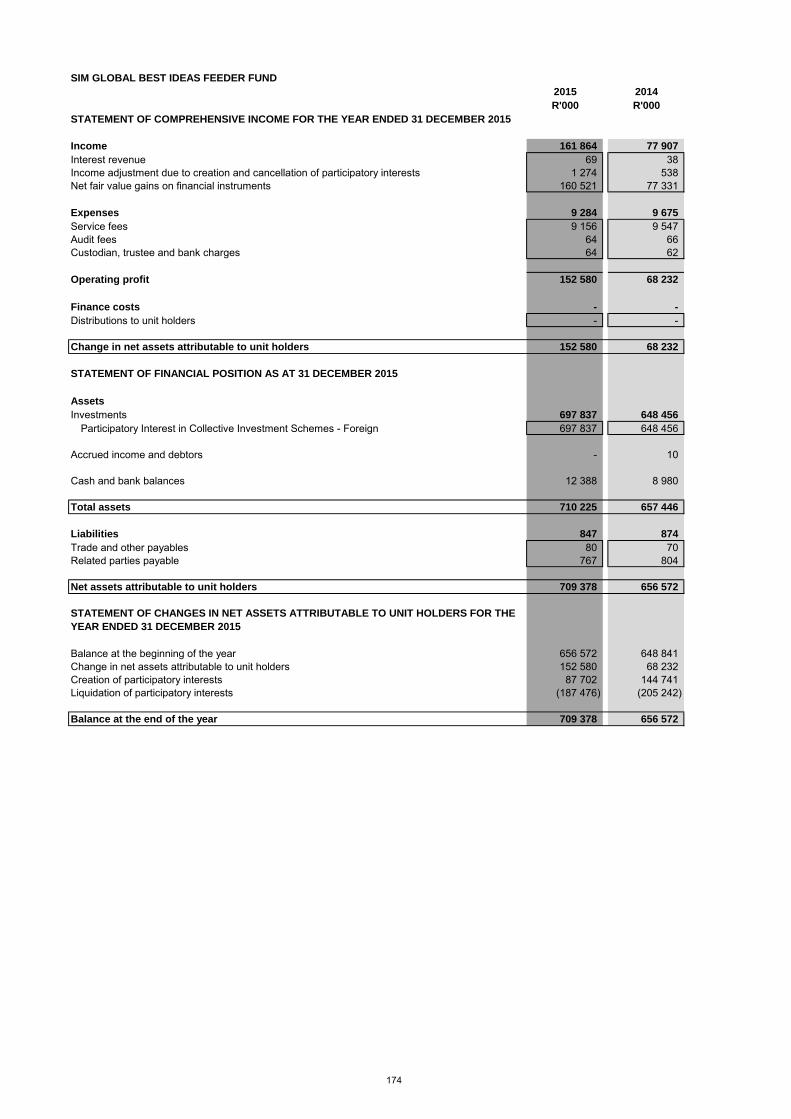
SIM GLOBAL BEST IDEAS FEEDER FUND
2015 2014
R'000 R'000
STATEMENT OF COMPREHENSIVE INCOME FOR THE YEAR ENDED 31 DECEMBER 2015
Income 161 864 77 907
Interest revenue 69 38 Income adjustment due to creation and cancellation of participatory interests 1 274 538 Net fair value gains on financial instruments 160 521 77 331
Expenses 9 284 9 675
Service fees 9 156 9 547 Audit fees 64 66 Custodian, trustee and bank charges 64 62
Operating profit 152 580 68 232
Finance costs - -
Distributions to unit holders - -
Change in net assets attributable to unit holders 152 580 68 232
STATEMENT OF FINANCIAL POSITION AS AT 31 DECEMBER 2015
Assets
Investments 697 837 648 456
Participatory Interest in Collective Investment Schemes - Foreign 697 837 648 456
Accrued income and debtors - 10
Cash and bank balances 12 388 8 980
Total assets 710 225 657 446
Liabilities 847 874
Trade and other payables 80 70 Related parties payable 767 804
Net assets attributable to unit holders 709 378 656 572
Balance at the beginning of the year 656 572 648 841 Change in net assets attributable to unit holders 152 580 68 232 Creation of participatory interests 87 702 144 741 Liquidation of participatory interests (187 476) (205 242)
Balance at the end of the year 709 378 656 572
STATEMENT OF CHANGES IN NET ASSETS ATTRIBUTABLE TO UNIT HOLDERS FOR THE
YEAR ENDED 31 DECEMBER 2015
174
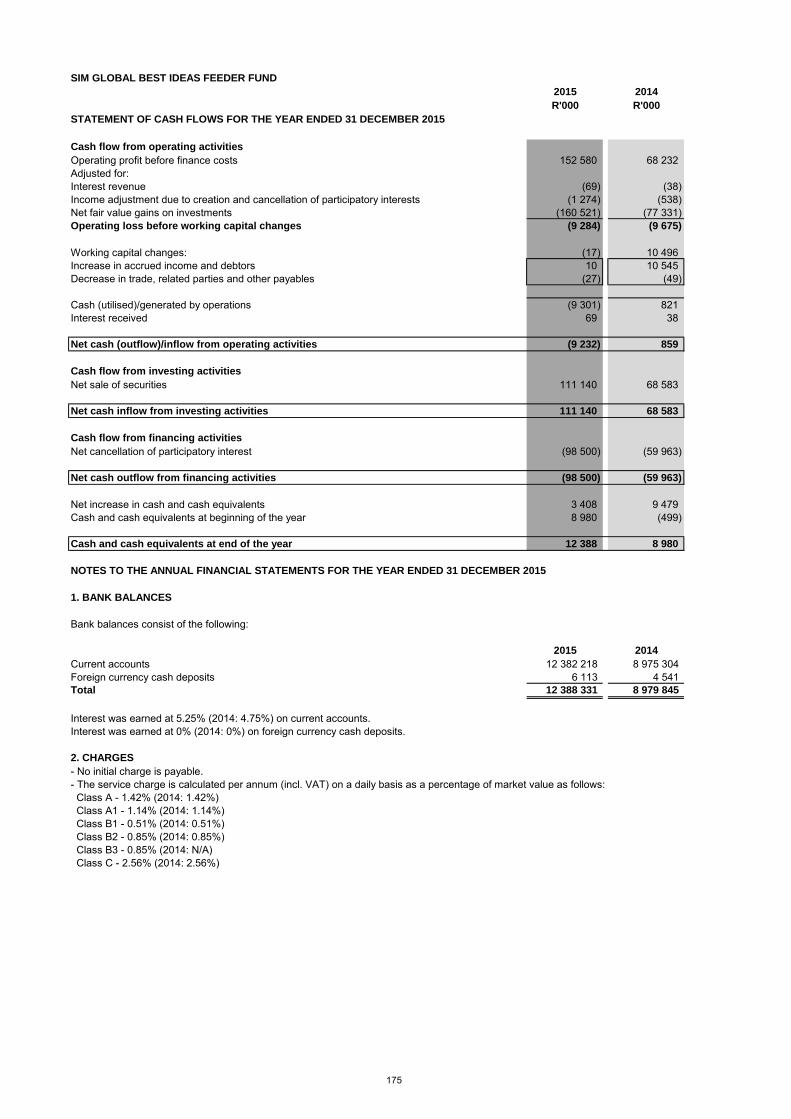
SIM GLOBAL BEST IDEAS FEEDER FUND
2015 2014
R'000 R'000
STATEMENT OF CASH FLOWS FOR THE YEAR ENDED 31 DECEMBER 2015
Cash flow from operating activities
Operating profit before finance costs 152 580 68 232 Adjusted for:Interest revenue (69) (38) Income adjustment due to creation and cancellation of participatory interests (1 274) (538) Net fair value gains on investments (160 521) (77 331) Operating loss before working capital changes (9 284) (9 675)
Working capital changes: (17) 10 496 Increase in accrued income and debtors 10 10 545 Decrease in trade, related parties and other payables (27) (49)
Cash (utilised)/generated by operations (9 301) 821 Interest received 69 38
Net cash (outflow)/inflow from operating activities (9 232) 859
Cash flow from investing activities
Net sale of securities 111 140 68 583
Net cash inflow from investing activities 111 140 68 583
Cash flow from financing activities
Net cancellation of participatory interest (98 500) (59 963)
Net cash outflow from financing activities (98 500) (59 963)
Net increase in cash and cash equivalents 3 408 9 479 Cash and cash equivalents at beginning of the year 8 980 (499)
Cash and cash equivalents at end of the year 12 388 8 980
NOTES TO THE ANNUAL FINANCIAL STATEMENTS FOR THE YEAR ENDED 31 DECEMBER 2015
1. BANK BALANCES
Bank balances consist of the following:
2015 2014
Current accounts 12 382 218 8 975 304 Foreign currency cash deposits 6 113 4 541 Total 12 388 331 8 979 845
Interest was earned at 5.25% (2014: 4.75%) on current accounts.Interest was earned at 0% (2014: 0%) on foreign currency cash deposits.
2. CHARGES
- No initial charge is payable.- The service charge is calculated per annum (incl. VAT) on a daily basis as a percentage of market value as follows: Class A - 1.42% (2014: 1.42%) Class A1 - 1.14% (2014: 1.14%) Class B1 - 0.51% (2014: 0.51%) Class B2 - 0.85% (2014: 0.85%) Class B3 - 0.85% (2014: N/A) Class C - 2.56% (2014: 2.56%)
175

SIM GLOBAL EQUITY INCOME FEEDER FUND
2015 2014
R'000 R'000
STATEMENT OF COMPREHENSIVE INCOME FOR THE YEAR ENDED 31 DECEMBER 2015
Income 12 528 1 869
Dividend revenue 1 171 773 Interest revenue 59 25 Income adjustment due to creation and cancellation of participatory interests 110 (12) Net fair value gains on financial instruments 11 188 1 083
Expenses 299 206
Service fees 246 136 Audit fees 21 43 Custodian, trustee and bank charges 32 27
Operating profit 12 229 1 663
Finance costs 1 140 625
Distributions to unit holders 1 140 625
Change in net assets attributable to unit holders 11 089 1 038
STATEMENT OF FINANCIAL POSITION AS AT 31 DECEMBER 2015
Assets
Investments 45 330 21 845
Participatory Interest in Collective Investment Schemes - Foreign 45 330 21 845
Accrued income and debtors 3 1
Cash and bank balances 2 366 1 311
Total assets 47 699 23 157
Liabilities 797 525
Trade and other payables 21 54 Related parties payable 31 16 Distributions payable 745 455
Net assets attributable to unit holders 46 902 22 632
Balance at the beginning of the year 22 632 11 030 Change in net assets attributable to unit holders 11 089 1 038 Creation of participatory interests 17 362 13 023 Liquidation of participatory interests (4 181) (2 459)
Balance at the end of the year 46 902 22 632
STATEMENT OF CHANGES IN NET ASSETS ATTRIBUTABLE TO UNIT HOLDERS FOR THE
YEAR ENDED 31 DECEMBER 2015
176

SIM GLOBAL EQUITY INCOME FEEDER FUND
2015 2014
R'000 R'000
STATEMENT OF CASH FLOWS FOR THE YEAR ENDED 31 DECEMBER 2015
Cash flow from operating activities
Operating profit before finance costs 12 229 1 663 Adjusted for:Dividend revenue (1 171) (773) Interest revenue (59) (25) Income adjustment due to creation and cancellation of participatory interests (110) 12 Net fair value gains on investments (11 188) (1 083) Operating loss before working capital changes (299) (206)
Working capital changes: (20) 4 Increase in accrued income and debtors (2) (1) (Decrease)/increase in trade, related parties and other payables (18) 5
Cash utilised by operations (319) (202) Interest received 59 25 Dividends received 1 171 773 Foreign exchange gains 118 18
Net cash inflow from operating activities 1 029 614
Cash flow from investing activities
Net purchase of securities (12 415) (9 949)
Net cash outflow from investing activities (12 415) (9 949)
Cash flow from financing activities
Net creation of participatory interest 13 291 10 275 Cash distributed to units holders (850) (26)
Net cash inflow from financing activities 12 441 10 249
Net increase in cash and cash equivalents 1 055 914 Cash and cash equivalents at beginning of the year 1 311 397
Cash and cash equivalents at end of the year 2 366 1 311
NOTES TO THE ANNUAL FINANCIAL STATEMENTS FOR THE YEAR ENDED 31 DECEMBER 2015
1. BANK BALANCES
Bank balances consist of the following:
2015 2014
Current accounts 1 460 643 737 381 Foreign currency cash deposits 904 857 574 145 Total 2 365 500 1 311 526
Interest was earned at 5.25% (2014: 4.75%) on current accounts.Interest was earned at 0% (2014: 0%) on foreign currency cash deposits.
2. CHARGES
- No initial charge is payable.- The service charge is calculated per annum (incl. VAT) on a daily basis as a percentage of market value as follows: Class A1- 0.85% (2014: 0.85%) Class B1 - 0.68% (2014: 0.68%)
177
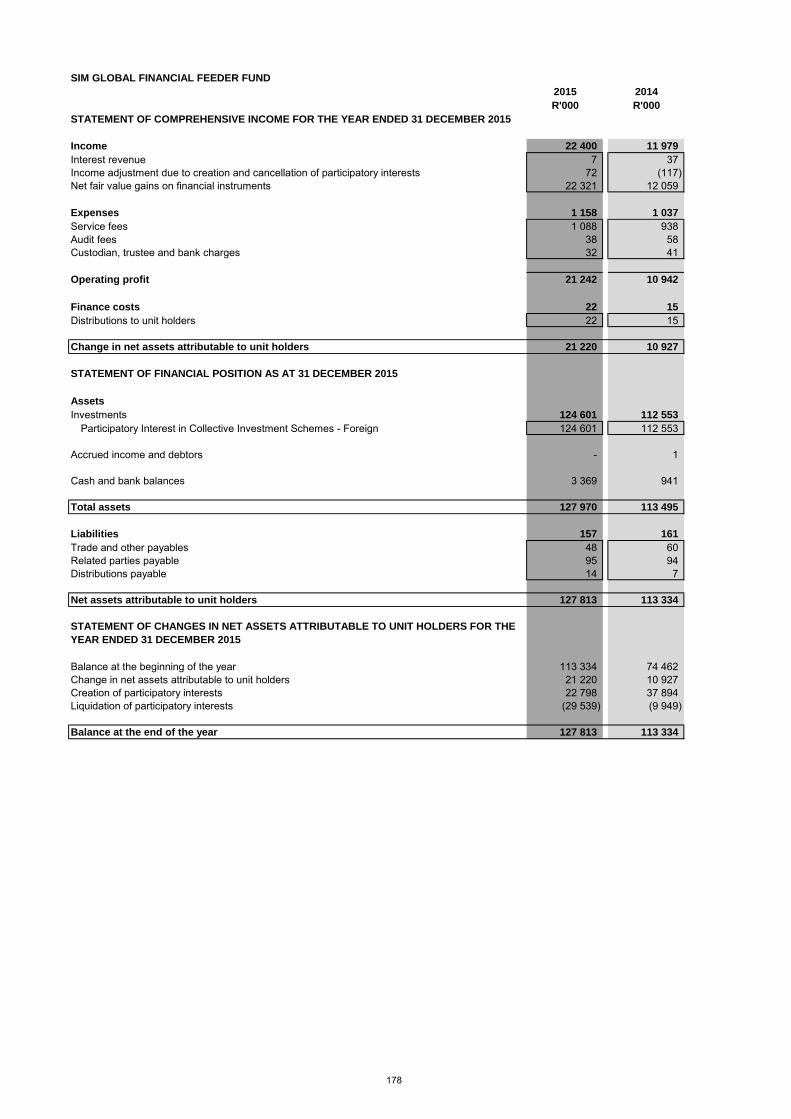
SIM GLOBAL FINANCIAL FEEDER FUND
2015 2014
R'000 R'000
STATEMENT OF COMPREHENSIVE INCOME FOR THE YEAR ENDED 31 DECEMBER 2015
Income 22 400 11 979
Interest revenue 7 37 Income adjustment due to creation and cancellation of participatory interests 72 (117) Net fair value gains on financial instruments 22 321 12 059
Expenses 1 158 1 037
Service fees 1 088 938 Audit fees 38 58 Custodian, trustee and bank charges 32 41
Operating profit 21 242 10 942
Finance costs 22 15
Distributions to unit holders 22 15
Change in net assets attributable to unit holders 21 220 10 927
STATEMENT OF FINANCIAL POSITION AS AT 31 DECEMBER 2015
Assets
Investments 124 601 112 553
Participatory Interest in Collective Investment Schemes - Foreign 124 601 112 553
Accrued income and debtors - 1
Cash and bank balances 3 369 941
Total assets 127 970 113 495
Liabilities 157 161
Trade and other payables 48 60 Related parties payable 95 94 Distributions payable 14 7
Net assets attributable to unit holders 127 813 113 334
Balance at the beginning of the year 113 334 74 462 Change in net assets attributable to unit holders 21 220 10 927 Creation of participatory interests 22 798 37 894 Liquidation of participatory interests (29 539) (9 949)
Balance at the end of the year 127 813 113 334
STATEMENT OF CHANGES IN NET ASSETS ATTRIBUTABLE TO UNIT HOLDERS FOR THE
YEAR ENDED 31 DECEMBER 2015
178

SIM GLOBAL FINANCIAL FEEDER FUND
2015 2014
R'000 R'000
STATEMENT OF CASH FLOWS FOR THE YEAR ENDED 31 DECEMBER 2015
Cash flow from operating activities
Operating profit before finance costs 21 242 10 942 Adjusted for:Interest revenue (7) (37) Income adjustment due to creation and cancellation of participatory interests (72) 117 Net fair value gains on investments (22 321) (12 059) Operating loss before working capital changes (1 158) (1 037)
Working capital changes: (10) 31 Decrease/(increase) in accrued income and debtors 1 (1) (Decrease)/increase in trade, related parties and other payables (11) 32
Cash utilised by operations (1 168) (1 006) Interest received 7 37
Net cash outflow from operating activities (1 161) (969)
Cash flow from investing activities
Net sale/(purchase) of securities 10 273 (26 275)
Net cash inflow/(outflow) from investing activities 10 273 (26 275)
Cash flow from financing activities
Net (cancellation)/creation of participatory interest (6 669) 27 821 Cash distributed to by unit holders (15) (1)
Net cash (outflow)/inflow from financing activities (6 684) 27 820
Net increase in cash and cash equivalents 2 428 576 Cash and cash equivalents at beginning of the year 941 365
Cash and cash equivalents at end of the year 3 369 941
NOTES TO THE ANNUAL FINANCIAL STATEMENTS FOR THE YEAR ENDED 31 DECEMBER 2015
1. BANK BALANCES
Bank balances consist of the following:
2015 2014
Current accounts 3 366 899 939 562 Foreign currency cash deposits 2 272 1 256 Total 3 369 171 940 818
Interest was earned at 5.25% (2014: 4.75%) on current accounts.Interest was earned at 0% (2014: 0%) on foreign currency cash deposits.
2. CHARGES
- The initial charge did not exceed 4.1% (excl. VAT) of the selling price.- The service charge is calculated per annum (incl. VAT) on a daily basis as a percentage of market value as follows: Class A1 - 1.14% (2014: 1.14%) Class B1 - 0.85% (2014: 0.85%) Class B2 - 0% (2014: N/A)
179

SIM INDEX FUND
STATEMENT OF COMPREHENSIVE INCOME FOR THE PERIOD ENDED 31 DECEMBER 2015
[4 Months] [12 Months]2015 2014
R'000 R'000
Income 206 795 180 693
Dividend revenue 26 365 59 915Interest revenue 1 181 1 653Income adjustment due to creation and cancellation of participatory interests (189) (1 547) Net fair value gains on financial instruments 179 438 120 672
Expenses 9 388 25 251
Service fees 7 462 23 511Audit fees 31 52Withholding tax (214) 773Custodian, trustee and bank charges 119 304Transaction costs 1 990 611
Operating profit 197 407 155 442
Finance costs 19 964 35 378
Distributions to unit holders 19 964 35 378
Change in net assets attributable to unit holders 177 443 120 064
STATEMENT OF FINANCIAL POSITION AS AT 31 DECEMBER 2015
2015 2014
R'000 R'000
Assets
Investments - 1 917 317
Equities and specialist securities - Local - 1 917 317
Accrued income and debtors - 44
Cash and bank balances - 17 384
Total assets - 1 934 745
Liabilities - 20 636
Trade and other payables - 64Related parties payable - 1 844Distributions payable - 18 728
Net assets attributable to unit holders - 1 914 109
STATEMENT OF CHANGES IN NET ASSETS ATTRIBUTABLE TO UNIT HOLDERS FOR THE
PERIOD ENDED 31 DECEMBER 2015
R'000 R'000
Balance at the beginning of the period 1 914 109 2 000 674Change in net assets attributable to unit holders 177 443 120 064Creation of participatory interests 40 382 53 726Liquidation of participatory interests (2 131 934) (260 355)
Balance at the end of the period - 1 914 109
The fund merged with the SIM General Equity Fund on 30 April 2015, resulting in the assets being transferred to the fundon the effective date.
180

SIM INDEX FUND
STATEMENT OF CASH FLOWS FOR THE PERIOD ENDED 31 DECEMBER 2015
[4 Months] [12 Months]2015 2014
R'000 R'000
Cash flow from operating activities
Operating profit before finance costs 197 407 155 442Adjusted for:Dividend revenue (26 365) (59 915) Interest revenue (1 181) (1 653) Income adjustment due to creation and cancellation of participatory interests 189 1 547Net fair value gains on investments (179 438) (120 672) Operating loss before working capital changes (9 388) (25 251)
Working capital changes: (1 864) (30) Decrease in accrued income and debtors 44 2Decrease increase in trade, related parties and other payables (1 908) (32)
Cash utilised by operations (11 252) (25 281) Interest received 1 181 1 653Dividends received 26 365 59 915
Net cash inflow from operating activities 16 294 36 287
Cash flow from investing activities
Net sale of securities 2 096 755 210 150
Net cash inflow from investing activities 2 096 755 210 150
Cash flow from financing activities
Net cancellation of participatory interest (2 091 741) (238 452) Cash distributed to unit holders (38 692) (4 494)
Net cash outflow from financing activities (2 130 433) (242 946)
Net (decrease)/increase in cash and cash equivalents (17 384) 3 491Cash and cash equivalents at beginning of the period 17 384 13 893
Cash and cash equivalents at end of the period - 17 384
NOTES TO THE ANNUAL FINANCIAL STATEMENTS FOR THE PERIOD ENDED 31 DECEMBER 2015
1. BANK BALANCES
Bank balances consist of the following:
2015 2014
Current accounts - 16 309 047SAFEX - 1 074 816Total - 17 383 863
Interest was earned at 5.25% (2014: 4.75%) on current accounts.Interest was earned at 5.75% (2014: 4.75%) on SAFEX accounts.
2. CHARGES
The initial charge did not exceed 5% (excl. VAT) of the selling price.- The service charge is calculated per annum (incl. VAT) on a daily basis as a percentage of market value as follows:Class A – 1.14% (2014: 1.14%)Class A1 – 0.51% (2014: 0.51%)Class B1 – 2.39% (2014: 2.39%)Class B2 – 0.45% (2014: 0.45%)
181

SIM INDUSTRIAL FUND
2015 2014
R'000 R'000
STATEMENT OF COMPREHENSIVE INCOME FOR THE YEAR ENDED 31 DECEMBER 2015
Income 350 747 301 174
Dividend revenue 29 051 24 752 Interest revenue 2 338 2 845 Other income - 2 Income adjustment due to creation and cancellation of participatory interests (102) (219) Net fair value gains on financial instruments 319 460 273 794
Expenses 27 762 20 643
Service fees 22 233 17 750 Audit fees 89 52 Withholding tax 683 386 Custodian, trustee and bank charges 473 254 Transaction costs 4 284 2 201
Operating profit 322 985 280 531
Finance costs 8 139 8 350
Distributions to unit holders 8 139 8 350
Change in net assets attributable to unit holders 314 846 272 181
STATEMENT OF FINANCIAL POSITION AS AT 31 DECEMBER 2015
Assets
Investments 1 870 692 1 537 984
Equities and specialist securities - Local 1 714 756 1 424 330 Equities and specialist securities - Foreign 155 936 113 654
Accrued income and debtors 93 650
Cash and bank balances 91 926 73 765
Total assets 1 962 711 1 612 399
Liabilities 5 959 8 978
Trade and other payables 136 51 Related parties payable 2 045 1 663 Distributions payable 3 778 7 264
Net assets attributable to unit holders 1 956 752 1 603 421
Balance at the beginning of the year 1 603 421 1 332 929 Change in net assets attributable to unit holders 314 846 272 181 Creation of participatory interests 219 810 149 825 Liquidation of participatory interests (181 325) (151 514)
Balance at the end of the year 1 956 752 1 603 421
STATEMENT OF CHANGES IN NET ASSETS ATTRIBUTABLE TO UNIT HOLDERS FOR THE
YEAR ENDED 31 DECEMBER 2015
182

SIM INDUSTRIAL FUND
2015 2014
R'000 R'000
STATEMENT OF CASH FLOWS FOR THE YEAR ENDED 31 DECEMBER 2015
Cash flow from operating activities
Operating profit before finance costs 322 985 280 531 Adjusted for:Dividend revenue (29 051) (24 752) Interest revenue (2 338) (2 845) Income adjustment due to creation and cancellation of participatory interests 102 219 Net fair value gains on investments (319 460) (273 794) Operating loss before working capital changes (27 762) (20 641)
Working capital changes: 1 024 (288) Decrease/(increase) in accrued income and debtors 557 (628) Increase in trade, related parties and other payables 467 340
Cash utilised by operations (26 738) (20 929) Interest received 2 338 2 845 Dividends received 29 051 24 752 Foreign exchange gains 3 437 649
Net cash inflow from operating activities 8 088 7 317
Cash flow from investing activities
Net (purchase)/sale of securities (16 685) 47 399
Net cash (outflow)/inflow from investing activities (16 685) 47 399
Cash flow from financing activities
Net creation/(cancellation) of participatory interest 38 383 (1 908) Cash distributed to unit holders (11 625) (5 873)
Net cash inflow/(outflow) from financing activities 26 758 (7 781)
Net increase in cash and cash equivalents 18 161 46 935 Cash and cash equivalents at beginning of the year 73 765 26 830
Cash and cash equivalents at end of the year 91 926 73 765
NOTES TO THE ANNUAL FINANCIAL STATEMENTS FOR THE YEAR ENDED 31 DECEMBER 2015
1. BANK BALANCES
Bank balances consist of the following:
2015 2014
Current accounts 79 695 605 67 614 018 Foreign currency cash deposits 12 229 647 6 151 207 Total 91 925 252 73 765 225
Interest was earned at 5.25% (2014: 4.75%) on current accounts.Interest was earned at 0% (2014: 0%) on foreign currency cash deposits.
2. CHARGES
- The initial charge did not exceed 5% (excl. VAT) of the selling price.- The service charge is calculated per annum (incl. VAT) on a daily basis as a percentage of market value as follows: Class A - 1.71 % (2014: 1.71 %) Class B1 - 2.39% (2014: 2.39 %) Class B2 - 0.68 % (2014: 0.68 %) Class R - 1.14 % (2014: 1.14 %)
183
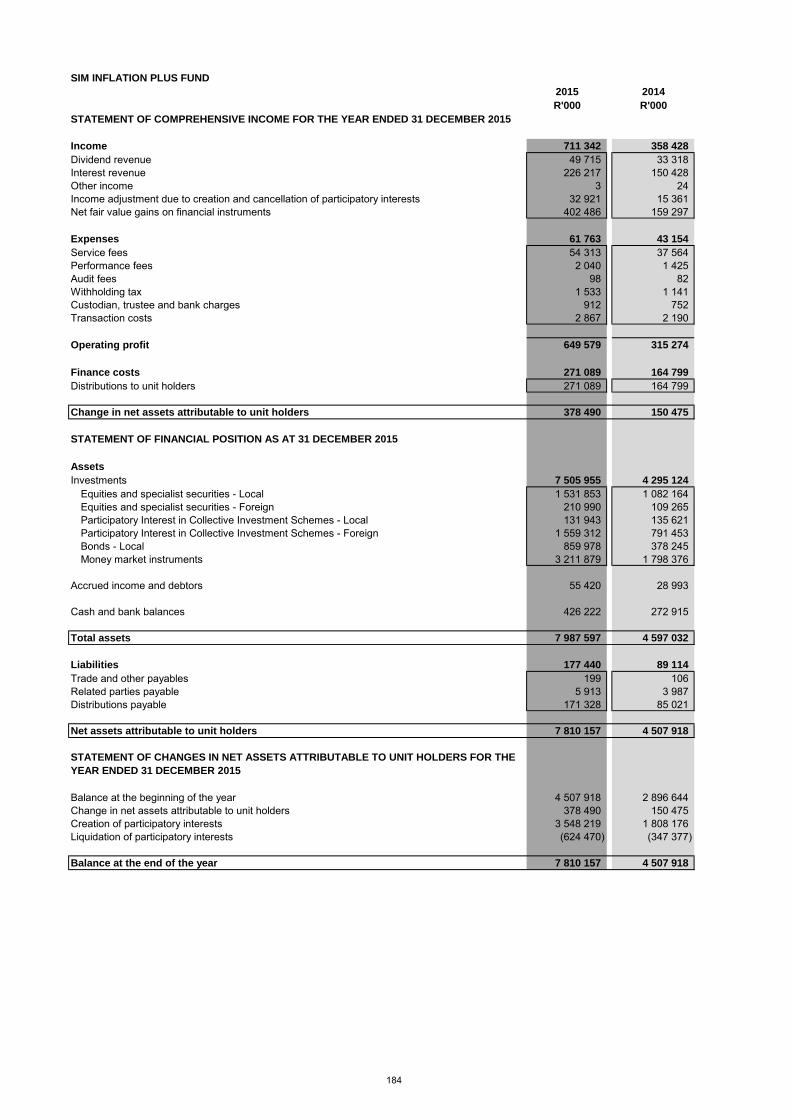
SIM INFLATION PLUS FUND
2015 2014
R'000 R'000
STATEMENT OF COMPREHENSIVE INCOME FOR THE YEAR ENDED 31 DECEMBER 2015
Income 711 342 358 428
Dividend revenue 49 715 33 318 Interest revenue 226 217 150 428 Other income 3 24 Income adjustment due to creation and cancellation of participatory interests 32 921 15 361 Net fair value gains on financial instruments 402 486 159 297
Expenses 61 763 43 154
Service fees 54 313 37 564 Performance fees 2 040 1 425 Audit fees 98 82 Withholding tax 1 533 1 141 Custodian, trustee and bank charges 912 752 Transaction costs 2 867 2 190
Operating profit 649 579 315 274
Finance costs 271 089 164 799
Distributions to unit holders 271 089 164 799
Change in net assets attributable to unit holders 378 490 150 475
STATEMENT OF FINANCIAL POSITION AS AT 31 DECEMBER 2015
Assets
Investments 7 505 955 4 295 124
Equities and specialist securities - Local 1 531 853 1 082 164 Equities and specialist securities - Foreign 210 990 109 265 Participatory Interest in Collective Investment Schemes - Local 131 943 135 621 Participatory Interest in Collective Investment Schemes - Foreign 1 559 312 791 453 Bonds - Local 859 978 378 245 Money market instruments 3 211 879 1 798 376
Accrued income and debtors 55 420 28 993
Cash and bank balances 426 222 272 915
Total assets 7 987 597 4 597 032
Liabilities 177 440 89 114
Trade and other payables 199 106 Related parties payable 5 913 3 987 Distributions payable 171 328 85 021
Net assets attributable to unit holders 7 810 157 4 507 918
Balance at the beginning of the year 4 507 918 2 896 644 Change in net assets attributable to unit holders 378 490 150 475 Creation of participatory interests 3 548 219 1 808 176 Liquidation of participatory interests (624 470) (347 377)
Balance at the end of the year 7 810 157 4 507 918
STATEMENT OF CHANGES IN NET ASSETS ATTRIBUTABLE TO UNIT HOLDERS FOR THE
YEAR ENDED 31 DECEMBER 2015
184

SIM INFLATION PLUS FUND
2015 2014
R'000 R'000
STATEMENT OF CASH FLOWS FOR THE YEAR ENDED 31 DECEMBER 2015
Cash flow from operating activities
Operating profit before finance costs 649 579 315 274 Adjusted for:Dividend revenue (49 715) (33 318) Interest revenue (226 217) (150 428) Income adjustment due to creation and cancellation of participatory interests (32 921) (15 361) Net fair value gains on investments (402 486) (159 297) Operating loss before working capital changes (61 760) (43 130)
Working capital changes: (24 408) (11 028) Increase in accrued income and debtors (26 427) (12 086) Increase in trade, related parties and other payables 2 019 1 058
Cash utilised by operations (86 168) (54 158) Interest received 226 217 150 428 Dividends received 49 715 33 318 Foreign exchange gains 18 056 2 509
Net cash inflow from operating activities 207 820 132 097
Cash flow from investing activities
Net purchase of securities (2 826 401) (1 390 358)
Net cash outflow from investing activities (2 826 401) (1 390 358)
Cash flow from financing activities
Net creation of participatory interest 2 956 670 1 341 998 Cash distributed to units holders (184 782) (4 371)
Net cash inflow from financing activities 2 771 888 1 337 627
Net increase in cash and cash equivalents 153 307 79 366 Cash and cash equivalents at beginning of the year 272 915 193 549
Cash and cash equivalents at end of the year 426 222 272 915
NOTES TO THE ANNUAL FINANCIAL STATEMENTS FOR THE YEAR ENDED 31 DECEMBER 2015
1. BANK BALANCES
Bank balances consist of the following:
2015 2014
Current accounts 138 858 738 97 987 408 Call deposits 2 981 851 40 427 356 Foreign currency cash deposits 189 861 990 81 300 099 SAFEX 94 519 233 53 200 362 Total 426 221 812 272 915 225
Interest was earned at 5.25% (2014: 4.75%) on current accounts.Interest was earned at 5.25% (2014: 4.7%) on call deposit accounts.Interest was earned at 0% (2014: 0%) on foreign currency cash deposits.Interest was earned at 5.75% (2014: 4.75%) on SAFEX deposits.
2. CHARGES
- No initial charge is payable.- The service charge is calculated per annum (incl. VAT) on a daily basis as a percentage of market value as follows: Class A - 1.14% (2014: 1.14%) Class B9 - 1.14% (2014: 1.14%) Class B1 - 2.39% (2014: 2.39%) Class B2 - 0% (2014: 0%) Class B3 - 0.39% (2014: 0.39%) Class B4 - 0.68% (2014: 0.68%) Class B5 - 0.91% (2014: 0.91%) Class B6 - 0.39% (2014: 0.39%) Class B7 - 0.91% (2014: 0.91%) Class B8 - 0.22% (2014: 0.22%)
185

SIM LOW EQUITY FUND
2015 2014
R'000 R'000
STATEMENT OF COMPREHENSIVE INCOME FOR THE YEAR ENDED 31 DECEMBER 2015
Income 89 788 71 858
Dividend revenue 6 754 6 077 Interest revenue 30 368 28 456 Other income - 1 Income adjustment due to creation and cancellation of participatory interests (1 558) 900 Net fair value gains on financial instruments 54 224 36 424
Expenses 13 581 13 388
Service fees 12 958 12 592 Audit fees 72 59 Withholding tax 199 201 Custodian, trustee and bank charges 160 244 Transaction costs 192 292
Operating profit 76 207 58 470
Finance costs 25 562 22 716
Distributions to unit holders 25 562 22 716
Change in net assets attributable to unit holders 50 645 35 754
STATEMENT OF FINANCIAL POSITION AS AT 31 DECEMBER 2015
Assets
Investments 663 053 744 942
Equities and specialist securities - Local 168 107 181 778 Equities and specialist securities - Foreign 20 158 15 897 Participatory Interest in Collective Investment Schemes - Local 7 722 13 508 Participatory Interest in Collective Investment Schemes - Foreign 150 938 146 710 Bonds - Local 86 808 74 439 Money market instruments 229 320 312 610
Accrued income and debtors 4 522 5 105
Cash and bank balances 62 005 53 692
Total assets 729 580 803 739
Liabilities 14 127 12 787
Trade and other payables 76 62 Related parties payable 1 024 1 127 Distributions payable 13 027 11 598
Net assets attributable to unit holders 715 453 790 952
Balance at the beginning of the year 790 952 623 414 Change in net assets attributable to unit holders 50 645 35 754 Creation of participatory interests 948 440 971 784 Liquidation of participatory interests (1 074 584) (840 000)
Balance at the end of the year 715 453 790 952
STATEMENT OF CHANGES IN NET ASSETS ATTRIBUTABLE TO UNIT HOLDERS FOR THE
YEAR ENDED 31 DECEMBER 2015
186
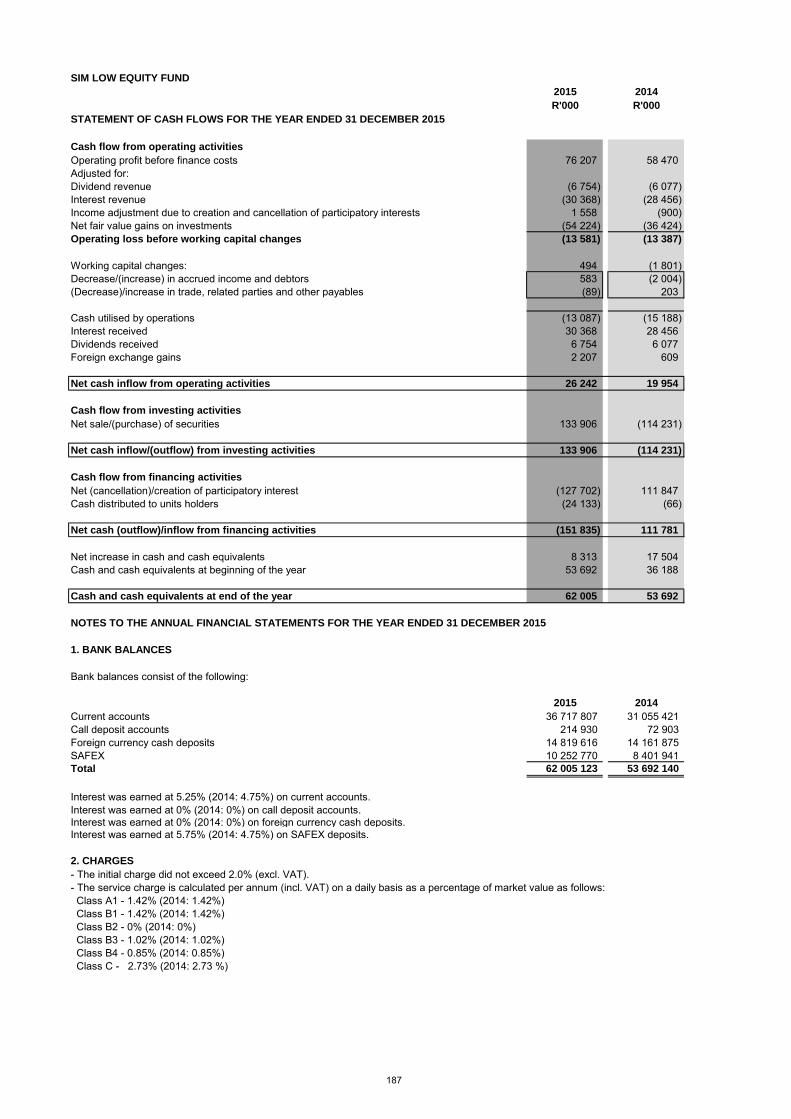
SIM LOW EQUITY FUND
2015 2014
R'000 R'000
STATEMENT OF CASH FLOWS FOR THE YEAR ENDED 31 DECEMBER 2015
Cash flow from operating activities
Operating profit before finance costs 76 207 58 470 Adjusted for:Dividend revenue (6 754) (6 077) Interest revenue (30 368) (28 456) Income adjustment due to creation and cancellation of participatory interests 1 558 (900) Net fair value gains on investments (54 224) (36 424) Operating loss before working capital changes (13 581) (13 387)
Working capital changes: 494 (1 801) Decrease/(increase) in accrued income and debtors 583 (2 004) (Decrease)/increase in trade, related parties and other payables (89) 203
Cash utilised by operations (13 087) (15 188) Interest received 30 368 28 456 Dividends received 6 754 6 077 Foreign exchange gains 2 207 609
Net cash inflow from operating activities 26 242 19 954
Cash flow from investing activities
Net sale/(purchase) of securities 133 906 (114 231)
Net cash inflow/(outflow) from investing activities 133 906 (114 231)
Cash flow from financing activities
Net (cancellation)/creation of participatory interest (127 702) 111 847 Cash distributed to units holders (24 133) (66)
Net cash (outflow)/inflow from financing activities (151 835) 111 781
Net increase in cash and cash equivalents 8 313 17 504 Cash and cash equivalents at beginning of the year 53 692 36 188
Cash and cash equivalents at end of the year 62 005 53 692
NOTES TO THE ANNUAL FINANCIAL STATEMENTS FOR THE YEAR ENDED 31 DECEMBER 2015
1. BANK BALANCES
Bank balances consist of the following:
2015 2014
Current accounts 36 717 807 31 055 421 Call deposit accounts 214 930 72 903 Foreign currency cash deposits 14 819 616 14 161 875 SAFEX 10 252 770 8 401 941 Total 62 005 123 53 692 140
Interest was earned at 5.25% (2014: 4.75%) on current accounts.Interest was earned at 0% (2014: 0%) on call deposit accounts.Interest was earned at 0% (2014: 0%) on foreign currency cash deposits.Interest was earned at 5.75% (2014: 4.75%) on SAFEX deposits.
2. CHARGES
- The initial charge did not exceed 2.0% (excl. VAT).- The service charge is calculated per annum (incl. VAT) on a daily basis as a percentage of market value as follows: Class A1 - 1.42% (2014: 1.42%) Class B1 - 1.42% (2014: 1.42%) Class B2 - 0% (2014: 0%) Class B3 - 1.02% (2014: 1.02%) Class B4 - 0.85% (2014: 0.85%) Class C - 2.73% (2014: 2.73 %)
187

SIM MANAGED AGGRESSIVE FUND OF FUNDS
2015 2014
R'000 R'000
STATEMENT OF COMPREHENSIVE INCOME FOR THE YEAR ENDED 31 DECEMBER 2015
Income 62 116 67 331
Dividend revenue 8 060 5 288 Interest revenue 11 360 8 520 Other income 3 10 Rebates earned 2 138 3 370 Income adjustment due to creation and cancellation of participatory interests 1 178 1 047 Net fair value gains on financial instruments 39 377 49 096
Expenses 5 087 4 638
Service fees 4 862 3 968 Performance fees 3 410 Audit fees 63 58 Withholding tax 95 144 Custodian, trustee and bank charges 64 58
Operating profit 57 029 62 693
Finance costs 18 511 14 044
Distributions to unit holders 18 511 14 044
Change in net assets attributable to unit holders 38 518 48 649
STATEMENT OF FINANCIAL POSITION AS AT 31 DECEMBER 2015
Assets
Investments 746 186 619 860
Participatory Interest in Collective Investment Schemes - Local 617 342 521 135 Participatory Interest in Collective Investment Schemes - Foreign 128 844 98 725
Accrued income and debtors 31 15
Cash and bank balances 35 935 12 916
Total assets 782 152 632 791
Liabilities 7 478 8 062
Trade and other payables 68 61 Related parties payable 429 345 Distributions payable 6 981 7 656
Net assets attributable to unit holders 774 674 624 729
Balance at the beginning of the year 624 729 478 429 Change in net assets attributable to unit holders 38 518 48 649 Creation of participatory interests 165 415 130 540 Liquidation of participatory interests (53 988) (32 889)
Balance at the end of the year 774 674 624 729
STATEMENT OF CHANGES IN NET ASSETS ATTRIBUTABLE TO UNIT HOLDERS FOR THE
YEAR ENDED 31 DECEMBER 2015
188

SIM MANAGED AGGRESSIVE FUND OF FUND
2015 2014
R'000 R'000
STATEMENT OF CASH FLOWS FOR THE YEAR ENDED 31 DECEMBER 2015
Cash flow from operating activities
Operating profit before finance costs 57 029 62 693 Adjusted for:Dividend revenue (8 060) (5 288) Interest revenue (11 360) (8 520) Income adjustment due to creation and cancellation of participatory interests (1 178) (1 047) Net fair value gains on investments (39 377) (49 096) Operating loss before working capital changes (2 946) (1 258)
Working capital changes: 75 (259) Increase in accrued income and debtors (16) (3) Increase/(decrease) in trade, related parties and other payables 91 (256)
Cash utilised by operations (2 871) (1 517) Interest received 11 360 8 520 Dividends received 8 060 5 288 Foreign exchange gains 554 15
Net cash inflow from operating activities 17 103 12 306
Cash flow from investing activities
Net purchase of securities (87 503) (97 976)
Net cash outflow from investing activities (87 503) (97 976)
Cash flow from financing activities
Net creation of participatory interest 112 605 87 658 Cash distributed to units holders (19 186) (25)
Net cash inflow from financing activities 93 419 87 633
Net increase in cash and cash equivalents 23 019 1 963 Cash and cash equivalents at beginning of the year 12 916 10 953
Cash and cash equivalents at end of the year 35 935 12 916
NOTES TO THE ANNUAL FINANCIAL STATEMENTS FOR THE YEAR ENDED 31 DECEMBER 2015
1. BANK BALANCES
Bank balances consist of the following:
2015 2014
Current accounts 30 020 561 12 677 433 Foreign currency cash deposits 5 913 647 238 962 Total 35 934 208 12 916 395
Interest was earned at 5.25% (2014: 4.75%) on current accounts.Interest was earned at 0% (2014: 0%) on foreign currency cash deposits.
2. CHARGES
- The initial charge did not exceed 4.25% (excl. VAT) of the selling price.- The service charge is calculated per annum (incl. VAT) on a daily basis as a percentage of market value as follows: Class A1 - 0.85% (2014: 0.85%) Class A2 - 1.02% (2014: N/A) Class B1 - 0.51% (2014: 0.51%) Class B2 - 2.39% (2014: 2.39%) Class B3 - 0.68% (2014: N/A) Class B4 - 2.39% (2014: 2.39%) Class B5 - 0.68% (2014: 0.68%) Class B6 - 0.85% (2014: N/A) Class B9 - 1.14% (2014: 1.14%)
189

SIM MANAGED CAUTIOUS FUND OF FUNDS
2015 2014
R'000 R'000
STATEMENT OF COMPREHENSIVE INCOME FOR THE YEAR ENDED 31 DECEMBER 2015
Income 101 279 141 003
Dividend revenue 5 180 3 887 Interest revenue 58 710 56 888 Other income 7 13 Rebates earned 1 355 2 294 Income adjustment due to creation and cancellation of participatory interests (27) (224) Net fair value gains on financial instruments 36 054 78 145
Expenses 16 991 13 643
Service fees 10 507 10 028 Performance fees 6 251 3 353 Audit fees 64 65 Withholding tax 59 99 Custodian, trustee and bank charges 110 98
Operating profit 84 288 127 360
Finance costs 50 503 49 702
Distributions to unit holders 50 503 49 702
Change in net assets attributable to unit holders 33 785 77 658
STATEMENT OF FINANCIAL POSITION AS AT 31 DECEMBER 2015
Assets
Investments 1 228 925 1 239 246
Participatory Interest in Collective Investment Schemes - Local 1 067 582 1 074 671 Participatory Interest in Collective Investment Schemes - Foreign 161 343 164 575
Accrued income and debtors 22 12
Cash and bank balances 54 457 12 950
Total assets 1 283 404 1 252 208
Liabilities 7 286 8 348
Trade and other payables 71 73 Related parties payable 1 172 1 358 Distributions payable 6 043 6 917
Net assets attributable to unit holders 1 276 118 1 243 860
Balance at the beginning of the year 1 243 860 1 179 687 Change in net assets attributable to unit holders 33 785 77 658 Creation of participatory interests 189 323 168 670 Liquidation of participatory interests (190 850) (182 155)
Balance at the end of the year 1 276 118 1 243 860
STATEMENT OF CHANGES IN NET ASSETS ATTRIBUTABLE TO UNIT HOLDERS FOR THE
YEAR ENDED 31 DECEMBER 2015
190
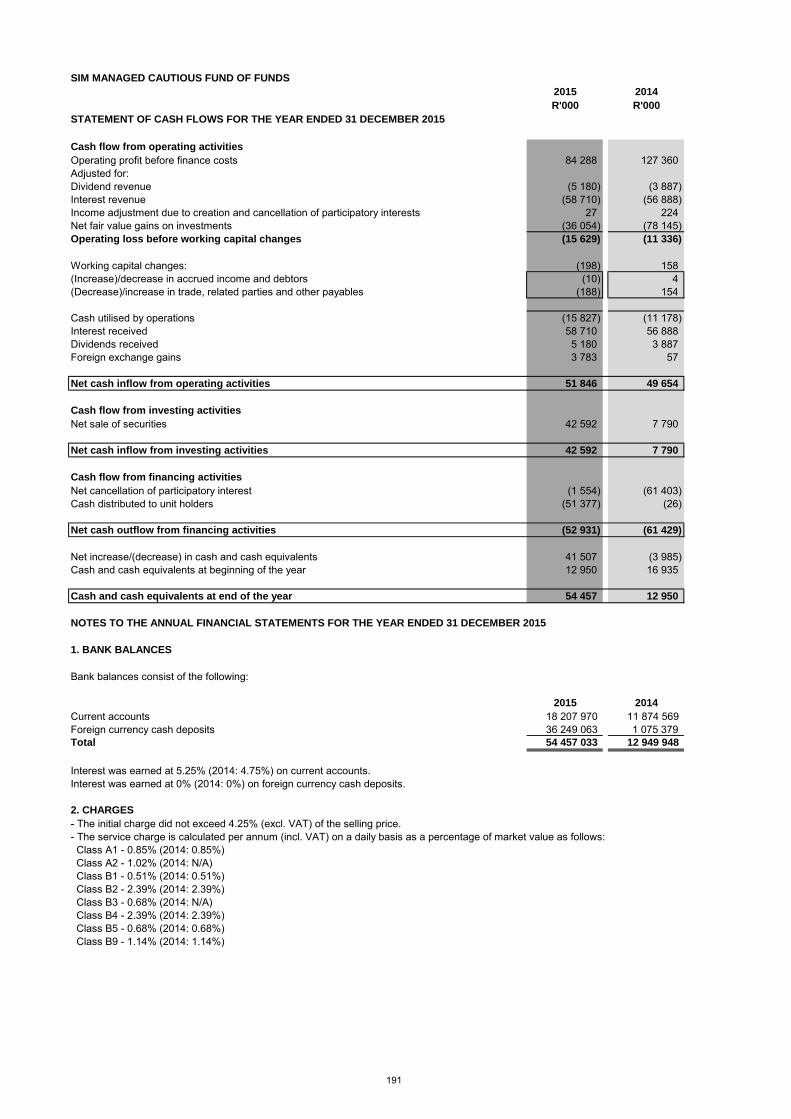
SIM MANAGED CAUTIOUS FUND OF FUNDS
2015 2014
R'000 R'000
STATEMENT OF CASH FLOWS FOR THE YEAR ENDED 31 DECEMBER 2015
Cash flow from operating activities
Operating profit before finance costs 84 288 127 360 Adjusted for:Dividend revenue (5 180) (3 887) Interest revenue (58 710) (56 888) Income adjustment due to creation and cancellation of participatory interests 27 224 Net fair value gains on investments (36 054) (78 145) Operating loss before working capital changes (15 629) (11 336)
Working capital changes: (198) 158 (Increase)/decrease in accrued income and debtors (10) 4 (Decrease)/increase in trade, related parties and other payables (188) 154
Cash utilised by operations (15 827) (11 178) Interest received 58 710 56 888 Dividends received 5 180 3 887 Foreign exchange gains 3 783 57
Net cash inflow from operating activities 51 846 49 654
Cash flow from investing activities
Net sale of securities 42 592 7 790
Net cash inflow from investing activities 42 592 7 790
Cash flow from financing activities
Net cancellation of participatory interest (1 554) (61 403) Cash distributed to unit holders (51 377) (26)
Net cash outflow from financing activities (52 931) (61 429)
Net increase/(decrease) in cash and cash equivalents 41 507 (3 985) Cash and cash equivalents at beginning of the year 12 950 16 935
Cash and cash equivalents at end of the year 54 457 12 950
NOTES TO THE ANNUAL FINANCIAL STATEMENTS FOR THE YEAR ENDED 31 DECEMBER 2015
1. BANK BALANCES
Bank balances consist of the following:
2015 2014
Current accounts 18 207 970 11 874 569 Foreign currency cash deposits 36 249 063 1 075 379 Total 54 457 033 12 949 948
Interest was earned at 5.25% (2014: 4.75%) on current accounts.Interest was earned at 0% (2014: 0%) on foreign currency cash deposits.
2. CHARGES
- The initial charge did not exceed 4.25% (excl. VAT) of the selling price.- The service charge is calculated per annum (incl. VAT) on a daily basis as a percentage of market value as follows: Class A1 - 0.85% (2014: 0.85%) Class A2 - 1.02% (2014: N/A) Class B1 - 0.51% (2014: 0.51%) Class B2 - 2.39% (2014: 2.39%) Class B3 - 0.68% (2014: N/A) Class B4 - 2.39% (2014: 2.39%) Class B5 - 0.68% (2014: 0.68%) Class B9 - 1.14% (2014: 1.14%)
191

SIM MANAGED CONSERVATIVE FUND OF FUNDS
2015 2014
R'000 R'000
STATEMENT OF COMPREHENSIVE INCOME FOR THE YEAR ENDED 31 DECEMBER 2015
Income 32 536 41 042
Dividend revenue 372 210 Interest revenue 21 654 20 968 Other income 2 3 Rebates earned 71 102 Income adjustment due to creation and cancellation of participatory interests (289) (42) Net fair value gains on financial instruments 10 726 19 801
Expenses 4 513 3 456
Service fees 2 743 2 514 Performance fees 1 681 839 Audit fees 46 65 Withholding tax 3 3 Custodian, trustee and bank charges 40 35
Operating profit 28 023 37 586
Finance costs 18 084 17 739
Distributions to unit holders 18 084 17 739
Change in net assets attributable to unit holders 9 939 19 847
STATEMENT OF FINANCIAL POSITION AS AT 31 DECEMBER 2015
Assets
Investments 355 982 373 895
Participatory Interest in Collective Investment Schemes - Local 306 648 321 767 Participatory Interest in Collective Investment Schemes - Foreign 49 334 52 128
Accrued income and debtors 11 11
Cash and bank balances 22 785 11 698
Total assets 378 778 385 604
Liabilities 3 154 3 209
Trade and other payables 48 67 Related parties payable 327 335 Distributions payable 2 779 2 807
Net assets attributable to unit holders 375 624 382 395
Balance at the beginning of the year 382 395 359 891 Change in net assets attributable to unit holders 9 939 19 847 Creation of participatory interests 65 393 64 810 Liquidation of participatory interests (82 103) (62 153)
Balance at the end of the year 375 624 382 395
STATEMENT OF CHANGES IN NET ASSETS ATTRIBUTABLE TO UNIT HOLDERS FOR THE
YEAR ENDED 31 DECEMBER 2015
192

SIM MANAGED CONSERVATIVE FUND OF FUNDS
2015 2014
R'000 R'000
STATEMENT OF CASH FLOWS FOR THE YEAR ENDED 31 DECEMBER 2015
Cash flow from operating activities
Operating profit before finance costs 28 023 37 586 Adjusted for:Dividend revenue (372) (210) Interest revenue (21 654) (20 968) Income adjustment due to creation and cancellation of participatory interests 289 42 Net fair value gains on investments (10 726) (19 801) Operating loss before working capital changes (4 440) (3 351)
Working capital changes: (27) 8 Increase in accrued income and debtors - (8) (Decrease)/increase in trade, related parties and other payables (27) 16
Cash utilised by operations (4 467) (3 343) Interest received 21 654 20 968 Dividends received 372 210 Foreign exchange gains 1 386 88
Net cash inflow from operating activities 18 945 17 923
Cash flow from investing activities
Net sale of securities 27 253 3 119
Net cash inflow from investing activities 27 253 3 119
Cash flow from financing activities
Net cancellation of participatory interest (16 999) (14 564) Cash distributed to unit holders (18 112) (12)
Net cash outflow from financing activities (35 111) (14 576)
Net increase in cash and cash equivalents 11 087 6 466 Cash and cash equivalents at beginning of the year 11 698 5 232
Cash and cash equivalents at end of the year 22 785 11 698
NOTES TO THE ANNUAL FINANCIAL STATEMENTS FOR THE YEAR ENDED 31 DECEMBER 2015
1. BANK BALANCES
Bank balances consist of the following:
2015 2014
Current accounts 9 432 948 10 353 579 Foreign currency cash deposits 13 352 152 1 344 195 Total 22 785 100 11 697 774
Interest was earned at 5.25% (2014: 4.75%) on current accounts.Interest was earned at 0% (2014: 0%) on foreign currency cash deposits.
2. CHARGES
- The initial charge did not exceed 4.25% (excl. VAT) of the selling price- The service charge is calculated per annum (incl. VAT) on a daily basis as a percentage of market value as follows: Class A1 - 0.85% (2014: 0.85%) Class A2 - 1.02% (2014: 1.25%) Class B1 - 0.51% (2014: 0.51%) Class B2 - 2.39% (2014: 2.39%) Class B3 - 0.68% (2014: 0.68%) Class B4 - 2.39% (2014: 2.4%) Class B5 - 0.68% (2014: 0.68%) Class B6 - 0.85% (2014: 0.86%) Class B9 - 1.14% (2014: 1.14%)
193
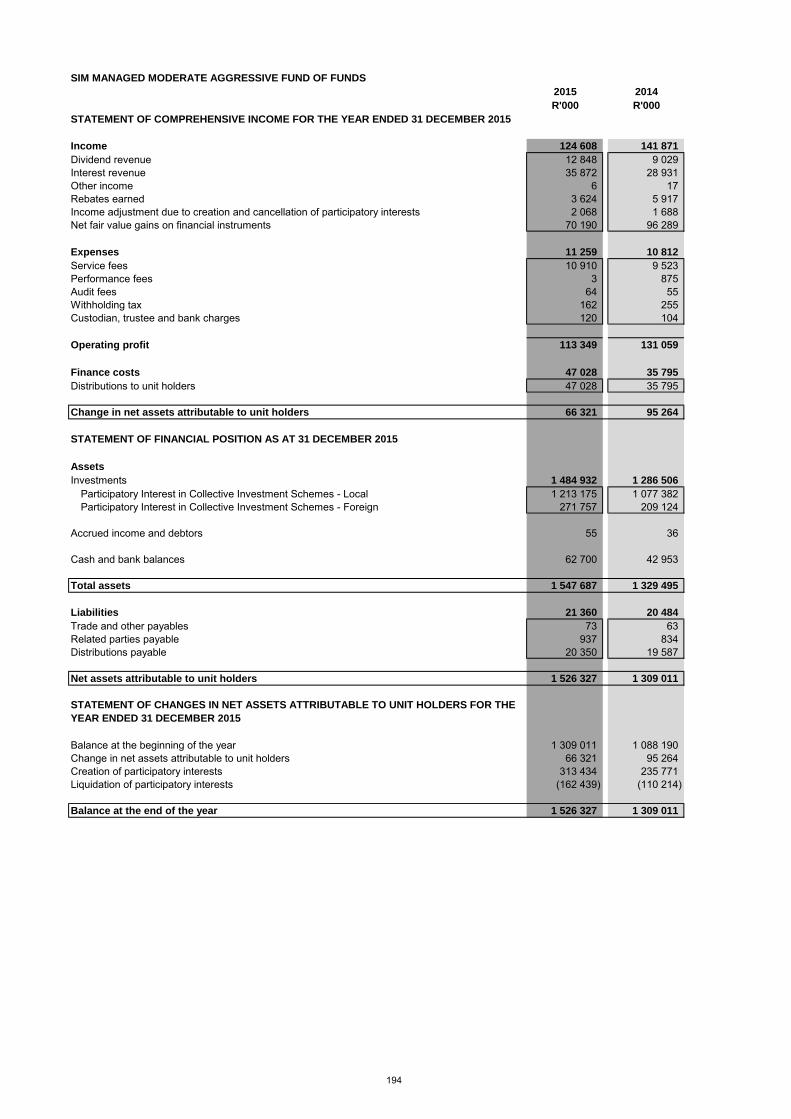
SIM MANAGED MODERATE AGGRESSIVE FUND OF FUNDS
2015 2014
R'000 R'000
STATEMENT OF COMPREHENSIVE INCOME FOR THE YEAR ENDED 31 DECEMBER 2015
Income 124 608 141 871
Dividend revenue 12 848 9 029 Interest revenue 35 872 28 931 Other income 6 17 Rebates earned 3 624 5 917 Income adjustment due to creation and cancellation of participatory interests 2 068 1 688 Net fair value gains on financial instruments 70 190 96 289
Expenses 11 259 10 812
Service fees 10 910 9 523 Performance fees 3 875 Audit fees 64 55 Withholding tax 162 255 Custodian, trustee and bank charges 120 104
Operating profit 113 349 131 059
Finance costs 47 028 35 795
Distributions to unit holders 47 028 35 795
Change in net assets attributable to unit holders 66 321 95 264
STATEMENT OF FINANCIAL POSITION AS AT 31 DECEMBER 2015
Assets
Investments 1 484 932 1 286 506
Participatory Interest in Collective Investment Schemes - Local 1 213 175 1 077 382 Participatory Interest in Collective Investment Schemes - Foreign 271 757 209 124
Accrued income and debtors 55 36
Cash and bank balances 62 700 42 953
Total assets 1 547 687 1 329 495
Liabilities 21 360 20 484
Trade and other payables 73 63 Related parties payable 937 834 Distributions payable 20 350 19 587
Net assets attributable to unit holders 1 526 327 1 309 011
Balance at the beginning of the year 1 309 011 1 088 190 Change in net assets attributable to unit holders 66 321 95 264 Creation of participatory interests 313 434 235 771 Liquidation of participatory interests (162 439) (110 214)
Balance at the end of the year 1 526 327 1 309 011
STATEMENT OF CHANGES IN NET ASSETS ATTRIBUTABLE TO UNIT HOLDERS FOR THE
YEAR ENDED 31 DECEMBER 2015
194

SIM MANAGED MODERATE AGGRESSIVE FUND OF FUNDS
2015 2014
R'000 R'000
STATEMENT OF CASH FLOWS FOR THE YEAR ENDED 31 DECEMBER 2015
Cash flow from operating activities
Operating profit before finance costs 113 349 131 059 Adjusted for:Dividend revenue (12 848) (9 029) Interest revenue (35 872) (28 931) Income adjustment due to creation and cancellation of participatory interests (2 068) (1 688) Net fair value gains on investments (70 190) (96 289) Operating loss before working capital changes (7 629) (4 878)
Working capital changes: 94 (580) (Increase)/decrease in accrued income and debtors (19) (5) Increase/(decrease) in trade, related parties and other payables 113 (575)
Cash utilised by operations (7 535) (5 458) Interest received 35 872 28 931 Dividends received 12 848 9 029 Foreign exchange gains 1 583 488
Net cash inflow from operating activities 42 768 32 990
Cash flow from investing activities
Net purchase of securities (129 819) (113 862)
Net cash outflow from investing activities (129 819) (113 862)
Cash flow from financing activities
Net creation of participatory interest 153 063 98 054 Cash distributed to units holders (46 265) (28)
Net cash inflow from financing activities 106 798 98 026
Net increase in cash and cash equivalents 19 747 17 154 Cash and cash equivalents at beginning of the year 42 953 25 799
Cash and cash equivalents at end of the year 62 700 42 953
NOTES TO THE ANNUAL FINANCIAL STATEMENTS FOR THE YEAR ENDED 31 DECEMBER 2015
1. BANK BALANCES
Bank balances consist of the following:
2015 2014
Current accounts 50 941 427 34 861 350 Foreign currency cash deposits 11 759 411 8 091 542 Total 62 700 838 42 952 892
Interest was earned at 5.25% (2014: 4.75%) on current accounts.Interest was earned at 0% (2014: 0%) on foreign currency cash deposits.
2. CHARGES
- The initial service charge did not exceed 4.25% (excl. VAT) of the selling price.- The service charge is calculated per annum (incl. VAT) on a daily basis as a percentage of market value as follows: Class A1 - 0.85% (2014: 0.85%) Class A2 - 1.02% (2014: N/A) Class B1 - 0.51% (2014: 0.51%) Class B2 - 2.39% (2014: 2.39%) Class B3 - 0.68% (2014: N/A) Class B4 - 0.85% (2014: N/A) Class B5 - 0.68% (2014: 0.68%) Class B9 - 1.14% (2014: 1.14%)
195

SIM MANAGED MODERATE FUND OF FUNDS
2015 2014
R'000 R'000
STATEMENT OF COMPREHENSIVE INCOME FOR THE YEAR ENDED 31 DECEMBER 2015
Income 313 682 406 440
Dividend revenue 29 807 21 877 Interest revenue 126 661 108 602 Other income 15 42 Rebates earned 8 407 13 094 Income adjustment due to creation and cancellation of participatory interests 2 042 4 982 Net fair value gains on financial instruments 146 750 257 843
Expenses 28 033 30 264
Service fees 27 294 24 021 Performance fees - 5 296 Audit fees 63 65 Withholding tax 362 608 Custodian, trustee and bank charges 314 274
Operating profit 285 649 376 176
Finance costs 151 960 122 717
Distributions to unit holders 151 960 122 717
Change in net assets attributable to unit holders 133 689 253 459
STATEMENT OF FINANCIAL POSITION AS AT 31 DECEMBER 2015
Assets
Investments 3 888 936 3 690 283
Participatory Interest in Collective Investment Schemes - Local 3 218 723 3 113 767 Participatory Interest in Collective Investment Schemes - Foreign 670 213 576 516
Accrued income and debtors 99 100
Cash and bank balances 193 121 133 685
Total assets 4 082 156 3 824 068
Liabilities 69 166 68 039
Trade and other payables 89 88 Related parties payable 2 284 2 143 Distributions payable 66 793 65 808
Net assets attributable to unit holders 4 012 990 3 756 029
Balance at the beginning of the year 3 756 029 3 193 650 Change in net assets attributable to unit holders 133 689 253 459 Creation of participatory interests 608 792 588 533 Liquidation of participatory interests (485 520) (279 613)
Balance at the end of the year 4 012 990 3 756 029
STATEMENT OF CHANGES IN NET ASSETS ATTRIBUTABLE TO UNIT HOLDERS FOR THE
YEAR ENDED 31 DECEMBER 2015
196

SIM MANAGED MODERATE FUND OF FUNDS
2015 2014
R'000 R'000
STATEMENT OF CASH FLOWS FOR THE YEAR ENDED 31 DECEMBER 2015
Cash flow from operating activities
Operating profit before finance costs 285 649 376 176 Adjusted for:Dividend revenue (29 807) (21 877) Interest revenue (126 661) (108 602) Income adjustment due to creation and cancellation of participatory interests (2 042) (4 982) Net fair value gains on investments (146 750) (257 843) Operating loss before working capital changes (19 611) (17 128)
Working capital changes: 143 247 Decrease/(increase) in accrued income and debtors 1 (62) Increase in trade, related parties and other payables 142 309
Cash utilised by operations (19 468) (16 881) Interest received 126 661 108 602 Dividends received 29 807 21 877 Foreign exchange gains 13 460 3 261
Net cash inflow from operating activities 150 460 116 859
Cash flow from investing activities
Net purchase of securities (65 363) (270 673)
Net cash outflow from investing activities (65 363) (270 673)
Cash flow from financing activities
Net creation of participatory interest 125 314 205 664 Cash distributed to units holders (150 975) (82)
Net cash (outflow)/inflow from financing activities (25 661) 205 582
Net increase in cash and cash equivalents 59 436 51 768 Cash and cash equivalents at beginning of the year 133 685 81 917
Cash and cash equivalents at end of the year 193 121 133 685
NOTES TO THE ANNUAL FINANCIAL STATEMENTS FOR THE YEAR ENDED 31 DECEMBER 2015
1. BANK BALANCES
Bank balances consist of the following:
2015 2014
Current accounts 91 013 243 96 180 177 Foreign currency cash deposits 102 108 195 37 505 189 Total 193 121 438 133 685 366
Interest was earned at 5.25% (2014: 4.75%) on current accounts.Interest was earned at 0% (2014: 0%) on foreign currency cash deposits.
2. CHARGES
- The initial charge did not exceed 4.25% (excl. VAT) of the selling price.- The service charge is calculated per annum (incl. VAT) on a daily basis as a percentage of market value as follows: Class A1 - 0.85% (2014: 0.85%) Class A2 - 1.02% (2014: 1.25%) Class B1 - 0.51% (2014: 0.51%) Class B2 - 2.39% (2014: 2.39%) Class B3 - 0.22% (2014: 0.22%) Class B4 - 2.39% (2014: 2.39%) Class B5 - 0.68% (2014: 0.68%) Class B6 - 0.68% (2014: 0.68%) Class B7 - 0.85% (2014: 0.85%) Class B9 - 1.14% (2014: 1.14%)
197

SIM MONEY MARKET FUND
2015 2014
R'000 R'000
STATEMENT OF COMPREHENSIVE INCOME FOR THE YEAR ENDED 31 DECEMBER 2015
Income 432 228 384 871
Interest revenue 437 431 383 160 Net fair value (losses)/gains on financial instruments (5 203) 1 711
Expenses 28 592 28 245
Service fees 27 684 27 349 Audit fees 89 75 Custodian, trustee and bank charges 777 814 Transaction costs 42 7
Operating profit 403 636 356 626
Finance costs 408 899 354 901
Distributions to unit holders 408 899 354 901
Change in net assets attributable to unit holders (5 263) 1 725
STATEMENT OF FINANCIAL POSITION AS AT 31 DECEMBER 2015
Assets
Investments 6 061 499 6 134 919
Money market instruments 6 061 499 6 134 919
Accrued income and debtors 86 564 89 925
Cash and bank balances 214 092 62 618
Total assets 6 362 155 6 287 462
Liabilities 39 296 33 351
Trade and other payables 151 135 Related parties payable 2 416 2 193 Distributions payable 36 729 31 023
Net assets attributable to unit holders 6 322 859 6 254 111
Balance at the beginning of the year 6 254 111 6 623 162 Change in net assets attributable to unit holders (5 263) 1 725 Creation of participatory interests 13 451 850 9 976 579 Liquidation of participatory interests (13 377 839) (10 347 355)
Balance at the end of the year 6 322 859 6 254 111
STATEMENT OF CHANGES IN NET ASSETS ATTRIBUTABLE TO UNIT HOLDERS FOR THE
YEAR ENDED 31 DECEMBER 2015
198
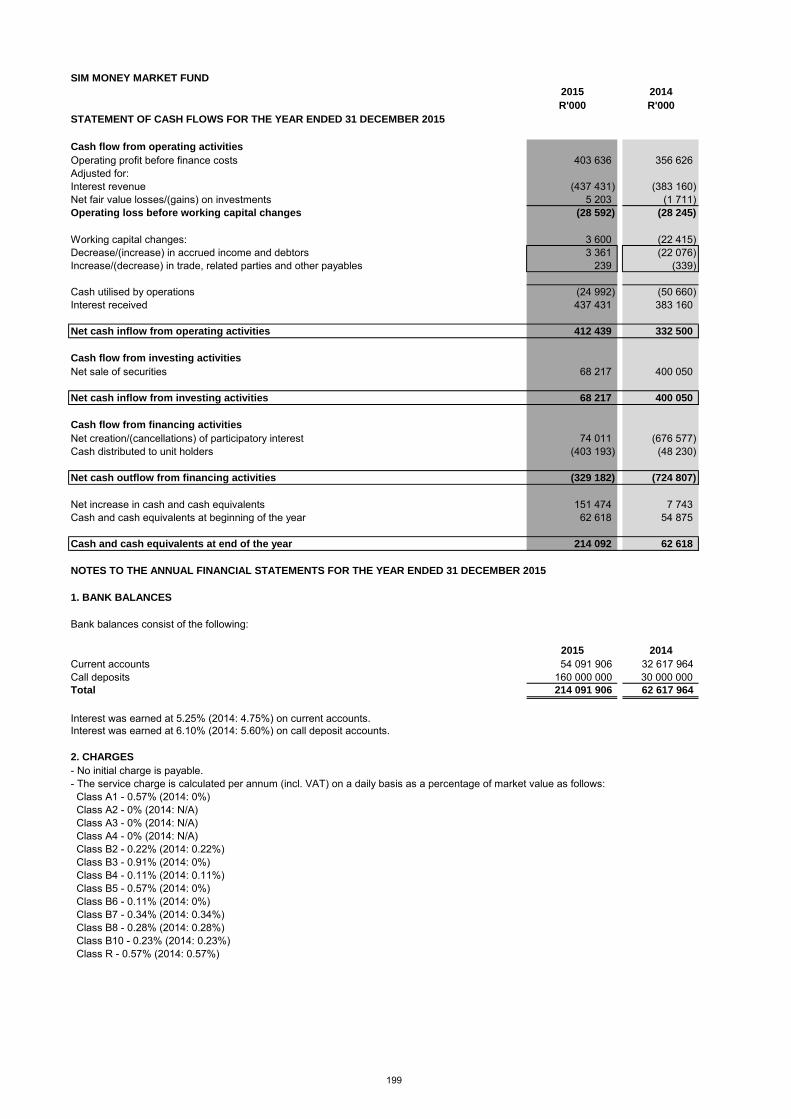
SIM MONEY MARKET FUND
2015 2014
R'000 R'000
STATEMENT OF CASH FLOWS FOR THE YEAR ENDED 31 DECEMBER 2015
Cash flow from operating activities
Operating profit before finance costs 403 636 356 626 Adjusted for:Interest revenue (437 431) (383 160) Net fair value losses/(gains) on investments 5 203 (1 711) Operating loss before working capital changes (28 592) (28 245)
Working capital changes: 3 600 (22 415) Decrease/(increase) in accrued income and debtors 3 361 (22 076) Increase/(decrease) in trade, related parties and other payables 239 (339)
Cash utilised by operations (24 992) (50 660) Interest received 437 431 383 160
Net cash inflow from operating activities 412 439 332 500
Cash flow from investing activities
Net sale of securities 68 217 400 050
Net cash inflow from investing activities 68 217 400 050
Cash flow from financing activities
Net creation/(cancellations) of participatory interest 74 011 (676 577) Cash distributed to unit holders (403 193) (48 230)
Net cash outflow from financing activities (329 182) (724 807)
Net increase in cash and cash equivalents 151 474 7 743 Cash and cash equivalents at beginning of the year 62 618 54 875
Cash and cash equivalents at end of the year 214 092 62 618
NOTES TO THE ANNUAL FINANCIAL STATEMENTS FOR THE YEAR ENDED 31 DECEMBER 2015
1. BANK BALANCES
Bank balances consist of the following:
2015 2014
Current accounts 54 091 906 32 617 964 Call deposits 160 000 000 30 000 000 Total 214 091 906 62 617 964
Interest was earned at 5.25% (2014: 4.75%) on current accounts.Interest was earned at 6.10% (2014: 5.60%) on call deposit accounts.
2. CHARGES
- No initial charge is payable.- The service charge is calculated per annum (incl. VAT) on a daily basis as a percentage of market value as follows: Class A1 - 0.57% (2014: 0%) Class A2 - 0% (2014: N/A) Class A3 - 0% (2014: N/A) Class A4 - 0% (2014: N/A) Class B2 - 0.22% (2014: 0.22%) Class B3 - 0.91% (2014: 0%) Class B4 - 0.11% (2014: 0.11%) Class B5 - 0.57% (2014: 0%) Class B6 - 0.11% (2014: 0%) Class B7 - 0.34% (2014: 0.34%) Class B8 - 0.28% (2014: 0.28%) Class B10 - 0.23% (2014: 0.23%) Class R - 0.57% (2014: 0.57%)
199

SIM PROPERTY FUND
2015 2014
R'000 R'000
STATEMENT OF COMPREHENSIVE INCOME FOR THE YEAR ENDED 31 DECEMBER 2015
Income 406 220 1 147 560
Dividend revenue 10 974 293 Interest revenue 314 876 299 689 Other income 213 136 Income adjustment due to creation and cancellation of participatory interests (456) (3 108) Net fair value gains on financial instruments 80 613 850 550
Expenses 8 897 6 917
Service fees 4 973 3 760 Audit fees 90 49 Custodian, trustee and bank charges 638 728 Transaction costs 3 196 2 380
Operating profit 397 323 1 140 643
Finance costs 319 881 292 451
Distributions to unit holders 319 881 292 451
Change in net assets attributable to unit holders 77 442 848 192
STATEMENT OF FINANCIAL POSITION AS AT 31 DECEMBER 2015
Assets
Investments 5 152 439 4 971 346
Equities and specialist securities - Local 5 152 439 4 971 346
Accrued income and debtors 42 176 984
Cash and bank balances 893 33 574
Total assets 5 195 508 5 005 904
Liabilities 64 807 64 419
Trade and other payables 1 872 3 751 Related parties payable 439 343 Distributions payable 62 496 60 325
Net assets attributable to unit holders 5 130 701 4 941 485
Balance at the beginning of the year 4 941 485 4 074 377 Change in net assets attributable to unit holders 77 442 848 192 Creation of participatory interests 1 126 488 684 413 Liquidation of participatory interests (1 014 714) (665 497)
Balance at the end of the year 5 130 701 4 941 485
STATEMENT OF CHANGES IN NET ASSETS ATTRIBUTABLE TO UNIT HOLDERS FOR THE
YEAR ENDED 31 DECEMBER 2015
200

SIM PROPERTY FUND
2015 2014
R'000 R'000
STATEMENT OF CASH FLOWS FOR THE YEAR ENDED 31 DECEMBER 2015
Cash flow from operating activities
Operating profit before finance costs 397 323 1 140 643 Adjusted for:Dividend revenue (10 974) (293) Interest revenue (314 876) (299 689) Income adjustment due to creation and cancellation of participatory interests 456 3 108 Net fair value gains on investments (80 613) (850 550) Operating loss before working capital changes (8 684) (6 781)
Working capital changes: (42 975) 2 776 Increase in accrued income and debtors (41 192) (925) (Decrease)/increase in trade, related parties and other payables (1 783) 3 701
Cash utilised by operations (51 659) (4 005) Interest received 314 876 299 689 Dividends received 10 974 293
Net cash inflow from operating activities 274 191 295 977
Cash flow from investing activities
Net purchase of securities (100 480) (34 942)
Net cash outflow from investing activities (100 480) (34 942)
Cash flow from financing activities
Net creation of participatory interest 111 318 (274 848) Cash distributed to unit holders (317 710) (198)
Net cash outflow from financing activities (206 392) (275 046)
Net decrease in cash and cash equivalents (32 681) (14 011) Cash and cash equivalents at beginning of the year 33 574 47 585
Cash and cash equivalents at end of the year 893 33 574
NOTES TO THE ANNUAL FINANCIAL STATEMENTS FOR THE YEAR ENDED 31 DECEMBER 2015
1. BANK BALANCES
Bank balances consist of the following:
2015 2014
Current accounts 892 706 33 573 794 Total 892 706 33 573 794
Interest was earned at 5.25% (2014: 4.75%) on current accounts.
2. CHARGES
- The initial charge did not exceed 5% (excl. VAT) of the selling price.- The service charge is calculated per annum (incl. VAT) on a daily basis as a percentage of market value as follows: Class A - 1.71% (2014: 1.71%) Class B1 - 0.68% (2014: 0.68%) Class B2 - 0% (2014: 0%) Class B3 - 0% (2014: 0%) Class B9 - 1.71% (2014: 1.71%)
201

SIM RESOURCES FUND
2015 2014
R'000 R'000
STATEMENT OF COMPREHENSIVE INCOME FOR THE YEAR ENDED 31 DECEMBER 2015
Income (13 134) (4 939)
Dividend revenue 2 548 1 829 Interest revenue 9 36 Other income - 6 Income adjustment due to creation and cancellation of participatory interests (59) 10 Net fair value losses on financial instruments (15 632) (6 820)
Expenses 1 272 1 674
Service fees 906 1 084 Audit fees 38 59 Withholding tax 36 34 Custodian, trustee and bank charges 52 131 Transaction costs 240 366
Operating loss (14 406) (6 613)
Finance costs 1 506 603
Distributions to unit holders 1 506 603
Change in net assets attributable to unit holders (15 912) (7 216)
STATEMENT OF FINANCIAL POSITION AS AT 31 DECEMBER 2015
Assets
Investments 35 958 56 121
Equities and specialist securities - Local 29 111 49 652 Equities and specialist securities - Foreign 6 324 6 469 Participatory Interest in Collective Investment Schemes - Foreign 523 -
Accrued income and debtors 31 111
Cash and bank balances 1 343 1 407
Total assets 37 332 57 639
Liabilities 562 452
Trade and other payables 51 59 Related parties payable 57 83 Distributions payable 454 310
Net assets attributable to unit holders 36 770 57 187
Balance at the beginning of the year 57 187 56 661 Change in net assets attributable to unit holders (15 912) (7 216) Creation of participatory interests 49 581 62 321 Liquidation of participatory interests (54 086) (54 579)
Balance at the end of the year 36 770 57 187
STATEMENT OF CHANGES IN NET ASSETS ATTRIBUTABLE TO UNIT HOLDERS FOR THE
YEAR ENDED 31 DECEMBER 2015
202

SIM RESOURCES FUND
2015 2014
R'000 R'000
STATEMENT OF CASH FLOWS FOR THE YEAR ENDED 31 DECEMBER 2015
Cash flow from operating activities
Operating loss before finance costs (14 406) (6 613) Adjusted for:Dividend revenue (2 548) (1 829) Interest revenue (9) (36) Income adjustment due to creation and cancellation of participatory interests 59 (10) Net fair value losses on investments 15 632 6 820 Operating loss before working capital changes (1 272) (1 668)
Working capital changes: 46 60 Decrease in accrued income and debtors 80 54 (Decrease)/increase in trade, related parties and other payables (34) 6
Cash utilised by operations (1 226) (1 608) Interest received 9 36 Dividends received 2 548 1 829 Foreign exchange gains 17 10
Net cash inflow from operating activities 1 348 267
Cash flow from investing activities
Net sale/(purchase) of securities 4 514 (7 006)
Net cash inflow/(outflow) from investing activities 4 514 (7 006)
Cash flow from financing activities
Net (cancellation)/creation of participatory interest (4 564) 7 355 Cash distributed to unit holders (1 362) (52)
Net cash (outflow)/inflow from financing activities (5 926) 7 303
Net (decrease)/increase in cash and cash equivalents (64) 564 Cash and cash equivalents at beginning of the year 1 407 843
Cash and cash equivalents at end of the year 1 343 1 407
NOTES TO THE ANNUAL FINANCIAL STATEMENTS FOR THE YEAR ENDED 31 DECEMBER 2015
1. BANK BALANCES
Bank balances consist of the following:
2015 2014
Current accounts 1 016 391 1 218 341 Foreign currency cash deposits 326 786 189 473 Total 1 343 177 1 407 814
Interest was earned at 5.25% (2014: 4.75%) on current accounts.Interest was earned at 0% (2014: 0%) on foreign currency cash deposits.
2. CHARGES
- No initial charge is payable.- The service charge is calculated per annum (incl. VAT) on a daily basis as a percentage of market value as follows: Class A - 1.71% (2014: 1.71%)
203

SIM SMALL CAP FUND
2015 2014
R'000 R'000
STATEMENT OF COMPREHENSIVE INCOME FOR THE YEAR ENDED 31 DECEMBER 2015
Income 44 089 57 876
Dividend revenue 9 812 6 750 Interest revenue 271 236 Other income - 37 Income adjustment due to creation and cancellation of participatory interests (48) 69 Net fair value gains on financial instruments 34 054 50 784
Expenses 5 007 4 432
Service fees 4 034 3 377 Audit fees 55 63 Withholding tax 83 68 Custodian, trustee and bank charges 87 129 Transaction costs 748 795
Operating profit 39 082 53 444
Finance costs 5 801 3 475
Distributions to unit holders 5 801 3 475
Change in net assets attributable to unit holders 33 281 49 969
STATEMENT OF FINANCIAL POSITION AS AT 31 DECEMBER 2015
Assets
Investments 388 491 335 994
Equities and specialist securities - Local 388 491 335 994
Accrued income and debtors 2 019 8
Cash and bank balances 5 575 7 614
Total assets 396 085 343 616
Liabilities 2 754 2 642 Trade and other payables 70 818 Related parties payable 351 318 Distributions payable 2 333 1 506
Net assets attributable to unit holders 393 331 340 974
Balance at the beginning of the year 340 974 271 854 Change in net assets attributable to unit holders 33 281 49 969 Creation of participatory interests 87 931 60 991 Liquidation of participatory interests (68 855) (41 840)
Balance at the end of the year 393 331 340 974
STATEMENT OF CHANGES IN NET ASSETS ATTRIBUTABLE TO UNIT HOLDERS FOR THE
YEAR ENDED 31 DECEMBER 2015
204

SIM SMALL CAP FUND
2015 2014
R'000 R'000
STATEMENT OF CASH FLOWS FOR THE YEAR ENDED 31 DECEMBER 2015
Cash flow from operating activities
Operating profit before finance costs 39 082 53 444 Adjusted for:Dividend revenue (9 812) (6 750) Interest revenue (271) (236) Income adjustment due to creation and cancellation of participatory interests 48 (69) Net fair value gains on investments (34 054) (50 784) Operating loss before working capital changes (5 007) (4 395)
Working capital changes: (2 726) 1 629 (Decrease)/increase in accrued income and debtors (2 011) 821 (Decrease)/increase in trade, related parties and other payables (715) 808
Cash utilised by operations (7 733) (2 766) Interest received 271 236 Dividends received 9 812 6 750 Foreign exchange gains 90 26
Net cash inflow from operating activities 2 440 4 246
Cash flow from investing activities
Net purchase of securities (18 533) (13 153)
Net cash outflow from investing activities (18 533) (13 153)
Cash flow from financing activities
Net creation of participatory interest 19 028 14 304 Cash distributed to unit holders (4 974) (308)
Net cash inflow from financing activities 14 054 13 996
Net (decrease)/increase in cash and cash equivalents (2 039) 5 089 Cash and cash equivalents at beginning of the year 7 614 2 525
Cash and cash equivalents at end of the year 5 575 7 614
NOTES TO THE ANNUAL FINANCIAL STATEMENTS FOR THE YEAR ENDED 31 DECEMBER 2015
1. BANK BALANCES
Bank balances consist of the following:
2015 2014
Current accounts 5 091 903 7 622 650 Foreign currency cash deposits 483 491 (8 779) Total 5 575 394 7 613 871
Interest was earned at 5.25% (2014: 4.75%) on current accounts.Interest was earned at 0% (2014: 0%) on foreign currency cash deposits.
2. CHARGES
- The initial charge did not exceed 5% (excl. VAT) of the selling price.- The service charge is calculated per annum (incl. VAT) on a daily basis as a percentage of market value as follows: Class A - 1.71% (2014: 1.71%) Class B1 - 2.39% (2014: 2.39%) Class B2 - 1.02% (2014: 1.02%) Class B3 - 0.68% (2014: 0.68%) Class B9 -1.71% (2014: 1.71% ) Class R - 1.14% (2014: 1.14%)
205

SIM TOP CHOICE EQUITY FUND
2015 2014
R'000 R'000
STATEMENT OF COMPREHENSIVE INCOME FOR THE YEAR ENDED 31 DECEMBER 2015
Income 69 620 90 211
Dividend revenue 29 037 20 938 Interest revenue 5 166 2 684 Other income - 57 Income adjustment due to creation and cancellation of participatory interests 494 943 Net fair value gains on financial instruments 34 923 65 589
Expenses 5 890 7 365
Service fees 3 338 2 642 Performance fees 195 2 193 Audit fees 64 58 Withholding tax (12) - Custodian, trustee and bank charges 119 130 Transaction costs 2 186 2 342
Operating profit 63 730 82 846
Finance costs 30 996 19 624
Distributions to unit holders 30 996 19 624
Change in net assets attributable to unit holders 32 734 63 222
STATEMENT OF FINANCIAL POSITION AS AT 31 DECEMBER 2015
Assets
Investments 988 393 831 381
Equities and specialist securities - Local 988 393 831 381
Accrued income and debtors 36 466
Cash and bank balances 19 371 39 933
Total assets 1 007 800 871 780
Liabilities 15 445 11 389
Trade and other payables 69 64 Related parties payable 388 259 Distributions payable 14 988 11 066
Net assets attributable to unit holders 992 355 860 391
Balance at the beginning of the year 860 391 594 075 Change in net assets attributable to unit holders 32 734 63 222 Creation of participatory interests 187 236 300 437 Liquidation of participatory interests (88 006) (97 343)
Balance at the end of the year 992 355 860 391
STATEMENT OF CHANGES IN NET ASSETS ATTRIBUTABLE TO UNIT HOLDERS FOR THE
YEAR ENDED 31 DECEMBER 2015
206
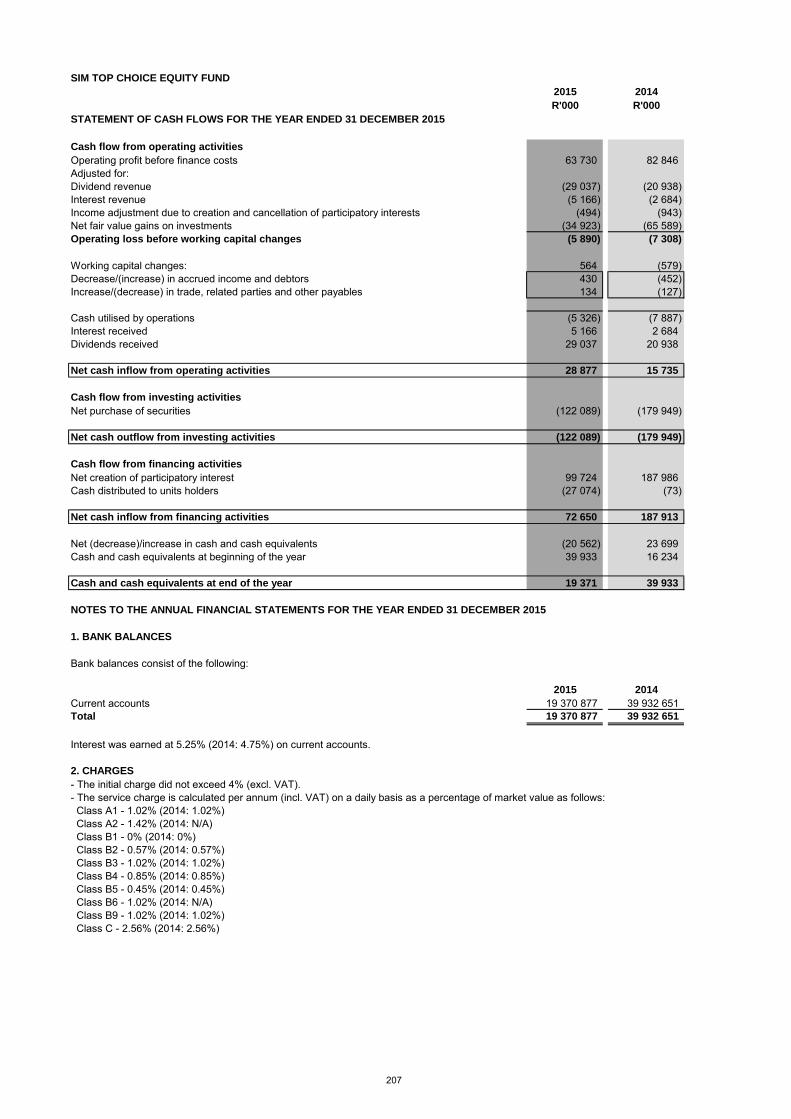
SIM TOP CHOICE EQUITY FUND
2015 2014
R'000 R'000
STATEMENT OF CASH FLOWS FOR THE YEAR ENDED 31 DECEMBER 2015
Cash flow from operating activities
Operating profit before finance costs 63 730 82 846 Adjusted for:Dividend revenue (29 037) (20 938) Interest revenue (5 166) (2 684) Income adjustment due to creation and cancellation of participatory interests (494) (943) Net fair value gains on investments (34 923) (65 589) Operating loss before working capital changes (5 890) (7 308)
Working capital changes: 564 (579) Decrease/(increase) in accrued income and debtors 430 (452) Increase/(decrease) in trade, related parties and other payables 134 (127)
Cash utilised by operations (5 326) (7 887) Interest received 5 166 2 684 Dividends received 29 037 20 938
Net cash inflow from operating activities 28 877 15 735
Cash flow from investing activities
Net purchase of securities (122 089) (179 949)
Net cash outflow from investing activities (122 089) (179 949)
Cash flow from financing activities
Net creation of participatory interest 99 724 187 986 Cash distributed to units holders (27 074) (73)
Net cash inflow from financing activities 72 650 187 913
Net (decrease)/increase in cash and cash equivalents (20 562) 23 699 Cash and cash equivalents at beginning of the year 39 933 16 234
Cash and cash equivalents at end of the year 19 371 39 933
NOTES TO THE ANNUAL FINANCIAL STATEMENTS FOR THE YEAR ENDED 31 DECEMBER 2015
1. BANK BALANCES
Bank balances consist of the following:
2015 2014
Current accounts 19 370 877 39 932 651 Total 19 370 877 39 932 651
Interest was earned at 5.25% (2014: 4.75%) on current accounts.
2. CHARGES
- The initial charge did not exceed 4% (excl. VAT).- The service charge is calculated per annum (incl. VAT) on a daily basis as a percentage of market value as follows: Class A1 - 1.02% (2014: 1.02%) Class A2 - 1.42% (2014: N/A) Class B1 - 0% (2014: 0%) Class B2 - 0.57% (2014: 0.57%) Class B3 - 1.02% (2014: 1.02%) Class B4 - 0.85% (2014: 0.85%) Class B5 - 0.45% (2014: 0.45%) Class B6 - 1.02% (2014: N/A) Class B9 - 1.02% (2014: 1.02%) Class C - 2.56% (2014: 2.56%)
207

SIM VALUE FUND
2015 2014
R'000 R'000
STATEMENT OF COMPREHENSIVE INCOME FOR THE YEAR ENDED 31 DECEMBER 2015
Income (141 167) 402 590
Dividend revenue 130 830 115 795 Interest revenue 4 049 7 183 Other income - 70 Income adjustment due to creation and cancellation of participatory interests (5 909) 2 853 Net fair value (losses)/gains on financial instruments (270 137) 276 689
Expenses 56 621 60 523
Service fees 43 863 48 147 Performance fees 878 1 803 Audit fees 98 75 Withholding tax 1 987 1 952 Custodian, trustee and bank charges 421 472 Transaction costs 9 374 8 074
Operating (loss)/profit (197 788) 342 067
Finance costs 95 264 82 774
Distributions to unit holders 95 264 82 774
Change in net assets attributable to unit holders (293 052) 259 293
STATEMENT OF FINANCIAL POSITION AS AT 31 DECEMBER 2015
Assets
Investments 2 862 833 3 621 172
Equities and specialist securities - Local 2 020 101 2 826 498 Equities and specialist securities - Foreign 698 950 684 103 Participatory Interest in Collective Investment Schemes - Foreign 143 782 110 571
Accrued income and debtors 1 710 2 722
Cash and bank balances 119 980 325 384
Total assets 2 984 523 3 949 278
Liabilities 48 736 47 712
Trade and other payables 3 054 481 Related parties payable 2 941 3 943 Distributions payable 42 741 43 288
Net assets attributable to unit holders 2 935 787 3 901 566
Balance at the beginning of the year 3 901 566 3 344 279 Change in net assets attributable to unit holders (293 052) 259 293 Creation of participatory interests 645 525 954 896 Liquidation of participatory interests (1 318 252) (656 902)
Balance at the end of the year 2 935 787 3 901 566
STATEMENT OF CHANGES IN NET ASSETS ATTRIBUTABLE TO UNIT HOLDERS FOR THE
YEAR ENDED 31 DECEMBER 2015
208
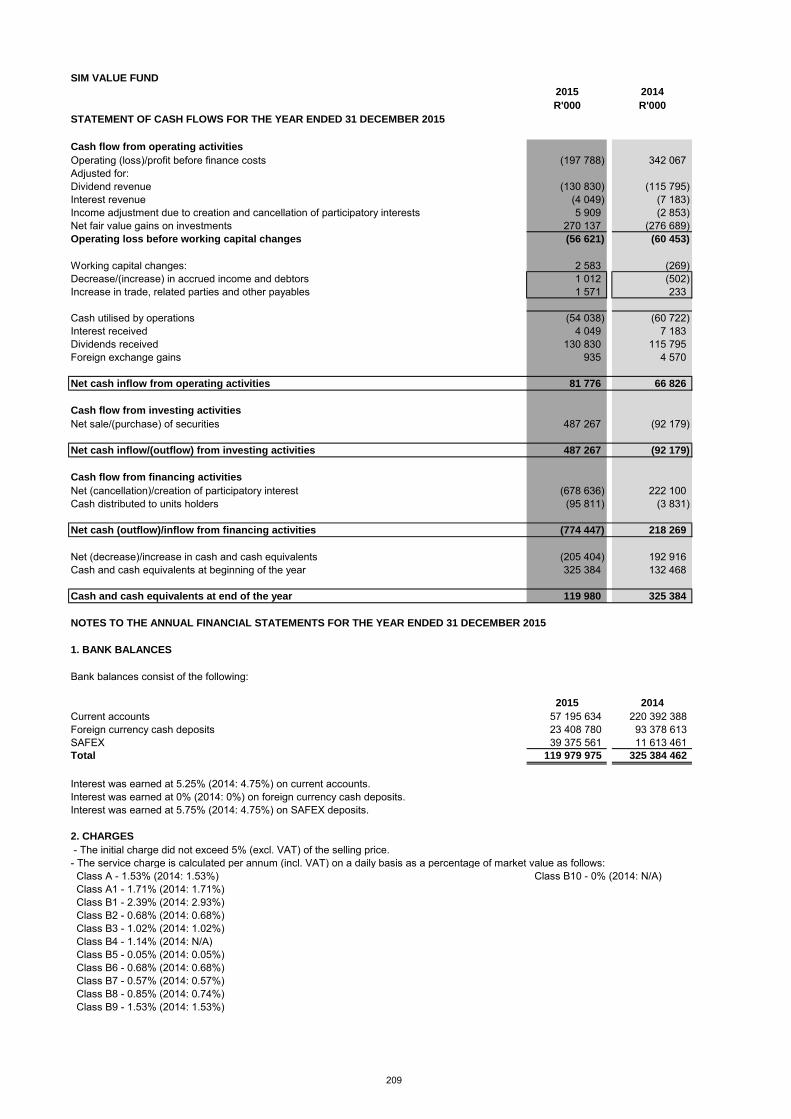
SIM VALUE FUND
2015 2014
R'000 R'000
STATEMENT OF CASH FLOWS FOR THE YEAR ENDED 31 DECEMBER 2015
Cash flow from operating activities
Operating (loss)/profit before finance costs (197 788) 342 067 Adjusted for:Dividend revenue (130 830) (115 795) Interest revenue (4 049) (7 183) Income adjustment due to creation and cancellation of participatory interests 5 909 (2 853) Net fair value gains on investments 270 137 (276 689) Operating loss before working capital changes (56 621) (60 453)
Working capital changes: 2 583 (269) Decrease/(increase) in accrued income and debtors 1 012 (502) Increase in trade, related parties and other payables 1 571 233
Cash utilised by operations (54 038) (60 722) Interest received 4 049 7 183 Dividends received 130 830 115 795 Foreign exchange gains 935 4 570
Net cash inflow from operating activities 81 776 66 826
Cash flow from investing activities
Net sale/(purchase) of securities 487 267 (92 179)
Net cash inflow/(outflow) from investing activities 487 267 (92 179)
Cash flow from financing activities
Net (cancellation)/creation of participatory interest (678 636) 222 100 Cash distributed to units holders (95 811) (3 831)
Net cash (outflow)/inflow from financing activities (774 447) 218 269
Net (decrease)/increase in cash and cash equivalents (205 404) 192 916 Cash and cash equivalents at beginning of the year 325 384 132 468
Cash and cash equivalents at end of the year 119 980 325 384
NOTES TO THE ANNUAL FINANCIAL STATEMENTS FOR THE YEAR ENDED 31 DECEMBER 2015
1. BANK BALANCES
Bank balances consist of the following:
2015 2014
Current accounts 57 195 634 220 392 388 Foreign currency cash deposits 23 408 780 93 378 613 SAFEX 39 375 561 11 613 461 Total 119 979 975 325 384 462
Interest was earned at 5.25% (2014: 4.75%) on current accounts.Interest was earned at 0% (2014: 0%) on foreign currency cash deposits.Interest was earned at 5.75% (2014: 4.75%) on SAFEX deposits.
2. CHARGES
- The initial charge did not exceed 5% (excl. VAT) of the selling price.- The service charge is calculated per annum (incl. VAT) on a daily basis as a percentage of market value as follows: Class A - 1.53% (2014: 1.53%) Class B10 - 0% (2014: N/A) Class A1 - 1.71% (2014: 1.71%) Class B1 - 2.39% (2014: 2.93%) Class B2 - 0.68% (2014: 0.68%) Class B3 - 1.02% (2014: 1.02%) Class B4 - 1.14% (2014: N/A) Class B5 - 0.05% (2014: 0.05%) Class B6 - 0.68% (2014: 0.68%) Class B7 - 0.57% (2014: 0.57%) Class B8 - 0.85% (2014: 0.74%) Class B9 - 1.53% (2014: 1.53%)
209
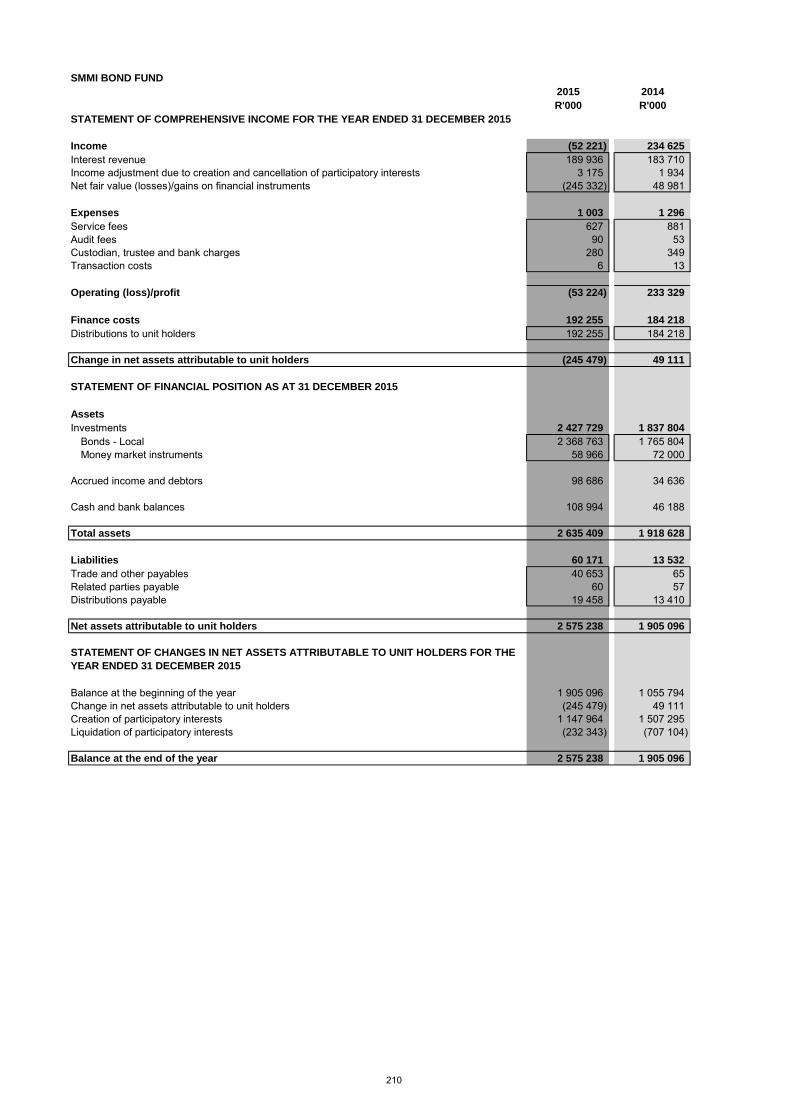
SMMI BOND FUND
2015 2014
R'000 R'000
STATEMENT OF COMPREHENSIVE INCOME FOR THE YEAR ENDED 31 DECEMBER 2015
Income (52 221) 234 625
Interest revenue 189 936 183 710 Income adjustment due to creation and cancellation of participatory interests 3 175 1 934 Net fair value (losses)/gains on financial instruments (245 332) 48 981
Expenses 1 003 1 296
Service fees 627 881 Audit fees 90 53 Custodian, trustee and bank charges 280 349 Transaction costs 6 13
Operating (loss)/profit (53 224) 233 329
Finance costs 192 255 184 218
Distributions to unit holders 192 255 184 218
Change in net assets attributable to unit holders (245 479) 49 111
STATEMENT OF FINANCIAL POSITION AS AT 31 DECEMBER 2015
Assets
Investments 2 427 729 1 837 804
Bonds - Local 2 368 763 1 765 804 Money market instruments 58 966 72 000
Accrued income and debtors 98 686 34 636
Cash and bank balances 108 994 46 188
Total assets 2 635 409 1 918 628
Liabilities 60 171 13 532
Trade and other payables 40 653 65 Related parties payable 60 57 Distributions payable 19 458 13 410
Net assets attributable to unit holders 2 575 238 1 905 096
Balance at the beginning of the year 1 905 096 1 055 794 Change in net assets attributable to unit holders (245 479) 49 111 Creation of participatory interests 1 147 964 1 507 295 Liquidation of participatory interests (232 343) (707 104)
Balance at the end of the year 2 575 238 1 905 096
STATEMENT OF CHANGES IN NET ASSETS ATTRIBUTABLE TO UNIT HOLDERS FOR THE
YEAR ENDED 31 DECEMBER 2015
210

SMMI BOND FUND
2015 2014
R'000 R'000
STATEMENT OF CASH FLOWS FOR THE YEAR ENDED 31 DECEMBER 2015
Cash flow from operating activities
Operating (loss)/profit before finance costs (53 224) 233 329 Adjusted for:Interest revenue (189 936) (183 710) Income adjustment due to creation and cancellation of participatory interests (3 175) (1 934) Net fair value losses/(gains) on investments 245 332 (48 981) Operating loss before working capital changes (1 003) (1 296)
Working capital changes: (23 459) (16 107) Increase in accrued income and debtors (64 050) (15 971) Increase/(decrease) in trade, related parties and other payables 40 591 (136)
Cash utilised by operations (24 462) (17 403) Interest received 189 936 183 710
Net cash inflow from operating activities 165 474 166 307
Cash flow from investing activities
Net purchase of securities (835 257) (786 989)
Net cash outflow from investing activities (835 257) (786 989)
Cash flow from financing activities
Net creation of participatory interest 918 796 624 313 Cash distributed to unit holders (186 207) (1)
Net cash inflow from financing activities 732 589 624 312
Net increase in cash and cash equivalents 62 806 3 630 Cash and cash equivalents at beginning of the year 46 188 42 558
Cash and cash equivalents at end of the year 108 994 46 188
NOTES TO THE ANNUAL FINANCIAL STATEMENTS FOR THE YEAR ENDED 31 DECEMBER 2015
1. BANK BALANCES
Bank balances consist of the following:
2015 2014
Current accounts 59 396 597 31 177 393 Call deposits 39 117 686 15 000 000 SAFEX 10 479 700 10 744 Total 108 993 983 46 188 137
Interest was earned at 5.25% (2014: 4.75%) on current accounts.Interest was earned between 4% - 6% (2014: 4% - 6%) on call deposit accounts.Interest was earned at 5.75% (2014: 4.8%) on SAFEX deposits.
2. CHARGES
- No initial charge is payable.- The service charge is calculated per annum (incl. VAT) on a daily basis as a percentage of market value as follows: Class B1 - 0.57% (2014: 0.57%) Class B2 - 0% (2014: 0%) Class B3 - 0.39% (2014: 0.40%) Class B4 - 0.57% (2014: N/A) Class B4 - 0.28% (2014: N/A) Class B6 - 0.45% (2014: N/A) Class B8 - 0.68% (2014: N/A)
211

SPI EQUITY FUND
2015 2014
R'000 R'000
STATEMENT OF COMPREHENSIVE INCOME FOR THE YEAR ENDED 31 DECEMBER 2015
Income 11 888 5 543
Dividend revenue 3 496 1 669 Interest revenue 327 324 Other income (37) - Income adjustment due to creation and cancellation of participatory interests 106 142 Net fair value gains on financial instruments 7 996 3 408
Expenses 1 627 1 208
Service fees 1 326 943 Audit fees 55 58 Withholding tax 55 33 Custodian, trustee and bank charges 27 30 Transaction costs 164 144
Operating profit 10 261 4 335
Finance costs 2 428 1 070
Distributions to unit holders 2 428 1 070
Change in net assets attributable to unit holders 7 833 3 265
STATEMENT OF FINANCIAL POSITION AS AT 31 DECEMBER 2015
Assets
Investments 94 890 72 563
Equities and specialist securities - Local 94 890 72 563
Accrued income and debtors 12 10
Cash and bank balances 9 973 9 158
Total assets 104 875 81 731
Liabilities 1 164 863
Trade and other payables 57 59 Related parties payable 119 96 Distributions payable 988 708
Net assets attributable to unit holders 103 711 80 868
Balance at the beginning of the year 80 868 49 733 Change in net assets attributable to unit holders 7 833 3 265 Creation of participatory interests 27 784 35 607 Liquidation of participatory interests (12 774) (7 737)
Balance at the end of the year 103 711 80 868
STATEMENT OF CHANGES IN NET ASSETS ATTRIBUTABLE TO UNIT HOLDERS FOR THE
YEAR ENDED 31 DECEMBER 2015
212

SPI EQUITY FUND
2015 2014
R'000 R'000
STATEMENT OF CASH FLOWS FOR THE YEAR ENDED 31 DECEMBER 2015
Cash flow from operating activities
Operating profit before finance costs 10 261 4 335 Adjusted for:Dividend revenue (3 496) (1 669) Interest revenue (327) (324) Income adjustment due to creation and cancellation of participatory interests (106) (142) Net fair value gains on investments (7 996) (3 408) Operating loss before working capital changes (1 664) (1 208)
Working capital changes: 19 39 Increase in accrued income and debtors (2) (7) Increase in trade, related parties and other payables 21 46
Cash utilised by operations (1 645) (1 169) Interest received 327 324 Dividends received 3 496 1 669
Net cash inflow from operating activities 2 178 824
Cash flow from investing activities
Net purchase of securities (14 331) (22 278)
Net outflow from investing activities (14 331) (22 278)
Cash flow from financing activities
Net creation of participatory interest 15 116 27 372 Cash distributed by unit holders (2 148) (65)
Net cash inflow from financing activities 12 968 27 307
Net increase in cash and cash equivalents 815 5 853 Cash and cash equivalents at beginning of the year 9 158 3 305
Cash and cash equivalents at end of the year 9 973 9 158
NOTES TO THE ANNUAL FINANCIAL STATEMENTS FOR THE YEAR ENDED 31 DECEMBER 2015
1. BANK BALANCES
Bank balances consist of the following:
2015 2014
Current accounts 9 972 589 9 157 544 Total 9 972 589 9 157 544
Interest was earned at 5.25% (2014: 4.75%) on current accounts.
2. CHARGES
- No initial charge is payable.- The service charge is calculated per annum (incl. VAT) on a daily basis as a percentage of market value as follows: Class A1 - 1.71% (2014: 1.71%) Class B1 - 1.14% (2014: 1.14%) Class B2 - 0.85% (2014: 0.85%)
213

TRESOR SCI BALANCED FUND [12 months]2015
R'000
STATEMENT OF COMPREHENSIVE INCOME FOR THE YEAR ENDED 31 DECEMBER 2015
Income 22 733
Dividend revenue 2 199 Interest revenue 2 364 Other income (4) Income adjustment due to creation and cancellation of participatory interests 700 Net fair value gains on financial instruments 17 474
Expenses 2 806
Service fees 2 259 Audit fees 55 Withholding tax 87 Custodian, trustee and bank charges 60 Transaction costs 345
Operating profit 19 927
Finance costs 2 781
Distributions to unit holders 2 781
Change in net assets attributable to unit holders 17 146
STATEMENT OF FINANCIAL POSITION AS AT 31 DECEMBER 2015
Assets
Investments 340 484
Equities and specialist securities - Local 74 699 Participatory Interest in Collective Investment Schemes - Local 265 785
Accrued income and debtors 12
Cash and bank balances 10 144
Total assets 350 640
Liabilities 3 115
Trade and other payables 58 Related parties payable 332 Distributions payable 2 725
Net assets attributable to unit holders 347 525
Balance at the beginning of the year - Change in net assets attributable to unit holders 17 146 Creation of participatory interests 342 714 Liquidation of participatory interests (12 335)
Balance at the end of the year 347 525
Comparatives not stated, since the Tresor SCI Balanced Fund was established on 15 January 2015.
STATEMENT OF CHANGES IN NET ASSETS ATTRIBUTABLE TO UNIT HOLDERS FOR THE
YEAR ENDED 31 DECEMBER 2015
214

TRESOR SCI BALANCED FUND [12 months]2015
R'000
STATEMENT OF CASH FLOWS FOR THE YEAR ENDED 31 DECEMBER 2015
Cash flow from operating activities
Operating profit before finance costs 19 927 Adjusted for:Dividend revenue (2 199) Interest revenue (2 364) Income adjustment due to creation and cancellation of participatory interests (700) Net fair value gains on investments (17 474) Operating loss before working capital changes (2 810)
Working capital changes: 378 Increase in accrued income and debtors (12) Increase in trade, related parties and other payables 390
Cash utilised by operations (2 432) Interest received 2 364 Dividends received 2 199
Net cash inflow from operating activities 2 131
Cash flow from investing activities
Net purchase of securities (323 010)
Net cash outflow from investing activities (323 010)
Cash flow from financing activities
Net creation of participatory interest 331 079 Cash distributed to unit holders (56)
Net cash inflow from financing activities 331 023
Net increase in cash and cash equivalents 10 144 Cash and cash equivalents at beginning of the year -
Cash and cash equivalents at end of the year 10 144
NOTES TO THE ANNUAL FINANCIAL STATEMENTS FOR THE YEAR ENDED 31 DECEMBER 2015
1. BANK BALANCES
Bank balances consist of the following:
2015
Current accounts 10 144 151 Total 10 144 151
Interest was earned at 5.25% (2014: N/A) on current accounts.
2. CHARGES
- No initial charge is payable.- The service charge is calculated per annum (incl. VAT) on a daily basis as a percentage of market value as follows: Class B1 - 1.14% (2014: N/A) Class B2 - 0.74% (2014: N/A)
215
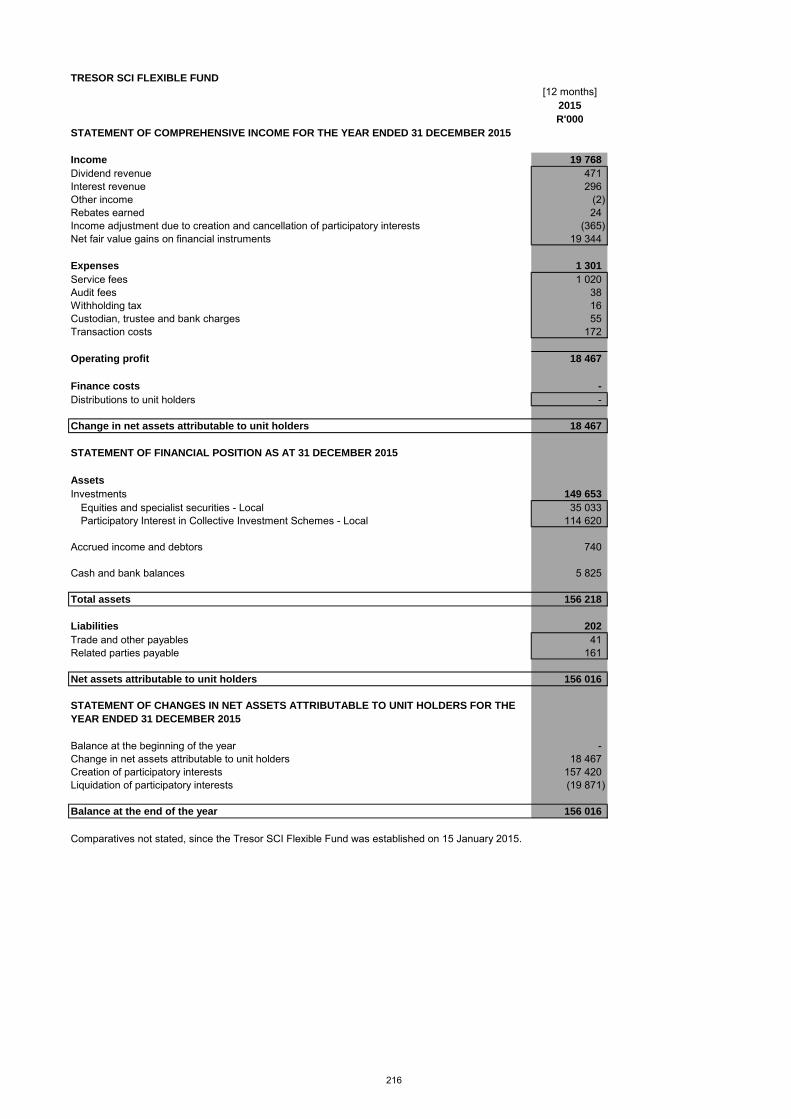
TRESOR SCI FLEXIBLE FUND
[12 months]2015
R'000
STATEMENT OF COMPREHENSIVE INCOME FOR THE YEAR ENDED 31 DECEMBER 2015
Income 19 768
Dividend revenue 471 Interest revenue 296 Other income (2) Rebates earned 24 Income adjustment due to creation and cancellation of participatory interests (365) Net fair value gains on financial instruments 19 344
Expenses 1 301
Service fees 1 020 Audit fees 38 Withholding tax 16 Custodian, trustee and bank charges 55 Transaction costs 172
Operating profit 18 467
Finance costs -
Distributions to unit holders -
Change in net assets attributable to unit holders 18 467
STATEMENT OF FINANCIAL POSITION AS AT 31 DECEMBER 2015
Assets
Investments 149 653
Equities and specialist securities - Local 35 033 Participatory Interest in Collective Investment Schemes - Local 114 620
Accrued income and debtors 740
Cash and bank balances 5 825
Total assets 156 218
Liabilities 202
Trade and other payables 41 Related parties payable 161
Net assets attributable to unit holders 156 016
Balance at the beginning of the year - Change in net assets attributable to unit holders 18 467 Creation of participatory interests 157 420 Liquidation of participatory interests (19 871)
Balance at the end of the year 156 016
Comparatives not stated, since the Tresor SCI Flexible Fund was established on 15 January 2015.
STATEMENT OF CHANGES IN NET ASSETS ATTRIBUTABLE TO UNIT HOLDERS FOR THE
YEAR ENDED 31 DECEMBER 2015
216

TRESOR SCI FLEXIBLE FUND
[12 months]2015
R'000
STATEMENT OF CASH FLOWS FOR THE YEAR ENDED 31 DECEMBER 2015
Cash flow from operating activities
Operating profit before finance costs 18 467 Adjusted for:Dividend revenue (471) Interest revenue (296) Income adjustment due to creation and cancellation of participatory interests 365 Net fair value gains on investments (19 344) Operating loss before working capital changes (1 279)
Working capital changes: (538) Increase in accrued income and debtors (740) Increase in trade, related parties and other payables 202
Cash utilised by operations (1 817) Interest received 296 Dividends received 471
Net cash outflow from operating activities (1 050)
Cash flow from investing activities
Net purchase of securities (130 309)
Net cash outflow from investing activities (130 309)
Cash flow from financing activities
Net creation of participatory interest 137 184
Net cash inflow from financing activities 137 184
Net increase in cash and cash equivalents 5 825 Cash and cash equivalents at beginning of the year -
Cash and cash equivalents at end of the year 5 825
NOTES TO THE ANNUAL FINANCIAL STATEMENTS FOR THE YEAR ENDED 31 DECEMBER 2015
1. BANK BALANCES
Bank balances consist of the following:
2015
Current accounts 5 824 722 Total 5 824 722
Interest was earned at 5.25% (2014: N/A) on current accounts.
2. CHARGES
- No initial charge is payable.- The service charge is calculated per annum (incl. VAT) on a daily basis as a percentage of market value as follows: Class B1 - 1.42% (2014: N/A) Class B2 - 1.02% (2014: N/A)
217
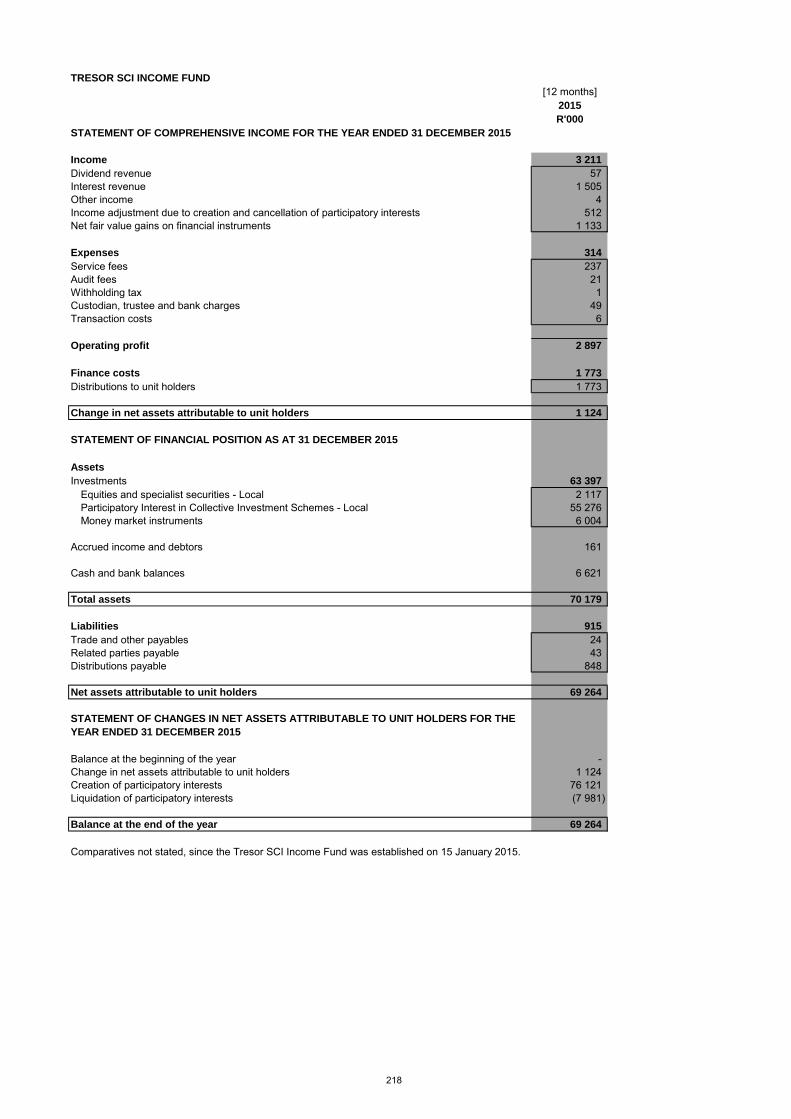
TRESOR SCI INCOME FUND
[12 months]2015
R'000
STATEMENT OF COMPREHENSIVE INCOME FOR THE YEAR ENDED 31 DECEMBER 2015
Income 3 211
Dividend revenue 57 Interest revenue 1 505 Other income 4 Income adjustment due to creation and cancellation of participatory interests 512 Net fair value gains on financial instruments 1 133
Expenses 314
Service fees 237 Audit fees 21 Withholding tax 1 Custodian, trustee and bank charges 49 Transaction costs 6
Operating profit 2 897
Finance costs 1 773
Distributions to unit holders 1 773
Change in net assets attributable to unit holders 1 124
STATEMENT OF FINANCIAL POSITION AS AT 31 DECEMBER 2015
Assets
Investments 63 397
Equities and specialist securities - Local 2 117 Participatory Interest in Collective Investment Schemes - Local 55 276 Money market instruments 6 004
Accrued income and debtors 161
Cash and bank balances 6 621
Total assets 70 179
Liabilities 915
Trade and other payables 24 Related parties payable 43 Distributions payable 848
Net assets attributable to unit holders 69 264
Balance at the beginning of the year - Change in net assets attributable to unit holders 1 124 Creation of participatory interests 76 121 Liquidation of participatory interests (7 981)
Balance at the end of the year 69 264
Comparatives not stated, since the Tresor SCI Income Fund was established on 15 January 2015.
STATEMENT OF CHANGES IN NET ASSETS ATTRIBUTABLE TO UNIT HOLDERS FOR THE
YEAR ENDED 31 DECEMBER 2015
218
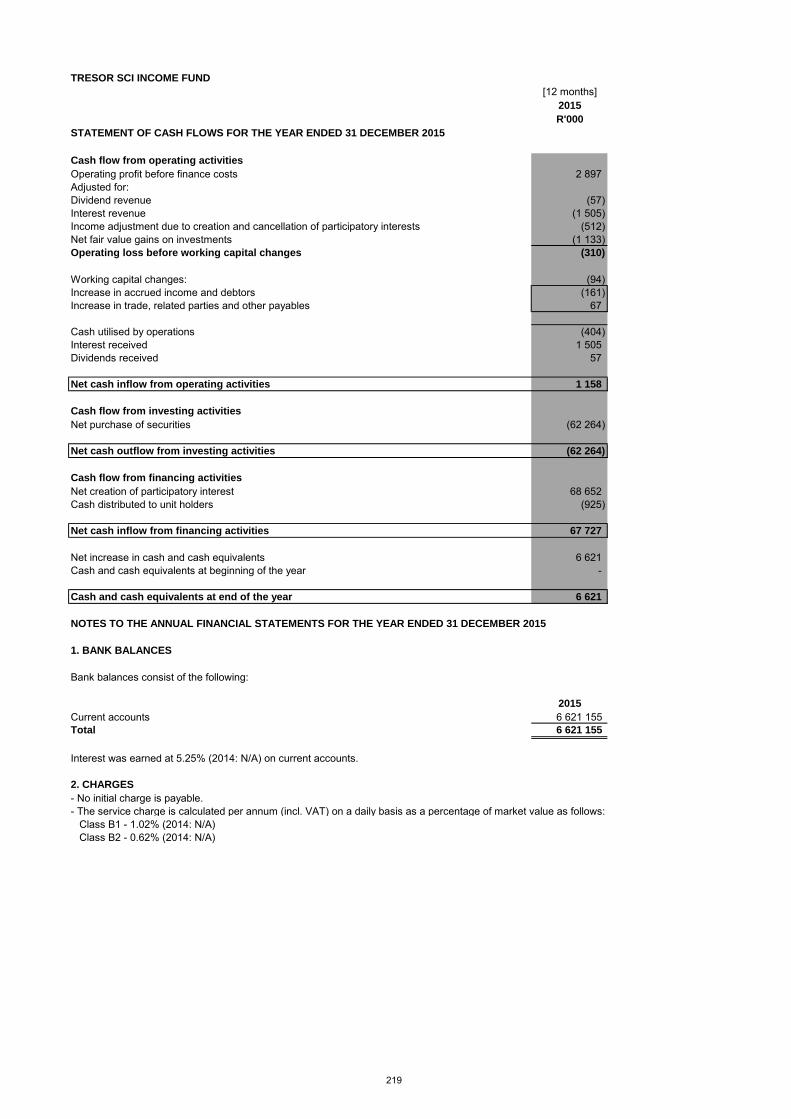
TRESOR SCI INCOME FUND
[12 months]2015
R'000
STATEMENT OF CASH FLOWS FOR THE YEAR ENDED 31 DECEMBER 2015
Cash flow from operating activities
Operating profit before finance costs 2 897 Adjusted for:Dividend revenue (57) Interest revenue (1 505) Income adjustment due to creation and cancellation of participatory interests (512) Net fair value gains on investments (1 133) Operating loss before working capital changes (310)
Working capital changes: (94) Increase in accrued income and debtors (161) Increase in trade, related parties and other payables 67
Cash utilised by operations (404) Interest received 1 505 Dividends received 57
Net cash inflow from operating activities 1 158
Cash flow from investing activities
Net purchase of securities (62 264)
Net cash outflow from investing activities (62 264)
Cash flow from financing activities
Net creation of participatory interest 68 652 Cash distributed to unit holders (925)
Net cash inflow from financing activities 67 727
Net increase in cash and cash equivalents 6 621 Cash and cash equivalents at beginning of the year -
Cash and cash equivalents at end of the year 6 621
NOTES TO THE ANNUAL FINANCIAL STATEMENTS FOR THE YEAR ENDED 31 DECEMBER 2015
1. BANK BALANCES
Bank balances consist of the following:
2015
Current accounts 6 621 155 Total 6 621 155
Interest was earned at 5.25% (2014: N/A) on current accounts.
2. CHARGES
- No initial charge is payable.- The service charge is calculated per annum (incl. VAT) on a daily basis as a percentage of market value as follows: Class B1 - 1.02% (2014: N/A) Class B2 - 0.62% (2014: N/A)
219

TRESOR SCI STABLE FUND
[12 months]2015
R'000
STATEMENT OF COMPREHENSIVE INCOME FOR THE YEAR ENDED 31 DECEMBER 2015
Income 15 706
Dividend revenue 972 Interest revenue 2 574 Other income 1 Income adjustment due to creation and cancellation of participatory interests 67 Net fair value gains on financial instruments 12 092
Expenses 1 915
Service fees 1 588 Audit fees 55 Withholding tax 25 Custodian, trustee and bank charges 54 Transaction costs 193
Operating profit 13 791
Finance costs 1 882
Distributions to unit holders 1 882
Change in net assets attributable to unit holders 11 909
STATEMENT OF FINANCIAL POSITION AS AT 31 DECEMBER 2015
Assets
Investments 200 082
Equities and specialist securities - Local 39 469 Participatory Interest in Collective Investment Schemes - Local 160 613
Accrued income and debtors 13
Cash and bank balances 11 717
Total assets 211 812
Liabilities 6 938
Trade and other payables 4 857 Related parties payable 199 Distributions payable 1 882
Net assets attributable to unit holders 204 874
Balance at the beginning of the year - Change in net assets attributable to unit holders 11 909 Creation of participatory interests 208 695 Liquidation of participatory interests (15 730)
Balance at the end of the year 204 874
Comparatives not stated, since the Tresor SCI Stable Fund was established on 15 January 2015.
STATEMENT OF CHANGES IN NET ASSETS ATTRIBUTABLE TO UNIT HOLDERS FOR THE
YEAR ENDED 31 DECEMBER 2015
220

TRESOR SCI STABLE FUND
[12 months]2015
R'000
STATEMENT OF CASH FLOWS FOR THE YEAR ENDED 31 DECEMBER 2015
Cash flow from operating activities
Operating profit before finance costs 13 791 Adjusted for:Dividend revenue (972) Interest revenue (2 574) Income adjustment due to creation and cancellation of participatory interests (67) Net fair value gains on investments (12 092) Operating loss before working capital changes (1 914)
Working capital changes: 5 043 Increase in accrued income and debtors (13) Increase in trade, related parties and other payables 5 056
Cash generated by operations 3 129 Interest received 2 574 Dividends received 972
Net cash inflow from operating activities 6 675
Cash flow from investing activities
Net purchase of securities (187 990)
Net cash outflow from investing activities (187 990)
Cash flow from financing activities
Net creation of participatory interest 193 032
Net cash inflow from financing activities 193 032
Net increase in cash and cash equivalents 11 717 Cash and cash equivalents at beginning of the year -
Cash and cash equivalents at end of the year 11 717
NOTES TO THE ANNUAL FINANCIAL STATEMENTS FOR THE YEAR ENDED 31 DECEMBER 2015
1. BANK BALANCES
Bank balances consist of the following:
2015
Current accounts 11 716 951 Total 11 716 951
Interest was earned at 5.25% (2014: N/A) on current accounts.
2. CHARGES
- No initial charge is payable.- The service charge is calculated per annum (incl. VAT) on a daily basis as a percentage of market value as follows: Class B1 - 1.14% (2014: N/A) Class B2 - 0.74% (2014: N/A)
221

CREATIONS AND CANCELLATIONS
Fund Name Issued Cancelled Issued Cancelled
BRACKENHAM SCI MANAGED FUND ANumber 49 223 973 23 234 849 263 010 758 3 895 205 Consideration (in Rands) 87 894 324 41 570 649 447 491 736 6 692 359
BRACKENHAM SCI MANAGED FUND B1Number 550 - - - Consideration (in Rands) 1 000 - - -
FIRST AVENUE SCI EQUITY FUND B1Number 9 785 121 3 365 442 293 969 66 752 Consideration (in Rands) 170 628 939 58 867 088 4 262 431 1 012 322
FIRST AVENUE SCI EQUITY FUND B2Number 3 435 642 2 376 251 9 665 133 1 151 744 Consideration (in Rands) 58 311 148 41 350 243 155 032 226 18 626 125
FIRST AVENUE SCI EQUITY FUND B3Number 11 647 595 8 713 462 41 728 984 13 399 769 Consideration (in Rands) 201 253 075 154 296 118 637 473 368 215 362 255
FIRST AVENUE SCI EQUITY FUND B4Number 61 - - - Consideration (in Rands) 1 000 - - -
GRAVITON SCI BALANCED FUND A1Number 5 095 091 1 372 989 1 504 868 879 575 Consideration (in Rands) 73 788 389 19 607 201 19 025 717 11 630 571
GRAVITON SCI BALANCED FUND B1Number 9 239 096 65 693 851 46 663 507 3 787 137 Consideration (in Rands) 132 379 594 911 799 712 626 319 939 50 378 317
GRAVITON SCI BALANCED FUND B2Number 43 598 579 3 485 480 - - Consideration (in Rands) 588 360 314 49 741 009 - -
GRAVITON SCI CAPITAL GROWTH FUND A1Number 118 916 163 350 503 453 22 482 Consideration (in Rands) 1 439 973 1 992 298 5 656 624 257 488
GRAVITON SCI CAPITAL GROWTH FUND B1Number 9 611 150 64 012 351 19 216 674 16 203 773 Consideration (in Rands) 115 127 185 787 322 089 217 205 651 185 727 814
GRAVITON SCI CAPITAL GROWTH FUND B2Number 86 - - - Consideration (in Rands) 1 000 - - -
GRAVITON SCI FLEXIBLE INCOME FUND A1Number 1 889 424 2 267 051 184 842 1 459 750 Consideration (in Rands) 19 338 061 23 211 587 1 866 587 14 777 413
GRAVITON SCI FLEXIBLE INCOME FUND B1Number 4 038 189 55 935 736 44 016 882 7 274 880 Consideration (in Rands) 41 080 097 566 481 773 448 537 243 73 771 860
GRAVITON SCI FLEXIBLE INCOME FUND B2Number 37 488 313 9 637 071 - - Consideration (in Rands) 378 044 820 98 517 055 - -
GRAVITON SCI LOW EQUITY FUND A1Number 475 690 205 198 650 098 166 917 Consideration (in Rands) 5 919 383 2 554 805 7 612 063 1 978 075
GRAVITON SCI LOW EQUITY FUND B1Number 3 118 958 84 283 506 33 345 581 12 734 298 Consideration (in Rands) 38 299 236 1 057 291 434 399 532 808 150 679 834
2015 2014
222
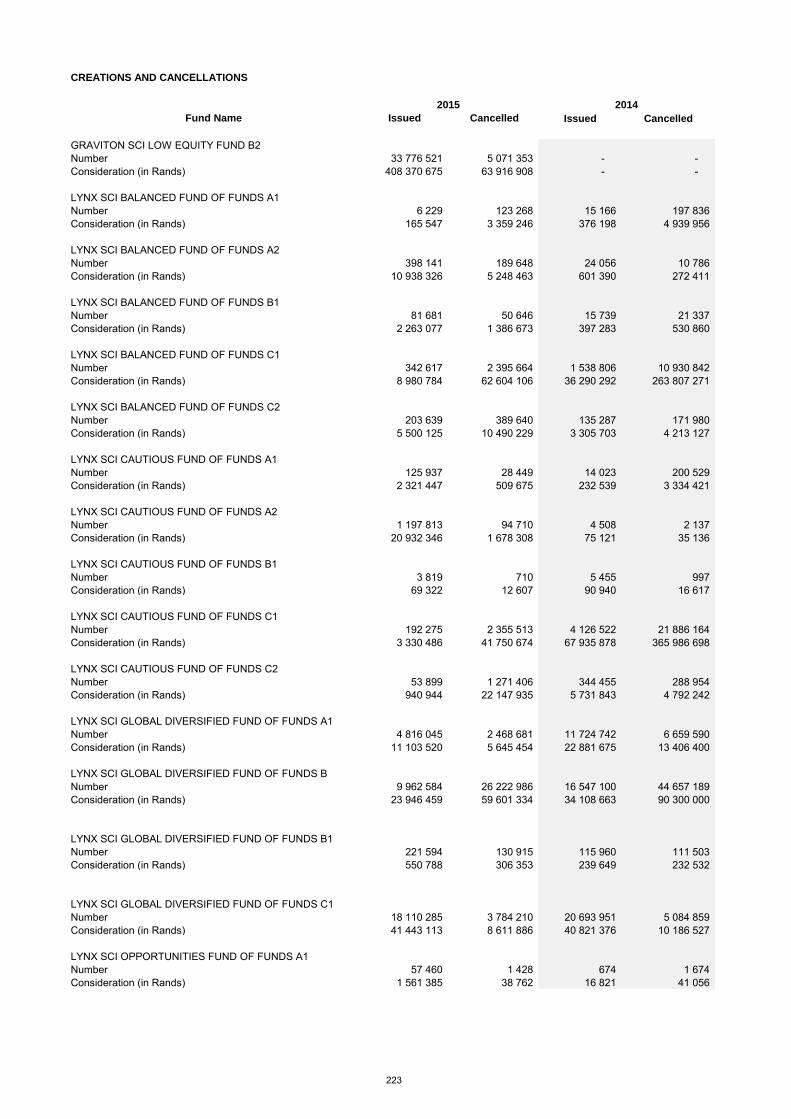
CREATIONS AND CANCELLATIONS
Fund Name Issued Cancelled Issued Cancelled
2015 2014
GRAVITON SCI LOW EQUITY FUND B2Number 33 776 521 5 071 353 - - Consideration (in Rands) 408 370 675 63 916 908 - -
LYNX SCI BALANCED FUND OF FUNDS A1Number 6 229 123 268 15 166 197 836 Consideration (in Rands) 165 547 3 359 246 376 198 4 939 956
LYNX SCI BALANCED FUND OF FUNDS A2Number 398 141 189 648 24 056 10 786 Consideration (in Rands) 10 938 326 5 248 463 601 390 272 411
LYNX SCI BALANCED FUND OF FUNDS B1Number 81 681 50 646 15 739 21 337 Consideration (in Rands) 2 263 077 1 386 673 397 283 530 860
LYNX SCI BALANCED FUND OF FUNDS C1Number 342 617 2 395 664 1 538 806 10 930 842 Consideration (in Rands) 8 980 784 62 604 106 36 290 292 263 807 271
LYNX SCI BALANCED FUND OF FUNDS C2Number 203 639 389 640 135 287 171 980 Consideration (in Rands) 5 500 125 10 490 229 3 305 703 4 213 127
LYNX SCI CAUTIOUS FUND OF FUNDS A1Number 125 937 28 449 14 023 200 529 Consideration (in Rands) 2 321 447 509 675 232 539 3 334 421
LYNX SCI CAUTIOUS FUND OF FUNDS A2Number 1 197 813 94 710 4 508 2 137 Consideration (in Rands) 20 932 346 1 678 308 75 121 35 136
LYNX SCI CAUTIOUS FUND OF FUNDS B1Number 3 819 710 5 455 997 Consideration (in Rands) 69 322 12 607 90 940 16 617
LYNX SCI CAUTIOUS FUND OF FUNDS C1Number 192 275 2 355 513 4 126 522 21 886 164 Consideration (in Rands) 3 330 486 41 750 674 67 935 878 365 986 698
LYNX SCI CAUTIOUS FUND OF FUNDS C2Number 53 899 1 271 406 344 455 288 954 Consideration (in Rands) 940 944 22 147 935 5 731 843 4 792 242
LYNX SCI GLOBAL DIVERSIFIED FUND OF FUNDS A1Number 4 816 045 2 468 681 11 724 742 6 659 590 Consideration (in Rands) 11 103 520 5 645 454 22 881 675 13 406 400
LYNX SCI GLOBAL DIVERSIFIED FUND OF FUNDS BNumber 9 962 584 26 222 986 16 547 100 44 657 189 Consideration (in Rands) 23 946 459 59 601 334 34 108 663 90 300 000
LYNX SCI GLOBAL DIVERSIFIED FUND OF FUNDS B1Number 221 594 130 915 115 960 111 503 Consideration (in Rands) 550 788 306 353 239 649 232 532
LYNX SCI GLOBAL DIVERSIFIED FUND OF FUNDS C1Number 18 110 285 3 784 210 20 693 951 5 084 859 Consideration (in Rands) 41 443 113 8 611 886 40 821 376 10 186 527
LYNX SCI OPPORTUNITIES FUND OF FUNDS A1Number 57 460 1 428 674 1 674 Consideration (in Rands) 1 561 385 38 762 16 821 41 056
223

CREATIONS AND CANCELLATIONS
Fund Name Issued Cancelled Issued Cancelled
2015 2014
LYNX SCI OPPORTUNITIES FUND OF FUNDS A2Number 58 798 281 - - Consideration (in Rands) 1 627 818 7 770 - -
LYNX SCI OPPORTUNITIES FUND OF FUNDS C1Number 82 277 182 801 16 756 370 954 Consideration (in Rands) 156 518 4 711 557 393 845 8 694 371
LYNX SCI OPPORTUNITIES FUND OF FUNDS C2Number 3 906 23 266 6 621 15 583 Consideration (in Rands) 102 269 613 422 153 525 363 317
MEGAFIN SCI BALANCED FUND OF FUNDS A1Number 97 - - - Consideration (in Rands) 1 000 - - -
MEGAFIN SCI BALANCED FUND OF FUNDS B1Number 81 961 225 7 769 289 - - Consideration (in Rands) 826 294 138 79 134 741 - -
MEGAFIN SCI GROWTH FUND OF FUNDS A1Number 90 - - - Consideration (in Rands) 1 000 - - -
MEGAFIN SCI GROWTH FUND OF FUNDS B1Number 5 777 575 455 945 - - Consideration (in Rands) 58 483 083 4 774 998 -
MEGAFIN SCI STABLE FUND OF FUNDS A1Number 96 - - - Consideration (in Rands) 1 000 - - -
MEGAFIN SCI STABLE FUND OF FUNDS B1Number 20 753 300 3 573 073 - - Consideration (in Rands) 208 316 206 36 639 379 - -
OBSIDIAN SCI BALANCED FUND B1Number 12 939 331 454 376 307 773 14 792 Consideration (in Rands) 161 402 883 5 605 734 3 427 676 162 669
OBSIDIAN SCI BALANCED FUND B3Number 176 347 3 304 746 4 292 121 103 945 Consideration (in Rands) 2 107 454 37 621 545 47 936 862 1 128 573
OBSIDIAN SCI BALANCED FUND B4Number 32 353 374 2 004 592 6 698 057 18 019 Consideration (in Rands) 403 156 472 25 101 850 74 522 470 202 130
OBSIDIAN SCI BALANCED FUND B5Number 3 366 546 87 - - Consideration (in Rands) 38 379 590 1 029 - -
OBSIDIAN SCI EQUITY FUND B1Number 100 - - - Consideration (in Rands) 1 000 - - -
OBSIDIAN SCI EQUITY FUND B2Number 100 - - - Consideration (in Rands) 1 000 - - -
OBSIDIAN SCI EQUITY FUND B3Number 100 000 - - - Consideration (in Rands) 1 000 000 - - -
OBSIDIAN SCI EQUITY FUND B4Number 100 - - - Consideration (in Rands) 1 000 - - -
224

CREATIONS AND CANCELLATIONS
Fund Name Issued Cancelled Issued Cancelled
2015 2014
SANLAM AFRICAN FRONTIER MARKETS FEEDER FUND A1Number 26 945 130 033 107 373 16 522 Consideration (in Rands) 302 176 1 424 131 1 228 371 187 194
SANLAM AFRICAN FRONTIER MARKETS FEEDER FUND B1Number 20 433 90 519 102 655 32 669 Consideration (in Rands) 235 767 979 691 1 153 595 365 036
SANLAM AFRICAN FRONTIER MARKETS FEEDER FUND B2Number - 100 - - Consideration (in Rands) - 1 057 - -
SANLAM AFRICAN FRONTIER MARKETS FEEDER FUND B3Number 90 874 2 267 893 2 177 020 100 000 Consideration (in Rands) 1 000 000 24 118 592 24 747 490 1 105 040
SANLAM ALTERNATIVE INCOME FUND A1Number 24 782 462 21 638 576 13 043 776 33 438 502 Consideration (in Rands) 24 782 462 21 638 576 13 043 776 33 438 502
SANLAM ALTERNATIVE INCOME FUND B1Number 6 638 508 606 6 362 256 814 3 871 479 653 3 109 404 237 Consideration (in Rands) 6 638 508 606 6 362 256 814 3 871 479 653 3 109 404 237
SANLAM ALTERNATIVE INCOME FUND B2Number 5 025 260 531 3 978 178 948 1 876 407 514 2 280 842 349 Consideration (in Rands) 5 025 260 531 3 978 178 948 1 876 407 514 2 280 842 349
SANLAM ALTERNATIVE INCOME FUND B3Number 707 342 830 540 473 974 763 349 979 290 517 652 Consideration (in Rands) 707 342 830 540 473 974 763 349 979 290 517 652
SANLAM ALTERNATIVE INCOME FUND B4Number 155 097 581 467 227 805 247 671 836 308 906 679 Consideration (in Rands) 155 097 581 467 227 805 247 671 836 308 906 679
SANLAM ALTERNATIVE INCOME FUND B5Number 513 256 830 890 150 220 475 328 130 462 099 135 Consideration (in Rands) 513 256 830 890 150 220 475 328 130 462 099 135
SANLAM ALTERNATIVE INCOME FUND B6Number 461 871 546 929 907 486 1 916 740 469 782 721 728 Consideration (in Rands) 461 871 546 929 907 486 1 916 740 469 782 721 728
SANLAM ALTERNATIVE INCOME FUND B7Number 15 315 798 261 801 000 600 000 000 1 299 999 000 Consideration (in Rands) 15 315 798 261 801 000 600 000 000 1 299 999 000
SANLAM ALTERNATIVE INCOME FUND B8Number 766 277 159 248 397 219 - - Consideration (in Rands) 766 277 159 248 397 219 - -
SANLAM ASIA PACIFIC FUND OF FUNDS A1Number 1 915 919 945 677 371 573 205 483 Consideration (in Rands) 34 098 590 16 507 473 5 387 844 2 919 780
SANLAM ASIA PACIFIC FUND OF FUNDS B1Number 1 147 52 769 - Consideration (in Rands) 21 861 898 11 953 -
SANLAM DIVERSIFIED INCOME FUND OF FUNDS A2Number 156 399 478 222 135 482 151 339 600 15 281 619 Consideration (in Rands) 164 571 641 234 855 678 157 600 429 15 935 000
225

CREATIONS AND CANCELLATIONS
Fund Name Issued Cancelled Issued Cancelled
2015 2014
SANLAM DIVERSIFIED INCOME FUND OF FUNDS A3Number 299 837 693 162 390 229 35 593 844 56 539 612 Consideration (in Rands) 317 811 392 171 820 163 37 014 522 58 797 450
SANLAM DIVERSIFIED INCOME FUND OF FUNDS A4Number 17 410 724 496 066 998 208 891 746 - Consideration (in Rands) 18 352 844 525 653 579 218 057 936 -
SANLAM DIVERSIFIED INCOME FUND OF FUND BNumber 57 876 586 136 425 925 184 723 435 423 453 959 Consideration (in Rands) 61 143 329 144 002 195 191 915 485 441 246 501
SANLAM DIVERSIFIED INCOME FUND OF FUND B2Number 96 072 379 527 284 417 963 Consideration (in Rands) 101 157 400 073 297 465 1 009
SANLAM DIVERSIFIED INCOME FUND OF FUND B3Number 1 133 810 12 069 962 - Consideration (in Rands) 1 199 482 12 770 1 000 -
SANLAM GLOBAL BALANCED FUND OF FUNDS A1Number 645 573 139 165 326 559 55 803 Consideration (in Rands) 16 795 114 3 713 350 6 940 295 1 177 174
SANLAM GLOBAL BALANCED FUND OF FUNDS B2Number 342 922 382 796 166 777 123 008 Consideration (in Rands) 8 840 122 10 006 806 3 662 784 2 710 278
SANLAM GLOBAL BALANCED FUND OF FUNDS B5Number 1 084 570 801 543 42 - Consideration (in Rands) 29 477 773 21 977 141 1 000 -
SANLAM GLOBAL CAUTIOUS FUND OF FUNDSNumber 1 350 771 194 289 339 095 342 517 Consideration (in Rands) 31 780 957 4 425 685 6 603 024 6 656 912
SANLAM GLOBAL EQUITY FUND ANumber 171 612 316 176 458 974 135 680 672 127 598 685 Consideration (in Rands) 1 004 905 929 1 041 079 796 705 672 757 667 774 528
SANLAM GLOBAL EQUITY FUND B1Number 676 559 45 419 456 710 86 876 Consideration (in Rands) 3 601 006 257 200 2 296 919 423 411
SANLAM GLOBAL EQUITY FUND B2Number - - 13 411 750 35 012 818 Consideration (in Rands) - - 70 078 046 188 319 115
SANLAM GLOBAL EQUITY FUND B3Number 13 225 49 077 13 411 750 35 012 818 Consideration (in Rands) 78 575 291 612 70 078 046 188 319 115
SANLAM GLOBAL EQUITY FUND RNumber 48 917 959 113 738 833 94 076 748 37 012 135 Consideration (in Rands) 286 400 668 678 904 999 501 171 279 197 933 532
SANLAM GLOBAL INDEX FUND OF FUNDS B1Number 61 983 1 123 423 53 568 103 506 Consideration (in Rands) 1 166 581 21 957 436 952 822 1 789 653
SANLAM GROWTH INSTITUTIONAL FUND B1Number 413 090 1 083 763 435 441 902 853 Consideration (in Rands) 28 284 841 75 230 474 28 551 347 59 318 136
SANLAM GROWTH INSTITUTIONAL FUND B2Number 4 621 920 11 469 318 21 195 394 6 100 989 Consideration (in Rands) 295 559 027 824 834 217 1 364 546 008 397 282 911
226

CREATIONS AND CANCELLATIONS
Fund Name Issued Cancelled Issued Cancelled
2015 2014
SANLAM GROWTH INSTITUTIONAL FUND B4Number - 17 - - Consideration (in Rands) - 2 322 - -
SANLAM GROWTH INSTITUTIONAL FUND B5Number 214 030 1 083 333 444 659 179 848 Consideration (in Rands) 15 201 515 76 418 246 29 381 814 11 662 440
SANLAM GROWTH INSTITUTIONAL FUND B6Number 63 24 767 28 471 3 812 Consideration (in Rands) 4 101 1 602 830 1 732 185 252 863
SANLAM GROWTH INSTITUTIONAL FUND B8Number 47 539 - 98 351 - Consideration (in Rands) 3 345 165 - 6 247 568 -
SANLAM INDIA OPPORTUNITIES FEEDER FUND ANumber 8 020 226 5 422 782 6 412 350 301 071 Consideration (in Rands) 138 030 033 94 661 887 92 794 357 3 597 835
SANLAM INSTITUTIONAL SPECIAL OPPORTUNITIES FUNDNumber 14 582 632 5 579 668 2 730 317 4 090 241 Consideration (in Rands) 656 414 654 246 253 473 111 443 685 168 959 717
SANLAM MARKET ALLOCATOR FUND A1 Number 6 710 4 035 100 603 717 Consideration (in Rands) 79 151 48 451 1 156 559 7 924
SANLAM MARKET ALLOCATOR FUND B1 Number 166 780 2 243 460 171 089 818 420 Consideration (in Rands) 1 959 754 27 057 248 1 884 055 9 000 000
SANLAM MARKET ALLOCATOR FUND B1 (ring)Number 2 243 460 2 243 460 - - Consideration (in Rands) 27 057 248 27 140 961 - -
SANLAM MARKET ALLOCATOR FUND B2 Number 275 450 176 346 814 838 2 422 Consideration (in Rands) 3 298 693 2 088 893 9 373 076 27 712
SANLAM OPTIMISED INCOME FUND B1Number 61 131 18 327 407 2 701 343 6 701 027 Consideration (in Rands) 61 709 18 487 524 2 739 360 6 821 941
SANLAM OPTIMISED INCOME FUND B2Number 5 648 998 291 821 394 13 484 554 28 020 865 Consideration (in Rands) 5 661 802 294 121 099 13 764 767 28 323 049
SANLAM OPTIMISED INCOME FUND B3Number 35 672 9 731 982 391 967 2 028 247 Consideration (in Rands) 36 008 9 843 402 399 999 2 076 722
SANLAM OPTIMISED INCOME FUND B4Number - 990 - - Consideration (in Rands) - 996 - -
SANLAM OPTIMISED INCOME FUND B5Number 351 176 342 176 967 976 Consideration (in Rands) 352 178 226 178 819 981
SANLAM PAN-EUROPE FUNDNumber 1 561 236 2 429 406 2 756 439 4 012 540 Consideration (in Rands) 6 590 263 10 426 682 11 203 548 15 759 400
SANLAM SELECT ABSOLUTE FUND A1 Number 198 917 707 9 165 9 165 Consideration (in Rands) 2 380 637 8 517 99 823 99 710
227

CREATIONS AND CANCELLATIONS
Fund Name Issued Cancelled Issued Cancelled
2015 2014
SANLAM SELECT ABSOLUTE FUND B1 Number 44 738 226 6 797 525 550 155 1 662 347 Consideration (in Rands) 544 613 494 83 386 000 5 724 089 18 316 032
SANLAM SELECT ABSOLUTE FUND B2Number 10 600 524 - - 99 903 Consideration (in Rands) 128 844 855 - - 1 030 510
SANLAM SELECT ABSOLUTE FUND B3Number 22 121 243 1 952 471 - - Consideration (in Rands) 264 511 567 23 623 859 - -
SANLAM SELECT ABSOLUTE FUND B4Number 87 - - - Consideration (in Rands) 1 000 - - -
SANLAM SELECT BOND PLUS FUND B1Number 91 - - - Consideration (in Rands) 1 000 - - -
SANLAM SELECT BOND PLUS FUND B2 Number 44 192 680 1 292 519 8 928 522 12 891 604 Consideration (in Rands) 476 136 084 13 976 673 95 518 017 139 647 400
SANLAM SELECT BOND PLUS FUND B3Number 91 - - - Consideration (in Rands) 1 000 - - -
SANLAM SELECT BOND PLUS FUND B6Number 465 971 228 741 172 270 2 926 991 Consideration (in Rands) 5 177 992 2 551 011 1 840 204 32 068 312
SANLAM SELECT BOND PLUS FUND B8Number 286 5 537 475 15 Consideration (in Rands) 3 139 59 383 5 064 159
SANLAM SELECT DEFENSIVE BALANCED FUND A1Number 5 792 706 17 429 477 11 741 768 - Consideration (in Rands) 61 770 680 189 115 818 122 999 999 -
SANLAM SELECT DEFENSIVE BALANCED FUND B1 Number 3 518 430 2 514 266 29 714 004 146 981 Consideration (in Rands) 37 473 717 27 221 000 303 665 531 1 500 000
SANLAM SELECT DEFENSIVE BALANCED FUND B2 Number 3 457 645 - - 99 901 Consideration (in Rands) 38 135 399 - - 1 007 340
SANLAM SELECT DEFENSIVE BALANCED FUND B3Number 26 678 773 5 410 166 - - Consideration (in Rands) 288 584 029 58 169 813 - -
SANLAM SELECT DEFENSIVE BALANCED FUND B4Number 124 882 1 047 - - Consideration (in Rands) 1 347 129 11 408 - -
SANLAM SELECT FLEXIBLE EQUITY FUND B1Number 6 766 350 - - - Consideration (in Rands) 92 637 955 - - -
SANLAM SELECT FLEXIBLE EQUITY FUND B2 Number 584 727 1 629 996 30 045 597 39 913 810 Consideration (in Rands) 7 471 540 21 700 000 339 938 464 455 007 212
SANLAM SELECT FLEXIBLE EQUITY FUND B4Number 570 239 355 - - Consideration (in Rands) 7 503 043 4 720 - -
228

CREATIONS AND CANCELLATIONS
Fund Name Issued Cancelled Issued Cancelled
2015 2014
SANLAM SELECT FLEXIBLE EQUITY FUND B6 Number 56 555 344 530 233 49 127 1 129 909 Consideration (in Rands) 738 640 505 6 823 796 542 923 12 492 311
SANLAM SELECT FLEXIBLE EQUITY FUND B8Number 287 529 121 409 547 548 2 867 695 Consideration (in Rands) 3 780 896 1 649 363 6 113 676 32 468 898
SANLAM SELECT MANAGED FUND A1 Number 20 271 332 27 773 945 7 541 100 38 495 Consideration (in Rands) 218 678 351 303 558 113 79 000 000 401 039
SANLAM SELECT MANAGED FUND B1Number 3 178 825 3 630 312 29 000 906 386 774 Consideration (in Rands) 33 008 362 38 852 000 293 242 001 4 061 026
SANLAM SELECT MANAGED FUND B2Number - - - 99 903 Consideration (in Rands) - - - 1 024 850
SANLAM SELECT MANAGED FUND B3Number 53 337 419 2 761 755 - - Consideration (in Rands) 578 668 924 30 036 613 - -
SANLAM SELECT MANAGED FUND B4Number 71 566 462 - - Consideration (in Rands) 768 819 4 968 - -
SANLAM SELECT OPTIMISED EQUITY FUND B10Number 236 526 173 222 335 439 5 815 792 Consideration (in Rands) 16 903 118 12 464 999 22 093 368 368 173 833
SANLAM SELECT OPTIMISED EQUITY FUND B2Number - - 467 943 29 121 661 Consideration (in Rands) - - 28 954 581 1 832 052 062
SANLAM SELECT OPTIMISED EQUITY FUND B4 Number 3 - 3 760 3 760 Consideration (in Rands) 217 - 253 739 255 847
SANLAM SELECT OPTIMISED EQUITY FUND B7Number 329 675 36 905 - - Consideration (in Rands) 23 670 497 2 671 388 - -
SANLAM SELECT STRATEGIC INCOME FUND A1Number 19 886 249 - - Consideration (in Rands) 201 679 2 515 - -
SANLAM SELECT STRATEGIC INCOME FUND B1Number 3 500 661 563 630 1 080 966 278 164 Consideration (in Rands) 35 453 077 5 711 000 10 880 680 2 831 008
SANLAM SELECT STRATEGIC INCOME FUND B2Number - - - 99 901 Consideration (in Rands) - - - 1 006 940
SANLAM SELECT STRATEGIC INCOME FUND B4Number 12 568 97 - - Consideration (in Rands) 127 904 983 - -
SANLAM SELECT STRATEGIC INCOME FUND B5Number 105 064 412 20 151 638 - - Consideration (in Rands) 1 068 655 174 200 001 007 - -
SANLAM SELECT STRATEGIC INCOME FUND B6Number 4 694 348 350 291 - - Consideration (in Rands) 47 415 234 3 554 002 - -
229

CREATIONS AND CANCELLATIONS
Fund Name Issued Cancelled Issued Cancelled
2015 2014
SANLAM SELECT THEMATIC EQUITY FUND B1Number 817 141 72 992 - - Consideration (in Rands) 26 856 063 2 452 105 - -
SANLAM SELECT THEMATIC EQUITY FUND B2Number 31 - - - Consideration (in Rands) 1 000 - - -
SANLAM SELECT THEMATIC EQUITY FUND B3Number 27 798 129 2 321 581 3 - Consideration (in Rands) 971 156 385 76 829 302 84 2
SANLAM SELECT THEMATIC EQUITY FUND B4Number 31 - - - Consideration (in Rands) 1 000 - - -
SANLAM SELECT THEMATIC EQUITY FUND B10Number - - 7 161 360 35 Consideration (in Rands) 3 - 224 156 728 1 098
SANLAM STABLE GROWTH FUND A1Number 34 695 194 688 103 Consideration (in Rands) 360 943 1 997 7 022 1 050
SANLAM STABLE GROWTH FUND B1Number 4 516 12 008 7 505 100 Consideration (in Rands) 46 622 124 423 78 100 1 046
SANLAM STABLE GROWTH FUND B3Number 1 644 941 32 851 1 614 034 35 406 Consideration (in Rands) 16 992 175 339 896 16 475 792 367 336
SANLAM STABLE GROWTH FUND B4Number 79 894 2 579 - - Consideration (in Rands) 825 177 26 658 - -
SANLAM STABLE GROWTH FUND B5Number 26 292 1 472 663 1 470 537 1 255 292 Consideration (in Rands) 270 923 15 324 970 15 243 289 12 736 348
SANLAM VALUE INSTITUTIONAL FUND B1Number 1 881 725 3 516 461 2 014 500 3 506 391 Consideration (in Rands) 111 582 428 210 981 884 112 704 985 197 280 924
SANLAM VALUE INSTITUTIONAL FUND B2Number - 20 - - Consideration (in Rands) - 1 220 - -
SANLAM VALUE INSTITUTIONAL FUND B3Number - 23 - - Consideration (in Rands) - 1 405 - -
SANLAM VALUE INSTITUTIONAL FUND B5Number - 21 - - Consideration (in Rands) - 1 222 - -
SESFIKILE SCI PROPERTY FUND A1Number 1 430 842 2 374 223 712 795 2 537 766 Consideration (in Rands) 27 612 807 46 562 626 10 399 938 37 518 371
SESFIKILE SCI PROPERTY FUND B1Number 2 251 651 6 342 553 3 410 493 637 788 Consideration (in Rands) 43 505 487 124 187 874 54 480 571 10 710 589
SESFIKILE SCI PROPERTY FUND B2Number 13 064 184 31 910 472 10 650 734 1 105 397 Consideration (in Rands) 246 564 810 619 018 691 161 635 327 17 312 353
230

CREATIONS AND CANCELLATIONS
Fund Name Issued Cancelled Issued Cancelled
2015 2014
SIM ABSOLUTE RETURN INCOME FUNDNumber 706 761 924 716 822 894 377 540 885 388 655 420 Consideration (in Rands) 850 286 832 862 705 201 452 171 170 465 874 006
SIM ABSOLUTE RETURN INCOME FUND A1Number 29 505 462 738 33 444 - Consideration (in Rands) 34 910 553 495 39 577 -
SIM ABSOLUTE RETURN INCOME FUND B1Number 39 165 776 110 741 713 44 533 833 102 762 719 Consideration (in Rands) 46 445 788 133 482 162 52 705 739 123 530 937
SIM ABSOLUTE RETURN INCOME FUND B2Number 1 960 608 1 210 036 1 257 834 4 543 692 Consideration (in Rands) 2 335 320 1 448 945 1 494 540 5 407 937
SIM ABSOLUTE RETURN INCOME FUND B3Number 144 003 497 869 194 645 503 826 Consideration (in Rands) 170 485 603 686 230 461 602 414
SIM ABSOLUTE RETURN INCOME FUND B4Number 18 934 169 75 564 489 22 754 016 47 338 505 Consideration (in Rands) 22 531 418 91 396 661 27 044 142 56 722 766
SIM ABSOLUTE RETURN INCOME FUND B5Number 169 574 106 723 86 875 145 782 Consideration (in Rands) 204 019 128 152 104 317 174 271
SIM ACTIVE INCOME FUND A1Number 28 124 559 26 307 926 26 676 882 51 452 462 Consideration (in Rands) 322 146 329 302 060 531 303 284 164 584 363 524
SIM ACTIVE INCOME FUND B1Number 14 642 818 5 354 426 18 583 908 25 168 771 Consideration (in Rands) 167 930 080 61 520 720 211 731 193 285 894 523
SIM ACTIVE INCOME FUND B10Number 11 591 400 7 526 852 7 069 637 8 620 459 Consideration (in Rands) 133 019 208 86 679 644 80 709 626 97 841 208
SIM ACTIVE INCOME FUND B2Number 41 207 669 55 000 439 40 325 298 11 557 884 Consideration (in Rands) 473 012 776 632 549 550 460 211 034 131 293 713
SIM ACTIVE INCOME FUND B3Number 3 016 702 2 383 979 341 151 233 900 Consideration (in Rands) 34 672 501 27 391 765 3 886 676 2 653 121
SIM ACTIVE INCOME FUND B4Number 43 047 820 12 858 917 40 831 203 8 741 316 Consideration (in Rands) 480 764 315 143 566 901 452 003 155 97 044 289
SIM ACTIVE INCOME FUND B5Number 46 041 749 27 786 109 18 217 789 43 010 348 Consideration (in Rands) 527 595 878 320 550 111 205 768 224 489 257 611
SIM ACTIVE INCOME FUND B6Number 12 506 309 12 213 251 6 519 863 726 024 Consideration (in Rands) 143 498 292 140 308 724 74 925 843 8 273 014
SIM ACTIVE INCOME FUND B7Number 1 154 1 391 2 101 2 291 Consideration (in Rands) 13 248 15 931 23 866 25 994
SIM ACTIVE INCOME FUND B8Number 17 182 032 4 514 727 - - Consideration (in Rands) 197 278 575 51 812 258 - -
231

CREATIONS AND CANCELLATIONS
Fund Name Issued Cancelled Issued Cancelled
2015 2014
SIM ACTIVE INCOME FUND B9Number 2 196 492 5 814 162 5 665 629 2 158 977 Consideration (in Rands) 25 063 821 66 786 196 64 231 405 24 612 372
SIM ACTIVE INCOME FUND CNumber 3 950 311 17 806 178 5 056 057 19 286 402 Consideration (in Rands) 45 088 530 204 193 558 57 199 921 218 829 268
SIM BALANCED FUND ANumber 2 958 552 1 394 535 3 594 725 813 794 Consideration (in Rands) 219 060 845 103 637 577 254 372 305 57 516 773
SIM BALANCED FUND A1Number 33 106 1 533 - - Consideration (in Rands) 2 466 489 114 150 - -
SIM BALANCED FUND BNumber 87 257 93 267 86 954 232 088 Consideration (in Rands) 6 506 776 6 929 511 6 136 992 15 941 094
SIM BALANCED FUND B1Number 653 642 1 575 083 1 187 367 1 510 489 Consideration (in Rands) 48 057 023 116 755 812 83 450 767 105 952 945
SIM BALANCED FUND B10Number 2 162 908 302 469 3 853 613 69 557 Consideration (in Rands) 160 234 293 22 700 000 275 145 901 5 000 000
SIM BALANCED FUND B3Number 3 234 178 1 575 083 5 337 577 1 378 610 Consideration (in Rands) 239 797 183 116 755 812 377 964 163 97 762 648
SIM BALANCED FUND B4Number 19 006 043 4 285 276 20 027 420 624 515 Consideration (in Rands) 1 410 942 211 312 316 722 1 418 323 121 44 020 709
SIM BALANCED FUND B6Number 297 909 246 118 695 517 133 306 Consideration (in Rands) 22 077 039 18 197 822 50 033 980 9 217 752
SIM BALANCED FUND B7Number 7 369 613 203 666 4 078 818 403 684 Consideration (in Rands) 548 483 509 15 000 087 285 764 403 27 880 272
SIM BALANCED FUND B8Number 148 036 1 592 - - Consideration (in Rands) 11 035 473 117 764 - -
SIM BALANCED FUND B9Number 225 608 702 115 972 306 177 559 Consideration (in Rands) 16 570 689 52 106 504 68 266 269 12 638 018
SIM BALANCED FUND B11Number 14 735 392 - - Consideration (in Rands) 1 096 297 29 130 - -
SIM BALANCED FUND RNumber 235 548 261 731 101 366 200 768 Consideration (in Rands) 17 631 460 19 519 323 7 129 942 14 259 601
SIM BOND PLUS FUNDNumber 8 161 956 9 113 193 3 948 000 5 013 220 Consideration (in Rands) 69 681 092 77 791 230 32 859 955 42 071 270
SIM BOND PLUS FUND B2Number 2 156 415 1 606 781 1 560 150 410 873 Consideration (in Rands) 18 254 846 13 776 234 12 751 552 3 450 084
232

CREATIONS AND CANCELLATIONS
Fund Name Issued Cancelled Issued Cancelled
2015 2014
SIM BOND PLUS FUND B3Number 32 710 916 2 343 452 33 265 585 1 092 311 Consideration (in Rands) 273 830 567 19 249 170 272 119 753 9 600 000
SIM ENHANCED YIELD FUND A1Number 33 218 315 36 568 126 70 747 308 118 122 758 Consideration (in Rands) 34 022 014 37 464 287 72 018 137 120 345 097
SIM ENHANCED YIELD FUND B1Number 231 320 534 42 253 933 30 702 207 61 249 941 Consideration (in Rands) 237 195 515 43 290 185 31 231 573 62 350 739
SIM ENHANCED YIELD FUND B2Number 144 959 886 121 226 774 377 933 467 382 668 778 Consideration (in Rands) 148 558 690 124 195 789 385 931 548 390 824 896
SIM ENHANCED YIELD FUND B3Number 989 664 386 898 460 219 651 952 496 401 004 678 Consideration (in Rands) 1 013 643 008 917 640 669 665 734 470 408 364 619
SIM FINANCIAL FUNDNumber 1 278 101 1 248 639 1 787 306 1 979 127 Consideration (in Rands) 80 244 716 76 990 165 93 480 348 103 941 384
SIM FINANCIAL FUND B1Number 1 681 2 199 1 079 22 231 Consideration (in Rands) 103 214 137 920 56 523 1 170 231
SIM FINANCIAL FUND B2Number 155 783 196 416 161 296 140 809 Consideration (in Rands) 9 891 312 12 442 883 8 661 186 7 709 833
SIM GENERAL EQUITY FUND ANumber 1 255 249 12 202 909 2 313 474 654 642 Consideration (in Rands) 259 038 345 2 571 207 535 457 904 849 128 992 360
SIM GENERAL EQUITY FUND A1Number 9 192 2 260 - - Consideration (in Rands) 1 932 267 469 965 - -
SIM GENERAL EQUITY FUND A2Number 25 277 4 096 - - Consideration (in Rands) 5 519 985 857 720 - -
SIM GENERAL EQUITY FUND B1Number 38 264 77 618 66 368 151 345 Consideration (in Rands) 7 954 872 16 468 598 12 927 291 29 695 245
SIM GENERAL EQUITY FUND B4Number 1 375 1 829 1 252 2 309 Consideration (in Rands) 289 592 385 104 243 678 444 047
SIM GENERAL EQUITY FUND B5Number 1 528 586 1 333 279 1 022 009 652 023 Consideration (in Rands) 321 743 747 274 730 130 202 393 595 123 933 133
SIM GENERAL EQUITY FUND B6Number 255 900 74 013 182 204 31 812 Consideration (in Rands) 54 042 217 15 479 899 35 795 213 6 314 086
SIM GENERAL EQUITY FUND B7Number 17 322 352 - - Consideration (in Rands) 3 661 300 74 357 - -
SIM GENERAL EQUITY FUND B8Number 2 142 166 - - Consideration (in Rands) 453 818 34 984 - -
233
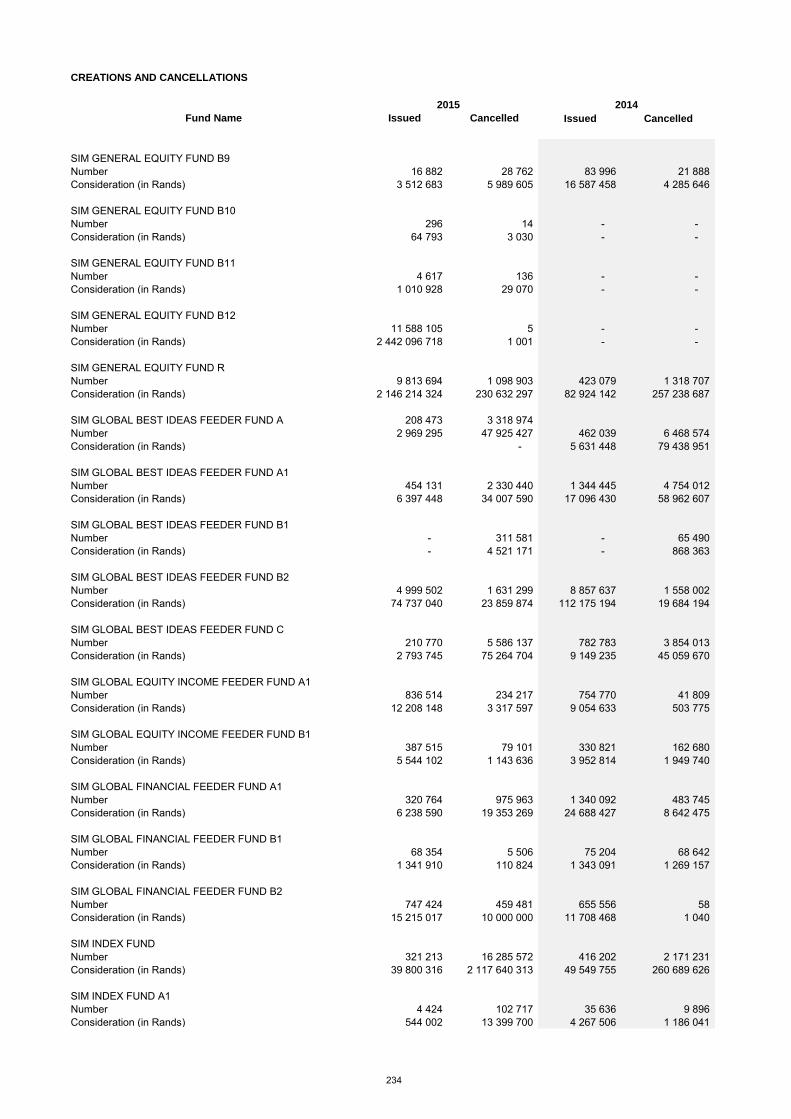
CREATIONS AND CANCELLATIONS
Fund Name Issued Cancelled Issued Cancelled
2015 2014
SIM GENERAL EQUITY FUND B9Number 16 882 28 762 83 996 21 888 Consideration (in Rands) 3 512 683 5 989 605 16 587 458 4 285 646
SIM GENERAL EQUITY FUND B10Number 296 14 - - Consideration (in Rands) 64 793 3 030 - -
SIM GENERAL EQUITY FUND B11Number 4 617 136 - - Consideration (in Rands) 1 010 928 29 070 - -
SIM GENERAL EQUITY FUND B12Number 11 588 105 5 - - Consideration (in Rands) 2 442 096 718 1 001 - -
SIM GENERAL EQUITY FUND RNumber 9 813 694 1 098 903 423 079 1 318 707 Consideration (in Rands) 2 146 214 324 230 632 297 82 924 142 257 238 687
SIM GLOBAL BEST IDEAS FEEDER FUND A 208 473 3 318 974 Number 2 969 295 47 925 427 462 039 6 468 574 Consideration (in Rands) - 5 631 448 79 438 951
SIM GLOBAL BEST IDEAS FEEDER FUND A1Number 454 131 2 330 440 1 344 445 4 754 012 Consideration (in Rands) 6 397 448 34 007 590 17 096 430 58 962 607
SIM GLOBAL BEST IDEAS FEEDER FUND B1Number - 311 581 - 65 490 Consideration (in Rands) - 4 521 171 - 868 363
SIM GLOBAL BEST IDEAS FEEDER FUND B2Number 4 999 502 1 631 299 8 857 637 1 558 002 Consideration (in Rands) 74 737 040 23 859 874 112 175 194 19 684 194
SIM GLOBAL BEST IDEAS FEEDER FUND CNumber 210 770 5 586 137 782 783 3 854 013 Consideration (in Rands) 2 793 745 75 264 704 9 149 235 45 059 670
SIM GLOBAL EQUITY INCOME FEEDER FUND A1Number 836 514 234 217 754 770 41 809 Consideration (in Rands) 12 208 148 3 317 597 9 054 633 503 775
SIM GLOBAL EQUITY INCOME FEEDER FUND B1Number 387 515 79 101 330 821 162 680 Consideration (in Rands) 5 544 102 1 143 636 3 952 814 1 949 740
SIM GLOBAL FINANCIAL FEEDER FUND A1Number 320 764 975 963 1 340 092 483 745 Consideration (in Rands) 6 238 590 19 353 269 24 688 427 8 642 475
SIM GLOBAL FINANCIAL FEEDER FUND B1Number 68 354 5 506 75 204 68 642 Consideration (in Rands) 1 341 910 110 824 1 343 091 1 269 157
SIM GLOBAL FINANCIAL FEEDER FUND B2Number 747 424 459 481 655 556 58 Consideration (in Rands) 15 215 017 10 000 000 11 708 468 1 040
SIM INDEX FUNDNumber 321 213 16 285 572 416 202 2 171 231 Consideration (in Rands) 39 800 316 2 117 640 313 49 549 755 260 689 626
SIM INDEX FUND A1Number 4 424 102 717 35 636 9 896 Consideration (in Rands) 544 002 13 399 700 4 267 506 1 186 041
234

CREATIONS AND CANCELLATIONS
Fund Name Issued Cancelled Issued Cancelled
2015 2014
SIM INDEX FUND B1Number 4 499 9 750 Consideration (in Rands) 563 64 818 1 041 93 545
SIM INDEX FUND B2Number 421 7 954 339 579 Consideration (in Rands) 53 010 1 033 268 40 535 65 495
SIM INDEX FUND RINGNumber - - 939 604 939 604 Consideration (in Rands) - - 115 506 001 113 942 217
SIM INDUSTRIAL FUND ANumber 876 443 335 094 834 226 368 477 Consideration (in Rands) 162 458 483 60 675 818 128 003 799 55 525 327
SIM INDUSTRIAL FUND B1Number 1 202 2 374 913 2 074 Consideration (in Rands) 224 080 430 612 150 266 318 526
SIM INDUSTRIAL FUND B2Number 55 860 105 500 67 841 99 031 Consideration (in Rands) 10 195 781 19 500 453 10 127 117 15 181 731
SIM INDUSTRIAL FUND RNumber 253 726 537 169 78 338 528 234 Consideration (in Rands) 45 491 090 99 370 535 11 433 538 80 597 645
SIM INFLATION PLUS FUNDNumber 62 688 636 15 686 179 75 999 575 7 438 122 Consideration (in Rands) 289 683 604 72 246 590 331 555 737 32 306 846
SIM INFLATION PLUS FUND B1Number 18 260 118 37 193 708 51 854 477 7 417 820 Consideration (in Rands) 83 498 114 171 393 367 225 774 613 32 528 653
SIM INFLATION PLUS FUND B2Number 45 480 188 44 328 795 44 199 018 41 213 870 Consideration (in Rands) 210 532 732 206 641 358 194 466 329 180 704 467
SIM INFLATION PLUS FUND B4Number 605 561 966 12 818 227 187 616 473 3 258 141 Consideration (in Rands) 2 823 001 401 58 422 962 822 925 647 14 460 471
SIM INFLATION PLUS FUND B6Number 25 571 326 14 046 189 32 208 519 11 929 394 Consideration (in Rands) 117 655 090 65 038 698 140 767 559 52 047 990
SIM INFLATION PLUS FUND B7Number 6 628 243 914 968 1 223 194 3 059 608 Consideration (in Rands) 30 592 512 4 236 141 5 364 554 13 344 052
SIM INFLATION PLUS FUND B8Number 2 802 582 4 277 172 5 472 924 4 455 660 Consideration (in Rands) 12 990 104 19 865 478 24 229 225 19 549 300
SIM INFLATION PLUS FUND B9Number 4 010 498 6 854 207 18 979 110 1 498 452 Consideration (in Rands) 18 301 947 31 732 249 82 637 346 6 617 462
SIM LOW EQUITY FUND A1Number 576 998 926 580 599 067 530 466 161 542 235 939 Consideration (in Rands) 855 889 768 860 910 737 738 389 372 755 556 151
SIM LOW EQUITY FUND B1Number 3 798 981 13 244 555 15 173 268 5 559 744 Consideration (in Rands) 5 558 737 19 619 431 21 056 817 7 774 074
235

CREATIONS AND CANCELLATIONS
Fund Name Issued Cancelled Issued Cancelled
2015 2014
SIM LOW EQUITY FUND B2Number - - 565 053 12 210 659 Consideration (in Rands) - - 775 458 17 032 648
SIM LOW EQUITY FUND B3Number 118 2 489 113 - Consideration (in Rands) 170 3 677 156 -
SIM LOW EQUITY FUND B4Number 52 139 442 94 684 284 126 044 153 26 986 070 Consideration (in Rands) 77 177 561 140 634 311 175 987 110 37 928 191
SIM LOW EQUITY FUND CNumber 12 324 641 42 382 225 31 578 440 20 808 139 Consideration (in Rands) 18 044 621 63 205 257 43 716 136 28 951 681
SIM MANAGED AGGRESSIVE FUND OF FUNDS A1Number 634 379 300 476 666 512 176 878 Consideration (in Rands) 15 508 615 7 321 383 15 068 572 4 003 541
SIM MANAGED AGGRESSIVE FUND OF FUNDS A2Number 772 325 - - Consideration (in Rands) 18 854 7 957 - -
SIM MANAGED AGGRESSIVE FUND OF FUNDS B1Number 5 794 871 1 364 629 4 089 912 841 252 Consideration (in Rands) 141 704 230 33 657 095 92 318 969 19 160 115
SIM MANAGED AGGRESSIVE FUND OF FUNDS B2Number 128 825 322 846 627 269 276 245 Consideration (in Rands) 3 108 322 7 778 744 13 637 884 6 167 838
SIM MANAGED AGGRESSIVE FUND OF FUNDS B3Number 10 000 184 - - Consideration (in Rands) 249 555 4 435 - -
SIM MANAGED AGGRESSIVE FUND OF FUNDS B4Number 52 727 36 741 67 770 33 614 Consideration (in Rands) 1 289 412 898 261 1 528 611 758 827
SIM MANAGED AGGRESSIVE FUND OF FUNDS B5Number 136 043 32 058 89 918 12 146 Consideration (in Rands) 3 359 321 784 230 2 000 995 279 460
SIM MANAGED AGGRESSIVE FUND OF FUNDS B6Number 233 108 - - Consideration (in Rands) 5 708 2 631 - -
SIM MANAGED AGGRESSIVE FUND OF FUNDS B9Number 79 357 167 727 328 434 125 253 Consideration (in Rands) 1 929 860 4 106 997 7 361 941 2 849 893
SIM MANAGED CAUTIOUS FUND OF FUNDS A1Number 2 778 266 1 631 964 1 998 673 1 882 822 Consideration (in Rands) 45 130 095 26 522 515 30 380 652 28 893 513
SIM MANAGED CAUTIOUS FUND OF FUNDS A2Number 1 955 65 - - Consideration (in Rands) 31 949 1 042 - -
SIM MANAGED CAUTIOUS FUND OF FUNDS B1Number 6 209 268 7 790 091 6 955 183 7 027 520 Consideration (in Rands) 100 578 228 126 711 971 105 539 762 107 513 229
SIM MANAGED CAUTIOUS FUND OF FUNDS B2Number 1 268 540 1 330 740 986 119 2 247 218 Consideration (in Rands) 20 433 558 21 615 485 14 910 427 34 143 233
236

CREATIONS AND CANCELLATIONS
Fund Name Issued Cancelled Issued Cancelled
2015 2014
SIM MANAGED CAUTIOUS FUND OF FUNDS B3Number 1 602 235 - - Consideration (in Rands) 25 754 3 779 - -
SIM MANAGED CAUTIOUS FUND OF FUNDS B4Number 5 033 5 840 5 572 7 399 Consideration (in Rands) 81 717 95 003 84 623 112 016
SIM MANAGED CAUTIOUS FUND OF FUNDS B5Number 633 998 166 755 501 176 236 921 Consideration (in Rands) 10 345 888 2 695 635 7 778 528 3 698 762
SIM MANAGED CAUTIOUS FUND OF FUNDS B6Number 126 63 - - Consideration (in Rands) 2 000 1 017 - -
SIM MANAGED CAUTIOUS FUND OF FUNDS B9Number 854 505 887 317 768 993 636 738 Consideration (in Rands) 13 886 447 14 422 083 11 635 568 9 679 218
SIM MANAGED CONSERVATIVE FUND OF FUNDS A1Number 1 157 722 492 297 660 830 646 296 Consideration (in Rands) 16 217 204 6 920 086 8 727 547 8 475 531
SIM MANAGED CONSERVATIVE FUND OF FUNDS A2Number 2 867 74 - - Consideration (in Rands) 40 738 987 - -
SIM MANAGED CONSERVATIVE FUND OF FUNDS B1Number 2 512 117 4 881 610 3 735 162 3 540 605 Consideration (in Rands) 35 061 416 68 670 324 49 054 549 46 632 613
SIM MANAGED CONSERVATIVE FUND OF FUNDS B2Number 549 265 236 716 132 601 290 591 Consideration (in Rands) 7 732 907 3 319 051 1 755 471 3 786 156
SIM MANAGED CONSERVATIVE FUND OF FUNDS B3Number 1 240 145 - - Consideration (in Rands) 17 658 2 039 - -
SIM MANAGED CONSERVATIVE FUND OF FUNDS B4Number 41 829 27 953 52 375 22 634 Consideration (in Rands) 589 922 393 888 695 487 302 279
SIM MANAGED CONSERVATIVE FUND OF FUNDS B5Number 197 523 70 722 204 073 32 731 Consideration (in Rands) 2 796 972 999 855 2 792 738 444 190
SIM MANAGED CONSERVATIVE FUND OF FUNDS B6Number 1 900 1 815 - - Consideration (in Rands) 26 968 25 691 - -
SIM MANAGED CONSERVATIVE FUND OF FUNDS B9Number 224 421 164 498 189 865 247 539 Consideration (in Rands) 3 172 907 2 324 604 2 510 535 3 280 540
SIM MANAGED MODERATE AGGRESSIVE FUND OF FUNDS A1Number 2 718 514 1 160 074 1 874 235 1 488 894 Consideration (in Rands) 55 963 543 24 086 231 36 112 565 28 628 152
SIM MANAGED MODERATE AGGRESSIVE FUND OF FUNDS A2Number 2 341 91 - - Consideration (in Rands) 49 248 1 864 - -
237

CREATIONS AND CANCELLATIONS
Fund Name Issued Cancelled Issued Cancelled
2015 2014
SIM MANAGED MODERATE AGGRESSIVE FUND OF FUNDS B1Number 10 964 833 3 475 548 7 979 518 2 512 087 Consideration (in Rands) 226 868 397 72 036 025 153 917 916 48 761 573
SIM MANAGED MODERATE AGGRESSIVE FUND OF FUNDS B2Number 338 268 1 105 544 471 629 626 388 Consideration (in Rands) 6 933 822 22 861 478 9 061 908 12 150 296
SIM MANAGED MODERATE AGGRESSIVE FUND OF FUNDS B3Number 13 212 233 - - Consideration (in Rands) 279 880 4 857 - -
SIM MANAGED MODERATE AGGRESSIVE FUND OF FUNDS B4Number 3 737 167 - - Consideration (in Rands) 76 298 3 453 - -
SIM MANAGED MODERATE AGGRESSIVE FUND OF FUNDS B5Number 853 620 555 305 700 617 125 366 Consideration (in Rands) 17 847 958 11 637 744 13 889 001 2 487 022
SIM MANAGED MODERATE AGGRESSIVE FUND OF FUNDS B9Number 390 250 1 549 499 1 355 187 993 588 Consideration (in Rands) 8 045 533 32 391 707 25 854 496 19 563 525
SIM MANAGED MODERATE FUND OF FUNDS A1Number 2 914 518 2 573 470 2 552 297 1 138 660 Consideration (in Rands) 59 343 153 52 851 915 48 879 696 21 904 643
SIM MANAGED MODERATE FUND OF FUNDS A2Number 9 037 1 732 - - Consideration (in Rands) 187 544 35 234 - -
SIM MANAGED MODERATE FUND OF FUNDS B1Number 23 634 678 16 609 004 24 264 570 11 175 641 Consideration (in Rands) 481 352 241 341 314 672 464 919 191 215 792 197
SIM MANAGED MODERATE FUND OF FUNDS B2Number 1 405 862 1 994 682 1 016 266 944 038 Consideration (in Rands) 28 557 462 40 649 469 19 331 742 18 054 665
SIM MANAGED MODERATE FUND OF FUNDS B3Number 146 224 354 114 192 801 296 254 Consideration (in Rands) 2 986 683 7 244 530 3 722 160 5 832 380
SIM MANAGED MODERATE FUND OF FUNDS B4Number 476 755 380 504 587 882 278 567 Consideration (in Rands) 9 756 010 7 772 029 11 238 904 5 320 538
SIM MANAGED MODERATE FUND OF FUNDS B5Number 1 106 992 220 732 972 996 60 650 Consideration (in Rands) 22 798 623 4 545 159 18 799 757 1 186 794
SIM MANAGED MODERATE FUND OF FUNDS B6Number 5 682 154 - - Consideration (in Rands) 117 649 3 117 - -
SIM MANAGED MODERATE FUND OF FUNDS B7Number 100 51 - - Consideration (in Rands) 2 000 1 014 - -
238
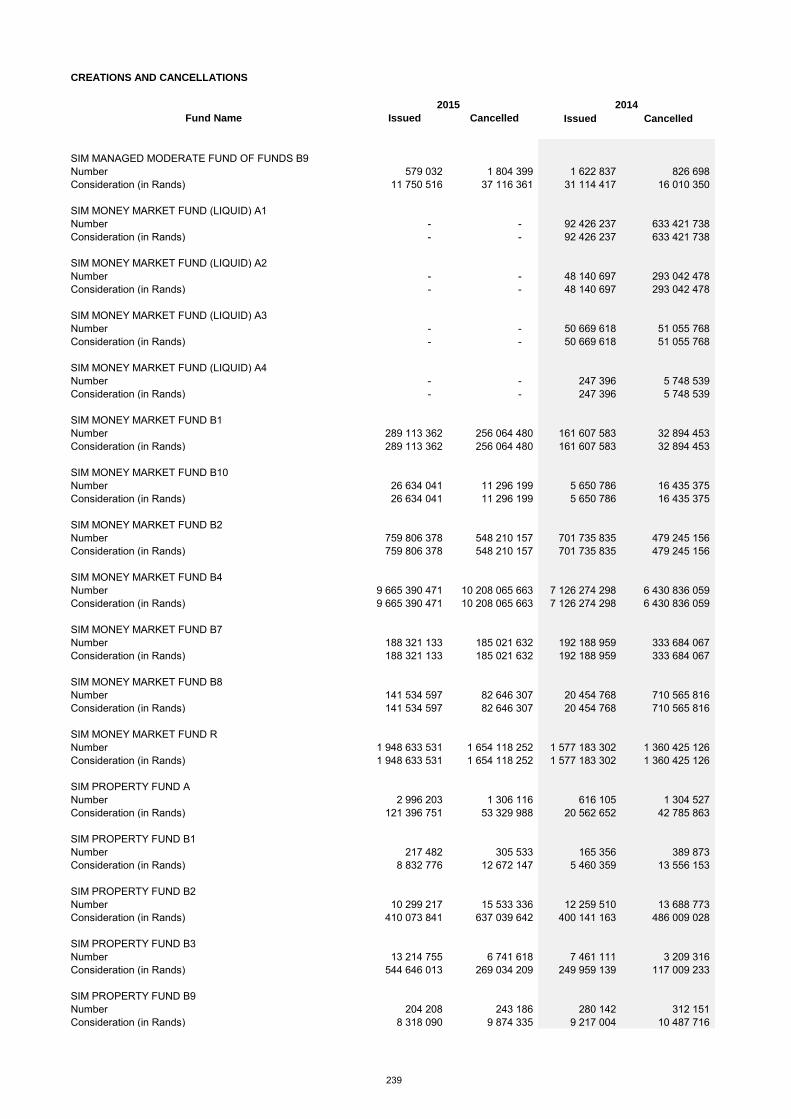
CREATIONS AND CANCELLATIONS
Fund Name Issued Cancelled Issued Cancelled
2015 2014
SIM MANAGED MODERATE FUND OF FUNDS B9Number 579 032 1 804 399 1 622 837 826 698 Consideration (in Rands) 11 750 516 37 116 361 31 114 417 16 010 350
SIM MONEY MARKET FUND (LIQUID) A1Number - - 92 426 237 633 421 738 Consideration (in Rands) - - 92 426 237 633 421 738
SIM MONEY MARKET FUND (LIQUID) A2Number - - 48 140 697 293 042 478 Consideration (in Rands) - - 48 140 697 293 042 478
SIM MONEY MARKET FUND (LIQUID) A3Number - - 50 669 618 51 055 768 Consideration (in Rands) - - 50 669 618 51 055 768
SIM MONEY MARKET FUND (LIQUID) A4Number - - 247 396 5 748 539 Consideration (in Rands) - - 247 396 5 748 539
SIM MONEY MARKET FUND B1Number 289 113 362 256 064 480 161 607 583 32 894 453 Consideration (in Rands) 289 113 362 256 064 480 161 607 583 32 894 453
SIM MONEY MARKET FUND B10Number 26 634 041 11 296 199 5 650 786 16 435 375 Consideration (in Rands) 26 634 041 11 296 199 5 650 786 16 435 375
SIM MONEY MARKET FUND B2Number 759 806 378 548 210 157 701 735 835 479 245 156 Consideration (in Rands) 759 806 378 548 210 157 701 735 835 479 245 156
SIM MONEY MARKET FUND B4Number 9 665 390 471 10 208 065 663 7 126 274 298 6 430 836 059 Consideration (in Rands) 9 665 390 471 10 208 065 663 7 126 274 298 6 430 836 059
SIM MONEY MARKET FUND B7Number 188 321 133 185 021 632 192 188 959 333 684 067 Consideration (in Rands) 188 321 133 185 021 632 192 188 959 333 684 067
SIM MONEY MARKET FUND B8Number 141 534 597 82 646 307 20 454 768 710 565 816 Consideration (in Rands) 141 534 597 82 646 307 20 454 768 710 565 816
SIM MONEY MARKET FUND RNumber 1 948 633 531 1 654 118 252 1 577 183 302 1 360 425 126 Consideration (in Rands) 1 948 633 531 1 654 118 252 1 577 183 302 1 360 425 126
SIM PROPERTY FUND ANumber 2 996 203 1 306 116 616 105 1 304 527 Consideration (in Rands) 121 396 751 53 329 988 20 562 652 42 785 863
SIM PROPERTY FUND B1Number 217 482 305 533 165 356 389 873 Consideration (in Rands) 8 832 776 12 672 147 5 460 359 13 556 153
SIM PROPERTY FUND B2Number 10 299 217 15 533 336 12 259 510 13 688 773 Consideration (in Rands) 410 073 841 637 039 642 400 141 163 486 009 028
SIM PROPERTY FUND B3Number 13 214 755 6 741 618 7 461 111 3 209 316 Consideration (in Rands) 544 646 013 269 034 209 249 959 139 117 009 233
SIM PROPERTY FUND B9Number 204 208 243 186 280 142 312 151 Consideration (in Rands) 8 318 090 9 874 335 9 217 004 10 487 716
239

CREATIONS AND CANCELLATIONS
Fund Name Issued Cancelled Issued Cancelled
2015 2014
SIM RESOURCES FUNDNumber 10 741 310 12 132 725 10 672 295 9 381 109 Consideration (in Rands) 49 744 614 54 308 415 62 514 449 54 762 114
SIM SMALL CAP FUND ANumber 434 162 375 007 248 688 241 215 Consideration (in Rands) 25 799 788 22 297 673 13 214 220 12 651 403
SIM SMALL CAP FUND B1Number 3 149 83 699 8 072 66 756 Consideration (in Rands) 188 071 5 083 553 419 461 3 525 192
SIM SMALL CAP FUND B2Number 9 154 16 051 11 955 30 238 Consideration (in Rands) 549 831 971 615 613 685 1 514 500
SIM SMALL CAP FUND B3Number 907 999 343 509 662 960 223 525 Consideration (in Rands) 54 560 559 20 688 291 34 873 752 11 610 522
SIM SMALL CAP FUND B9Number 5 482 9 716 8 582 1 381 Consideration (in Rands) 325 500 587 146 440 573 72 989
SIM SMALL CAP FUND RNumber 112 120 322 474 218 475 240 712 Consideration (in Rands) 6 731 356 19 498 322 11 591 378 12 559 014
SIM TOP CHOICE EQUITY FUND A1Number 1 315 120 743 565 2 532 888 1 835 124 Consideration (in Rands) 39 108 091 22 094 248 71 166 199 52 321 173
SIM TOP CHOICE EQUITY FUND A2Number 36 36 - - Consideration (in Rands) 1 000 1 012 - -
SIM TOP CHOICE EQUITY FUND B1Number 3 173 311 592 938 4 275 096 - Consideration (in Rands) 91 165 066 18 184 040 118 309 701 -
SIM TOP CHOICE EQUITY FUND B2Number 5 846 19 263 3 719 64 060 Consideration (in Rands) 174 318 575 476 99 839 1 701 039
SIM TOP CHOICE EQUITY FUND B4Number 1 060 283 767 665 2 957 456 697 058 Consideration (in Rands) 31 699 693 22 073 916 84 868 997 19 477 714
SIM TOP CHOICE EQUITY FUND B5Number 513 956 450 216 564 884 500 625 Consideration (in Rands) 15 205 701 13 412 253 15 594 651 13 863 804
SIM TOP CHOICE EQUITY FUND B6Number 36 36 - - Consideration (in Rands) 1 000 1 012 - -
SIM TOP CHOICE EQUITY FUND B9Number 114 203 84 855 194 256 56 256 Consideration (in Rands) 3 426 278 2 510 514 5 430 213 1 587 736
SIM TOP CHOICE EQUITY FUND CNumber 196 215 268 901 223 238 321 831 Consideration (in Rands) 5 797 134 7 940 180 6 229 295 8 710 432
SIM VALUE FUNDNumber 1 310 624 8 685 952 1 927 250 9 329 220 Consideration (in Rands) 46 282 788 312 429 043 66 206 365 328 506 254
240
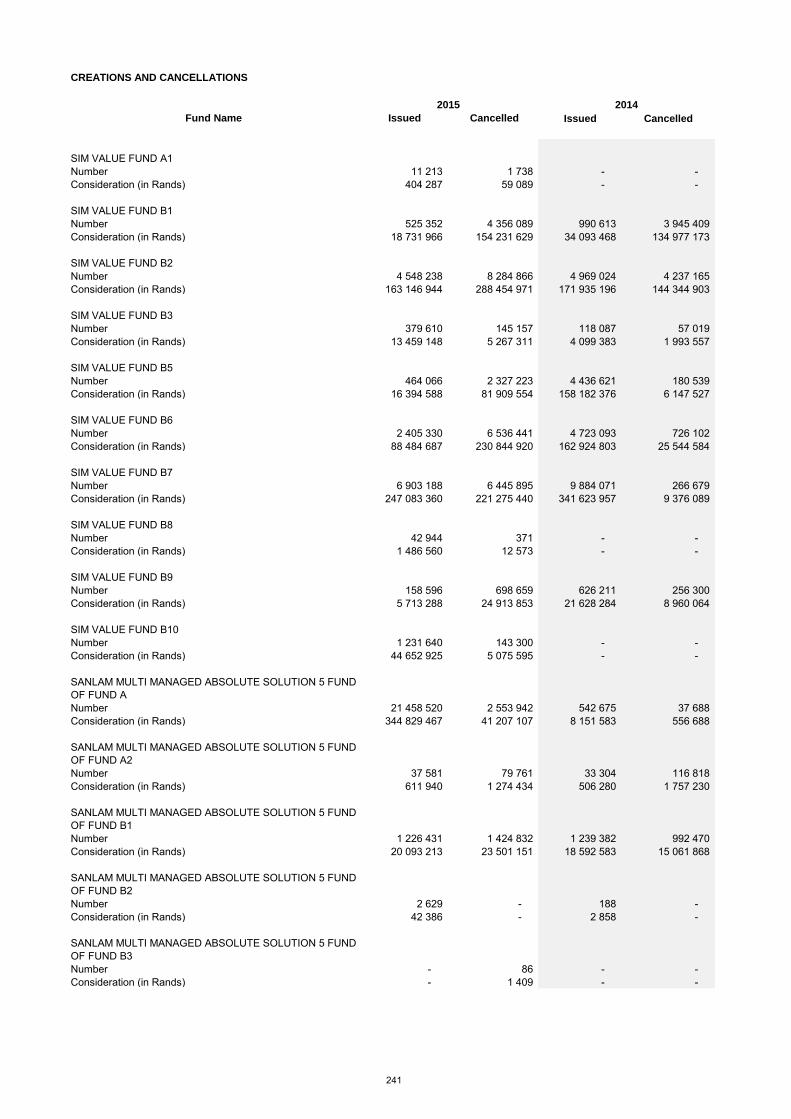
CREATIONS AND CANCELLATIONS
Fund Name Issued Cancelled Issued Cancelled
2015 2014
SIM VALUE FUND A1Number 11 213 1 738 - - Consideration (in Rands) 404 287 59 089 - -
SIM VALUE FUND B1Number 525 352 4 356 089 990 613 3 945 409 Consideration (in Rands) 18 731 966 154 231 629 34 093 468 134 977 173
SIM VALUE FUND B2Number 4 548 238 8 284 866 4 969 024 4 237 165 Consideration (in Rands) 163 146 944 288 454 971 171 935 196 144 344 903
SIM VALUE FUND B3Number 379 610 145 157 118 087 57 019 Consideration (in Rands) 13 459 148 5 267 311 4 099 383 1 993 557
SIM VALUE FUND B5Number 464 066 2 327 223 4 436 621 180 539 Consideration (in Rands) 16 394 588 81 909 554 158 182 376 6 147 527
SIM VALUE FUND B6Number 2 405 330 6 536 441 4 723 093 726 102 Consideration (in Rands) 88 484 687 230 844 920 162 924 803 25 544 584
SIM VALUE FUND B7Number 6 903 188 6 445 895 9 884 071 266 679 Consideration (in Rands) 247 083 360 221 275 440 341 623 957 9 376 089
SIM VALUE FUND B8Number 42 944 371 - - Consideration (in Rands) 1 486 560 12 573 - -
SIM VALUE FUND B9Number 158 596 698 659 626 211 256 300 Consideration (in Rands) 5 713 288 24 913 853 21 628 284 8 960 064
SIM VALUE FUND B10Number 1 231 640 143 300 - - Consideration (in Rands) 44 652 925 5 075 595 - -
SANLAM MULTI MANAGED ABSOLUTE SOLUTION 5 FUND OF FUND A Number 21 458 520 2 553 942 542 675 37 688 Consideration (in Rands) 344 829 467 41 207 107 8 151 583 556 688
SANLAM MULTI MANAGED ABSOLUTE SOLUTION 5 FUND OF FUND A2 Number 37 581 79 761 33 304 116 818 Consideration (in Rands) 611 940 1 274 434 506 280 1 757 230
SANLAM MULTI MANAGED ABSOLUTE SOLUTION 5 FUND OF FUND B1 Number 1 226 431 1 424 832 1 239 382 992 470 Consideration (in Rands) 20 093 213 23 501 151 18 592 583 15 061 868
SANLAM MULTI MANAGED ABSOLUTE SOLUTION 5 FUND OF FUND B2 Number 2 629 - 188 - Consideration (in Rands) 42 386 - 2 858 -
SANLAM MULTI MANAGED ABSOLUTE SOLUTION 5 FUND OF FUND B3 Number - 86 - - Consideration (in Rands) - 1 409 - -
241

CREATIONS AND CANCELLATIONS
Fund Name Issued Cancelled Issued Cancelled
2015 2014
SANLAM MULTI MANAGED ABSOLUTE SOLUTION 5 FUND OF FUND B4 Number 2 662 127 1 633 788 3 438 295 670 423 Consideration (in Rands) 43 992 936 26 804 772 52 627 625 10 097 261
SANLAM MULTI MANAGED ABSOLUTE SOLUTION 5 FUND OF FUND B9 Number 96 359 208 161 77 945 283 785 Consideration (in Rands) 1 591 148 3 444 870 1 158 478 4 247 154
SANLAM MULTI MANAGED ABSOLUTE SOLUTION 5 FUND OF FUND C Number 7 224 674 - 8 Consideration (in Rands) 115 284 10 827 7 113
SANLAM MULTI MANAGED ABSOLUTE SOLUTION 5 FUND OF FUND C2 Number 11 894 115 990 21 780 71 196 Consideration (in Rands) 193 266 1 922 498 325 504 1 065 948
SANLAM MULTI MANAGED AGGRESSIVE FUND OF FUNDS A1Number 45 176 32 849 26 708 9 534 Consideration (in Rands) 803 666 582 917 447 924 158 221
SANLAM MULTI MANAGED AGGRESSIVE FUND OF FUNDS A2Number 1 158 693 272 448 Consideration (in Rands) 20 113 12 283 4 535 7 604
SANLAM MULTI MANAGED AGGRESSIVE FUND OF FUNDS B1Number 758 653 860 261 914 046 533 576 Consideration (in Rands) 13 380 136 15 219 709 15 069 316 8 931 917
SANLAM MULTI MANAGED AGGRESSIVE FUND OF FUNDS B9Number 162 224 234 413 87 443 661 903 Consideration (in Rands) 2 895 876 4 177 363 1 450 924 10 737 197
SANLAM MULTI MANAGED AGGRESSIVE FUND OF FUNDS C1Number 70 914 385 684 77 972 357 389 Consideration (in Rands) 1 255 990 6 828 912 1 252 028 5 945 862
SANLAM MULTI MANAGED BALANCED FUND OF FUNDS A Number 1 604 388 667 034 320 022 408 576 Consideration (in Rands) 79 544 927 33 114 558 14 326 473 18 304 637
SANLAM MULTI MANAGED BALANCED FUND OF FUNDS A2 Number 33 163 1 014 390 748 Consideration (in Rands) 1 674 555 51 376 17 182 33 775
SANLAM MULTI MANAGED BALANCED FUND OF FUNDS B Number 15 - 14 - Consideration (in Rands) 734 - 630 1
SANLAM MULTI MANAGED BALANCED FUND OF FUNDS B2 Number 33 594 774 3 362 097 77 176 4 410 Consideration (in Rands) 1 672 475 729 169 190 367 3 595 905 199 450
242

CREATIONS AND CANCELLATIONS
Fund Name Issued Cancelled Issued Cancelled
2015 2014
SANLAM MULTI MANAGED BALANCED FUND OF FUNDS B3 Number 265 681 563 197 303 925 444 680 Consideration (in Rands) 13 061 200 28 004 221 13 483 071 19 830 038
SANLAM MULTI MANAGED BALANCED FUND OF FUNDS B9Number - 32 - - Consideration (in Rands) - 1 614 - -
SANLAM MULTI MANAGED BALANCED FUND OF FUNDS C1Number 33 590 214 - - Consideration (in Rands) 1 670 969 10 577 - -
SMMI BOND FUND B1Number 10 363 058 7 243 682 22 893 530 13 922 096 Consideration (in Rands) 64 713 792 46 245 090 147 989 187 90 212 335
SMMI BOND FUND B2Number 2 166 823 779 319 613 844 2 807 384 642 1 248 638 594 Consideration (in Rands) 1 054 313 748 156 346 457 1 349 004 167 618 251 154
SMMI BOND FUND B3Number 593 108 228 264 2 318 236 219 242 Consideration (in Rands) 3 823 587 1 462 558 15 016 858 1 421 657
SANLAM MULTI MANAGED CAUTIOUS FUND OF FUNDS A1Number 122 067 68 736 58 944 48 383 Consideration (in Rands) 1 607 252 907 421 728 086 602 403
SANLAM MULTI MANAGED CAUTIOUS FUND OF FUNDS A2Number 45 127 15 15 Consideration (in Rands) 576 1 626 191 191
SANLAM MULTI MANAGED CAUTIOUS FUND OF FUNDS B1Number 1 201 377 612 824 450 613 631 326 Consideration (in Rands) 15 582 820 7 931 310 5 482 721 7 693 953
SANLAM MULTI MANAGED CAUTIOUS FUND OF FUNDS B9Number 1 457 987 1 530 667 572 606 1 253 343 Consideration (in Rands) 19 132 924 20 160 149 7 097 064 15 461 632
SANLAM MULTI MANAGED CAUTIOUS FUND OF FUNDS C1Number 352 702 1 173 670 326 395 761 287 Consideration (in Rands) 4 610 081 15 332 108 3 995 587 9 373 781
SANLAM MULTI MANAGED CONSERVATIVE FUND OF FUNDS A1Number 11 123 11 515 25 688 49 424 Consideration (in Rands) 131 120 136 107 292 080 570 710
SANLAM MULTI MANAGED CONSERVATIVE FUND OF FUNDS A2Number 10 101 13 160 Consideration (in Rands) 119 1 200 147 1 833
SANLAM MULTI MANAGED CONSERVATIVE FUND OF FUNDS B1Number 141 442 176 183 109 935 310 824 Consideration (in Rands) 1 649 171 2 062 664 1 239 776 3 512 319
243

CREATIONS AND CANCELLATIONS
Fund Name Issued Cancelled Issued Cancelled
2015 2014
SANLAM MULTI MANAGED CONSERVATIVE FUND OF FUNDS B9Number 1 905 697 7 614 527 1 730 491 10 253 853 Consideration (in Rands) 22 271 358 89 748 456 19 591 544 117 028 286
SANLAM MULTI MANAGED CONSERVATIVE FUND OF FUNDS C1Number 390 535 2 744 621 370 857 4 088 698 Consideration (in Rands) 4 566 998 32 279 281 4 203 211 46 575 631
SANLAM MULTI MANAGED DEFENSIVE FUND OF FUNDSNumber 964 788 1 010 211 466 079 926 270 Consideration (in Rands) 24 247 731 25 519 709 11 151 876 22 304 993
SANLAM MULTI MANAGED DEFENSIVE FUND OF FUNDS A2Number 2 648 7 964 1 477 146 Consideration (in Rands) 67 304 204 847 35 063 3 482
SANLAM MULTI MANAGED DEFENSIVE FUND OF FUNDS B2Number 15 803 484 750 904 9 014 2 673 Consideration (in Rands) 402 767 336 19 101 479 221 941 65 003
SANLAM MULTI MANAGED DEFENSIVE FUND OF FUNDS B3 Number 126 121 343 031 119 272 223 561 Consideration (in Rands) 3 172 083 8 730 027 2 868 889 5 399 955
SANLAM MULTI MANAGED DEFENSIVE FUND OF FUNDS B9 Number - 54 - - Consideration (in Rands) - 1 369 - -
SANLAM MULTI MANAGED EQUITY FUND B1Number 2 011 029 2 436 606 3 581 882 40 167 671 Consideration (in Rands) 37 605 482 46 660 000 64 290 278 719 063 018
SANLAM MULTI MANAGED EQUITY FUND B6Number 7 299 6 - Consideration (in Rands) 125 5 460 114 -
SANLAM MULTI MANAGED EQUITY FUND B8Number 3 503 10 338 5 721 136 994 Consideration (in Rands) 65 808 195 769 102 822 2 525 767
SANLAM MULTI MANAGED EQUITY FUND B9Number 27 816 2 701 419 2 024 200 11 924 109 Consideration (in Rands) 509 589 50 498 897 36 527 311 221 583 472
SANLAM MULTI MANAGED EQUITY FUND B10Number - 80 - - Consideration (in Rands) - 1 518 - -
SANLAM MULTI MANAGED EQUITY FUND OF FUNDSNumber 49 572 175 851 41 993 133 097 Consideration (in Rands) 3 303 582 11 853 629 2 694 500 8 610 954
SANLAM MULTI MANAGED EQUITY FUND OF FUNDS A2 Number 177 1 32 61 Consideration (in Rands) 11 978 75 2 049 3 899
SANLAM MULTI MANAGED EQUITY FUND OF FUNDS B2 Number 801 - 956 20 Consideration (in Rands) 53 883 - 59 447 1 260
244

CREATIONS AND CANCELLATIONS
Fund Name Issued Cancelled Issued Cancelled
2015 2014
SANLAM MULTI MANAGED EQUITY FUND OF FUNDS B3 Number 4 202 9 229 381 821 819 219 Consideration (in Rands) 283 290 630 860 25 658 081 54 717 480
SANLAM MULTI MANAGED EQUITY FUND OF FUNDS B9Number - 24 - - Consideration (in Rands) - 1 588 - -
SANLAM MULTI MANAGED EQUITY FUND OF FUNDS C1Number 225 - - - Consideration (in Rands) 14 999 - - -
SANLAM MULTI MANAGED EQUITY INDEX FUND B1Number 8 765 351 15 450 107 4 533 256 2 245 618 Consideration (in Rands) 215 970 383 386 694 511 106 391 636 50 234 590
SANLAM MULTI MANAGED EQUITY INDEX FUND B4Number - 55 - - Consideration (in Rands) - 1 388 - -
SANLAM MULTI MANAGED EQUITY INDEX FUND B5Number 49 164 219 426 210 147 134 222 Consideration (in Rands) 1 199 124 5 489 025 4 722 955 3 064 788
SANLAM MULTI MANAGED FLEXIBLE EQUITY FUND B3Number 14 238 646 3 594 487 13 813 675 5 144 847 Consideration (in Rands) 279 502 571 71 035 156 229 232 074 89 482 285
SANLAM MULTI MANAGED FLEXIBLE EQUITY FUND B4Number 592 185 2 971 124 2 196 722 5 674 225 Consideration (in Rands) 11 556 009 58 046 080 37 734 280 91 966 429
SANLAM MULTI MANAGED FLEXIBLE EQUITY FUND B7 Number 4 939 594 1 113 663 5 283 084 221 527 Consideration (in Rands) 95 582 254 21 846 599 90 385 805 3 750 000
SANLAM MULTI MANAGED INFLATION LINKED BOND FUND B1Number 489 526 1 584 474 345 639 6 165 865 Consideration (in Rands) 6 133 305 20 058 996 4 034 907 74 013 052
SANLAM MULTI MANAGED INFLATION LINKED BOND FUND B2Number 342 727 1 249 924 1 075 784 3 206 767 Consideration (in Rands) 4 309 358 15 845 539 13 018 255 37 560 347
SANLAM MULTI MANAGED INFLATION LINKED BOND FUND B3Number 17 405 161 33 286 586 10 077 132 75 541 374 Consideration (in Rands) 222 098 517 417 648 223 121 047 879 903 042 881
SANLAM MULTI MANAGED INSTITUTIONAL AGGRESSIVE EQUITY FUND ONE B10Number 24 200 252 384 11 657 1 997 Consideration (in Rands) 1 887 646 20 000 000 767 311 129 925
SANLAM MULTI MANAGED INSTITUTIONAL AGGRESSIVE EQUITY FUND ONE B2Number 12 810 12 835 - - Consideration (in Rands) 1 000 000 1 023 725 - -
245

CREATIONS AND CANCELLATIONS
Fund Name Issued Cancelled Issued Cancelled
2015 2014
SANLAM MULTI MANAGED INSTITUTIONAL AGGRESSIVE EQUITY FUND ONE B4Number - 24 - - Consideration (in Rands) - 1 908 - -
SANLAM MULTI MANAGED INSTITUTIONAL AGGRESSIVE EQUITY FUND ONE B6Number - 24 - - Consideration (in Rands) - 1 917 - -
SANLAM MULTI MANAGED INSTITUTIONAL GENERAL EQUITY FUND TWO B10Number 145 680 1 848 378 941 979 244 881 Consideration (in Rands) 7 037 206 87 876 845 44 929 640 12 177 112
SANLAM MULTI MANAGED INSTITUTIONAL GENERAL EQUITY FUND TWO B11Number 6 621 820 7 939 771 10 477 570 971 260 Consideration (in Rands) 321 604 368 373 368 222 510 294 207 48 522 544
SANLAM MULTI MANAGED INSTITUTIONAL GENERAL EQUITY FUND TWO B2Number - 32 14 526 14 526 Consideration (in Rands) - 1 496 733 700 732 486
SANLAM MULTI MANAGED INSTITUTIONAL GENERAL EQUITY FUND TWO B3Number 6 138 971 10 006 090 20 397 953 6 314 379 Consideration (in Rands) 288 183 233 503 327 113 953 290 559 302 297 115
SANLAM MULTI MANAGED INSTITUTIONAL GENERAL EQUITY FUND TWO B6Number 494 30 153 59 196 29 560 Consideration (in Rands) 23 256 1 394 994 2 767 291 1 465 761
SANLAM MULTI MANAGED INSTITUTIONAL GENERAL EQUITY FUND TWO B9Number - 28 - - Consideration (in Rands) - 465 - -
SANLAM MULTI MANAGED INSTITUTIONAL POSITIVE RETURN FUND FOUR B3Number 17 374 206 9 502 945 7 633 045 9 909 626 Consideration (in Rands) 290 431 284 157 592 478 118 787 435 157 480 460
SANLAM MULTI MANAGED INSTITUTIONAL POSITIVE RETURN FUND FOUR B5Number 5 240 758 1 285 077 1 773 600 3 661 477 Consideration (in Rands) 88 255 921 21 750 311 27 907 199 56 760 000
SANLAM MULTI MANAGED INSTITUTIONAL POSITIVE RETURN FUND FOUR B7Number 1 183 919 5 003 374 2 221 005 8 075 783 Consideration (in Rands) 19 862 734 84 587 533 35 074 023 122 785 609
SANLAM MULTI MANAGED INSTITUTIONAL POSITIVE RETURN FUND FOUR B9Number 11 406 122 604 123 279 17 530 Consideration (in Rands) 193 061 2 081 265 1 991 043 282 904
SANLAM MULTI MANAGED INSTITUTIONAL POSITIVE RETURN FUND THREE B3Number 3 429 702 12 895 712 4 942 780 5 815 357 Consideration (in Rands) 117 560 218 446 908 549 165 121 048 198 382 483
246

CREATIONS AND CANCELLATIONS
Fund Name Issued Cancelled Issued Cancelled
2015 2014
SANLAM MULTI MANAGED INSTITUTIONAL POSITIVE RETURN FUND THREE B3 (RING)Number 4 179 394 4 179 394 - - Consideration (in Rands) 147 656 857 148 222 535 - -
SANLAM MULTI MANAGED INSTITUTIONAL POSITIVE RETURN FUND THREE B5Number 3 154 181 7 915 153 1 456 635 5 152 347 Consideration (in Rands) 62 609 310 154 276 172 27 995 547 102 550 000
SANLAM MULTI MANAGED INSTITUTIONAL POSITIVE RETURN FUND THREE B5 (RING)Number 656 350 656 350 - - Consideration (in Rands) 13 327 583 13 374 811 - -
SANLAM MULTI MANAGED INSTITUTIONAL POSITIVE RETURN FUND THREE B6Number 276 377 665 632 480 315 222 589 Consideration (in Rands) 9 592 035 23 181 422 16 202 610 7 585 335
SANLAM MULTI MANAGED INSTITUTIONAL POSITIVE RETURN FUND THREE B7Number - 32 - - Consideration (in Rands) - 23 - -
SANLAM MULTI MANAGED INSTITUTIONAL POSITIVE RETURN FUND THREE B9Number 1 - - - Consideration (in Rands) 42 15 14 15
SANLAM MULTI MANAGED INSTITUTIONAL POSITIVE RETURN FUND THREE B10Number 66 613 1 999 185 553 458 413 689 Consideration (in Rands) 2 346 554 71 264 904 18 754 887 14 202 013
SANLAM MULTI MANAGED INSTITUTIONAL POSITIVE RETURN FUND TWO B2Number 9 225 471 18 235 682 9 118 175 37 791 729 Consideration (in Rands) 137 981 675 272 770 855 135 350 382 559 198 588
SANLAM MULTI MANAGED INSTITUTIONAL POSITIVE RETURN FUND TWO B4Number 1 486 916 417 538 1 447 514 4 135 645 Consideration (in Rands) 22 203 746 6 243 128 21 473 057 61 253 850
SANLAM MULTI MANAGED INSTITUTIONAL POSITIVE RETURN FUND TWO B6Number - 67 - - Consideration (in Rands) - 1 012 - -
SANLAM MULTI MANAGED INSTITUTIONAL POSITIVE RETURN FUND TWO B8Number - 19 1 488 Consideration (in Rands) - 280 14 7 269
SANLAM MULTI MANAGED INSTITUTIONAL POSITIVE RETURN FUND TWO B10Number 275 276 3 138 676 974 237 1 447 834 Consideration (in Rands) 4 112 659 47 045 778 14 457 277 21 460 007
SANLAM MULTI MANAGED INSTITUTIONAL PRUDENTIAL BALANCED FUND ONE B1Number 4 244 936 87 554 4 209 374 32 319 Consideration (in Rands) 58 284 792 1 211 206 51 379 176 396 176
247

CREATIONS AND CANCELLATIONS
Fund Name Issued Cancelled Issued Cancelled
2015 2014
SANLAM MULTI MANAGED INSTITUTIONAL PRUDENTIAL BALANCED FUND ONE B2Number - 100 - - Consideration (in Rands) - 1 411 - -
SANLAM MULTI MANAGED INSTITUTIONAL PRUDENTIAL BALANCED FUND ONE B3Number 6 672 387 7 131 921 2 084 856 1 287 976 Consideration (in Rands) 93 676 052 101 119 747 25 308 469 15 696 017
SANLAM MULTI MANAGED INSTITUTIONAL PRUDENTIAL INCOME PROVIDER FUND TWO B1Number 37 821 402 70 646 621 39 953 089 97 600 533 Consideration (in Rands) 389 641 787 729 736 999 407 918 592 991 411 378
SANLAM MULTI MANAGED INSTITUTIONAL PRUDENTIAL INCOME PROVIDER FUND TWO B2Number 4 014 101 2 960 982 4 375 209 14 537 259 Consideration (in Rands) 41 291 690 30 516 895 44 308 896 148 270 780
SANLAM MULTI MANAGED INSTITUTIONAL PRUDENTIAL INCOME PROVIDER FUND TWO B3Number - 100 - - Consideration (in Rands) - 1 023 - -
SANLAM MULTI MANAGED LONG TERM GROWTH SOLUTION 7 FUND OF FUNDS A Number 1 245 209 2 083 989 635 177 19 560 Consideration (in Rands) 21 734 835 37 218 085 10 725 605 315 453
SANLAM MULTI MANAGED LONG TERM GROWTH SOLUTION 7 FUND OF FUNDS A RINGNumber 2 020 274 2 020 274 - - Consideration (in Rands) 36 056 438 36 577 063 - -
SANLAM MULTI MANAGED LONG TERM GROWTH SOLUTION 7 FUND OF FUNDS A2 Number 13 279 38 555 16 286 40 425 Consideration (in Rands) 246 191 726 068 277 343 690 629
SANLAM MULTI MANAGED LONG TERM GROWTH SOLUTION 7 FUND OF FUNDS B1 Number 2 546 388 1 204 832 1 629 355 707 492 Consideration (in Rands) 47 922 528 22 852 578 27 747 867 12 118 359
SANLAM MULTI MANAGED LONG TERM GROWTH SOLUTION 7 FUND OF FUNDS B2 Number 406 1 860 2 818 119 595 Consideration (in Rands) 7 576 34 722 47 654 2 072 581
SANLAM MULTI MANAGED LONG TERM GROWTH SOLUTION 7 FUND OF FUNDS B4 Number 1 355 703 294 856 690 084 125 393 Consideration (in Rands) 25 378 291 5 492 939 11 843 043 2 141 986
SANLAM MULTI MANAGED LONG TERM GROWTH SOLUTION 7 FUND OF FUNDS B9 Number 76 028 508 729 146 404 519 407 Consideration (in Rands) 1 418 344 9 572 517 2 484 310 8 873 458
SANLAM MULTI MANAGED LONG TERM GROWTH SOLUTION 7 FUND OF FUNDS C Number 1 152 114 566 1 263 8 548 Consideration (in Rands) 20 198 2 080 607 20 709 139 417
248
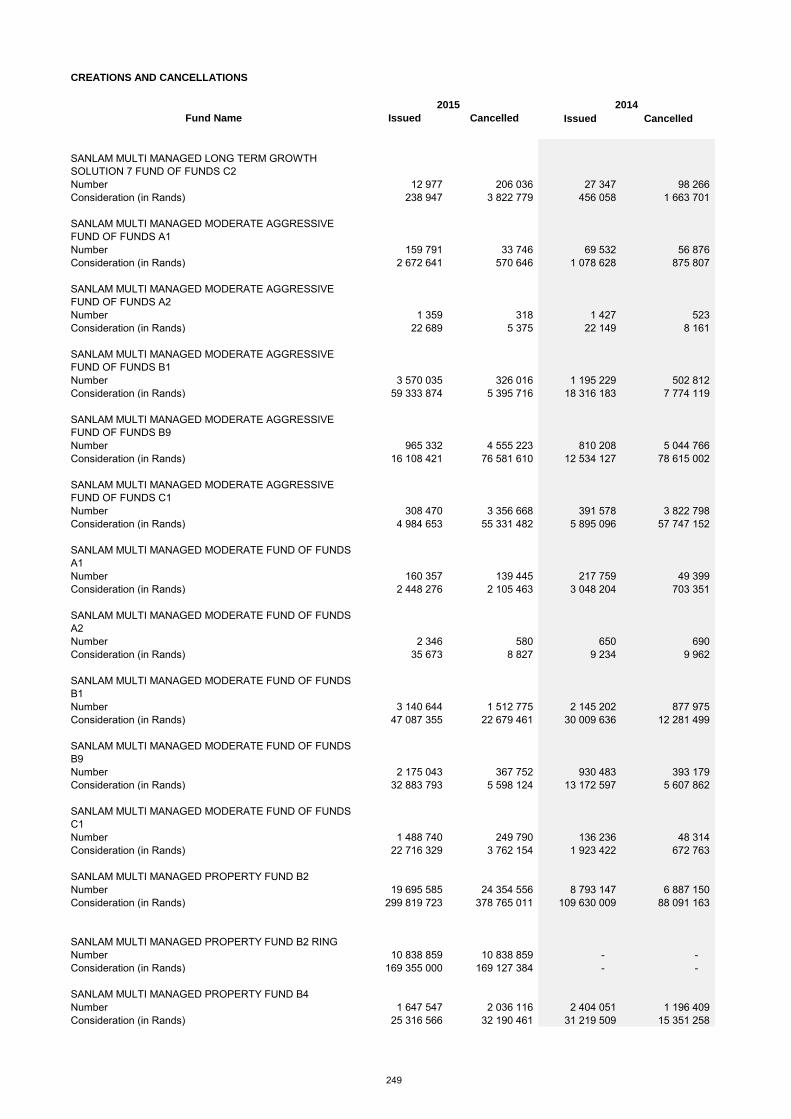
CREATIONS AND CANCELLATIONS
Fund Name Issued Cancelled Issued Cancelled
2015 2014
SANLAM MULTI MANAGED LONG TERM GROWTH SOLUTION 7 FUND OF FUNDS C2Number 12 977 206 036 27 347 98 266 Consideration (in Rands) 238 947 3 822 779 456 058 1 663 701
SANLAM MULTI MANAGED MODERATE AGGRESSIVE FUND OF FUNDS A1Number 159 791 33 746 69 532 56 876 Consideration (in Rands) 2 672 641 570 646 1 078 628 875 807
SANLAM MULTI MANAGED MODERATE AGGRESSIVE FUND OF FUNDS A2Number 1 359 318 1 427 523 Consideration (in Rands) 22 689 5 375 22 149 8 161
SANLAM MULTI MANAGED MODERATE AGGRESSIVE FUND OF FUNDS B1Number 3 570 035 326 016 1 195 229 502 812 Consideration (in Rands) 59 333 874 5 395 716 18 316 183 7 774 119
SANLAM MULTI MANAGED MODERATE AGGRESSIVE FUND OF FUNDS B9Number 965 332 4 555 223 810 208 5 044 766 Consideration (in Rands) 16 108 421 76 581 610 12 534 127 78 615 002
SANLAM MULTI MANAGED MODERATE AGGRESSIVE FUND OF FUNDS C1Number 308 470 3 356 668 391 578 3 822 798 Consideration (in Rands) 4 984 653 55 331 482 5 895 096 57 747 152
SANLAM MULTI MANAGED MODERATE FUND OF FUNDS A1Number 160 357 139 445 217 759 49 399 Consideration (in Rands) 2 448 276 2 105 463 3 048 204 703 351
SANLAM MULTI MANAGED MODERATE FUND OF FUNDS A2Number 2 346 580 650 690 Consideration (in Rands) 35 673 8 827 9 234 9 962
SANLAM MULTI MANAGED MODERATE FUND OF FUNDS B1Number 3 140 644 1 512 775 2 145 202 877 975 Consideration (in Rands) 47 087 355 22 679 461 30 009 636 12 281 499
SANLAM MULTI MANAGED MODERATE FUND OF FUNDS B9Number 2 175 043 367 752 930 483 393 179 Consideration (in Rands) 32 883 793 5 598 124 13 172 597 5 607 862
SANLAM MULTI MANAGED MODERATE FUND OF FUNDS C1Number 1 488 740 249 790 136 236 48 314 Consideration (in Rands) 22 716 329 3 762 154 1 923 422 672 763
SANLAM MULTI MANAGED PROPERTY FUND B2Number 19 695 585 24 354 556 8 793 147 6 887 150 Consideration (in Rands) 299 819 723 378 765 011 109 630 009 88 091 163
SANLAM MULTI MANAGED PROPERTY FUND B2 RINGNumber 10 838 859 10 838 859 - - Consideration (in Rands) 169 355 000 169 127 384 - -
SANLAM MULTI MANAGED PROPERTY FUND B4Number 1 647 547 2 036 116 2 404 051 1 196 409 Consideration (in Rands) 25 316 566 32 190 461 31 219 509 15 351 258
249

CREATIONS AND CANCELLATIONS
Fund Name Issued Cancelled Issued Cancelled
2015 2014
SANLAM MULTI MANAGED PROPERTY FUND B6Number 1 130 018 1 030 438 1 219 862 1 080 194 Consideration (in Rands) 17 109 661 16 129 000 14 795 454 13 846 000
SANLAM MULTI MANAGED PROPERTY FUND B8Number 3 633 432 2 634 091 844 113 1 370 893 Consideration (in Rands) 55 378 179 40 213 725 10 278 435 18 316 927
SANLAM MULTI MANAGED PROTECTION SOLUTION 3 FUND OF FUNDS A Number 775 231 1 104 698 395 220 2 408 Consideration (in Rands) 10 593 164 15 335 667 5 200 288 31 140
SANLAM MULTI MANAGED PROTECTION SOLUTION 3 FUND OF FUNDS A Number 1 049 334 1 049 334 - - Consideration (in Rands) 14 546 605 14 731 393 - -
SANLAM MULTI MANAGED PROTECTION SOLUTION 3 FUND OF FUNDS A2 Number 14 454 32 265 24 315 19 112 Consideration (in Rands) 203 880 461 400 323 252 252 160
SANLAM MULTI MANAGED PROTECTION SOLUTION 3 FUND OF FUNDS B1 Number 1 225 099 916 804 605 637 537 767 Consideration (in Rands) 17 464 351 13 193 717 7 983 394 7 067 754
SANLAM MULTI MANAGED PROTECTION SOLUTION 3 FUND OF FUNDS B3 Number - 91 - - Consideration (in Rands) - 1 289 - -
SANLAM MULTI MANAGED PROTECTION SOLUTION 3 FUND OF FUNDS B4 Number 944 252 1 097 791 1 329 659 815 723 Consideration (in Rands) 13 451 090 15 661 031 17 698 193 10 824 143
SANLAM MULTI MANAGED PROTECTION SOLUTION 3 FUND OF FUNDS B9Number 69 555 31 344 38 311 39 167 Consideration (in Rands) 989 511 448 748 509 843 515 276
SANLAM MULTI MANAGED PROTECTION SOLUTION 3 FUND OF FUNDS C Number 2 097 1 087 3 028 102 835 Consideration (in Rands) 29 111 115 485 39 281 1 339 240
SANLAM MULTI MANAGED PROTECTION SOLUTION 3 FUND OF FUNDS C2Number 602 67 103 4 944 34 222 Consideration (in Rands) 8 420 939 738 66 161 455 349
SANLAM MULTI MANAGED INSTITUTIONAL YIELD PLUS FUND TWO B2Number 2 102 798 7 745 750 3 977 904 15 021 724 Consideration (in Rands) 25 840 398 95 514 214 48 851 768 184 500 699
SANLAM MULTI MANAGED INSTITUTIONAL YIELD PLUS FUND TWO B6Number 4 708 58 068 1 339 826 Consideration (in Rands) 46 8 713 711 209 16 473 886
SANLAM MULTI MANAGED INSTITUTIONAL YIELD PLUS FUND TWO B8Number 102 901 522 711 313 031 309 958 Consideration (in Rands) 1 265 184 6 436 710 3 842 203 3 809 400
250

CREATIONS AND CANCELLATIONS
Fund Name Issued Cancelled Issued Cancelled
2015 2014
SPI EQUITY FUND A1Number 425 848 364 810 1 311 297 178 382 Consideration (in Rands) 7 527 645 6 462 138 21 217 961 2 848 929
SPI EQUITY FUND B1Number 669 026 292 155 316 476 252 604 Consideration (in Rands) 11 732 600 5 162 072 5 090 974 4 027 445
SPI EQUITY FUND B2Number 496 760 68 676 577 212 54 423 Consideration (in Rands) 8 697 414 1 216 867 9 459 795 881 025
TRESCOR SCI BALANCED FUND B1Number 32 463 031 991 135 - - Consideration (in Rands) 341 698 816 10 619 469 - -
TRESCOR SCI BALANCED FUND B2Number 100 - - - Consideration (in Rands) 1 000 - - -
TRESCOR SCI FLEXIBLE FUND B1Number 8 433 519 840 088 - - Consideration (in Rands) 90 616 935 9 225 940 - -
TRESCOR SCI FLEXIBLE FUND B2Number 6 122 513 600 510 - - Consideration (in Rands) 66 050 929 10 259 089 - -
TRESCOR SCI INCOME FUND B1Number 1 640 883 480 561 - - Consideration (in Rands) 16 752 324 4 944 373 - -
TRESCOR SCI INCOME FUND B2Number 5 838 548 281 101 - - Consideration (in Rands) 59 683 312 2 837 836 - -
TRESCOR SCI STABLE FUND B1Number 20 098 357 1 431 849 - - Consideration (in Rands) 208 181 114 15 150 067 - -
TRESCOR SCI STABLE FUND B2Number 100 - - - Consideration (in Rands) 1 000 - - -
251

QUARTERLY REVIEW OF FLUCTUATIONS OF UNIT PRICES (IN CENTS)
Fund Name Maximum Minimum
BRACKENHAM SCI MANAGED FUND
December 2014 quarter 174.14 169.47 March 2015 quarter 178.93 168.94 June 2015 quarter 183.10 176.18 September 2015 quarter 181.58 174.59 December 2015 quarter 188.39 179.34 FIRST AVENUE SCI EQUITY FUND B1
December 2014 quarter 1 695.31 1 498.54 March 2015 quarter 1 761.70 1 580.80 June 2015 quarter 1 822.89 1 682.89 September 2015 quarter 1 759.17 1 566.43 December 2015 quarter 1 841.78 1 611.90 FIRST AVENUE SCI EQUITY FUND B2
December 2014 quarter 1 699.92 1 502.45 March 2015 quarter 1 764.70 1 582.90 June 2015 quarter 1 827.17 1 687.60 September 2015 quarter 1 761.57 1 569.16 December 2015 quarter 1 846.44 1 616.63 FIRST AVENUE SCI EQUITY FUND B3
December 2014 quarter 1 711.52 1 512.34 March 2015 quarter 1 772.50 1 588.37 June 2015 quarter 1 838.25 1 699.77 September 2015 quarter 1 768.27 1 576.17 December 2015 quarter 1 858.42 1 628.38 FIRST AVENUE SCI EQUITY FUND B4
December 2014 quarter - - March 2015 quarter 1 778.70 1 594.64 June 2015 quarter 1 844.78 1 705.89 September 2015 quarter 1 774.21 1 581.49 December 2015 quarter 1 864.63 1 634.25 GRAVITON SCI BALANCED FUND A1
December 2014 quarter 1 379.16 1 293.63 March 2015 quarter 1 432.86 1 340.47 June 2015 quarter 1 479.27 1 424.71 September 2015 quarter 1 445.59 1 394.07 December 2015 quarter 1 497.05 1 409.09 GRAVITON SCI BALANCED FUND B1
December 2014 quarter 1 380.61 1 294.81 March 2015 quarter 1 433.90 1 340.70 June 2015 quarter 1 483.40 1 429.08 September 2015 quarter 1 446.37 1 395.02 December 2015 quarter 1 498.98 1 411.74 GRAVITON SCI BALANCED FUND B2
December 2014 quarter - - March 2015 quarter 1 437.75 1 341.26 June 2015 quarter 1 485.27 1 432.98 September 2015 quarter 1 447.39 1 396.66 December 2015 quarter 1 503.50 1 417.19 GRAVITON SCI CAPITAL GROWTH FUND A1
December 2014 quarter 1 171.68 1 117.75 March 2015 quarter 1 206.74 1 146.60 June 2015 quarter 1 232.98 1 194.41 September 2015 quarter 1 213.26 1 176.68 December 2015 quarter 1 258.89 1 190.35 GRAVITON SCI CAPITAL GROWTH FUND B1
December 2014 quarter 1 173.61 1 118.71 March 2015 quarter 1 207.36 1 146.73 June 2015 quarter 1 234.31 1 195.24 September 2015 quarter 1 213.59 1 177.21 December 2015 quarter 1 260.15 1 192.70
Selling price
252
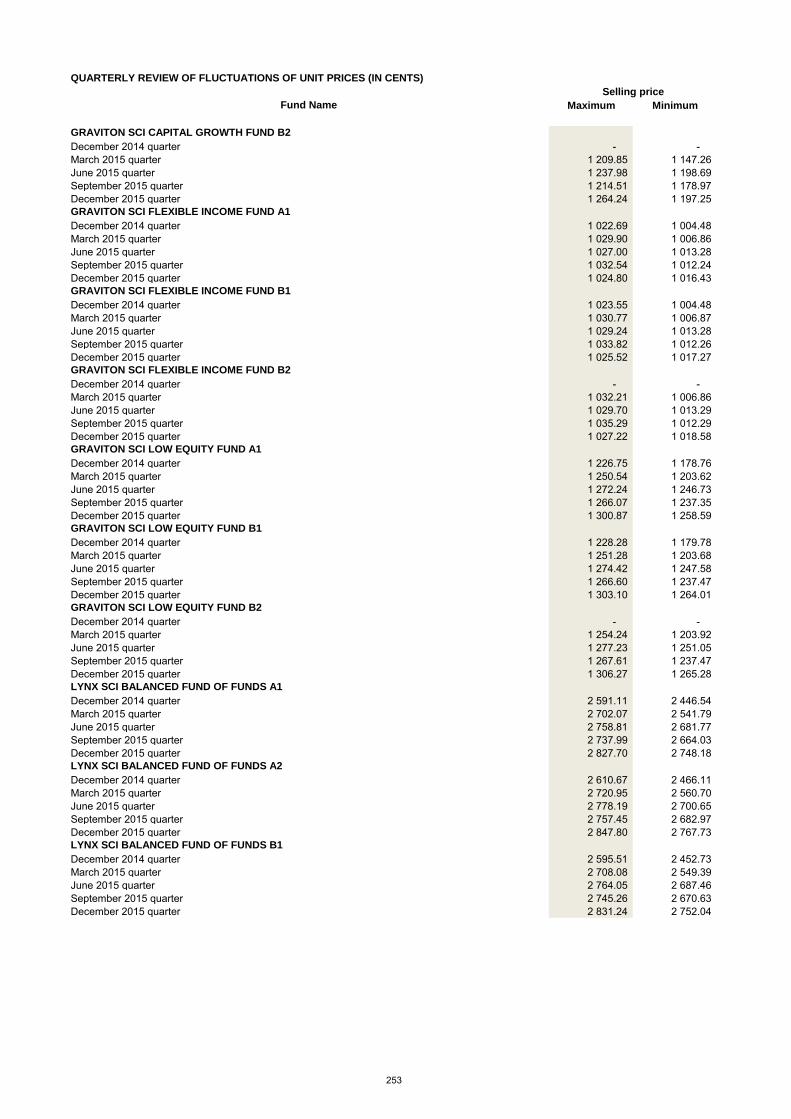
QUARTERLY REVIEW OF FLUCTUATIONS OF UNIT PRICES (IN CENTS)
Fund Name Maximum Minimum
Selling price
GRAVITON SCI CAPITAL GROWTH FUND B2
December 2014 quarter - - March 2015 quarter 1 209.85 1 147.26 June 2015 quarter 1 237.98 1 198.69 September 2015 quarter 1 214.51 1 178.97 December 2015 quarter 1 264.24 1 197.25 GRAVITON SCI FLEXIBLE INCOME FUND A1
December 2014 quarter 1 022.69 1 004.48 March 2015 quarter 1 029.90 1 006.86 June 2015 quarter 1 027.00 1 013.28 September 2015 quarter 1 032.54 1 012.24 December 2015 quarter 1 024.80 1 016.43 GRAVITON SCI FLEXIBLE INCOME FUND B1
December 2014 quarter 1 023.55 1 004.48 March 2015 quarter 1 030.77 1 006.87 June 2015 quarter 1 029.24 1 013.28 September 2015 quarter 1 033.82 1 012.26 December 2015 quarter 1 025.52 1 017.27 GRAVITON SCI FLEXIBLE INCOME FUND B2
December 2014 quarter - - March 2015 quarter 1 032.21 1 006.86 June 2015 quarter 1 029.70 1 013.29 September 2015 quarter 1 035.29 1 012.29 December 2015 quarter 1 027.22 1 018.58 GRAVITON SCI LOW EQUITY FUND A1
December 2014 quarter 1 226.75 1 178.76 March 2015 quarter 1 250.54 1 203.62 June 2015 quarter 1 272.24 1 246.73 September 2015 quarter 1 266.07 1 237.35 December 2015 quarter 1 300.87 1 258.59 GRAVITON SCI LOW EQUITY FUND B1
December 2014 quarter 1 228.28 1 179.78 March 2015 quarter 1 251.28 1 203.68 June 2015 quarter 1 274.42 1 247.58 September 2015 quarter 1 266.60 1 237.47 December 2015 quarter 1 303.10 1 264.01 GRAVITON SCI LOW EQUITY FUND B2
December 2014 quarter - - March 2015 quarter 1 254.24 1 203.92 June 2015 quarter 1 277.23 1 251.05 September 2015 quarter 1 267.61 1 237.47 December 2015 quarter 1 306.27 1 265.28 LYNX SCI BALANCED FUND OF FUNDS A1
December 2014 quarter 2 591.11 2 446.54 March 2015 quarter 2 702.07 2 541.79 June 2015 quarter 2 758.81 2 681.77 September 2015 quarter 2 737.99 2 664.03 December 2015 quarter 2 827.70 2 748.18 LYNX SCI BALANCED FUND OF FUNDS A2
December 2014 quarter 2 610.67 2 466.11 March 2015 quarter 2 720.95 2 560.70 June 2015 quarter 2 778.19 2 700.65 September 2015 quarter 2 757.45 2 682.97 December 2015 quarter 2 847.80 2 767.73 LYNX SCI BALANCED FUND OF FUNDS B1
December 2014 quarter 2 595.51 2 452.73 March 2015 quarter 2 708.08 2 549.39 June 2015 quarter 2 764.05 2 687.46 September 2015 quarter 2 745.26 2 670.63 December 2015 quarter 2 831.24 2 752.04
253
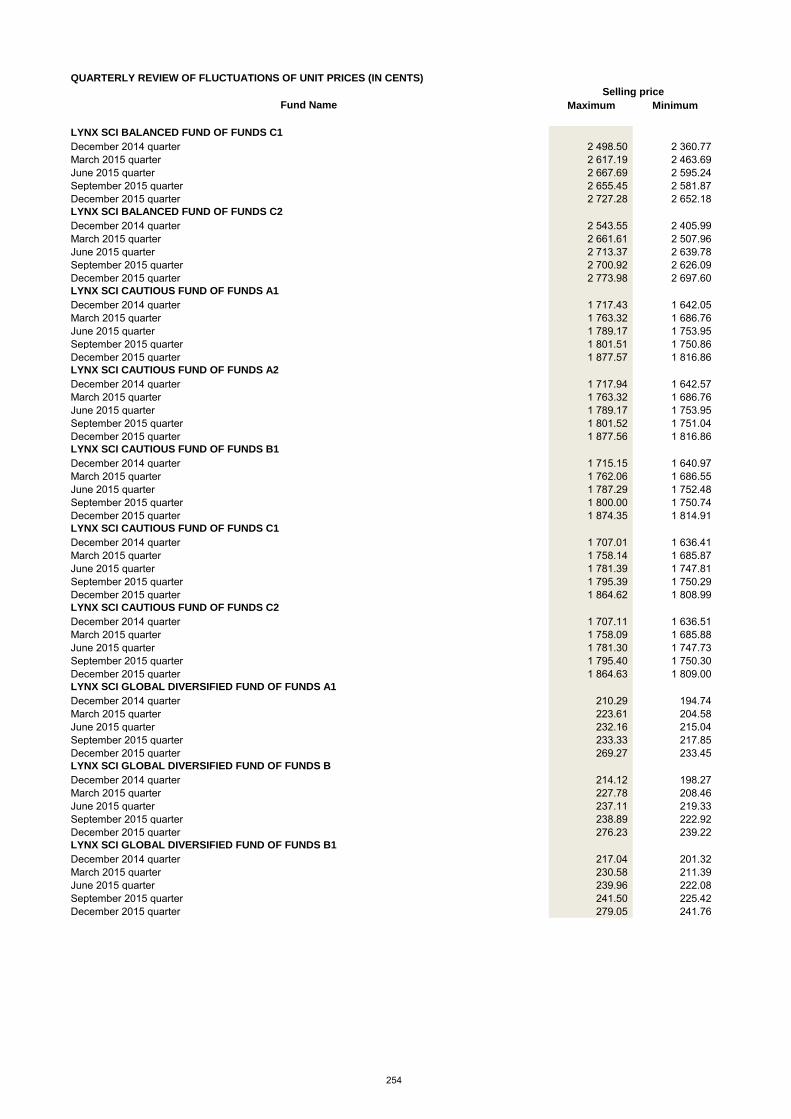
QUARTERLY REVIEW OF FLUCTUATIONS OF UNIT PRICES (IN CENTS)
Fund Name Maximum Minimum
Selling price
LYNX SCI BALANCED FUND OF FUNDS C1
December 2014 quarter 2 498.50 2 360.77 March 2015 quarter 2 617.19 2 463.69 June 2015 quarter 2 667.69 2 595.24 September 2015 quarter 2 655.45 2 581.87 December 2015 quarter 2 727.28 2 652.18 LYNX SCI BALANCED FUND OF FUNDS C2
December 2014 quarter 2 543.55 2 405.99 March 2015 quarter 2 661.61 2 507.96 June 2015 quarter 2 713.37 2 639.78 September 2015 quarter 2 700.92 2 626.09 December 2015 quarter 2 773.98 2 697.60 LYNX SCI CAUTIOUS FUND OF FUNDS A1
December 2014 quarter 1 717.43 1 642.05 March 2015 quarter 1 763.32 1 686.76 June 2015 quarter 1 789.17 1 753.95 September 2015 quarter 1 801.51 1 750.86 December 2015 quarter 1 877.57 1 816.86 LYNX SCI CAUTIOUS FUND OF FUNDS A2
December 2014 quarter 1 717.94 1 642.57 March 2015 quarter 1 763.32 1 686.76 June 2015 quarter 1 789.17 1 753.95 September 2015 quarter 1 801.52 1 751.04 December 2015 quarter 1 877.56 1 816.86 LYNX SCI CAUTIOUS FUND OF FUNDS B1
December 2014 quarter 1 715.15 1 640.97 March 2015 quarter 1 762.06 1 686.55 June 2015 quarter 1 787.29 1 752.48 September 2015 quarter 1 800.00 1 750.74 December 2015 quarter 1 874.35 1 814.91 LYNX SCI CAUTIOUS FUND OF FUNDS C1
December 2014 quarter 1 707.01 1 636.41 March 2015 quarter 1 758.14 1 685.87 June 2015 quarter 1 781.39 1 747.81 September 2015 quarter 1 795.39 1 750.29 December 2015 quarter 1 864.62 1 808.99 LYNX SCI CAUTIOUS FUND OF FUNDS C2
December 2014 quarter 1 707.11 1 636.51 March 2015 quarter 1 758.09 1 685.88 June 2015 quarter 1 781.30 1 747.73 September 2015 quarter 1 795.40 1 750.30 December 2015 quarter 1 864.63 1 809.00 LYNX SCI GLOBAL DIVERSIFIED FUND OF FUNDS A1
December 2014 quarter 210.29 194.74 March 2015 quarter 223.61 204.58 June 2015 quarter 232.16 215.04 September 2015 quarter 233.33 217.85 December 2015 quarter 269.27 233.45 LYNX SCI GLOBAL DIVERSIFIED FUND OF FUNDS B
December 2014 quarter 214.12 198.27 March 2015 quarter 227.78 208.46 June 2015 quarter 237.11 219.33 September 2015 quarter 238.89 222.92 December 2015 quarter 276.23 239.22 LYNX SCI GLOBAL DIVERSIFIED FUND OF FUNDS B1
December 2014 quarter 217.04 201.32 March 2015 quarter 230.58 211.39 June 2015 quarter 239.96 222.08 September 2015 quarter 241.50 225.42 December 2015 quarter 279.05 241.76
254

QUARTERLY REVIEW OF FLUCTUATIONS OF UNIT PRICES (IN CENTS)
Fund Name Maximum Minimum
Selling price
LYNX SCI GLOBAL DIVERSIFIED FUND OF FUNDS C1
December 2014 quarter 208.01 192.63 March 2015 quarter 221.11 202.24 June 2015 quarter 229.19 212.46 September 2015 quarter 230.04 214.82 December 2015 quarter 265.12 230.01 LYNX SCI OPPORTUNITIES FUND OF FUNDS A1
December 2014 quarter 2 580.44 2 370.81 March 2015 quarter 2 745.97 2 497.82 June 2015 quarter 2 850.38 2 723.07 September 2015 quarter 2 792.49 2 587.51 December 2015 quarter 2 853.46 2 613.93 LYNX SCI OPPORTUNITIES FUND OF FUNDS A2
December 2014 quarter 2 579.92 2 370.28 March 2015 quarter 2 745.40 2 497.04 June 2015 quarter 2 849.87 2 722.54 September 2015 quarter 2 791.66 2 586.74 December 2015 quarter 2 852.61 2 613.15 LYNX SCI OPPORTUNITIES FUND OF FUNDS B1
December 2014 quarter 2 571.15 2 363.05 March 2015 quarter 2 738.84 2 491.65 June 2015 quarter 2 842.13 2 715.71 September 2015 quarter 2 785.78 2 580.96 December 2015 quarter 2 844.70 2 604.99 LYNX SCI OPPORTUNITIES FUND OF FUNDS C1
December 2014 quarter 2 487.16 2 284.13 March 2015 quarter 2 651.47 2 409.18 June 2015 quarter 2 748.62 2 626.55 September 2015 quarter 2 698.40 2 498.54 December 2015 quarter 2 747.92 2 513.39 LYNX SCI OPPORTUNITIES FUND OF FUNDS C2
December 2014 quarter 2 481.70 2 278.64 March 2015 quarter 2 646.04 2 403.73 June 2015 quarter 2 742.99 2 621.17 September 2015 quarter 2 692.87 2 493.42 December 2015 quarter 2 742.29 2 508.24 MEGAFIN SCI BALANCED FUND OF FUNDS A1
December 2014 quarter - - March 2015 quarter - - June 2015 quarter - - September 2015 quarter - - December 2015 quarter 1 043.85 100.00 MEGAFIN SCI BALANCED FUND OF FUNDS B1
December 2014 quarter - - March 2015 quarter 1 014.61 998.92 June 2015 quarter 1 047.21 1 013.10 September 2015 quarter 1 032.14 989.67 December 2015 quarter 1 057.15 1 015.99 MEGAFIN SCI GROWTH FUND OF FUNDS A1
December 2014 quarter - - March 2015 quarter - - June 2015 quarter - - September 2015 quarter - - December 2015 quarter 1 179.64 100.00 MEGAFIN SCI GROWTH FUND OF FUNDS B1
December 2014 quarter - - March 2015 quarter 1 027.01 999.42 June 2015 quarter 1 060.72 1 012.15 September 2015 quarter 1 063.32 1 011.10 December 2015 quarter 1 183.57 1 076.21
255

QUARTERLY REVIEW OF FLUCTUATIONS OF UNIT PRICES (IN CENTS)
Fund Name Maximum Minimum
Selling price
MEGAFIN SCI STABLE FUND OF FUNDS A1
December 2014 quarter - - March 2015 quarter - - June 2015 quarter - - September 2015 quarter - - December 2015 quarter 1 045.60 100.00 MEGAFIN SCI STABLE FUND OF FUNDS B1
December 2014 quarter - - March 2015 quarter 1 012.62 999.32 June 2015 quarter 1 029.54 1 009.53 September 2015 quarter 1 034.69 1 010.65 December 2015 quarter 1 062.02 1 035.19 OBSIDIAN SCI BALANCED FUND B1
December 2014 quarter 1 159.51 1 059.54 March 2015 quarter 1 248.03 1 138.09 June 2015 quarter 1 292.32 1 237.93 September 2015 quarter 1 265.32 1 190.57 December 2015 quarter 1 294.18 1 216.45 OBSIDIAN SCI BALANCED FUND B2
December 2014 quarter 1 162.48 1 061.32 March 2015 quarter 1 249.02 1 138.15 June 2015 quarter 1 293.65 1 239.88 September 2015 quarter 1 265.53 1 190.98 December 2015 quarter 1 295.50 1 218.14 OBSIDIAN SCI BALANCED FUND B3
December 2014 quarter 1 164.81 1 062.58 March 2015 quarter 1 250.78 1 138.26 June 2015 quarter 1 296.07 1 243.49 September 2015 quarter 1 266.24 1 192.07 December 2015 quarter 1 298.17 1 221.46 OBSIDIAN SCI BALANCED FUND B4
December 2014 quarter 1 162.83 1 061.42 March 2015 quarter 1 249.73 1 138.20 June 2015 quarter 1 294.64 1 241.37 September 2015 quarter 1 265.90 1 191.51 December 2015 quarter 1 296.66 1 219.55 OBSIDIAN SCI BALANCED FUND B5
December 2014 quarter - - March 2015 quarter 1 251.42 1 138.29 June 2015 quarter 1 296.94 1 244.80 September 2015 quarter 1 266.46 1 192.43 December 2015 quarter 1 299.13 1 222.66 OBSIDIAN SCI EQUITY FUND B1
December 2014 quarter - - March 2015 quarter - - June 2015 quarter - - September 2015 quarter - - December 2015 quarter 1 000.00 993.83 OBSIDIAN SCI EQUITY FUND B2
December 2014 quarter - - March 2015 quarter - - June 2015 quarter - - September 2015 quarter - - December 2015 quarter 1 000.00 993.83 OBSIDIAN SCI EQUITY FUND B3
December 2014 quarter - - March 2015 quarter - - June 2015 quarter - - September 2015 quarter - - December 2015 quarter 1 000.00 993.83
256

QUARTERLY REVIEW OF FLUCTUATIONS OF UNIT PRICES (IN CENTS)
Fund Name Maximum Minimum
Selling price
OBSIDIAN SCI EQUITY FUND B4
December 2014 quarter - - March 2015 quarter - - June 2015 quarter - - September 2015 quarter - - December 2015 quarter 1 000.00 993.83 SANLAM AFRICAN FRONTIER MARKETS FEEDER FUND A1
December 2014 quarter 1 276.14 1 051.50 March 2015 quarter 1 158.04 1 040.23 June 2015 quarter 1 179.32 1 106.31 September 2015 quarter 1 111.55 1 041.24 December 2015 quarter - - SANLAM AFRICAN FRONTIER MARKETS FEEDER FUND B1
December 2014 quarter 1 278.25 1 054.05 March 2015 quarter 1 160.67 1 043.11 June 2015 quarter 1 182.95 1 109.42 September 2015 quarter 1 115.12 1 035.67 December 2015 quarter - - SANLAM AFRICAN FRONTIER MARKETS FEEDER FUND B2
December 2014 quarter 1 279.29 1 055.32 March 2015 quarter 1 162.00 1 044.43 June 2015 quarter 1 184.37 1 110.72 September 2015 quarter 1 116.45 1 046.14 December 2015 quarter - - SANLAM AFRICAN FRONTIER MARKETS FEEDER FUND B3
December 2014 quarter 1 282.52 1 059.26 March 2015 quarter 1 166.05 1 049.02 June 2015 quarter 1 190.48 1 115.84 September 2015 quarter 1 122.53 1 052.35 December 2015 quarter - - SANLAM ALTERNATIVE INCOME FUND A1
December 2014 quarter 100.00 100.00 March 2015 quarter 100.00 100.00 June 2015 quarter 100.00 100.00 September 2015 quarter 100.00 100.00 December 2015 quarter 100.00 100.00 SANLAM ALTERNATIVE INCOME FUND B1
December 2014 quarter 100.00 100.00 March 2015 quarter 100.00 100.00 June 2015 quarter 100.00 100.00 September 2015 quarter 100.00 100.00 December 2015 quarter 100.00 100.00 SANLAM ALTERNATIVE INCOME FUND B2
December 2014 quarter 100.00 100.00 March 2015 quarter 100.00 100.00 June 2015 quarter 100.00 100.00 September 2015 quarter 100.00 100.00 December 2015 quarter 100.00 100.00 SANLAM ALTERNATIVE INCOME FUND B3
December 2014 quarter 100.00 100.00 March 2015 quarter 100.00 100.00 June 2015 quarter 100.00 100.00 September 2015 quarter 100.00 100.00 December 2015 quarter 100.00 100.00 SANLAM ALTERNATIVE INCOME FUND B4
December 2014 quarter 100.00 100.00 March 2015 quarter 100.00 100.00 June 2015 quarter 100.00 100.00 September 2015 quarter 100.00 100.00 December 2015 quarter 100.00 100.00
257

QUARTERLY REVIEW OF FLUCTUATIONS OF UNIT PRICES (IN CENTS)
Fund Name Maximum Minimum
Selling price
SANLAM ALTERNATIVE INCOME FUND B5
December 2014 quarter 100.00 100.00 March 2015 quarter 100.00 100.00 June 2015 quarter 100.00 100.00 September 2015 quarter 100.00 100.00 December 2015 quarter 100.00 100.00 SANLAM ALTERNATIVE INCOME FUND B6
December 2014 quarter 100.00 100.00 March 2015 quarter 100.00 100.00 June 2015 quarter 100.00 100.00 September 2015 quarter 100.00 100.00 December 2015 quarter 100.00 100.00 SANLAM ALTERNATIVE INCOME FUND B7
December 2014 quarter 100.00 100.00 March 2015 quarter 100.00 100.00 June 2015 quarter 100.00 100.00 September 2015 quarter 100.00 100.00 December 2015 quarter 100.00 100.00 SANLAM ALTERNATIVE INCOME FUND B8
December 2014 quarter - - March 2015 quarter - - June 2015 quarter 100.00 100.00 September 2015 quarter 100.00 100.00 December 2015 quarter 100.00 100.00 SANLAM ASIA PACIFIC FUND OF FUNDS
December 2014 quarter 1 578.69 1 399.71 March 2015 quarter 1 750.21 1 508.70 June 2015 quarter 1 860.10 1 688.78 September 2015 quarter 1 794.64 1 604.98 December 2015 quarter 2 027.86 1 800.24 SANLAM ASIA PACIFIC FUND OF FUNDS B1
December 2014 quarter 1 685.01 1 505.03 March 2015 quarter 1 858.63 1 615.82 June 2015 quarter 1 980.66 1 797.66 September 2015 quarter 1 912.78 1 711.15 December 2015 quarter 2 165.67 1 921.27 SANLAM DIVERSIFIED INCOME FUND OF FUNDS A2
December 2014 quarter 105.09 104.30 March 2015 quarter 105.59 104.82 June 2015 quarter 105.84 104.97 September 2015 quarter 106.23 105.52 December 2015 quarter 106.63 106.10 SANLAM DIVERSIFIED INCOME FUND OF FUNDS A3
December 2014 quarter 105.09 104.32 March 2015 quarter 105.59 104.82 June 2015 quarter 105.84 105.22 September 2015 quarter 106.25 105.50 December 2015 quarter 106.63 106.10 SANLAM DIVERSIFIED INCOME FUND OF FUNDS A4
December 2014 quarter 105.16 104.31 March 2015 quarter 105.60 104.83 June 2015 quarter 105.91 105.22 September 2015 quarter 106.31 105.53 December 2015 quarter 106.70 106.12 SANLAM DIVERSIFIED INCOME FUND OF FUND B
December 2014 quarter 105.11 104.28 March 2015 quarter 105.59 104.82 June 2015 quarter 105.86 105.21 September 2015 quarter 106.27 105.53 December 2015 quarter 106.65 106.11 SANLAM DIVERSIFIED INCOME FUND OF FUND B2
December 2014 quarter 105.11 104.31 March 2015 quarter 105.59 104.83 June 2015 quarter 107.35 104.46 September 2015 quarter 105.51 104.87 December 2015 quarter 104.87 104.87
258

QUARTERLY REVIEW OF FLUCTUATIONS OF UNIT PRICES (IN CENTS)
Fund Name Maximum Minimum
Selling price
SANLAM DIVERSIFIED INCOME FUND OF FUND B3
December 2014 quarter 105.30 104.30 March 2015 quarter 106.02 105.03 June 2015 quarter 105.88 105.21 September 2015 quarter 106.22 105.53 December 2015 quarter 106.68 106.11 SANLAM GLOBAL BALANCED FUND OF FUNDS
December 2014 quarter 2 311.76 2 070.77 March 2015 quarter 2 463.25 2 229.27 June 2015 quarter 2 539.62 2 371.61 September 2015 quarter 2 599.38 2 419.28 December 2015 quarter 3 080.60 2 648.35 SANLAM GLOBAL BALANCED FUND OF FUNDS B1
December 2014 quarter 2 183.00 1 944.73 March 2015 quarter 2 330.47 2 098.72 June 2015 quarter 2 391.83 2 237.35 September 2015 quarter 2 450.52 2 282.97 December 2015 quarter 2 897.79 2 494.44 SANLAM GLOBAL BALANCED FUND OF FUNDS B2
December 2014 quarter 2 385.88 2 144.98 March 2015 quarter 2 537.19 2 303.27 June 2015 quarter 2 618.73 2 445.52 September 2015 quarter 2 680.31 2 494.61 December 2015 quarter 3 176.54 2 730.80 SANLAM GLOBAL BALANCED FUND OF FUNDS B5
December 2014 quarter 2 564.80 2 324.47 March 2015 quarter 2 715.62 2 481.69 June 2015 quarter 2 817.93 2 623.98 September 2015 quarter 2 877.30 2 674.13 December 2015 quarter 3 410.38 2 931.65 SANLAM GLOBAL CAUTIOUS FUND OF FUNDS
December 2014 quarter 2 126.04 1 940.56 March 2015 quarter 2 267.04 2 069.37 June 2015 quarter 2 308.78 2 187.82 September 2015 quarter 2 432.71 2 219.10 December 2015 quarter 2 842.71 2 444.77 SANLAM GLOBAL EQUITY FUND A
December 2014 quarter 552.10 492.36 March 2015 quarter 580.73 521.83 June 2015 quarter 610.64 566.19 September 2015 quarter 601.60 549.04 December 2015 quarter 672.23 595.66 SANLAM GLOBAL EQUITY FUND B1
December 2014 quarter 522.80 464.29 March 2015 quarter 549.96 492.11 June 2015 quarter 575.61 535.02 September 2015 quarter 566.95 517.02 December 2015 quarter 630.38 559.54 SANLAM GLOBAL EQUITY FUND B3
December 2014 quarter 561.06 500.93 March 2015 quarter 590.14 530.92 June 2015 quarter 621.35 575.72 September 2015 quarter 611.39 558.10 December 2015 quarter 684.12 605.90
259
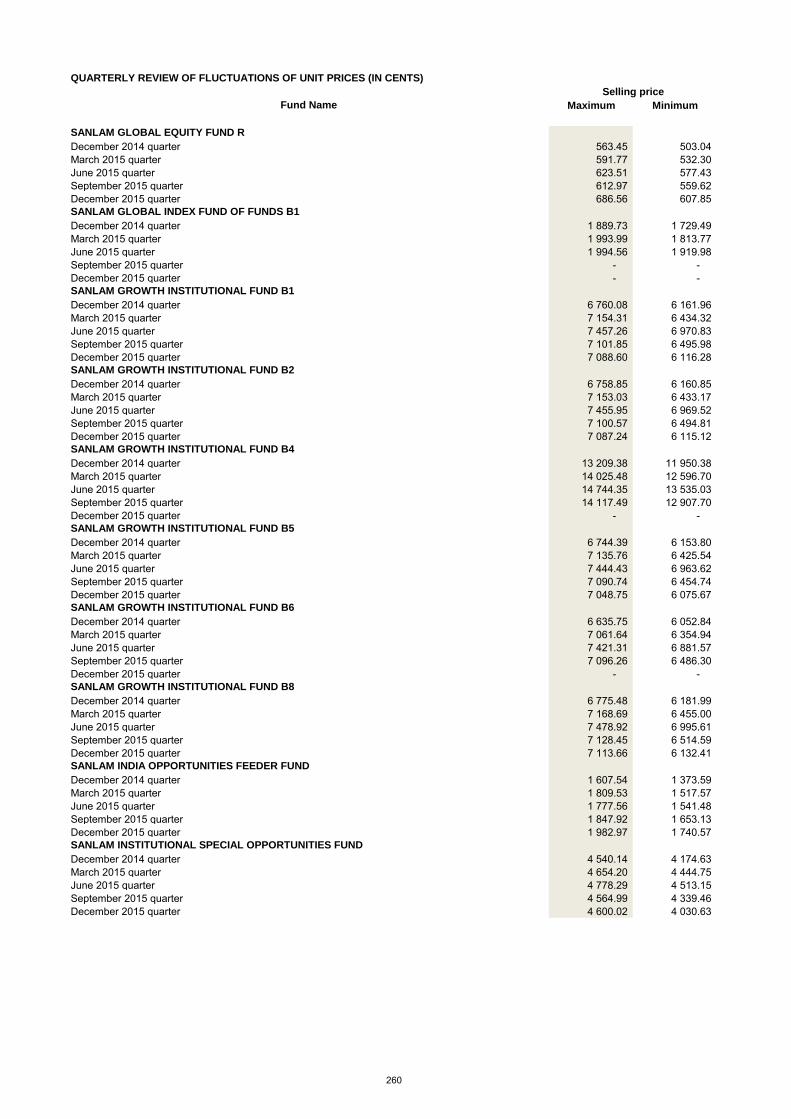
QUARTERLY REVIEW OF FLUCTUATIONS OF UNIT PRICES (IN CENTS)
Fund Name Maximum Minimum
Selling price
SANLAM GLOBAL EQUITY FUND R
December 2014 quarter 563.45 503.04 March 2015 quarter 591.77 532.30 June 2015 quarter 623.51 577.43 September 2015 quarter 612.97 559.62 December 2015 quarter 686.56 607.85 SANLAM GLOBAL INDEX FUND OF FUNDS B1
December 2014 quarter 1 889.73 1 729.49 March 2015 quarter 1 993.99 1 813.77 June 2015 quarter 1 994.56 1 919.98 September 2015 quarter - - December 2015 quarter - - SANLAM GROWTH INSTITUTIONAL FUND B1
December 2014 quarter 6 760.08 6 161.96 March 2015 quarter 7 154.31 6 434.32 June 2015 quarter 7 457.26 6 970.83 September 2015 quarter 7 101.85 6 495.98 December 2015 quarter 7 088.60 6 116.28 SANLAM GROWTH INSTITUTIONAL FUND B2
December 2014 quarter 6 758.85 6 160.85 March 2015 quarter 7 153.03 6 433.17 June 2015 quarter 7 455.95 6 969.52 September 2015 quarter 7 100.57 6 494.81 December 2015 quarter 7 087.24 6 115.12 SANLAM GROWTH INSTITUTIONAL FUND B4
December 2014 quarter 13 209.38 11 950.38 March 2015 quarter 14 025.48 12 596.70 June 2015 quarter 14 744.35 13 535.03 September 2015 quarter 14 117.49 12 907.70 December 2015 quarter - - SANLAM GROWTH INSTITUTIONAL FUND B5
December 2014 quarter 6 744.39 6 153.80 March 2015 quarter 7 135.76 6 425.54 June 2015 quarter 7 444.43 6 963.62 September 2015 quarter 7 090.74 6 454.74 December 2015 quarter 7 048.75 6 075.67 SANLAM GROWTH INSTITUTIONAL FUND B6
December 2014 quarter 6 635.75 6 052.84 March 2015 quarter 7 061.64 6 354.94 June 2015 quarter 7 421.31 6 881.57 September 2015 quarter 7 096.26 6 486.30 December 2015 quarter - - SANLAM GROWTH INSTITUTIONAL FUND B8
December 2014 quarter 6 775.48 6 181.99 March 2015 quarter 7 168.69 6 455.00 June 2015 quarter 7 478.92 6 995.61 September 2015 quarter 7 128.45 6 514.59 December 2015 quarter 7 113.66 6 132.41 SANLAM INDIA OPPORTUNITIES FEEDER FUND
December 2014 quarter 1 607.54 1 373.59 March 2015 quarter 1 809.53 1 517.57 June 2015 quarter 1 777.56 1 541.48 September 2015 quarter 1 847.92 1 653.13 December 2015 quarter 1 982.97 1 740.57 SANLAM INSTITUTIONAL SPECIAL OPPORTUNITIES FUND
December 2014 quarter 4 540.14 4 174.63 March 2015 quarter 4 654.20 4 444.75 June 2015 quarter 4 778.29 4 513.15 September 2015 quarter 4 564.99 4 339.46 December 2015 quarter 4 600.02 4 030.63
260

QUARTERLY REVIEW OF FLUCTUATIONS OF UNIT PRICES (IN CENTS)
Fund Name Maximum Minimum
Selling price
SANLAM MARKET ALLOCATOR FUND A1
December 2014 quarter 1 161.77 1 090.86 March 2015 quarter 1 206.20 1 123.37 June 2015 quarter 1 239.64 1 185.46 September 2015 quarter 1 214.28 1 139.44 December 2015 quarter 1 222.19 1 150.28 SANLAM MARKET ALLOCATOR FUND B1
December 2014 quarter 1 163.71 1 091.43 March 2015 quarter 1 209.03 1 123.93 June 2015 quarter 1 240.56 1 187.85 September 2015 quarter 1 215.61 1 141.38 December 2015 quarter 1 223.45 1 153.34 SANLAM MARKET ALLOCATOR FUND B2
December 2014 quarter 1 162.55 1 091.08 March 2015 quarter 1 207.32 1 123.58 June 2015 quarter 1 240.31 1 186.43 September 2015 quarter 1 214.84 1 140.25 December 2015 quarter 1 222.69 1 151.35 SANLAM MARKET ALLOCATOR FUND B3
December 2014 quarter 1 162.46 1 091.05 March 2015 quarter 1 207.32 1 123.60 June 2015 quarter 1 240.04 1 186.60 September 2015 quarter 1 214.82 1 140.25 December 2015 quarter 1 222.82 1 151.57 SANLAM OPTIMISED INCOME FUND B1
December 2014 quarter 102.10 100.02 March 2015 quarter 101.52 99.94 June 2015 quarter - - September 2015 quarter - - December 2015 quarter - - SANLAM OPTIMISED INCOME FUND B2
December 2014 quarter 102.10 100.07 March 2015 quarter 101.53 100.00 June 2015 quarter 114.96 99.77 September 2015 quarter 103.40 99.01 December 2015 quarter 107.45 101.39 SANLAM OPTIMISED INCOME FUND B3
December 2014 quarter 102.10 100.01 March 2015 quarter 101.52 99.94 June 2015 quarter - - September 2015 quarter - - December 2015 quarter - - SANLAM OPTIMISED INCOME FUND B4
December 2014 quarter 102.10 100.04 March 2015 quarter 101.52 99.98 June 2015 quarter 101.23 99.76 September 2015 quarter - - December 2015 quarter - - SANLAM OPTIMISED INCOME FUND B5
December 2014 quarter 102.13 100.04 March 2015 quarter 101.50 93.72 June 2015 quarter 95.04 93.68 September 2015 quarter - - December 2015 quarter - - SANLAM PAN-EUROPE FUND
December 2014 quarter 399.82 362.23 March 2015 quarter 422.07 372.59 June 2015 quarter 446.44 414.07 September 2015 quarter 450.94 419.98 December 2015 quarter 495.67 446.52
261
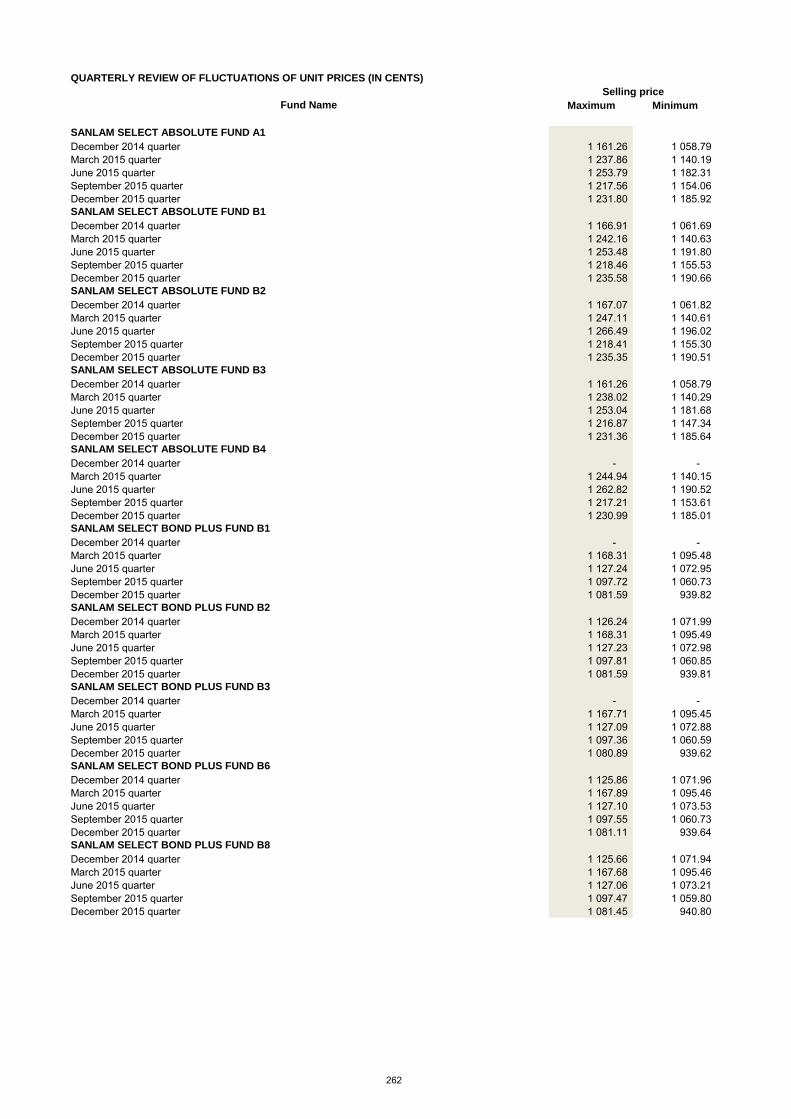
QUARTERLY REVIEW OF FLUCTUATIONS OF UNIT PRICES (IN CENTS)
Fund Name Maximum Minimum
Selling price
SANLAM SELECT ABSOLUTE FUND A1
December 2014 quarter 1 161.26 1 058.79 March 2015 quarter 1 237.86 1 140.19 June 2015 quarter 1 253.79 1 182.31 September 2015 quarter 1 217.56 1 154.06 December 2015 quarter 1 231.80 1 185.92 SANLAM SELECT ABSOLUTE FUND B1
December 2014 quarter 1 166.91 1 061.69 March 2015 quarter 1 242.16 1 140.63 June 2015 quarter 1 253.48 1 191.80 September 2015 quarter 1 218.46 1 155.53 December 2015 quarter 1 235.58 1 190.66 SANLAM SELECT ABSOLUTE FUND B2
December 2014 quarter 1 167.07 1 061.82 March 2015 quarter 1 247.11 1 140.61 June 2015 quarter 1 266.49 1 196.02 September 2015 quarter 1 218.41 1 155.30 December 2015 quarter 1 235.35 1 190.51 SANLAM SELECT ABSOLUTE FUND B3
December 2014 quarter 1 161.26 1 058.79 March 2015 quarter 1 238.02 1 140.29 June 2015 quarter 1 253.04 1 181.68 September 2015 quarter 1 216.87 1 147.34 December 2015 quarter 1 231.36 1 185.64 SANLAM SELECT ABSOLUTE FUND B4
December 2014 quarter - - March 2015 quarter 1 244.94 1 140.15 June 2015 quarter 1 262.82 1 190.52 September 2015 quarter 1 217.21 1 153.61 December 2015 quarter 1 230.99 1 185.01 SANLAM SELECT BOND PLUS FUND B1
December 2014 quarter - - March 2015 quarter 1 168.31 1 095.48 June 2015 quarter 1 127.24 1 072.95 September 2015 quarter 1 097.72 1 060.73 December 2015 quarter 1 081.59 939.82 SANLAM SELECT BOND PLUS FUND B2
December 2014 quarter 1 126.24 1 071.99 March 2015 quarter 1 168.31 1 095.49 June 2015 quarter 1 127.23 1 072.98 September 2015 quarter 1 097.81 1 060.85 December 2015 quarter 1 081.59 939.81 SANLAM SELECT BOND PLUS FUND B3
December 2014 quarter - - March 2015 quarter 1 167.71 1 095.45 June 2015 quarter 1 127.09 1 072.88 September 2015 quarter 1 097.36 1 060.59 December 2015 quarter 1 080.89 939.62 SANLAM SELECT BOND PLUS FUND B6
December 2014 quarter 1 125.86 1 071.96 March 2015 quarter 1 167.89 1 095.46 June 2015 quarter 1 127.10 1 073.53 September 2015 quarter 1 097.55 1 060.73 December 2015 quarter 1 081.11 939.64 SANLAM SELECT BOND PLUS FUND B8
December 2014 quarter 1 125.66 1 071.94 March 2015 quarter 1 167.68 1 095.46 June 2015 quarter 1 127.06 1 073.21 September 2015 quarter 1 097.47 1 059.80 December 2015 quarter 1 081.45 940.80
262
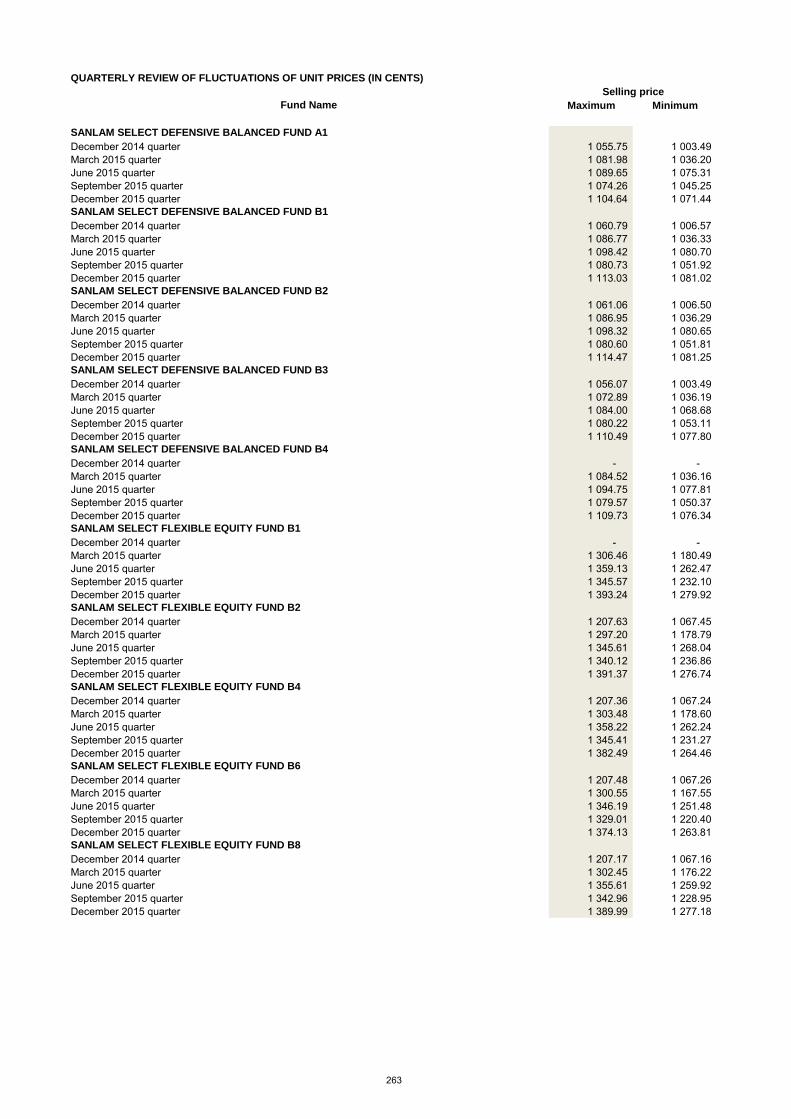
QUARTERLY REVIEW OF FLUCTUATIONS OF UNIT PRICES (IN CENTS)
Fund Name Maximum Minimum
Selling price
SANLAM SELECT DEFENSIVE BALANCED FUND A1
December 2014 quarter 1 055.75 1 003.49 March 2015 quarter 1 081.98 1 036.20 June 2015 quarter 1 089.65 1 075.31 September 2015 quarter 1 074.26 1 045.25 December 2015 quarter 1 104.64 1 071.44 SANLAM SELECT DEFENSIVE BALANCED FUND B1
December 2014 quarter 1 060.79 1 006.57 March 2015 quarter 1 086.77 1 036.33 June 2015 quarter 1 098.42 1 080.70 September 2015 quarter 1 080.73 1 051.92 December 2015 quarter 1 113.03 1 081.02 SANLAM SELECT DEFENSIVE BALANCED FUND B2
December 2014 quarter 1 061.06 1 006.50 March 2015 quarter 1 086.95 1 036.29 June 2015 quarter 1 098.32 1 080.65 September 2015 quarter 1 080.60 1 051.81 December 2015 quarter 1 114.47 1 081.25 SANLAM SELECT DEFENSIVE BALANCED FUND B3
December 2014 quarter 1 056.07 1 003.49 March 2015 quarter 1 072.89 1 036.19 June 2015 quarter 1 084.00 1 068.68 September 2015 quarter 1 080.22 1 053.11 December 2015 quarter 1 110.49 1 077.80 SANLAM SELECT DEFENSIVE BALANCED FUND B4
December 2014 quarter - - March 2015 quarter 1 084.52 1 036.16 June 2015 quarter 1 094.75 1 077.81 September 2015 quarter 1 079.57 1 050.37 December 2015 quarter 1 109.73 1 076.34 SANLAM SELECT FLEXIBLE EQUITY FUND B1
December 2014 quarter - - March 2015 quarter 1 306.46 1 180.49 June 2015 quarter 1 359.13 1 262.47 September 2015 quarter 1 345.57 1 232.10 December 2015 quarter 1 393.24 1 279.92 SANLAM SELECT FLEXIBLE EQUITY FUND B2
December 2014 quarter 1 207.63 1 067.45 March 2015 quarter 1 297.20 1 178.79 June 2015 quarter 1 345.61 1 268.04 September 2015 quarter 1 340.12 1 236.86 December 2015 quarter 1 391.37 1 276.74 SANLAM SELECT FLEXIBLE EQUITY FUND B4
December 2014 quarter 1 207.36 1 067.24 March 2015 quarter 1 303.48 1 178.60 June 2015 quarter 1 358.22 1 262.24 September 2015 quarter 1 345.41 1 231.27 December 2015 quarter 1 382.49 1 264.46 SANLAM SELECT FLEXIBLE EQUITY FUND B6
December 2014 quarter 1 207.48 1 067.26 March 2015 quarter 1 300.55 1 167.55 June 2015 quarter 1 346.19 1 251.48 September 2015 quarter 1 329.01 1 220.40 December 2015 quarter 1 374.13 1 263.81 SANLAM SELECT FLEXIBLE EQUITY FUND B8
December 2014 quarter 1 207.17 1 067.16 March 2015 quarter 1 302.45 1 176.22 June 2015 quarter 1 355.61 1 259.92 September 2015 quarter 1 342.96 1 228.95 December 2015 quarter 1 389.99 1 277.18
263

QUARTERLY REVIEW OF FLUCTUATIONS OF UNIT PRICES (IN CENTS)
Fund Name Maximum Minimum
Selling price
SANLAM SELECT MANAGED FUND A1
December 2014 quarter 1 056.16 995.10 March 2015 quarter 1 083.00 1 015.61 June 2015 quarter 1 108.58 1 061.59 September 2015 quarter 1 069.21 1 021.88 December 2015 quarter 1 110.10 1 053.77 SANLAM SELECT MANAGED FUND B1
December 2014 quarter 1 060.16 998.09 March 2015 quarter 1 084.79 1 015.96 June 2015 quarter 1 111.77 1 073.49 September 2015 quarter 1 077.29 1 030.05 December 2015 quarter 1 120.86 1 065.02 SANLAM SELECT MANAGED FUND B2
December 2014 quarter 1 060.54 998.02 March 2015 quarter 1 084.78 1 015.94 June 2015 quarter 1 111.84 1 073.58 September 2015 quarter 1 077.44 1 030.19 December 2015 quarter 1 120.84 1 065.03 SANLAM SELECT MANAGED FUND B3
December 2014 quarter 1 055.79 994.88 March 2015 quarter 1 083.36 1 015.63 June 2015 quarter 1 108.03 1 068.66 September 2015 quarter 1 076.56 1 028.93 December 2015 quarter 1 117.21 1 059.21 SANLAM SELECT MANAGED FUND B4
December 2014 quarter - - March 2015 quarter 1 082.79 1 015.54 June 2015 quarter 1 108.21 1 068.05 September 2015 quarter 1 076.34 1 028.59 December 2015 quarter 1 117.02 1 060.16 SANLAM SELECT OPTIMISED EQUITY FUND B10
December 2014 quarter 7 043.39 6 389.33 March 2015 quarter 7 408.93 6 767.64 June 2015 quarter 7 702.96 7 170.45 September 2015 quarter 7 359.49 6 634.56 December 2015 quarter 7 558.82 6 866.65 SANLAM SELECT OPTIMISED EQUITY FUND B2
December 2014 quarter 7 044.31 6 389.87 March 2015 quarter 7 426.54 6 767.71 June 2015 quarter 7 703.90 7 171.72 September 2015 quarter 7 360.94 6 635.81 December 2015 quarter 7 560.73 6 927.46 SANLAM SELECT OPTIMISED EQUITY FUND B4
December 2014 quarter 7 012.45 6 370.33 March 2015 quarter 7 409.67 6 764.91 June 2015 quarter 7 681.56 7 142.88 September 2015 quarter 7 354.69 6 626.64 December 2015 quarter 7 534.06 6 896.11 SANLAM SELECT OPTIMISED EQUITY FUND B7
December 2014 quarter 7 024.76 6 378.27 March 2015 quarter 7 406.00 6 765.14 June 2015 quarter 7 682.74 7 143.39 September 2015 quarter 7 353.64 6 625.28 December 2015 quarter 7 536.59 6 835.38 SANLAM SELECT OPTIMISED EQUITY FUND B9
December 2014 quarter 7 018.30 6 374.41 March 2015 quarter 7 413.80 6 765.55 June 2015 quarter 7 687.06 7 149.45 September 2015 quarter 7 355.82 6 628.51 December 2015 quarter 7 541.16 6 904.60
264
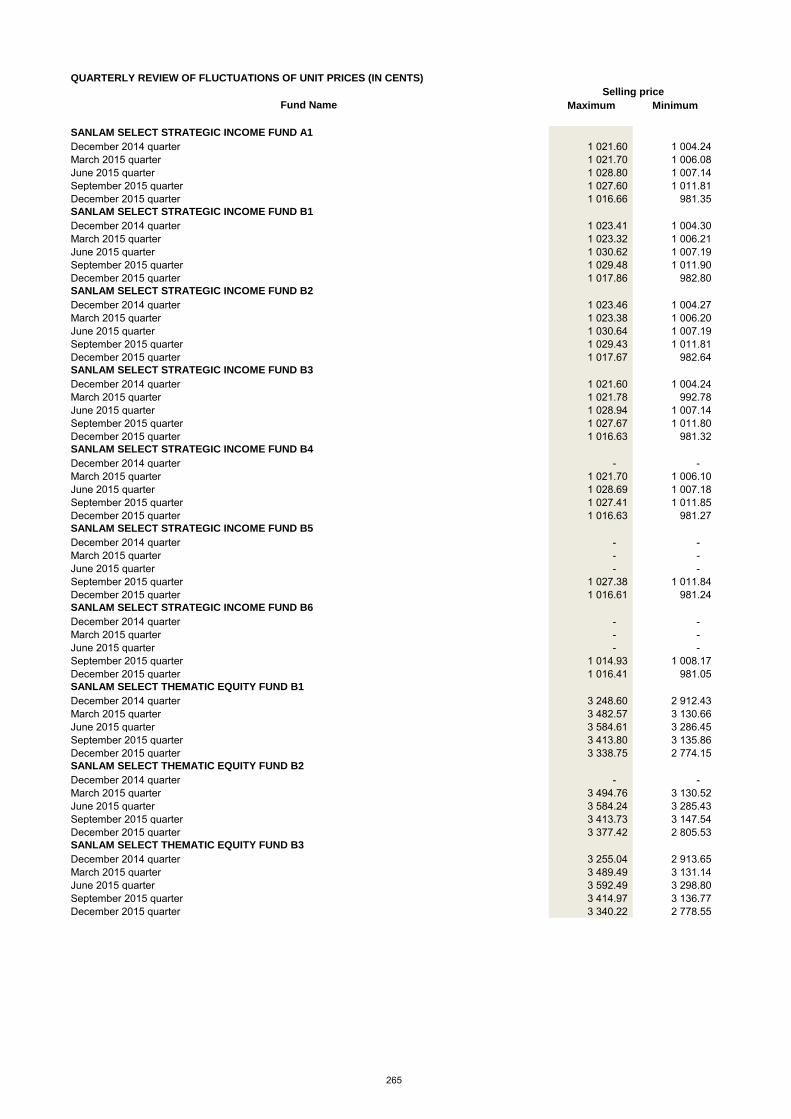
QUARTERLY REVIEW OF FLUCTUATIONS OF UNIT PRICES (IN CENTS)
Fund Name Maximum Minimum
Selling price
SANLAM SELECT STRATEGIC INCOME FUND A1
December 2014 quarter 1 021.60 1 004.24 March 2015 quarter 1 021.70 1 006.08 June 2015 quarter 1 028.80 1 007.14 September 2015 quarter 1 027.60 1 011.81 December 2015 quarter 1 016.66 981.35 SANLAM SELECT STRATEGIC INCOME FUND B1
December 2014 quarter 1 023.41 1 004.30 March 2015 quarter 1 023.32 1 006.21 June 2015 quarter 1 030.62 1 007.19 September 2015 quarter 1 029.48 1 011.90 December 2015 quarter 1 017.86 982.80 SANLAM SELECT STRATEGIC INCOME FUND B2
December 2014 quarter 1 023.46 1 004.27 March 2015 quarter 1 023.38 1 006.20 June 2015 quarter 1 030.64 1 007.19 September 2015 quarter 1 029.43 1 011.81 December 2015 quarter 1 017.67 982.64 SANLAM SELECT STRATEGIC INCOME FUND B3
December 2014 quarter 1 021.60 1 004.24 March 2015 quarter 1 021.78 992.78 June 2015 quarter 1 028.94 1 007.14 September 2015 quarter 1 027.67 1 011.80 December 2015 quarter 1 016.63 981.32 SANLAM SELECT STRATEGIC INCOME FUND B4
December 2014 quarter - - March 2015 quarter 1 021.70 1 006.10 June 2015 quarter 1 028.69 1 007.18 September 2015 quarter 1 027.41 1 011.85 December 2015 quarter 1 016.63 981.27 SANLAM SELECT STRATEGIC INCOME FUND B5
December 2014 quarter - - March 2015 quarter - - June 2015 quarter - - September 2015 quarter 1 027.38 1 011.84 December 2015 quarter 1 016.61 981.24 SANLAM SELECT STRATEGIC INCOME FUND B6
December 2014 quarter - - March 2015 quarter - - June 2015 quarter - - September 2015 quarter 1 014.93 1 008.17 December 2015 quarter 1 016.41 981.05 SANLAM SELECT THEMATIC EQUITY FUND B1
December 2014 quarter 3 248.60 2 912.43 March 2015 quarter 3 482.57 3 130.66 June 2015 quarter 3 584.61 3 286.45 September 2015 quarter 3 413.80 3 135.86 December 2015 quarter 3 338.75 2 774.15 SANLAM SELECT THEMATIC EQUITY FUND B2
December 2014 quarter - - March 2015 quarter 3 494.76 3 130.52 June 2015 quarter 3 584.24 3 285.43 September 2015 quarter 3 413.73 3 147.54 December 2015 quarter 3 377.42 2 805.53 SANLAM SELECT THEMATIC EQUITY FUND B3
December 2014 quarter 3 255.04 2 913.65 March 2015 quarter 3 489.49 3 131.14 June 2015 quarter 3 592.49 3 298.80 September 2015 quarter 3 414.97 3 136.77 December 2015 quarter 3 340.22 2 778.55
265

QUARTERLY REVIEW OF FLUCTUATIONS OF UNIT PRICES (IN CENTS)
Fund Name Maximum Minimum
Selling price
SANLAM SELECT THEMATIC EQUITY FUND B4
December 2014 quarter - - March 2015 quarter 3 501.22 3 131.14 June 2015 quarter 3 586.72 3 291.73 September 2015 quarter 3 415.54 3 152.52 December 2015 quarter 3 340.95 2 779.09 SANLAM SELECT THEMATIC EQUITY FUND B10
December 2014 quarter 3 253.75 2 913.53 March 2015 quarter 3 492.18 3 130.73 June 2015 quarter 3 583.88 3 283.15 September 2015 quarter 3 412.64 3 142.42 December 2015 quarter 3 337.52 2 773.61 SANLAM STABLE GROWTH FUND A1
December 2014 quarter 1 046.25 1 034.45 March 2015 quarter 1 039.70 1 027.24 June 2015 quarter 1 049.91 1 023.26 September 2015 quarter 1 040.01 1 022.90 December 2015 quarter 1 047.74 1 005.65 SANLAM STABLE GROWTH FUND B1
December 2014 quarter 1 047.67 1 035.26 March 2015 quarter 1 040.29 1 027.39 June 2015 quarter 1 051.26 1 024.17 September 2015 quarter 1 040.03 1 023.21 December 2015 quarter 1 048.52 1 006.46 SANLAM STABLE GROWTH FUND B2
December 2014 quarter 1 047.77 1 035.38 March 2015 quarter 1 040.22 1 027.36 June 2015 quarter 1 051.54 1 024.19 September 2015 quarter 1 040.37 1 023.58 December 2015 quarter 1 049.49 1 007.23 SANLAM STABLE GROWTH FUND B3
December 2014 quarter 1 051.17 1 037.44 March 2015 quarter 1 041.52 1 027.74 June 2015 quarter 1 055.51 1 026.51 September 2015 quarter 1 041.14 1 025.07 December 2015 quarter 1 053.37 1 010.69 SANLAM STABLE GROWTH FUND B4
December 2014 quarter 1 048.96 1 036.09 March 2015 quarter 1 040.67 1 027.50 June 2015 quarter 1 052.92 1 025.00 September 2015 quarter 1 040.64 1 024.09 December 2015 quarter 1 050.79 1 008.39 SANLAM STABLE GROWTH FUND B5
December 2014 quarter 1 050.42 1 037.01 March 2015 quarter 1 041.22 1 027.66 June 2015 quarter 1 054.69 1 026.02 September 2015 quarter 1 040.94 1 024.70 December 2015 quarter 1 052.37 1 009.81 SANLAM VALUE INSTITUTIONAL FUND B1
December 2014 quarter 5 951.84 5 457.08 March 2015 quarter 6 180.39 5 644.52 June 2015 quarter 6 376.30 5 920.70 September 2015 quarter 6 067.92 5 549.94 December 2015 quarter 6 312.07 5 592.39 SANLAM VALUE INSTITUTIONAL FUND B2
December 2014 quarter 5 951.37 5 457.15 March 2015 quarter 6 179.97 5 644.44 June 2015 quarter 6 376.08 5 919.83 September 2015 quarter 6 067.12 5 549.13 December 2015 quarter - -
266

QUARTERLY REVIEW OF FLUCTUATIONS OF UNIT PRICES (IN CENTS)
Fund Name Maximum Minimum
Selling price
SANLAM VALUE INSTITUTIONAL FUND B3
December 2014 quarter 5 944.53 5 455.43 March 2015 quarter 6 174.95 5 643.31 June 2015 quarter 6 373.34 5 911.03 September 2015 quarter 6 063.52 5 543.66 December 2015 quarter - - SANLAM VALUE INSTITUTIONAL FUND B5
December 2014 quarter 5 668.53 5 179.45 March 2015 quarter 5 898.29 5 368.06 June 2015 quarter 6 082.63 5 640.25 September 2015 quarter 5 786.00 5 289.46 December 2015 quarter - - SESFIKILE SCI PROPERTY FUND A1
December 2014 quarter 1 796.58 1 575.95 March 2015 quarter 1 995.07 1 745.86 June 2015 quarter 2 019.96 1 842.75 September 2015 quarter 2 001.07 1 854.76 December 2015 quarter - - SESFIKILE SCI PROPERTY FUND B1
December 2014 quarter 1 798.45 1 577.01 March 2015 quarter 1 996.13 1 745.92 June 2015 quarter 2 021.20 1 844.55 September 2015 quarter 2 001.49 1 854.48 December 2015 quarter - - SESFIKILE SCI PROPERTY FUND B2
December 2014 quarter 1 800.71 1 578.29 March 2015 quarter 1 997.43 1 746.03 June 2015 quarter 2 022.72 1 846.74 September 2015 quarter 2 001.89 1 854.76 December 2015 quarter - - SIM ABSOLUTE RETURN INCOME FUND
December 2014 quarter 121.23 119.10 March 2015 quarter 119.79 117.71 June 2015 quarter 121.63 119.89 September 2015 quarter 120.60 118.65 December 2015 quarter 122.12 120.96 SIM ABSOLUTE RETURN INCOME FUND A1
December 2014 quarter 121.23 119.14 March 2015 quarter 119.77 117.88 June 2015 quarter 121.57 119.87 September 2015 quarter 120.59 118.86 December 2015 quarter 122.09 120.93 SIM ABSOLUTE RETURN INCOME FUND B1
December 2014 quarter 121.98 119.51 March 2015 quarter 120.13 117.88 June 2015 quarter 122.32 120.24 September 2015 quarter 120.98 118.87 December 2015 quarter 122.75 121.61 SIM ABSOLUTE RETURN INCOME FUND B2
December 2014 quarter 120.54 118.79 March 2015 quarter 119.43 117.86 June 2015 quarter 120.88 119.52 September 2015 quarter 120.28 118.85 December 2015 quarter 121.50 120.31 SIM ABSOLUTE RETURN INCOME FUND B3
December 2014 quarter 121.43 119.23 March 2015 quarter 119.86 117.87 June 2015 quarter 121.77 119.97 September 2015 quarter 120.70 118.86 December 2015 quarter 122.27 121.12
267

QUARTERLY REVIEW OF FLUCTUATIONS OF UNIT PRICES (IN CENTS)
Fund Name Maximum Minimum
Selling price
SIM ABSOLUTE RETURN INCOME FUND B4
December 2014 quarter 121.57 119.31 March 2015 quarter 119.93 117.88 June 2015 quarter 121.91 120.04 September 2015 quarter 120.77 118.86 December 2015 quarter 122.39 121.24 SIM ABSOLUTE RETURN INCOME FUND B5
December 2014 quarter 121.68 119.34 March 2015 quarter 120.01 117.88 June 2015 quarter 122.06 120.11 September 2015 quarter 120.84 118.86 December 2015 quarter 122.50 121.36 SIM ACTIVE INCOME FUND A1
December 2014 quarter 1 153.84 1 131.34 March 2015 quarter 1 157.32 1 137.06 June 2015 quarter 1 155.94 1 140.71 September 2015 quarter 1 157.75 1 138.88 December 2015 quarter 1 152.46 1 141.69 SIM ACTIVE INCOME FUND B1
December 2014 quarter 1 156.48 1 131.60 March 2015 quarter 1 159.76 1 137.16 June 2015 quarter 1 158.59 1 140.76 September 2015 quarter 1 160.39 1 138.93 December 2015 quarter 1 154.29 1 143.73 SIM ACTIVE INCOME FUND B10
December 2014 quarter 1 155.22 1 131.38 March 2015 quarter 1 158.60 1 137.12 June 2015 quarter 1 157.33 1 140.74 September 2015 quarter 1 159.13 1 138.85 December 2015 quarter 1 153.43 1 142.77 SIM ACTIVE INCOME FUND B2
December 2014 quarter 1 155.14 1 131.49 March 2015 quarter 1 158.54 1 137.12 June 2015 quarter 1 157.24 1 140.72 September 2015 quarter 1 159.03 1 138.86 December 2015 quarter 1 153.37 1 142.70 SIM ACTIVE INCOME FUND B3
December 2014 quarter 1 154.01 1 131.71 March 2015 quarter 1 157.50 1 137.11 June 2015 quarter 1 156.10 1 140.74 September 2015 quarter 1 157.87 1 138.90 December 2015 quarter 1 152.59 1 141.83 SIM ACTIVE INCOME FUND B4
December 2014 quarter 1 122.50 1 099.36 March 2015 quarter 1 125.98 1 105.09 June 2015 quarter 1 124.16 1 108.70 September 2015 quarter 1 125.84 1 106.95 December 2015 quarter 1 120.55 1 110.13 SIM ACTIVE INCOME FUND B5
December 2014 quarter 1 154.97 1 131.38 March 2015 quarter 1 158.39 1 137.11 June 2015 quarter 1 157.06 1 140.68 September 2015 quarter 1 158.85 1 138.88 December 2015 quarter 1 153.24 1 142.56 SIM ACTIVE INCOME FUND B6
December 2014 quarter 1 154.83 1 131.35 March 2015 quarter 1 158.23 1 137.10 June 2015 quarter 1 156.91 1 140.71 September 2015 quarter 1 158.70 1 138.88 December 2015 quarter 1 153.13 1 142.44
268

QUARTERLY REVIEW OF FLUCTUATIONS OF UNIT PRICES (IN CENTS)
Fund Name Maximum Minimum
Selling price
SIM ACTIVE INCOME FUND B7
December 2014 quarter 1 152.36 1 131.48 March 2015 quarter 1 156.00 1 137.04 June 2015 quarter 1 154.48 1 140.70 September 2015 quarter 1 156.25 1 139.13 December 2015 quarter 1 151.46 1 140.57 SIM ACTIVE INCOME FUND B8
December 2014 quarter - - March 2015 quarter - - June 2015 quarter 1 154.72 1 140.77 September 2015 quarter 1 156.49 1 139.12 December 2015 quarter 1 151.73 1 140.84 SIM ACTIVE INCOME FUND B9
December 2014 quarter 1 153.17 1 131.36 March 2015 quarter 1 156.75 1 137.09 June 2015 quarter 1 155.29 1 140.70 September 2015 quarter 1 157.05 1 138.85 December 2015 quarter 1 152.00 1 141.18 SIM ACTIVE INCOME FUND C
December 2014 quarter 1 149.56 1 131.31 March 2015 quarter 1 153.44 1 137.00 June 2015 quarter 1 151.67 1 140.64 September 2015 quarter 1 153.38 1 138.79 December 2015 quarter 1 149.52 1 138.40 SIM BALANCED FUND A
December 2014 quarter 7 273.03 6 906.36 March 2015 quarter 7 497.56 7 071.02 June 2015 quarter 7 685.32 7 412.54 September 2015 quarter 7 497.33 7 166.97 December 2015 quarter 7 651.00 7 141.49 SIM BALANCED FUND A1
December 2014 quarter - - March 2015 quarter 7 496.77 7 067.36 June 2015 quarter 7 683.89 7 409.26 September 2015 quarter 7 496.16 7 165.17 December 2015 quarter 7 646.58 7 136.00 SIM BALANCED FUND B
December 2014 quarter 7 277.22 6 906.32 March 2015 quarter 7 499.17 7 070.16 June 2015 quarter 7 689.32 7 420.88 September 2015 quarter 7 500.07 7 171.25 December 2015 quarter 7 661.37 7 154.34 SIM BALANCED FUND B1
December 2014 quarter 7 242.40 6 886.04 March 2015 quarter 7 492.81 7 068.49 June 2015 quarter 7 672.85 7 387.77 September 2015 quarter 7 489.42 7 154.71 December 2015 quarter 7 621.18 7 104.52 SIM BALANCED FUND B10
December 2014 quarter 7 328.56 6 941.22 March 2015 quarter 7 509.25 7 074.97 June 2015 quarter 7 699.80 7 440.52 September 2015 quarter 7 505.96 7 179.88 December 2015 quarter 7 683.18 7 181.60 SIM BALANCED FUND B11
December 2014 quarter - - March 2015 quarter 7 499.01 7 069.15 June 2015 quarter 7 689.92 7 421.46 September 2015 quarter 7 500.09 7 171.27 December 2015 quarter 7 661.47 7 154.47
269

QUARTERLY REVIEW OF FLUCTUATIONS OF UNIT PRICES (IN CENTS)
Fund Name Maximum Minimum
Selling price
SIM BALANCED FUND B3
December 2014 quarter 7 291.21 6 918.18 March 2015 quarter 7 499.88 7 072.95 June 2015 quarter 7 691.21 7 424.58 September 2015 quarter 7 501.27 7 173.12 December 2015 quarter 7 665.89 7 159.93 SIM BALANCED FUND B4
December 2014 quarter 7 306.00 6 927.11 March 2015 quarter 7 502.79 7 073.84 June 2015 quarter 7 694.42 7 430.88 September 2015 quarter 7 503.21 7 176.12 December 2015 quarter 7 673.27 7 169.12 SIM BALANCED FUND B6
December 2014 quarter 7 320.97 6 936.96 March 2015 quarter 7 506.39 7 072.86 June 2015 quarter 7 696.71 7 434.98 September 2015 quarter 7 504.41 7 177.97 December 2015 quarter 7 677.78 7 174.72 SIM BALANCED FUND B7
December 2014 quarter 7 304.21 6 926.80 March 2015 quarter 7 500.82 7 073.11 June 2015 quarter 7 691.86 7 425.23 September 2015 quarter 7 501.27 7 173.11 December 2015 quarter 7 665.93 7 160.01 SIM BALANCED FUND B8
December 2014 quarter - - March 2015 quarter 7 499.14 7 069.37 June 2015 quarter 7 691.69 7 425.07 September 2015 quarter 7 501.82 7 173.63 December 2015 quarter 7 666.49 7 160.53 SIM BALANCED FUND B9
December 2014 quarter 7 274.13 6 907.29 March 2015 quarter 7 497.52 7 071.24 June 2015 quarter 7 685.32 7 412.55 September 2015 quarter 7 497.32 7 166.97 December 2015 quarter 7 651.01 7 141.49 SIM BALANCED FUND R
December 2014 quarter 7 287.73 6 917.02 March 2015 quarter 7 497.92 7 071.86 June 2015 quarter 7 686.93 7 415.33 September 2015 quarter 7 498.08 7 168.16 December 2015 quarter 7 653.89 7 145.06 SIM BOND PLUS FUND
December 2014 quarter 882.57 828.28 March 2015 quarter 891.23 832.47 June 2015 quarter 871.24 833.68 September 2015 quarter 833.11 808.48 December 2015 quarter 830.48 722.73 SIM BOND PLUS FUND B2
December 2014 quarter 884.78 829.62 March 2015 quarter 891.66 832.48 June 2015 quarter 872.68 836.07 September 2015 quarter 833.63 809.36 December 2015 quarter 832.40 724.69 SIM BOND PLUS FUND B3
December 2014 quarter 885.59 830.11 March 2015 quarter 891.81 832.49 June 2015 quarter 873.20 836.94 September 2015 quarter 833.85 809.70 December 2015 quarter 833.14 725.43
270

QUARTERLY REVIEW OF FLUCTUATIONS OF UNIT PRICES (IN CENTS)
Fund Name Maximum Minimum
Selling price
SIM ENHANCED YIELD FUND A1
December 2014 quarter 103.18 101.57 March 2015 quarter 103.46 102.00 June 2015 quarter 102.79 101.97 September 2015 quarter 102.62 101.88 December 2015 quarter 102.85 100.57 SIM ENHANCED YIELD FUND B1
December 2014 quarter 103.19 101.57 March 2015 quarter 103.45 101.99 June 2015 quarter 102.79 101.97 September 2015 quarter 102.63 101.88 December 2015 quarter 102.86 100.57 SIM ENHANCED YIELD FUND B2
December 2014 quarter 103.20 101.57 March 2015 quarter 103.47 102.00 June 2015 quarter 102.80 101.98 September 2015 quarter 102.63 101.88 December 2015 quarter 102.86 100.57 SIM ENHANCED YIELD FUND B3
December 2014 quarter 103.22 101.57 March 2015 quarter 103.49 102.00 June 2015 quarter 102.83 101.97 September 2015 quarter 102.66 101.88 December 2015 quarter 102.89 100.59 SIM FINANCIAL FUND
December 2014 quarter 5 989.80 5 152.37 March 2015 quarter 6 507.69 5 713.47 June 2015 quarter 6 907.26 6 353.60 September 2015 quarter 6 792.45 6 053.13 December 2015 quarter 6 643.12 5 228.00 SIM FINANCIAL FUND B1
December 2014 quarter 5 971.06 5 141.55 March 2015 quarter 6 497.85 5 706.67 June 2015 quarter 6 893.92 6 334.67 September 2015 quarter 6 788.28 6 043.29 December 2015 quarter 6 628.97 5 212.37 SIM FINANCIAL FUND B2
December 2014 quarter 6 018.81 5 169.41 March 2015 quarter 6 523.47 5 712.20 June 2015 quarter 6 928.39 6 383.07 September 2015 quarter 6 798.46 6 065.05 December 2015 quarter 6 664.15 5 251.34 SIM GENERAL EQUITY FUND A
December 2014 quarter 20 363.01 18 698.57 March 2015 quarter 21 392.01 19 443.65 June 2015 quarter 22 393.79 20 900.21 September 2015 quarter 21 520.87 19 508.40 December 2015 quarter 21 943.96 19 542.27 SIM GENERAL EQUITY FUND A1
December 2014 quarter - - March 2015 quarter 21 415.60 19 446.09 June 2015 quarter 22 416.17 20 892.33 September 2015 quarter 21 534.79 19 564.48 December 2015 quarter 22 028.89 19 625.58 SIM GENERAL EQUITY FUND A2
December 2014 quarter - - March 2015 quarter 21 424.65 19 454.71 June 2015 quarter 22 445.89 20 919.90 September 2015 quarter 21 552.76 19 597.03 December 2015 quarter 22 105.19 19 711.74
271

QUARTERLY REVIEW OF FLUCTUATIONS OF UNIT PRICES (IN CENTS)
Fund Name Maximum Minimum
Selling price
SIM GENERAL EQUITY FUND B1
December 2014 quarter 20 314.97 18 631.39 March 2015 quarter 21 325.53 19 416.91 June 2015 quarter 22 301.51 20 855.22 September 2015 quarter 21 485.59 19 492.95 December 2015 quarter 21 899.90 19 491.00 SIM GENERAL EQUITY FUND B10
December 2014 quarter - - March 2015 quarter 21 342.48 19 438.68 June 2015 quarter 22 318.84 20 873.85 September 2015 quarter 21 511.53 19 525.49 December 2015 quarter 21 943.02 19 529.90 SIM GENERAL EQUITY FUND B11
December 2014 quarter - - March 2015 quarter 21 424.65 19 454.91 June 2015 quarter 22 448.90 20 921.68 September 2015 quarter 21 554.42 19 599.16 December 2015 quarter 22 110.20 19 717.41 SIM GENERAL EQUITY FUND B12
December 2014 quarter - - March 2015 quarter - - June 2015 quarter - - September 2015 quarter 21 562.32 19 610.92 December 2015 quarter 22 143.13 19 755.78 SIM GENERAL EQUITY FUND B4
December 2014 quarter 20 378.30 18 709.21 March 2015 quarter 21 402.28 19 445.75 June 2015 quarter 22 410.08 20 906.03 September 2015 quarter 21 539.47 19 564.62 December 2015 quarter 22 035.33 19 636.49 SIM GENERAL EQUITY FUND B5
December 2014 quarter 20 437.79 18 755.53 March 2015 quarter 21 423.72 19 452.66 June 2015 quarter 22 445.38 20 921.07 September 2015 quarter 21 547.86 19 586.20 December 2015 quarter 22 086.88 19 694.05 SIM GENERAL EQUITY FUND B6
December 2014 quarter 20 418.09 18 741.21 March 2015 quarter 21 417.10 19 449.07 June 2015 quarter 22 432.51 20 914.34 September 2015 quarter 21 544.40 19 577.68 December 2015 quarter 22 066.74 19 670.98 SIM GENERAL EQUITY FUND B7
December 2014 quarter - - March 2015 quarter 21 418.58 19 452.51 June 2015 quarter 22 439.35 20 915.81 September 2015 quarter 21 550.53 19 592.15 December 2015 quarter 22 092.27 19 696.83 SIM GENERAL EQUITY FUND B8
December 2014 quarter - - March 2015 quarter 21 420.71 19 451.50 June 2015 quarter 22 434.97 20 911.58 September 2015 quarter 21 547.14 19 586.69 December 2015 quarter 22 078.70 19 681.33 SIM GENERAL EQUITY FUND B9
December 2014 quarter 20 379.02 18 712.14 March 2015 quarter 21 393.01 19 444.35 June 2015 quarter 22 396.09 20 900.64 September 2015 quarter 21 537.09 19 560.04 December 2015 quarter 22 022.41 19 621.36
272

QUARTERLY REVIEW OF FLUCTUATIONS OF UNIT PRICES (IN CENTS)
Fund Name Maximum Minimum
Selling price
SIM GENERAL EQUITY FUND R
December 2014 quarter 20 409.93 18 736.05 March 2015 quarter 21 399.23 19 446.18 June 2015 quarter 22 406.18 20 904.24 September 2015 quarter 21 543.18 19 577.66 December 2015 quarter 22 055.91 19 655.23 SIM GLOBAL BEST IDEAS FEEDER FUND A
December 2014 quarter 1 334.71 1 173.28 March 2015 quarter 1 394.33 1 245.80 June 2015 quarter 1 450.40 1 323.90 September 2015 quarter 1 460.31 1 335.09 December 2015 quarter 1 690.30 1 441.14 SIM GLOBAL BEST IDEAS FEEDER FUND A1
December 2014 quarter 1 358.96 1 196.93 March 2015 quarter 1 419.30 1 270.42 June 2015 quarter 1 478.74 1 349.14 September 2015 quarter 1 489.93 1 362.04 December 2015 quarter 1 725.86 1 470.90 SIM GLOBAL BEST IDEAS FEEDER FUND B1
December 2014 quarter 1 400.26 1 236.82 March 2015 quarter 1 462.32 1 312.63 June 2015 quarter 1 530.39 1 392.79 September 2015 quarter 1 544.87 1 411.93 December 2015 quarter 1 792.60 1 526.59 SIM GLOBAL BEST IDEAS FEEDER FUND B2
December 2014 quarter 1 382.50 1 219.85 March 2015 quarter 1 443.60 1 294.36 June 2015 quarter 1 506.37 1 373.72 September 2015 quarter 1 518.89 1 388.39 December 2015 quarter 1 760.71 1 500.02 SIM GLOBAL BEST IDEAS FEEDER FUND C
December 2014 quarter 1 266.88 1 107.71 March 2015 quarter 1 323.70 1 176.50 June 2015 quarter 1 369.39 1 252.26 September 2015 quarter 1 374.71 1 257.30 December 2015 quarter 1 586.49 1 354.71 SIM GLOBAL EQUITY INCOME FEEDER FUND A1
December 2014 quarter 1 274.56 1 131.92 March 2015 quarter 1 336.10 1 186.41 June 2015 quarter 1 434.43 1 281.15 September 2015 quarter 1 477.91 1 345.33 December 2015 quarter 1 737.48 1 491.50 SIM GLOBAL EQUITY INCOME FEEDER FUND B1
December 2014 quarter 1 275.55 1 132.54 March 2015 quarter 1 336.48 1 186.46 June 2015 quarter 1 435.46 1 281.71 September 2015 quarter 1 478.57 1 345.37 December 2015 quarter 1 738.87 1 492.34 SIM GLOBAL FINANCIAL FEEDER FUND A1
December 2014 quarter 1 938.49 1 776.69 March 2015 quarter 1 992.16 1 793.74 June 2015 quarter 2 083.03 1 901.65 September 2015 quarter 2 081.71 1 833.87 December 2015 quarter 2 282.12 2 049.17 SIM GLOBAL FINANCIAL FEEDER FUND B1
December 2014 quarter 1 952.48 1 789.98 March 2015 quarter 2 007.50 1 808.57 June 2015 quarter 2 101.24 1 917.40 September 2015 quarter 2 100.72 1 851.09 December 2015 quarter 2 305.48 2 069.35
273

QUARTERLY REVIEW OF FLUCTUATIONS OF UNIT PRICES (IN CENTS)
Fund Name Maximum Minimum
Selling price
SIM GLOBAL FINANCIAL FEEDER FUND B2
December 2014 quarter 1 992.28 1 827.62 March 2015 quarter 2 050.35 1 849.85 June 2015 quarter 2 152.58 1 961.52 September 2015 quarter 2 153.90 1 899.42 December 2015 quarter 2 371.70 2 126.27 SIM INDEX FUND
December 2014 quarter 12 379.66 11 373.56 March 2015 quarter 12 774.47 11 372.99 June 2015 quarter 13 392.57 12 562.72 September 2015 quarter - - December 2015 quarter - - SIM INDEX FUND A1
December 2014 quarter 12 410.23 11 396.45 March 2015 quarter 12 788.11 11 373.98 June 2015 quarter 13 418.29 12 582.22 September 2015 quarter - - December 2015 quarter - - SIM INDEX FUND B1
December 2014 quarter 12 300.66 11 299.57 March 2015 quarter 12 728.87 11 352.42 June 2015 quarter 13 322.06 12 505.56 September 2015 quarter - - December 2015 quarter - - SIM INDEX FUND B2
December 2014 quarter 12 412.85 11 398.42 March 2015 quarter 12 789.30 11 374.08 June 2015 quarter 13 420.51 12 583.91 September 2015 quarter - - December 2015 quarter - - SIM INDEX FUND RING
December 2014 quarter 12 293.05 12 125.42 March 2015 quarter - - June 2015 quarter - - September 2015 quarter - - December 2015 quarter - - SIM INDUSTRIAL FUND A
December 2014 quarter 16 816.17 14 817.46 March 2015 quarter 18 023.90 16 439.08 June 2015 quarter 19 226.32 18 141.56 September 2015 quarter 18 791.95 17 169.48 December 2015 quarter 20 108.89 18 888.47 SIM INDUSTRIAL FUND B1
December 2014 quarter 16 635.60 14 658.03 March 2015 quarter 17 833.13 16 267.94 June 2015 quarter 19 013.55 17 946.61 September 2015 quarter 18 557.42 16 944.39 December 2015 quarter 19 799.99 18 602.80 SIM INDUSTRIAL FUND B2
December 2014 quarter 16 933.15 14 900.79 March 2015 quarter 18 073.29 16 453.34 June 2015 quarter 19 292.60 18 192.84 September 2015 quarter 18 810.27 17 202.66 December 2015 quarter 20 216.87 18 983.04 SIM INDUSTRIAL FUND R
December 2014 quarter 16 896.76 14 879.45 March 2015 quarter 18 053.71 16 450.00 June 2015 quarter 19 266.27 18 173.03 September 2015 quarter 18 805.23 17 190.74 December 2015 quarter 20 172.14 18 944.08
274

QUARTERLY REVIEW OF FLUCTUATIONS OF UNIT PRICES (IN CENTS)
Fund Name Maximum Minimum
Selling price
SIM INFLATION PLUS FUND
December 2014 quarter 451.19 433.68 March 2015 quarter 459.18 440.49 June 2015 quarter 467.86 457.67 September 2015 quarter 465.23 455.22 December 2015 quarter 481.82 472.37 SIM INFLATION PLUS FUND B1
December 2014 quarter 448.44 432.05 March 2015 quarter 457.77 440.25 June 2015 quarter 465.36 456.15 September 2015 quarter 463.89 454.31 December 2015 quarter 478.78 469.63 SIM INFLATION PLUS FUND B2
December 2014 quarter 453.70 435.15 March 2015 quarter 460.43 440.65 June 2015 quarter 470.11 459.02 September 2015 quarter 466.45 455.83 December 2015 quarter 484.59 474.85 SIM INFLATION PLUS FUND B4
December 2014 quarter 452.18 434.24 March 2015 quarter 459.68 440.60 June 2015 quarter 468.75 458.21 September 2015 quarter 465.70 455.53 December 2015 quarter 482.91 473.35 SIM INFLATION PLUS FUND B6
December 2014 quarter 452.55 434.28 March 2015 quarter 459.62 440.58 June 2015 quarter 468.77 458.14 September 2015 quarter 465.66 455.49 December 2015 quarter 482.89 473.33 SIM INFLATION PLUS FUND B7
December 2014 quarter 451.69 433.97 March 2015 quarter 459.40 440.51 June 2015 quarter 468.28 457.91 September 2015 quarter 465.46 455.36 December 2015 quarter 482.36 472.85 SIM INFLATION PLUS FUND B8
December 2014 quarter 453.20 434.85 March 2015 quarter 460.19 440.65 June 2015 quarter 469.66 458.76 September 2015 quarter 466.19 455.82 December 2015 quarter 484.03 474.35 SIM INFLATION PLUS FUND B9
December 2014 quarter 451.19 433.67 March 2015 quarter 459.17 440.48 June 2015 quarter 467.85 457.66 September 2015 quarter 465.22 455.20 December 2015 quarter 481.81 472.36 SIM LOW EQUITY FUND A1
December 2014 quarter 144.45 138.69 March 2015 quarter 147.00 141.27 June 2015 quarter 149.91 146.51 September 2015 quarter 149.12 145.70 December 2015 quarter 154.67 151.30 SIM LOW EQUITY FUND B1
December 2014 quarter 144.44 138.67 March 2015 quarter 147.01 141.42 June 2015 quarter 149.92 146.52 September 2015 quarter 149.10 145.69 December 2015 quarter 154.65 151.28
275

QUARTERLY REVIEW OF FLUCTUATIONS OF UNIT PRICES (IN CENTS)
Fund Name Maximum Minimum
Selling price
SIM LOW EQUITY FUND B2
December 2014 quarter 145.50 139.31 March 2015 quarter 147.56 141.51 June 2015 quarter 150.87 147.11 September 2015 quarter 149.65 145.98 December 2015 quarter 155.80 152.31 SIM LOW EQUITY FUND B3
December 2014 quarter 144.72 138.82 March 2015 quarter 147.17 141.45 June 2015 quarter 150.19 146.69 September 2015 quarter 149.30 145.81 December 2015 quarter 155.01 151.61 SIM LOW EQUITY FUND B4
December 2014 quarter 144.86 138.92 March 2015 quarter 147.21 141.42 June 2015 quarter 150.28 146.74 September 2015 quarter 149.34 145.84 December 2015 quarter 155.12 151.71 SIM LOW EQUITY FUND C
December 2014 quarter 143.52 138.13 March 2015 quarter 146.55 141.35 June 2015 quarter 149.09 146.02 September 2015 quarter 148.64 145.38 December 2015 quarter 153.64 150.37 SIM MANAGED AGGRESSIVE FUND OF FUNDS A1
December 2014 quarter 2 356.25 2 191.81 March 2015 quarter 2 469.07 2 288.11 June 2015 quarter 2 549.69 2 447.37 September 2015 quarter 2 483.24 2 333.06 December 2015 quarter 2 559.98 2 383.69 SIM MANAGED AGGRESSIVE FUND OF FUNDS A2
December 2014 quarter - - March 2015 quarter 2 347.12 2 293.71 June 2015 quarter - - September 2015 quarter 2 489.34 2 338.58 December 2015 quarter 2 565.41 2 388.37 SIM MANAGED AGGRESSIVE FUND OF FUNDS B1
December 2014 quarter 2 362.40 2 196.36 March 2015 quarter 2 473.00 2 290.63 June 2015 quarter 2 554.62 2 451.78 September 2015 quarter 2 486.41 2 336.45 December 2015 quarter 2 565.43 2 389.67 SIM MANAGED AGGRESSIVE FUND OF FUNDS B2
December 2014 quarter 2 316.10 2 158.70 March 2015 quarter 2 441.45 2 266.77 June 2015 quarter 2 517.34 2 411.63 September 2015 quarter 2 456.27 2 305.88 December 2015 quarter 2 522.48 2 344.71 SIM MANAGED AGGRESSIVE FUND OF FUNDS B3
December 2014 quarter - - March 2015 quarter 2 347.73 2 294.13 June 2015 quarter - - September 2015 quarter 2 490.07 2 339.61 December 2015 quarter 2 567.90 2 391.53 SIM MANAGED AGGRESSIVE FUND OF FUNDS B4
December 2014 quarter 2 345.07 2 187.78 March 2015 quarter 2 467.30 2 292.71 June 2015 quarter 2 544.02 2 437.20 September 2015 quarter 2 486.05 2 333.84 December 2015 quarter 2 553.09 2 373.18
276
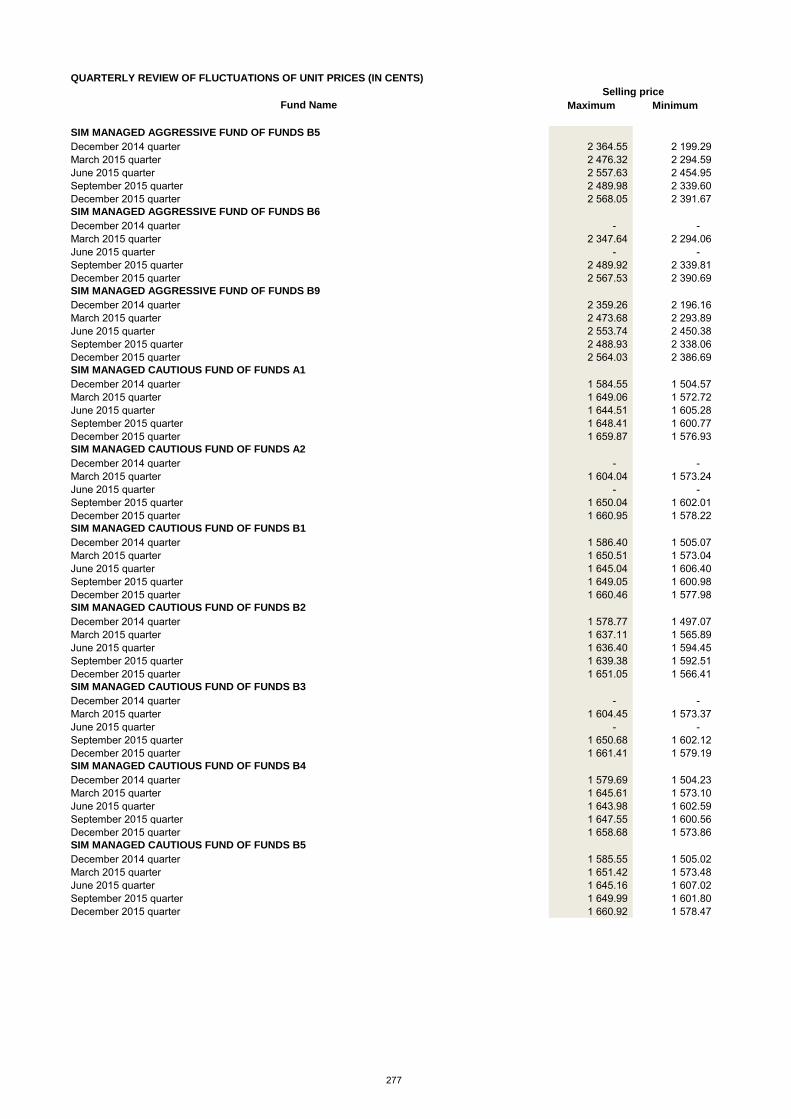
QUARTERLY REVIEW OF FLUCTUATIONS OF UNIT PRICES (IN CENTS)
Fund Name Maximum Minimum
Selling price
SIM MANAGED AGGRESSIVE FUND OF FUNDS B5
December 2014 quarter 2 364.55 2 199.29 March 2015 quarter 2 476.32 2 294.59 June 2015 quarter 2 557.63 2 454.95 September 2015 quarter 2 489.98 2 339.60 December 2015 quarter 2 568.05 2 391.67 SIM MANAGED AGGRESSIVE FUND OF FUNDS B6
December 2014 quarter - - March 2015 quarter 2 347.64 2 294.06 June 2015 quarter - - September 2015 quarter 2 489.92 2 339.81 December 2015 quarter 2 567.53 2 390.69 SIM MANAGED AGGRESSIVE FUND OF FUNDS B9
December 2014 quarter 2 359.26 2 196.16 March 2015 quarter 2 473.68 2 293.89 June 2015 quarter 2 553.74 2 450.38 September 2015 quarter 2 488.93 2 338.06 December 2015 quarter 2 564.03 2 386.69 SIM MANAGED CAUTIOUS FUND OF FUNDS A1
December 2014 quarter 1 584.55 1 504.57 March 2015 quarter 1 649.06 1 572.72 June 2015 quarter 1 644.51 1 605.28 September 2015 quarter 1 648.41 1 600.77 December 2015 quarter 1 659.87 1 576.93 SIM MANAGED CAUTIOUS FUND OF FUNDS A2
December 2014 quarter - - March 2015 quarter 1 604.04 1 573.24 June 2015 quarter - - September 2015 quarter 1 650.04 1 602.01 December 2015 quarter 1 660.95 1 578.22 SIM MANAGED CAUTIOUS FUND OF FUNDS B1
December 2014 quarter 1 586.40 1 505.07 March 2015 quarter 1 650.51 1 573.04 June 2015 quarter 1 645.04 1 606.40 September 2015 quarter 1 649.05 1 600.98 December 2015 quarter 1 660.46 1 577.98 SIM MANAGED CAUTIOUS FUND OF FUNDS B2
December 2014 quarter 1 578.77 1 497.07 March 2015 quarter 1 637.11 1 565.89 June 2015 quarter 1 636.40 1 594.45 September 2015 quarter 1 639.38 1 592.51 December 2015 quarter 1 651.05 1 566.41 SIM MANAGED CAUTIOUS FUND OF FUNDS B3
December 2014 quarter - - March 2015 quarter 1 604.45 1 573.37 June 2015 quarter - - September 2015 quarter 1 650.68 1 602.12 December 2015 quarter 1 661.41 1 579.19 SIM MANAGED CAUTIOUS FUND OF FUNDS B4
December 2014 quarter 1 579.69 1 504.23 March 2015 quarter 1 645.61 1 573.10 June 2015 quarter 1 643.98 1 602.59 September 2015 quarter 1 647.55 1 600.56 December 2015 quarter 1 658.68 1 573.86 SIM MANAGED CAUTIOUS FUND OF FUNDS B5
December 2014 quarter 1 585.55 1 505.02 March 2015 quarter 1 651.42 1 573.48 June 2015 quarter 1 645.16 1 607.02 September 2015 quarter 1 649.99 1 601.80 December 2015 quarter 1 660.92 1 578.47
277
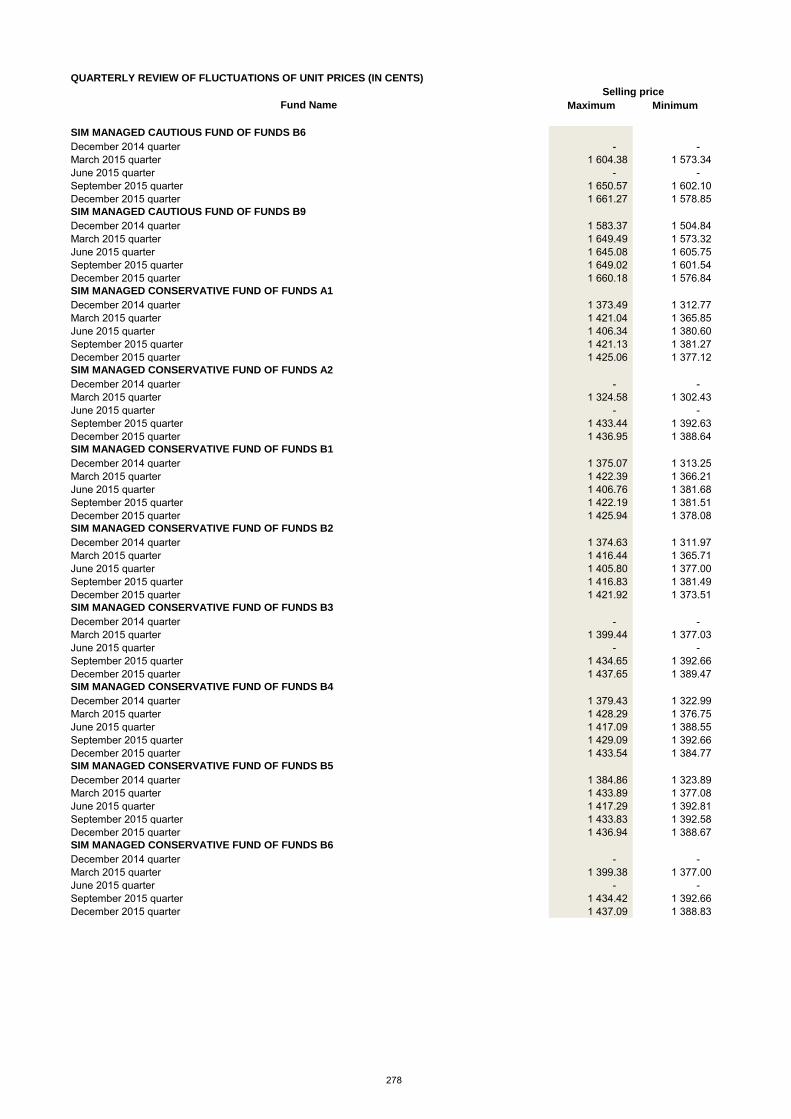
QUARTERLY REVIEW OF FLUCTUATIONS OF UNIT PRICES (IN CENTS)
Fund Name Maximum Minimum
Selling price
SIM MANAGED CAUTIOUS FUND OF FUNDS B6
December 2014 quarter - - March 2015 quarter 1 604.38 1 573.34 June 2015 quarter - - September 2015 quarter 1 650.57 1 602.10 December 2015 quarter 1 661.27 1 578.85 SIM MANAGED CAUTIOUS FUND OF FUNDS B9
December 2014 quarter 1 583.37 1 504.84 March 2015 quarter 1 649.49 1 573.32 June 2015 quarter 1 645.08 1 605.75 September 2015 quarter 1 649.02 1 601.54 December 2015 quarter 1 660.18 1 576.84 SIM MANAGED CONSERVATIVE FUND OF FUNDS A1
December 2014 quarter 1 373.49 1 312.77 March 2015 quarter 1 421.04 1 365.85 June 2015 quarter 1 406.34 1 380.60 September 2015 quarter 1 421.13 1 381.27 December 2015 quarter 1 425.06 1 377.12 SIM MANAGED CONSERVATIVE FUND OF FUNDS A2
December 2014 quarter - - March 2015 quarter 1 324.58 1 302.43 June 2015 quarter - - September 2015 quarter 1 433.44 1 392.63 December 2015 quarter 1 436.95 1 388.64 SIM MANAGED CONSERVATIVE FUND OF FUNDS B1
December 2014 quarter 1 375.07 1 313.25 March 2015 quarter 1 422.39 1 366.21 June 2015 quarter 1 406.76 1 381.68 September 2015 quarter 1 422.19 1 381.51 December 2015 quarter 1 425.94 1 378.08 SIM MANAGED CONSERVATIVE FUND OF FUNDS B2
December 2014 quarter 1 374.63 1 311.97 March 2015 quarter 1 416.44 1 365.71 June 2015 quarter 1 405.80 1 377.00 September 2015 quarter 1 416.83 1 381.49 December 2015 quarter 1 421.92 1 373.51 SIM MANAGED CONSERVATIVE FUND OF FUNDS B3
December 2014 quarter - - March 2015 quarter 1 399.44 1 377.03 June 2015 quarter - - September 2015 quarter 1 434.65 1 392.66 December 2015 quarter 1 437.65 1 389.47 SIM MANAGED CONSERVATIVE FUND OF FUNDS B4
December 2014 quarter 1 379.43 1 322.99 March 2015 quarter 1 428.29 1 376.75 June 2015 quarter 1 417.09 1 388.55 September 2015 quarter 1 429.09 1 392.66 December 2015 quarter 1 433.54 1 384.77 SIM MANAGED CONSERVATIVE FUND OF FUNDS B5
December 2014 quarter 1 384.86 1 323.89 March 2015 quarter 1 433.89 1 377.08 June 2015 quarter 1 417.29 1 392.81 September 2015 quarter 1 433.83 1 392.58 December 2015 quarter 1 436.94 1 388.67 SIM MANAGED CONSERVATIVE FUND OF FUNDS B6
December 2014 quarter - - March 2015 quarter 1 399.38 1 377.00 June 2015 quarter - - September 2015 quarter 1 434.42 1 392.66 December 2015 quarter 1 437.09 1 388.83
278

QUARTERLY REVIEW OF FLUCTUATIONS OF UNIT PRICES (IN CENTS)
Fund Name Maximum Minimum
Selling price
SIM MANAGED CONSERVATIVE FUND OF FUNDS B9
December 2014 quarter 1 382.77 1 323.58 March 2015 quarter 1 431.61 1 376.95 June 2015 quarter 1 417.52 1 391.27 September 2015 quarter 1 432.03 1 392.42 December 2015 quarter 1 435.86 1 387.44 SIM MANAGED MODERATE AGGRESSIVE FUND OF FUNDS A1
December 2014 quarter 2 011.39 1 889.80 March 2015 quarter 2 089.22 1 959.38 June 2015 quarter 2 142.64 2 072.51 September 2015 quarter 2 095.42 1 995.03 December 2015 quarter 2 156.14 2 033.25 SIM MANAGED MODERATE AGGRESSIVE FUND OF FUNDS A2
December 2014 quarter - - March 2015 quarter 2 010.54 1 972.87 June 2015 quarter - - September 2015 quarter 2 108.90 2 007.75 December 2015 quarter 2 169.18 2 045.17 SIM MANAGED MODERATE AGGRESSIVE FUND OF FUNDS B1
December 2014 quarter 2 015.31 1 892.35 March 2015 quarter 2 091.29 1 960.12 June 2015 quarter 2 145.49 2 076.16 September 2015 quarter 2 096.88 1 996.66 December 2015 quarter 2 159.36 2 037.07 SIM MANAGED MODERATE AGGRESSIVE FUND OF FUNDS B2
December 2014 quarter 1 996.61 1 881.13 March 2015 quarter 2 086.19 1 958.83 June 2015 quarter 2 136.30 2 061.88 September 2015 quarter 2 091.84 1 990.53 December 2015 quarter 2 144.76 2 019.03 SIM MANAGED MODERATE AGGRESSIVE FUND OF FUNDS B3
December 2014 quarter - - March 2015 quarter 2 011.06 1 973.03 June 2015 quarter - - September 2015 quarter 2 109.61 2 008.58 December 2015 quarter 2 171.31 2 047.97 SIM MANAGED MODERATE AGGRESSIVE FUND OF FUNDS B4
December 2014 quarter - - March 2015 quarter 2 010.98 1 972.99 June 2015 quarter - - September 2015 quarter 2 109.38 2 008.28 December 2015 quarter 2 170.48 2 046.79 SIM MANAGED MODERATE AGGRESSIVE FUND OF FUNDS B5
December 2014 quarter 2 026.72 1 904.45 March 2015 quarter 2 103.57 1 973.10 June 2015 quarter 2 157.75 2 087.58 September 2015 quarter 2 109.78 2 008.83 December 2015 quarter 2 171.80 2 048.42 SIM MANAGED MODERATE AGGRESSIVE FUND OF FUNDS B9
December 2014 quarter 2 022.34 1 901.92 March 2015 quarter 2 101.61 1 972.93 June 2015 quarter 2 154.76 2 083.48 September 2015 quarter 2 108.70 2 007.47 December 2015 quarter 2 168.37 2 044.13 SIM MANAGED MODERATE FUND OF FUNDS A1
December 2014 quarter 2 000.46 1 889.67 March 2015 quarter 2 067.74 1 951.87 June 2015 quarter 2 108.55 2 048.08 September 2015 quarter 2 067.54 1 980.42 December 2015 quarter 2 122.80 1 997.89
279
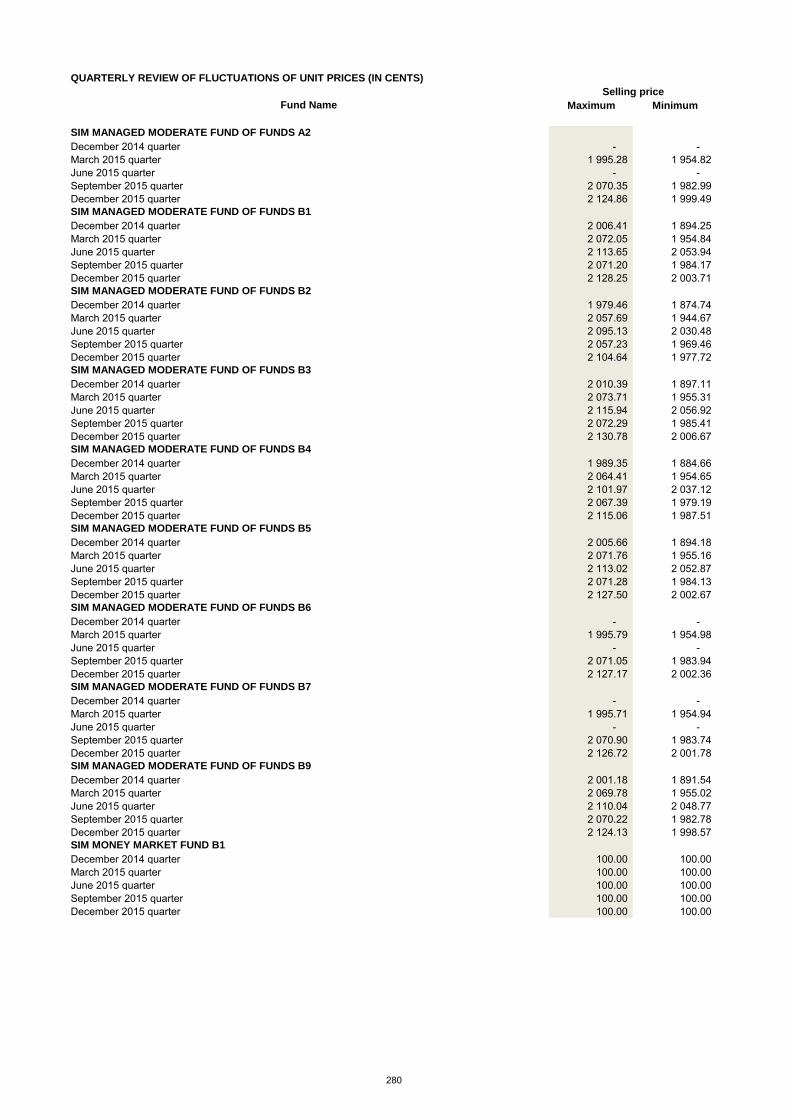
QUARTERLY REVIEW OF FLUCTUATIONS OF UNIT PRICES (IN CENTS)
Fund Name Maximum Minimum
Selling price
SIM MANAGED MODERATE FUND OF FUNDS A2
December 2014 quarter - - March 2015 quarter 1 995.28 1 954.82 June 2015 quarter - - September 2015 quarter 2 070.35 1 982.99 December 2015 quarter 2 124.86 1 999.49 SIM MANAGED MODERATE FUND OF FUNDS B1
December 2014 quarter 2 006.41 1 894.25 March 2015 quarter 2 072.05 1 954.84 June 2015 quarter 2 113.65 2 053.94 September 2015 quarter 2 071.20 1 984.17 December 2015 quarter 2 128.25 2 003.71 SIM MANAGED MODERATE FUND OF FUNDS B2
December 2014 quarter 1 979.46 1 874.74 March 2015 quarter 2 057.69 1 944.67 June 2015 quarter 2 095.13 2 030.48 September 2015 quarter 2 057.23 1 969.46 December 2015 quarter 2 104.64 1 977.72 SIM MANAGED MODERATE FUND OF FUNDS B3
December 2014 quarter 2 010.39 1 897.11 March 2015 quarter 2 073.71 1 955.31 June 2015 quarter 2 115.94 2 056.92 September 2015 quarter 2 072.29 1 985.41 December 2015 quarter 2 130.78 2 006.67 SIM MANAGED MODERATE FUND OF FUNDS B4
December 2014 quarter 1 989.35 1 884.66 March 2015 quarter 2 064.41 1 954.65 June 2015 quarter 2 101.97 2 037.12 September 2015 quarter 2 067.39 1 979.19 December 2015 quarter 2 115.06 1 987.51 SIM MANAGED MODERATE FUND OF FUNDS B5
December 2014 quarter 2 005.66 1 894.18 March 2015 quarter 2 071.76 1 955.16 June 2015 quarter 2 113.02 2 052.87 September 2015 quarter 2 071.28 1 984.13 December 2015 quarter 2 127.50 2 002.67 SIM MANAGED MODERATE FUND OF FUNDS B6
December 2014 quarter - - March 2015 quarter 1 995.79 1 954.98 June 2015 quarter - - September 2015 quarter 2 071.05 1 983.94 December 2015 quarter 2 127.17 2 002.36 SIM MANAGED MODERATE FUND OF FUNDS B7
December 2014 quarter - - March 2015 quarter 1 995.71 1 954.94 June 2015 quarter - - September 2015 quarter 2 070.90 1 983.74 December 2015 quarter 2 126.72 2 001.78 SIM MANAGED MODERATE FUND OF FUNDS B9
December 2014 quarter 2 001.18 1 891.54 March 2015 quarter 2 069.78 1 955.02 June 2015 quarter 2 110.04 2 048.77 September 2015 quarter 2 070.22 1 982.78 December 2015 quarter 2 124.13 1 998.57 SIM MONEY MARKET FUND B1
December 2014 quarter 100.00 100.00 March 2015 quarter 100.00 100.00 June 2015 quarter 100.00 100.00 September 2015 quarter 100.00 100.00 December 2015 quarter 100.00 100.00
280
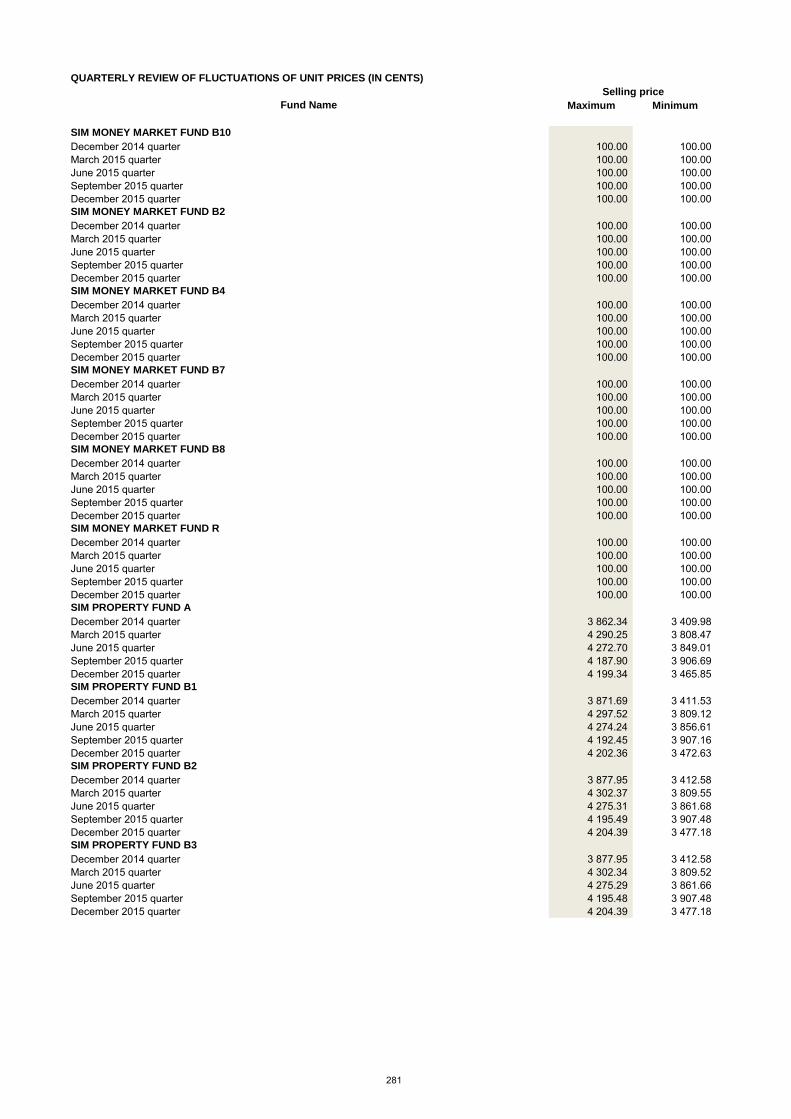
QUARTERLY REVIEW OF FLUCTUATIONS OF UNIT PRICES (IN CENTS)
Fund Name Maximum Minimum
Selling price
SIM MONEY MARKET FUND B10
December 2014 quarter 100.00 100.00 March 2015 quarter 100.00 100.00 June 2015 quarter 100.00 100.00 September 2015 quarter 100.00 100.00 December 2015 quarter 100.00 100.00 SIM MONEY MARKET FUND B2
December 2014 quarter 100.00 100.00 March 2015 quarter 100.00 100.00 June 2015 quarter 100.00 100.00 September 2015 quarter 100.00 100.00 December 2015 quarter 100.00 100.00 SIM MONEY MARKET FUND B4
December 2014 quarter 100.00 100.00 March 2015 quarter 100.00 100.00 June 2015 quarter 100.00 100.00 September 2015 quarter 100.00 100.00 December 2015 quarter 100.00 100.00 SIM MONEY MARKET FUND B7
December 2014 quarter 100.00 100.00 March 2015 quarter 100.00 100.00 June 2015 quarter 100.00 100.00 September 2015 quarter 100.00 100.00 December 2015 quarter 100.00 100.00 SIM MONEY MARKET FUND B8
December 2014 quarter 100.00 100.00 March 2015 quarter 100.00 100.00 June 2015 quarter 100.00 100.00 September 2015 quarter 100.00 100.00 December 2015 quarter 100.00 100.00 SIM MONEY MARKET FUND R
December 2014 quarter 100.00 100.00 March 2015 quarter 100.00 100.00 June 2015 quarter 100.00 100.00 September 2015 quarter 100.00 100.00 December 2015 quarter 100.00 100.00 SIM PROPERTY FUND A
December 2014 quarter 3 862.34 3 409.98 March 2015 quarter 4 290.25 3 808.47 June 2015 quarter 4 272.70 3 849.01 September 2015 quarter 4 187.90 3 906.69 December 2015 quarter 4 199.34 3 465.85 SIM PROPERTY FUND B1
December 2014 quarter 3 871.69 3 411.53 March 2015 quarter 4 297.52 3 809.12 June 2015 quarter 4 274.24 3 856.61 September 2015 quarter 4 192.45 3 907.16 December 2015 quarter 4 202.36 3 472.63 SIM PROPERTY FUND B2
December 2014 quarter 3 877.95 3 412.58 March 2015 quarter 4 302.37 3 809.55 June 2015 quarter 4 275.31 3 861.68 September 2015 quarter 4 195.49 3 907.48 December 2015 quarter 4 204.39 3 477.18 SIM PROPERTY FUND B3
December 2014 quarter 3 877.95 3 412.58 March 2015 quarter 4 302.34 3 809.52 June 2015 quarter 4 275.29 3 861.66 September 2015 quarter 4 195.48 3 907.48 December 2015 quarter 4 204.39 3 477.18
281

QUARTERLY REVIEW OF FLUCTUATIONS OF UNIT PRICES (IN CENTS)
Fund Name Maximum Minimum
Selling price
SIM PROPERTY FUND B9
December 2014 quarter 3 862.34 3 409.98 March 2015 quarter 4 290.25 3 808.43 June 2015 quarter 4 272.68 3 849.02 September 2015 quarter 4 187.90 3 906.60 December 2015 quarter 4 199.34 3 465.85 SIM RESOURCES FUND
December 2014 quarter 576.45 473.25 March 2015 quarter 528.21 446.67 June 2015 quarter 535.43 476.71 September 2015 quarter 463.53 378.95 December 2015 quarter 430.35 333.27 SIM SMALL CAP FUND A
December 2014 quarter 5 694.91 5 113.98 March 2015 quarter 5 984.53 5 621.11 June 2015 quarter 6 150.14 5 880.28 September 2015 quarter 6 180.18 5 824.98 December 2015 quarter 6 319.49 5 698.60 SIM SMALL CAP FUND B1
December 2014 quarter 5 657.87 5 084.55 March 2015 quarter 5 949.24 5 592.04 June 2015 quarter 6 104.50 5 842.20 September 2015 quarter 6 146.10 5 790.79 December 2015 quarter 6 273.34 5 653.60 SIM SMALL CAP FUND B2
December 2014 quarter 5 713.46 5 124.77 March 2015 quarter 5 991.59 5 621.86 June 2015 quarter 6 166.64 5 890.19 September 2015 quarter 6 184.70 5 831.30 December 2015 quarter 6 335.49 5 716.46 SIM SMALL CAP FUND B3
December 2014 quarter 5 722.78 5 130.19 March 2015 quarter 5 995.12 5 622.21 June 2015 quarter 6 174.91 5 895.15 September 2015 quarter 6 186.96 5 834.48 December 2015 quarter 6 343.51 5 725.41 SIM SMALL CAP FUND B9
December 2014 quarter 5 694.92 5 113.98 March 2015 quarter 5 984.51 5 621.13 June 2015 quarter 6 150.12 5 880.26 September 2015 quarter 6 180.17 5 824.97 December 2015 quarter 6 319.48 5 698.59 SIM SMALL CAP FUND R
December 2014 quarter 5 710.38 5 122.98 March 2015 quarter 5 990.41 5 621.59 June 2015 quarter 6 163.89 5 888.53 September 2015 quarter 6 183.94 5 830.25 December 2015 quarter 6 332.82 5 713.48 SIM SWAZILAND MONEY MARKET FUND A1
December 2014 quarter - - March 2015 quarter - - June 2015 quarter - - September 2015 quarter - - December 2015 quarter 100.00 100.00 SIM TOP CHOICE EQUITY FUND A1
December 2014 quarter 2 864.45 2 621.05 March 2015 quarter 2 990.31 2 727.72 June 2015 quarter 3 171.36 2 970.70 September 2015 quarter 3 032.63 2 744.72 December 2015 quarter 3 124.24 2 761.34
282

QUARTERLY REVIEW OF FLUCTUATIONS OF UNIT PRICES (IN CENTS)
Fund Name Maximum Minimum
Selling price
SIM TOP CHOICE EQUITY FUND A2
December 2014 quarter - - March 2015 quarter 2 828.26 2 727.20 June 2015 quarter - - September 2015 quarter - - December 2015 quarter - - SIM TOP CHOICE EQUITY FUND B1
December 2014 quarter 2 883.81 2 636.81 March 2015 quarter 2 996.66 2 728.97 June 2015 quarter 3 181.59 2 978.13 September 2015 quarter 3 034.11 2 748.74 December 2015 quarter 3 135.35 2 774.75 SIM TOP CHOICE EQUITY FUND B2
December 2014 quarter 2 862.40 2 618.22 March 2015 quarter 2 993.13 2 728.27 June 2015 quarter 3 175.91 2 974.00 September 2015 quarter 3 033.30 2 746.51 December 2015 quarter 3 128.76 2 766.11 SIM TOP CHOICE EQUITY FUND B4
December 2014 quarter 2 870.53 2 626.32 March 2015 quarter 2 991.39 2 727.93 June 2015 quarter 3 173.09 2 971.96 September 2015 quarter 3 032.93 2 745.39 December 2015 quarter 3 125.97 2 763.28 SIM TOP CHOICE EQUITY FUND B5
December 2014 quarter 2 867.91 2 623.14 March 2015 quarter 2 993.83 2 728.41 June 2015 quarter 3 177.04 2 974.82 September 2015 quarter 3 033.45 2 746.95 December 2015 quarter 3 130.04 2 767.72 SIM TOP CHOICE EQUITY FUND B6
December 2014 quarter - - March 2015 quarter 2 828.88 2 727.65 June 2015 quarter - - September 2015 quarter - - December 2015 quarter - - SIM TOP CHOICE EQUITY FUND B9
December 2014 quarter 2 865.01 2 621.54 March 2015 quarter 2 990.36 2 727.72 June 2015 quarter 3 171.44 2 970.76 September 2015 quarter 3 032.65 2 744.74 December 2015 quarter 3 124.28 2 761.39 SIM TOP CHOICE EQUITY FUND C
December 2014 quarter 2 834.65 2 595.82 March 2015 quarter 2 969.15 2 714.09 June 2015 quarter 3 143.83 2 942.24 September 2015 quarter 3 018.58 2 727.96 December 2015 quarter 3 095.92 2 732.61 SIM VALUE FUND
December 2014 quarter 3 537.42 3 296.45 March 2015 quarter 3 679.82 3 371.68 June 2015 quarter 3 861.82 3 639.71 September 2015 quarter 3 672.19 3 378.10 December 2015 quarter 3 625.18 3 080.63 SIM VALUE FUND A1
December 2014 quarter - - March 2015 quarter 3 677.12 3 371.50 June 2015 quarter 3 865.07 3 643.34 September 2015 quarter 3 671.96 3 377.58 December 2015 quarter 3 624.15 3 079.17
283

QUARTERLY REVIEW OF FLUCTUATIONS OF UNIT PRICES (IN CENTS)
Fund Name Maximum Minimum
Selling price
SIM VALUE FUND B1
December 2014 quarter 3 530.32 3 282.20 March 2015 quarter 3 669.18 3 364.28 June 2015 quarter 3 844.23 3 625.86 September 2015 quarter 3 664.49 3 368.40 December 2015 quarter 3 609.13 3 064.05 SIM VALUE FUND B10
December 2014 quarter - - March 2015 quarter - - June 2015 quarter - - September 2015 quarter 3 675.40 3 386.30 December 2015 quarter 3 645.79 3 103.50 SIM VALUE FUND B2
December 2014 quarter 3 553.23 3 306.26 March 2015 quarter 3 684.31 3 372.93 June 2015 quarter 3 872.02 3 646.55 September 2015 quarter 3 673.75 3 382.56 December 2015 quarter 3 636.85 3 093.52 SIM VALUE FUND B3
December 2014 quarter 3 546.46 3 301.91 March 2015 quarter 3 682.48 3 372.41 June 2015 quarter 3 868.47 3 644.32 September 2015 quarter 3 673.01 3 380.37 December 2015 quarter 3 631.27 3 087.59 SIM VALUE FUND B5
December 2014 quarter 3 564.25 3 312.85 March 2015 quarter 3 687.59 3 373.83 June 2015 quarter 3 876.14 3 648.37 September 2015 quarter 3 674.88 3 385.63 December 2015 quarter 3 644.66 3 102.34 SIM VALUE FUND B6
December 2014 quarter 3 551.59 3 304.61 March 2015 quarter 3 684.28 3 372.89 June 2015 quarter 3 871.91 3 646.43 September 2015 quarter 3 673.57 3 381.95 December 2015 quarter 3 635.07 3 092.01 SIM VALUE FUND B7
December 2014 quarter 3 554.97 3 307.22 March 2015 quarter 3 684.87 3 373.24 June 2015 quarter 3 872.76 3 646.87 September 2015 quarter 3 673.75 3 382.40 December 2015 quarter 3 636.47 3 093.59 SIM VALUE FUND B8
December 2014 quarter - - March 2015 quarter 3 679.40 3 372.97 June 2015 quarter 3 870.92 3 646.06 September 2015 quarter 3 673.48 3 381.77 December 2015 quarter 3 634.81 3 091.21 SIM VALUE FUND B9
December 2014 quarter 3 537.70 3 296.72 March 2015 quarter 3 679.84 3 371.70 June 2015 quarter 3 861.84 3 639.73 September 2015 quarter 3 672.20 3 378.13 December 2015 quarter 3 625.25 3 080.69 SANLAM MULTI MANAGED ABSOLUTE SOLUTION 5 FUND OF FUNDS A
December 2014 quarter 1 556.66 1 465.53 March 2015 quarter 1 620.38 1 521.63 June 2015 quarter 1 645.21 1 602.17 September 2015 quarter 1 645.30 1 576.09 December 2015 quarter 1 672.46 1 601.45
284

QUARTERLY REVIEW OF FLUCTUATIONS OF UNIT PRICES (IN CENTS)
Fund Name Maximum Minimum
Selling price
SANLAM MULTI MANAGED ABSOLUTE SOLUTION 5 FUND OF FUNDS A2
December 2014 quarter 1 586.69 1 495.06 March 2015 quarter 1 650.27 1 551.17 June 2015 quarter 1 675.54 1 631.61 September 2015 quarter 1 675.86 1 605.52 December 2015 quarter 1 703.53 1 631.51 SANLAM MULTI MANAGED ABSOLUTE SOLUTION 5 FUND OF FUNDS B1
December 2014 quarter 1 587.11 1 495.14 March 2015 quarter 1 650.58 1 551.23 June 2015 quarter 1 675.64 1 631.60 September 2015 quarter 1 676.03 1 605.78 December 2015 quarter 1 703.68 1 631.86 SANLAM MULTI MANAGED ABSOLUTE SOLUTION 5 FUND OF FUNDS B2
December 2014 quarter 1 587.13 1 495.14 March 2015 quarter 1 650.60 1 551.23 June 2015 quarter 1 675.66 1 631.61 September 2015 quarter 1 676.04 1 605.81 December 2015 quarter 1 703.68 1 631.86 SANLAM MULTI MANAGED ABSOLUTE SOLUTION 5 FUND OF FUNDS B3
December 2014 quarter 1 586.76 1 495.10 March 2015 quarter 1 650.32 1 551.20 June 2015 quarter 1 631.60 1 631.60 September 2015 quarter - - December 2015 quarter - - SANLAM MULTI MANAGED ABSOLUTE SOLUTION 5 FUND OF FUNDS B4
December 2014 quarter 1 586.04 1 494.94 March 2015 quarter 1 649.79 1 551.07 June 2015 quarter 1 675.37 1 631.62 September 2015 quarter 1 675.59 1 605.11 December 2015 quarter 1 703.26 1 630.94 SANLAM MULTI MANAGED ABSOLUTE SOLUTION 5 FUND OF FUNDS B9
December 2014 quarter 1 585.59 1 494.88 March 2015 quarter 1 649.45 1 551.00 June 2015 quarter 1 675.22 1 631.60 September 2015 quarter 1 675.38 1 604.79 December 2015 quarter 1 703.06 1 630.54 SANLAM MULTI MANAGED ABSOLUTE SOLUTION 5 FUND OF FUNDS C
December 2014 quarter 1 539.41 1 452.01 March 2015 quarter 1 604.06 1 508.16 June 2015 quarter 1 630.99 1 587.63 September 2015 quarter 1 630.49 1 560.87 December 2015 quarter 1 657.50 1 585.09 SANLAM MULTI MANAGED ABSOLUTE SOLUTION 5 FUND OF FUNDS C2
December 2014 quarter 1 580.40 1 493.92 March 2015 quarter 1 645.55 1 550.12 June 2015 quarter 1 673.46 1 628.28 September 2015 quarter 1 673.19 1 601.45 December 2015 quarter 1 700.92 1 626.02 SANLAM MULTI MANAGED AGGRESSIVE FUND OF FUNDS A1
December 2014 quarter 1 727.47 1 618.28 March 2015 quarter 1 807.21 1 678.55 June 2015 quarter 1 861.21 1 781.32 September 2015 quarter 1 809.34 1 706.80 December 2015 quarter 1 846.18 1 702.68
285

QUARTERLY REVIEW OF FLUCTUATIONS OF UNIT PRICES (IN CENTS)
Fund Name Maximum Minimum
Selling price
SANLAM MULTI MANAGED AGGRESSIVE FUND OF FUNDS A2
December 2014 quarter 1 727.13 1 617.77 March 2015 quarter 1 806.54 1 678.59 June 2015 quarter 1 860.14 1 780.03 September 2015 quarter 1 809.17 1 706.56 December 2015 quarter 1 845.47 1 701.81 SANLAM MULTI MANAGED AGGRESSIVE FUND OF FUNDS B1
December 2014 quarter 1 717.79 1 607.94 March 2015 quarter 1 796.04 1 666.63 June 2015 quarter 1 850.54 1 771.87 September 2015 quarter 1 797.50 1 695.94 December 2015 quarter 1 835.64 1 693.53 SANLAM MULTI MANAGED AGGRESSIVE FUND OF FUNDS B9
December 2014 quarter 1 724.71 1 616.27 March 2015 quarter 1 805.86 1 678.36 June 2015 quarter 1 858.74 1 777.96 September 2015 quarter 1 808.63 1 705.74 December 2015 quarter 1 843.38 1 699.31 SANLAM MULTI MANAGED AGGRESSIVE FUND OF FUNDS C1
December 2014 quarter 1 706.11 1 600.26 March 2015 quarter 1 792.55 1 668.67 June 2015 quarter 1 841.33 1 758.01 September 2015 quarter 1 796.81 1 693.28 December 2015 quarter 1 824.55 1 679.43 SANLAM MULTI MANAGED BALANCED FUND OF FUNDS A
December 2014 quarter 4 675.13 4 355.41 March 2015 quarter 4 932.34 4 601.63 June 2015 quarter 5 074.58 4 919.14 September 2015 quarter 4 998.89 4 812.78 December 2015 quarter 5 166.41 4 844.86 SANLAM MULTI MANAGED BALANCED FUND OF FUNDS A2
December 2014 quarter 4 688.12 4 363.08 March 2015 quarter 4 937.46 4 602.07 June 2015 quarter 5 083.80 4 926.03 September 2015 quarter 5 001.67 4 816.82 December 2015 quarter 5 176.61 4 857.18 SANLAM MULTI MANAGED BALANCED FUND OF FUNDS B
December 2014 quarter 4 688.10 4 363.07 March 2015 quarter 4 937.41 4 602.06 June 2015 quarter 5 083.71 4 925.97 September 2015 quarter 5 001.67 4 816.80 December 2015 quarter 5 176.53 4 857.09 SANLAM MULTI MANAGED BALANCED FUND OF FUNDS B2
December 2014 quarter 4 691.91 4 365.33 March 2015 quarter 4 939.36 4 602.21 June 2015 quarter 5 087.34 4 928.45 September 2015 quarter 5 003.06 4 818.83 December 2015 quarter 5 181.63 4 863.23 SANLAM MULTI MANAGED BALANCED FUND OF FUNDS B3
December 2014 quarter 4 695.72 4 370.19 March 2015 quarter 4 945.81 4 602.05 June 2015 quarter 5 102.79 4 939.56 September 2015 quarter 5 004.10 4 821.68 December 2015 quarter 5 187.12 4 872.01 SANLAM MULTI MANAGED BALANCED FUND OF FUNDS B9
December 2014 quarter 4 680.96 4 358.72 March 2015 quarter 4 934.74 4 601.84 June 2015 quarter 5 079.16 4 922.43 September 2015 quarter 5 000.03 4 814.53 December 2015 quarter - -
286
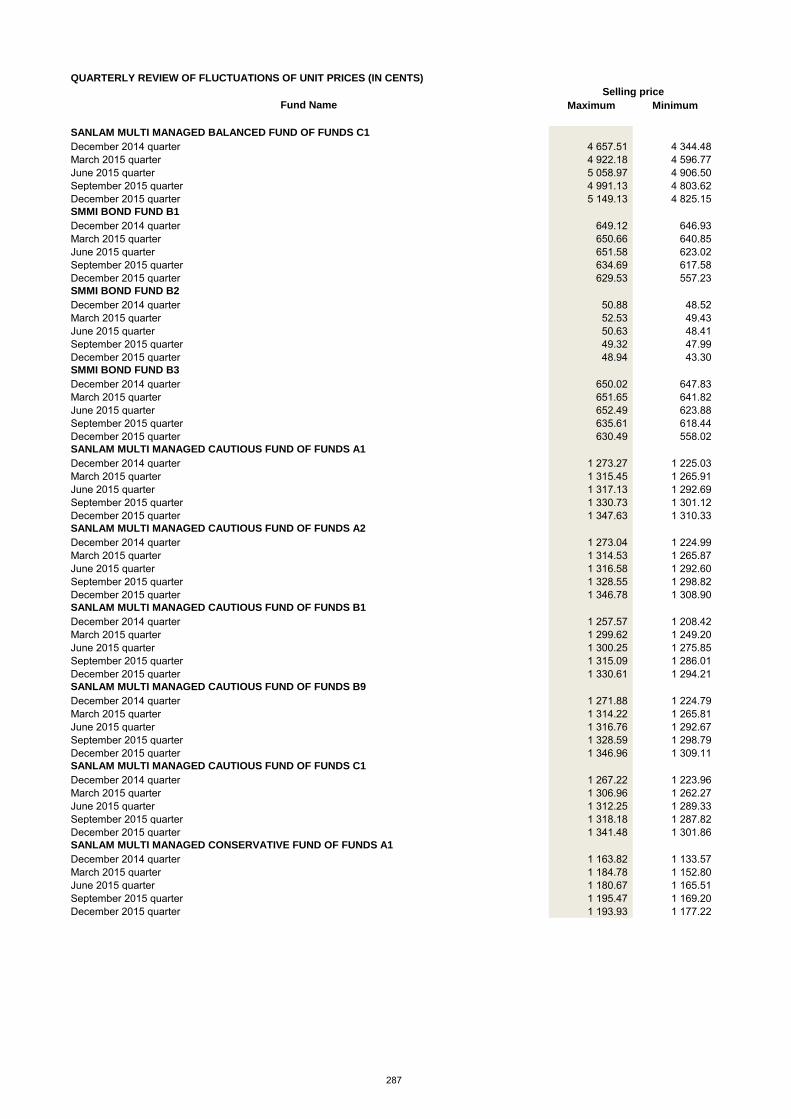
QUARTERLY REVIEW OF FLUCTUATIONS OF UNIT PRICES (IN CENTS)
Fund Name Maximum Minimum
Selling price
SANLAM MULTI MANAGED BALANCED FUND OF FUNDS C1
December 2014 quarter 4 657.51 4 344.48 March 2015 quarter 4 922.18 4 596.77 June 2015 quarter 5 058.97 4 906.50 September 2015 quarter 4 991.13 4 803.62 December 2015 quarter 5 149.13 4 825.15 SMMI BOND FUND B1
December 2014 quarter 649.12 646.93 March 2015 quarter 650.66 640.85 June 2015 quarter 651.58 623.02 September 2015 quarter 634.69 617.58 December 2015 quarter 629.53 557.23 SMMI BOND FUND B2
December 2014 quarter 50.88 48.52 March 2015 quarter 52.53 49.43 June 2015 quarter 50.63 48.41 September 2015 quarter 49.32 47.99 December 2015 quarter 48.94 43.30 SMMI BOND FUND B3
December 2014 quarter 650.02 647.83 March 2015 quarter 651.65 641.82 June 2015 quarter 652.49 623.88 September 2015 quarter 635.61 618.44 December 2015 quarter 630.49 558.02 SANLAM MULTI MANAGED CAUTIOUS FUND OF FUNDS A1
December 2014 quarter 1 273.27 1 225.03 March 2015 quarter 1 315.45 1 265.91 June 2015 quarter 1 317.13 1 292.69 September 2015 quarter 1 330.73 1 301.12 December 2015 quarter 1 347.63 1 310.33 SANLAM MULTI MANAGED CAUTIOUS FUND OF FUNDS A2
December 2014 quarter 1 273.04 1 224.99 March 2015 quarter 1 314.53 1 265.87 June 2015 quarter 1 316.58 1 292.60 September 2015 quarter 1 328.55 1 298.82 December 2015 quarter 1 346.78 1 308.90 SANLAM MULTI MANAGED CAUTIOUS FUND OF FUNDS B1
December 2014 quarter 1 257.57 1 208.42 March 2015 quarter 1 299.62 1 249.20 June 2015 quarter 1 300.25 1 275.85 September 2015 quarter 1 315.09 1 286.01 December 2015 quarter 1 330.61 1 294.21 SANLAM MULTI MANAGED CAUTIOUS FUND OF FUNDS B9
December 2014 quarter 1 271.88 1 224.79 March 2015 quarter 1 314.22 1 265.81 June 2015 quarter 1 316.76 1 292.67 September 2015 quarter 1 328.59 1 298.79 December 2015 quarter 1 346.96 1 309.11 SANLAM MULTI MANAGED CAUTIOUS FUND OF FUNDS C1
December 2014 quarter 1 267.22 1 223.96 March 2015 quarter 1 306.96 1 262.27 June 2015 quarter 1 312.25 1 289.33 September 2015 quarter 1 318.18 1 287.82 December 2015 quarter 1 341.48 1 301.86 SANLAM MULTI MANAGED CONSERVATIVE FUND OF FUNDS A1
December 2014 quarter 1 163.82 1 133.57 March 2015 quarter 1 184.78 1 152.80 June 2015 quarter 1 180.67 1 165.51 September 2015 quarter 1 195.47 1 169.20 December 2015 quarter 1 193.93 1 177.22
287

QUARTERLY REVIEW OF FLUCTUATIONS OF UNIT PRICES (IN CENTS)
Fund Name Maximum Minimum
Selling price
SANLAM MULTI MANAGED CONSERVATIVE FUND OF FUNDS A2
December 2014 quarter 1 163.59 1 133.56 March 2015 quarter 1 184.61 1 152.76 June 2015 quarter 1 180.43 1 165.52 September 2015 quarter 1 208.07 1 169.20 December 2015 quarter 1 193.92 1 177.27 SANLAM MULTI MANAGED CONSERVATIVE FUND OF FUNDS B1
December 2014 quarter 1 155.42 1 124.19 March 2015 quarter 1 176.23 1 143.44 June 2015 quarter 1 172.10 1 156.09 September 2015 quarter 1 183.53 1 159.65 December 2015 quarter 1 185.16 1 168.40 SANLAM MULTI MANAGED CONSERVATIVE FUND OF FUNDS B9
December 2014 quarter 1 162.69 1 133.55 March 2015 quarter 1 183.80 1 152.75 June 2015 quarter 1 179.51 1 165.50 September 2015 quarter 1 191.11 1 169.17 December 2015 quarter 1 192.69 1 176.20 SANLAM MULTI MANAGED CONSERVATIVE FUND OF FUNDS C1
December 2014 quarter 1 158.46 1 133.46 March 2015 quarter 1 180.10 1 152.50 June 2015 quarter 1 175.64 1 165.46 September 2015 quarter 1 186.74 1 169.08 December 2015 quarter 1 189.73 1 172.60 SANLAM MULTI MANAGED DEFENSIVE FUND OF FUNDS
December 2014 quarter 2 474.08 2 389.88 March 2015 quarter 2 518.15 2 447.28 June 2015 quarter 2 542.24 2 509.12 September 2015 quarter 2 542.63 2 487.00 December 2015 quarter 2 617.75 2 564.52 SANLAM MULTI MANAGED DEFENSIVE FUND OF FUNDS A2
December 2014 quarter 2 481.07 2 394.02 March 2015 quarter 2 521.21 2 447.48 June 2015 quarter 2 546.77 2 512.69 September 2015 quarter 2 546.20 2 487.01 December 2015 quarter 2 625.32 2 571.28 SANLAM MULTI MANAGED DEFENSIVE FUND OF FUNDS B2
December 2014 quarter 2 483.10 2 395.22 March 2015 quarter 2 522.16 2 447.52 June 2015 quarter 2 548.34 2 513.80 September 2015 quarter 2 547.92 2 487.15 December 2015 quarter 2 628.98 2 574.56 SANLAM MULTI MANAGED DEFENSIVE FUND OF FUNDS B3
December 2014 quarter 2 484.62 2 396.92 March 2015 quarter 2 527.07 2 447.48 June 2015 quarter 2 553.48 2 518.51 September 2015 quarter 2 550.00 2 486.91 December 2015 quarter 2 633.07 2 578.91 SANLAM MULTI MANAGED DEFENSIVE FUND OF FUNDS B9
December 2014 quarter 2 478.10 2 392.29 March 2015 quarter 2 519.85 2 447.35 June 2015 quarter 2 544.80 2 511.08 September 2015 quarter 2 544.48 2 486.99 December 2015 quarter - -SANLAM MULTI MANAGED DEFENSIVE FUND OF FUNDS C1
December 2014 quarter 2 465.03 2 384.51 March 2015 quarter 2 514.21 2 446.99 June 2015 quarter 2 536.49 2 504.39 September 2015 quarter 2 540.14 2 486.99 December 2015 quarter 2 608.29 2 556.04
288
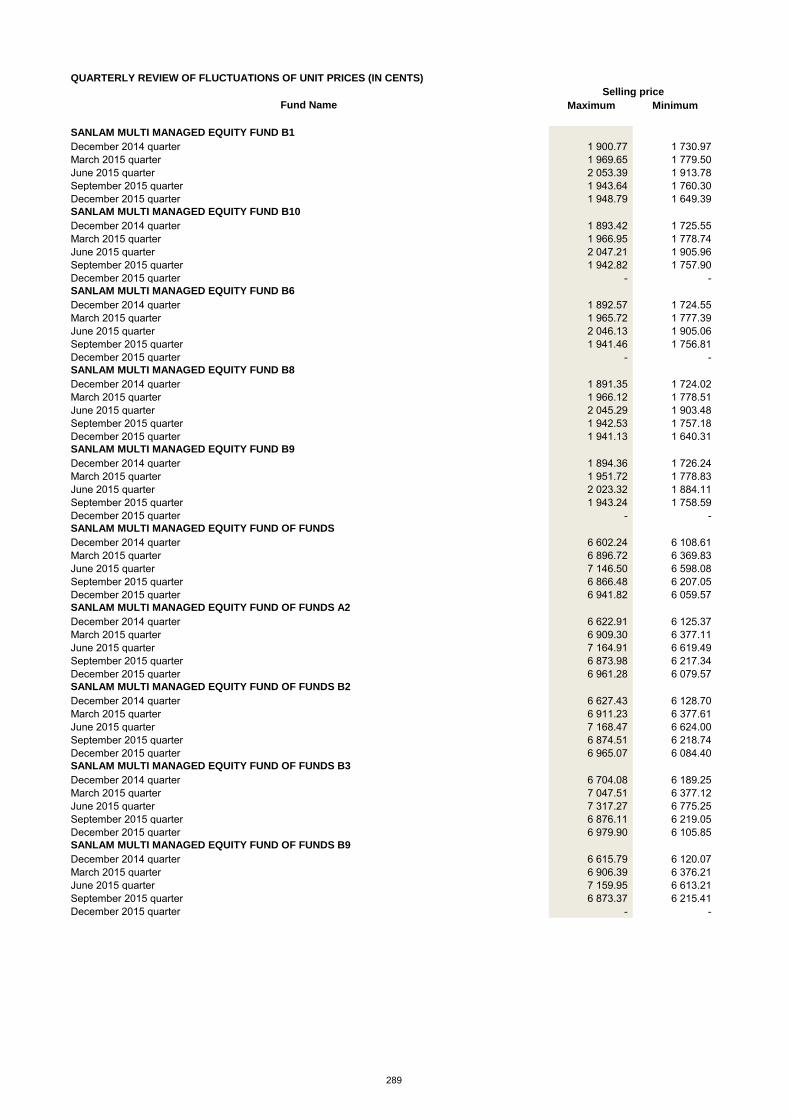
QUARTERLY REVIEW OF FLUCTUATIONS OF UNIT PRICES (IN CENTS)
Fund Name Maximum Minimum
Selling price
SANLAM MULTI MANAGED EQUITY FUND B1
December 2014 quarter 1 900.77 1 730.97 March 2015 quarter 1 969.65 1 779.50 June 2015 quarter 2 053.39 1 913.78 September 2015 quarter 1 943.64 1 760.30 December 2015 quarter 1 948.79 1 649.39 SANLAM MULTI MANAGED EQUITY FUND B10
December 2014 quarter 1 893.42 1 725.55 March 2015 quarter 1 966.95 1 778.74 June 2015 quarter 2 047.21 1 905.96 September 2015 quarter 1 942.82 1 757.90 December 2015 quarter - -SANLAM MULTI MANAGED EQUITY FUND B6
December 2014 quarter 1 892.57 1 724.55 March 2015 quarter 1 965.72 1 777.39 June 2015 quarter 2 046.13 1 905.06 September 2015 quarter 1 941.46 1 756.81 December 2015 quarter - -SANLAM MULTI MANAGED EQUITY FUND B8
December 2014 quarter 1 891.35 1 724.02 March 2015 quarter 1 966.12 1 778.51 June 2015 quarter 2 045.29 1 903.48 September 2015 quarter 1 942.53 1 757.18 December 2015 quarter 1 941.13 1 640.31 SANLAM MULTI MANAGED EQUITY FUND B9
December 2014 quarter 1 894.36 1 726.24 March 2015 quarter 1 951.72 1 778.83 June 2015 quarter 2 023.32 1 884.11 September 2015 quarter 1 943.24 1 758.59 December 2015 quarter - -SANLAM MULTI MANAGED EQUITY FUND OF FUNDS
December 2014 quarter 6 602.24 6 108.61 March 2015 quarter 6 896.72 6 369.83 June 2015 quarter 7 146.50 6 598.08 September 2015 quarter 6 866.48 6 207.05 December 2015 quarter 6 941.82 6 059.57 SANLAM MULTI MANAGED EQUITY FUND OF FUNDS A2
December 2014 quarter 6 622.91 6 125.37 March 2015 quarter 6 909.30 6 377.11 June 2015 quarter 7 164.91 6 619.49 September 2015 quarter 6 873.98 6 217.34 December 2015 quarter 6 961.28 6 079.57 SANLAM MULTI MANAGED EQUITY FUND OF FUNDS B2
December 2014 quarter 6 627.43 6 128.70 March 2015 quarter 6 911.23 6 377.61 June 2015 quarter 7 168.47 6 624.00 September 2015 quarter 6 874.51 6 218.74 December 2015 quarter 6 965.07 6 084.40 SANLAM MULTI MANAGED EQUITY FUND OF FUNDS B3
December 2014 quarter 6 704.08 6 189.25 March 2015 quarter 7 047.51 6 377.12 June 2015 quarter 7 317.27 6 775.25 September 2015 quarter 6 876.11 6 219.05 December 2015 quarter 6 979.90 6 105.85 SANLAM MULTI MANAGED EQUITY FUND OF FUNDS B9
December 2014 quarter 6 615.79 6 120.07 March 2015 quarter 6 906.39 6 376.21 June 2015 quarter 7 159.95 6 613.21 September 2015 quarter 6 873.37 6 215.41 December 2015 quarter - -
289

QUARTERLY REVIEW OF FLUCTUATIONS OF UNIT PRICES (IN CENTS)
Fund Name Maximum Minimum
Selling price
SANLAM MULTI MANAGED EQUITY FUND OF FUNDS C1
December 2014 quarter 6 547.21 6 058.13 March 2015 quarter 6 839.50 6 317.99 June 2015 quarter 7 081.41 6 532.85 September 2015 quarter 6 807.71 6 150.21 December 2015 quarter 6 869.27 5 991.72 SANLAM MULTI MANAGED EQUITY INDEX FUND B1
December 2014 quarter 2 449.78 2 198.95 March 2015 quarter 2 551.38 2 323.61 June 2015 quarter 2 686.97 2 468.98 September 2015 quarter 2 539.82 2 271.23 December 2015 quarter 2 605.93 2 251.34 SANLAM MULTI MANAGED EQUITY INDEX FUND B4
December 2014 quarter 2 446.66 2 196.63 March 2015 quarter 2 549.83 2 323.47 June 2015 quarter 2 684.19 2 465.36 September 2015 quarter 2 539.45 2 270.13 December 2015 quarter - - SANLAM MULTI MANAGED EQUITY INDEX FUND B5
December 2014 quarter 2 444.34 2 194.95 March 2015 quarter 2 548.39 2 323.39 June 2015 quarter 2 682.18 2 463.11 September 2015 quarter 2 539.16 2 269.41 December 2015 quarter 2 601.28 2 245.71 SANLAM MULTI MANAGED FLEXIBLE EQUITY FUND B3
December 2014 quarter 1 826.37 1 671.69 March 2015 quarter 1 961.51 1 790.65 June 2015 quarter 2 029.28 1 931.67 September 2015 quarter 2 035.82 1 890.95 December 2015 quarter 2 058.27 1 884.73 SANLAM MULTI MANAGED FLEXIBLE EQUITY FUND B4
December 2014 quarter 1 817.89 1 663.75 March 2015 quarter 1 952.84 1 783.06 June 2015 quarter 2 020.67 1 924.11 September 2015 quarter 2 027.74 1 882.90 December 2015 quarter 2 050.41 1 877.25 SANLAM MULTI MANAGED FLEXIBLE EQUITY FUND B7
December 2014 quarter 1 818.76 1 664.44 March 2015 quarter 1 953.77 1 783.64 June 2015 quarter 2 021.55 1 924.70 September 2015 quarter 2 028.41 1 883.69 December 2015 quarter 2 051.02 1 877.89 SANLAM MULTI MANAGED INFLATION LINKED BOND FUND B1
December 2014 quarter 1 266.00 1 232.19 March 2015 quarter 1 258.11 1 246.45 June 2015 quarter 1 290.65 1 249.17 September 2015 quarter 1 292.55 1 261.07 December 2015 quarter 1 301.93 1 218.53 SANLAM MULTI MANAGED INFLATION LINKED BOND FUND B2
December 2014 quarter 1 265.56 1 232.17 March 2015 quarter 1 258.03 1 246.12 June 2015 quarter 1 290.42 1 248.74 September 2015 quarter 1 292.24 1 261.06 December 2015 quarter 1 301.48 1 218.10 SANLAM MULTI MANAGED INFLATION LINKED BOND FUND B3
December 2014 quarter 1 266.96 1 232.23 March 2015 quarter 1 258.30 1 247.18 June 2015 quarter 1 291.16 1 250.06 September 2015 quarter 1 293.23 1 261.02 December 2015 quarter 1 302.89 1 219.46
290

QUARTERLY REVIEW OF FLUCTUATIONS OF UNIT PRICES (IN CENTS)
Fund Name Maximum Minimum
Selling price
SANLAM MULTI MANAGED INSTITUTIONAL AGGRESSIVE EQUITY FUND ONE B10
December 2014 quarter 7 571.63 6 662.09 March 2015 quarter 8 002.95 7 227.94 June 2015 quarter 8 547.22 7 773.93 September 2015 quarter 8 009.43 7 115.99 December 2015 quarter 8 229.45 7 176.70 SANLAM MULTI MANAGED INSTITUTIONAL AGGRESSIVE EQUITY FUND ONE B2
December 2014 quarter 7 570.56 6 661.37 March 2015 quarter 8 002.79 7 227.78 June 2015 quarter 8 547.05 7 773.78 September 2015 quarter 8 009.43 7 115.98 December 2015 quarter - - SANLAM MULTI MANAGED INSTITUTIONAL AGGRESSIVE EQUITY FUND ONE B4
December 2014 quarter 7 543.77 6 642.02 March 2015 quarter 7 984.20 7 224.80 June 2015 quarter 8 521.38 7 740.18 September 2015 quarter 8 005.92 7 106.13 December 2015 quarter - - SANLAM MULTI MANAGED INSTITUTIONAL AGGRESSIVE EQUITY FUND ONE B6
December 2014 quarter 7 553.84 6 649.15 March 2015 quarter 7 991.52 7 225.97 June 2015 quarter 8 531.57 7 753.59 September 2015 quarter 8 007.44 7 110.30 December 2015 quarter - - SANLAM MULTI MANAGED INSTITUTIONAL GENERAL EQUITY FUND TWO B10
December 2014 quarter 4 902.53 4 545.80 March 2015 quarter 5 008.30 4 543.44 June 2015 quarter 5 270.37 4 891.33 September 2015 quarter 4 900.93 4 426.32 December 2015 quarter 4 747.13 3 769.93 SANLAM MULTI MANAGED INSTITUTIONAL GENERAL EQUITY FUND TWO B11
December 2014 quarter 4 902.63 4 545.88 March 2015 quarter 5 008.36 4 543.44 June 2015 quarter 5 270.47 4 891.45 September 2015 quarter 4 900.92 4 426.33 December 2015 quarter 4 747.17 3 770.00 SANLAM MULTI MANAGED INSTITUTIONAL GENERAL EQUITY FUND TWO B2
December 2014 quarter 4 919.59 4 559.75 March 2015 quarter 5 015.62 4 545.38 June 2015 quarter 5 286.98 4 911.36 September 2015 quarter 4 902.28 4 431.52 December 2015 quarter - - SANLAM MULTI MANAGED INSTITUTIONAL GENERAL EQUITY FUND TWO B3
December 2014 quarter 4 919.43 4 559.41 March 2015 quarter 5 015.41 4 545.23 June 2015 quarter 5 286.92 4 911.08 September 2015 quarter 4 902.77 4 432.04 December 2015 quarter 4 760.93 3 785.36
291
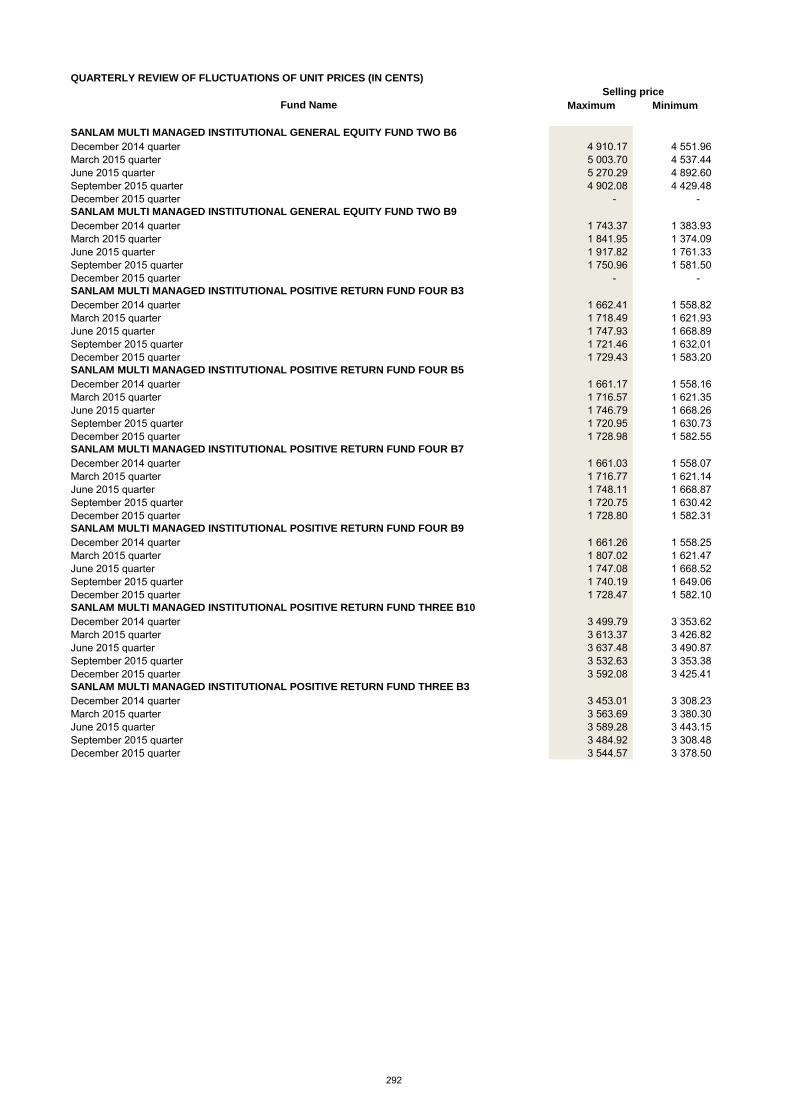
QUARTERLY REVIEW OF FLUCTUATIONS OF UNIT PRICES (IN CENTS)
Fund Name Maximum Minimum
Selling price
SANLAM MULTI MANAGED INSTITUTIONAL GENERAL EQUITY FUND TWO B6
December 2014 quarter 4 910.17 4 551.96 March 2015 quarter 5 003.70 4 537.44 June 2015 quarter 5 270.29 4 892.60 September 2015 quarter 4 902.08 4 429.48 December 2015 quarter - - SANLAM MULTI MANAGED INSTITUTIONAL GENERAL EQUITY FUND TWO B9
December 2014 quarter 1 743.37 1 383.93 March 2015 quarter 1 841.95 1 374.09 June 2015 quarter 1 917.82 1 761.33 September 2015 quarter 1 750.96 1 581.50 December 2015 quarter - - SANLAM MULTI MANAGED INSTITUTIONAL POSITIVE RETURN FUND FOUR B3
December 2014 quarter 1 662.41 1 558.82 March 2015 quarter 1 718.49 1 621.93 June 2015 quarter 1 747.93 1 668.89 September 2015 quarter 1 721.46 1 632.01 December 2015 quarter 1 729.43 1 583.20 SANLAM MULTI MANAGED INSTITUTIONAL POSITIVE RETURN FUND FOUR B5
December 2014 quarter 1 661.17 1 558.16 March 2015 quarter 1 716.57 1 621.35 June 2015 quarter 1 746.79 1 668.26 September 2015 quarter 1 720.95 1 630.73 December 2015 quarter 1 728.98 1 582.55 SANLAM MULTI MANAGED INSTITUTIONAL POSITIVE RETURN FUND FOUR B7
December 2014 quarter 1 661.03 1 558.07 March 2015 quarter 1 716.77 1 621.14 June 2015 quarter 1 748.11 1 668.87 September 2015 quarter 1 720.75 1 630.42 December 2015 quarter 1 728.80 1 582.31 SANLAM MULTI MANAGED INSTITUTIONAL POSITIVE RETURN FUND FOUR B9
December 2014 quarter 1 661.26 1 558.25 March 2015 quarter 1 807.02 1 621.47 June 2015 quarter 1 747.08 1 668.52 September 2015 quarter 1 740.19 1 649.06 December 2015 quarter 1 728.47 1 582.10 SANLAM MULTI MANAGED INSTITUTIONAL POSITIVE RETURN FUND THREE B10
December 2014 quarter 3 499.79 3 353.62 March 2015 quarter 3 613.37 3 426.82 June 2015 quarter 3 637.48 3 490.87 September 2015 quarter 3 532.63 3 353.38 December 2015 quarter 3 592.08 3 425.41 SANLAM MULTI MANAGED INSTITUTIONAL POSITIVE RETURN FUND THREE B3
December 2014 quarter 3 453.01 3 308.23 March 2015 quarter 3 563.69 3 380.30 June 2015 quarter 3 589.28 3 443.15 September 2015 quarter 3 484.92 3 308.48 December 2015 quarter 3 544.57 3 378.50
292

QUARTERLY REVIEW OF FLUCTUATIONS OF UNIT PRICES (IN CENTS)
Fund Name Maximum Minimum
Selling price
SANLAM MULTI MANAGED INSTITUTIONAL POSITIVE RETURN FUND THREE B3 RING
December 2014 quarter - - March 2015 quarter - - June 2015 quarter 5 462.82 975.56 September 2015 quarter - - December 2015 quarter - - SANLAM MULTI MANAGED INSTITUTIONAL POSITIVE RETURN FUND THREE B5
December 2014 quarter 1 984.37 1 901.43 March 2015 quarter 2 048.62 1 942.92 June 2015 quarter 2 062.40 1 979.32 September 2015 quarter 2 002.94 1 901.42 December 2015 quarter 2 036.95 1 942.21
SANLAM MULTI MANAGED INSTITUTIONAL POSITIVE RETURN FUND THREE B5 RING
December 2014 quarter - - March 2015 quarter - - June 2015 quarter 2 041.42 2 027.86 September 2015 quarter - - December 2015 quarter - - SANLAM MULTI MANAGED INSTITUTIONAL POSITIVE RETURN FUND THREE B6
December 2014 quarter 3 456.38 3 312.45 March 2015 quarter 3 569.26 3 384.65 June 2015 quarter 3 592.15 3 448.17 September 2015 quarter 3 489.40 3 312.02 December 2015 quarter 3 547.50 3 382.85 SANLAM MULTI MANAGED INSTITUTIONAL POSITIVE RETURN FUND THREE B7
December 2014 quarter 74.86 71.72 March 2015 quarter 77.50 73.51 June 2015 quarter 78.54 75.52 September 2015 quarter 76.56 72.38 December 2015 quarter - - SANLAM MULTI MANAGED INSTITUTIONAL POSITIVE RETURN FUND THREE B9
December 2014 quarter 3 422.99 3 275.05 March 2015 quarter 3 548.58 3 361.03 June 2015 quarter 3 597.32 3 464.53 September 2015 quarter 3 510.91 3 332.72 December 2015 quarter 3 569.89 3 404.49 SANLAM MULTI MANAGED INSTITUTIONAL POSITIVE RETURN FUND TWO B10
December 2014 quarter 1 493.15 1 477.83 March 2015 quarter 1 498.72 1 484.33 June 2015 quarter 1 501.11 1 490.91 September 2015 quarter 1 500.88 1 490.22 December 2015 quarter 1 506.40 1 473.97 SANLAM MULTI MANAGED INSTITUTIONAL POSITIVE RETURN FUND TWO B2
December 2014 quarter 1 494.07 1 477.93 March 2015 quarter 1 499.77 1 484.42 June 2015 quarter 1 502.11 1 491.10 September 2015 quarter 1 501.89 1 490.26 December 2015 quarter 1 507.41 1 482.69
293

QUARTERLY REVIEW OF FLUCTUATIONS OF UNIT PRICES (IN CENTS)
Fund Name Maximum Minimum
Selling price
SANLAM MULTI MANAGED INSTITUTIONAL POSITIVE RETURN FUND TWO B4
December 2014 quarter 1 493.24 1 477.85 March 2015 quarter 1 498.85 1 484.35 June 2015 quarter 1 501.24 1 490.95 September 2015 quarter 1 500.99 1 490.23 December 2015 quarter 1 506.52 1 482.28 SANLAM MULTI MANAGED INSTITUTIONAL POSITIVE RETURN FUND TWO B6
December 2014 quarter 1 493.71 1 477.88 March 2015 quarter 1 499.29 1 484.32 June 2015 quarter 1 501.58 1 490.88 September 2015 quarter 1 501.20 1 490.09 December 2015 quarter - - SANLAM MULTI MANAGED INSTITUTIONAL POSITIVE RETURN FUND TWO B8
December 2014 quarter 1 492.60 1 477.72 March 2015 quarter 1 499.09 1 476.94 June 2015 quarter 1 500.51 1 489.41 September 2015 quarter 1 533.33 1 490.43 December 2015 quarter 1 566.67 1 500.00 SANLAM MULTI MANAGED INSTITUTIONAL PRUDENTIAL BALANCED FUND ONE B1
December 2014 quarter 1 298.47 1 199.87 March 2015 quarter 1 380.50 1 262.95 June 2015 quarter 1 417.42 1 363.67 September 2015 quarter 1 398.97 1 347.16 December 2015 quarter 1 457.78 1 397.26 SANLAM MULTI MANAGED INSTITUTIONAL PRUDENTIAL BALANCED FUND ONE B2
December 2014 quarter 1 291.52 1 195.66 March 2015 quarter 1 376.30 1 261.48 June 2015 quarter 1 412.22 1 356.45 September 2015 quarter 1 394.90 1 346.13 December 2015 quarter - - SANLAM MULTI MANAGED INSTITUTIONAL PRUDENTIAL BALANCED FUND ONE B3
December 2014 quarter 1 290.46 1 194.78 March 2015 quarter 1 375.90 1 261.43 June 2015 quarter 1 411.71 1 355.80 September 2015 quarter 1 394.32 1 346.00 December 2015 quarter 1 451.12 1 389.14
SANLAM MULTI MANAGED INSTITUTIONAL PRUDENTIAL INCOME PROVIDER FUND TWO B1
December 2014 quarter 1 036.31 1 015.76 March 2015 quarter 1 040.20 1 020.40 June 2015 quarter 1 037.76 1 022.62 September 2015 quarter 1 043.44 1 019.79 December 2015 quarter 1 038.82 1 028.47
SANLAM MULTI MANAGED INSTITUTIONAL PRUDENTIAL INCOME PROVIDER FUND TWO B2
December 2014 quarter 1 034.99 1 015.72 March 2015 quarter 1 038.95 1 020.33 June 2015 quarter 1 036.51 1 022.61 September 2015 quarter 1 042.15 1 020.48 December 2015 quarter 1 037.52 1 027.47
294

QUARTERLY REVIEW OF FLUCTUATIONS OF UNIT PRICES (IN CENTS)
Fund Name Maximum Minimum
Selling price
SANLAM MULTI MANAGED INSTITUTIONAL PRUDENTIAL INCOME PROVIDER FUND TWO B3
December 2014 quarter 1 034.33 1 015.67 March 2015 quarter 1 038.63 1 020.25 June 2015 quarter 1 035.89 1 022.53 September 2015 quarter 1 041.45 1 020.40 December 2015 quarter - - SANLAM MULTI MANAGED LONG TERM GROWTH SOLUTION 7 FUND OF FUNDS A
December 2014 quarter 1 743.82 1 628.11 March 2015 quarter 1 824.21 1 697.26 June 2015 quarter 1 863.00 1 802.41 September 2015 quarter 1 867.04 1 773.44 December 2015 quarter 1 905.06 1 801.72
SANLAM MULTI MANAGED LONG TERM GROWTH SOLUTION 7 FUND OF FUNDS A RING
December 2014 quarter - - March 2015 quarter - - June 2015 quarter - - September 2015 quarter 1 819.88 1 784.73 December 2015 quarter - - SANLAM MULTI MANAGED LONG TERM GROWTH SOLUTION 7 FUND OF FUNDS A2
December 2014 quarter 1 801.56 1 685.34 March 2015 quarter 1 881.79 1 754.48 June 2015 quarter 1 922.04 1 859.54 September 2015 quarter 1 926.57 1 830.15 December 2015 quarter 1 965.78 1 859.52 SANLAM MULTI MANAGED LONG TERM GROWTH SOLUTION 7 FUND OF FUNDS B1
December 2014 quarter 1 802.28 1 685.47 March 2015 quarter 1 882.32 1 754.58 June 2015 quarter 1 922.25 1 859.56 September 2015 quarter 1 926.87 1 830.60 December 2015 quarter 1 966.07 1 860.13 SANLAM MULTI MANAGED LONG TERM GROWTH SOLUTION 7 FUND OF FUNDS B2
December 2014 quarter 1 802.27 1 685.46 March 2015 quarter 1 882.32 1 754.58 June 2015 quarter 1 922.25 1 859.55 September 2015 quarter 1 926.88 1 830.61 December 2015 quarter 1 966.07 1 860.12 SANLAM MULTI MANAGED LONG TERM GROWTH SOLUTION 7 FUND OF FUNDS B3
December 2014 quarter 1 801.72 1 685.35 March 2015 quarter 1 881.65 1 754.48 June 2015 quarter 1 859.55 1 859.55 September 2015 quarter - - December 2015 quarter - - SANLAM MULTI MANAGED LONG TERM GROWTH SOLUTION 7 FUND OF FUNDS B4
December 2014 quarter 1 800.85 1 685.23 March 2015 quarter 1 881.23 1 754.35 June 2015 quarter 1 921.84 1 859.55 September 2015 quarter 1 926.25 1 829.69 December 2015 quarter 1 965.49 1 858.88
295
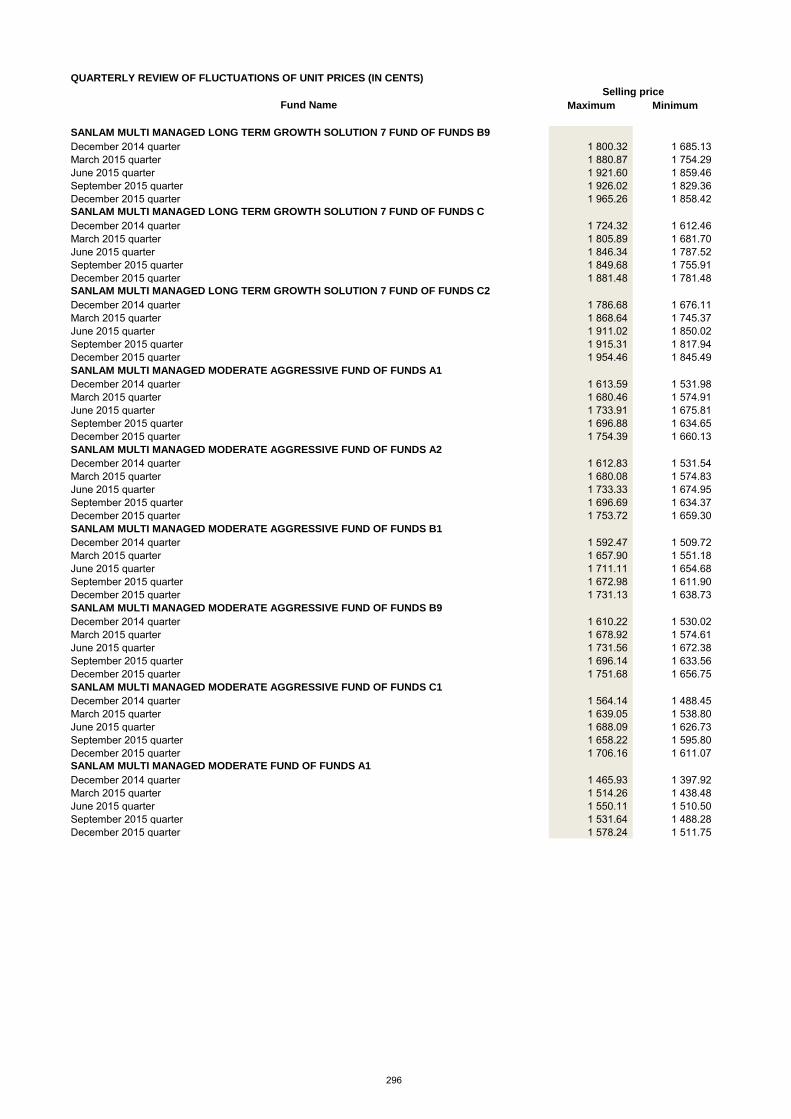
QUARTERLY REVIEW OF FLUCTUATIONS OF UNIT PRICES (IN CENTS)
Fund Name Maximum Minimum
Selling price
SANLAM MULTI MANAGED LONG TERM GROWTH SOLUTION 7 FUND OF FUNDS B9
December 2014 quarter 1 800.32 1 685.13 March 2015 quarter 1 880.87 1 754.29 June 2015 quarter 1 921.60 1 859.46 September 2015 quarter 1 926.02 1 829.36 December 2015 quarter 1 965.26 1 858.42 SANLAM MULTI MANAGED LONG TERM GROWTH SOLUTION 7 FUND OF FUNDS C
December 2014 quarter 1 724.32 1 612.46 March 2015 quarter 1 805.89 1 681.70 June 2015 quarter 1 846.34 1 787.52 September 2015 quarter 1 849.68 1 755.91 December 2015 quarter 1 881.48 1 781.48 SANLAM MULTI MANAGED LONG TERM GROWTH SOLUTION 7 FUND OF FUNDS C2
December 2014 quarter 1 786.68 1 676.11 March 2015 quarter 1 868.64 1 745.37 June 2015 quarter 1 911.02 1 850.02 September 2015 quarter 1 915.31 1 817.94 December 2015 quarter 1 954.46 1 845.49 SANLAM MULTI MANAGED MODERATE AGGRESSIVE FUND OF FUNDS A1
December 2014 quarter 1 613.59 1 531.98 March 2015 quarter 1 680.46 1 574.91 June 2015 quarter 1 733.91 1 675.81 September 2015 quarter 1 696.88 1 634.65 December 2015 quarter 1 754.39 1 660.13 SANLAM MULTI MANAGED MODERATE AGGRESSIVE FUND OF FUNDS A2
December 2014 quarter 1 612.83 1 531.54 March 2015 quarter 1 680.08 1 574.83 June 2015 quarter 1 733.33 1 674.95 September 2015 quarter 1 696.69 1 634.37 December 2015 quarter 1 753.72 1 659.30 SANLAM MULTI MANAGED MODERATE AGGRESSIVE FUND OF FUNDS B1
December 2014 quarter 1 592.47 1 509.72 March 2015 quarter 1 657.90 1 551.18 June 2015 quarter 1 711.11 1 654.68 September 2015 quarter 1 672.98 1 611.90 December 2015 quarter 1 731.13 1 638.73 SANLAM MULTI MANAGED MODERATE AGGRESSIVE FUND OF FUNDS B9
December 2014 quarter 1 610.22 1 530.02 March 2015 quarter 1 678.92 1 574.61 June 2015 quarter 1 731.56 1 672.38 September 2015 quarter 1 696.14 1 633.56 December 2015 quarter 1 751.68 1 656.75 SANLAM MULTI MANAGED MODERATE AGGRESSIVE FUND OF FUNDS C1
December 2014 quarter 1 564.14 1 488.45 March 2015 quarter 1 639.05 1 538.80 June 2015 quarter 1 688.09 1 626.73 September 2015 quarter 1 658.22 1 595.80 December 2015 quarter 1 706.16 1 611.07 SANLAM MULTI MANAGED MODERATE FUND OF FUNDS A1
December 2014 quarter 1 465.93 1 397.92 March 2015 quarter 1 514.26 1 438.48 June 2015 quarter 1 550.11 1 510.50 September 2015 quarter 1 531.64 1 488.28 December 2015 quarter 1 578.24 1 511.75
296

QUARTERLY REVIEW OF FLUCTUATIONS OF UNIT PRICES (IN CENTS)
Fund Name Maximum Minimum
Selling price
SANLAM MULTI MANAGED MODERATE FUND OF FUNDS A2
December 2014 quarter 1 465.68 1 397.85 March 2015 quarter 1 513.96 1 438.44 June 2015 quarter 1 549.66 1 510.15 September 2015 quarter 1 531.43 1 487.99 December 2015 quarter 1 577.62 1 510.98 SANLAM MULTI MANAGED MODERATE FUND OF FUNDS B1
December 2014 quarter 1 450.66 1 381.63 March 2015 quarter 1 497.86 1 421.17 June 2015 quarter 1 533.84 1 494.29 September 2015 quarter 1 514.05 1 471.17 December 2015 quarter 1 561.13 1 495.92 SANLAM MULTI MANAGED MODERATE FUND OF FUNDS B9
December 2014 quarter 1 462.69 1 396.00 March 2015 quarter 1 513.36 1 438.73 June 2015 quarter 1 548.51 1 509.36 September 2015 quarter 1 530.87 1 486.94 December 2015 quarter 1 575.47 1 508.36 SANLAM MULTI MANAGED MODERATE FUND OF FUNDS C1
December 2014 quarter 1 454.86 1 391.31 March 2015 quarter 1 509.41 1 437.57 June 2015 quarter 1 542.81 1 501.98 September 2015 quarter 1 529.03 1 484.68 December 2015 quarter 1 569.80 1 501.13 SANLAM MULTI MANAGED PROPERTY FUND B2
December 2014 quarter 1 477.69 1 304.85 March 2015 quarter 1 620.03 1 425.07 June 2015 quarter 1 640.42 1 465.35 September 2015 quarter 1 584.74 1 458.43 December 2015 quarter 1 614.13 1 328.09 SANLAM MULTI MANAGED PROPERTY FUND B2 RING
December 2014 quarter - - March 2015 quarter - - June 2015 quarter - - September 2015 quarter - - December 2015 quarter 1 564.22 1 559.78 SANLAM MULTI MANAGED PROPERTY FUND B4
December 2014 quarter 1 473.87 1 302.69 March 2015 quarter 1 617.88 1 424.92 June 2015 quarter 1 637.91 1 461.80 September 2015 quarter 1 584.03 1 458.81 December 2015 quarter 1 611.44 1 324.97 SANLAM MULTI MANAGED PROPERTY FUND B6
December 2014 quarter 1 476.54 1 304.20 March 2015 quarter 1 619.40 1 425.03 June 2015 quarter 1 639.68 1 464.30 September 2015 quarter 1 584.55 1 458.76 December 2015 quarter 1 613.35 1 327.17 SANLAM MULTI MANAGED PROPERTY FUND B8
December 2014 quarter 1 475.08 1 303.38 March 2015 quarter 1 618.56 1 424.97 June 2015 quarter 1 638.70 1 462.92 September 2015 quarter 1 584.26 1 458.79 December 2015 quarter 1 612.30 1 325.96 SANLAM MULTI MANAGED PROTECTION SOLUTION 3 FUND OF FUNDS A
December 2014 quarter 1 357.37 1 291.27 March 2015 quarter 1 402.66 1 335.08 June 2015 quarter 1 421.39 1 388.56 September 2015 quarter 1 426.16 1 380.08 December 2015 quarter 1 444.14 1 401.48 SANLAM MULTI MANAGED PROTECTION SOLUTION 3 FUND OF FUNDS A RING
December 2014 quarter - - March 2015 quarter - - June 2015 quarter - - September 2015 quarter 1 408.36 1 386.27 December 2015 quarter
297

QUARTERLY REVIEW OF FLUCTUATIONS OF UNIT PRICES (IN CENTS)
Fund Name Maximum Minimum
Selling price
SANLAM MULTI MANAGED PROTECTION SOLUTION 3 FUND OF FUNDS A2
December 2014 quarter 1 380.45 1 313.90 March 2015 quarter 1 425.59 1 357.71 June 2015 quarter 1 444.56 1 411.11 September 2015 quarter 1 449.61 1 402.91 December 2015 quarter 1 467.87 1 424.79 SANLAM MULTI MANAGED PROTECTION SOLUTION 3 FUND OF FUNDS B1
December 2014 quarter 1 380.61 1 313.92 March 2015 quarter 1 425.73 1 357.74 June 2015 quarter 1 444.64 1 411.14 September 2015 quarter 1 449.71 1 403.05 December 2015 quarter 1 467.93 1 424.92 SANLAM MULTI MANAGED PROTECTION SOLUTION 3 FUND OF FUNDS B3
December 2014 quarter 1 380.43 1 313.88 March 2015 quarter 1 425.62 1 357.72 June 2015 quarter 1 411.12 1 411.12 September 2015 quarter - - December 2015 quarter - - SANLAM MULTI MANAGED PROTECTION SOLUTION 3 FUND OF FUNDS B4
December 2014 quarter 1 379.89 1 313.81 March 2015 quarter 1 425.18 1 357.62 June 2015 quarter 1 444.41 1 411.11 September 2015 quarter 1 449.38 1 402.55 December 2015 quarter 1 467.63 1 424.27 SANLAM MULTI MANAGED PROTECTION SOLUTION 3 FUND OF FUNDS B9
December 2014 quarter 1 379.48 1 313.74 March 2015 quarter 1 424.86 1 357.54 June 2015 quarter 1 444.31 1 411.11 September 2015 quarter 1 449.22 1 402.29 December 2015 quarter 1 467.48 1 423.94 SANLAM MULTI MANAGED PROTECTION SOLUTION 3 FUND OF FUNDS C
December 2014 quarter 1 340.01 1 276.91 March 2015 quarter 1 386.22 1 320.78 June 2015 quarter 1 406.39 1 374.80 September 2015 quarter 1 410.51 1 364.04 December 2015 quarter 1 428.35 1 384.37 SANLAM MULTI MANAGED PROTECTION SOLUTION 3 FUND OF FUNDS C2
December 2014 quarter 1 371.73 1 309.89 March 2015 quarter 1 418.38 1 353.82 June 2015 quarter 1 439.94 1 408.05 September 2015 quarter 1 444.14 1 396.23 December 2015 quarter 1 462.44 1 416.77 SANLAM MULTI MANAGED YIELD PLUS FUND TWO B2
298

QUARTERLY REVIEW OF FLUCTUATIONS OF UNIT PRICES (IN CENTS)
Fund Name Maximum Minimum
Selling price
December 2014 quarter 1 233.82 1 225.28 March 2015 quarter 1 235.41 1 227.35 June 2015 quarter 1 235.29 1 227.64 September 2015 quarter 1 236.09 1 227.87 December 2015 quarter 1 236.22 1 225.80 SANLAM MULTI MANAGED YIELD PLUS FUND TWO B6
December 2014 quarter 1 233.72 1 225.26 March 2015 quarter 1 235.04 1 227.32 June 2015 quarter 1 234.83 1 227.40 September 2015 quarter 1 235.56 1 227.82 December 2015 quarter - - SANLAM MULTI MANAGED YIELD PLUS FUND TWO B8
December 2014 quarter 1 233.07 1 225.26 March 2015 quarter 1 234.70 1 227.31 June 2015 quarter 1 234.59 1 227.61 September 2015 quarter 1 235.42 1 228.09 December 2015 quarter 1 235.53 1 225.55 SPI EQUITY FUND A1
December 2014 quarter 1 651.65 1 527.19 March 2015 quarter 1 745.82 1 549.83 June 2015 quarter 1 845.20 1 736.44 September 2015 quarter 1 795.51 1 613.68 December 2015 quarter 1 887.78 1 698.40 SPI EQUITY FUND B1
December 2014 quarter 1 659.76 1 534.30 March 2015 quarter 1 752.30 1 554.54 June 2015 quarter 1 852.90 1 743.13 September 2015 quarter 1 800.99 1 619.08 December 2015 quarter 1 896.23 1 706.99 SPI EQUITY FUND B2
December 2014 quarter 1 663.71 1 537.76 March 2015 quarter 1 755.44 1 556.80 June 2015 quarter 1 856.65 1 746.38 September 2015 quarter 1 803.64 1 621.71 December 2015 quarter 1 900.37 1 711.22 TRESCOR SCI BALANCED FUND B1
December 2014 quarter - - March 2015 quarter 1 048.38 996.63 June 2015 quarter 1 081.95 1 050.09 September 2015 quarter 1 081.54 1 032.29 December 2015 quarter 1 117.36 1 071.27 TRESCOR SCI BALANCED FUND B2
December 2014 quarter - - March 2015 quarter 1 049.52 996.76 June 2015 quarter 1 083.49 1 051.26 September 2015 quarter 1 081.93 1 032.94 December 2015 quarter 1 119.03 1 073.39 TRESCOR SCI FLEXIBLE FUND B1
December 2014 quarter - - March 2015 quarter 1 065.19 990.10 June 2015 quarter 1 096.60 1 060.57 September 2015 quarter 1 108.08 1 039.22 December 2015 quarter 1 217.58 1 114.76 TRESCOR SCI FLEXIBLE FUND B2
December 2014 quarter - - March 2015 quarter 1 066.01 990.29 June 2015 quarter 1 097.73 1 061.49 September 2015 quarter 1 110.49 1 041.72 December 2015 quarter 1 222.20 1 118.14
299

QUARTERLY REVIEW OF FLUCTUATIONS OF UNIT PRICES (IN CENTS)
Fund Name Maximum Minimum
Selling price
TRESCOR SCI INCOME FUND B1
December 2014 quarter - - March 2015 quarter 1 016.80 997.53 June 2015 quarter 1 028.26 1 015.92 September 2015 quarter 1 036.87 1 017.44 December 2015 quarter 1 042.79 1 027.19 TRESCOR SCI INCOME FUND B2
December 2014 quarter - - March 2015 quarter 1 017.61 997.56 June 2015 quarter 1 029.64 1 016.75 September 2015 quarter 1 037.90 1 017.48 December 2015 quarter 1 043.85 1 028.04 TRESCOR SCI STABLE FUND B1
December 2014 quarter - - March 2015 quarter 1 048.00 996.34 June 2015 quarter 1 069.35 1 042.79 September 2015 quarter 1 072.25 1 041.26 December 2015 quarter 1 111.50 1 079.14 TRESCOR SCI STABLE FUND B2
December 2014 quarter - - March 2015 quarter 1 049.00 996.44 June 2015 quarter 1 070.73 1 044.76 September 2015 quarter 1 076.00 1 042.57 December 2015 quarter 1 115.98 1 084.11
300

INCOME DISTRIBUTIONS TO UNIT HOLDERS (cents per unit)
Fund name
31 March
2015
30 June
2015
30 September
2015
31 December
2015
BRACKENHAM SCI MANAGED FUND - 2.46 - 1.55 BRACKENHAM SCI MANAGED FUND B1 - - - 0.51 FIRST AVENUE SCI EQUITY FUND B1 - 22.43 - 9.25 FIRST AVENUE SCI EQUITY FUND B2 - 25.85 - 12.76 FIRST AVENUE SCI EQUITY FUND B3 - 34.69 - 21.20 FIRST AVENUE SCI EQUITY FUND B4 - 35.26 - 21.82 GRAVITON SCI BALANCED FUND A1 - 13.86 - 31.10 GRAVITON SCI BALANCED FUND B1 - 18.43 - 33.98 GRAVITON SCI BALANCED FUND B2 - 22.41 - 40.46 GRAVITON SCI CAPITAL GROWTH FUND A1 - 11.34 - 45.20 GRAVITON SCI CAPITAL GROWTH FUND B1 - 13.26 - 47.81 GRAVITON SCI CAPITAL GROWTH FUND B2 - 19.18 - 52.66 GRAVITON SCI FLEXIBLE INCOME FUND A1 14.49 15.12 16.62 16.63 GRAVITON SCI FLEXIBLE INCOME FUND B1 15.48 17.36 17.89 17.37 GRAVITON SCI FLEXIBLE INCOME FUND B2 17.15 17.86 19.44 19.12 GRAVITON SCI LOW EQUITY FUND A1 - 16.17 - 43.72 GRAVITON SCI LOW EQUITY FUND B1 - 19.23 - 49.50 GRAVITON SCI LOW EQUITY FUND B2 - 23.47 - 51.50 LYNX SCI BALANCED FUND OF FUNDS A1 - 34.48 - 39.28 LYNX SCI BALANCED FUND OF FUNDS A2 - 34.49 - 39.55 LYNX SCI BALANCED FUND OF FUNDS B1 - 29.90 - 34.59 LYNX SCI BALANCED FUND OF FUNDS C1 - 14.39 - 19.69 LYNX SCI BALANCED FUND OF FUNDS C2 - 14.85 - 20.02 LYNX SCI CAUTIOUS FUND OF FUNDS A1 - 32.15 - 33.32 LYNX SCI CAUTIOUS FUND OF FUNDS A2 - 32.15 - 33.33 LYNX SCI CAUTIOUS FUND OF FUNDS B1 - 29.15 - 30.21 LYNX SCI CAUTIOUS FUND OF FUNDS C1 - 19.39 - 20.77 LYNX SCI CAUTIOUS FUND OF FUNDS C2 - 18.63 - 20.76 LYNX SCI GLOBAL DIVERSIFIED FUND OF FUNDS A1 - - - - LYNX SCI GLOBAL DIVERSIFIED FUND OF FUNDS B - - - - LYNX SCI GLOBAL DIVERSIFIED FUND OF FUNDS B1 - - - - LYNX SCI GLOBAL DIVERSIFIED FUND OF FUNDS C1 - - - - LYNX SCI OPPORTUNITIES FUND OF FUNDS A1 - 14.66 - 18.41 LYNX SCI OPPORTUNITIES FUND OF FUNDS A2 - 16.33 - 18.43 LYNX SCI OPPORTUNITIES FUND OF FUNDS B1 - 10.95 - 14.55 LYNX SCI OPPORTUNITIES FUND OF FUNDS C1 - - - - LYNX SCI OPPORTUNITIES FUND OF FUNDS C2 - - - - MEGAFIN SCI BALANCED FUND OF FUNDS A1 - - - - MEGAFIN SCI BALANCED FUND OF FUNDS B1 - 5.53 - 7.81 MEGAFIN SCI GROWTH FUND OF FUNDS A1 - - - - MEGAFIN SCI GROWTH FUND OF FUNDS B1 - - - 2.83 MEGAFIN SCI STABLE FUND OF FUNDS A1 - - - - MEGAFIN SCI STABLE FUND OF FUNDS B1 - - - 14.03 OBSIDIAN SCI BALANCED FUND B1 - 17.59 - 14.53 OBSIDIAN SCI BALANCED FUND B2 - 19.67 - 16.81 OBSIDIAN SCI BALANCED FUND B3 - 23.29 - 20.38 OBSIDIAN SCI BALANCED FUND B4 - 21.11 - 18.16 OBSIDIAN SCI BALANCED FUND B5 - 24.64 - 21.77 OBSIDIAN SCI EQUITY FUND B1 - - - - OBSIDIAN SCI EQUITY FUND B2 - - - - OBSIDIAN SCI EQUITY FUND B3 - - - - OBSIDIAN SCI EQUITY FUND B4 - - - - SANLAM AFRICAN FRONTIER MARKETS FEEDER FUND A1 - - - - SANLAM AFRICAN FRONTIER MARKETS FEEDER FUND B1 - - - - SANLAM AFRICAN FRONTIER MARKETS FEEDER FUND B2 - - - - SANLAM AFRICAN FRONTIER MARKETS FEEDER FUND B3 - - - - SANLAM ASIA PACIFIC FUND OF FUNDS - - - - SANLAM ASIA PACIFIC FUND OF FUNDS B1 - - - - SANLAM DIVERSIFIED INCOME FUND OF FUNDS A2 0.93 0.92 0.95 1.01 SANLAM DIVERSIFIED INCOME FUND OF FUNDS A3 0.93 0.92 0.95 1.01 SANLAM DIVERSIFIED INCOME FUND OF FUNDS A4 1.15 1.14 1.18 1.25 SANLAM DIVERSIFIED INCOME FUND OF FUNDS B 1.01 0.98 1.03 1.09 SANLAM DIVERSIFIED INCOME FUND OF FUNDS B2 0.98 2.23 - - SANLAM DIVERSIFIED INCOME FUND OF FUNDS B3 1.72 1.04 0.65 1.16 SANLAM GLOBAL BALANCED FUND OF FUNDS - 10.39 - 4.44 SANLAM GLOBAL BALANCED FUND OF FUNDS B1 - - - -
301

INCOME DISTRIBUTIONS TO UNIT HOLDERS (cents per unit)
Fund name
31 March
2015
30 June
2015
30 September
2015
31 December
2015
SANLAM GLOBAL BALANCED FUND OF FUNDS B2 - 10.70 - 4.57 SANLAM GLOBAL BALANCED FUND OF FUNDS B5 - 19.61 - 7.04 SANLAM GLOBAL CAUTIOUS FOF - - - - SANLAM GLOBAL EQUITY FUND A - 1.27 - 1.95 SANLAM GLOBAL EQUITY FUND B1 - - - - SANLAM GLOBAL EQUITY FUND B3 - 2.41 - 3.20 SANLAM GLOBAL EQUITY FUND R - 3.24 - 4.09 SANLAM GLOBAL INDEX FUND OF FUNDS B1 - - - - SANLAM GROWTH INSTITUTIONAL FUND B1 65.83 37.33 67.11 16.92 SANLAM GROWTH INSTITUTIONAL FUND B2 65.82 37.34 67.09 16.92 SANLAM GROWTH INSTITUTIONAL FUND B4 255.58 315.17 434.45 - SANLAM GROWTH INSTITUTIONAL FUND B5 49.66 20.53 50.03 2.05 SANLAM GROWTH INSTITUTIONAL FUND B6 60.12 84.59 139.54 - SANLAM GROWTH INSTITUTIONAL FUND B8 50.62 21.21 51.54 3.53 SANLAM INDIA OPPORTUNITIES FEEDER FUND - - - - SANLAM INST SPECIAL OPPORTUNITIES FUND - 104.46 - 94.52 SANLAM MARKET ALLOCATOR FUND A1 7.91 6.94 8.02 9.11 SANLAM MARKET ALLOCATOR FUND B1 11.20 10.36 11.43 12.96 SANLAM MARKET ALLOCATOR FUND B2 9.22 8.30 9.42 10.49 SANLAM MARKET ALLOCATOR FUND B3 9.22 8.58 9.71 11.33 SANLAM OPTIMISED INCOME FUND B1 0.27 - - - SANLAM OPTIMISED INCOME FUND B2 1.02 14.21 2.64 6.83 SANLAM OPTIMISED INCOME FUND B3 0.26 - - - SANLAM OPTIMISED INCOME FUND B4 0.95 0.58 - - SANLAM OPTIMISED INCOME FUND B5 0.31 - - - SANLAM PAN-EUROPE FUND - 0.26 - - SANLAM SELECT ABSOLUTE FUND A1 - 0.95 - 5.94 SANLAM SELECT ABSOLUTE FUND B1 - 11.32 - 12.33 SANLAM SELECT ABSOLUTE FUND B2 - 15.83 - 14.54 SANLAM SELECT ABSOLUTE FUND B3 - 0.31 - 5.70 SANLAM SELECT ABSOLUTE FUND B4 - 9.52 - 8.19 SANLAM SELECT BOND PLUS FUND B1 21.16 20.87 20.42 22.29 SANLAM SELECT BOND PLUS FUND B2 21.13 20.76 20.53 22.17 SANLAM SELECT BOND PLUS FUND B3 19.34 19.07 18.55 20.57 SANLAM SELECT BOND PLUS FUND B6 18.80 19.32 24.91 20.87 SANLAM SELECT BOND PLUS FUND B8 18.16 18.89 17.78 14.44 SANLAM SELECT DEFENSIVE BALANCED FUND A1 - 30.77 - 26.94 SANLAM SELECT DEFENSIVE BALANCED FUND B1 - 34.31 - 30.51 SANLAM SELECT DEFENSIVE BALANCED FUND B2 - 34.23 - 32.36 SANLAM SELECT DEFENSIVE BALANCED FUND B3 - 17.34 - 27.28 SANLAM SELECT DEFENSIVE BALANCED FUND B4 - 28.58 - 26.52 SANLAM SELECT FLEXIBLE EQUITY FUND B1 9.04 8.71 10.20 9.14 SANLAM SELECT FLEXIBLE EQUITY FUND B2 2.61 5.26 8.04 - SANLAM SELECT FLEXIBLE EQUITY FUND B4 2.72 5.40 6.24 - SANLAM SELECT FLEXIBLE EQUITY FUND B6 17.93 3.46 2.56 - SANLAM SELECT FLEXIBLE EQUITY FUND B8 2.91 4.80 6.24 5.16 SANLAM SELECT MANAGED FUND A1 - 18.44 - 17.94 SANLAM SELECT MANAGED FUND B1 - 23.34 - 22.97 SANLAM SELECT MANAGED FUND B2 - 23.33 - 22.68 SANLAM SELECT MANAGED FUND B3 - 18.40 - 13.22 SANLAM SELECT MANAGED FUND B4 - 17.82 - 17.41 SANLAM SELECT OPTIMISED EQUITY FUND B10 - 120.36 - 46.46 SANLAM SELECT OPTIMISED EQUITY FUND B2 - 121.26 - 87.71 SANLAM SELECT OPTIMISED EQUITY FUND B4 - 86.43 - 49.41 SANLAM SELECT OPTIMISED EQUITY FUND B7 - 87.70 - 9.46 SANLAM SELECT OPTIMISED EQUITY FUND B9 - 94.58 - 59.85 SANLAM SELECT STRATEGIC INCOME FUND A1 14.39 16.91 18.28 15.28 SANLAM SELECT STRATEGIC INCOME FUND B1 16.14 18.70 20.02 17.03 SANLAM SELECT STRATEGIC INCOME FUND B2 16.19 18.79 20.21 17.09 SANLAM SELECT STRATEGIC INCOME FUND B3 14.53 17.04 18.48 15.39 SANLAM SELECT STRATEGIC INCOME FUND B4 14.23 16.71 17.95 15.01 SANLAM SELECT STRATEGIC INCOME FUND B5 - - 17.93 14.98 SANLAM SELECT STRATEGIC INCOME FUND B6 - - 5.49 14.82 SANLAM SELECT THEMATIC EQUITY FUND B1 19.28 20.04 24.40 15.15 SANLAM SELECT THEMATIC EQUITY FUND B10 14.89 14.48 19.48 14.16 SANLAM SELECT THEMATIC EQUITY FUND B2 19.63 18.49 22.63 13.49
302

INCOME DISTRIBUTIONS TO UNIT HOLDERS (cents per unit)
Fund name
31 March
2015
30 June
2015
30 September
2015
31 December
2015
SANLAM SELECT THEMATIC EQUITY FUND B3 13.60 35.27 31.75 22.42 SANLAM SELECT THEMATIC EQUITY FUND B4 28.63 27.82 31.84 22.23 SANLAM STABLE GROWTH FUND A1 - 13.62 - 13.12 SANLAM STABLE GROWTH FUND B1 - 15.36 - 14.99 SANLAM STABLE GROWTH FUND B2 - 15.30 - 14.84 SANLAM STABLE GROWTH FUND B3 - 19.36 - 18.91 SANLAM STABLE GROWTH FUND B4 - 16.69 - 16.27 SANLAM STABLE GROWTH FUND B5 - 18.55 - 17.87 SANLAM VALUE INSTITUTIONAL FUND B1 40.27 51.65 56.83 40.07 SANLAM VALUE INSTITUTIONAL FUND B2 40.62 51.23 56.30 - SANLAM VALUE INSTITUTIONAL FUND B3 28.92 39.35 44.58 - SANLAM VALUE INSTITUTIONAL FUND B5 27.84 36.04 40.58 - SESFIKILE SCI PROPERTY FUND A1 - 47.02 24.31 - SESFIKILE SCI PROPERTY FUND B1 - 49.21 25.32 - SESFIKILE SCI PROPERTY FUND B2 - 51.90 26.41 - SIM ABSOLUTE RETURN INCOME FUND - 2.83 - 3.64 SIM ABSOLUTE RETURN INCOME FUND A1 - 2.77 - 3.59 SIM ABSOLUTE RETURN INCOME FUND B1 - 3.52 - 4.37 SIM ABSOLUTE RETURN INCOME FUND B2 - 2.08 - 2.90 SIM ABSOLUTE RETURN INCOME FUND B3 - 2.97 - 3.80 SIM ABSOLUTE RETURN INCOME FUND B4 - 3.11 - 3.94 SIM ABSOLUTE RETURN INCOME FUND B5 - 3.26 - 4.08 SIM ACTIVE INCOME FUND A1 17.18 17.62 18.68 18.98 SIM ACTIVE INCOME FUND B1 19.77 20.26 21.31 21.65 SIM ACTIVE INCOME FUND B10 18.53 19.00 20.05 20.40 SIM ACTIVE INCOME FUND B2 18.50 18.93 19.96 20.32 SIM ACTIVE INCOME FUND B3 17.36 17.79 18.79 19.18 SIM ACTIVE INCOME FUND B4 17.93 17.81 18.74 19.10 SIM ACTIVE INCOME FUND B5 18.34 18.77 19.80 20.13 SIM ACTIVE INCOME FUND B6 18.17 18.60 19.64 19.99 SIM ACTIVE INCOME FUND B7 15.77 16.15 17.18 17.50 SIM ACTIVE INCOME FUND B8 - 16.14 17.15 17.50 SIM ACTIVE INCOME FUND B9 16.56 16.97 17.98 18.32 SIM ACTIVE INCOME FUND C 13.02 13.36 14.31 14.68 SIM BALANCED FUND A 22.24 93.71 - 130.14 SIM BALANCED FUND A1 - 89.94 - 123.80 SIM BALANCED FUND B 24.28 103.18 - 145.01 SIM BALANCED FUND B1 9.50 65.62 - 87.40 SIM BALANCED FUND B10 39.66 125.34 - 176.59 SIM BALANCED FUND B11 - 103.79 - 145.16 SIM BALANCED FUND B3 28.99 107.38 - 151.47 SIM BALANCED FUND B4 33.08 114.52 - 162.09 SIM BALANCED FUND B6 36.75 119.11 - 168.57 SIM BALANCED FUND B7 31.08 108.05 - 151.56 SIM BALANCED FUND B8 - 107.87 - 152.03 SIM BALANCED FUND B9 22.70 93.72 - 130.17 SIM BALANCED FUND R 25.28 96.82 - 134.28 SIM BOND PLUS FUND - 29.79 - 31.28 SIM BOND PLUS FUND B2 - 32.47 - 33.91 SIM BOND PLUS FUND B3 - 33.45 - 34.89 SIM ENHANCED YIELD FUND A1 1.77 1.81 1.86 1.84 SIM ENHANCED YIELD FUND B1 1.76 1.81 1.87 1.85 SIM ENHANCED YIELD FUND B2 1.80 1.84 1.90 1.87 SIM ENHANCED YIELD FUND B3 1.88 1.93 1.98 1.97 SIM FINANCIAL FUND - 67.00 - 91.06 SIM FINANCIAL FUND B1 - 45.65 - 69.23 SIM FINANCIAL FUND B2 - 100.17 - 123.88 SIM GENERAL EQUITY FUND A - 208.41 - 87.08 SIM GENERAL EQUITY FUND A1 - 231.49 - 180.98 SIM GENERAL EQUITY FUND A2 5.20 295.75 - 277.20 SIM GENERAL EQUITY FUND B1 - 116.63 - 39.87 SIM GENERAL EQUITY FUND B10 - 114.79 - 63.44 SIM GENERAL EQUITY FUND B11 5.40 300.90 - 283.59 SIM GENERAL EQUITY FUND B12 - - - 331.15 SIM GENERAL EQUITY FUND B4 - 234.84 - 191.43 SIM GENERAL EQUITY FUND B5 5.20 291.85 - 259.04
303

INCOME DISTRIBUTIONS TO UNIT HOLDERS (cents per unit)
Fund name
31 March
2015
30 June
2015
30 September
2015
31 December
2015
SIM GENERAL EQUITY FUND B6 - 269.22 - 231.61 SIM GENERAL EQUITY FUND B7 - 283.20 - 259.45 SIM GENERAL EQUITY FUND B8 - 272.19 - 241.18 SIM GENERAL EQUITY FUND B9 - 213.52 - 173.01 SIM GENERAL EQUITY FUND R - 233.00 - 210.53 SIM GLOBAL BEST IDEAS FEEDER FUND A - - - - SIM GLOBAL BEST IDEAS FEEDER FUND A1 - - - - SIM GLOBAL BEST IDEAS FEEDER FUND B1 - - - - SIM GLOBAL BEST IDEAS FEEDER FUND B2 - - - - SIM GLOBAL BEST IDEAS FEEDER FUND C - - - - SIM GLOBAL EQUITY INCOME FEEDER FUND A1 - 18.91 - 26.80 SIM GLOBAL EQUITY INCOME FEEDER FUND B1 - 20.02 - 28.10 SIM GLOBAL FINANCIAL FEEDER FUND A1 - - - - SIM GLOBAL FINANCIAL FEEDER FUND B1 - - - - SIM GLOBAL FINANCIAL FEEDER FUND B2 - 0.58 - 1.50 SIM INDEX FUND - 126.33 - - SIM INDEX FUND A1 - 152.18 - - SIM INDEX FUND B1 - 75.19 - - SIM INDEX FUND B2 - 154.42 - - SIM INDUSTRIAL FUND A - 4.05 - - SIM INDUSTRIAL FUND B1 - - - - SIM INDUSTRIAL FUND B2 - 95.73 - 92.85 SIM INDUSTRIAL FUND R - 54.90 - 49.29 SIM INFLATION PLUS FUND - 8.35 - 9.77 SIM INFLATION PLUS FUND B1 - 5.50 - 6.78 SIM INFLATION PLUS FUND B2 - 10.94 - 12.49 SIM INFLATION PLUS FUND B4 - 9.40 - 10.85 SIM INFLATION PLUS FUND B6 - 9.23 - 10.82 SIM INFLATION PLUS FUND B7 - 8.86 - 10.30 SIM INFLATION PLUS FUND B8 - 10.44 - 11.94 SIM INFLATION PLUS FUND B9 - 8.36 - 9.74 SIM LOW EQUITY FUND A1 - 2.67 - 2.96 SIM LOW EQUITY FUND B1 - 2.70 - 2.96 SIM LOW EQUITY FUND B2 - 3.79 - 4.12 SIM LOW EQUITY FUND B3 - 2.99 - 3.33 SIM LOW EQUITY FUND B4 - 3.09 - 3.41 SIM LOW EQUITY FUND C - 1.75 - 1.97 SIM MANAGED AGGRESSIVE FUND OF FUNDS A1 - 37.32 - 19.70 SIM MANAGED AGGRESSIVE FUND OF FUNDS A2 - - - 17.65 SIM MANAGED AGGRESSIVE FUND OF FUNDS B1 - 41.35 - 23.98 SIM MANAGED AGGRESSIVE FUND OF FUNDS B2 - 21.93 - 0.62 SIM MANAGED AGGRESSIVE FUND OF FUNDS B3 - - - 21.27 SIM MANAGED AGGRESSIVE FUND OF FUNDS B4 - 18.53 - 0.66 SIM MANAGED AGGRESSIVE FUND OF FUNDS B5 - 39.61 - 21.93 SIM MANAGED AGGRESSIVE FUND OF FUNDS B6 - - - 19.75 SIM MANAGED AGGRESSIVE FUND OF FUNDS B9 - 33.70 - 16.19 SIM MANAGED CAUTIOUS FUND OF FUNDS A1 24.28 8.34 23.45 7.60 SIM MANAGED CAUTIOUS FUND OF FUNDS A2 - - 24.73 8.23 SIM MANAGED CAUTIOUS FUND OF FUNDS B1 25.51 9.49 24.41 8.73 SIM MANAGED CAUTIOUS FUND OF FUNDS B2 18.84 2.64 17.73 1.90 SIM MANAGED CAUTIOUS FUND OF FUNDS B3 - - 26.16 9.49 SIM MANAGED CAUTIOUS FUND OF FUNDS B4 20.23 4.06 19.37 2.54 SIM MANAGED CAUTIOUS FUND OF FUNDS B5 26.03 9.85 25.14 8.82 SIM MANAGED CAUTIOUS FUND OF FUNDS B6 - - 25.83 9.17 SIM MANAGED CAUTIOUS FUND OF FUNDS B9 24.08 8.09 23.06 6.63 SIM MANAGED CONSERVATIVE FOF A1 23.30 7.89 23.27 10.10 SIM MANAGED CONSERVATIVE FOF A2 - - 24.23 10.57 SIM MANAGED CONSERVATIVE FOF B1 24.36 8.91 24.12 10.99 SIM MANAGED CONSERVATIVE FOF B2 18.58 3.13 18.44 5.16 SIM MANAGED CONSERVATIVE FOF B3 - - 25.52 11.69 SIM MANAGED CONSERVATIVE FOF B4 19.42 3.92 19.62 5.61 SIM MANAGED CONSERVATIVE FOF B5 25.00 9.42 24.84 10.85 SIM MANAGED CONSERVATIVE FOF B6 - - 25.26 10.96 SIM MANAGED CONSERVATIVE FOF B9 22.71 7.40 22.87 9.22 SIM MANAGED MODERATE AGGRESSIVE FOF A1 - 36.70 - 26.21 SIM MANAGED MODERATE AGGRESSIVE FOF A2 - - - 24.13
304

INCOME DISTRIBUTIONS TO UNIT HOLDERS (cents per unit)
Fund name
31 March
2015
30 June
2015
30 September
2015
31 December
2015
SIM MANAGED MODERATE AGGRESSIVE FOF B1 - 40.16 - 29.84 SIM MANAGED MODERATE AGGRESSIVE FOF B2 - 24.56 - 9.99 SIM MANAGED MODERATE AGGRESSIVE FOF B3 - - - 27.31 SIM MANAGED MODERATE AGGRESSIVE FOF B4 - - - 26.06 SIM MANAGED MODERATE AGGRESSIVE FOF B5 - 38.45 - 28.26 SIM MANAGED MODERATE AGGRESSIVE FOF B9 - 33.74 - 23.33 SIM MANAGED MODERATE FUND OF FUNDS A1 - 41.19 - 31.79 SIM MANAGED MODERATE FUND OF FUNDS A2 - - - 29.48 SIM MANAGED MODERATE FUND OF FUNDS B1 - 44.69 - 35.44 SIM MANAGED MODERATE FUND OF FUNDS B2 - 28.83 - 15.71 SIM MANAGED MODERATE FUND OF FUNDS B3 - 47.61 - 38.46 SIM MANAGED MODERATE FUND OF FUNDS B4 - 25.59 - 15.78 SIM MANAGED MODERATE FUND OF FUNDS B5 - 42.96 - 33.71 SIM MANAGED MODERATE FUND OF FUNDS B6 - - - 32.70 SIM MANAGED MODERATE FUND OF FUNDS B7 - - - 31.80 SIM MANAGED MODERATE FUND OF FUNDS B9 - 38.29 - 28.85 SIM PROPERTY FUND A 46.01 47.35 48.08 30.80 SIM PROPERTY FUND B1 56.29 57.87 58.74 41.31 SIM PROPERTY FUND B2 63.19 64.90 65.84 48.33 SIM PROPERTY FUND B3 63.18 64.89 65.83 48.34 SIM PROPERTY FUND B9 46.00 47.35 48.08 30.80 SIM RESOURCES FUND - 9.07 - 4.45 SIM SMALL CAP FUND A - 40.93 - 17.32 SIM SMALL CAP FUND B1 - 20.89 - - SIM SMALL CAP FUND B2 - 61.13 - 38.08 SIM SMALL CAP FUND B3 - 71.25 - 48.50 SIM SMALL CAP FUND B9 - 40.92 - 17.32 SIM SMALL CAP FUND R - 57.76 - 34.62 SIM TOP CHOICE EQUITY FUND A1 - 39.72 - 32.66 SIM TOP CHOICE EQUITY FUND B1 - 55.01 - 49.36 SIM TOP CHOICE EQUITY FUND B2 - 46.51 - 38.19 SIM TOP CHOICE EQUITY FUND B4 - 42.29 - 34.99 SIM TOP CHOICE EQUITY FUND B5 - 48.21 - 40.21 SIM TOP CHOICE EQUITY FUND B9 - 39.83 - 32.70 SIM TOP CHOICE EQUITY FUND C - 16.99 - 11.21 SIM VALUE FUND - 41.98 - 39.29 SIM VALUE FUND A1 - 44.09 - 37.35 SIM VALUE FUND B1 - 26.48 - 24.91 SIM VALUE FUND B10 - - - 67.52 SIM VALUE FUND B2 0.90 56.79 - 55.44 SIM VALUE FUND B3 - 51.29 - 48.09 SIM VALUE FUND B5 4.74 64.40 - 66.56 SIM VALUE FUND B6 0.88 56.52 - 53.71 SIM VALUE FUND B7 1.57 58.00 - 55.69 SIM VALUE FUND B8 - 54.77 - 52.55 SIM VALUE FUND B9 - 42.00 - 39.37 SMM ABSOLUTE SOLUTION 5 FOF A 5.65 9.75 10.89 7.21 SMM ABSOLUTE SOLUTION 5 FOF A2 6.28 10.52 11.81 8.08 SMM ABSOLUTE SOLUTION 5 FOF B1 6.73 10.96 12.27 8.56 SMM ABSOLUTE SOLUTION 5 FOF B2 6.75 11.01 12.30 8.55 SMM ABSOLUTE SOLUTION 5 FOF B3 6.40 - - - SMM ABSOLUTE SOLUTION 5 FOF B4 5.61 9.82 11.11 7.38 SMM ABSOLUTE SOLUTION 5 FOF B9 5.14 9.34 10.60 6.85 SMM ABSOLUTE SOLUTION 5 FOF C 0.80 5.14 6.18 2.47 SMM ABSOLUTE SOLUTION 5 FOF C2 - 3.54 5.00 1.17 SMM AGGRESSIVE FOF A1 - 16.42 - 24.65 SMM AGGRESSIVE FOF A2 - 15.01 - 23.63 SMM AGGRESSIVE FOF B1 - 19.52 - 27.58 SMM AGGRESSIVE FOF B9 - 12.54 - 20.61 SMM AGGRESSIVE FOF C1 - - - 6.77 SMM BALANCED FOF A - 33.90 - 50.94 SMM BALANCED FOF A2 - 47.87 - 65.54 SMM BALANCED FOF B - 47.73 - 65.41 SMM BALANCED FOF B2 - 53.75 - 72.69 SMM BALANCED FOF B3 - 68.99 - 81.11 SMM BALANCED FOF B9 - 40.87 - -
305
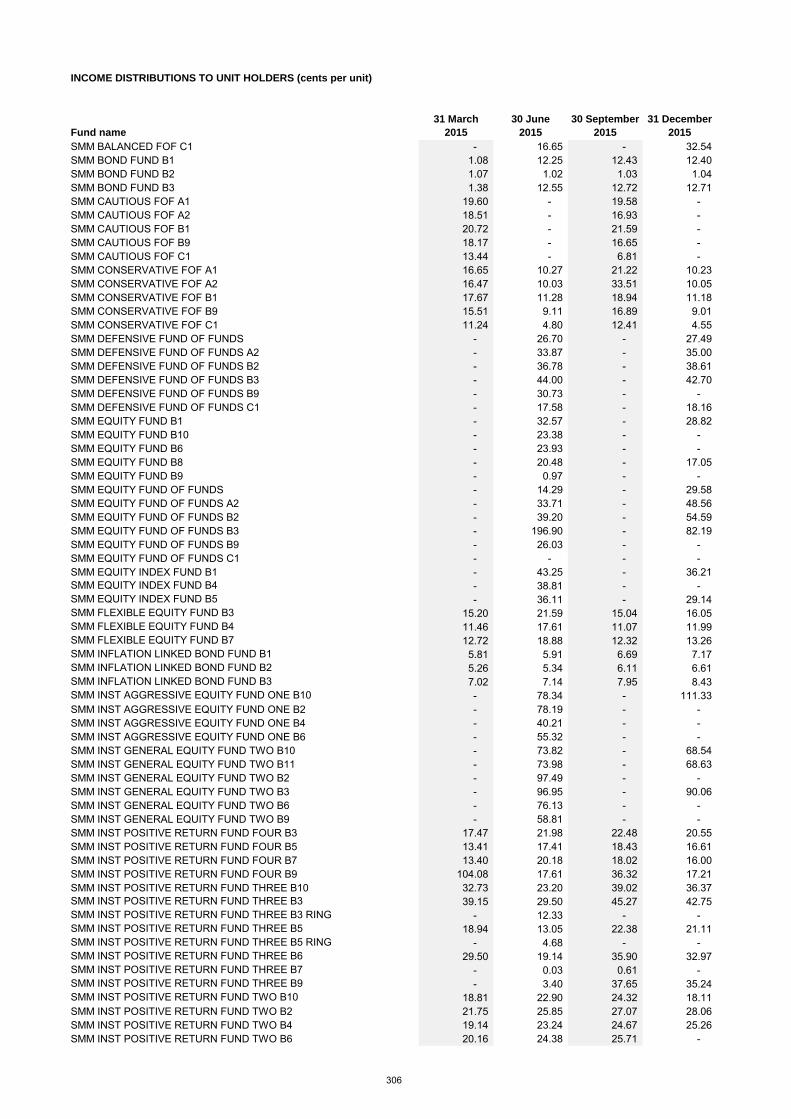
INCOME DISTRIBUTIONS TO UNIT HOLDERS (cents per unit)
Fund name
31 March
2015
30 June
2015
30 September
2015
31 December
2015
SMM BALANCED FOF C1 - 16.65 - 32.54 SMM BOND FUND B1 1.08 12.25 12.43 12.40 SMM BOND FUND B2 1.07 1.02 1.03 1.04 SMM BOND FUND B3 1.38 12.55 12.72 12.71 SMM CAUTIOUS FOF A1 19.60 - 19.58 - SMM CAUTIOUS FOF A2 18.51 - 16.93 - SMM CAUTIOUS FOF B1 20.72 - 21.59 - SMM CAUTIOUS FOF B9 18.17 - 16.65 - SMM CAUTIOUS FOF C1 13.44 - 6.81 - SMM CONSERVATIVE FOF A1 16.65 10.27 21.22 10.23 SMM CONSERVATIVE FOF A2 16.47 10.03 33.51 10.05 SMM CONSERVATIVE FOF B1 17.67 11.28 18.94 11.18 SMM CONSERVATIVE FOF B9 15.51 9.11 16.89 9.01 SMM CONSERVATIVE FOF C1 11.24 4.80 12.41 4.55 SMM DEFENSIVE FUND OF FUNDS - 26.70 - 27.49 SMM DEFENSIVE FUND OF FUNDS A2 - 33.87 - 35.00 SMM DEFENSIVE FUND OF FUNDS B2 - 36.78 - 38.61 SMM DEFENSIVE FUND OF FUNDS B3 - 44.00 - 42.70 SMM DEFENSIVE FUND OF FUNDS B9 - 30.73 - - SMM DEFENSIVE FUND OF FUNDS C1 - 17.58 - 18.16 SMM EQUITY FUND B1 - 32.57 - 28.82 SMM EQUITY FUND B10 - 23.38 - - SMM EQUITY FUND B6 - 23.93 - - SMM EQUITY FUND B8 - 20.48 - 17.05 SMM EQUITY FUND B9 - 0.97 - - SMM EQUITY FUND OF FUNDS - 14.29 - 29.58 SMM EQUITY FUND OF FUNDS A2 - 33.71 - 48.56 SMM EQUITY FUND OF FUNDS B2 - 39.20 - 54.59 SMM EQUITY FUND OF FUNDS B3 - 196.90 - 82.19 SMM EQUITY FUND OF FUNDS B9 - 26.03 - - SMM EQUITY FUND OF FUNDS C1 - - - - SMM EQUITY INDEX FUND B1 - 43.25 - 36.21 SMM EQUITY INDEX FUND B4 - 38.81 - - SMM EQUITY INDEX FUND B5 - 36.11 - 29.14 SMM FLEXIBLE EQUITY FUND B3 15.20 21.59 15.04 16.05 SMM FLEXIBLE EQUITY FUND B4 11.46 17.61 11.07 11.99 SMM FLEXIBLE EQUITY FUND B7 12.72 18.88 12.32 13.26 SMM INFLATION LINKED BOND FUND B1 5.81 5.91 6.69 7.17 SMM INFLATION LINKED BOND FUND B2 5.26 5.34 6.11 6.61 SMM INFLATION LINKED BOND FUND B3 7.02 7.14 7.95 8.43 SMM INST AGGRESSIVE EQUITY FUND ONE B10 - 78.34 - 111.33 SMM INST AGGRESSIVE EQUITY FUND ONE B2 - 78.19 - - SMM INST AGGRESSIVE EQUITY FUND ONE B4 - 40.21 - - SMM INST AGGRESSIVE EQUITY FUND ONE B6 - 55.32 - - SMM INST GENERAL EQUITY FUND TWO B10 - 73.82 - 68.54 SMM INST GENERAL EQUITY FUND TWO B11 - 73.98 - 68.63 SMM INST GENERAL EQUITY FUND TWO B2 - 97.49 - - SMM INST GENERAL EQUITY FUND TWO B3 - 96.95 - 90.06 SMM INST GENERAL EQUITY FUND TWO B6 - 76.13 - - SMM INST GENERAL EQUITY FUND TWO B9 - 58.81 - - SMM INST POSITIVE RETURN FUND FOUR B3 17.47 21.98 22.48 20.55 SMM INST POSITIVE RETURN FUND FOUR B5 13.41 17.41 18.43 16.61 SMM INST POSITIVE RETURN FUND FOUR B7 13.40 20.18 18.02 16.00 SMM INST POSITIVE RETURN FUND FOUR B9 104.08 17.61 36.32 17.21 SMM INST POSITIVE RETURN FUND THREE B10 32.73 23.20 39.02 36.37 SMM INST POSITIVE RETURN FUND THREE B3 39.15 29.50 45.27 42.75 SMM INST POSITIVE RETURN FUND THREE B3 RING - 12.33 - - SMM INST POSITIVE RETURN FUND THREE B5 18.94 13.05 22.38 21.11 SMM INST POSITIVE RETURN FUND THREE B5 RING - 4.68 - - SMM INST POSITIVE RETURN FUND THREE B6 29.50 19.14 35.90 32.97 SMM INST POSITIVE RETURN FUND THREE B7 - 0.03 0.61 - SMM INST POSITIVE RETURN FUND THREE B9 - 3.40 37.65 35.24 SMM INST POSITIVE RETURN FUND TWO B10 18.81 22.90 24.32 18.11 SMM INST POSITIVE RETURN FUND TWO B2 21.75 25.85 27.07 28.06 SMM INST POSITIVE RETURN FUND TWO B4 19.14 23.24 24.67 25.26 SMM INST POSITIVE RETURN FUND TWO B6 20.16 24.38 25.71 -
306
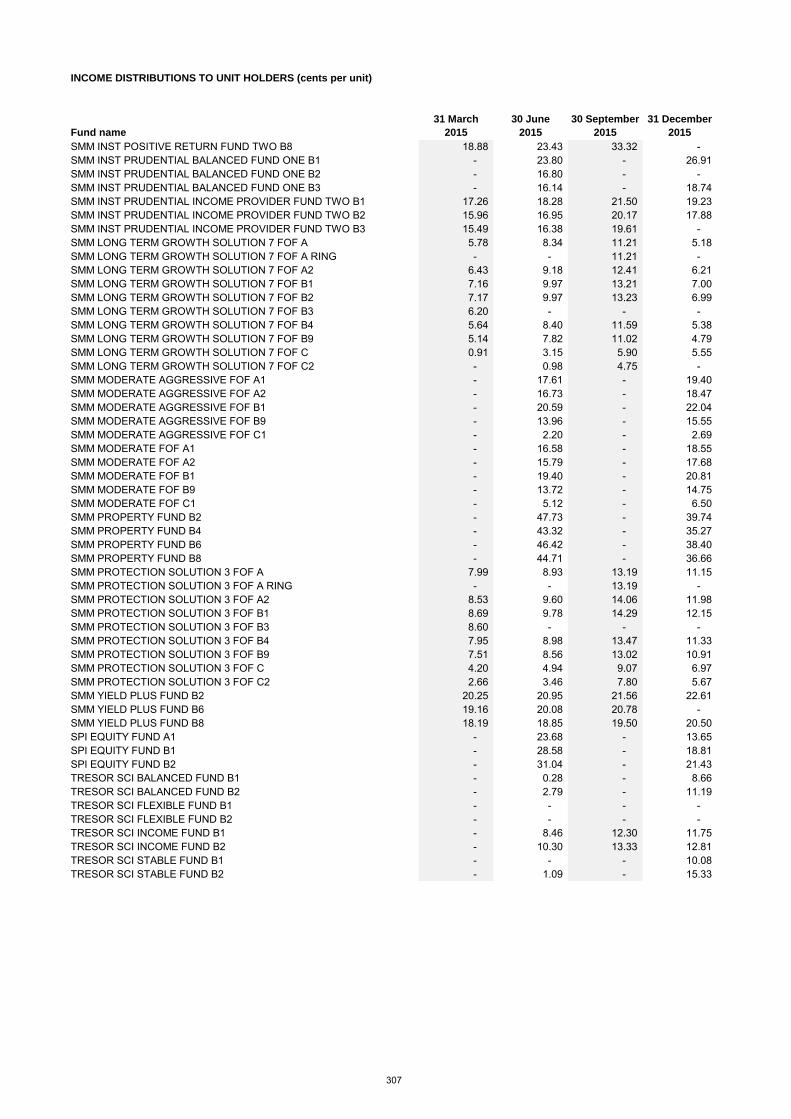
INCOME DISTRIBUTIONS TO UNIT HOLDERS (cents per unit)
Fund name
31 March
2015
30 June
2015
30 September
2015
31 December
2015
SMM INST POSITIVE RETURN FUND TWO B8 18.88 23.43 33.32 - SMM INST PRUDENTIAL BALANCED FUND ONE B1 - 23.80 - 26.91 SMM INST PRUDENTIAL BALANCED FUND ONE B2 - 16.80 - - SMM INST PRUDENTIAL BALANCED FUND ONE B3 - 16.14 - 18.74 SMM INST PRUDENTIAL INCOME PROVIDER FUND TWO B1 17.26 18.28 21.50 19.23 SMM INST PRUDENTIAL INCOME PROVIDER FUND TWO B2 15.96 16.95 20.17 17.88 SMM INST PRUDENTIAL INCOME PROVIDER FUND TWO B3 15.49 16.38 19.61 - SMM LONG TERM GROWTH SOLUTION 7 FOF A 5.78 8.34 11.21 5.18 SMM LONG TERM GROWTH SOLUTION 7 FOF A RING - - 11.21 - SMM LONG TERM GROWTH SOLUTION 7 FOF A2 6.43 9.18 12.41 6.21 SMM LONG TERM GROWTH SOLUTION 7 FOF B1 7.16 9.97 13.21 7.00 SMM LONG TERM GROWTH SOLUTION 7 FOF B2 7.17 9.97 13.23 6.99 SMM LONG TERM GROWTH SOLUTION 7 FOF B3 6.20 - - - SMM LONG TERM GROWTH SOLUTION 7 FOF B4 5.64 8.40 11.59 5.38 SMM LONG TERM GROWTH SOLUTION 7 FOF B9 5.14 7.82 11.02 4.79 SMM LONG TERM GROWTH SOLUTION 7 FOF C 0.91 3.15 5.90 5.55 SMM LONG TERM GROWTH SOLUTION 7 FOF C2 - 0.98 4.75 - SMM MODERATE AGGRESSIVE FOF A1 - 17.61 - 19.40 SMM MODERATE AGGRESSIVE FOF A2 - 16.73 - 18.47 SMM MODERATE AGGRESSIVE FOF B1 - 20.59 - 22.04 SMM MODERATE AGGRESSIVE FOF B9 - 13.96 - 15.55 SMM MODERATE AGGRESSIVE FOF C1 - 2.20 - 2.69 SMM MODERATE FOF A1 - 16.58 - 18.55 SMM MODERATE FOF A2 - 15.79 - 17.68 SMM MODERATE FOF B1 - 19.40 - 20.81 SMM MODERATE FOF B9 - 13.72 - 14.75 SMM MODERATE FOF C1 - 5.12 - 6.50 SMM PROPERTY FUND B2 - 47.73 - 39.74 SMM PROPERTY FUND B4 - 43.32 - 35.27 SMM PROPERTY FUND B6 - 46.42 - 38.40 SMM PROPERTY FUND B8 - 44.71 - 36.66 SMM PROTECTION SOLUTION 3 FOF A 7.99 8.93 13.19 11.15 SMM PROTECTION SOLUTION 3 FOF A RING - - 13.19 - SMM PROTECTION SOLUTION 3 FOF A2 8.53 9.60 14.06 11.98 SMM PROTECTION SOLUTION 3 FOF B1 8.69 9.78 14.29 12.15 SMM PROTECTION SOLUTION 3 FOF B3 8.60 - - - SMM PROTECTION SOLUTION 3 FOF B4 7.95 8.98 13.47 11.33 SMM PROTECTION SOLUTION 3 FOF B9 7.51 8.56 13.02 10.91 SMM PROTECTION SOLUTION 3 FOF C 4.20 4.94 9.07 6.97 SMM PROTECTION SOLUTION 3 FOF C2 2.66 3.46 7.80 5.67 SMM YIELD PLUS FUND B2 20.25 20.95 21.56 22.61 SMM YIELD PLUS FUND B6 19.16 20.08 20.78 - SMM YIELD PLUS FUND B8 18.19 18.85 19.50 20.50 SPI EQUITY FUND A1 - 23.68 - 13.65 SPI EQUITY FUND B1 - 28.58 - 18.81 SPI EQUITY FUND B2 - 31.04 - 21.43 TRESOR SCI BALANCED FUND B1 - 0.28 - 8.66 TRESOR SCI BALANCED FUND B2 - 2.79 - 11.19 TRESOR SCI FLEXIBLE FUND B1 - - - - TRESOR SCI FLEXIBLE FUND B2 - - - - TRESOR SCI INCOME FUND B1 - 8.46 12.30 11.75 TRESOR SCI INCOME FUND B2 - 10.30 13.33 12.81 TRESOR SCI STABLE FUND B1 - - - 10.08 TRESOR SCI STABLE FUND B2 - 1.09 - 15.33
307
i159
5 3/
2016 The full annual report is available to all investors.
Kindly send your personal details together with your collective investment account number to:Sanlam Collective Investments, PO Box 30, Sanlamhof 7532
Or visit our Client Contact Centre at: Sanlam Head Office, 2 Strand Road, Sanlamhof, Bellville, South Africa
An electronic version of our annual report is available on our website or can be requested from our Client Contact Centre or via e-mail.
E [email protected] 0860 100 26W www.sanlamunittrusts.co.za
2 Strand Road, Bellville 7530 | PO Box 30, Sanlamhof 7532South Africa
T +27 (0)21 916 1800F +27 (0)21 947 8224
www.sanlamunittrust.co.za
The Sanlam Group is a full member of the Association for Savings and Investment SA. Collective investment schemes are generally medium- to long-term investments. Please note that past performances are not necessarily an accurate determination of future performances, and that the value of investments / units / unit trusts may go down as well as up. A schedule of fees and charges and maximum commissions is available from the Manager, Sanlam Collective Investments (RF) Pty Ltd, a registered and approved Manager in Collective Investment Schemes in Securities. Additional information of the proposed investment, including brochures, application forms and annual or quarterly reports, can be obtained from the Manager, free of charge. Collective investments are traded at ruling prices and can engage in borrowing and scrip lending. Collective investments are calculated on a net asset value basis, which is the total market value of all assets in the portfolio including any income accruals and less any deductible expenses such as audit fees, brokerage and service fees. Actual investment performance of the portfolio and the investor will differ depending on the initial fees applicable, the actual investment date, and the date of reinvestment of income as well as dividend withholding tax. Forward pricing is used. The Manager does not provide any guarantee either with respect to the capital or the return of a portfolio. The performance of the portfolio depends on the underlying assets and variable market factors. Performance is based on NAV to NAV calculations with income reinvestments done on the ex-div date. Lump sum investment performances are quoted. The portfolio may invest in other unit trust portfolios which levy their own fees, and may result is a higher fee structure for our portfolio. All the portfolio options presented are approved collective investment schemes in terms of Collective Investment Schemes Control Act, No 45 of 2002 (“CISCA”). International investments or investments in foreign securities could be accompanied by additional risks such as potential constraints on liquidity and repatriation of funds, macroeconomic risk, political risk, foreign exchange risk, tax risk, settlement risk as well as potential limitations on the availability of market information. The Manager has the right to close any portfolios to new investors to manage them more efficiently in accordance with their mandates. . A fund of funds is a portfolio that invests in portfolios of collective investment schemes that levy their own charges, which could result in a higher fee structure for the fund of fund. A feeder fund is a portfolio that invests in a single portfolio of collective investment schemes, which levies its own charges and which could result in a higher fee structure for the feeder fund The Manager retains full legal responsibility for the third-party-named portfolio. The portfolio management of all the portfolios is outsourced to financial services providers authorized in terms of the Financial Advisory and Intermediary Services Act, 2002. Standard Bank of South Africa Ltd is the appointed trustee of the Sanlam Collective Investments Scheme.