SANDIA 17 METER VAWT* Albuquerque, New Mexico 87185 · Albuquerque, New Mexico 87185 ... and...
12
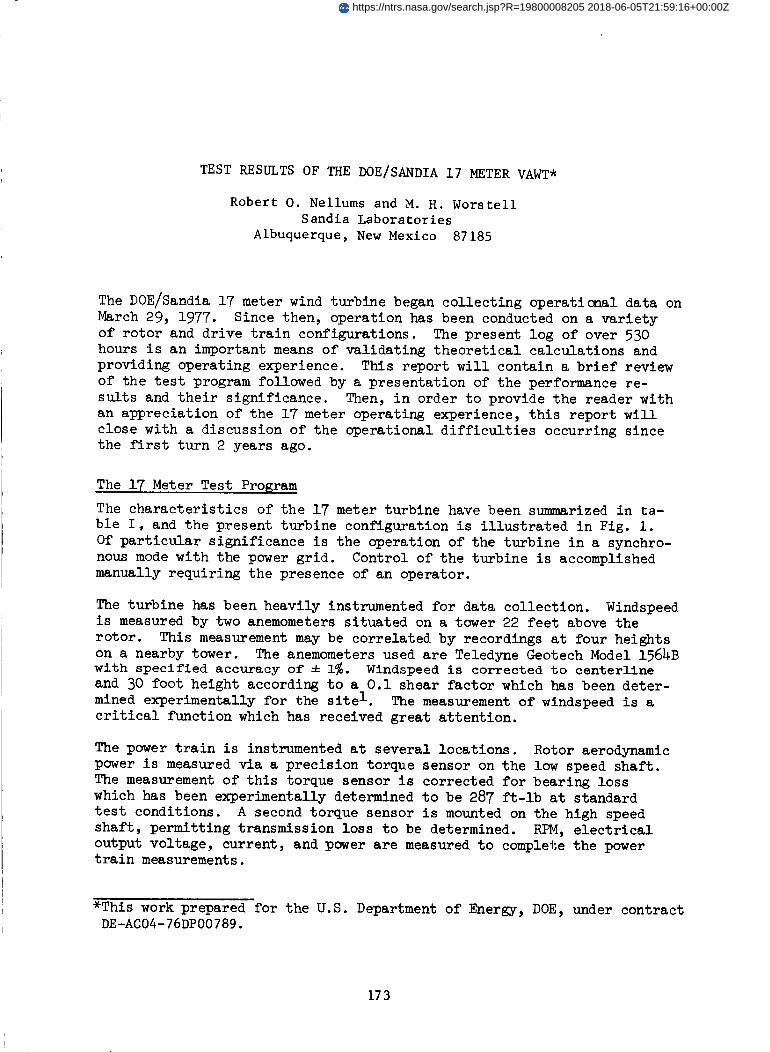
TEST RESULTS OF THE DOE/SANDIA 17 METER VAWT* Robert O. Nellums and M. H. Worstell Sandia Laboratories Albuquerque, New Mexico 87185 The DOE/Sandia 17 meter wind turbine began collecting operaticaal data on March 29, 1977. Since then, operation has been conducted on a variety of rotor and drive train configurations. The present log of over 530 hours is an important means of validating theoretical calculations and providing operating experience. This report will contain a brief review of the test program followed by a presentation of the performance re- sults and their significance. Then, in order to provide the reader with an appreciation of the 17 meter operating experience, this report will close with a discussion of the operational difficulties occurring since the first turn 2 years ago. The 17 Meter Test Program The characteristics of the 17 meter turbine have been summarized in ta- ble I, and the present turbine configuration is illustrated in Fig. 1. Of particular significance is the operation of the turbine in a synchro- nous mode with the power grid. Control of the turbine is accomplished manually requiring the presence of an operator. The turbine has been heavily instrumented for data collection. Windspeed is measured by two anemometers situated on a tower 22 feet above the rotor. This measurement may be correlated by recordings at four heights on a nearby tower. The anemometers used are Teledyne Geotech Model 1564B with specified accuracy of • 1%. Windspeed is corrected to centerline and 30 foot height according to a O.1 shear factor which has been deter- mined experimentally for the site 1. The measurement of windspeed is a critical function which has received great attention. The power train is instrumented at several locations. Rotor aerodynamic power is measured via a precision torque sensor on the low speed shaft. The measurement of this torque sensor is corrected for bearing loss which has been experimentally determined to be 287 ft-lb at standard test conditions. A second torque sensor is mounted on the high speed shaft, permitting transmission loss to be determined. RPM, electrical output voltage, current, and power are measured to complete the power train measurements. *This work prepared for the U.S. Department of Energy, DOE, under contract DE-AC04-76DP00789. 173 https://ntrs.nasa.gov/search.jsp?R=19800008205 2018-06-05T21:59:16+00:00Z
Transcript of SANDIA 17 METER VAWT* Albuquerque, New Mexico 87185 · Albuquerque, New Mexico 87185 ... and...
TEST RESULTS OF THE DOE/SANDIA 17 METER VAWT*
Robert O. Nellums and M. H. Worstell
Sandia Laboratories
Albuquerque, New Mexico 87185
The DOE/Sandia 17 meter wind turbine began collecting operaticaal data on
March 29, 1977. Since then, operation has been conducted on a variety
of rotor and drive train configurations. The present log of over 530
hours is an important means of validating theoretical calculations and
providing operating experience. This report will contain a brief review
of the test program followed by a presentation of the performance re-
sults and their significance. Then, in order to provide the reader with
an appreciation of the 17 meter operating experience, this report will
close with a discussion of the operational difficulties occurring since
the first turn 2 years ago.
The 17 Meter Test Program
The characteristics of the 17 meter turbine have been summarized in ta-
ble I, and the present turbine configuration is illustrated in Fig. 1.
Of particular significance is the operation of the turbine in a synchro-
nous mode with the power grid. Control of the turbine is accomplished
manually requiring the presence of an operator.
The turbine has been heavily instrumented for data collection. Windspeedis measured by two anemometers situated on a tower 22 feet above the
rotor. This measurement may be correlated by recordings at four heights
on a nearby tower. The anemometers used are Teledyne Geotech Model 1564Bwith specified accuracy of • 1%. Windspeed is corrected to centerline
and 30 foot height according to a O.1 shear factor which has been deter-
mined experimentally for the site 1. The measurement of windspeed is a
critical function which has received great attention.
The power train is instrumented at several locations. Rotor aerodynamic
power is measured via a precision torque sensor on the low speed shaft.
The measurement of this torque sensor is corrected for bearing loss
which has been experimentally determined to be 287 ft-lb at standard
test conditions. A second torque sensor is mounted on the high speed
shaft, permitting transmission loss to be determined. RPM, electrical
output voltage, current, and power are measured to complete the powertrain measurements.
*This work prepared for the U.S. Department of Energy, DOE, under contractDE-AC04-76DP00789.
173
https://ntrs.nasa.gov/search.jsp?R=19800008205 2018-06-05T21:59:16+00:00Z
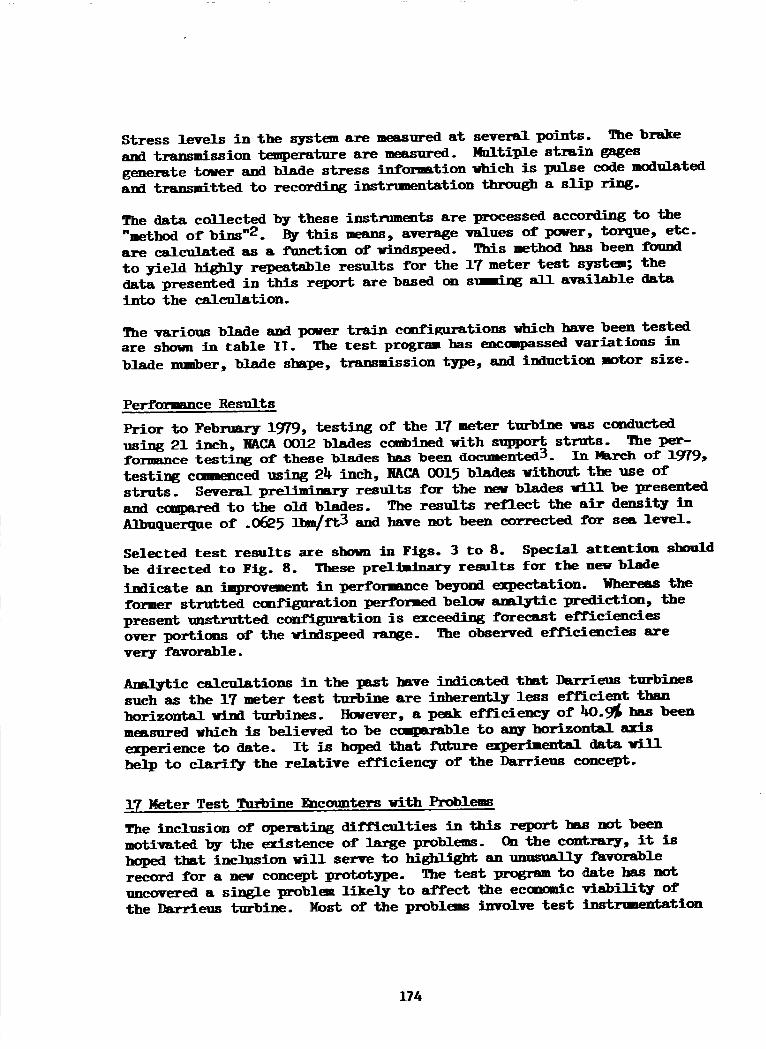
Stress levels in the system are measured at several points. The brake
and transmission temperature are measured. Multiple strain gages
generate tower and blade stress information which is pulse code modulated
and transmitted to recording instrumentation through a slip ring.
The data c_ected by these instruments are processed according to the"method of bins "2. By this means, average values of power, torque, etc.
are calculated as a function of windspeed. This method has been found
to yield highly repeatable results for the 17 meter test system; the
data presented in this report are based on summing all awailable datainto the calculation.
The _xrious blade and power train configurations which have been testedare shown in table II. The test progr_ has encmpassed variations in
blade number, blade shape, transmission type, and induction motor size.
Performance Results
Prior to February 1979, testing of the 17 meter turbine was eonducted
using 21 inch, NACA 0012 blades combined with support struts. The per-formanee testing of these blades has been documented3. In Narch of 1979,
testing ecumenced using 24 inch, NACA 0015 blades without the use of
struts. Several preliwiakry results for the new blades will be presented
and ccmtmxed to the old blades. The results reflect the air density in
Albuquerque of .0_5 Ibm/f_3 and have not been corrected for sea level.
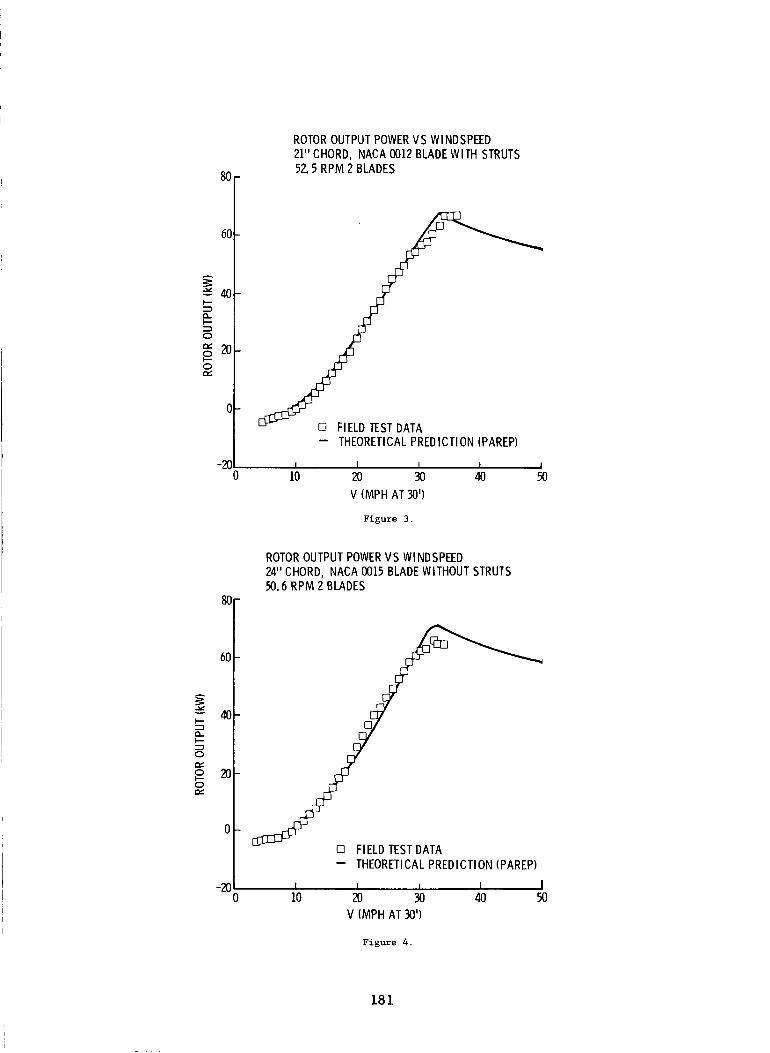
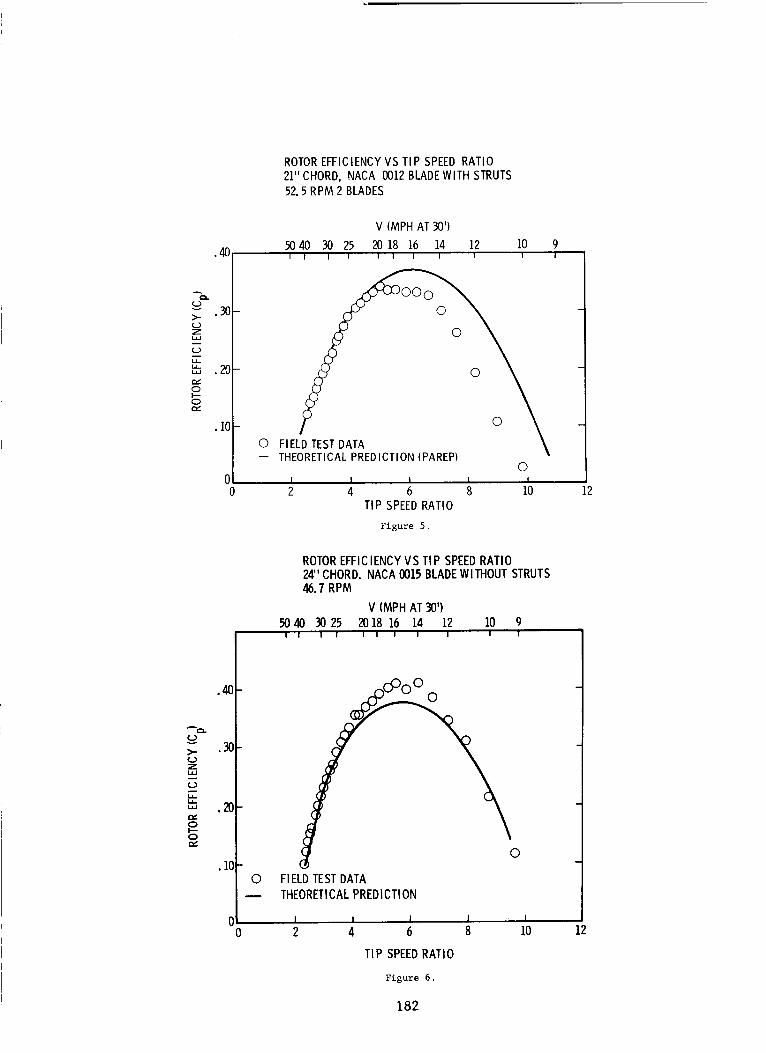
Selected test results are shown in Figs. 3 to 8. Special atteatlon should
be directed to Fig. 8. These preliminary results for the new blade
indicate an improvement in performance beyond expectation. Nhereas the
former strutted con_tion performed below _c prediction, the
present unstrutted configuration is exceeding forecast efYieioncies
over porti_ of the vindspeed range. The observed efficie_cies are
very favorable.
Analytic calculations in the past have indicated that Darrieus turbines
such as the 17 meter test turbine are inherently less efficient than
horizontal wind turbines. However, a peak efficiency of _0._ has been
measured which is believed to be ecmpaxable to any horizontal axis
experience to date. It is hoped that future experimental data will
help to clarif_ the relative efficiency of the Darrieus concept.
17 Meter Test Turbine Encounters with Problem6
The inclusion of operating difficulties in this report has not been
motivated by the existence of large problems. On the contrary, it is
hoped that inclusion will serve to highlight an unusually favorable
record for a new concept prototype. The test program to date has not
uncovered a single problem likely to affect the economic viability of
the Darrieus turbine. Most of the problems invalve test instrumentation
174

not pertinent to normal machine operation. Of the remainder, it is
believed that by identifying potential pitfalls here, future designers
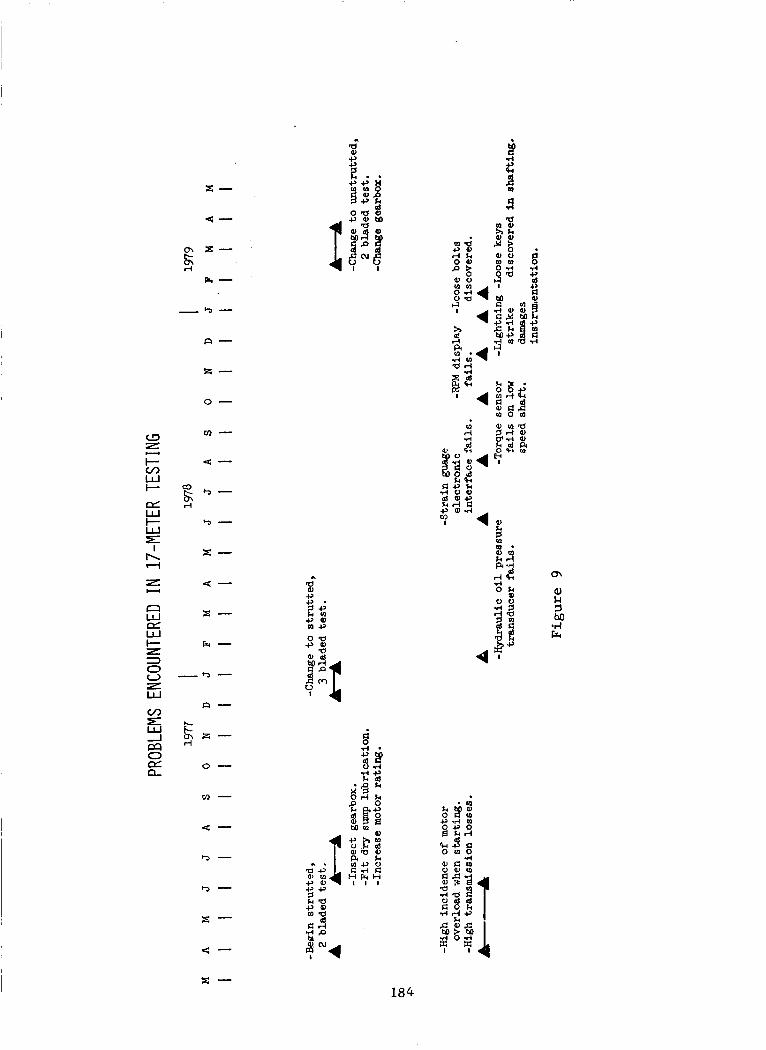
may be able to avoid them. The difficulties which have been experienced
are shown in Fig. 9.
The first problem discovered during testing was an inherent high power
loss in the transmission reaching 30 kW. This condition also aggravated
a tendency of the 50 hp induction motor to overload during start up.
These problems were addressed by first disassembling and inspecting the
transmission. After finding no faults, the wet sump lubrication was
replaced with a dry sump system. Following this modification, the trans-
mission efficiency improved dramatically as is shown in Fig. 3. No
additional start up problems have arisen. A final modification at this
time was to increase the induction motor to 75 hp in order to expand the
system generating capability using an induction generator. The rating
increase was also expected to complement the start up capability.
Occurring next in chronological order were several faults in the data
collection instrumentation which had no bearing on normal machine opera-
tion. The pressure transducer used to indicate brake pressure failed
and was replaced with no problems since. The Pulse Code Modulator used
to transmit multiple strain gage measurements developed a faulty power
supply which was replaced and no problems have resulted since. The
torque sensor used to measure rotor output suffered water damage and
had to be rebuilt. Last, the LED readout of RPM became erratic and was
replaced.
The lightning protection system for the 17 meter test system consists of
a top mounted mast connected to ground through the four guy cables and
through the tower via dedicated slip rings*. Only the mechanical system
is protected. The turbine has undergone five lightning strikes; only
the last strike caused discernable damage. High voltage passed through
the anemometer output wires into the computer interface, damaging several
circuit boards. Future effort will be aimed at protecting electronic
components.
The most recent difficulty to arise has been the loosening of several
bolts and drive shaft keys. As a result, regular inspection of bolts
and keys is now performed. The keys were only found to be loosening
on shafts where the key was th_ only locking mechanism transmitting
torque. These keys are being replaced by clamp-type arrangements. Both
of these problems are to some degree associated with the oscillatory
output of the turbine which should be reduced on future designs as a
result of torque ripple reduction studies5.
Two final problems are minor but have been consistently bothersome. The
blade hinge pins tend to seize to their bushings and complicate the
changing of blades. Secondly, the anemometers are extremely subject to
damage from hailstorms, ice, and high wind and have required frequent
175

repair. Several more robust units are being investigated for use inmeasuring cut-in and cut-out windspeed such as might be done on a commer-cial design. However, the test program requires the finest and mostprecise windspeed measurementavailable and it appears that the currentrate of repair maybe unavoidable on the 17 meter testing.
To summarizethe conclusions of this report, the 17 meter diameter testbed has thus far produced power efficiency and reliability experiencefavorable to the Darrieus turbine concept. Continued experimental test-ing is expected to play an important role in future Darrieus turbinedevelopment.
References
l,
.
,
.
R. E. Akins, "Wind Characteristics at the VAWT Test Facility,"
Sandia Laboratories Report, SAND78-0760, September 1978.
R. E. Akins, "Performance Evaluation of Wind Energy Conversion Sys-
tems Using the Method of Bins - Current Status," Sandia Laboratories
Report, SAND77-1375, March 1978.
M. H. Worstell, "Aerodynamic Performance of the 17 Meter Diameter
Darrieus Wind Turbine," Sandia Laboratories Report, SAND78-1737,
September 1978.
C. W. Dodd, "Lightning Protection for the Vertical Axis Wind Tur-
bine," Sandia Laboratories Report, SAND77-1241, October 1977.
R. C. Reuter, M. H. Worstell, "Torque Ripple in a Vertical Axis
Wind Turbine," Sandia Laboratories Report, SAND78-0577, April 1978.
Q.
A.
DISCUSSION
What are the details of your theoretical prediction? Are you using a steady
profile drag coefficient?
Vertical axis technology is not mature, and our analytical techniques are
in a state of flux. We presently simulate VAWT aerodynamic performance
using a multiple stress tube model which has been tailored slightly to match
experimental wind tunnel data. It is not the kind of accuracy we have a lot
of confidence in. We are developing additional models.
Q. What do you have for profile drag in this prediction?
176
A.
Q$
A.
Q.
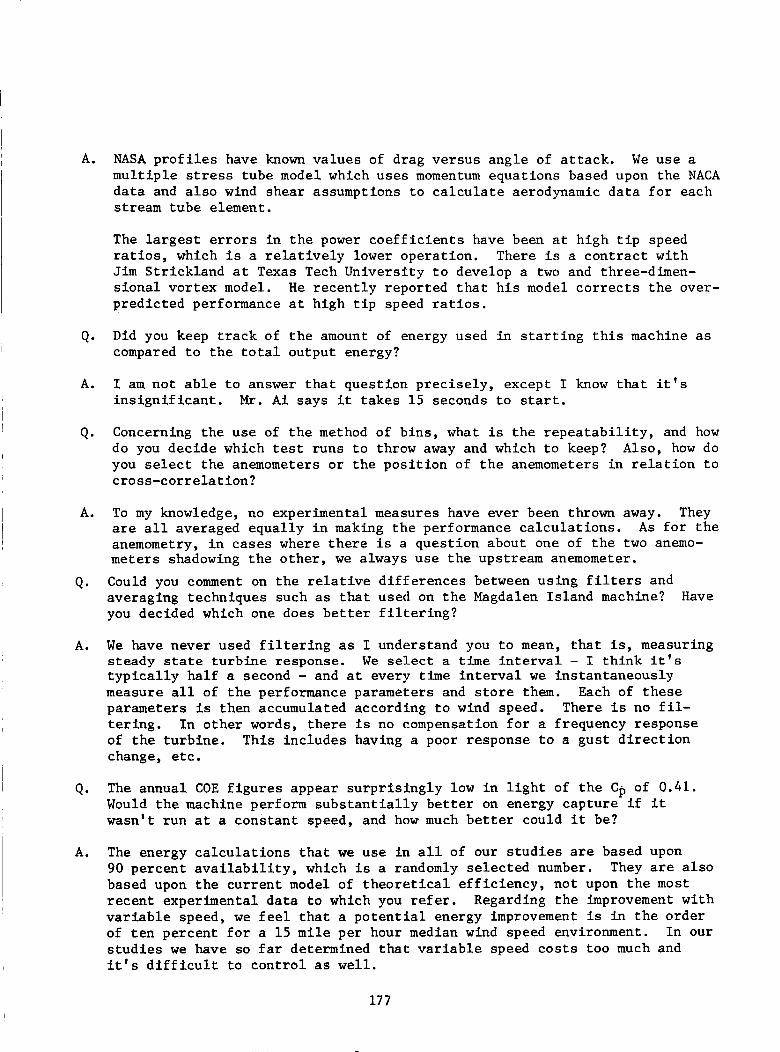
NASA profiles have known values of drag versus angle of attack. We use a
multiple stress tube model which uses momentum equations based upon the NACA
data and also wind shear assumptions to calculate aerodynamic data for each
stream tube element.
The largest errors in the power coefficients have been at high tip speed
ratios, which is a relatively lower operation. There is a contract with
Jim Strickland at Texas Tech University to develop a two and three-dimen-
sional vortex model. He recently reported that his model corrects the over-
predicted performance at high tip speed ratios.
Did you keep track of the amount of energy used in starting this machine as
compared to the total output energy?
I am not able to answer that question precisely, except I know that it's
insignificant. Mr. Ai says it takes 15 seconds to start.
Concerning the use of the method of bins, what is the repeatability, and how
do you decide which test runs to throw away and which to keep? Also, how do
you select the anemometers or the position of the anemometers in relation to
cross-correlation?
A. To my knowledge, no experimental measures have ever been thrown away. They
are all averaged equally in making the performance calculations. As for the
anemometry, in cases where there is a question about one of the two anemo-
meters shadowing the other, we always use the upstream anemometer.
Q. Could you comment on the relative differences between using filters and
averaging techniques such as that used on the Magdalen Island machine? Have
you decided which one does better filtering?
A.
Q.
Ao
We have never used filtering as I understand you to mean, that is, measuring
steady state turbine response. We select a time interval - I think it's
typically half a second - and at every time interval we instantaneously
measure all of the performance parameters and store them. Each of these
parameters is then accumulated according to wind speed. There is no fil-
tering. In other words, there is no compensation for a frequency response
of the turbine. This includes having a poor response to a gust direction
change, etc.
The annual COE figures appear surprisingly low in light of the Cp of 0.41.
Would the machine perform substantially better on energy capture if it
wasn't run at a constant speed, and how much better could it be?
The energy calculations that we use in all of our studies are based upon
90 percent availability, which is a randomly selected number. They are also
based upon the current model of theoretical efficiency, not upon the most
recent experimental data to which you refer. Regarding the improvement with
variable speed, we feel that a potential energy improvement is in the order
of ten percent for a 15 mile per hour median wind speed environment. In our
studies we have so far determined that variable speed costs too much and
it's difficult to control as well.
177
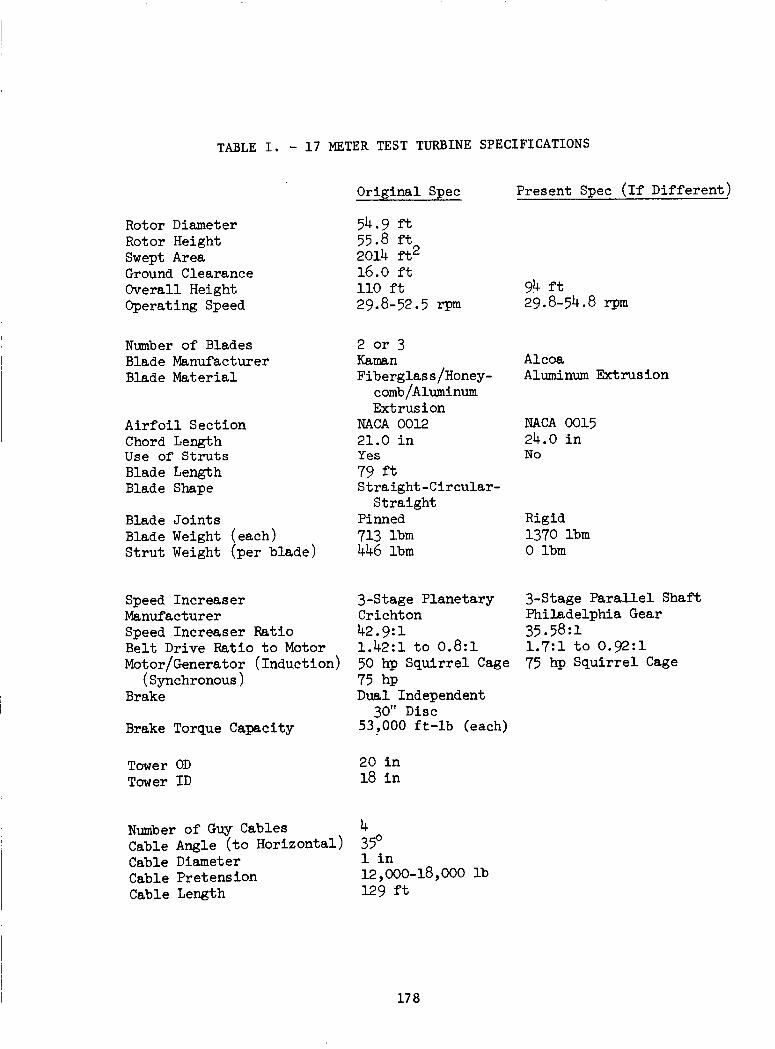
TABLE I. - 17 METER TEST TURBINE SPECIFICATIONS
Rotor Diameter
Rotor Height
Swept AreaGround Clearance
Overall Height
Operating Speed
Number of Blades
Blade Manufacturer
Blade Material
Airfoil Section
Chord LengthUse of Struts
Blade Length
Blade Shape
Blade Joints
Blade Weight (each)
Strut Weight (per blade)
Original Spec
54.9 ft55.8 ft2014 ft216.O ft
ii0 ft
29.8-52.5 rpm
2 or3Kaman
Fib erglas s/Honey-
comb/AluminumExtrusion
NACA 0012
21.0 inYes
79 ft
Straight-Circular-
StraightPinned
713 ibm446 lbm
Present Spec (If Different)
94 ft
29.8-54.8 rpm
Alcoa
Aluminum Extrusion
NACA 001524.0 inNo
Rigid1370 lbm
0 lbm
Speed IncreaserManufacturer
Speed Increaser RatioBelt Drive Ratio to Motor
Motor/Generator (Induction)
(Synchronous)Brake
Brake Torque Capacity
Tower OD
Tower ID
3-Stage PlanetaryCrichton
42.9:11.42:1 to O.8:1
50 hp Squirrel Cage75 hp
Dual Independent30" Disc
53,000 ft-lb (each)
2O in
18 in
3-Stage Parallel Shaft
Philadelphia Gear
35.58:1
1.7:1 to 0.92:1
75 hp Squirrel Cage
Number of Guy Cables
Cable Angle (to Horizontal)Cable Diameter
Cable Pretension
Cable Length
435°i in
12,000-18,000 lb
129 ft
178

TABLE II. - 17 METER TEST CHRONOLOGY
Item
Begin strutted,2-bladed test
Inspect gear box
Fit dry sump lubrication
Increase motor rating
Change to strutted,
3-bladed test
Change to unstrutted
2-bladed test
Change gear box
Date
April 1977
June and July1977
December 1977
January 1978
February and March
1979
179

THE17-METERTESTTURBINE,
nu /r
Figure i.
i00
8O
6O
m
40
2O
EFFICIENCYOFTHEPLANETARYGEARBOXAFTERDRYSUMPMODIFICATION
i0 20 30 {0
powernm_ (m_)
, r---'---'-----t
50 6O 70
Figure 2,
180
8O
ROTOROUTPUTPOWERVS Wl NDSPEED21" CHORD, NACA0012 BLADEWITH STRUTS52.5 RPM 2 BLADES
6O
A
0
,-,- 20
0ev.
-200
- THEORETICALPREDICTION (PAREP)
I I I I I
10 20 30 40 .50
V (MPH AT 30')
Figure 3.
A
h--
Q-h----%O
O
Oev*
8O
6O
4O
20
-2010
ROTOROUTPUTPOWERVS Wl NDSPEED24" CHORD, NACA 0015 BLADEWITHOUTSTRUTS50.6 RPM 2 BLADES
[] FIELDTESTDATA-- THEORETICALPREDICTION (PAREP)
I I I I I
10 20 30 40 50
V (MPH AT 30')
Figure 4.
181
ROTOREFFICIENCYVSTIPSPEEDRATIO21"CHORD,NACA0012BLADEWITHSTRUTS52.5 RPA42 BLADES
O
>-
O
,,z,C.O
LIJ
p,,,
OI,--OCIC
(_)
>-
(..)ZI.i.Im
r.J
LI.I.I-LIJ
e,,.
OI---O
.40
.30
.20
•10
•4(]
.30
.20
•10
0i
0
O
V (MPH AT 30')
.5040 30 25 20 18 16 14 12 10 9I I I I I I [ I f I I
FIELD TESTDATATHEORETICALPREDICTION(PAREP)
©I I i I I
2 4 6 8 10TiP SPEED RATIO
Figure 5.
ROTOREFFICIENCYVS TIP SPEEDRATIO24" CHORD. NACA 0015 BLADEWITHOUT STRUTS46. 7 RPM
V (MPH AT 30')50 40 30 25 2018 16 14 12 10 9
I I I I I I I I I I I
0
°°°° 0
FIELD TESTDATA
THEORETICALPREDICTION
I I I I2 4 6 8
TiP SPEEDRATIO
Figure 6.
I10
12
12
182

ROTOREFFICIENCYVS TIP SPEEDRATIO
24" CHORD, NACA 0015 BLADEWITHOUTSTRUTS50.6 RPM 2 BLADES
5040 30 25 20 18 16 14 12 10 9I II 1 I I I l I ] t
V (MPH AT 30')
•4o @%0 oo0
gN "20
.1 o FIELDTESTDATA \- THEi_O_:TTC,_IPREDICTION(PAREPI -\0
I I I I J
O 2 4 6 8 10
TIP SPEEDRATIO
Figure 7.
12
A
>-¢.)Z
¢.)
l,
o
o
• 40
.30
.20
• 10
00
TWO BLADEDROTOREFFICIENCYVS TIP SPEEDRATIO
24" CHORDNACAOO1.5UNSTRUTTED50.6 RPM
O
(_%0 21"CHORD0 0 0 NACA 0012
0 0 STRUTTED
0 f© ©
°°0 ©
©
©I II I
4 6TIP SPEEDRATIO
8 10
Figure 8.
I12
183
,--4
0
z
O0
i,i
i,iE
I
r_ x
ILl _:
I,I
;E
O
ZI,I
ELU _
_ m
m4_
O_
e_,.. t
4.)
o,_
O•el °
O.H
I.._ [._ I--.II I !
•H .,-4
0-_ _ _o_o,_ .,_,
, ._._
,,-40¢1
I::k "_
O %11)
O O
N,'-t
a)l-i
.H
184