SAND2005-6569 Unlimited Release October 1 Human...
23
SAND REPORT SAND2005-6569 Unlimited Release Printed October 2005 Human Performance Modeling for System of Systems Analyt cs : Soldier Fatigue Lawton, Dwight . P . Miller, James E . Campbell Prepared by Sandia National Laboratories Albuquerque, New Mexico 87185 and Livermore California 94550 Sandia is a multiprogram laboratory operated by Sandia Corporation, A Lockheed Martin Company, for the United States Department of Energy under Contract DE-AC04-94AL85000.
Transcript of SAND2005-6569 Unlimited Release October 1 Human...
1SAND REPORTSAND2005-6569Unlimited ReleasePrinted October 2005
Human Performance Modeling for System ofSystems Analyt cs: Soldier Fatigue
Lawton, Dwight. P . Miller, James E . Campbell
Prepared bySandia National LaboratoriesAlbuquerque, New Mexico 87185 and Livermore California 94550
Sandia is a multiprogram laboratory operated by Sandia Corporation,A Lockheed Martin Company, for the United States Department ofEnergy under Contract DE-AC04-94AL85000.
1
1
Issued by Sandia National Laboratories, operated for the United States Department of Energy by Sandia Corporation.
NOTICE : This report was prepared as an account of work sponsored by an agency of the United StatesGovernment . Neither the United States Government nor any agency thereof, nor any of their employees, nor anyof their contractors, subcontractors, or their employees, makes any warranty, express or implied, or assumes anylegal liability or responsibility for the accuracy, completeness, or usefulness of any information, apparatus,product, or process disclosed, or represents that its use would not infringe privately owned rights . Referenceherein to any specific commercial product, process, or service by trade name, trademark, manufacturer, orotherwise, does not necessarily constitute or imply its endorsement, recommendation, or favoring by the UnitedStates Government, any agency thereof or any of their contractors or subcontractors . The views and opinionsexpressed herein do not necessarily state or reflect those of the United States Government, any agency thereofor any of their contractors .
ii

SAND2005-6569
Unlimited Release
Printed October 2005
Human Performance Modeling for System of Systems Analytics : SoldierFatigue
Craig R. LawtonDwight P. Miller
James E. Campbell
Sandia National Laboratories
Abstract : The military has identified Human Performance Modeling (HPM) as a significantrequirement and challenge of future systems modeling and analysis initiatives as can be seen in theDepartment of Defense's (DoD) Defense Modeling and Simulation Office's (DMSO) Master Plan(DoD 5000 .59-P 1995). To this goal, the military is currently spending millions of dollars onprograms devoted to HPM in various military contexts . Examples include the HumanPerformance Modeling Integration (HPMI) program within the Air Force Research Laboratory,which focuses on integrating HPMs with constructive models of systems (e .g . cockpit simulations)and the Navy's Human Performance Center (HPC) established in September 2003 . Nearly all ofthese initiatives focus on the interface between humans and a single system. This is insufficient inthe era of highly complex network centric SoS . This report presents research and development inthe area of HPM in a system-of-systems (SoS) . Specifically, this report addresses modelingsoldier fatigue and the potential impacts soldier fatigue can have on SoS performance .
111

TABLE OF CONTENTS
1. INTRODUCTION 1
2. FATIGUE MODELS FOUND IN THE OPEN LITERATURE 1
2 .1 The Two-Process Model 2
2 .2 Sleep/Wake Predictor Model 2
2 .3 System for Aircrew Fatigue Evaluation (SAFE) 2
2 .4 Interactive Neurobehavioral Model 2
2 .5 SAIC Human Performance Cognitive Model (HPCM) 2
2 .6 SAFTE 3
2 .7 CAS – Circadian Alertness Simulator 4
2 .8 Galaxy Aviation Maintenance Fatigue & Performance Study 4
2.9 Dynamic Bayesian Network Real-Time Fatigue Modeling and Monitoring 4
2.10 Dawson and Fletcher's FAID Model of Work-Related Fatigue 5
2 .11 Comparison of Six Models of Fatigue at 2002 Workshop 5
2 .12 Selecting a Fatigue Model for Experimentation 7
3. REVIEW OF SOS SIMULATION METHODOLOGY 7
4. EXPERIMENTATION AND RESULTS FOR SCENARIOS INCLUDING SOLDIERFATIGUE 10
4.1 Simulation Example Problem Definition 10
4.2 Representing Soldier Fatigue in the SoS Simulation 11
4.3 Experiments and Results 14
5. CONCLUSIONS AND FUTURE CONSIDERATIONS 15
6.0 REFERENCES 16
iv
1
LIST OF FIGURES
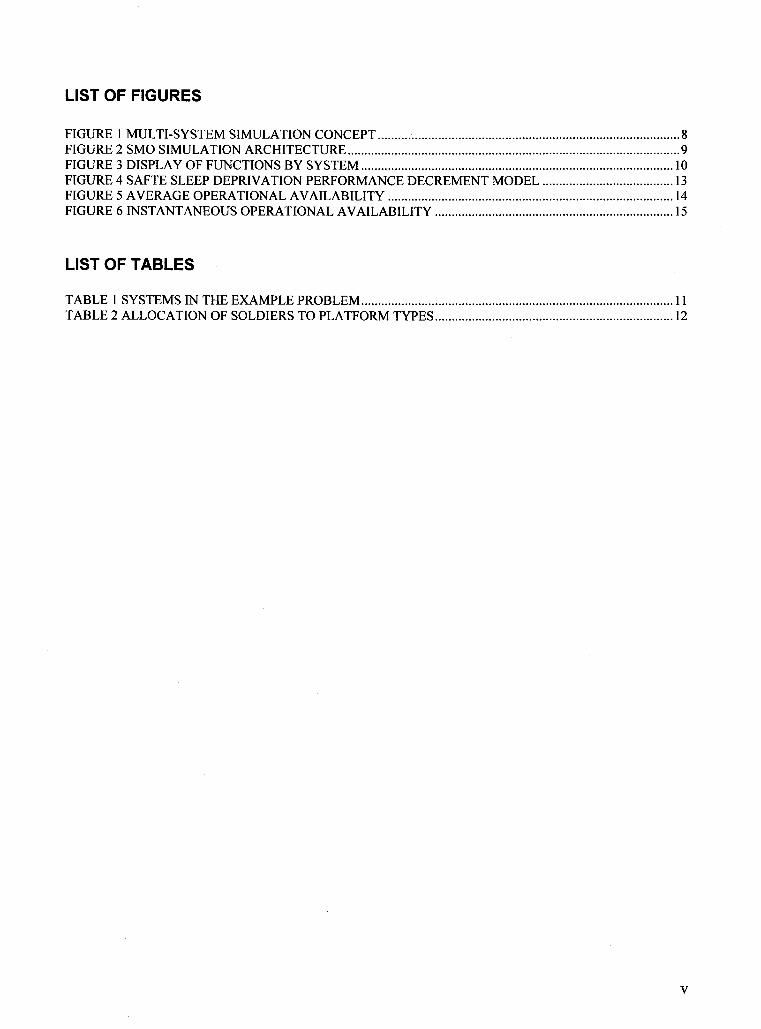
FIGURE 1 MULTI-SYSTEM SIMULATION CONCEPT 8FIGURE 2 SMO SIMULATION ARCHITECTURE 9FIGURE 3 DISPLAY OF FUNCTIONS BY SYSTEM 10FIGURE 4 SAFTE SLEEP DEPRIVATION PERFORMANCE DECREMENT MODEL 13FIGURE 5 AVERAGE OPERATIONAL AVAILABILITY 14FIGURE 6 INSTANTANEOUS OPERATIONAL AVAILABILITY 15
LIST OF TABLES
TABLE 1 SYSTEMS IN THE EXAMPLE PROBLEM 11TABLE 2 ALLOCATION OF SOLDIERS TO PLATFORM TYPES 12
v

1. Introduction
Current System of Systems (SoS) analysis efforts at Sandia National Laboratories (SNL) capturemultiple performance attributes of military hardware systems, such as mobility and lethality inthe context of user-defined scenarios . This capability is state-of-the-art and unique to SNL.However, the analysis capability is focused on technological and sustainment systems ; thecontributions and performance capabilities of human operators are not included . The problemwith this approach is that humans are the driving force behind most military operations . Notincluding them in any analysis may miss the largest performance factor of the SoS simulation.When we considered the largest determinants of human performance in military scenarios,cognitive fatigue was noted as the leading contributor . In this report, we will present the resultsof a late-start LDRD effort to develop a methodology for integrating soldier fatigue with thecurrent SoS modeling and simulation toolset.
Significant research has been devoted to human fatigue in a military context. This research hasled to the development of biomathematical models intended to capture the effects of work-restschedules, sleep deprivation, circadian rhythms, and sleep-replenishment cycles on perceivedsleepiness and performance . The goal of this project is to use this research as the basis forestimating fatigue in humans and quantifying the potential impact of fatigue on SoS performance(e.g. the performance of a company within the Unit of Action force structure) . The fundamentalapproach to achieve this goal is to assess the current state of human fatigue modeling in the openliterature and select the most promising models that will support representing soldiers aselements within the simulation linked to combat and support platforms . This will allow themodeling of task failure rate in soldiers based on biomathematical models . A task failure isassumed to be a failure that leads to a system abort. Each soldier has a baseline task failure rateat maximum alertness . As a mission scenario unfolds and soldiers are deprived of sleep, theirtask failure rates increase . The increase in failure rate is estimated by a biomathematical modelof the effects of sleep deprivation on task performance . This approach allows for the assessmentof the impact of human fatigue on platform and SoS performance (e .g. operational availability).
A survey of the research and development devoted to human fatigue modeling will be presentedin Section 2. This will be followed by a brief review of the current SoS simulation and analysismethodology in section 3 . Section 4 will present a preliminary set of experiments and resultsdemonstrating the utility of the inclusion of human fatigue modeling in the SoS methodology . Inthe final section, Section 5, future considerations will be addressed.
2. Fatigue Models Found in the Open Literature
This section summarizes current fatigue models that may be suitable for inclusion in the SoSmodeling structure. Please note that the models described herein address cognitive fatigue, notfatigue resulting from physical labor.
1
2.1 The Two-Process Model
Developed initially for the sleep-research field, Achermann's two-process model resides at thebasis of many models that address the regulation of fatigue and performance . Based onelectroencephalographic slow-wave data collected during non-REM sleep, the model includes alinear interaction of homeostatic and circadian processes and an exponential sleep-inertiacomponent. In 2003, the software associated with this model did not have a standard interfaceand could not be updated in real-time [1].
2.2 Sleep/Wake Predictor Model
Akerstedt developed this model using empirical subjective alertness data from altered sleep/wakepatterns . It assumes an eight-hour sleep period to begin, an exponential fall in alertness duringwakefulness, followed by an exponential rise in alertness during sleep . It uses a circadianrhythm peak alertness at 4 :48 PM, and an exponential sleep-inertia factor. The model wasdeveloped for sleep researchers, companies demanding irregular work schedules, andorganizations governing safe work-hour regulations . The software allows real-time updates andhas screen outputs that include sleep latency, duration and bedtime, as well as alertness andperformance curves [1].
2.3 System for Aircrew Fatigue Evaluation (SAFE)
Developed primarily for aviation operation applications, the SAFE model grew out of laboratoryexperiments and was fine tuned using long-haul flight operational data . The model is a"combination of sinusoidal component in time of day and a cubic trend in time since sleep ."Currently being used by the UK Civil Aviation Authority, the interface displays resultsgraphically in two-week time frames, alertness levels are color-coded, and the existing version ofthe model (in 2003) did not accept real-time updates [1].
2.4 Interactive Neurobehavioral Model
This model uses a combination of circadian, homeostatic, and sleep-inertia components toestimate neurobehavioral performance. It assumes initial conditions of eight hours of sleep indarkness and 16 hours of wakefulness in 150 lux illumination . Validation studies with humansubjects include varying light patterns, jet lag, sleep deprivation, and non-24 hour schedules.The PC-compatible software allows inputs of light levels and sleep/wake times, while the outputgraphs performance, alertness, and minimum core body temperature . This model is used byNASA and DoD researchers [1].
2.5 SAIC Human Performance Cognitive Model (HPCM)
This holistic model considers fatigue as only one of several stressors that can have a limitinginfluence on human performance in information operations (e .g. decision-making, targetselection, situation analysis, mission analysis, and communication) . The HPCM can produce asoutputs minute-to-minute estimates of human effectiveness (as a percentage of maximum), timedelay, and decision-making styles (called types by the authors) . The model has beenimplemented in Windows-compatible simulation software, which has a user interface consisting
2
of input and parameter adjustment screens and a run-time output screen, whose minute-to-minuteestimates are entered into an Excel spreadsheet [2].
The HPCM assumes an underlying naturalistic decision-making process, as stipulated by Kleinand colleagues [3,4] . In addition to the influences of sleep-deprivation and fatigue onperformance, the model accounts for the stressors of 1) time pressure (i .e . having less thanoptimal time to perform a task), 2) personality (aggressive/risk tolerant vs . non-aggressive/riskaverse), and 3) threats of failure and confidence builders (e .g. hearing that your forces achieved agoal) . The model also accounts for significant modulators of stress, including training,experience, and intelligence.
2.6 SAFTE
For the purposes of this summary, the sleep-deprivation and fatigue stressors are the mostinteresting part of the HPCM, described in section 2 .5 . These factors are handled by the SAFTE(Sleep, Activity, Fatigue, and Task Effectiveness) model, developed by Steven Hursh andcolleagues at SAIC and Johns Hopkins University School of Medicine . It has been underdevelopment in various forms since 1989, and is probably the most complex and sophisticatedfatigue model extant . It uses a circadian rhythm function, a circadian sleep propensity function,and a method to extend predictions to task effectiveness and cognitive capability . The SAFTEapplies to information operations only and makes no claims for applying to physical-exertionactivities or other kinds of work.
Under sustained combat conditions, sleep deprivation and fatigue are natural human hazards.Tasks most sensitive to sleep deprivation and fatigue are cognitive operations, such as decision-making, logical reasoning, memory, and mathematics . According to Hursh [2]:
" . . .studies of sleep patterns in simulated combat at the National Training Centerindicate that commanders (Lt . Colonels and Colonels) in force on force operationsaverage just over four hours of sleep per day, about half of the normalrequirement for fully effective performance ."
The SAFTE model assumes a cognitive reservoir that maintains a balance of effectiveperformance units . The reservoir is set at the beginning of the simulation, based on the sleepdebt (if applicable) accumulated in the days prior to the simulation start time . During sleep, unitsaccumulate at rates responsive to the existing sleep deficit (i .e . more quickly for the initial sleepthan prolonged sleep) . Units are subtracted during time awake in a linear manner until a steadystate is achieved after three days of reduced sleep of 4 hours per night . Effectiveness is aminute-by-minute mathematical calculation based on the cognitive reservoir level, circadianrhythm, and motivation effects.
The Air Force Research Laboratory in conjunction with the Air Force Operational Test andEvaluation Center conducted a wartime aircrew fatigue assessment during C-17 missions toAfghanistan during Operation Enduring Freedom [6] . Data collection included psychomotortests, activity monitors, logbooks, and subjective self-assessments .
3
2.7 CAS – Circadian Alertness Simulator
The CAS model allows for the assessment of fatigue risk (usually for the transportation industry)based on sleep-wake patterns . The model is based on the Two-Process Model . A homeostaticcomponent is combined with a circadian-rhythm component to calculate an alertness curve.Sleep-wake data and the operator's individual chronotype characteristics (short vs . long sleeper,morning type vs . evening type, etc .) and napping capability are used as input to the model.Output includes graphical plots of predicted alertness as a function of time, the impact of naps atdifferent times of day, frequency distributions of simulated alertness during work andcommuting activities, and distributions of cumulative fatigue risk scores for large groups ofworkers.
The model does not account for different kinds of work or other stressors that may influencealertness or fatigue . This approach is best used for determining optimal work schedules for aknown population of workers, who can supply individual data on their sleep/wake patterns . It isalso used in accident analysis to inquire whether fatigue was in influencing factor.
The validation approach described in [5] seemed to be circular reasoning . This model performedleast well in the independent model comparison of six fatigue models, conducted at a Fatigue andPerformance Workshop, where the models were used to predict results from four standardscenarios [13].
2.8 Galaxy Aviation Maintenance Fatigue & Performance Study
In 2001, Galaxy Scientific Corp . published a report on the results of an FAA-sponsored studylooking at predictors of human performance in commercial aviation maintenance workers [8].Variables studied included average daily sleep, occupational extreme temperatures, lighting,noise, and alertness . Twenty-five commercial-airline, maintenance personnel wore activity-measuring devices for 14 days, which yielded an average sleep duration of 5 hours 7 minutes perday. This finding was consistent with previous studies . Twenty-three technicians woremeasurement devices to monitor temperature, ambient lighting, and sound levels while working.All 48 filled out questionnaires about working conditions and personal habits . Roughly half ofthe participants worked swing/night shifts . Workers were unaware of the average actual sleepduration, and claimed an average 6 .26 hours in the questionnaire . The authors point out that theactual measurements did not include initial "tossing and turning" as sleep, and that peopletypically estimate their sleep time by inclusive clock time . Regardless, the authors concludedthat actual sleep duration was inadequate for the required work and recommended remedialactions that could be taken. The authors offered a simple mathematical model describing howtemperature, sound, light and fatigue impact the probability of an error occurring . Fatigue had animpact an order of magnitude higher than any of the other factors.
2.9 Dynamic Bayesian Network Real-Time Fatigue Modeling and Monitoring
Lan, Qiang, and Looney developed a dynamic fatigue model based on hierarchical BayesianNetworks in 2003 . In order to account for the changes in fatigue over time, the authors improvedupon their previous static model [9], which utilized contextual nodes, such as temperature, light,anxiety, and workload ; and observation nodes, such as gaze, head tilt, and yawn frequency .
4

Rather than step-function outputs, as found with the static model, the fatigue predictions of thedynamic model [10] show curvilinear and asymptotic profiles, which more realistically modelthe accumulation of fatigue over time . The authors are currently validating the model usinghuman subjects.
2.10 Dawson and Fletcher's FAID Model of Work-Related Fatigue
Based on the work of Borbely and Daan, Dawson and Fletcher analyze fatigue based on thelinear accumulation of hours of prior wakefulness and sinusoidal components from circadianrhythms [11,12] . The circadian component assumes a 24-hour periodicity with a maximumfatigue rate of 2 .0 units per hour starting at 0500 hours and a minimum value of 1 .0 unit perhours at 1700 hours . Therefore, the increase in fatigue across a work period is not linear, butdependent upon the time of day. Quality of sleep varies as a function of the time of sleep onsetand the amount of sleep . Thus, the model calculates fatigue as an algebraic function of fatigueand recovery functions, given the initial conditions of prior work over the previous week.Saturation occurs when full recovery has occurred, regardless of additional sleep beyond 10-11hours . The model has been used to evaluate alternative work schedules for standard and rotatingwork schedules and for commercial-aviation schedules . The model's output indicates that foridentical work durations, time of work onset and shift rotation can increase work-related fatigueby up to 60 percent. The model is described in detail in [11], and empirical evaluations arereported in [ 12].
The second article in the series [12] addresses model evaluations using sleep-deprivationexperiments and comparisons to current scheduling recommendations found in the literature.Fairly high concurrence was attained between model predictions and performance aftercumulative sleep deprivation of 4-5 hours per night for 7 nights . Model predictions were foundto correlate highly with psychomotor vigilance task (PVT) lapses (r = 0 .92) and slowest 10% ofreaction time responses (r = 0.91), as well as sleep latency (r = -0.97). When model predictionswere compared to published data from continuous sleep deprivation over a 64-hour period,correlations were obtained with vigilance (r = -0 .75), performance (r = -0.75), sleepiness (r =0.82), and tiredness (r = -0 .79) . The model also predicts fatigue levels for workers on a rotatingshift schedule. Using the results of model outputs the authors make several recommendationsabout shiftwork. For example, they state that as few night shifts as possible be worked insuccession, with the maximum of three . They also suggest that permanent night shift workshould be avioided, as should single days off between night shifts, and that forward rotation ofshifts (morning, day, night) are preferable to backward rotation (morning, night, day) . Theauthors suggest that further improvements in accuracy could be attained if day-to-day changes incircadian rhythms can be accounted for (e .g. crossing time zones).
2.11 Comparison of Six Models of Fatigue at 2002 Workshop
A Fatigue and Performance Modeling Workshop was held in Seattle, WA on June 13 and 14,2002 . Predictions of human fatigue and performance were solicited for four differentsleep/wake/work scenarios from the mathematical modeling community . Six modeling teamsresponded and their predictions were compared to empirical data collected from experiments forthe four scenarios . A fifth scenario was given to the modeling teams at the Workshop. Theteams that competed were :
5
A. CHS Chronic Fatigue ModelB. CASC. FAIDD. Interactive Neurobehavioral ModelE. SAFTEF. Sleep/Wake Predictor
Spencer & BelyavinMoore-EdeDawson & FletcherJewett & KronauerHurshFolkhard & Akerstedt
The five scenarios used for prediction comparisons used healthy male and female non-drug usersas subjects in the following wake/sleep/work profiles:
Scenario 1 : 88 hours of extended wafefulnessn=13 without naps, n=12 with 2-hour naps every 12 hours
Scenario 2 : 14 days of partial sleep deprivationn=13 sleep resticted to 4 hours/day, n=11 sleep restricted to 6 hours/day
Scenario 3 : Freight locomotive engineers on the Extra Board (on-call substitutes)n=10 male engineers over 14 days kept daily logs, no napping was allowed duringwork periods, caffeine was consumed ad libitum
Scenario 4 : Long-range flight operationsTheoretical 20-hour flights, followed by 50-hour layover, followed by 18-hourreturn flight, no drugs used except caffeine
Scenario 5 : 7 days of sleep restriction followed by 3 days recoveryn=16 slept 7 hours/day, n=18 slept 3 hours/day, followed by sleep from 23 :00 to07 :00. This scenario was presented at the Workshop
Dependent measures included subjective sleepiness (Karolinska Sleepiness Scale, or KSS) and apsychomotor vigilance task (PVT), which measures time lapses in responses to stimuli . In bothmetrics, larger scores indicate increased fatigue . Ref. 12 publishes all of the graphicalcomparisons between empirical data and model predictions, and summarizes the mean squareerror (MSE) and relative root-mean-squared error (RRMSE) between actual and predictedsleepiness and performance for the six models . Differences between models were notstatistically compared, however numerical differences were generally small compared to thedifferences between model predictions and empirical data.
Results In scenario 1, model B had the lowest MSE and RRMSE for sleepiness, while model Dedged out the others for lowest error in performance. In scenario 2, model E predicted sleepinessbest, while model C was had the lowest error for performance . However, when sleep inertia wasremoved (all the data points immediately following awakening were removed from the analysis)in scenario 2, [revised] model E was the winner . Scenario 3 yielded a virtual dead heat formodels F, B, and E for predicting alertness (model A was not used in this scenario) . Noexperimental data were available for comparisons in scenario 4, and modeling teams C and D did
6
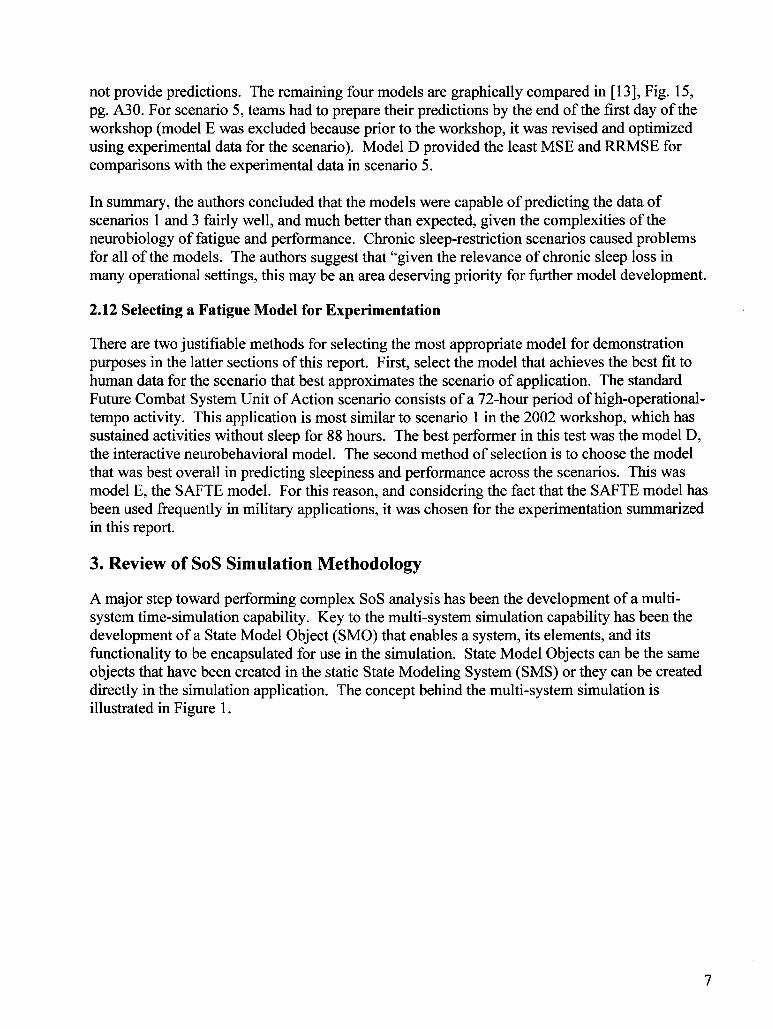
not provide predictions . The remaining four models are graphically compared in [13], Fig . 15,pg. A30. For scenario 5, teams had to prepare their predictions by the end of the first day of theworkshop (model E was excluded because prior to the workshop, it was revised and optimizedusing experimental data for the scenario) . Model D provided the least MSE and RRMSE forcomparisons with the experimental data in scenario 5.
In summary, the authors concluded that the models were capable of predicting the data ofscenarios 1 and 3 fairly well, and much better than expected, given the complexities of theneurobiology of fatigue and performance . Chronic sleep-restriction scenarios caused problemsfor all of the models . The authors suggest that "given the relevance of chronic sleep loss inmany operational settings, this may be an area deserving priority for further model development.
2.12 Selecting a Fatigue Model for Experimentation
There are two justifiable methods for selecting the most appropriate model for demonstrationpurposes in the latter sections of this report. First, select the model that achieves the best fit tohuman data for the scenario that best approximates the scenario of application . The standardFuture Combat System Unit of Action scenario consists of a 72-hour period of high-operational-tempo activity. This application is most similar to scenario 1 in the 2002 workshop, which hassustained activities without sleep for 88 hours . The best performer in this test was the model D,the interactive neurobehavioral model . The second method of selection is to choose the modelthat was best overall in predicting sleepiness and performance across the scenarios . This wasmodel E, the SAFTE model . For this reason, and considering the fact that the SAFTE model hasbeen used frequently in military applications, it was chosen for the experimentation summarizedin this report.
3. Review of SoS Simulation Methodology
A major step toward performing complex SoS analysis has been the development of a multi-system time-simulation capability. Key to the multi-system simulation capability has been thedevelopment of a State Model Object (SMO) that enables a system, its elements, and itsfunctionality to be encapsulated for use in the simulation . State Model Objects can be the sameobjects that have been created in the static State Modeling System (SMS) or they can be createddirectly in the simulation application . The concept behind the multi-system simulation isillustrated in Figure 1 .
1
7

Controlling Simulation \Software
• EnvironmentalConditions
• "Terrain• Use Conditions• Supply Network
State Nlodel Object
• Mobility• Lethality• Survivability• Mission Probability
J
Figure 1 Multi-System Simulation Concept
Every system in the simulation is represented by an SMO which represents the system'sfunctionality while the controlling simulation software provides needed information onenvironmental conditions, terrain, use conditions, supply network information, etc . A simplifiedview of the SMO simulation architecture is shown in Figure 2 . The SMO is the central feature ofthe simulation with an SMO used to represent each system in the SoS being simulated . There isalso a scenario model that describes the detailed scenarios that the systems will follow during thesimulation . A combat-damage model provides a mechanism to simulate the effects of combatdamage, ranging from damage to individual system primary elements to completely disabling thesystem. Finally, a supplies-and-services model provides a means for spare parts andconsumables to move from system to system in the simulation and makes maintenance servicesavailable to systems requiring repairs . The following section discusses the components of theSMO Simulation .
8

Real "lime Results• System States• Function States• Scenario Completion Probability• Status of Supplies
Corn batDamage Model
1
Supplies and ServicesModel
JStatistical Results-/
• Systems Availability by Platform Type• Systems Availability in Force Structure• Logistics Information
Figure 2 SMO Simulation Architecture
The SMO can be configured to represent a wide variety of systems . The types of systems thatmight be represented by the SMO include air vehicles, ground vehicles, manufacturingequipment, a soldier and the equipment he carries, etc . For modeling and simulation purposes,the SMO can be used to represent almost any system whose functionality can be described by thestates of the system's elements.
The SMO is made up of a collection of elements that may be subsystems, components, failuremodes, external conditions, or functional elements of other systems . The SMO can have multiplefunctions or measures of effectiveness (MOEs), such as mobility, communications, sensing,lethality, etc. This attribute makes this modeling system unique in the field . Furthermore, anyfunction can itself have multiple states and is not restricted to success or failure . The state of anyfunction is determined by the states of the elements that contribute to that function . The SMOsimulation also provides an interface for managing dependencies between the SMOs . The SMOsimulation is a time-step simulation where system states are evaluated and determined at eachtime step .
9

"Current Results
$~(
Systems I Element Slates I Availability 1
Function Success P,ebabiivSystem Type
fSoS StructureC2V-001 : Operability O7423
-
• Ballalion• C2V-
C2V-0O10-6
0 .5
0 .4
0 .3
0 .1
0 .0
- - - 0 .6
0 .5
0 .4
0 .3
Opel abIityCdSensingM abilityLethality
- 0 C2V-002OperabilityCdSensingMobilityLethality
- 18 C2V-003Operability ,-~C4SensingMobility
V
Expand
I
Expand All
Colapse
Collapse Al
0 .1
0 .0
¢~°
CO
m
¢
N em
c
M3'
S
92
e-, ~Ecrs LL
Q7
vI 12,
m
,~
Close
Figure 3 Display of Functions by System
Figure 3 shows systems and their functions in real time as the simulation proceeds . The treestructure on the left side can be shown with the systems organized by system type as is the casein Figure 3, or the systems can be organized within the system-of-systems structure . Allfunctions are shown for each system . When a system function fails . the green circle beside thatfunction turns red . If the function is reduced to an intermediate state (partially operable), thecircle turns yellow. The right side of the window shows the probability of successful operationof the selected function for the remainder of the mission . Note that functions can be dependenton elements and functions of other systems . In Figure 3, in the upper right-hand portion, we cansee that the probability that C2V-001 will remain operable for the remainder of the mission is0.7423 . Should C2V-001 lose operability. the most likely element failures are shown in thePareto chart. Based on the results in Figure 3 and other summary results such as operationalavailability (both average and instantaneous), various performance measures of the SoS can beassessed over the duration of the scenario.
4 . Experimentation and Results for Scenarios Including Soldier Fatigue
This section describes a simulation example that will form the basis representing soldiers and theimpacts of fatigue . After the baseline example is described, the methodology for incorporatingsoldiers and soldier fatigue will be presented . This is followed by simulation and analysis of aset of scenarios quantifying the impacts of different levels of fatigue on SoS performance.
4.1 Simulation Example Problem Definition
For the purposes of demonstrating the impacts of soldier fatigue on SoS performance, a baselineSoS simulation the following example problem formed the basis for analysis . The exampleconsists of a total of 40 systems with the types and numbers shown in Table 1 . The exampledepicts a typical Headquarters Company (HHC) of the Future Combat Systems Unit of Action
10

(FCSUA) force structure . Note that there is a mixture of manned ground combat platforms,manned ground support platforms, unmanned air platforms . and unmanned ground platforms.This example will allow us to demonstrate the impact of human fatigue on a number of MOEs ofvarying platform types .
Table 1 Systems in the Example Problem
System Type Number
Command and Control Vehicle (C2V) 5
High Mobility Multipurpose Wheeled Vehiclefor Command and Control (HMMWV-C2) 4
Unit Water Pod System (CAMEL) 2
Tank Rack (Fuel) 2
Infantry Carrier Vehicle (ICV) 5
Forward Repair and Maintenance Vehicle 1(FRMV)
Heavy Expanded Mobility Tactical Truck withLoad Handling System (HEMTT-LHS) 6
Unmanned Air Vehicle Class I (UAV CLI) 4
Unmanned Air Vehicle Class 2 (UAV CL2) 2
Palletized Loading System with Trailer (PLS) 4
Medical Vehicle for Evacuation (MV-E) 2
Medical Vehicle for Treatment (MV-T) 2
MULE-Countermine (MULE-CM) 1
Each system in the FCSUA is represented as a state model object in the SMO simulation . Theground vehicles all follow a scenario that consists of a 72-hour period of high-operational-tempoactivity . The UAVs have 2-hour flights every eight hours for the 72-hour interval . The next stepin developing this model is representing soldiers in a way that can relate their task effectivenessto the functionality of the systems.
4.2 Representing Soldier Fatigue in the SoS Simulation
The SMO and its functions are dependent on the elements that comprise the SMO . Byrepresenting the soldier as an element of the platform SMO, the availability of the SMO or one ofits functions can be dependent on the soldier . In reality, crews of soldiers are allocated toplatforms, each performing critical tasks . Table 2 includes the allocation of soldiers to platformtypes (note: the abbreviated functional title of the soldier is listed in the table) .
II

ble 2 Allocation of Soldiers to Platform Ty)Platform Personnel
C2V VEH-CMDROPS-NCOOPS-OFFISR-OFFC4/SIG/DRIVER
CAMEL MAINT-TECHFRMV MAINT-TECH-1
MAINT-TECH 2HEMTT_LHS OPERATOR
DRIVERHMMWV-C2 OPERATIONS-TECH
DRIVERICV VEH-CMDR
OPS-NCOFIRES-NCOISR-NCOC4-SIG-DRIVERCDRXOISR-SPCROBOTICS-TECH
MV-E PA-OFFHEALTH-CARE-TECH-1HEALTH-CARE-TECH-2
MV-E PA-OFFHEALTH-CARE-TECH-1HEALTH-CARE-TECH-2
Tank_Rack SUSTAINMENT-TECHUAV1 UAV-OPERATORUAV2 UAV-OPERATORHMMWV SPT OPERATIONS-TECH
DRIVER
As the soldier fails to perform critical tasks, they impact the availability of the platform . For thepurposes of demonstration, a nominal rate of one failure impacting platform availability per 100hours was assumed for all soldiers (note : although we have no experimental data to support thisvalue it is a reasonable value to demonstrate impact) . The real question is, what is the functionalrelationship between fatigue and soldier performance? To answer this question we have chosento utilize, for the purposes of this example problem, the approach taken by the developers of theSleep, Activity, Fatigue, and Task Effectiveness (SAFTE) model, developed by Hursch andassociates. The SAFTE model uses a linear model to represent performance degradation as afunction of hours on task . That is, as soldiers are deprived of sleep, after an eight-hour sleepperiod, their cognitive performance decreases linearly over time and their critical task failure rate(impacting platform availability increases) . The slope of the line is based on actual
es
12
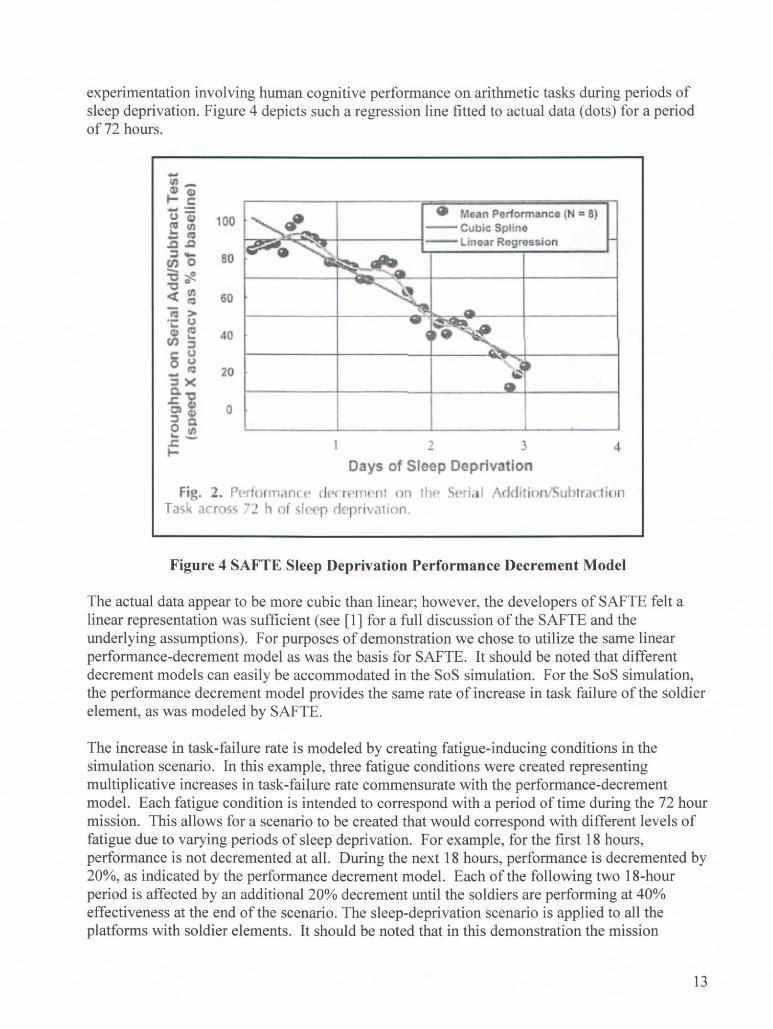
experimentation involving human cognitive performance on arithmetic tasks during periods ofsleep deprivation. Figure 4 depicts such a regression line fitted to actual data (dots) for a periodof 72 hours .
Figure 4 SAFTE Sleep Deprivation Performance Decrement Model
The actual data appear to be more cubic than linear : however, the developers of SAFTE felt alinear representation was sufficient (see [1] for a full discussion of the SAFTE and theunderlying assumptions) . For purposes of demonstration we chose to utilize the same linearperformance-decrement model as was the basis for SAFTE . It should be noted that differentdecrement models can easily be accommodated in the SoS simulation . For the SoS simulation,the performance decrement model provides the same rate of increase in task failure of the soldierelement, as was modeled by SAFTE.
The increase in task-failure rate is modeled by creating fatigue-inducing conditions in thesimulation scenario . In this example, three fatigue conditions were created representingmultiplicative increases in task-failure rate commensurate with the performance-decrementmodel . Each fatigue condition is intended to correspond with a period of time during the 72 hourmission. This allows for a scenario to be created that would correspond with different levels offatigue due to varying periods of sleep deprivation . For example, for the first 18 hours,performance is not decremented at all . During the next 18 hours, performance is decremented by20%, as indicated by the performance decrement model . Each of the following two 18-hourperiod is affected by an additional 20% decrement until the soldiers are performing at 40%effectiveness at the end of the scenario . The sleep-deprivation scenario is applied to all theplatforms with soldier elements . It should be noted that in this demonstration the mission
O Mean Performance (N = 8lCubic Splinelinear Regression
4
Days of Sleep Deprivation
fig. 2 . Pertorrnan( t tll r rerne .nt on the Serial Addition/Sulatrat 'ionrack across 72 h of cleep deprivation.
xa .0co• w
0
o1
2
3
C uo u20
100
80
60
• 40
13
scenario is broken up into three phases of sleep deprivation, the number of phases could be asmany as the user desires (incidentally, the cubic data in Figure 4 suggests three performancepeaks followed by rapid decline).
4.3 Experiments and Results
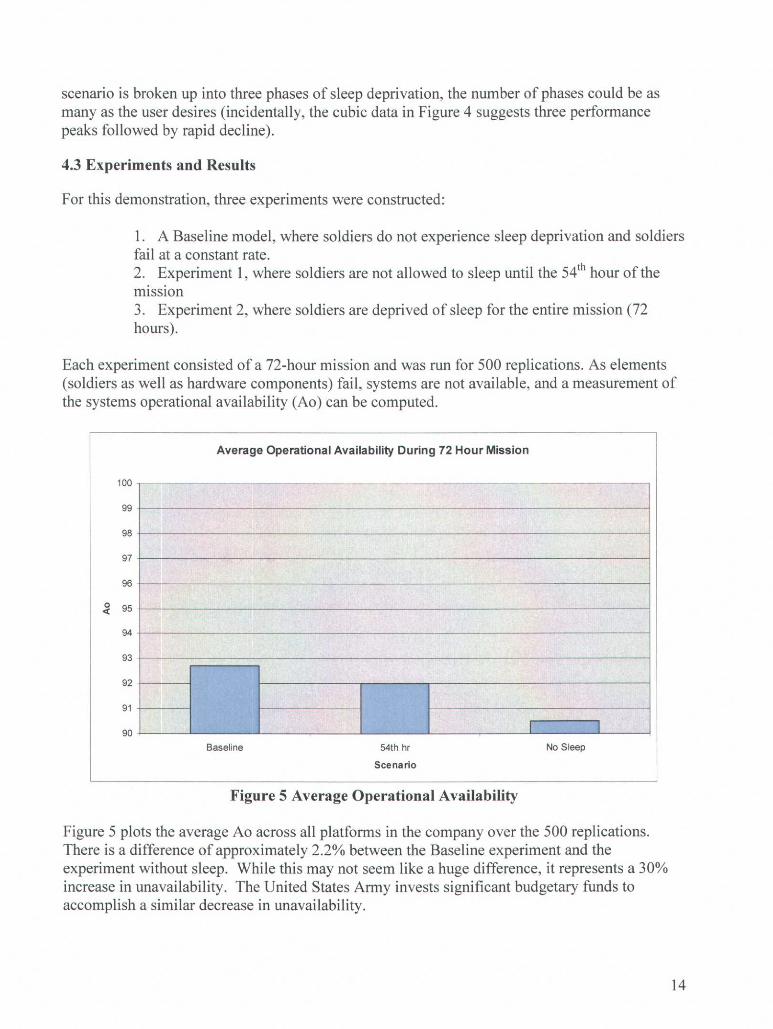
For this demonstration, three experiments were constructed:
1. A Baseline model, where soldiers do not experience sleep deprivation and soldiersfail at a constant rate.2. Experiment 1, where soldiers are not allowed to sleep until the 54 th hour of themission3. Experiment 2, where soldiers are deprived of sleep for the entire mission (72hours).
Each experiment consisted of a 72-hour mission and was run for 500 replications . As elements(soldiers as well as hardware components) fail, systems are not available, and a measurement ofthe systems operational availability (Ao) can be computed.
Average Operational Availability During 72 Hour Mission
100 -
99 -
98-
97 -
96 -
a 95-
94 -
93 -
92 -
91 -
90 -
Baseline 54th hr
Scenario
No Sleep
Figure 5 Average Operational Availability
Figure 5 plots the average Ao across all platforms in the company over the 500 replications.There is a difference of approximately 2 .2% between the Baseline experiment and theexperiment without sleep . While this may not seem like a huge difference, it represents a 30%increase in unavailability . The United States Army invests significant budgetary funds toaccomplish a similar decrease in unavailability .
14

Figure 6 Instantaneous Operational Availability
Figure 6 plots the moving average every 6 hours for operational availability (an approximation ofinstantaneous availability) of the C2V platforms over the course of the 72-hour mission for eachof the three experiments, after 500 replications . The most striking aspect when looking at thechart is the extremely rapid decline in availability after the 54 th hour. This is due to thecompounding effect that lack of sleep has on soldier performance. The experiment where sleepoccurs are at the 54th hour indicates that performance would significantly benefit from moderatesleep at that point in the mission.
5. Conclusions and Future Considerations
The goal of this project was to demonstrate the impact of soldier fatigue on the performance ofan FCS UA, using an SoS simulation-modeling framework that incorporates elements of themathematical models that have been developed to simulate the effects of sleep deprivation onhumans. Using an approximation of the performance-decrement function characterized by theSAFTE fatigue model, the temporal multiplicative impacts of sleep deficit on soldier taskperformance were included in a small example simulation consisting of 40 systems and 116soldiers. Accommodating sufficient run-time, this analysis could easily be scaled up to an entireunit of action consisting of approximately 1500 systems and 3500 soldiers.The example analysis demonstrates very clearly that the SMO simulation framework that hasbeen developed at SNL can be augmented with mathematical models drawn from the soldierfatigue research base and that this augmented methodology can clearly quantify the impact offatigue on the performance of a SoS.
Operational Availability - 6 Hour Moving Average - C2V Systems
-
0.95 -
0 .9 -coa
~— Baseline
Q 0 85 54th hr
No Sleep
0 .8
0 .75
0 .7
0
10
20
30
40
50
60
70
80
Mission Time
1
1
15

One alternative to representing the soldier as an element of a system is to represent the soldier asa subsystem or system in and of itself. That is, the soldier would be modeled autonomouslyallowing the soldier to have independent elements and functions . When simulating failure due toonly fatigue, this level of flexibility is not necessary . But if more sophisticated cognitivemodeling of soldier is necessary in order to model numerous human failure modes (e .g. lack oftraining, stress, injury) or represent more complex interdependencies between and among othersystems, then modeling the soldier as a system or subsystem will be required . Modeling thesoldier as an independent system or subsystem would also allow for more detailed treatment ofsleep, activity, and sleep-replenishment functions in the human system (e .g. individualized sleepschedules could be analyzed) . As we begin to model the cognitive system in an SoS simulationframework this will likely be the direction.
6.0 References
1. Mallis, M.M, Medjal, S., Nguyen, T .T., & Dinges, D.F. (2003) Summary of the keyfeatures of seven biomathematical models of human fatigue and performance . AviationSpace and Environmental Medicine, 75 :3 Supplement, A4-A14.
2. Hursh, S .R.& Bell, G.B. (2001) Human Performance Cognitive Model for Air ForceInformation Operations, SAIC, December 2001.
3. Klein, G. (1997) . The current statusof the naturalistic decision-making framework. InFlin, et al . (eds .) Decision-making under stress . Brookfield : Ashgate.
4. Klein, G. (1996) The effect of acute stressors on decision-making. In Driskell & Salas(eds.) Stress and human performance . Mahwah: Earlbaum.
5. Hursh, S .R. (2004) Non-Prescriptive Tools for Effective Fatigue Management . Slidepresentation at the DOT Human Factors Coordinating Committee, June 23, 2004.
6. Guttkuhn, R, et al . (2003) Human fatigue risk simulations in 24/7 operations . In Chick,et al . (eds.), Proceedings of the 2003 Winter Simulation Conference, pp . 1838-1842.
7. Moore-Ede, M. et al. (2004) Circadian Alertness Simulator for fatigue risk assessmentin transportation: Application to reduce frequency and severity of truck accidents,Aviation, Space, and Environmental Medicine (in press).
8. Hall, S ., Johnson, W. B., & Watson, J . (2001) Evaluation of aviation maintenanceworking environments, fatigue, and human performance, R04-00641-A, GalaxyScientific Corp.
9. Lan, P., Ji, Q., and Looney, C . (2002) Information fusion with Bayesian beliefnetworks for monitoring human fatigue . In Proceedings of the 5th InternationalConference on Information Fusion (FUSION 2002), International Society ofInfromation Fusin, Annapolis MD .
16
10. Lan, P., Ji, Q., and Looney, C . (2003) . Non-intrusive real time human fatiguemodeling and monitoring, Proceedings of the 47`h Annual Meeting of the HumanFactors and Ergonomics Society, Santa Monica CA.
11. Dawson, D . & Fletcher, A . (2001) A quantitative model of work-related fatigue:Background and definition, Ergonomics, 44:2.
12. Fletcher, A . & Dawson, D . (2001) A quantitative model of work-related fatigue:Empirical evaluation, Ergonomics, 44:5, 475-488.
13. Van Dongen, H.P.A. (2004) Comparison of mathematical model predictions toexperimental data of fatigue and performance . Aviation Space and EnvironmentalMedicine, 75:3 Supplement, A15-A36 .
1
17
'
Distribution:
MS 0188 D. Chavez, LDRD Office, 1030MS 0748 Chris Atcitty, 06861MS 1011 Robert Cranwell, 06642MS 1011 Dennis Anderson, 06642MS 1011 James Campbell, 06642MS 1011 Leon Chapman, 06642MS 1011 Craig Lawton, 06642MS 1011 Dwight Miller, 06642MS 9018 Central Technical Files, 8945-1MS 0899 Technical Library, 9616
18