Sanchez - Childhood Obesity - c.ymcdn.comc.ymcdn.com/sites/ · Reversing Childhood Obesity in...
18
5/20/2010 1 Reversing Childhood Obesity in Texas: Bigger is not Always Better TOMA/TxACOFP Joint Annual Convention 2010 June 19, 2010 Eduardo Sanchez , MD, MPH VP and Chief Medical Officer, BlueCross BlueShield of Texas Former, Texas Commissioner of Health Childhood Obesity: Why We Must Act Now! Dallas Regional Chamber May 21, 2010 Eduardo Sanchez , MD, MPH VP and Chief Medical Officer, BlueCross BlueShield of Texas Former, Texas Commissioner of Health 1. Childhood obesity prevalence is the same today as it was 30 years ago. a. True b. False Pre Test Questions
Transcript of Sanchez - Childhood Obesity - c.ymcdn.comc.ymcdn.com/sites/ · Reversing Childhood Obesity in...
5/20/2010
1
Reversing Childhood Obesity in Texas: Bigger is not Always Better
TOMA/TxACOFP Joint Annual Convention 2010 June 19, 2010
Eduardo Sanchez , MD, MPH
VP and Chief Medical Officer, BlueCross BlueShield of Texas
Former, Texas Commissioner of Health
Childhood Obesity:Why We Must Act Now!
Dallas Regional ChamberMay 21, 2010
Eduardo Sanchez , MD, MPHVP and Chief Medical Officer, BlueCross BlueShield of Texas
Former, Texas Commissioner of Health
1. Childhood obesity prevalence is the same today as it was 30 years ago.
a. Trueb. False
Pre Test Questions
5/20/2010
2
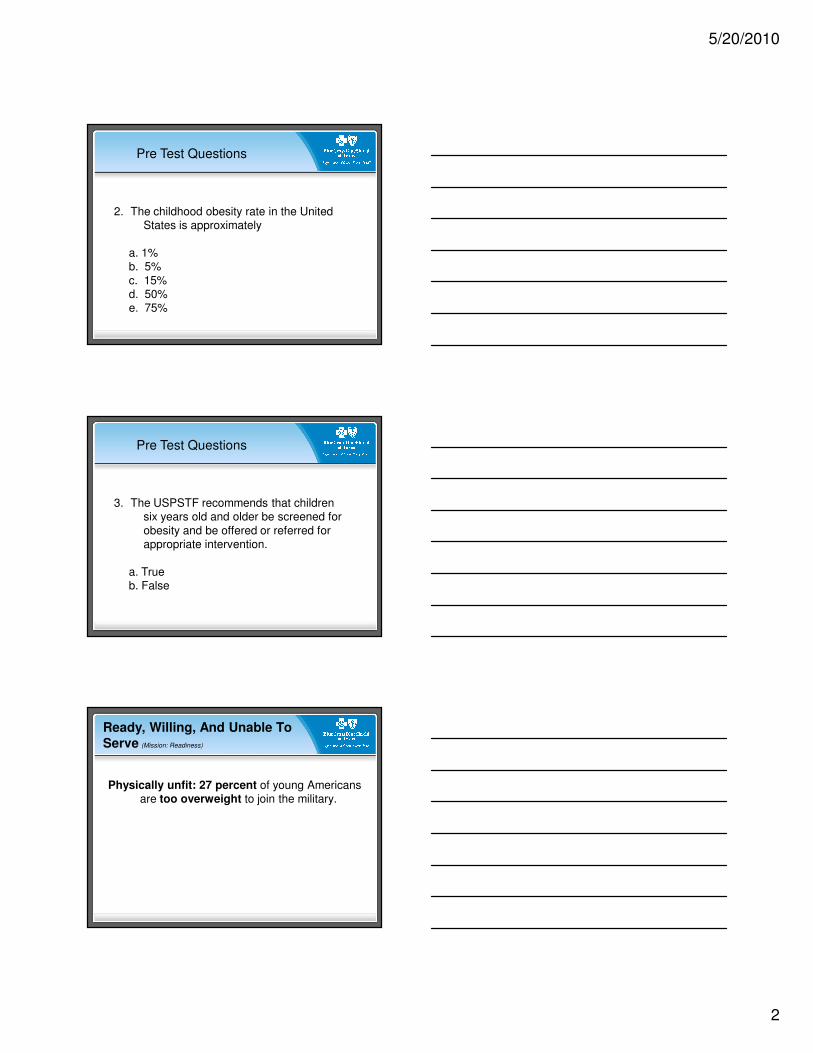
2. The childhood obesity rate in the United States is approximately
a. 1%b. 5%c. 15%d. 50%e. 75%
Pre Test Questions
3. The USPSTF recommends that children six years old and older be screened for obesity and be offered or referred for appropriate intervention.
a. Trueb. False
Pre Test Questions
Ready, Willing, And Unable To Serve (Mission: Readiness)
Physically unfit: 27 percent of young Americans are too overweight to join the military.
5/20/2010
3
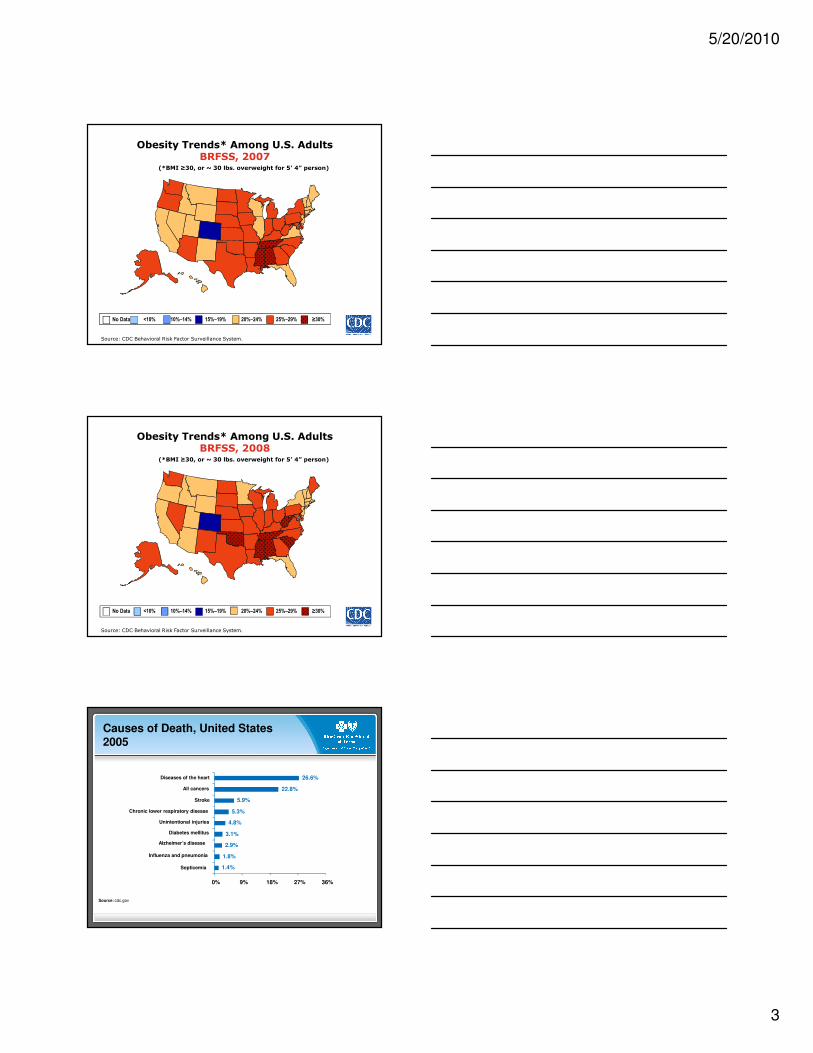
Source: CDC Behavioral Risk Factor Surveillance System.
Obesity Trends* Among U.S. AdultsBRFSS, 2007
(*BMI ≥30, or ~ 30 lbs. overweight for 5’ 4” person)
No Data <10% 10%–14% 15%–19% 20%–24% 25%–29% ≥30%
Source: CDC Behavioral Risk Factor Surveillance System.
Obesity Trends* Among U.S. AdultsBRFSS, 2008
(*BMI ≥30, or ~ 30 lbs. overweight for 5’ 4” person)
No Data <10% 10%–14% 15%–19% 20%–24% 25%–29% ≥30%
Causes of Death, United States 2005
Source: cdc.gov
1.4%
1.8%
2.9%
3.1%
4.8%
5.3%
5.9%
22.8%
26.6%
0% 9% 18% 27% 36%
Septicemia
Influenza and pneumonia
Alzheimer’s disease
Diabetes mellitus
Unintentional injuries
Chronic lower respiratory disease
Stroke
All cancers
Diseases of the heart
5/20/2010
4
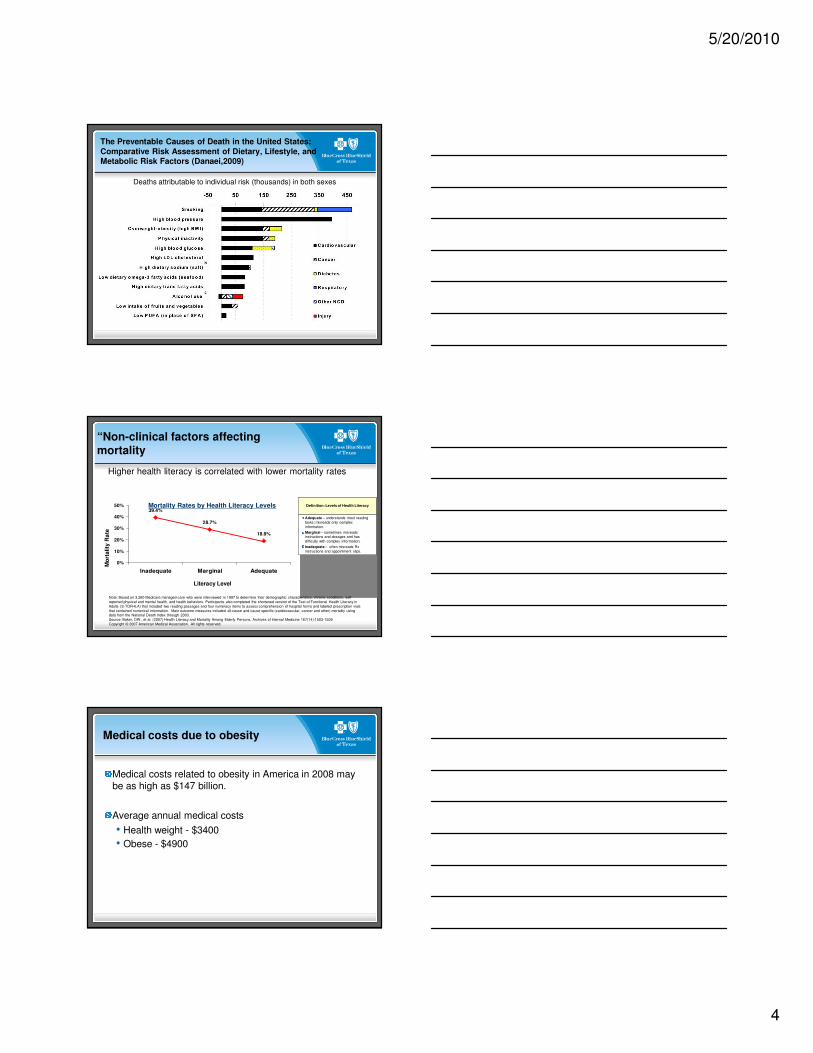
The Preventable Causes of Death in the United States:Comparative Risk Assessment of Dietary, Lifestyle, andMetabolic Risk Factors (Danaei,2009)
Deaths attributable to individual risk (thousands) in both sexes
Definition: Levels of Health Literacy
Adequate – understands most reading tasks; misreads only complex information.
Marginal – sometimes misreads instructions and dosages and has difficulty with complex information.
Inadequate – often misreads Rx instructions and appointment slips.
Higher health literacy is correlated with lower mortality rates
Mortality Rates by Health Literacy Levels
“Non-clinical factors affecting mortality
39.4%
28.7%
18.9%
0%
10%
20%
30%
40%
50%
Inadequate Marginal Adequate
Mo
rta
lity
Ra
te
Literacy Level
Note: Based on 3,260 Medicare managed-care who were interviewed in 1997 to determine their demographic characteristics, chronic conditions, self-reported physical and mental health, and health behaviors. Participants also completed the shortened version of the Test of Functional Health Literacy in Adults (S-TOFHLA) that included two reading passages and four numeracy items to assess comprehension of hospital forms and labeled prescription vials that contained numerical information. Main outcome measures included all-cause and cause specific (cardiovascular, cancer and other) mortality using data from the National Death Index through 2003.Source: Baker, DW., et al. (2007) Health Literacy and Mortality Among Elderly Persons. Archives of Internal Medicine 167(14):1503-1509Copyright © 2007 American Medical Association. All rights reserved.
Medical costs due to obesity
Medical costs related to obesity in America in 2008 may be as high as $147 billion.
Average annual medical costs
• Health weight - $3400
• Obese - $4900
5/20/2010
5
The Impact of Obesity on Rising Medical Spending
27% of the rise in health care spending from 1987 to 2001is accounted for by increases in the proportion of and spending on obese people relative to healthy weight individuals.
Thorpe, et al. Health Affairs, Oct 2004.
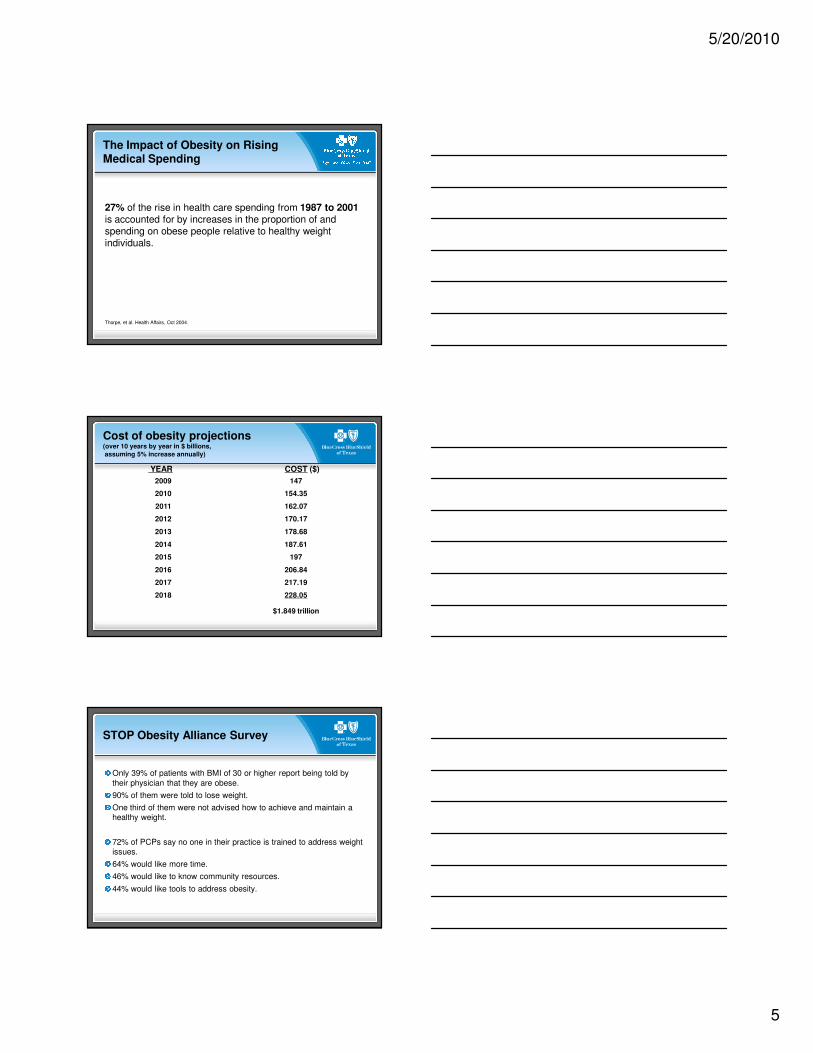
Cost of obesity projections(over 10 years by year in $ billions,assuming 5% increase annually)
2009 147
2010 154.35
2011 162.07
2012 170.17
2013 178.68
2014 187.61
2015 197
2016 206.84
2017 217.19
2018 228.05
$1.849 trillion
YEAR COST ($)
STOP Obesity Alliance Survey
Only 39% of patients with BMI of 30 or higher report being told by their physician that they are obese.
90% of them were told to lose weight.
One third of them were not advised how to achieve and maintain a healthy weight.
72% of PCPs say no one in their practice is trained to address weight issues.
64% would like more time.
46% would like to know community resources.
44% would like tools to address obesity.
5/20/2010
6
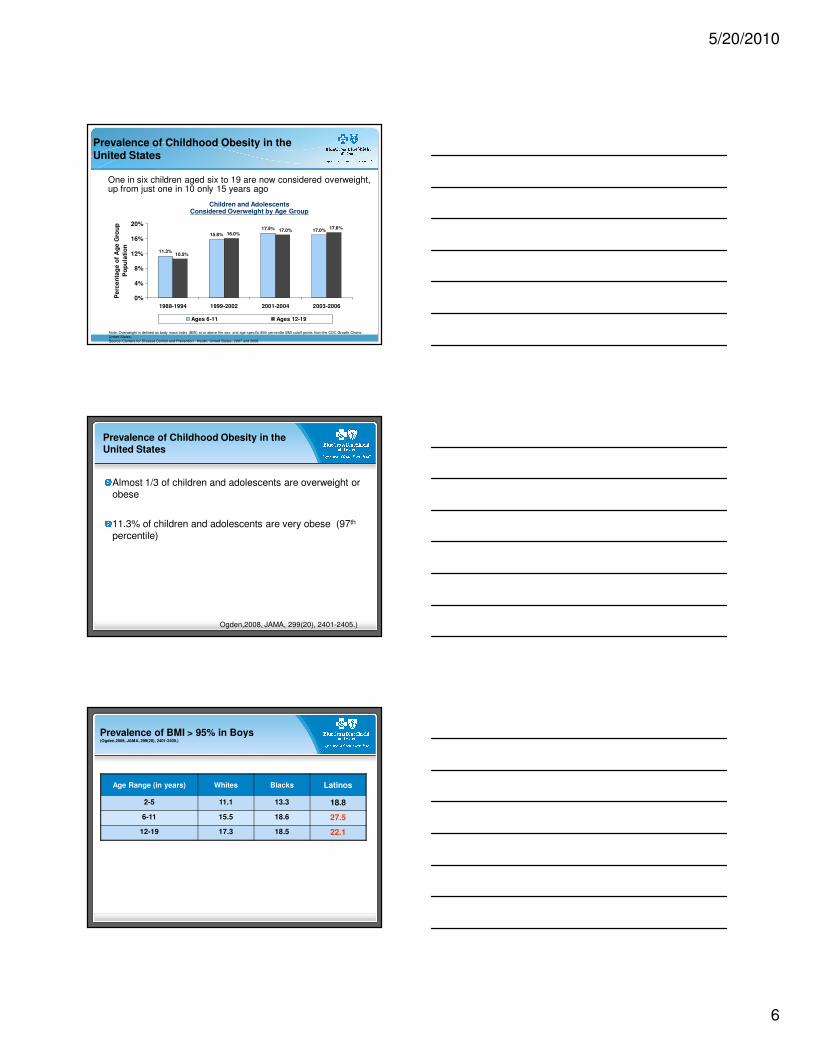
11.3%
15.8%
17.5% 17.0%
10.5%
16.0%17.0%
17.6%
0%
4%
8%
12%
16%
20%
1988-1994 1999-2002 2001-2004 2003-2006
Pe
rce
nta
ge
of
Ag
e G
rou
p
Po
pu
lati
on
Ages 6-11 Ages 12-19
One in six children aged six to 19 are now considered overweight, up from just one in 10 only 15 years ago
Prevalence of Childhood Obesity in the United States
Children and AdolescentsConsidered Overweight by Age Group
Note: Overweight is defined as body mass index (BMI) at or above the sex- and age-specific 95th percentile BMI cutoff points from the CDC Growth Charts: United States.Source: Centers for Disease Control and Prevention. Health, United States, 2007 and 2008
Prevalence of Childhood Obesity in the United States
Almost 1/3 of children and adolescents are overweight or obese
11.3% of children and adolescents are very obese (97th
percentile)
Ogden,2008, JAMA, 299(20), 2401-2405.)
Prevalence of BMI > 95% in Boys(Ogden,2008, JAMA, 299(20), 2401-2405.)
Age Range (in years) Whites Blacks Latinos
2-5 11.1 13.3 18.8
6-11 15.5 18.6 27.5
12-19 17.3 18.5 22.1
5/20/2010
7
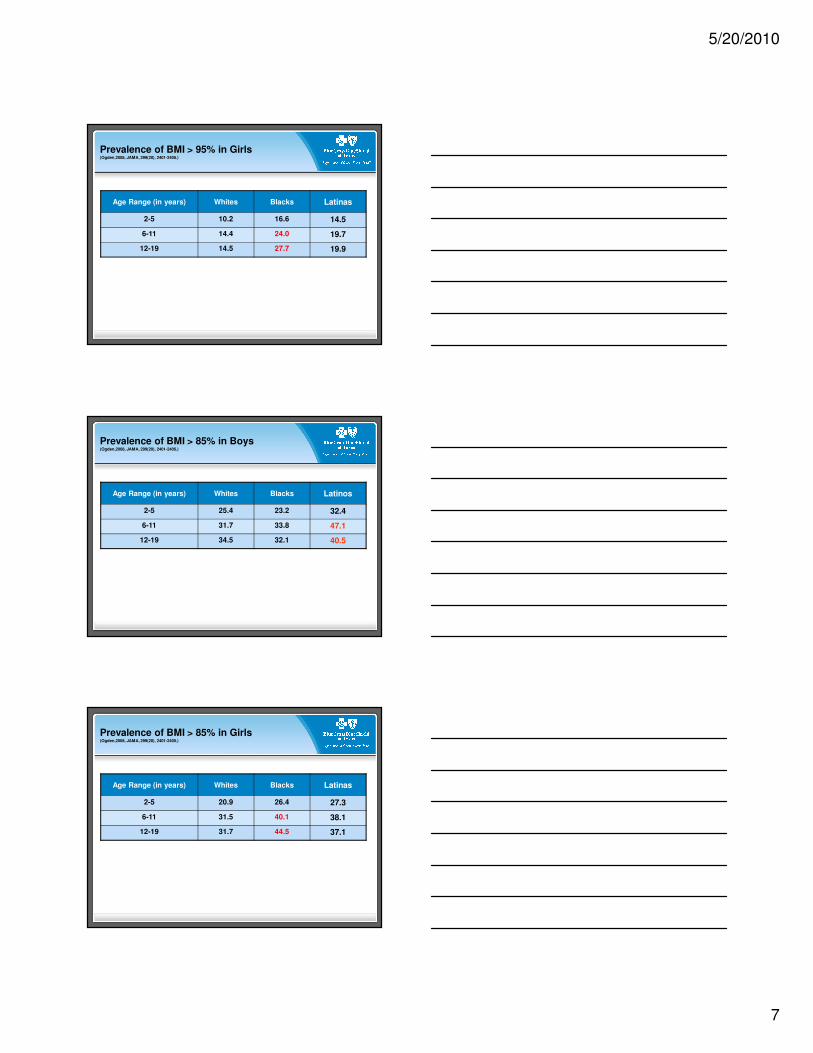
Prevalence of BMI > 95% in Girls(Ogden,2008, JAMA, 299(20), 2401-2405.)
Age Range (in years) Whites Blacks Latinas
2-5 10.2 16.6 14.5
6-11 14.4 24.0 19.7
12-19 14.5 27.7 19.9
Prevalence of BMI > 85% in Boys(Ogden,2008, JAMA, 299(20), 2401-2405.)
Age Range (in years) Whites Blacks Latinos
2-5 25.4 23.2 32.4
6-11 31.7 33.8 47.1
12-19 34.5 32.1 40.5
Prevalence of BMI > 85% in Girls(Ogden,2008, JAMA, 299(20), 2401-2405.)
Age Range (in years) Whites Blacks Latinas
2-5 20.9 26.4 27.3
6-11 31.5 40.1 38.1
12-19 31.7 44.5 37.1
5/20/2010
8
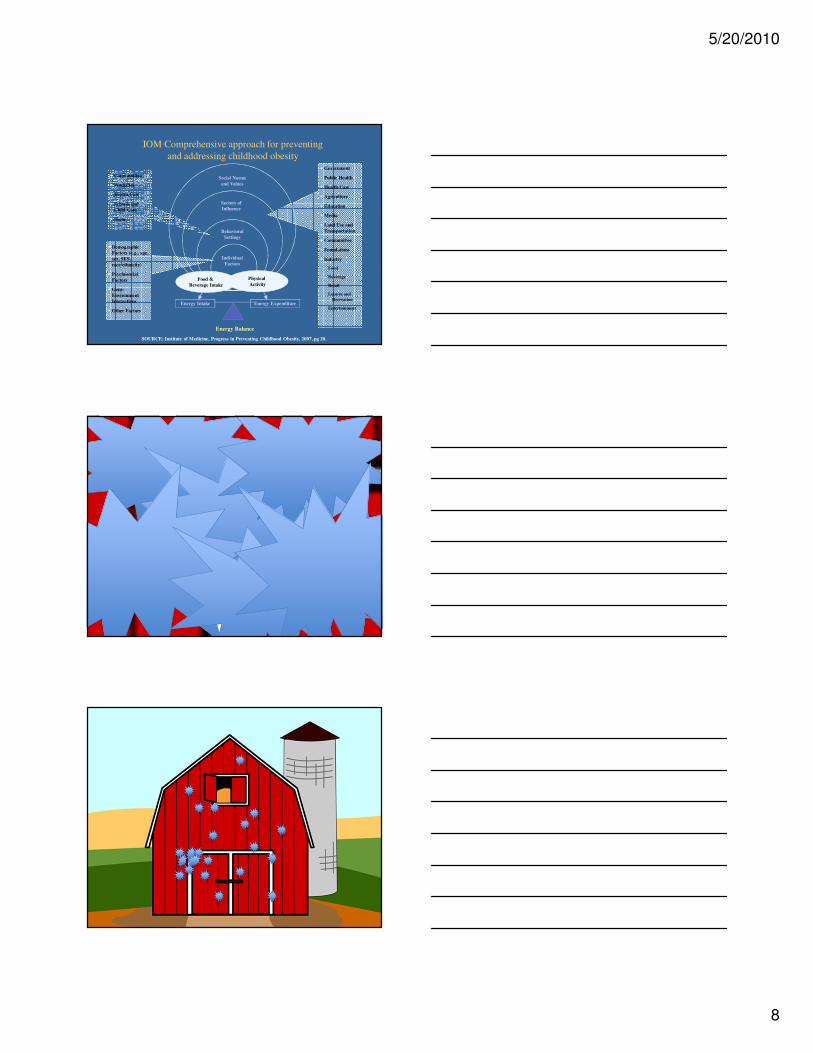
Energy Intake Energy Expenditure
Energy Balance
Individual
Factors
Behavioral
Settings
Social Norms
and Values
� Communities
� Worksites
� Health Care
� Schools and
Child Care
� Home
� Demographic
Factors (e.g., age,
sex, SES,
race/ethnicity)
� Psychosocial
Factors
� Gene-
Environment
Interactions
� Other Factors
� Government
� Public Health
� Health Care
� Agriculture
� Education
� Media
� Land Use and
Transportation
� Communities
� Foundations
� Industry
Food
Beverage
Retail
Leisure and
Recreation
Entertainment
Physical
Activity
Sectors of
Influence
Food &
Beverage Intake
IOM Comprehensive approach for preventing
and addressing childhood obesity
SOURCE: Institute of Medicine, Progress in Preventing Childhood Obesity, 2007, pg 20.
5/20/2010
9
SOLVING THE PROBLEM OF CHILDHOOD OBESITY WITHIN A GENERATION (May 2010)
Getting children a healthy start on life, with good prenatal care for their parents; support for breastfeeding; adherence to limits on “screen time”; and quality child care settings with nutritious food and ample opportunity for young children to be physically active.
Empowering parents and caregivers with simpler, more actionable messages about nutritional choices based on the latest Dietary Guidelines for Americans; improved labels on food and menus that provide clear information to help make healthy choices for children; reduced marketing of unhealthy products to children; and improved health care services, including BMI measurement for all children.
Providing healthy food in schools, through improvements in federally-supported school lunches and breakfasts; upgrading the nutritional quality of other foods sold in schools; and improving nutrition education and the overall school environment.
Improving access to healthy, affordable food, by eliminating “food deserts” in urban and rural America; lowering the relative prices of healthier foods; developing or reformulating food products to be healthier; and reducing the incidence of hunger, which has been linked to obesity.
Getting children more physically active, through quality physical education, recess, and other opportunities in and after school; addressing aspects of the “built environment” that make it difficult for children to walk or bike safely in their communities; and improving access to safe parks, playgrounds, and indoor and outdoor recreational facilities.
White House Task Force on Childhood Obesity
A tale of two communities
Somerville, Massachusetts
El Paso, Texas
5/20/2010
10
Lessons Learned from tobacco control initiatives
Comprehensive approaches work best
Single interventions haven’t worked as well
Programs need to be sustained
Steps to prevent and reverse childhood obesity
School-basedUniversal coordinated school health programs
Science based nutrition guidelines for all foods in schools
Universal school breakfast/lunch
Fresh fruits and vegetables
Farm to School
School gardens
30 minutes per day physical activity in schools
Classroom teaching about good eating and activity
No child left behind – 100% high school graduation
Steps to prevent and reverse childhood obesity
Toolkits for clinicians
Physician advocacy
Develop and standardize health/nutrition guidelines for FNS/SNAP/WIC
Summer food programs for eligible children
Community access to good food – healthy, green, just, and affordable
Water over soda
No child left inside
5/20/2010
11
The Role of Health Plans in Addressing Obesity
Raising awareness and changing attitudes –employers and members
Partnerships
Public policy
Charitable giving
Data sharing
Wellness/Prevention
Decision support tools - toolkits
Aligned reimbursement strategies
BCBSA Pediatric Obesity and Diabetes Prevention Pilot Program
5-2-1-0 message
• 5 servings of fruits and vegetables daily
• limit TV or computer time to 2 hours or less daily
• participate in 1 hour or more of play or physical activity daily
• drink zero sweetened drinks every day
BCBSA Pediatric Obesity and Diabetes Prevention Pilot Program
More than 1,650 physician practices in five states will receive tool kits
The tool kits include
• a pocket guide for the docs,
• charts for physicians to log information,
• a double-sided wall poster,
• tear-off sheets tailored towards different age ranges: ages 2 to 4, 5 to 9, and 10 years and older,
• patient workbooks that allow patients/parents to track their healthy habits and
• tri-fold brochures to help generate awareness and provide parents with basic information about Body Mass Index (BMI), behavioral risks and healthy tips.
5/20/2010
12
USPSTF
Screening for Obesity in Children and Adolescents (January 2010)
Summary of Recommendation
• The USPSTF recommends that clinicians screen children aged 6 years and older for obesity and offer them or refer them to comprehensive, intensive behavioral interventions to promote improvement in weight status.Grade: B recommendation.
Policy Position Statement on the Prevention, Assessment, Diagnosis and Treatment of Child and Adolescent Obesity in the Healthcare Environment
Assessment:
• Healthcare providers should perform, at a minimum, a yearly assessment of weight status in all children.
• Providers should qualitatively assess dietary patterns, screen time, and physical activity behaviors in all pediatric patients at each well child visit.
• All overweight and obese children should receive a thorough physical examination including BMI assessment, pulse rate and blood pressure measured with a large enough cuff. The following laboratory tests should occur for both the overweight and obese: fasting lipid profile, fasting glucose, aspartate aminotransferase, and alanine aminotransferase. In the obese patient, blood urea nitrogen and creatinine should be assessed.
• Healthcare providers should obtain a focused family history for obesity, type 2 diabetes, cardiovascular disease (particularly hypertension), and early deaths from heart disease or stroke to assess risk of current or future comorbidities associated with a child’s overweight or obese status.
Treatment: For overweight and obese children, treatment should occur in a staged approach based upon the child’s age, BMI, related comorbidities, weight status of parents, and progress in treatment: a prevention plus protocol, structured weight management, comprehensive multidisciplinary protocol, and pediatric tertiary weight management. The child’s primary caregivers and families should be integrally involved in the process.
AHA
Recommendations for Treatment of Child and Adolescent Overweight and Obesity
Bonnie A. Spear, Sarah E. Barlow, Chris Ervin, David S. Ludwig, Brian E. Saelens, Karen E. Schetzina and Elsie M. Taveras
Pediatrics 2007;120;S254-S288
Staged Treatment of Pediatric Obesity According to Age and BMI Percentile
Age groupings
• 2-5 years
• 6-11 years
• 12-18 years
BMI percentile
• 5 - 85
• 85 - 94
• 95 - 98
• > 98
5/20/2010
13
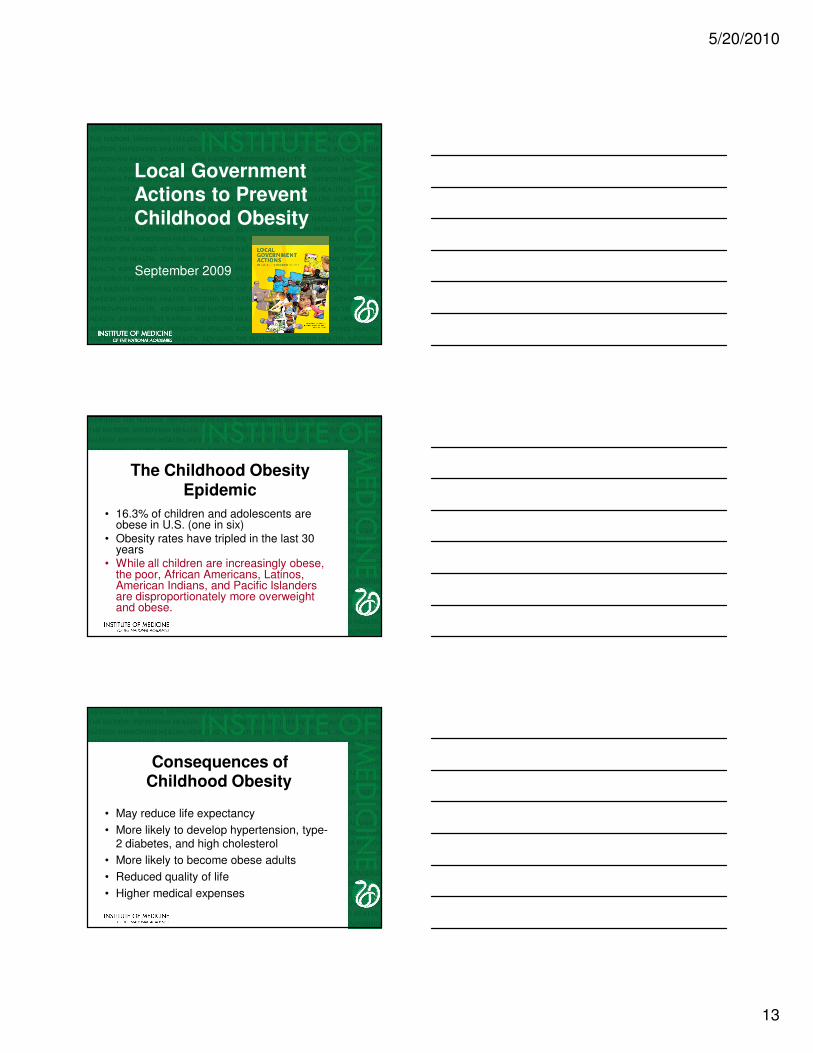
Local Government Actions to Prevent Childhood Obesity
September 2009
The Childhood Obesity Epidemic
• 16.3% of children and adolescents are obese in U.S. (one in six)
• Obesity rates have tripled in the last 30 years
• While all children are increasingly obese, the poor, African Americans, Latinos, American Indians, and Pacific Islanders are disproportionately more overweight and obese.
Consequences of Childhood Obesity
• May reduce life expectancy
• More likely to develop hypertension, type-2 diabetes, and high cholesterol
• More likely to become obese adults
• Reduced quality of life
• Higher medical expenses
5/20/2010
14
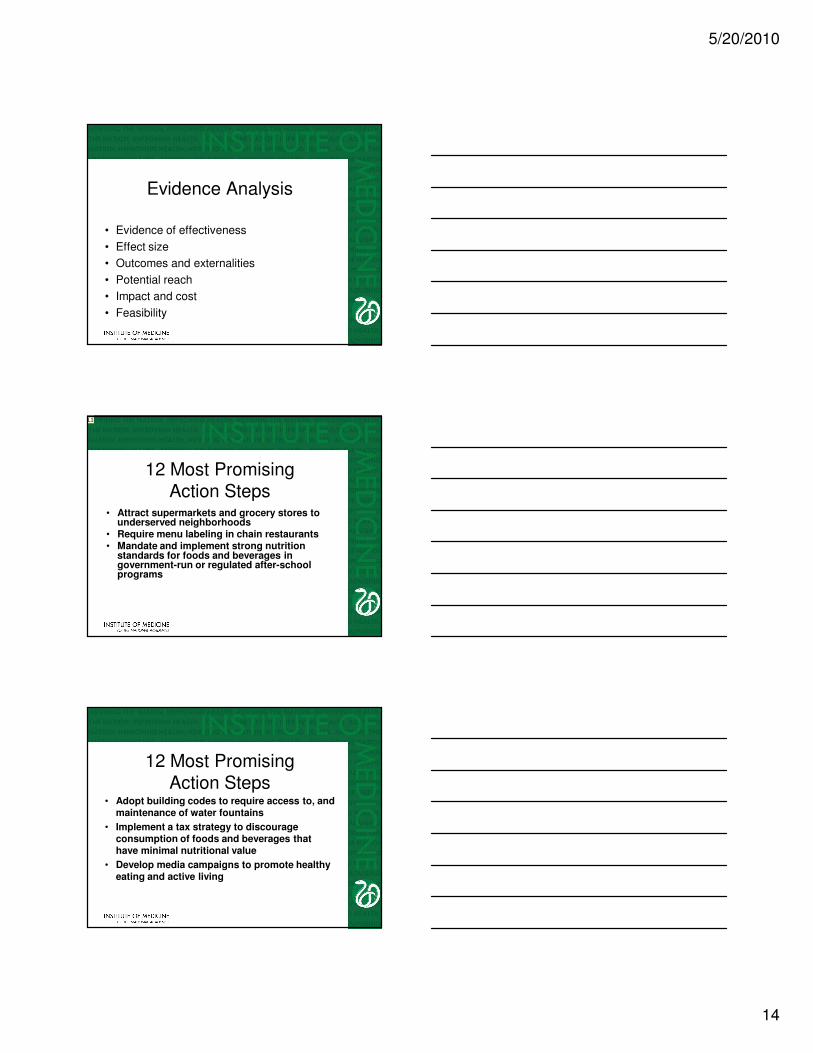
Evidence Analysis
• Evidence of effectiveness
• Effect size
• Outcomes and externalities
• Potential reach
• Impact and cost
• Feasibility
12 Most Promising Action Steps
• Attract supermarkets and grocery stores to underserved neighborhoods
• Require menu labeling in chain restaurants• Mandate and implement strong nutrition
standards for foods and beverages in government-run or regulated after-school programs
L1
12 Most Promising Action Steps
• Adopt building codes to require access to, and maintenance of water fountains
• Implement a tax strategy to discourage consumption of foods and beverages that have minimal nutritional value
• Develop media campaigns to promote healthy eating and active living
Slide 41
L1 breatk up by goals? spread out more? Meyers, 9/7/2009
5/20/2010
15
12 Most Promising Action Steps
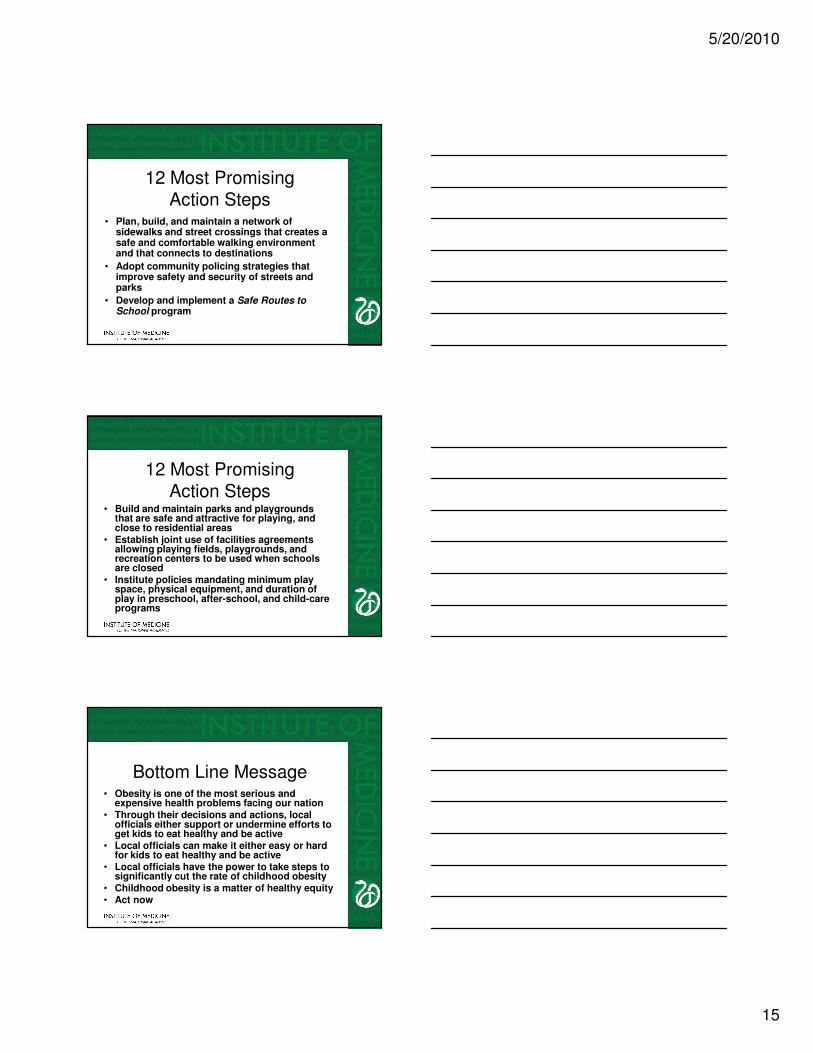
• Plan, build, and maintain a network of sidewalks and street crossings that creates a safe and comfortable walking environment and that connects to destinations
• Adopt community policing strategies that improve safety and security of streets and parks
• Develop and implement a Safe Routes to
School program
12 Most Promising Action Steps
• Build and maintain parks and playgrounds that are safe and attractive for playing, and close to residential areas
• Establish joint use of facilities agreements allowing playing fields, playgrounds, and recreation centers to be used when schools are closed
• Institute policies mandating minimum play space, physical equipment, and duration of play in preschool, after-school, and child-care programs
Bottom Line Message• Obesity is one of the most serious and
expensive health problems facing our nation• Through their decisions and actions, local
officials either support or undermine efforts to get kids to eat healthy and be active
• Local officials can make it either easy or hard for kids to eat healthy and be active
• Local officials have the power to take steps to significantly cut the rate of childhood obesity
• Childhood obesity is a matter of healthy equity• Act now
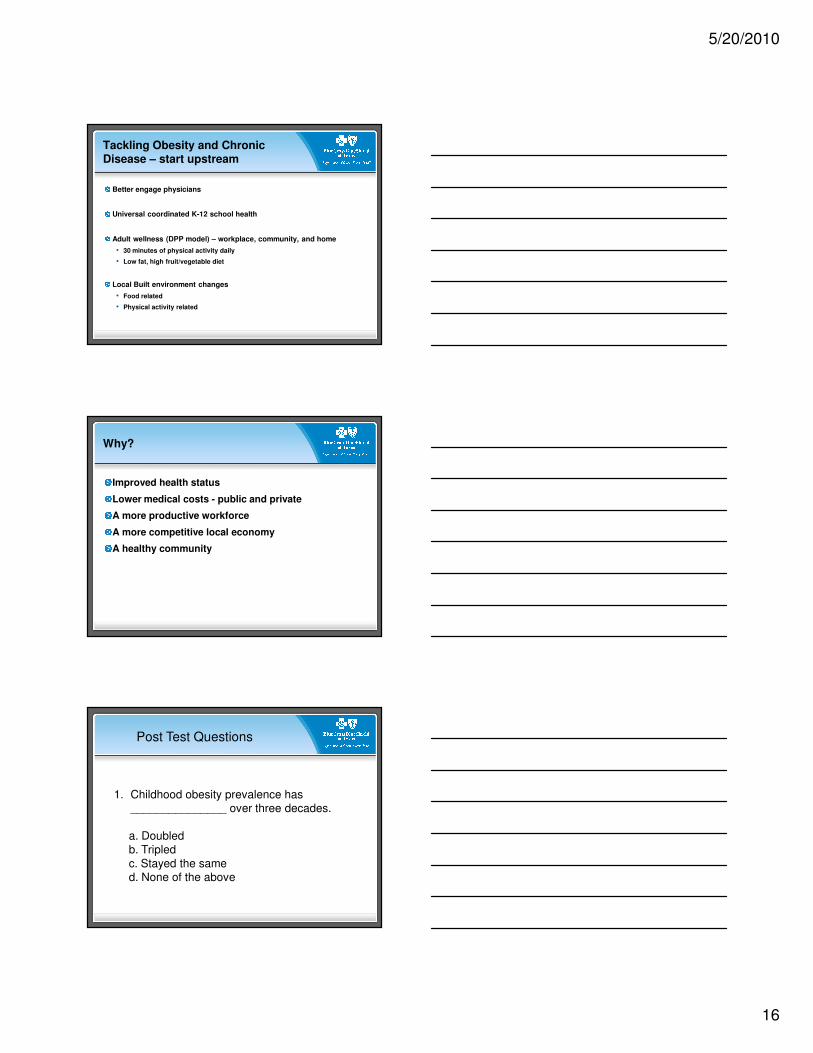
5/20/2010
16
Tackling Obesity and Chronic Disease – start upstream
Better engage physicians
Universal coordinated K-12 school health
Adult wellness (DPP model) – workplace, community, and home
• 30 minutes of physical activity daily
• Low fat, high fruit/vegetable diet
Local Built environment changes
• Food related
• Physical activity related
Why?
Improved health status
Lower medical costs - public and private
A more productive workforce
A more competitive local economy
A healthy community
1. Childhood obesity prevalence has _______________ over three decades.
a. Doubledb. Tripledc. Stayed the samed. None of the above
Post Test Questions
5/20/2010
17
2. Childhood obesity is associated with which of the following:
a. Hypertensionb. Type 2 diabetes mellitusc. Otitis media
Post Test Questions
3. Treatment of childhood obesity should include:
a. cardiac catheterizationb. healthy lifestyle counselingc. renal ultrasound
Post Test Questions
4. Which of the following is included in the 5/2/1/0 messaging:
a. 5 servings of fruits and vegetables daily b. limit TV or computer time to 2 hours or less daily c. participate in 1 hour or more of play or physical activity
daily d. drink zero sweetened drinks every daye. all of the above
Post Test Questions