San Pablo commercial corridor - Berkeley, California · STUDY AREA AND METHODOLOGY Image source:...
44
SAN PABLO AVENUE COMMERCIAL DISTRICT ECONOMIC DEVELOPMENT WORK SESSION, DECEMBER 13, 2016
Transcript of San Pablo commercial corridor - Berkeley, California · STUDY AREA AND METHODOLOGY Image source:...

SAN PABLO AVENUE
COMMERCIAL DISTRICTECONOMIC DEVELOPMENT WORK SESSION, DECEMBER 13, 2016

AGENDA
Study Area and Methodology
Historic Context
Demographic Composition
Urban Form
Commercial Nodes
Business and Employment Statistics
Real Estate Trends
Community Assets and Initiatives
Challenges & Opportunities
Q&A2
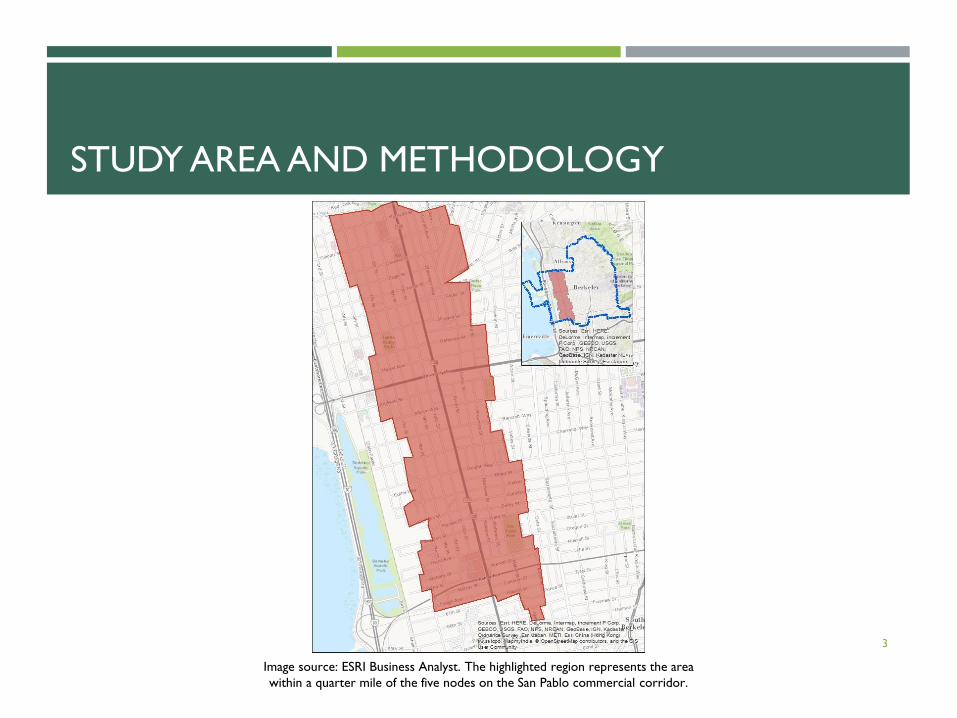
STUDY AREA AND METHODOLOGY
Image source: ESRI Business Analyst. The highlighted region represents the area
within a quarter mile of the five nodes on the San Pablo commercial corridor.
3

STUDY AREA AND METHODOLOGY
4
Literature Review
Data Sources
Demographics:
Census Bureau, ESRI
Business Analyst
Businesses &
Employment: EDD,
MuniServices, OED
Stakeholder
Interviews
City Staff Focus
Group
Note: The San Pablo commercial
corridor business data presented is
limited to San Pablo Avenue addresses
in Berkeley.
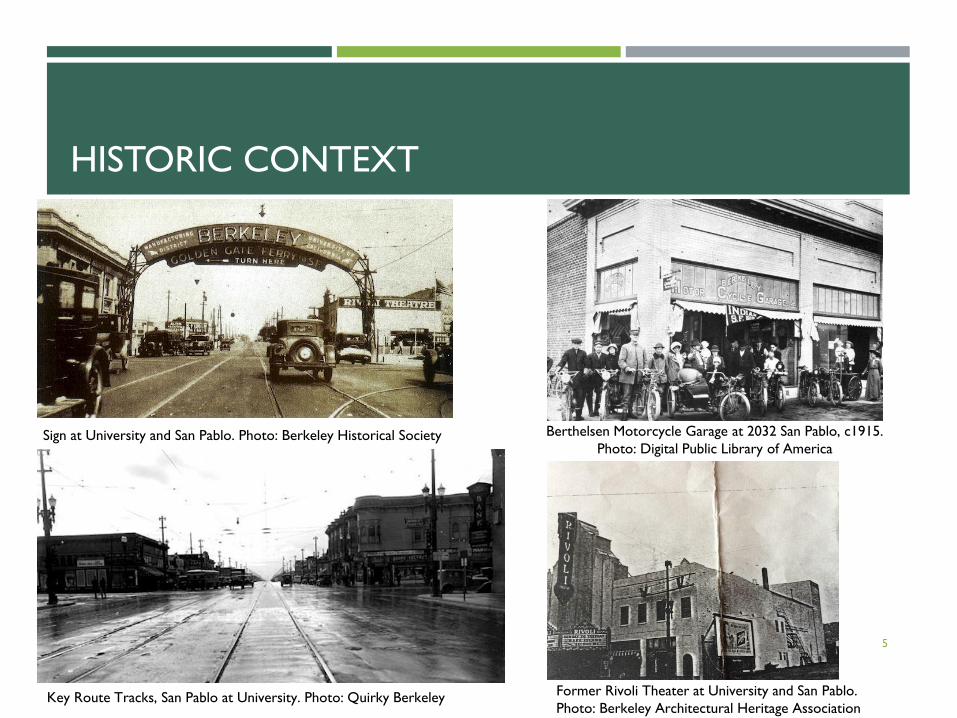
HISTORIC CONTEXT
Sign at University and San Pablo. Photo: Berkeley Historical Society
Key Route Tracks, San Pablo at University. Photo: Quirky Berkeley
Berthelsen Motorcycle Garage at 2032 San Pablo, c1915.
Photo: Digital Public Library of America
5
Former Rivoli Theater at University and San Pablo.
Photo: Berkeley Architectural Heritage Association

PAST PLANS AND INITIATIVES
6
West Berkeley Plan (1993)
Goals for San Pablo included fostering neighborhood retail development while protecting
manufacturing businesses; improved transit connections; and improving environmental
quality
San Pablo Revitalization Program (1998)
Façade improvement grants
Enforcement of city codes on blighted sites; development of vacant and underutilized sites
San Pablo Public Improvement Plan (2003)
Identified community concerns about San Pablo Avenue conditions
Focused on pedestrian appeal, safety, and accessibility
Resulted in creation of unofficial design guidelines for the corridor, still in use
“Plan Bay Area” (MTC/ABAG) (2013)
San Pablo Avenue is designated as a Priority Development Area (PDA); future housing
growth and transit resources will be targeted for San Pablo

DEMOGRAPHIC COMPOSITION

SAN PABLO AREA DEMOGRAPHICS
Total population: 14,708 (12.7% of Berkeley’s population)
7,180 Housing Units (14.6% of Berkeley housing stock)
Renters: 42.6%
Homeowners: 57.4%
Median income: $66,151
Median income citywide: $65,283
Unemployment Rate: 7.13%
Workforce Participation (age 16+): 69.3%
Source: US Census Bureau. Median income estimates reflect weighted average of median incomes for eight Census tracts bordering San Pablo
Ave, American Community Survey, 2010-2014 Rolling Sample. All other figures are for the area highlighted on the map on Slide 2, accessed via
ESRI Business Analyst.
8

RESIDENTS BY AGE GROUP, SAN PABLO AVENUE-ADJACENT TRACTS
AND CITY OF BERKELEY, 2010-2014 ESTIMATES
0%
5%
10%
15%
20%
25%
30%
35%
< 5 5-17 18-24 25-44 45-65 65+
Perc
en
t o
f P
op
ula
tio
n
Age Group
San Pablo Ave City of Berkeley9

0% 10% 20% 30% 40% 50% 60% 70% 80% 90% 100%
Census Tract 4240.02
Census Tract 4233
Census Tract 4220
Census Tract 4232
Census Tract 4231
Census Tract 4222
Census Tract 4221
Census Tract 4219
Weighted average of alltracts
32.7%
33.2%
54.6%
38.5%
54.8%
62.1%
51.7%
64.4%
49.6%
20.5%
17.9%
17.6%
35.9%
7.2%
11.0%
21.8%
4.6%
15.7%
38.1%
34.1%
17.8%
13.9%
11.4%
6.1%
8.9%
7.8%
16.8%
5.5%
11.0%
6.5%
6.1%
19.0%
15.1%
12.4%
17.6%
12.6%
3.3%
3.8%
3.4%
5.7%
7.6%
5.7%
5.3%
5.6%
5.2% White
Hispanic/Latino
Black
Asian
Bi/Multiracial,Native American,Hawaiian/PacificIslander, or Other
RACIAL/ETHNIC COMPOSITION,
SAN PABLO-ADJACENT CENSUS TRACTS
Source: US Census Bureau, American Community Survey, 2010-2014 Rolling Sample10
North (Albany Border)
South (Oakland Border)

CHANGE IN POPULATION, RACIAL GROUPS, AND INCOME, SAN
PABLO-ADJACENT CENSUS TRACTS, 2000-2014
4.6%
36.3%
-27.3%
17.3%
-40%
-30%
-20%
-10%
0%
10%
20%
30%
40%
San Pablo Corridor Total(Population)
Whites (Population) Non-Whites (Population) Income
Note: Income is in 2014 Dollars. Source: American Community Survey (ACS) Estimates 2010-2014; 2000 Census
11

URBAN FORM

Top: Biker
crosses at San
Pablo and
Virginia (facing
northwest)
Left: Auto-
Oriented Uses
at San Pablo
and Virginia
(facing
southwest)
URBAN FORM
13

URBAN FORM
Above: Intersection of San Pablo and Ashby, facing
southwest
Right: Shops near the intersection of San Pablo and
Dwight, a pedestrian-friendly retail/restaurant segment
14

URBAN FORM
Historic Heinz Building, San Pablo and Ashby
15

URBAN FORM
Left: Curb cuts into parking lots
interrupt the pedestrian environment
Top: Parking lots entrances on NE
side of University and San Pablo
16

COMMERCIAL NODES
Ashby
Dwight
University
Cedar
Gilman
San Pablo Avenue
17

GILMAN AND SAN PABLO
Note: Parking lots are highly visible from node. Image Source: Google Maps
18

CEDAR AND SAN PABLO
Aerial image Source: Google Maps
19

UNIVERSITY AND SAN PABLO
Note: large number and coverage of surface parking lots. Image Source: (left and above) Google Maps
20

DWIGHT AND SAN PABLO
21

ASHBY AND SAN PABLO
Note: Surface parking fully obscured from street.
Image Source: Google Maps
22

BUSINESS AND EMPLOYMENT
STATISTICS
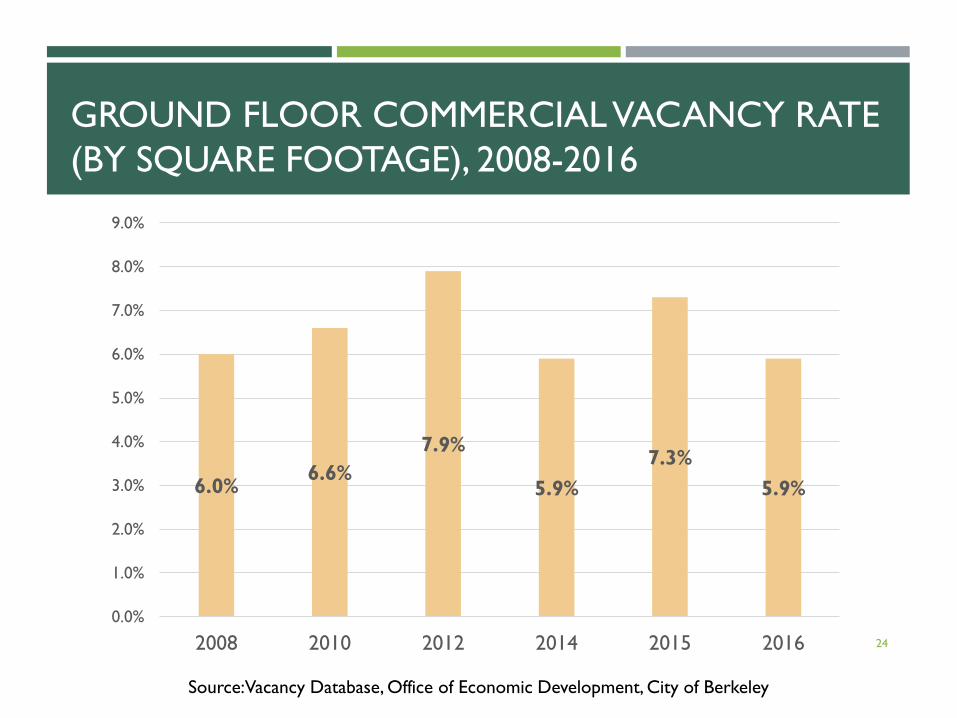
GROUND FLOOR COMMERCIAL VACANCY RATE
(BY SQUARE FOOTAGE), 2008-2016
6.0%6.6%
7.9%
5.9%
7.3%
5.9%
0.0%
1.0%
2.0%
3.0%
4.0%
5.0%
6.0%
7.0%
8.0%
9.0%
2008 2010 2012 2014 2015 2016
Source: Vacancy Database, Office of Economic Development, City of Berkeley
24

GROUND FLOOR COMMERCIAL OCCUPANCY
BY CATEGORY, BY SQUARE FOOTAGE, Q3 2016
0%
10%
20%
30%
40%
50%
60%
70%
80%
90%
100%
Citywide San Pablo
Vacant
Trade Services
Retail
Public and Nonprofit
Entities
Personal Services
Office / Other Non-Retail
Food & Beverage Services
Business / Professional
Services
Arts, Entertainment &
Recreation
40%
7%
7.5%
13%
30%
21%
5.9%
8%
14%
6%10%
19%
25

SALES TAX PERFORMANCE OVER TIME, SAN
PABLO AND CITYWIDE, 2007-2016
-10%
-5%
0%
5%
10%
15%
20%
25%
30%
2007 2008 2009 2010 2011 2012 2013 2014 2015 2016
Berkeley San Pablo
Source: MuniServices, OED Analysis
26
Sale
s Tax
Reve
nue, %
Chan
ge S
ince
2007

SALES TAX REVENUE BY CATEGORY, SAN PABLO
AND CITYWIDE, 2015 Q2 – 2016 Q1
0%
10%
20%
30%
40%
50%
60%
70%
80%
90%
100%
Berkeley San Pablo
BUSINESS TO
BUSINESS
CONSTRUCTION
MISCELLANEOUS
FOOD PRODUCTS
GENERAL RETAIL
TRANSPORTATION
Source: MuniServices, OED Analysis
27

BUSINESS CLUSTERS: AUTO-ORIENTED BUSINESSES
28

BUSINESS CLUSTERS: HOME FURNISHINGS
29

ANNUAL SALES TAX PERFORMANCE OVER TIME, HOME IMPROVEMENT AND
AUTO-ORIENTED BUSINESS CLUSTERS, 2007-2016
$-
$50,000
$100,000
$150,000
$200,000
$250,000
$300,000
2007 2008 2009 2010 2011 2012 2013 2014 2015 2016
Home Improvement Auto-Oriented
Source: MuniServices, OED Analysis
30

WAGES AND AVERAGE EMPLOYMENT, BUSINESSES
WITH SAN PABLO ADDRESSES, 2011 Q4-2015 Q4
$-
$5,000,000
$10,000,000
$15,000,000
$20,000,000
$25,000,000
$30,000,000
$35,000,000
$40,000,000
1,750
1,800
1,850
1,900
1,950
2,000
2,050
2,100
2,150
2,200
2,250
2011 2012 2013 2014 2015
Avera
ge n
um
ber
of
em
plo
yees
Q4 average
employment
Q4 Wages
Source: Quarterly Census of Employment and Wages (QCEW), Bureau of Labor Statistics
31

REAL ESTATE TRENDS

WEST BERKELEY MEDIAN SALES PRICE OVER TIME,
SINGLE-FAMILY HOMES, 2010 Q1-2016 Q3
$0
$100,000
$200,000
$300,000
$400,000
$500,000
$600,000
$700,000
$800,000
$900,000
$1,000,000
2010 2011 2012 2013 2014 2015 2016
Single-Family Home
Note: Figures are for homes west of Sacramento Street in Berkeley. The yearly medians represent the average values of the median
figures for each quarter. Source: Red Oak Realty, Multiple Listing Service (MLS Data), October 2016.
33
Media
n S
ales
Pri
ce

SAN PABLO AVENUE-ADJACENT HOUSING PROJECTS, RECENTLY
CONSTRUCTED AND IN DEVELOPMENT PIPELINE
Source: City of Berkeley Office of Economic Development 34

KEY TAKEAWAYS
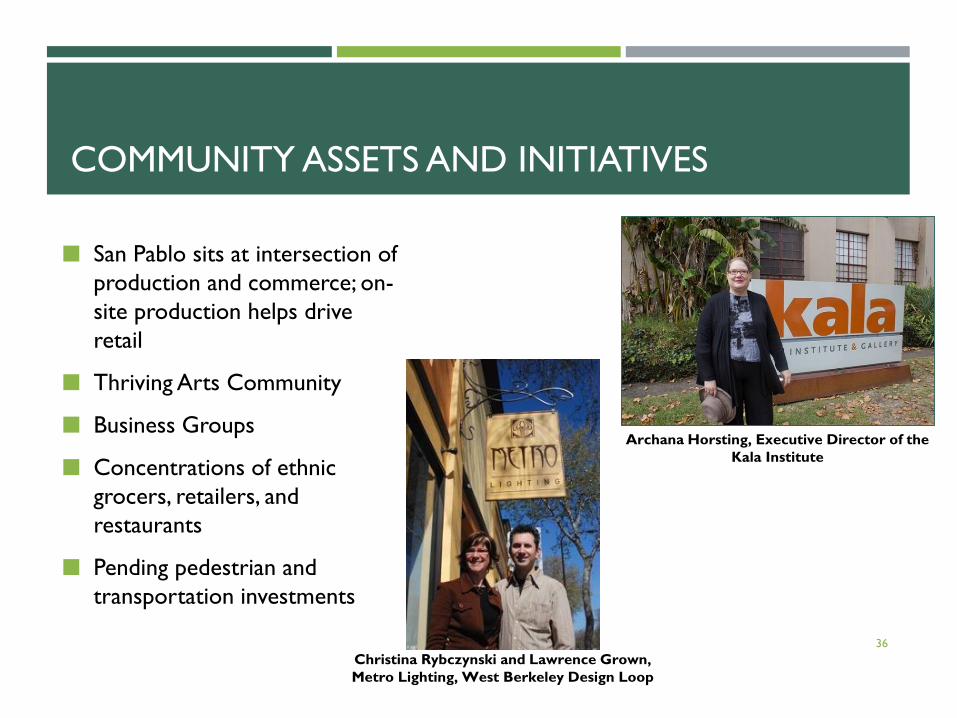
COMMUNITY ASSETS AND INITIATIVES
36
San Pablo sits at intersection of
production and commerce; on-
site production helps drive
retail
Thriving Arts Community
Business Groups
Concentrations of ethnic
grocers, retailers, and
restaurants
Pending pedestrian and
transportation investments
Archana Horsting, Executive Director of the
Kala Institute
Christina Rybczynski and Lawrence Grown,
Metro Lighting, West Berkeley Design Loop

COMMUNITY ASSETS AND INITIATIVES:
PRODUCTION AND COMMERCE
Home furnishings manufacturing
Artisanal production
37
Berkeley Potters’ Studio
On-site production at Metro Lighting

COMMUNITY ASSETS AND INITIATIVES:
THRIVING ARTS COMMUNITY
38
Source: 2008 Field Survey, Civic Arts Commission, Office of
Economic Development
Installations from Kala Art Institute’s Print Public Initiative

COMMUNITY ASSETS AND INITIATIVES:
BUSINESS GROUPS
39

COMMUNITY ASSETS AND INITIATIVES:
ETHNIC GROCERS, RETAILERS, AND RESTAURANTS
40
Gaumenkitzel Chef and owner Anja
Voth. Photo: Suzanna Mannion
Mural at Mi Tierra Foods; Manager Ambrocio
Hernandez (right), Photo: Berkeleyside

COMMUNITY ASSETS AND INITIATIVES:
PENDING TRANSPORTATION INVESTMENTS
41
Alameda County Transportation Commission (Alameda CTC) has designated San
Pablo Ave as a priority corridor
Rapid bus upgrades
Possible bus rapid transit corridor in long term
Planning to begin in Spring 2017
I-80 Gilman Interchange project
Will improve vehicle, pedestrian, and bicycle operations at I-80 and Gilman
Construction anticipated in FY 2020-2021
AC Transit plans to expand West Berkeley bus service beginning March 2017
CoB has applied for $8.6 million for Alameda CTC Transit Signal Priority
program
Extends green lights when buses are detected approaching

CHALLENGES
Loss of racial and economic diversity
Competing local and regional interests for transportation and land use
Existing cluster of auto-oriented businesses is threatened by competing
uses
42

OPPORTUNITIES
Leverage San Pablo’s development potential to preserve and increase
housing affordability.
Engage with regional transportation agencies and private sector leaders
to expand sustainable, multi-modal transportation.
Pursue grant funding to conduct comprehensive land use planning for
the San Pablo Priority Development Area.
Leverage planned development and regional transportation investments
to enhance the pedestrian environment.
Promote walkable, active frontages, especially at the Nodes.
Support existing and emerging business associations and industry
clusters.43

Q & A