San Jose's Walk n' Roll Program: An Evaluation of School ...
49
San Jose State University San Jose State University SJSU ScholarWorks SJSU ScholarWorks Master's Projects Master's Theses and Graduate Research Spring 5-2018 San Jose's Walk n' Roll Program: An Evaluation of School San Jose's Walk n' Roll Program: An Evaluation of School Pedestrian Education Programs Pedestrian Education Programs Stephen Ngo San Jose State University Follow this and additional works at: https://scholarworks.sjsu.edu/etd_projects Part of the Education Policy Commons, Policy Design, Analysis, and Evaluation Commons, Public Administration Commons, Transportation Commons, and the Urban Studies Commons Recommended Citation Recommended Citation Ngo, Stephen, "San Jose's Walk n' Roll Program: An Evaluation of School Pedestrian Education Programs" (2018). Master's Projects. 590. DOI: https://doi.org/10.31979/etd.ddgw-f3ns https://scholarworks.sjsu.edu/etd_projects/590 This Master's Project is brought to you for free and open access by the Master's Theses and Graduate Research at SJSU ScholarWorks. It has been accepted for inclusion in Master's Projects by an authorized administrator of SJSU ScholarWorks. For more information, please contact [email protected].
Transcript of San Jose's Walk n' Roll Program: An Evaluation of School ...

San Jose State University San Jose State University
SJSU ScholarWorks SJSU ScholarWorks
Master's Projects Master's Theses and Graduate Research
Spring 5-2018
San Jose's Walk n' Roll Program: An Evaluation of School San Jose's Walk n' Roll Program: An Evaluation of School
Pedestrian Education Programs Pedestrian Education Programs
Stephen Ngo San Jose State University
Follow this and additional works at: https://scholarworks.sjsu.edu/etd_projects
Part of the Education Policy Commons, Policy Design, Analysis, and Evaluation Commons, Public
Administration Commons, Transportation Commons, and the Urban Studies Commons
Recommended Citation Recommended Citation Ngo, Stephen, "San Jose's Walk n' Roll Program: An Evaluation of School Pedestrian Education Programs" (2018). Master's Projects. 590. DOI: https://doi.org/10.31979/etd.ddgw-f3ns https://scholarworks.sjsu.edu/etd_projects/590
This Master's Project is brought to you for free and open access by the Master's Theses and Graduate Research at SJSU ScholarWorks. It has been accepted for inclusion in Master's Projects by an authorized administrator of SJSU ScholarWorks. For more information, please contact [email protected].

San Jose's Walk n' Roll Program An Evaluation of School Pedestrian Education Programs
by
Stephen Ngo
A Thesis Quality Research Paper Submitted in Partial Fulfillment of the
Requirements for the Master’s Degree
in
PUBLIC ADMINISTRATION
Prof. Frances Edwards. Ph.D. Adviser
The Graduate School
San Jose State University May 2018
1

2

INTRODUCTION
The City of San Jose has been recognized as among the safest cities in the United States,
but an area that the city seeks to improve in is reducing the number of traffic accidents
involving pedestrians and bicyclists. As stated by the city, “San Jose’s injury crash rate is
about half the national average” (Vision Zero San Jose, 2015, p. 6), but, on average, 40
people are killed annually and 150 are seriously injured on San Jose’s streets. To address
this, San Jose is using data, education, and technology to make a shift towards creating
streets and roads that benefit not just cars, but everyone who uses streets and roads
(Vision Zero San Jose, 2015, p. 6). A key component to increasing pedestrian safety is
developing safe and healthy habits at an early age, which is why education and
encouragement programs are critical for this goal. This study evaluates San Jose’s Walk
n’ Roll program and analyzes whether it has an influence on the number of students who
walk or ride a bicycle to school. The effectiveness of this program will be based upon the
number of students who choose to walk or ride a bicycle to school instead of riding in a
car, and seeing whether there is a measurable difference after the Walk n’ Roll training.
3

BACKGROUND
For several decades, San Jose has been active in efforts to reduce traffic accidents and
traffic related fatalities. From 1996 to 2000, Santa Clara County reported that traffic
related accidents accounted for 50 percent of deaths in youths from 0 - 19 years old
(Pedestrian and Bicycle Information Center, 2009, p. 1). In November 2002, San Jose’s
Department of Transportation began an education program named “Street Smarts” to
educate drivers, bicyclists, and pedestrians on safe traffic practices. To educate children
and school communities about safe practices, this program introduced the Streets Smarts
Back-to-School Traffic Committee, which partnered with school districts and the
American Automobile Association (AAA). Through these partnerships, Street Smarts
was able to provide traffic safety materials to schools and hold educational events, such
as bicycle rodeos, to teach students safe active transportation practices.
Despite San Jose having fewer traffic related injuries and fatalities than the
national average, city leaders adopted Vision Zero, stating that any loss of life to traffic
related accidents was unacceptable. Using an estimate from the National Highway Traffic
Safety Administration, the City of San Jose states that loss of one life to a traffic accident
costs society $1.4 million (City of San Jose, 2017, p. 10). San Jose has approved the
investment of over $80 million in its Five-Year Transportation Capital Improvement
Program (CIP) to make transportation safer for drivers, pedestrians, and cyclists. The
money goes toward adding more bicycle lanes, improved lighting systems, and
educational programs such as Walk n’ Roll (City of San Jose, 2015, p. 19).
4

Safe Routes to School
Walk n’ Roll is part of a larger nationwide initiative known as Safe Routes to School.
Safe Routes began as a movement in Odense, Denmark in the 1970s to reduce the
number of traffic-related fatalities (Safe Routes to School Guide, n. d.). Due to the
success of program, other European countries began developing their own Safe Routes
programs during the 1980s. The Bronx in New York was the first city in the United
States to adopt a Safe Routes to School program, and several cities in the United States
began adopting their own Safe Routes to School model. Programs in the United States
not only focused on traffic safety, but also aimed to decrease childhood obesity. The
successes of these programs led to interest from the federal government, and Congress
established the Federal-Aid Safe Routes to School Program in 2005, dedicating almost $1
billion in funding for Safe Routes to School programs across the United States. As stated
by the Safe Routes to School National Partnership, has three primary goals:
1. To enable and encourage children, including those with disabilities, to walk
and bicycle to school;
2. To make bicycling and walking to school a safer and more appealing
transportation alternative, thereby encouraging a healthy and active lifestyle
from an early age; and
3. To facilitate the planning, development, and implementation of projects and
activities that will improve safety and reduce traffic, fuel consumption, air
5

pollution in the vicinity of schools (Safe Routes to School: National
Partnership, n. d.).
In the San Francisco Bay Area, Safe Routes to School programs also aim to
reduce greenhouse gas emissions and car pollution. According to the Bay Area’s
Metropolitan Transportation Commission’s (MTC) “Climate Initiatives Program
Evaluation: Regional Safe Routes to School Program” (2015) projects are funded to
reduce greenhouse gases and encourage healthier lifestyles for Bay Area residents (MTC,
2016, ES-1). For Santa Clara County, $4.04 million went towards 2011-2014 funding for
Safe Routes to School Programs. From 2013-2014, 90 Bay Area schools were in a Safe
Routes to School Program, which resulted in an increase of 4% of students walking to
school, and an 11% reduction in trips by vehicle to schools (MTC, 2016, ES-1).
6

Figure 1: Safe Routes Programs by County, 2016
Source: Metropolitan Transportation Commission, 2016a.
The MTC found that Alameda, Marin, and Santa Clara Counties had lower
walking and biking percentage changes since beginning the programs, despite these
counties having longer histories of being in Safe Routes programs. The MTC states that
this could be due to the fact that these counties have populations that are “amenable to
switching to walking and biking” and began the shift away from cars earlier, so the
incremental change was less (MTC, 2016, p. 15). Despite this, all counties enrolled in the
program have shown a shift towards active transportation rather than driving.
MTC data also shows that the distance that a family lives from a school is an
indicator of how likely students are to switch from family vehicle to active transportation.
The farther a family lives from school, the less likely it is that a student is willing to
7

switch from family vehicle to active transportation (MTC, 2016, p. 16). For the entire
region, the total number of miles that students walked is 199,489 miles more and bicycled
148,777 miles more since starting the program (MTC, 2016, p. 17). It was found that in a
sample of schools accounting for 65,185 enrolled students, a total of 403,812 pounds, or
4.8%, in greenhouse gas emissions was reduced (MTC, 2016, p. 19). The MTC states that
if this number was applied to all 1.9 million enrolled students in all nine Bay Area
counties, it would lead to a reduction of 5.3 million pounds in greenhouse gas emissions.
Walk n’ Roll
The Walk n’ Roll program was created in 2012 to encourage students to walk or ride their
bicycles rather than take family vehicles to school. The city reached out to schools and
provided information to schools and surrounding communities on the benefits of active
transportation to school (Vision Zero San Jose, 2015, p. 10). At the regional level, the
Metropolitan Transportation Commission funds San Jose’s Walk n’ Roll program
through the Climate Initiative’s program (Vision Zero San Jose, 2015). The goals of the
Walk n’ Roll program are:
● Instill healthy and active lifestyle behaviors by encouraging daily physical activity
in a fun and social environment.
● Improve community safety by increasing the visibility and number of students
walking and biking to school.
● Reduce traffic congestion around school zones while reducing air pollution and
greenhouse gases.
● Increase their sense of community (City of San Jose, 2017).
8
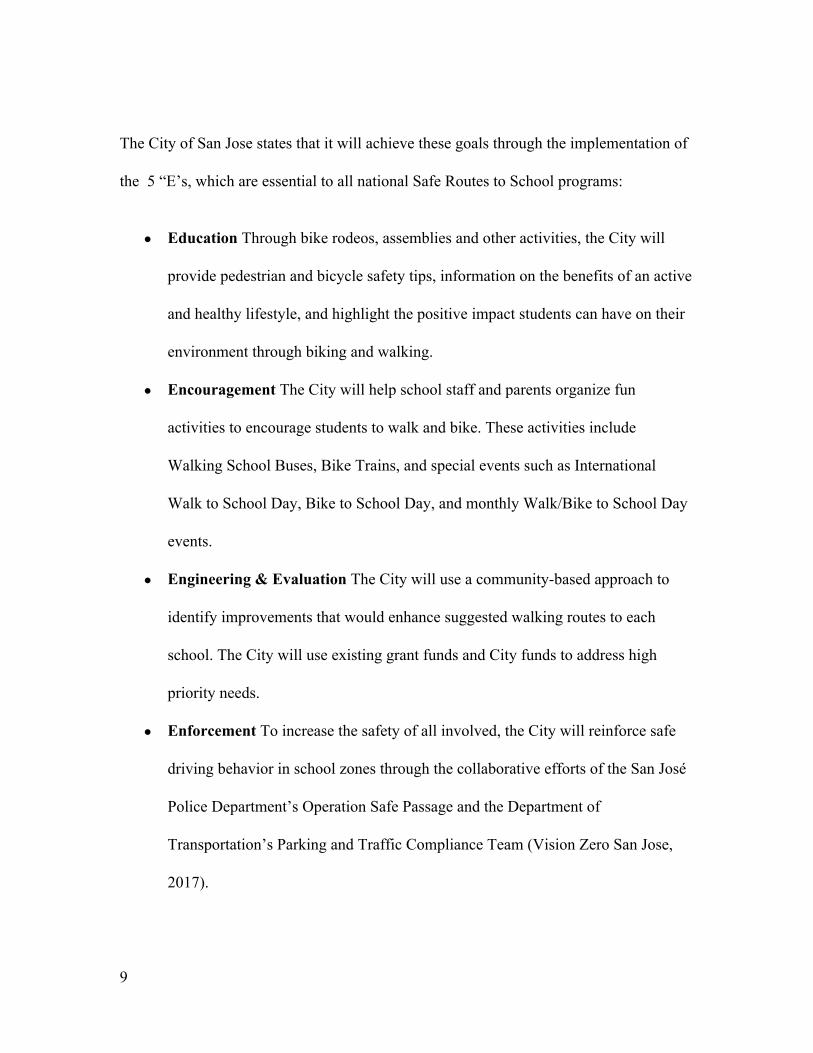
The City of San Jose states that it will achieve these goals through the implementation of
the 5 “E’s, which are essential to all national Safe Routes to School programs:
● Education Through bike rodeos, assemblies and other activities, the City will
provide pedestrian and bicycle safety tips, information on the benefits of an active
and healthy lifestyle, and highlight the positive impact students can have on their
environment through biking and walking.
● Encouragement The City will help school staff and parents organize fun
activities to encourage students to walk and bike. These activities include
Walking School Buses, Bike Trains, and special events such as International
Walk to School Day, Bike to School Day, and monthly Walk/Bike to School Day
events.
● Engineering & Evaluation The City will use a community-based approach to
identify improvements that would enhance suggested walking routes to each
school. The City will use existing grant funds and City funds to address high
priority needs.
● Enforcement To increase the safety of all involved, the City will reinforce safe
driving behavior in school zones through the collaborative efforts of the San José
Police Department’s Operation Safe Passage and the Department of
Transportation’s Parking and Traffic Compliance Team (Vision Zero San Jose,
2017).
9
In addition to these 5 E’s, San Jose’s Walk n’ Roll program also has a sixth E
which stands for equity. San Jose hopes to make active modes of transportation
accessible to students of all socioeconomic backgrounds. Traditionally, students in lower
income neighborhoods have had a difficult time getting to school using active transport
due to factors such as safety and lack of community engagement.
San Jose’s Walk n’ Roll program was initially funded by the Valley Transit
Authority’s (VTA) VERBS program at the time. VERBS stands for “Vehicle Emissions
Reductions Based at Schools” and has four goals:
(1) facilitate the planning, development, and implementation of a project and/or activity
that will reduce traffic, fuel consumption and air pollution in the vicinity of schools; and
(2) reduce traffic related injuries and fatalities to school children; and
(3) enable and encourage children, including those with disabilities, to walk and bicycle
to school; and
(4) make bicycling and walking to school a safer and more appealing transportation
alternative, thereby encouraging a healthy and active lifestyle from an early age. (VTA,
n.d., p. 1)
VERBS is part of the MTC’s Bay Area Safe Routes to School Program, and the
MTC grants $5 million to cities, counties, and local transit agencies to help fund bike
lanes, traffic calming projects, and education programs for students (MTC, n.d.). VERBS
receives approximately $5 million in funding from the Federal Highway Administration’s
Congestion Mitigation and Air Quality (CMAQ) funds, and the VTA is able to fund
projects ranging from $500,000 to $1,000,000 through these funds. The Walk n’ Roll
10

program will go from receiving VERBS funding to VTA money through Measure B
funds. Measure B is a half-cent sales tax increase that was approved in 2016 by Santa
Clara County voters which is expected to generate $6.3 billion over the course of 30
years and is intended for transit improvements (VTA, 2018.).
Walk n’ Roll initially worked with 25 schools in its first cycle, and now works
with 67 schools. The program uses the help of volunteer groups that help facilitate the
program at the school sites. The volunteer groups consist of parents, community
members, and the principals. The program meets with the schools monthly to record
updates and any concerns that schools may have. Due to the increasing number of
schools that participate in Walk n' Roll, the program works closest with new schools to
help with implementation, as opposed to schools that have been longer with the program.
Education
The Walk n’ Roll program uses assemblies and bike rodeos to educate students on how to
walk to school safely and how to safely ride their bicycles. Safety assemblies are usually
held at the beginning of the school year, and teach students what precautions they should
take when crossing streets, and the benefits of walking to school. During these
assemblies, the Walk n’ Roll program is introduced to students, and schools designate
one day out of the week as a walk-to-school day. On these days, students are encouraged
to walk to school with their parents and friends, rather than taking a family vehicle to
school. The first Wednesday of October is also recognized as International Walk to
School Day and is used to encourage all students to walk to school that day. Bike rodeos
11
are used to teach students how to safely ride their bicycles and to pay attention to their
surroundings. During a bike rodeo, students go through different courses that teach them
different aspects of bicycle safety, such as how to check their bicycles to make sure they
are safe, appropriate riding speeds, and the traffic signs bicyclists should be aware of.
Encouragement
There are various incentives and methods that schools use to encourage students to walk
to school, and the type of incentives given are dependent on the schools. Some schools
within the program may assign a certain day of the week as walk-to-school day, and
reward students with stickers or pencils for walking to school. Principals and teachers
may participate in walk-to-school days to model safe walking and to encourage their
students to walk to school, as well. The number of days that students walk to school may
be recorded, as well, via tally or barcode, and a school might recognize students with
certificates (see Figure 2) to acknowledge their efforts.
12

Figure 2. Example of Walk n’ Roll Certificate. Taken from: City of San Jose. (2016). Walk n’ Roll Toolkit [Sample certificate]. Retrieved from: http://www.getstreetsmarts.org/downloads/walknroll/WalknRollToolkit_English.pdf
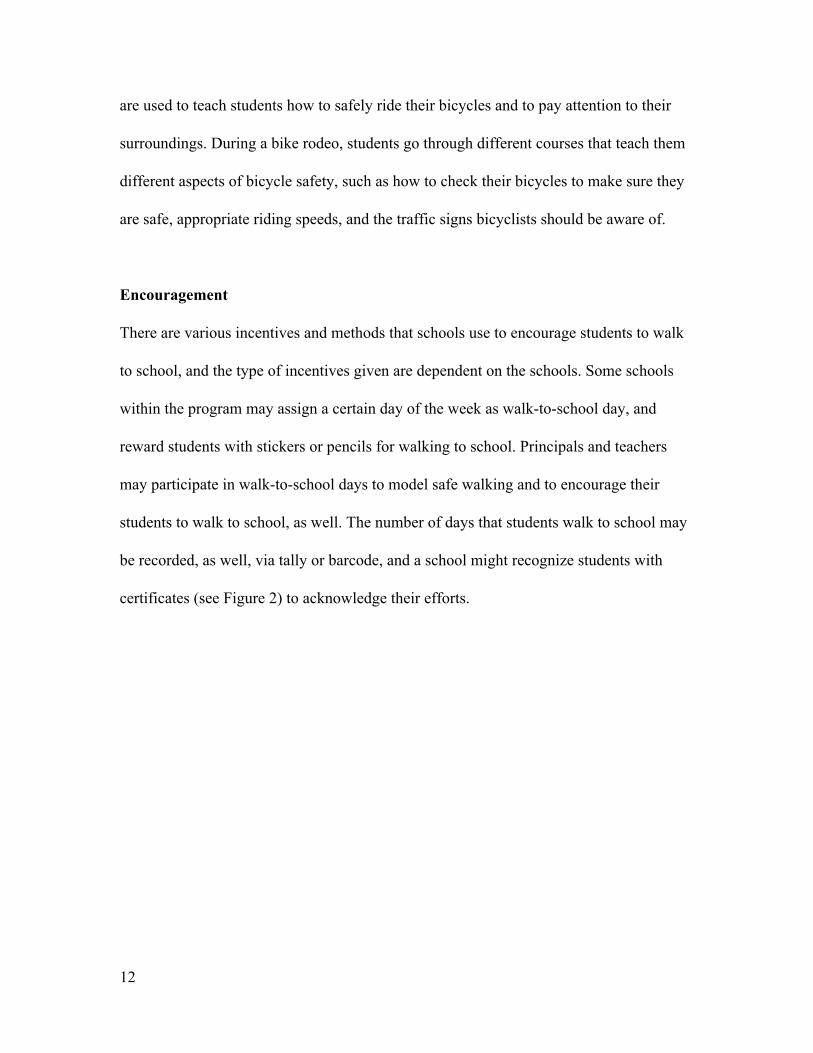
Engineering and Evaluation
Walking audits are intended to get community feedback and community input to improve
the safety of a school’s surrounding area. Parents, principals, Walk n’ Roll staff, and
Department of Transportation engineers walk around the neighborhood to see what
capital improvements are needed. Feedback from the community is recorded and the
Department of Transportation takes the feedback into consideration when developing the
annual capital improvement budget for infrastructure improvements (see Figure 3).
13
Figure 3. Walk Audit sample. Taken from: City of San Jose. (2018). Walk Audit [Informational chart]. From City of San Jose Walk n’ Roll Program
After walking around the surrounding neighborhood, the Department of
Transportation works with the community to develop different routes that students can
use to get to school, depending on where the students live. These routes are provided to
parents who volunteer to lead groups of students in “walking school buses.” “Walking
school buses” consist of volunteer parents who walk with a group of students to school.
Enforcement
San Jose’s Department of Transportation’s Parking and Traffic Compliance Team and the
Police Department address Walk n’ Roll’s enforcement component. Before and after
school, officers and members of the Parking and Traffic Compliance Team make sure
that drivers are obeying traffic signs, traffic laws, and street markings.
14

15

METHODOLOGY
This study used Sylvia & Sylvia’s Outcome Evaluation model to research the design of
San Jose’s Walk n’ Roll program and its impact in regard increasing the number of
students who choose active modes of transportation. The Walk n’ Roll Program is a
voluntary program that the city offers to schools that are willing to participate. The
importance of program evaluation is stated by Ron and Kathleen Sylvia in their book,
Program Planning and Evaluation for the Public Manager, “Another important reason
for collecting and synthesizing local data is that it can form the basis for local resource
allocations” (Sylvia & Sylvia, 2012, p. 117). The emphasis of the program is to
encourage students to walk and ride their bicycles to school rather than ride in their
families’ cars. Another goal of the program is to educate students on safe pedestrian
practices. Overall, the program aims to educate students on the benefits of walking and
bicycling to school, and to have students continue engaging in active modes of
transportation. This is measured and recorded by mode shift, which will be mentioned in
the findings portions of the paper.
16
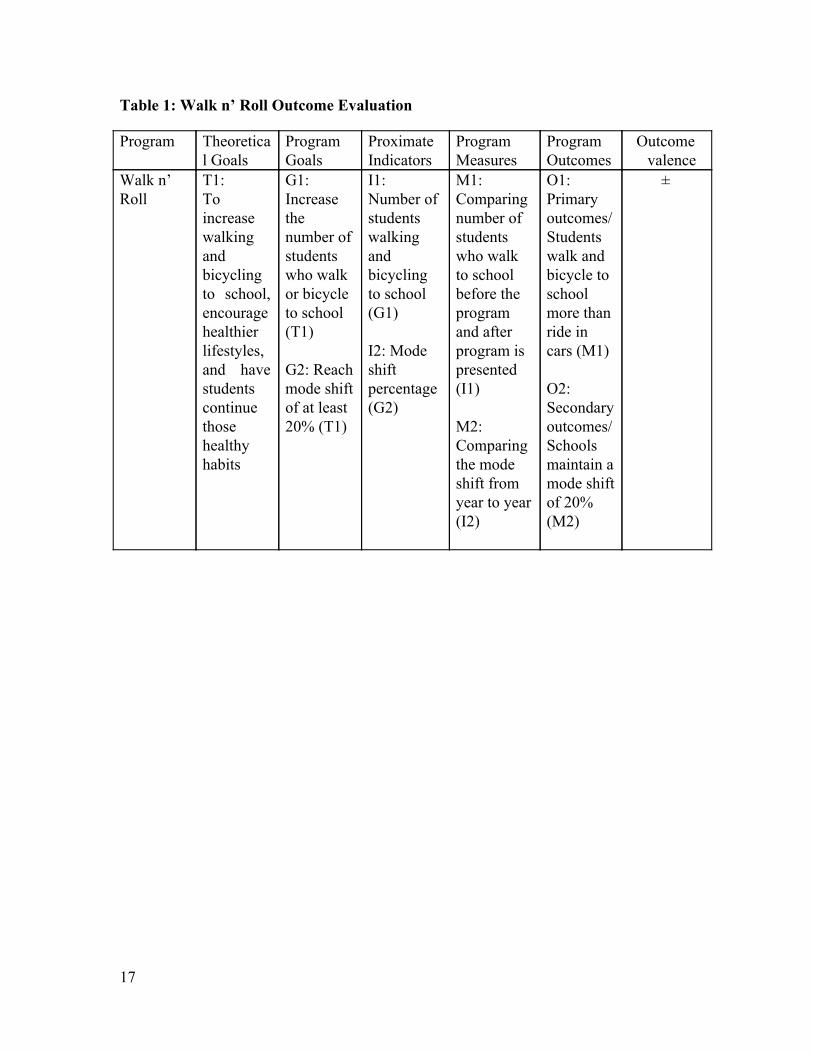
Table 1: Walk n’ Roll Outcome Evaluation
Program Theoretical Goals
Program Goals
Proximate Indicators
Program Measures
Program Outcomes
Outcome valence
Walk n’ Roll
T1: To increase walking and bicycling to school, encourage healthier lifestyles, and have students continue those healthy habits
G1: Increase the number of students who walk or bicycle to school (T1) G2: Reach mode shift of at least 20% (T1)
I1: Number of students walking and bicycling to school (G1) I2: Mode shift percentage(G2)
M1: Comparing number of students who walk to school before the program and after program is presented (I1) M2: Comparing the mode shift from year to year (I2)
O1: Primary outcomes/Students walk and bicycle to school more than ride in cars (M1) O2: Secondary outcomes/ Schools maintain a mode shift of 20% (M2)
±
17

18
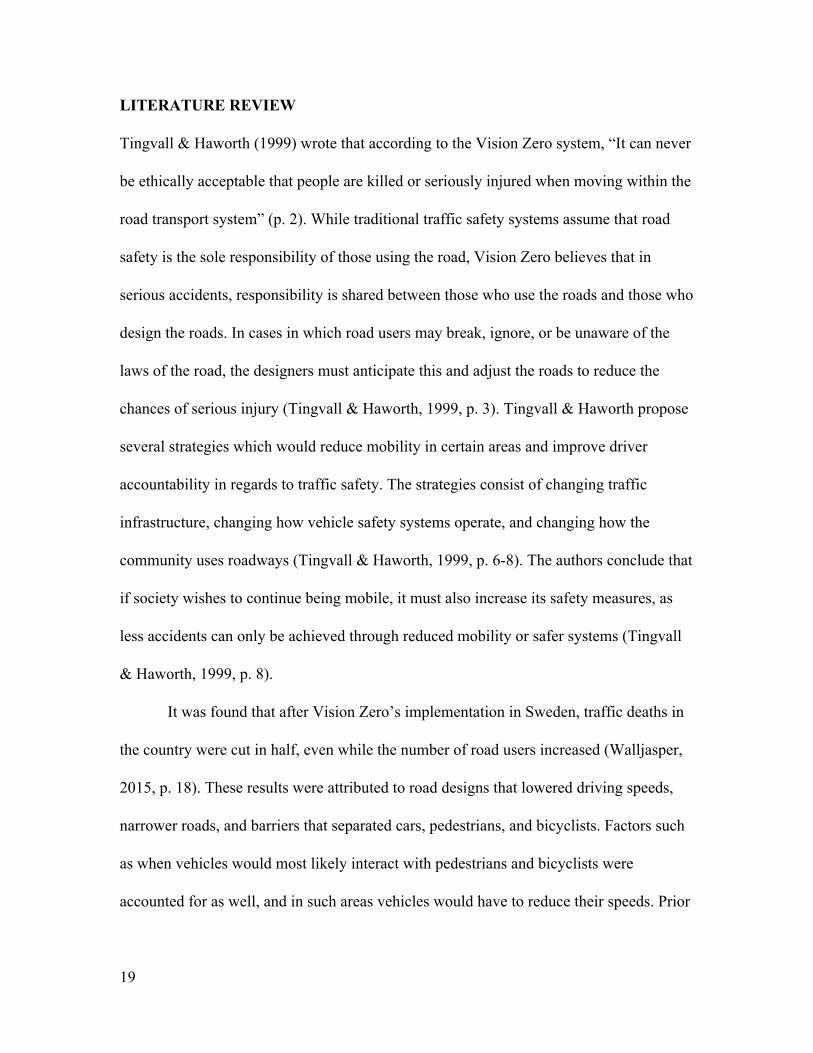
LITERATURE REVIEW
Tingvall & Haworth (1999) wrote that according to the Vision Zero system, “It can never
be ethically acceptable that people are killed or seriously injured when moving within the
road transport system” (p. 2). While traditional traffic safety systems assume that road
safety is the sole responsibility of those using the road, Vision Zero believes that in
serious accidents, responsibility is shared between those who use the roads and those who
design the roads. In cases in which road users may break, ignore, or be unaware of the
laws of the road, the designers must anticipate this and adjust the roads to reduce the
chances of serious injury (Tingvall & Haworth, 1999, p. 3). Tingvall & Haworth propose
several strategies which would reduce mobility in certain areas and improve driver
accountability in regards to traffic safety. The strategies consist of changing traffic
infrastructure, changing how vehicle safety systems operate, and changing how the
community uses roadways (Tingvall & Haworth, 1999, p. 6-8). The authors conclude that
if society wishes to continue being mobile, it must also increase its safety measures, as
less accidents can only be achieved through reduced mobility or safer systems (Tingvall
& Haworth, 1999, p. 8).
It was found that after Vision Zero’s implementation in Sweden, traffic deaths in
the country were cut in half, even while the number of road users increased (Walljasper,
2015, p. 18). These results were attributed to road designs that lowered driving speeds,
narrower roads, and barriers that separated cars, pedestrians, and bicyclists. Factors such
as when vehicles would most likely interact with pedestrians and bicyclists were
accounted for as well, and in such areas vehicles would have to reduce their speeds. Prior
19

to Vision Zero, it was believed that widening roads would make them safer, but it was
found that narrowing roads led to safer driving due to the fact that drivers would have to
slow down (Mendoza et al., 2017, p. 108). Vision Zero recognizes that human error may
occur, and collisions between vehicles and pedestrians or bicyclists might still happen,
but that those hit at a lower speed have a more likely chance of surviving.
Prior to implementation of Vision Zero in the United States, Kelley (2010)
described the various reasons as to why road safety programs in the United States were
not successful. Kelley states that 40,000 people die per year due to automobile related
accidents (Kelley, 2010, p. 170). With the implementation of Vision Zero in several
cities, there have been reports of noticeable reductions in serious vehicle-related
accidents. Researchers state that after the implementation of Vision Zero, the number of
pedestrian fatalities dropped by 27 percent in 2014, which was considered a historic low
(Walljasper, 2015, p. 18). New York implemented several of the strategies that were
outlined by Vision Zero, and it had police officers focusing on traffic safety. This resulted
in the number of speeding tickets increasing by 36 percent (Walljasper, 2015, p. 19).
The City of San Jose implemented Vision Zero in May 2015 and has the same
goals of reducing traffic deaths to zero. According to data put out by the city and federal
government, San Jose has historically had fewer injuries per crash than the national
average (City of San Jose, 2015, p. 7). Richards writes that San Jose has the second
lowest traffic fatality rate of big cities in the United States, and that the city’s annual
crash rate of 3.18 also makes it the second lowest of comparable sized cities (Richards,
2015). However, he also states that in 2015 there were 142 traffic-related deaths in San
20
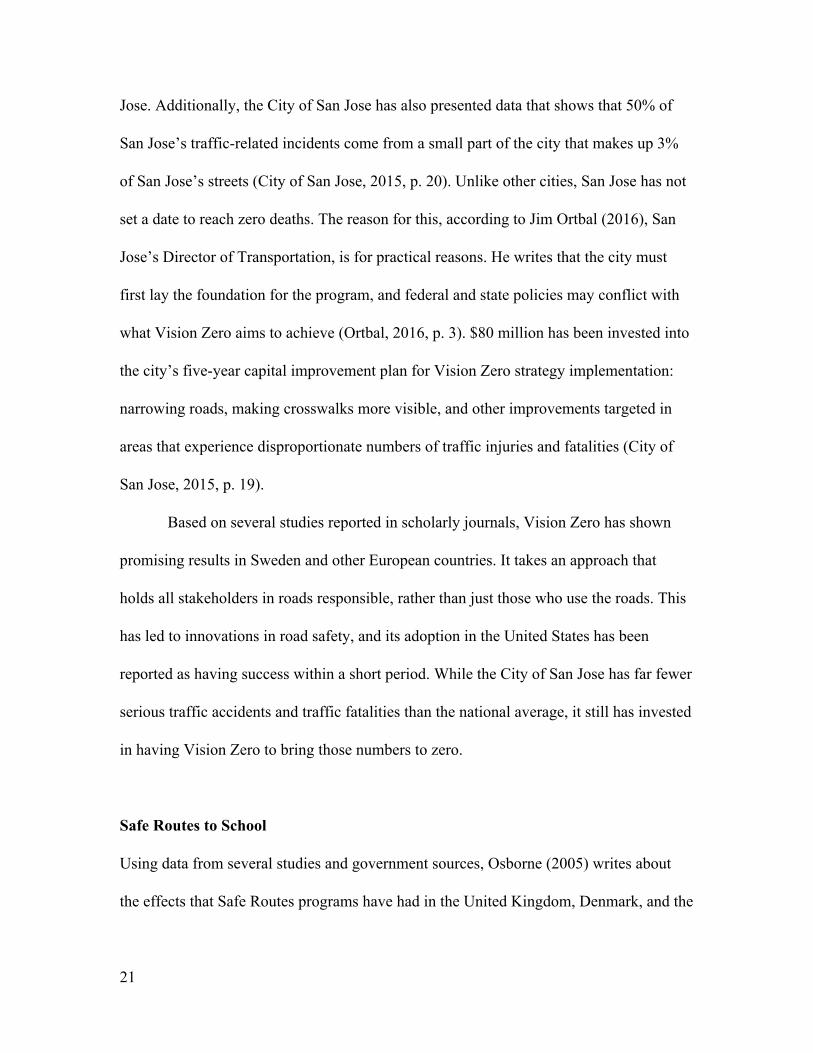
Jose. Additionally, the City of San Jose has also presented data that shows that 50% of
San Jose’s traffic-related incidents come from a small part of the city that makes up 3%
of San Jose’s streets (City of San Jose, 2015, p. 20). Unlike other cities, San Jose has not
set a date to reach zero deaths. The reason for this, according to Jim Ortbal (2016), San
Jose’s Director of Transportation, is for practical reasons. He writes that the city must
first lay the foundation for the program, and federal and state policies may conflict with
what Vision Zero aims to achieve (Ortbal, 2016, p. 3). $80 million has been invested into
the city’s five-year capital improvement plan for Vision Zero strategy implementation:
narrowing roads, making crosswalks more visible, and other improvements targeted in
areas that experience disproportionate numbers of traffic injuries and fatalities (City of
San Jose, 2015, p. 19).
Based on several studies reported in scholarly journals, Vision Zero has shown
promising results in Sweden and other European countries. It takes an approach that
holds all stakeholders in roads responsible, rather than just those who use the roads. This
has led to innovations in road safety, and its adoption in the United States has been
reported as having success within a short period. While the City of San Jose has far fewer
serious traffic accidents and traffic fatalities than the national average, it still has invested
in having Vision Zero to bring those numbers to zero.
Safe Routes to School
Using data from several studies and government sources, Osborne (2005) writes about
the effects that Safe Routes programs have had in the United Kingdom, Denmark, and the
21

United States. Osborne writes that healthy habits developed at a younger age often carry
on to adulthood, and that it is why it is important to study what influences travel mode
choice (Osborne, 2005, p. 235). In an effort to reduce the number of traffic fatalities,
Denmark heavily invested in making its streets more accommodating for pedestrians and
bicyclists. Denmark’s government also promoted bicycling programs, making the city of
Odense Europe’s top bicycling city (Osborne, 2005, p. 236). In contrast, the UK has a
larger percentage of children who walk to school, but much lower numbers of those who
ride their bicycles. The UK’s Traveling to School Initiative has led to a reduction of
traveling by car by 23 percent (Osborne, 2005, p. 236). The United States invested more
into school bus transport and still has a high percentage of transportation by car. The
percentage of children who walk or bicycle to school in the United States is far lower
than those who live in Denmark and the UK. A rise in childhood obesity and the rising
cost of car travel have been the impetus for Safe Routes programs to begin in the United
States (Osborne, 2005, p. 237). Osborne concludes that the Danish model has shown that
having Safe Routes programs leads to safer streets and developing healthy habits, and
that governments should communicate with stakeholders, collect travel data, and invest in
programs that encourage alternatives to driving (Osborne, 2005, p. 237).
Several authors have written studies on the effectiveness of the Safe Routes to
School program. Hubsmith (2006) explains the Safe Routes to School Program and
describes earlier European programs that reduced pedestrian fatalities. In the United
States, 20 to 30 percent of morning traffic is due to parents driving their children to
school (Hubsmith, 2006, p. 169). To show how trends have changed, data shows that in
22

1969, half of all students walked or biked to school, as opposed to 2003, where 15
percent of students walked or biked to school (Hubsmith, 2006, p. 169). Hubsmith states
that outside of contributing to more traffic congestion, this problem has led to children
being less physically active, which can then increase the rate of childhood obesity.
Reasons for children walking less include parental fears of their children being struck by
cars, the distance from schools, and fear of strangers (Hubsmith, 2006, p. 169-170). The
article goes on to describe the 5 Es of Safe Routes to School: Evaluation, Engineering,
Education, Encouragement, and Enforcement, and how each of their characteristics
contributes to the success of Safe Routes programs.
The history of Safe Routes programs is also detailed, with Denmark’s 1970s
pedestrian and bicycle safety program being the first established national Safe Routes to
School program. Prior to the Safe Routes program, Denmark had Western Europe’s
highest rate of traffic-related child fatalities, and after ten years of the Safe Routes
program, the casualty percentage was reduced by 80 percent (Hubsmith, 2006, p. 178).
After the success of Denmark’s program, other countries began developing their own
version of Safe Routes programs, dramatically lowering pedestrian and bicycling injuries.
In 1997, the United States started its first Safe Routes programs, which included
New York City’s Safe Routes to School Program, Florida’s Safe Ways to School
Program, and Chicago’s Walk to School Day (Hubsmith, 2006, p. 181). Within
California, Marin County’s safety program received $50,000 in federal funding, and nine
schools in the country saw increases in walking by 64 percent and bicycling by 114
percent (Hubsmith, 2006, p. 181). Federal funding toward Safe Routes programs
23

continually increased, and after President Bush signed the Safe, Accountable, Flexible,
Efficient Transportation Equity Act: A Legacy for Users (SAFETEA-LU) in 2005, $612
million was available for Safe Routes programs for the following four years. Hubsmith
concludes that the United States should form partnerships with other countries with Safe
Routes program “to share best practices”, and that more research and evaluations should
be done to understand the effectiveness of Safe Routes programs (Hubsmith, 2006, p.
188).
In Implementing Safe Routes to School: Application for the Sociological Model
and Issues to Consider, Martin, Moeti, and Pullen-Seufert (2009) examine the benefits of
the Safe Routes to School program, and barriers to implementing the program. The
authors state that because children are required to attend school, teaching the benefits of
walking and bicycling to school and having students practice alternative modes of
transportation have benefits in improving health and community building. Teaching
students about these benefits has the potential to encourage families and neighborhoods
to increase the amount of walking and bicycling, and decrease the amount of car driving
(Martin et al., 2009, p. 611).While the authors conclude that areas that are able to
implement Safe Routes to School benefit from improved student health, an improved
sense of community, and improved air quality, there are socioeconomic barriers that can
prevent neighborhoods from adopting the program (Martin et al., 2009, p. 612). Poor
neighborhoods have difficulty adopting and implementing the program due to the fact
that students may live too far away from their schools to participate. Within other
neighborhoods, the threat of crime may prevent students from engaging in the program as
24

well. However, the authors state that finding ways to bring Safe Routes to School and
developing transportation methods could be a possible way to build more equity and
infrastructure in these economically-challenged neighborhoods (Martin et al., 2009, p.
612).
DiMaggio, Frangos, and Li (2016) use crash records from 18 states spanning over
the course of 16 years to study whether there is a relationship between the National Safe
Routes to School program and a reduction in traffic accidents involving pedestrians and
bicyclists. The authors state that there have not been many studies that evaluate traffic
safety programs, and that there is a need for more research in this field (DiMaggio et al.,
2016, p. 413). The regions that are studied vary from rural to urban environments, and the
authors acknowledge that the traffic conditions are locally unique. The authors conclude
that there is a relationship between the number of traffic accidents and the program, and
there is a reduction of traffic-related accidents in the time period studied. They state that
there is a 14% to 16% reduction in pedestrian and bicyclist injuries related to traffic
accidents, and a 13% reduction in fatalities (DiMaggio et al, 2016, p. 415). Some
limitations to the study include the inability to study data that is recorded during school
hours as opposed to non-school hours, and that the data involving bicyclists and
pedestrians were studied collectively, meaning that they were unable to differentiate
between accidents involving specifically cyclists or pedestrians (DiMaggio et al., 2016,
416). Despite the limitations, the authors recommend that states should adopt the
program, as it has had a benefit to all states that were in their study.
25
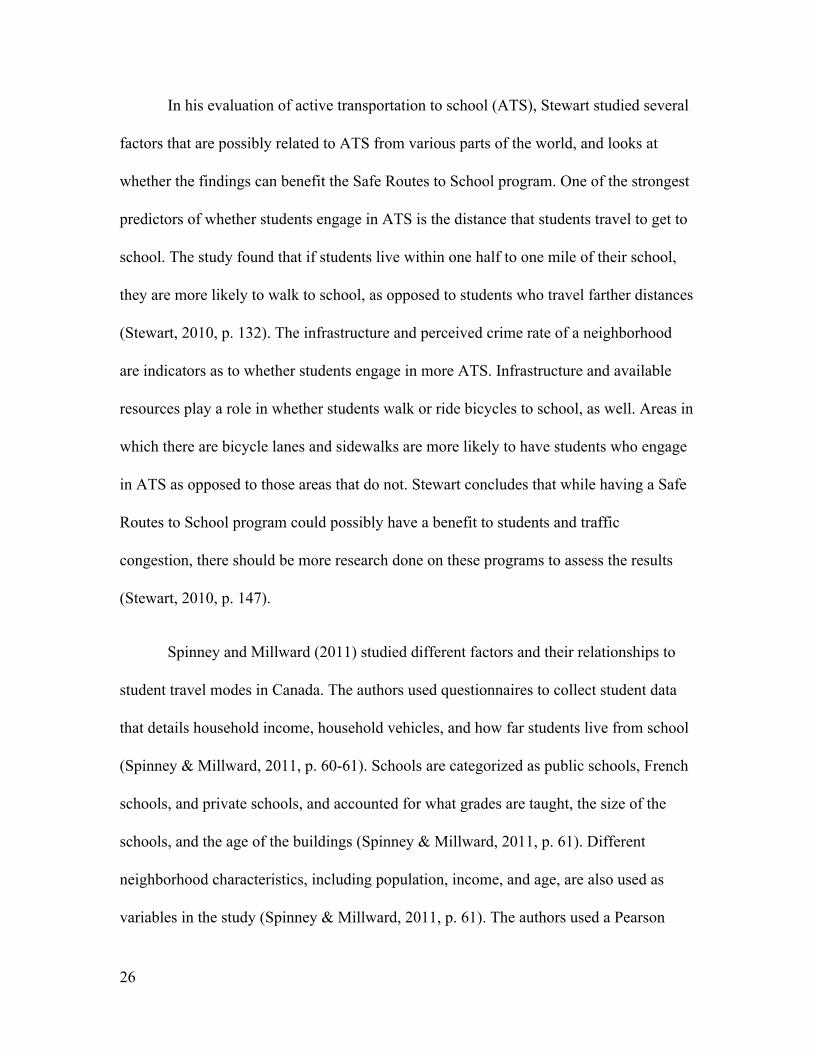
In his evaluation of active transportation to school (ATS), Stewart studied several
factors that are possibly related to ATS from various parts of the world, and looks at
whether the findings can benefit the Safe Routes to School program. One of the strongest
predictors of whether students engage in ATS is the distance that students travel to get to
school. The study found that if students live within one half to one mile of their school,
they are more likely to walk to school, as opposed to students who travel farther distances
(Stewart, 2010, p. 132). The infrastructure and perceived crime rate of a neighborhood
are indicators as to whether students engage in more ATS. Infrastructure and available
resources play a role in whether students walk or ride bicycles to school, as well. Areas in
which there are bicycle lanes and sidewalks are more likely to have students who engage
in ATS as opposed to those areas that do not. Stewart concludes that while having a Safe
Routes to School program could possibly have a benefit to students and traffic
congestion, there should be more research done on these programs to assess the results
(Stewart, 2010, p. 147).
Spinney and Millward (2011) studied different factors and their relationships to
student travel modes in Canada. The authors used questionnaires to collect student data
that details household income, household vehicles, and how far students live from school
(Spinney & Millward, 2011, p. 60-61). Schools are categorized as public schools, French
schools, and private schools, and accounted for what grades are taught, the size of the
schools, and the age of the buildings (Spinney & Millward, 2011, p. 61). Different
neighborhood characteristics, including population, income, and age, are also used as
variables in the study (Spinney & Millward, 2011, p. 61). The authors used a Pearson
26
chi-square test to study the association of mode choice and the different student, school,
and neighborhood characteristics (Spinney & Millward, 2011, p. 62). The study found
that student distance from school was the biggest factor in whether students walked to
school. It was also found that students from higher income and lower income
neighborhoods had higher incidences of walking (Spinney & Millward, 2011, p. 68).
27

28

FINDINGS
The data used comes from San Jose’s Walk n’ Roll program. The program gets its data
from classroom tallies conducted by teachers. Data is collected at the beginning of the
day, Tuesday through Thursday, asking students how they got to school. Data is then
collected at the end of the day, asking how students travel home. Weather is also
recorded to study how it affects modes of travel. The tallies are collected one week in
Fall semester and one week in Spring semester. When collected, Walk n’ Roll lists the
modes of transportation as walking, bicycling, and other. Other consists of riding
scooters, skateboards, and other active modes of transportation outside of walking or
biking. These numbers are represented in percentages and are added together to show the
combined active transportation percentage.
In addition to collecting the aforementioned data, mode shift is also calculated
and recorded by the Walk n’ Roll program. Mode shift is calculated to show the change
from the baseline to the current period. This is important because it shows the progress
that has been made since to the first enrollment period.
The first period that a school is enrolled in the program is considered the baseline.
Because the Walk n’ Roll program assumes that it will be working with a school for at
least three years, the first year of enrollment gathers data to see where schools are in
terms of driving to school and modes of active transportation. The reasons for a school’s
29

recorded numbers may vary. Factors include volunteer parents and students moving to
other schools, or a change in school administration. When this happens the program must
re-introduce itself to a new group of parents or a new principal, which may affect on how
engaged the new school community is with the program.
Walk n’ Roll provided data from 33 schools and the data presented has the names
of the schools changed for privacy purposes. Of the 33 schools, data from four schools
was analyzed. Time period represents when the data was recorded, and is split into either
2 Q, which represents Spring, or 4 Q, which represents mid-Fall. While a school is active
it is marked with a “1”, and if it becomes inactive, meaning it may have stopped working
with the program, it is marked with a “0”. This paper used samples from schools that
have been active with the program for more than two years to see the long-term
effectiveness of the program. As stated previously, Walk n’ Roll works closest with
schools for the first two to three years, and after that period they do not work as closely
with schools. Mode shift is measured on an annual bases and is measured against the first
period of enrollment, so only percentages from Spring periods are used.
30

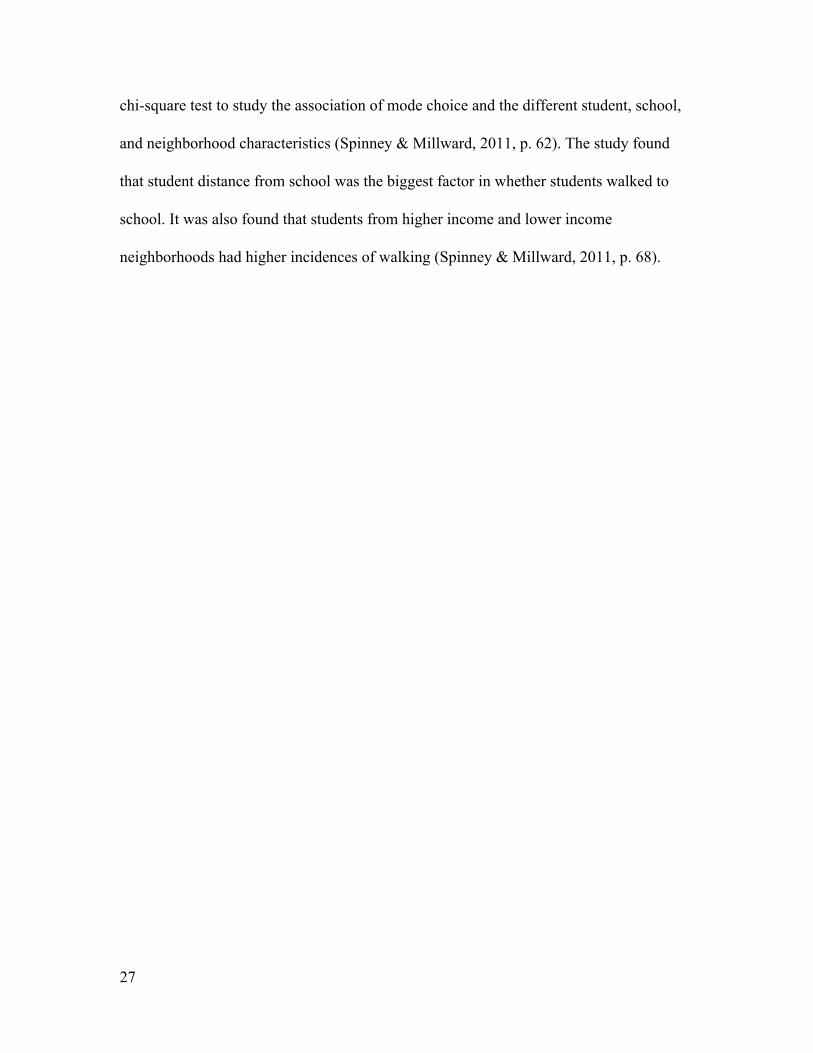
School C1 enrolled in the Walk n’ Roll program in Fall 2012 with a combined active
transportation percentage of 15.6% as its baseline. The combined active transportation
percentage continued to increase in the following periods and reached its peak in Fall
2014 at 36%. After this, the combined active transportation percentage begins to decline,
and has several periods in which the percentage increases and decreases. In its last
31
recorded period, the combined active transportation percentage is at 20.4%. While this
percentage shows a significant drop from its highest recorded year, it is still 4.8% higher
than its baseline.
School C1’s mode shift percentage shows that after one year, it was able to reach and
maintain at least 20% mode shift. It reached its peak of 125.6% mode shift in 2014, and
has been able to keep a mode shift well above 20% in the following years.
32
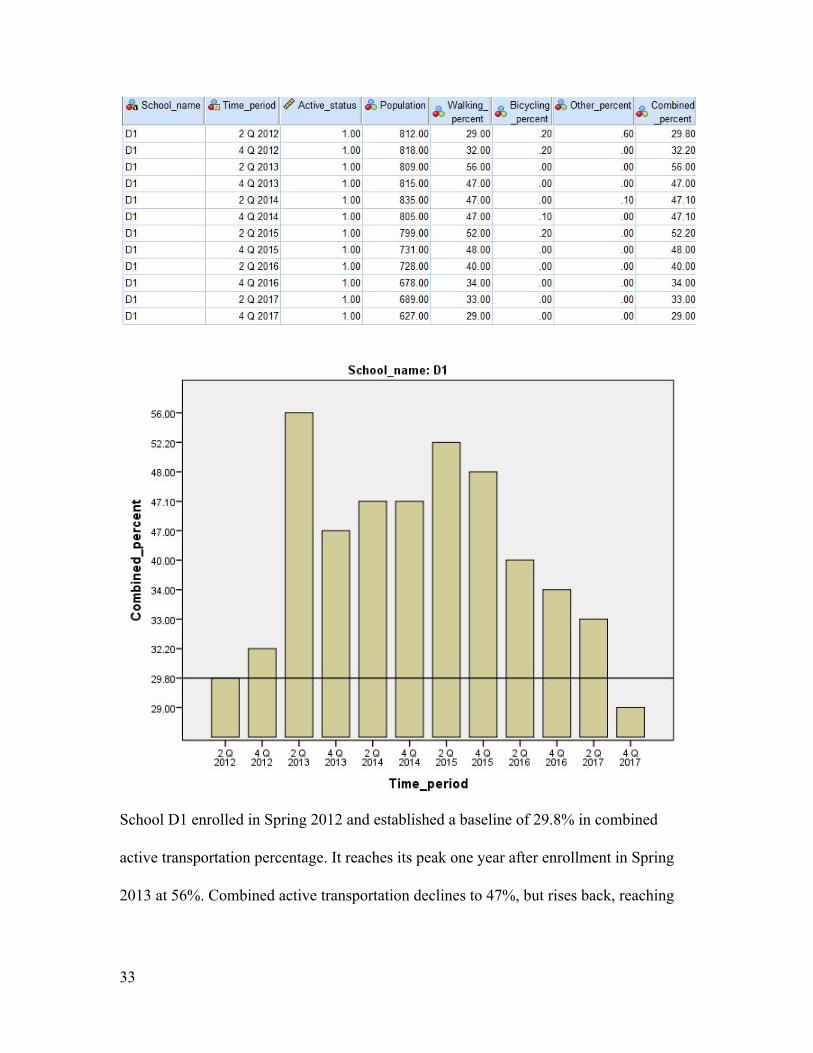
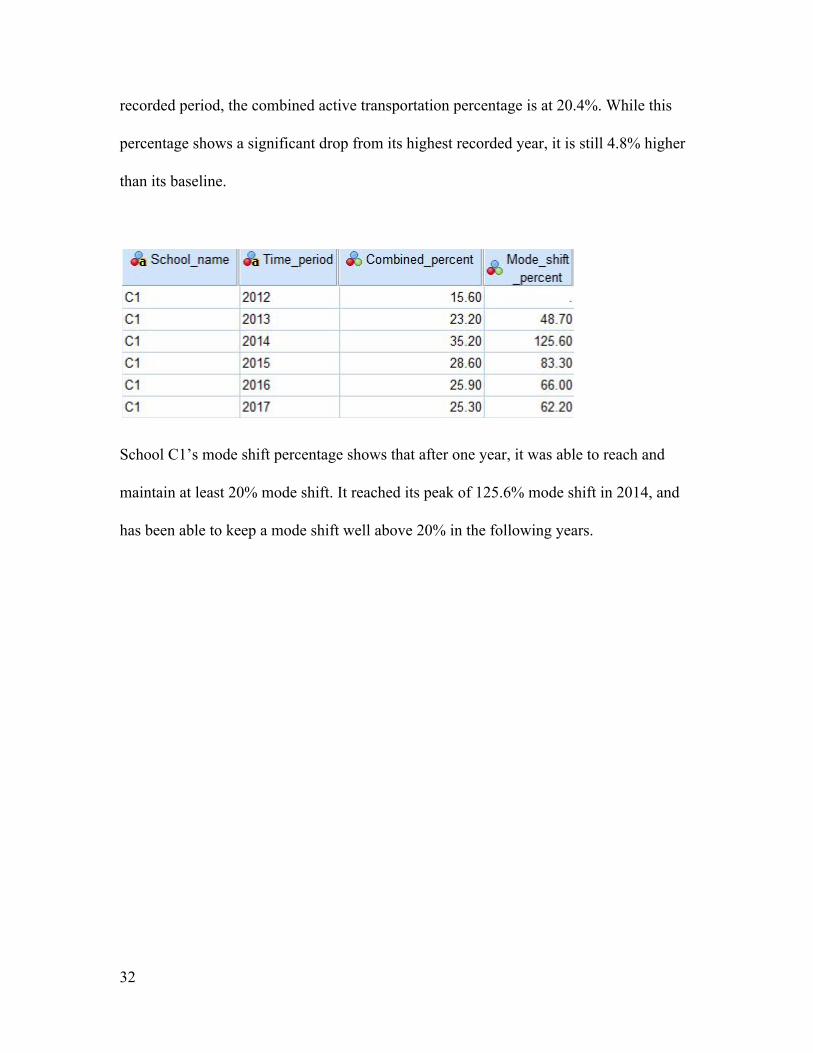
School D1 enrolled in Spring 2012 and established a baseline of 29.8% in combined
active transportation percentage. It reaches its peak one year after enrollment in Spring
2013 at 56%. Combined active transportation declines to 47%, but rises back, reaching
33

52.2% in Spring 2015. After this, however, there is a continual decline, and in its last
recorded period, the school dropped to 29% which is below its baseline. It should be
noted that in addition to a decline in combined active transportation, there is a decline in
student population as well, which may be a contributing factor.
After a year of enrollment, School D1 reached its highest mode shift in 87.9% and
maintained at least 20% mode shift until 2017. The mode shift for the last recorded
period was 10.7%, and as mentioned before, this was during a period of continual decline
in combined active transportation and student population for the school.
34

School L1 enrolled in the program in Spring 2012 and established a combined active
transportation percentage baseline of 16%. The school reached its peak of 29% in Fall
35
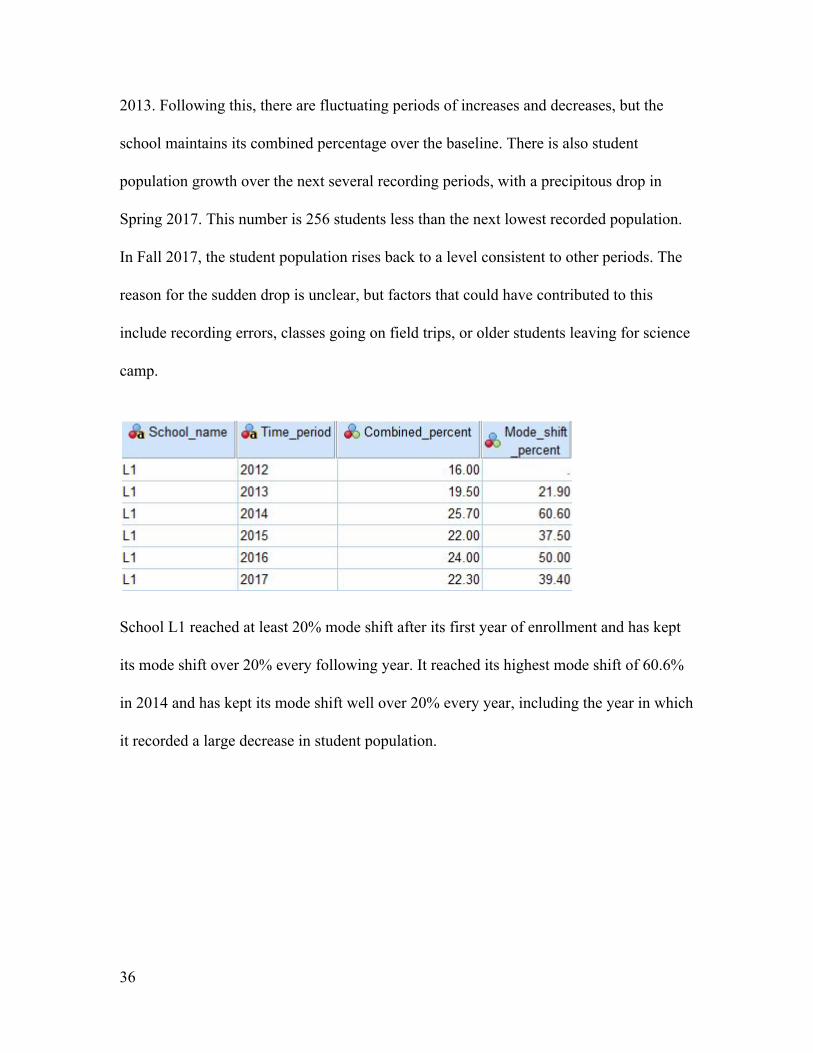
2013. Following this, there are fluctuating periods of increases and decreases, but the
school maintains its combined percentage over the baseline. There is also student
population growth over the next several recording periods, with a precipitous drop in
Spring 2017. This number is 256 students less than the next lowest recorded population.
In Fall 2017, the student population rises back to a level consistent to other periods. The
reason for the sudden drop is unclear, but factors that could have contributed to this
include recording errors, classes going on field trips, or older students leaving for science
camp.
School L1 reached at least 20% mode shift after its first year of enrollment and has kept
its mode shift over 20% every following year. It reached its highest mode shift of 60.6%
in 2014 and has kept its mode shift well over 20% every year, including the year in which
it recorded a large decrease in student population.
36
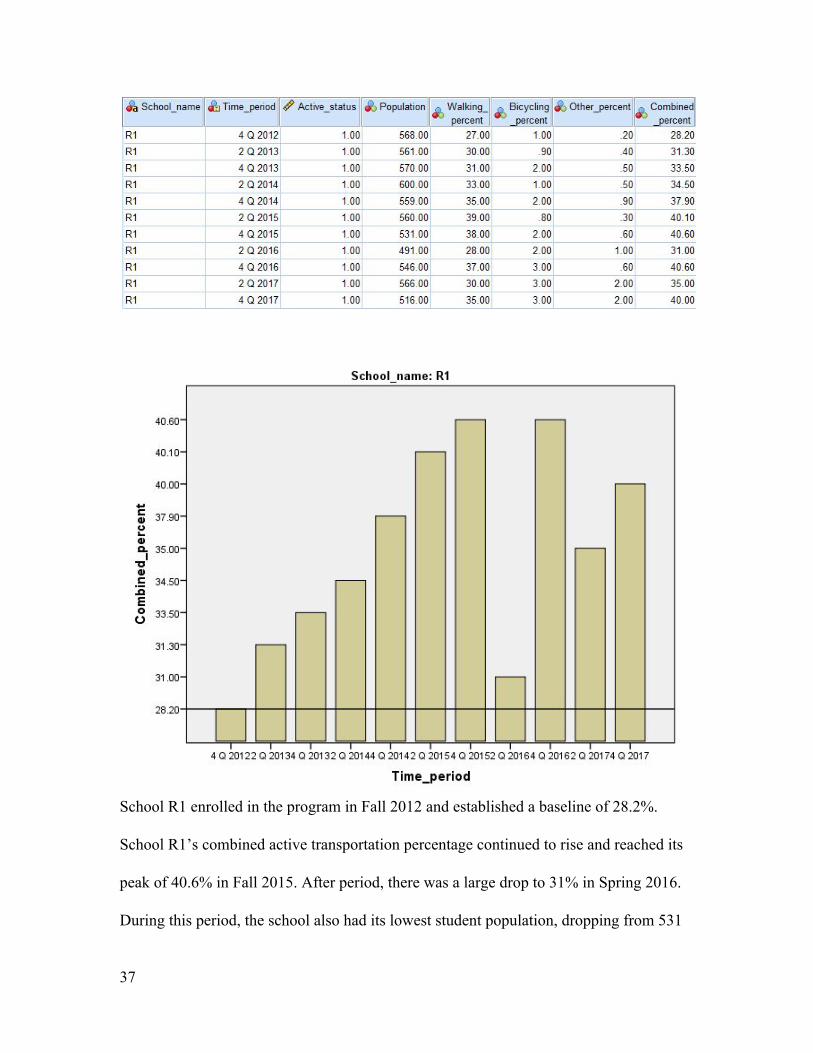
School R1 enrolled in the program in Fall 2012 and established a baseline of 28.2%.
School R1’s combined active transportation percentage continued to rise and reached its
peak of 40.6% in Fall 2015. After period, there was a large drop to 31% in Spring 2016.
During this period, the school also had its lowest student population, dropping from 531
37
students to 491 students. It is not known exactly why there is a drop, and various factors
may have contributed to this. However, there is an increase in both student population
and combined active transportation the following period, and the following periods have
consistent active transportation percentages as the previous ones.
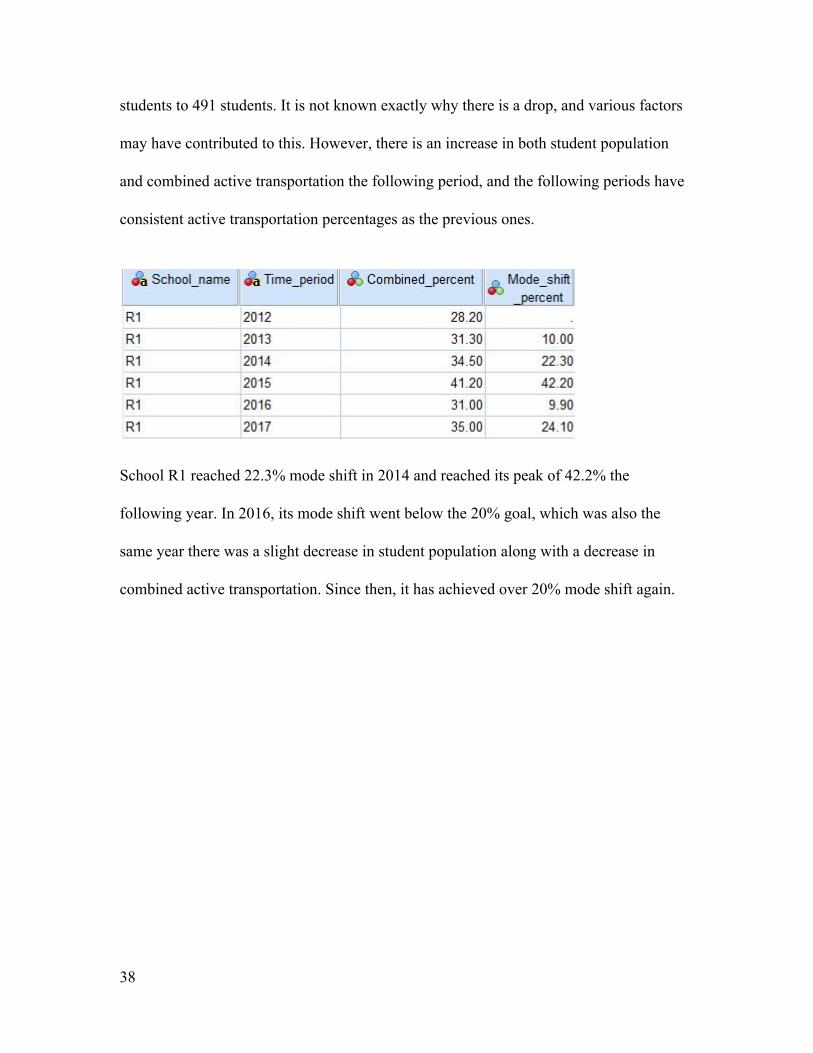
School R1 reached 22.3% mode shift in 2014 and reached its peak of 42.2% the
following year. In 2016, its mode shift went below the 20% goal, which was also the
same year there was a slight decrease in student population along with a decrease in
combined active transportation. Since then, it has achieved over 20% mode shift again.
38
ANALYSIS
Most schools enrolled in the Walk n’ Roll program did not drop below the baseline
participation level, except for school D1 which showed a continual decline after its peak
period. However, the school also had a continually decreasing population, which may
have accounted for this. School L1 had a large population decrease from Fall 2016 to
Spring 2017. Even with the decrease, however, school L1 was able to keep high
participation percentages in active transportation and mode shift. This may indicate that
there may be factors outside of participation with the program and population that affect
whether students engage in active transportation or not.
In attempting to study the correlation between the Walk n’ Roll program and
reductions in traffic accidents by schools, it was found that it would not be appropriate to
correlate the program and the number of traffic accidents. While San Jose’s Department
of Transportation provided a detailed list of traffic accidents dating from 2010, a large
majority of accidents listed were not on streets near Walk n’ Roll schools. Due to this,
perhaps it might be more effective to study the correlation between capital improvements
around schools, what effect the improvements have, and see whether there is a correlation
between the program and capital improvements.
Another limitation to this study is that schools not enrolled in the program do not
regularly keep track of their students’ modes of travel. If this data is collected, then a
comparison of all schools could be done, and it might give insight into whether Walk n’
Roll influences transportation mode shift.
39

Data that could have contributed to this paper would be the amount of greenhouse
gas emissions reduced in San Jose due to the Walk n’ Roll program. This type of data
would have provided a better understanding of the environmental impact that this
program has on the City. While the City publishes greenhouse gas emissions inventories,
the information is about the entirety of San Jose. Due to staff numbers, it might not be
practical or possible for Walk n’ Roll to measure greenhouse gas emissions for each
school.
However, one factor that can be analyzed is the relationship between the Walk n’
Roll program and the participating schools. In the first one to three years of the program
the city’s Walk n’ Roll program works closely with schools by doing monthly check-ins,
doing walking audits with the school community, and having events, such as bike rodeos
and assemblies. After this period, the program uses volunteers, and school administration
encourages students to engage in active transportation, and the program mainly collects
data. The result is that schools reach their peaks in the first three years with the program,
but there is a decline in participation afterwards. The data suggests that without the active
participation of city resources with the program, participation begins to drop, but in some
schools, participation may stabilize at a certain point.
Weather may also be a factor in the fluctuation in active transportation
participation. California experienced a five-year drought that generated very few rainy
days. (USGS, 2018) Early data collection regarding Walk n’ Roll participation
(2010-2016) may have been influenced by the willingness of children to use active
transportation in good weather, and of parents’ willingness to walk to school with
40

children on clear days. The drought ended in 2017 with a particularly wet year. (Stevens,
2017) It is notable that all the schools showed a drop in active transportation use during
2017, which may correlate with the increased number of stormy days. Parents may have
chosen to drive their children to school more often to keep them dry.
41

42

CONCLUSION
The Walk n’ Roll program’s focus of increasing numbers of students walking or biking to
school seems to meet its goal, but this growth is not sustained, and there is a drop off
typically after the third year. After the third year, most schools keep their active
transportation participation higher than the baseline, but there are cases in which schools
drop below the established baseline. While there is a safety component to the Walk n’
Roll program, it is focused more on education and developing safe routes for students
rather than policy changes.
Going forward, future studies might want to take transportation data from schools
not enrolled in the program to study travel trends. This would give additional insight as to
whether there are significant changes in schools not enrolled in Safe Routes to School
programs, and what other factors might affect student transportation choice.
Additionally, if one of the program’s stated goals is to reduce car-generated air pollution
and greenhouse gas emissions, this type of data should be tracked as well. As the number
of schools working with Walk n’ Roll grows, it would be worth investing more resources
into the program to maintain walking numbers that promote healthy habits and reduce
greenhouse gas emissions to see whether the program meets its goals in this respect.
43

44
REFERENCES
Baum, J. (2015, November 18). San Jose Seeks Ways To Prevent Fatalities On Busy
Streets. San Jose Mercury News. Retrieved from: https://www.mercurynews.com/2015/11/11/san-jose-city-meets-with-almaden-residents-to-figure-out-how-to-prevent-fatal-accidents-on-busy-streets /
Baum, J. (2017, September 28). San Jose hunts for ways to take the danger out of its most
troubled roads. San Jose Mercury News. Retrieved from: http://www.mercurynews.com/2017/09/28/san-jose-city-hunts-for-ways-to-take-the-danger-out-of-its-most-troubled-roads/
City of San Jose. (2017). Walk n’ Roll: San Jose Vision Zero. Retrieved from:
http://www.getstreetsmarts.org/walknroll/ City of San Jose (2015, April). Vision Zero San Jose: Current Status and Actions.
Retrieved from: https://www.sanjoseca.gov/DocumentCenter/View/42849 City of San Jose. (2017). Vision Zero San Jose: Two-Year Action Plan - 2017 & 2018.
Retrieved from: https://bikesiliconvalley.org/wp-content/uploads/Attachment_D-2-Year-Action-Plan.pdf
City of San Jose. (2018). Walk Audit. [Filled walk audit]. From City of San Jose Walk n’
Roll Program. City of San Jose. (2016). Walk n’ Roll Toolkit. [Sample certificate]. Retrieved from:
http://www.getstreetsmarts.org/downloads/walknroll/WalknRollToolkit_English.pdf
Cushing, M., Hooshmand, J., Pomares, B., & Hotz, G. (2016 December). Vision Zero in
the United States Versus Sweden: Infrastructure Improvement for Cycling Safety. American Journal of Public Health, (16)2
DiMaggio, C., Frangos, S., & Guohua, L. (2016, April 13). National Safe Routes to
School program and risk of school-age and pedestrian and bicyclist injury. Annals of Epidemiology (26), 412-417.
Fleisher, A., Wier, M., & Hunter, M. (2016). A Vision for Transportation Safety:
Framework for Identifying Best Practice Strategies to Advance Vision Zero. Transportation Research Record. (2582), 72-86.
45
Hubsmith, D. A. (2006). Safe Routes to School in the United States. Children, Youth and Environments 16(1), 168-190.
Kim, E., Muennig, P., & Rosen, Z. (2017). Vision zero: A toolkit for road safety in the
modern era. Injury Epidemiology, 4(1), 1-9. Kelley, B. (2010, September). Why the United States lags in auto safety and lessons it
can import. Journal of Public Health Policy, (31)3, 369-377. Kronenberg, C., Woodward, L., Dubose, B., & Weissman, D. (2015). Achieving Vision
Zero Data-Driven Investment Strategy to Eliminate Pedestrian Fatalities on a Citywide Level. Transportation Research Record, 2519(2519), 146-156.
Martin, S. L., Moeti, R., & Peullen-Seufert, N. (2009, October). Implementing Safe
Routes to School: Application for the Socioecological Model and Issues to Consider. Health Promotion Practice (10)4, 606-614.
McAndrews, C. (2013, November). Road Safety as a Shared Responsibility and a Public
Problem in Swedish Road Safety Policy. Science, Technology, & Human Values, (38)6, 749-772.
Metropolitan Transportation Commission. (2018). Bay Area Safe Routes to School.
Retrieved from https://mtc.ca.gov/our-work/invest-protect/investment-strategies-commitments/protect-our-climate/bay-area-safe-routes
Metropolitan Transportation Commission (2016a). Figure 3. Comparison of Public
Schools in Safe Routes Program and Analysis by County. [Informational chart]. Retrieved from https://mtc.ca.gov/sites/default/files/MTC_Regional_SRTS_Evaluation_Report_Final.pdf
Metropolitan Transportation Commission. (2016b). MTC’s Climate Initiatives Program
Evaluation: Regional Safe Routes to School Program. Retrieved from: https://mtc.ca.gov/sites/default/files/MTC_Regional_SRTS_Evaluation_Report_Final.pdf
National Center for Safe Routes to School. (n.d). About Us. Retrieved from:
http://www.saferoutesinfo.org/#about National Highway Traffic Safety Administration. (2017, February). Traffic Safety Data.
Retrieved from: https://crashstats.nhtsa.dot.gov/Api/Public/ViewPublication/812375
46

Ortbal, J. (2016, April 18). Annual Transportation System Safety Report. San Jose City Council Memorandum. Retrieved from: http://www.sanjoseca.gov/DocumentCenter/View/56183
Osborne, P. (2005). Safe Routes for Children: What They Want and What Works.
Children, Youth, and Environments (15)1, 234-239. Pedestrian and Bicycle Information Center. (2009.) Street Smarts: PBIS Case Study - San
Jose, CA. Retrieved from: http://www.pedbikeinfo.org/cms/downloads/EDU.StreetSmarts.pdf
Richards, G. (2015, May 3). Safer roads an S.J. priority. San Jose Mercury News.
Retrieved from: https://www.mercurynews.com/2015/05/02/san-jose-has-ambitious-plans-to-make-city-streets-safer-for-drivers-bicyclists-and-pedestrians/
Safe Routes to School Guide. (n. .d). History of Safe Routes to School. Retrieved from:
http://guide.saferoutesinfo.org/introduction/history_of_srts.cfm Safe Routes to School: National Partnership. (n. d.). Funding History of Safe Routes to
School. Retrieved from: https://www.saferoutespartnership.org/healthy-communities/101/history
Safe Routes to School: National Partnership. (2015). Vision Zero and Safe Routes to
School: Partners in Safety. Retrieved from: https://www.saferoutespartnership.org/sites/default/files/resource_files/042417-sr2s-visionzero-final.pdf
Spinney, J. E. L., & Millward, H. (2011). School Travel Mode Choice and Characteristics
of the Children, School and Neighborhood. Children, Youth, and Environments 21(2), 55-76.
Stevens, M. (2017). California, drenched by winter rain, is told drought’s over. New York
Times. April 7. Retrieved from https://www.nytimes.com/2017/04/07/us/california-drought.html
Stewart, O. (2010, December 9). Findings from Research on Active Transportation to
School and Implications for Safe Routes to School Program. Journal of Planning Literature, 26(2), 127-150.
Swedish Transport Agency, Swedish Transport Administration, Transport Analysis and
Swedish National Road and Transport Research Institute (VTI). (2012). Development of Road Safety in Sweden. United Nations Economic Commission for Europe. Retrieved from:
47

http://www.unece.org/fileadmin/DAM/trans/doc/2012/wp1/NatDev-2012_SWEDEN.pdf
Szczepanski, C. (2015, May 11). San Jose: Widening the Lens on Vision Zero. Vision
Zero Network. Retrieved from: https://visionzeronetwork.org/san-jose-widening-the-lens-on-vision-zero/
Tingvall, C. & Haworth, N. (1999, September 6-7). Vision Zero - An ethical approach to
safety and mobility. Monash University Accident Research Centre. www.monash.edu/muarc/research/our-publications/papers/visionzero
USGS. (2018). 2012-2016 California drought: Historical Perspective. Retrieved from
https://ca.water.usgs.gov/california-drought/california-drought-comparisons.html Valley Transit Authority. (n.d.). Santa Clara County Vehicle Emissions Reductions
Based at Schools (VERBS). Retrieved from: http://www.vta.org/sfc/servlet.shepherd/document/download/069A0000001ELrIIAW
Valley Transit Authority. (2018). 2016 Measure B. Retrieved from:
http://www.vta.org/measure-b-2016 Walljasper, J. (2015). The safest streets: Vision zero aims to eliminate all traffic fatalities.
Planning, 81(5), 14-21. Wadsworth, J. (2015, May 11). ‘Vision Zero’ Plan Would Reduce Speed Limits, Traffic
Deaths. San Jose Inside. Retrieved from: http://www.sanjoseinside.com/2015/05/11/vision-zero-plan-would-reduce-speed-limits-traffic-deaths/
Wong, S.C & Sze, N.N. (2010). Is the effect of quantified road safety targets sustainable?
Safety Science, 48(9), 1182-1188. Zwetsloot, G.I.J.M., Kines, P., Wybo, J.L., Ruotsala, R., Drupsteen, L.,
Bezemer, R.A. (2017). Zero Accident Vision based strategies in organisations: Innovative perspectives. Safety Science, 91, 260-268. Doi: 10.1016/j.ssci.2016.08.016.
Zwetsloot, G.I.J.M., Kines, P., Ruotsala, R., Drupsteen, L., Merivirta, M., Bezemer, R.A.
(2017). The importance of commitment, communication, culture and learning for the implementation of the Zero Accident Vision in 27 companies in Europe. Safety Science, 96, 22-32.
48