
San Joaquin Valley Fair Housing and Equity Assessment · delano hanford porterville tulare madera...
53
San Joaquin Valley Fair Housing and Equity Assessment April 2014 PREPARED FOR THE U.S. DEPARTMENT OF HOUSING AND URBAN DEVELOPMENT OFFICE OF SUSTAINABLE HOUSING AND COMMUNITIES
Transcript of San Joaquin Valley Fair Housing and Equity Assessment · delano hanford porterville tulare madera...
San Joaquin ValleyFair Housing and Equity Assessment
April 2014
PREPARED FOR THE U.S. DEPARTMENT OF
HOUSING AND URBAN DEVELOPMENT OFFICE
OF SUSTAINABLE HOUSING AND COMMUNITIES

PAGE 3
Written and prepared by:
With assistance from:
Funding provided by:
MAYA ABOOD
NAOMI CYTRON
MATT MARTIN
JESSICA HOWEN MCBRIDE
CALIFORNIA COALITION FOR RURAL HOUSING
THE U.S. DEPARTMENT OF HOUSING AND URBAN DEVELOPMENT (HUD) THROUGH THE SUSTAINABLE COMMUNITIES REGIONAL PLANNING GRANT
FEDERAL RESERVE BANK OF SAN FRANCISCO
KIRWAN INSTITUTE FOR THE STUDY OF RACE AND ETHNICITY
UCLA LUSKIN SCHOOL OF PUBLIC AFFAIRS

PAGE 5
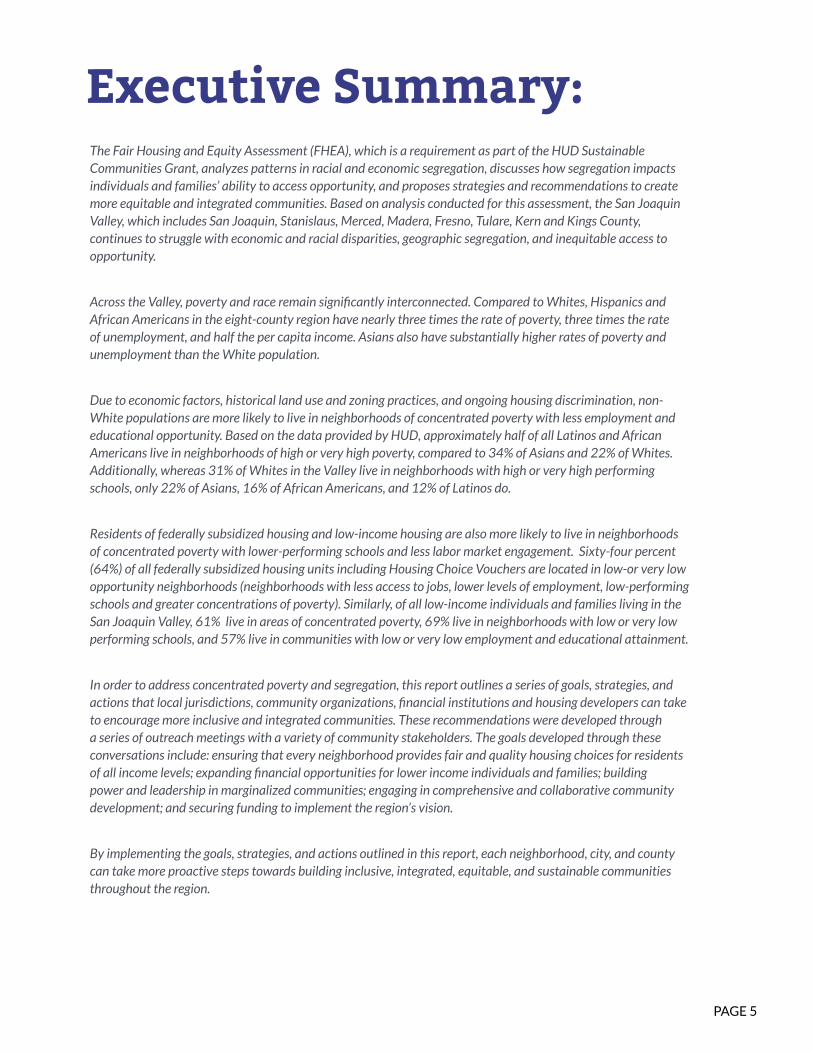
Executive Summary:The Fair Housing and Equity Assessment (FHEA), which is a requirement as part of the HUD Sustainable Communities Grant, analyzes patterns in racial and economic segregation, discusses how segregation impacts individuals and families’ ability to access opportunity, and proposes strategies and recommendations to create more equitable and integrated communities. Based on analysis conducted for this assessment, the San Joaquin Valley, which includes San Joaquin, Stanislaus, Merced, Madera, Fresno, Tulare, Kern and Kings County, continues to struggle with economic and racial disparities, geographic segregation, and inequitable access to opportunity.
Across the Valley, poverty and race remain significantly interconnected. Compared to Whites, Hispanics and African Americans in the eight-county region have nearly three times the rate of poverty, three times the rate of unemployment, and half the per capita income. Asians also have substantially higher rates of poverty and unemployment than the White population.
Due to economic factors, historical land use and zoning practices, and ongoing housing discrimination, non-White populations are more likely to live in neighborhoods of concentrated poverty with less employment and educational opportunity. Based on the data provided by HUD, approximately half of all Latinos and African Americans live in neighborhoods of high or very high poverty, compared to 34% of Asians and 22% of Whites. Additionally, whereas 31% of Whites in the Valley live in neighborhoods with high or very high performing schools, only 22% of Asians, 16% of African Americans, and 12% of Latinos do.
Residents of federally subsidized housing and low-income housing are also more likely to live in neighborhoods of concentrated poverty with lower-performing schools and less labor market engagement. Sixty-four percent (64%) of all federally subsidized housing units including Housing Choice Vouchers are located in low-or very low opportunity neighborhoods (neighborhoods with less access to jobs, lower levels of employment, low-performing schools and greater concentrations of poverty). Similarly, of all low-income individuals and families living in the San Joaquin Valley, 61% live in areas of concentrated poverty, 69% live in neighborhoods with low or very low performing schools, and 57% live in communities with low or very low employment and educational attainment.
In order to address concentrated poverty and segregation, this report outlines a series of goals, strategies, and actions that local jurisdictions, community organizations, financial institutions and housing developers can take to encourage more inclusive and integrated communities. These recommendations were developed through a series of outreach meetings with a variety of community stakeholders. The goals developed through these conversations include: ensuring that every neighborhood provides fair and quality housing choices for residents of all income levels; expanding financial opportunities for lower income individuals and families; building power and leadership in marginalized communities; engaging in comprehensive and collaborative community development; and securing funding to implement the region’s vision.
By implementing the goals, strategies, and actions outlined in this report, each neighborhood, city, and county can take more proactive steps towards building inclusive, integrated, equitable, and sustainable communities throughout the region.
PAGE 6
SECTION 1: Demographics and Background................................................................................................8
SECTION 2: Segregation..................................................................................................................................... 19
SECTION 3: Racially/Ethnically Concentrated Areas of Poverty....................................................... 28
SECTION 4: Historical and Ongoing Contributors to Racial/Ethnic Segregation....................... 30
SECTION 5: Access to Opportunity............................................................................................................... 34
SECTION 6: Mapping Opportunity................................................................................................................ 40
SECTION 7: Major Public Investments.................................................................................................... .....41
SECTION 8: Fair Housing Infrastructure and Outstanding Issues....................................................43
SECTION 9: Recommendations....................................................................................................................... 46
Table of Contents:
PAGE 7
Introduction:In 2010, fourteen cities and four regional non-profit organizations in the San Joaquin Valley came together to advance the goals of sustainable planning, community engagement, and regional integration through an innovative initiative called Smart Valley Places. The Smart Valley Places Consortium, which was funded by the U.S. Department of Housing and Urban Development (HUD) as part of a Sustainable Communities Regional Planning Grant, encouraged the investment in more transportation choices, equitable-affordable housing options, sustainable economic development planning, and healthier, more walkable communities.
Through the Smart Valley consortium, the cities of Lodi, Stockton, Manteca, Modesto, Turlock, Merced, Madera, Clovis, Fresno, Hanford, Tulare, Visalia, Porterville, and Delano along with the Office of Community and Economic Development at Fresno State (OCED), American Farmland Trust (AFT), California Coalition for Rural Housing (CCRH), and Central California Regional Obesity Prevention Program (CCROPP), collaborated on local planning initiatives, shared best practices in smart growth models, and further developed a road map for regional growth.
The ultimate goal of the initiative was to develop more inclusive and prosperous communities, however, this can only be achieved if all residents, regardless of income, race, family size, religion, and disability, have access to neighborhoods that promote opportunity and support economic and social well-being.
The Fair Housing and Equity Assessment, which is required for all HUD Sustainable Communities Grantees, encourages local and regional jurisdictions to discuss how patterns of racial and ethnic segregation may contribute to disparities in access to housing, transit, education, healthcare, and economic prosperity. Using data as a starting point, the assessment requires grantees to engage in a process of collective discussion and decision-making in order to develop action plans that reduce racial segregation, increase equitable access to opportunity, and affirmatively further fair housing for all residents.
Although this report focuses primarily on the fourteen compact cities included in the grant, the data and narrative also includes discussion and analysis of the eight-county San Joaquin Valley region as a whole.
PAGE 8
SAN JOAQUIN COUNTY
STANISLAUS COUNTY MERCED
COUNTY MADERA COUNTY
FRESNOCOUNTY
TULARE COUNTY
KINGS COUNTY
KERN COUNTY
Lodi
Stockton
Manteca
Modesto
Merced
Madera
Clovis
Visalia
Tulare
PortervilleHanford
Delano
Fresno
Turlock
A Rapidly Growing RegionIn 2010, the San Joaquin Valley, which
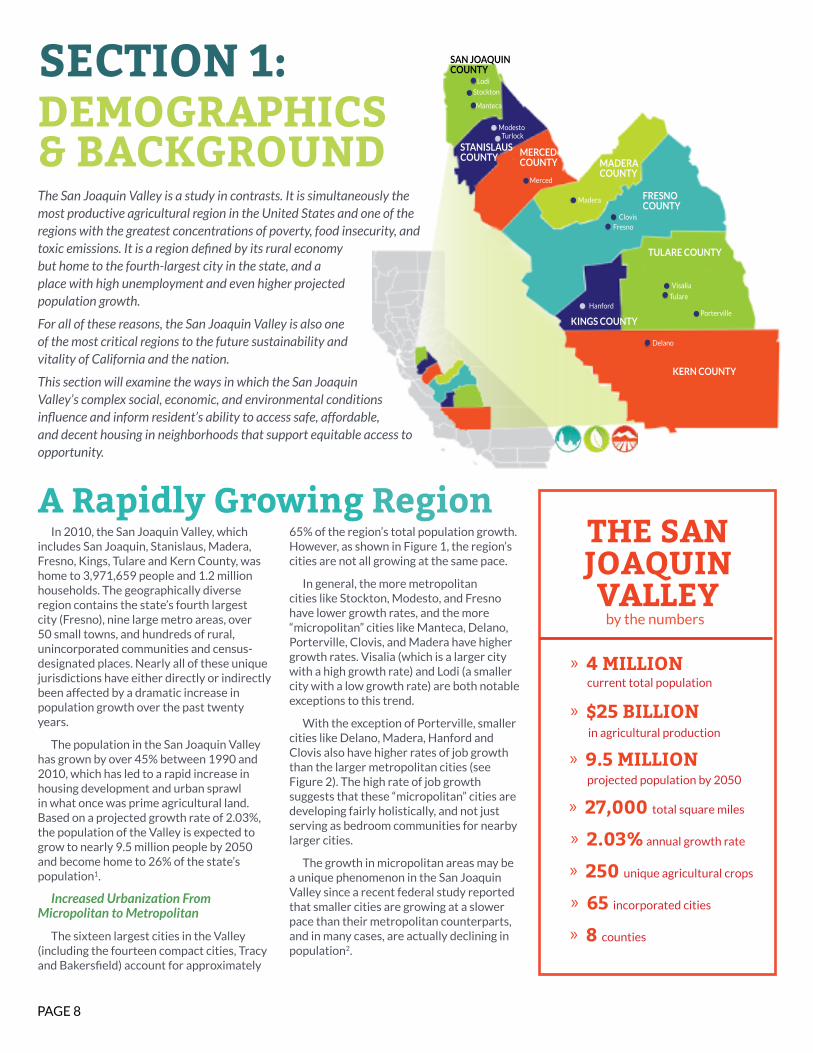
includes San Joaquin, Stanislaus, Madera, Fresno, Kings, Tulare and Kern County, was home to 3,971,659 people and 1.2 million households. The geographically diverse region contains the state’s fourth largest city (Fresno), nine large metro areas, over 50 small towns, and hundreds of rural, unincorporated communities and census-designated places. Nearly all of these unique jurisdictions have either directly or indirectly been affected by a dramatic increase in population growth over the past twenty years.
The population in the San Joaquin Valley has grown by over 45% between 1990 and 2010, which has led to a rapid increase in housing development and urban sprawl in what once was prime agricultural land. Based on a projected growth rate of 2.03%, the population of the Valley is expected to grow to nearly 9.5 million people by 2050 and become home to 26% of the state’s population1.
Increased Urbanization From Micropolitan to Metropolitan
The sixteen largest cities in the Valley (including the fourteen compact cities, Tracy and Bakersfield) account for approximately
65% of the region’s total population growth. However, as shown in Figure 1, the region’s cities are not all growing at the same pace.
In general, the more metropolitan cities like Stockton, Modesto, and Fresno have lower growth rates, and the more “micropolitan” cities like Manteca, Delano, Porterville, Clovis, and Madera have higher growth rates. Visalia (which is a larger city with a high growth rate) and Lodi (a smaller city with a low growth rate) are both notable exceptions to this trend.
With the exception of Porterville, smaller cities like Delano, Madera, Hanford and Clovis also have higher rates of job growth than the larger metropolitan cities (see Figure 2). The high rate of job growth suggests that these “micropolitan” cities are developing fairly holistically, and not just serving as bedroom communities for nearby larger cities.
The growth in micropolitan areas may be a unique phenomenon in the San Joaquin Valley since a recent federal study reported that smaller cities are growing at a slower pace than their metropolitan counterparts, and in many cases, are actually declining in population2.
The San Joaquin Valley is a study in contrasts. It is simultaneously the most productive agricultural region in the United States and one of the regions with the greatest concentrations of poverty, food insecurity, and toxic emissions. It is a region defined by its rural economy but home to the fourth-largest city in the state, and a place with high unemployment and even higher projected population growth.
For all of these reasons, the San Joaquin Valley is also one of the most critical regions to the future sustainability and vitality of California and the nation.
This section will examine the ways in which the San Joaquin Valley’s complex social, economic, and environmental conditions influence and inform resident’s ability to access safe, affordable, and decent housing in neighborhoods that support equitable access to opportunity.
DEMOGRAPHICS & BACKGROUND
THE SAN JOAQUIN VALLEY
by the numbers
SECTION 1:
» 4 MILLION
» 27,000 total square miles
» 9.5 MILLION
» 250 unique agricultural crops
» 65 incorporated cities
» 8 counties
» 2.03% annual growth rate
current total population
projected population by 2050
» $25 BILLION in agricultural production
PAGE 9
297,9
84
203,5
47
127,0
8198
,632
80,79
371
,067
69,73
3
63,30
1
62,62
460
,933
55,02
3
54,32
4
52,42
6
505,8
82
VISA
LIA
DELA
NOHA
NFOR
D
PORT
ERVI
LLE
TULA
REM
ADER
ALO
DI
TURL
OCK
MAN
TECA
MER
CED
FRES
NOST
OCKT
ON
MOD
ESTO
CLOV
IS
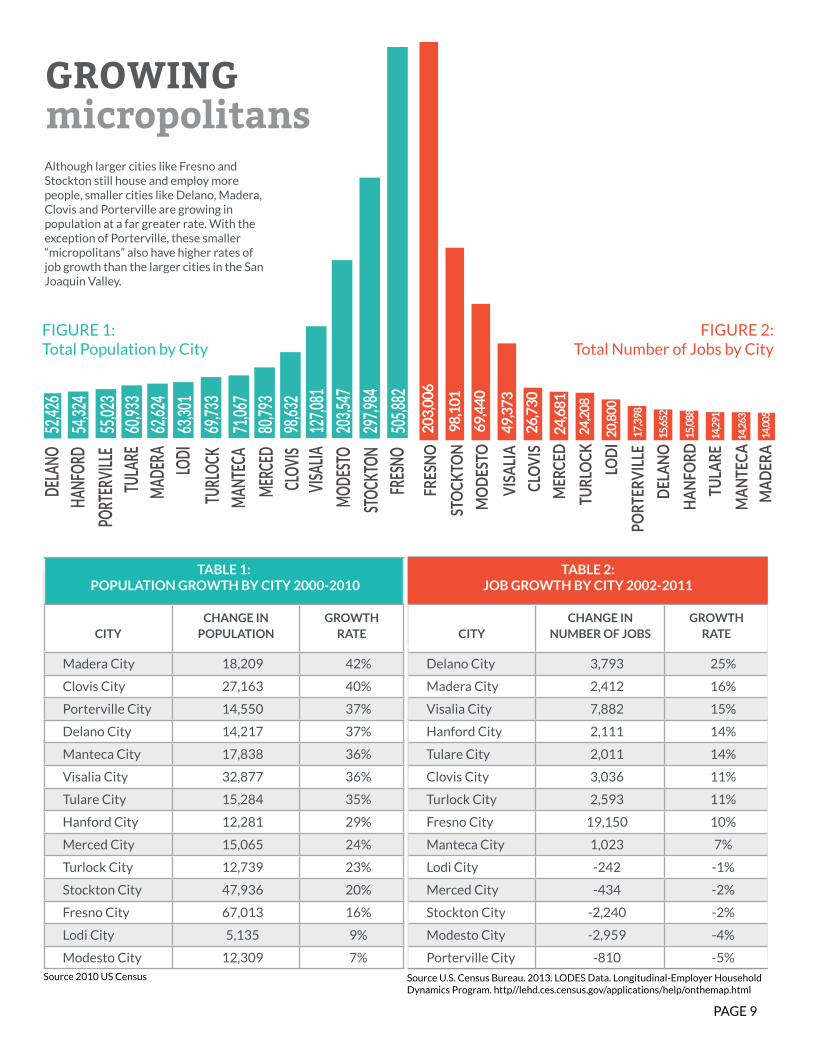
GROWING
TABLE 2:JOB GROWTH BY CITY 2002-2011
CITYCHANGE IN
NUMBER OF JOBSGROWTH
RATE
Delano City 3,793 25%
Madera City 2,412 16%
Visalia City 7,882 15%
Hanford City 2,111 14%
Tulare City 2,011 14%
Clovis City 3,036 11%
Turlock City 2,593 11%
Fresno City 19,150 10%
Manteca City 1,023 7%
Lodi City -242 -1%
Merced City -434 -2%
Stockton City -2,240 -2%
Modesto City -2,959 -4%
Porterville City -810 -5%
TABLE 1: POPULATION GROWTH BY CITY 2000-2010
CITYCHANGE IN
POPULATIONGROWTH
RATE
Madera City 18,209 42%
Clovis City 27,163 40%
Porterville City 14,550 37%
Delano City 14,217 37%
Manteca City 17,838 36%
Visalia City 32,877 36%
Tulare City 15,284 35%
Hanford City 12,281 29%
Merced City 15,065 24%
Turlock City 12,739 23%
Stockton City 47,936 20%
Fresno City 67,013 16%
Lodi City 5,135 9%
Modesto City 12,309 7%
Although larger cities like Fresno and Stockton still house and employ more people, smaller cities like Delano, Madera, Clovis and Porterville are growing in population at a far greater rate. With the exception of Porterville, these smaller “micropolitans” also have higher rates of job growth than the larger cities in the San Joaquin Valley.
98,1
01
203,
006
69,4
40
49,3
73
26,7
30
24,6
81
24,2
08
20,8
00
17,3
98
15,6
52
15,0
88
14,2
91
14,2
63
14,0
05
VIS
ALI
A
DEL
AN
O
HA
NFO
RD
PORT
ERV
ILLE
TULA
RE
MA
DER
A
LOD
I
TURL
OCK
MA
NTE
CA
MER
CED
FRES
NO
STO
CKTO
N
MO
DES
TO
CLO
VIS
FIGURE 1:Total Population by City
FIGURE 2:Total Number of Jobs by City
micropolitans
Source 2010 US Census Source U.S. Census Bureau. 2013. LODES Data. Longitudinal-Employer Household Dynamics Program. http//lehd.ces.census.gov/applications/help/onthemap.html
PAGE 10
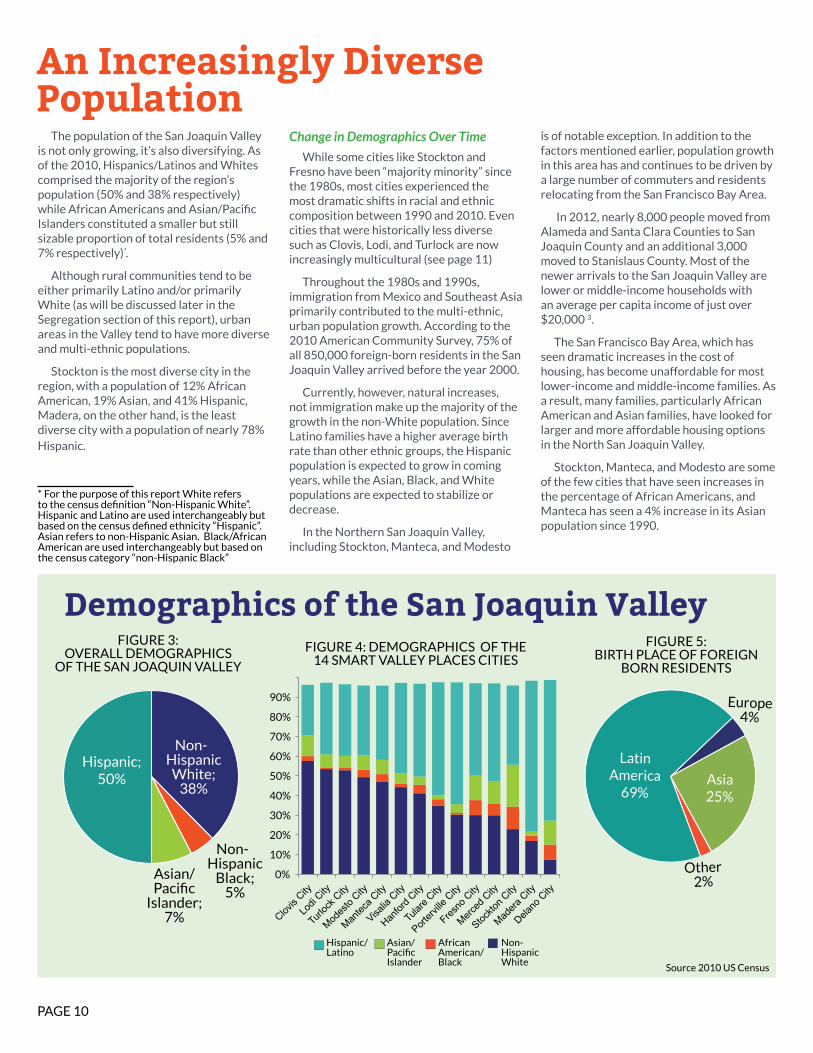
An Increasingly Diverse Population
The population of the San Joaquin Valley is not only growing, it’s also diversifying. As of the 2010, Hispanics/Latinos and Whites comprised the majority of the region’s population (50% and 38% respectively) while African Americans and Asian/Pacific Islanders constituted a smaller but still sizable proportion of total residents (5% and 7% respectively)*.
Although rural communities tend to be either primarily Latino and/or primarily White (as will be discussed later in the Segregation section of this report), urban areas in the Valley tend to have more diverse and multi-ethnic populations.
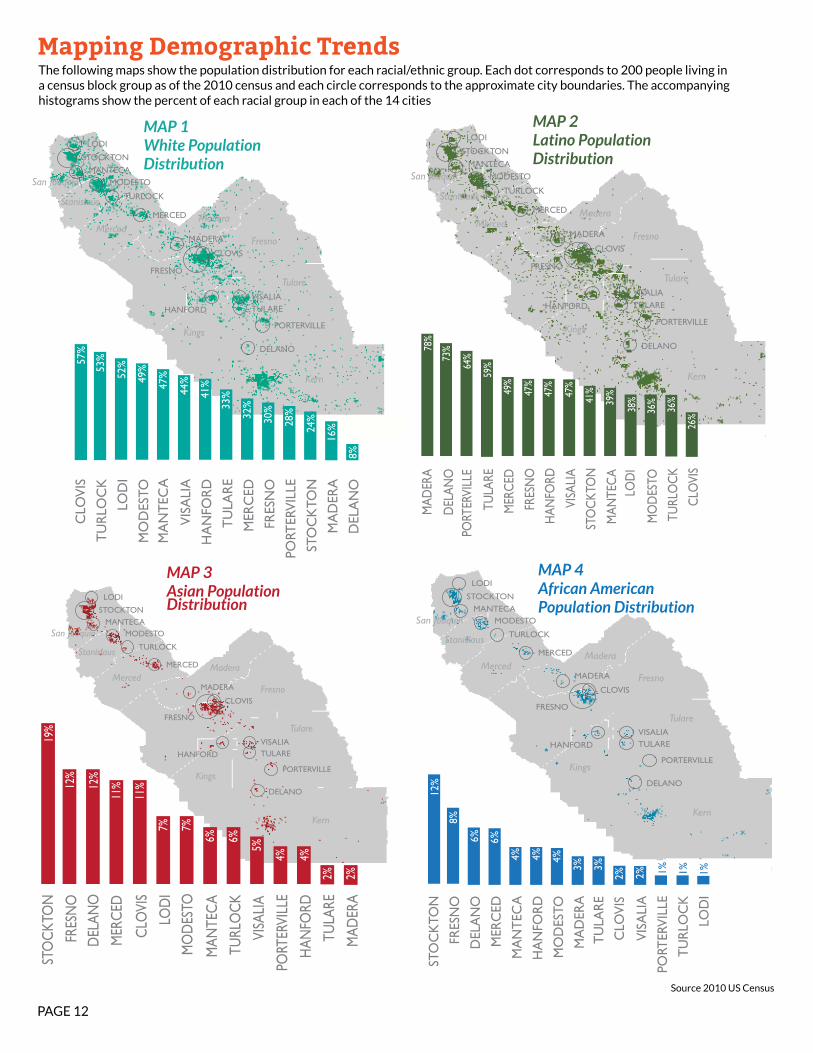
Stockton is the most diverse city in the region, with a population of 12% African American, 19% Asian, and 41% Hispanic, Madera, on the other hand, is the least diverse city with a population of nearly 78% Hispanic.
* For the purpose of this report White refers to the census definition “Non-Hispanic White”. Hispanic and Latino are used interchangeably but based on the census defined ethnicity “Hispanic”. Asian refers to non-Hispanic Asian. Black/African American are used interchangeably but based on the census category “non-Hispanic Black”
Change in Demographics Over Time
While some cities like Stockton and Fresno have been “majority minority” since the 1980s, most cities experienced the most dramatic shifts in racial and ethnic composition between 1990 and 2010. Even cities that were historically less diverse such as Clovis, Lodi, and Turlock are now increasingly multicultural (see page 11)
Throughout the 1980s and 1990s, immigration from Mexico and Southeast Asia primarily contributed to the multi-ethnic, urban population growth. According to the 2010 American Community Survey, 75% of all 850,000 foreign-born residents in the San Joaquin Valley arrived before the year 2000.
Currently, however, natural increases, not immigration make up the majority of the growth in the non-White population. Since Latino families have a higher average birth rate than other ethnic groups, the Hispanic population is expected to grow in coming years, while the Asian, Black, and White populations are expected to stabilize or decrease.
In the Northern San Joaquin Valley, including Stockton, Manteca, and Modesto
is of notable exception. In addition to the factors mentioned earlier, population growth in this area has and continues to be driven by a large number of commuters and residents relocating from the San Francisco Bay Area.
In 2012, nearly 8,000 people moved from Alameda and Santa Clara Counties to San Joaquin County and an additional 3,000 moved to Stanislaus County. Most of the newer arrivals to the San Joaquin Valley are lower or middle-income households with an average per capita income of just over $20,000 3.
The San Francisco Bay Area, which has seen dramatic increases in the cost of housing, has become unaffordable for most lower-income and middle-income families. As a result, many families, particularly African American and Asian families, have looked for larger and more affordable housing options in the North San Joaquin Valley.
Stockton, Manteca, and Modesto are some of the few cities that have seen increases in the percentage of African Americans, and Manteca has seen a 4% increase in its Asian population since 1990.
0%
10%
20%
30%
40%
50%
60%
70%
80%
90%
Clovis
City
Lodi
City
Turlo
ck C
ity
Modes
to City
Mantec
a City
Visalia
City
Hanfor
d City
Tular
e City
Porterv
ille C
ity
Fresno
City
Merced
City
Stockto
n City
Madera
City
Delano
City
Hispanic/Latino
Asian/Pacific Islander
AfricanAmerican/Black
Non-HispanicWhite
FIGURE 5:BIRTH PLACE OF FOREIGN
BORN RESIDENTS
FIGURE 4: DEMOGRAPHICS OF THE 14 SMART VALLEY PLACES CITIES
Demographics of the San Joaquin Valley
Hispanic; 50%
Non-Hispanic
White; 38%
Non-Hispanic
Black;5%
Asian/Pacific
Islander;7%
Non-
Hispanic
White;
38%
Other 2%
Europe4%
Latin America
69%Asia25%
FIGURE 3:OVERALL DEMOGRAPHICS
OF THE SAN JOAQUIN VALLEY
Source 2010 US Census
PAGE 11
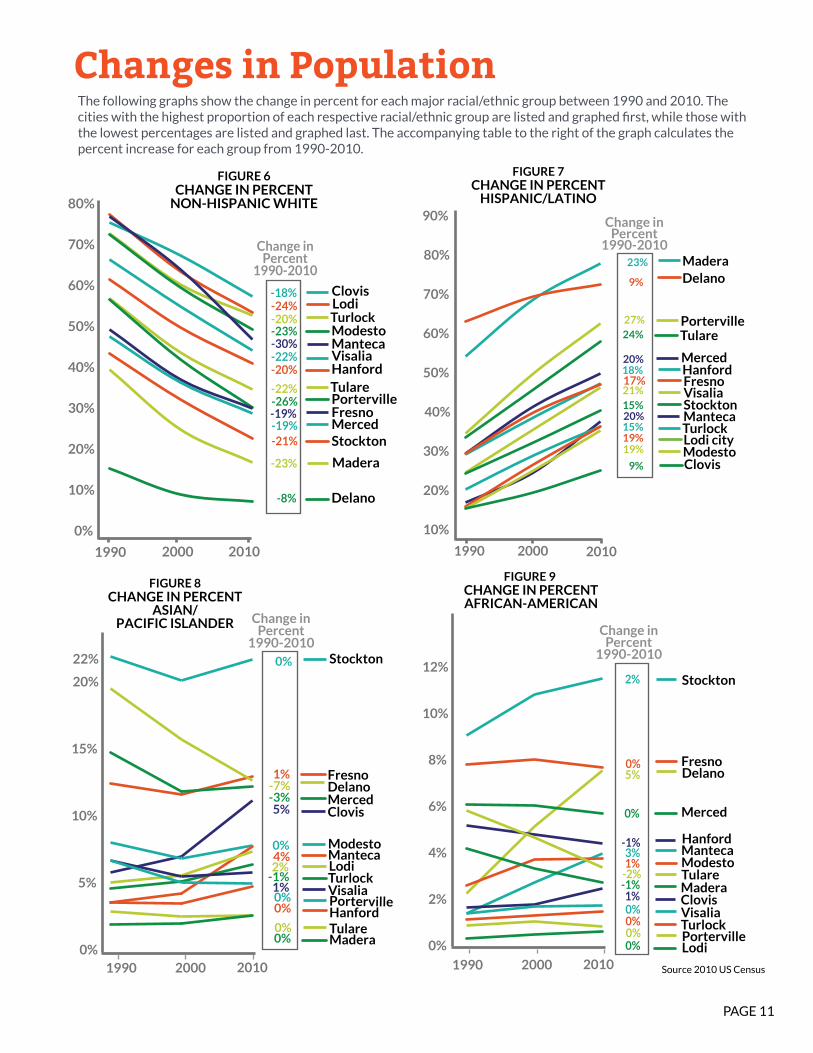
Changes in Population
10%
20%
30%
40%
50%
60%
70%
80%
90%
Madera Delano
Porterville Tulare
Merced Hanford Fresno Visalia Stockton Manteca Turlock Lodi city Modesto Clovis
1990 2000 2010
9%
23%
9%
27%24%
20%18%17%21%15%
15%19%19%
20%
Change in Percent
1990-2010
CHANGE IN PERCENTHISPANIC/LATINO
FIGURE 7
1990 2000 2010 0%
5%
10%
15%
20%
22% Stockton
Fresno Delano Merced Clovis
Modesto Manteca Lodi Turlock Visalia Porterville Hanford Tulare Madera 0%
0%
1%-7%-3%5%
0%4%2%
-1%
0%0%
0%
1%
Change in Percent
1990-2010
CHANGE IN PERCENTASIAN/
PACIFIC ISLANDER
FIGURE 8
Stockton
Fresno Delano
Merced
Hanford Manteca Modesto Tulare Madera Clovis Visalia Turlock Porterville Lodi 0%
2%
0%5%
0%
-1%3%1%
-2%-1%
0%0%0%
1%
Change in Percent
1990-2010
0%
2%
4%
6%
8%
10%
12%
1990 2000 2010
CHANGE IN PERCENTAFRICAN-AMERICAN
FIGURE 9
The following graphs show the change in percent for each major racial/ethnic group between 1990 and 2010. The cities with the highest proportion of each respective racial/ethnic group are listed and graphed first, while those with the lowest percentages are listed and graphed last. The accompanying table to the right of the graph calculates the percent increase for each group from 1990-2010.
0%
10%
20%
30%
40%
50%
60%
70%
80%
1990 2000 2010
Clovis Lodi Turlock Modesto Manteca Visalia Hanford Tulare Porterville Fresno Merced Stockton
Madera
Delano -8%
-18%-24%-20%-23%-30%-22%-20%
-22%-26%
-19%-21%
-23%
-19%
Change in Percent
1990-2010
CHANGE IN PERCENT NON-HISPANIC WHITE
FIGURE 6
Source 2010 US Census
PAGE 12
TULARE
LODI
STOCKTONMANTECA
MODESTO
TURLOCK
MERCED
MADERA
CLOVIS
FRESNO
DELANO
PORTERVILLE
HANFORDVISALIA
Kern
Tulare
Kings
Fresno
MaderaMerced
Stanislaus
San Joaquin
TULARE
LODI
STOCKTONMANTECA
MODESTO
TURLOCK
MERCED
MADERA
CLOVIS
FRESNO
DELANO
PORTERVILLE
HANFORD
VISALIA
Kern
Tulare
Kings
Fresno
MaderaMerced
Stanislaus
San Joaquin
TULARE
LODI
STOCKTONMANTECA
MODESTO
TURLOCK
MERCED
MADERA
CLOVIS
FRESNO
DELANO
PORTERVILLE
HANFORDVISALIA
Kern
Tulare
Kings
Fresno
MaderaMerced
Stanislaus
San Joaquin
VISA
LIA
STO
CK
TON
FRES
NO
DEL
AN
OM
ERC
EDM
AN
TEC
AH
AN
FORD
MO
DES
TOM
AD
ERA
CLO
VIS
LOD
ITU
RLO
CK
PORT
ERVI
LLE
TULA
RE
12%
8%
6% 6%
4% 4% 4%
3% 3%
2% 2% 1% 1% 1%
Mapping Demographic Trends The following maps show the population distribution for each racial/ethnic group. Each dot corresponds to 200 people living in a census block group as of the 2010 census and each circle corresponds to the approximate city boundaries. The accompanying histograms show the percent of each racial group in each of the 14 cities
TURL
OCK
MAD
ERA
PORT
ERVI
LLE
DEL
ANO
TULA
REM
ERCE
D
VISA
LIA
HAN
FORD
FRES
NO
STO
CKTO
N
CLO
VIS
LOD
IM
ANTE
CA
MO
DES
TO
78%
73%
64%
59%
49%
47%
47%
47%
41%
39%
38%
36%
36%
26%
TULARE
LODI
STOCKTONMANTECA
MODESTO
TURLOCK
MERCED
MADERA
CLOVIS
FRESNO
DELANO
PORTERVILLE
HANFORDVISALIA
Kern
Tulare
Kings
Fresno
MaderaMerced
Stanislaus
San Joaquin
18%
12%
11%
10%
8%
6%
PORT
ERVI
LLE
STO
CKTO
NFR
ESN
O
MER
CED
DEL
ANO
CLO
VIS
LOD
I
MAN
TEC
A
MO
DES
TO
TURL
OCK
MAD
ERA
TULA
REH
ANFO
RD
VISA
LIA
19%
12%
12%
11%
11%
7% 7%
6% 6%
5%
4% 4%
2% 2%
MAP 3Asian Population Distribution
MAP 4African American Population Distribution
MAP 2Latino Population Distribution
MAP 1White Population Distribution
53%57
%
52%
49%
47%
44%
41%
33%
32%
30%
28%
24%
16%
8%
PORT
ERVI
LLE
CLO
VIS
TURL
OC
KLO
DI
MA
NTE
CA
MO
DES
TO
VISA
LIA
HA
NFO
RDTU
LARE
MER
CED
DEL
AN
OM
AD
ERA
STO
CK
TON
FRES
NO
Source 2010 US Census
PAGE 13
The San Joaquin Valley faces broad challenges related to economic development and economic growth. As mentioned earlier, the leading industries in the region include agriculture, manufacturing, warehousing, construction, and oil and gas production. These industries typically employ a higher percentage of low-income and less educated employees, and most have significant workplace hazards and unstable or seasonal employment needs.
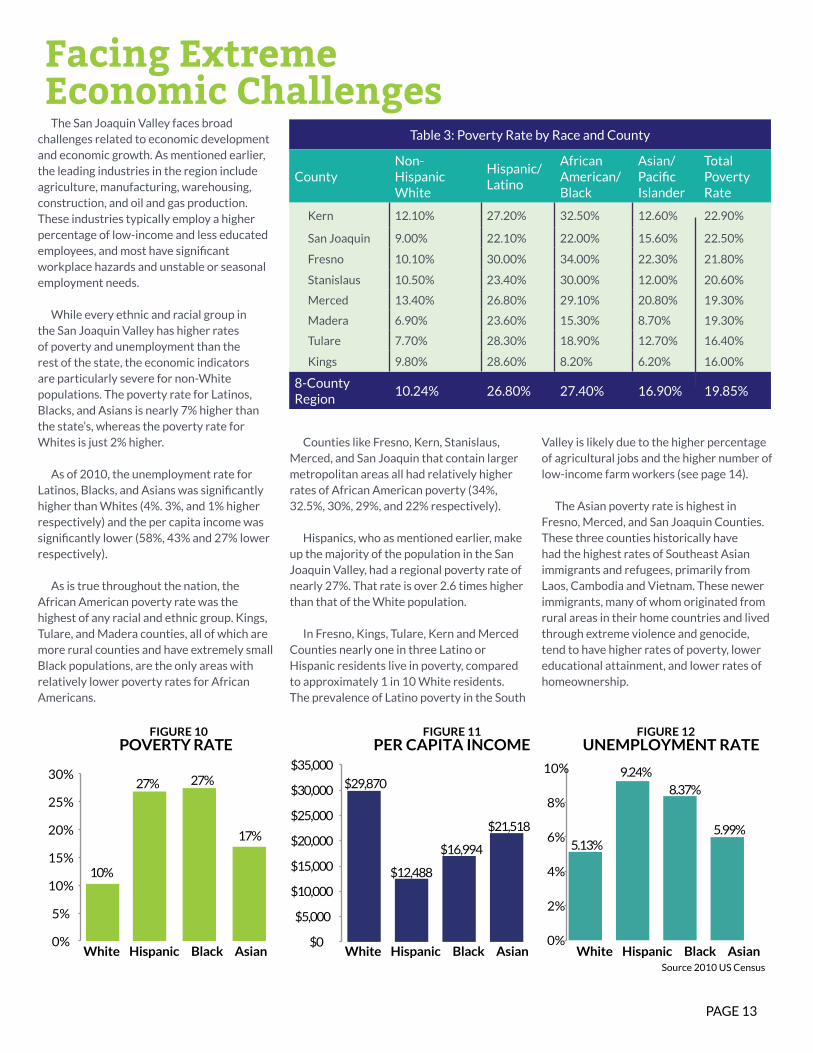
While every ethnic and racial group in the San Joaquin Valley has higher rates of poverty and unemployment than the rest of the state, the economic indicators are particularly severe for non-White populations. The poverty rate for Latinos, Blacks, and Asians is nearly 7% higher than the state’s, whereas the poverty rate for Whites is just 2% higher.
As of 2010, the unemployment rate for Latinos, Blacks, and Asians was significantly higher than Whites (4%. 3%, and 1% higher respectively) and the per capita income was significantly lower (58%, 43% and 27% lower respectively).
As is true throughout the nation, the African American poverty rate was the highest of any racial and ethnic group. Kings, Tulare, and Madera counties, all of which are more rural counties and have extremely small Black populations, are the only areas with relatively lower poverty rates for African Americans.
Counties like Fresno, Kern, Stanislaus, Merced, and San Joaquin that contain larger metropolitan areas all had relatively higher rates of African American poverty (34%, 32.5%, 30%, 29%, and 22% respectively).
Hispanics, who as mentioned earlier, make up the majority of the population in the San Joaquin Valley, had a regional poverty rate of nearly 27%. That rate is over 2.6 times higher than that of the White population.
In Fresno, Kings, Tulare, Kern and Merced Counties nearly one in three Latino or Hispanic residents live in poverty, compared to approximately 1 in 10 White residents. The prevalence of Latino poverty in the South
Valley is likely due to the higher percentage of agricultural jobs and the higher number of low-income farm workers (see page 14).
The Asian poverty rate is highest in Fresno, Merced, and San Joaquin Counties. These three counties historically have had the highest rates of Southeast Asian immigrants and refugees, primarily from Laos, Cambodia and Vietnam. These newer immigrants, many of whom originated from rural areas in their home countries and lived through extreme violence and genocide, tend to have higher rates of poverty, lower educational attainment, and lower rates of homeownership.
Facing Extreme Economic Challenges
Table 3: Poverty Rate by Race and County
County Non-Hispanic White
Hispanic/ Latino
African American/ Black
Asian/Pacific Islander
Total Poverty Rate
Kern 12.10% 27.20% 32.50% 12.60% 22.90%
San Joaquin 9.00% 22.10% 22.00% 15.60% 22.50%
Fresno 10.10% 30.00% 34.00% 22.30% 21.80%
Stanislaus 10.50% 23.40% 30.00% 12.00% 20.60%
Merced 13.40% 26.80% 29.10% 20.80% 19.30%
Madera 6.90% 23.60% 15.30% 8.70% 19.30%
Tulare 7.70% 28.30% 18.90% 12.70% 16.40%
Kings 9.80% 28.60% 8.20% 6.20% 16.00%
8-County Region
10.24% 26.80% 27.40% 16.90% 19.85%
27%
10%
0%
5%
10%
15%
20%
25%
30%
POVERTY RATE
$12,488
$16,994
$21,518
$0
$5,000
$10,000
$15,000
$20,000
$25,000
$30,000
$35,000
PER CAPITA INCOME
0%
2%
4%
6%
8%
10%
UNEMPLOYMENT RATE
White Hispanic Black
Asian White Hispanic Black
Asian White Hispanic Black
Asian
$29,870 9.24%
27%
5.99%
8.37%
5.13%
FIGURE 10 FIGURE 11 FIGURE 12
17%
Source 2010 US Census
PAGE 14
Home to Particularly Vulnerable Populations
Farm workers, Foreign Born, and Linguistically Isolated Populations
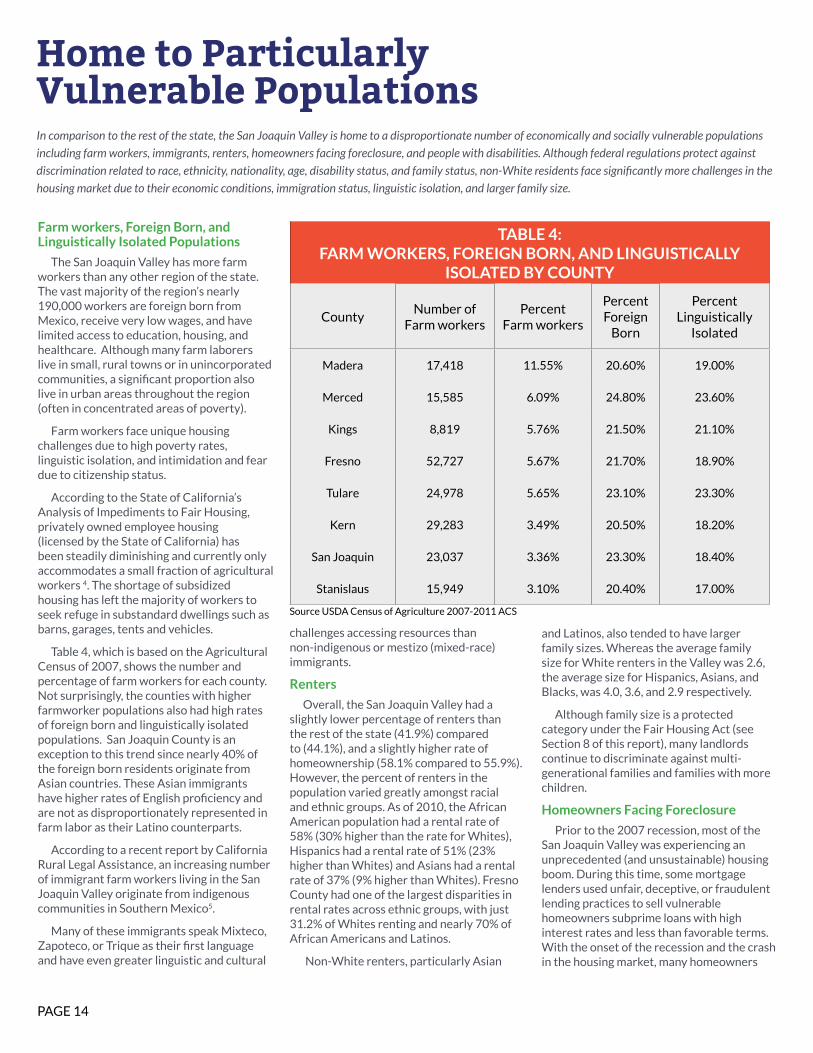
The San Joaquin Valley has more farm workers than any other region of the state. The vast majority of the region’s nearly 190,000 workers are foreign born from Mexico, receive very low wages, and have limited access to education, housing, and healthcare. Although many farm laborers live in small, rural towns or in unincorporated communities, a significant proportion also live in urban areas throughout the region (often in concentrated areas of poverty).
Farm workers face unique housing challenges due to high poverty rates, linguistic isolation, and intimidation and fear due to citizenship status.
According to the State of California’s Analysis of Impediments to Fair Housing, privately owned employee housing (licensed by the State of California) has been steadily diminishing and currently only accommodates a small fraction of agricultural workers 4. The shortage of subsidized housing has left the majority of workers to seek refuge in substandard dwellings such as barns, garages, tents and vehicles.
Table 4, which is based on the Agricultural Census of 2007, shows the number and percentage of farm workers for each county. Not surprisingly, the counties with higher farmworker populations also had high rates of foreign born and linguistically isolated populations. San Joaquin County is an exception to this trend since nearly 40% of the foreign born residents originate from Asian countries. These Asian immigrants have higher rates of English proficiency and are not as disproportionately represented in farm labor as their Latino counterparts.
According to a recent report by California Rural Legal Assistance, an increasing number of immigrant farm workers living in the San Joaquin Valley originate from indigenous communities in Southern Mexico5.
Many of these immigrants speak Mixteco, Zapoteco, or Trique as their first language and have even greater linguistic and cultural
challenges accessing resources than non-indigenous or mestizo (mixed-race)immigrants.
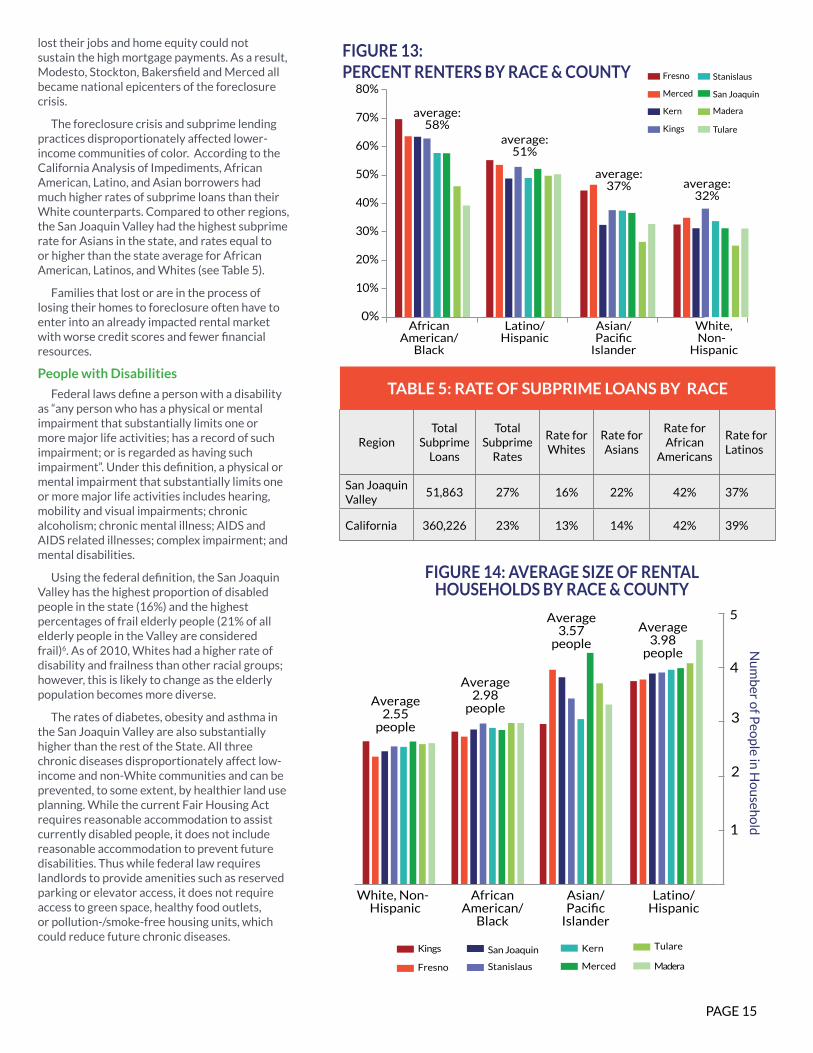
Renters
Overall, the San Joaquin Valley had a slightly lower percentage of renters than the rest of the state (41.9%) compared to (44.1%), and a slightly higher rate of homeownership (58.1% compared to 55.9%). However, the percent of renters in the population varied greatly amongst racial and ethnic groups. As of 2010, the African American population had a rental rate of 58% (30% higher than the rate for Whites), Hispanics had a rental rate of 51% (23% higher than Whites) and Asians had a rental rate of 37% (9% higher than Whites). Fresno County had one of the largest disparities in rental rates across ethnic groups, with just 31.2% of Whites renting and nearly 70% of African Americans and Latinos.
Non-White renters, particularly Asian
and Latinos, also tended to have larger family sizes. Whereas the average family size for White renters in the Valley was 2.6, the average size for Hispanics, Asians, and Blacks, was 4.0, 3.6, and 2.9 respectively.
Although family size is a protected category under the Fair Housing Act (see Section 8 of this report), many landlords continue to discriminate against multi-generational families and families with more children.
Homeowners Facing Foreclosure
Prior to the 2007 recession, most of the San Joaquin Valley was experiencing an unprecedented (and unsustainable) housing boom. During this time, some mortgage lenders used unfair, deceptive, or fraudulent lending practices to sell vulnerable homeowners subprime loans with high interest rates and less than favorable terms. With the onset of the recession and the crash in the housing market, many homeowners
TABLE 4:FARM WORKERS, FOREIGN BORN, AND LINGUISTICALLY
ISOLATED BY COUNTY
County Number of
Farm workersPercent
Farm workers
Percent Foreign
Born
Percent Linguistically
Isolated
Madera 17,418 11.55% 20.60% 19.00%
Merced 15,585 6.09% 24.80% 23.60%
Kings 8,819 5.76% 21.50% 21.10%
Fresno 52,727 5.67% 21.70% 18.90%
Tulare 24,978 5.65% 23.10% 23.30%
Kern 29,283 3.49% 20.50% 18.20%
San Joaquin 23,037 3.36% 23.30% 18.40%
Stanislaus 15,949 3.10% 20.40% 17.00%
In comparison to the rest of the state, the San Joaquin Valley is home to a disproportionate number of economically and socially vulnerable populations
including farm workers, immigrants, renters, homeowners facing foreclosure, and people with disabilities. Although federal regulations protect against
discrimination related to race, ethnicity, nationality, age, disability status, and family status, non-White residents face significantly more challenges in the
housing market due to their economic conditions, immigration status, linguistic isolation, and larger family size.
Source USDA Census of Agriculture 2007-2011 ACS
PAGE 15
lost their jobs and home equity could not sustain the high mortgage payments. As a result, Modesto, Stockton, Bakersfield and Merced all became national epicenters of the foreclosure crisis.
The foreclosure crisis and subprime lending practices disproportionately affected lower-income communities of color. According to the California Analysis of Impediments, African American, Latino, and Asian borrowers had much higher rates of subprime loans than their White counterparts. Compared to other regions, the San Joaquin Valley had the highest subprime rate for Asians in the state, and rates equal to or higher than the state average for African American, Latinos, and Whites (see Table 5).
Families that lost or are in the process of losing their homes to foreclosure often have to enter into an already impacted rental market with worse credit scores and fewer financial resources.
People with Disabilities
Federal laws define a person with a disability as “any person who has a physical or mental impairment that substantially limits one or more major life activities; has a record of such impairment; or is regarded as having such impairment”. Under this definition, a physical or mental impairment that substantially limits one or more major life activities includes hearing, mobility and visual impairments; chronic alcoholism; chronic mental illness; AIDS and AIDS related illnesses; complex impairment; and mental disabilities.
Using the federal definition, the San Joaquin Valley has the highest proportion of disabled people in the state (16%) and the highest percentages of frail elderly people (21% of all elderly people in the Valley are considered frail)6. As of 2010, Whites had a higher rate of disability and frailness than other racial groups; however, this is likely to change as the elderly population becomes more diverse.
The rates of diabetes, obesity and asthma in the San Joaquin Valley are also substantially higher than the rest of the State. All three chronic diseases disproportionately affect low-income and non-White communities and can be prevented, to some extent, by healthier land use planning. While the current Fair Housing Act requires reasonable accommodation to assist currently disabled people, it does not include reasonable accommodation to prevent future disabilities. Thus while federal law requires landlords to provide amenities such as reserved parking or elevator access, it does not require access to green space, healthy food outlets, or pollution-/smoke-free housing units, which could reduce future chronic diseases.
TABLE 5: RATE OF SUBPRIME LOANS BY RACE
RegionTotal
Subprime Loans
Total Subprime
Rates
Rate for Whites
Rate for Asians
Rate for African
Americans
Rate for Latinos
San Joaquin Valley
51,863 27% 16% 22% 42% 37%
California 360,226 23% 13% 14% 42% 39%
0%
10%
20%
30%
40%
50%
60%
70%
80%Fresno
Merced
Kern
Kings
Stanislaus
San Joaquin
Madera
Tulare
average:58%
AfricanAmerican/
Black
Latino/Hispanic
Asian/Pacific
Islander
White, Non-
Hispanic
average:51%
average:37% average:
32%
FIGURE 13:PERCENT RENTERS BY RACE & COUNTY
FIGURE 14: AVERAGE SIZE OF RENTAL HOUSEHOLDS BY RACE & COUNTY
Average3.98
people
Average3.57
people
Average2.98
peopleAverage
2.55people
5
4
3
2
1
Kings
Fresno
San Joaquin
Stanislaus
Kern
Merced
Tulare
Madera
AfricanAmerican/
Black
Latino/Hispanic
Asian/Pacific
Islander
White, Non-Hispanic
Nu
mb
er of P
eop
le in H
ou
seho
ld
PAGE 16
The Homeless Population
The homeless population is arguably the most vulnerable segment of the community. Chronically homeless people have high rates of physical and mental illness, high rates of communicable diseases such as Hepatitis C and HIV, and high rates of imprisonment and incarceration.
Various studies show that providing permanent, affordable, and supportive housing is the most cost effective way to prevent homelessness and avoid the subsequent strains on the public health and judicial systems.
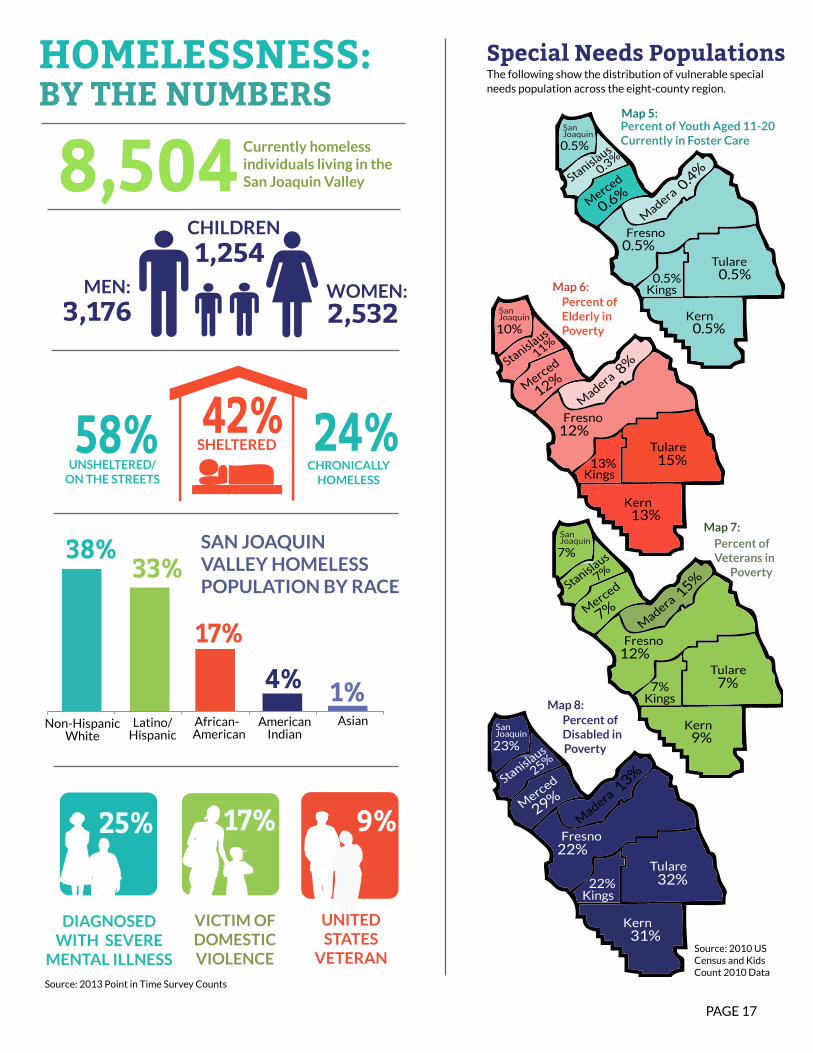
According to the 2013 Point in Time Homeless Census, there are over 8,500 homeless in the San Joaquin Valley, of which 58% are unsheltered and living on the streets. Fresno and Merced counties, which both have unsheltered homeless populations exceeding 80%, have among the highest rates in the nation.
African-Americans and Native Americans are the most overrepresented racial groups within the homeless population. Although African Americans make up just 5% of the region’s population, they constitute 17% of the homeless. Similarly, Native Americans comprise less than 1% of the total population, but represent 4% of the homeless.
Latinos and Asians, on the other hand, are both underrepresented amongst the homeless. Latinos comprise over 50% of the region’s population, but only 33% of the homeless. Likewise, Asians make up 7% of the Valley’s total population but just 1% of the homeless.
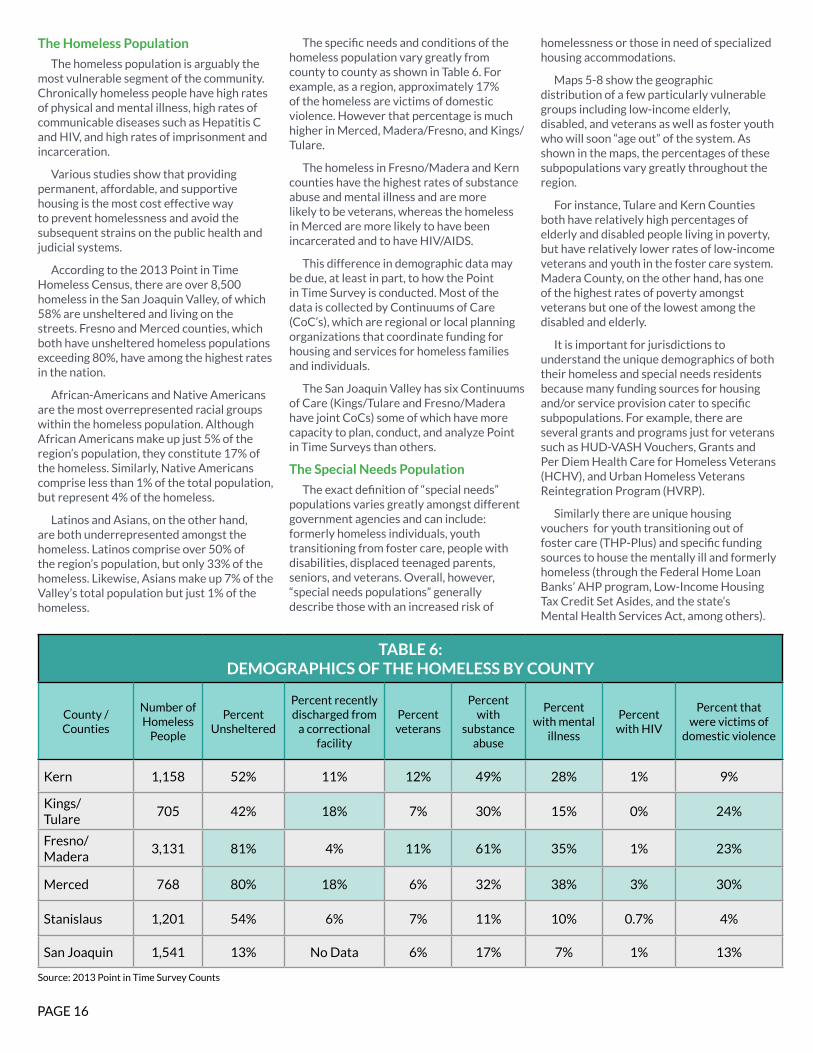
The specific needs and conditions of the homeless population vary greatly from county to county as shown in Table 6. For example, as a region, approximately 17% of the homeless are victims of domestic violence. However that percentage is much higher in Merced, Madera/Fresno, and Kings/Tulare.
The homeless in Fresno/Madera and Kern counties have the highest rates of substance abuse and mental illness and are more likely to be veterans, whereas the homeless in Merced are more likely to have been incarcerated and to have HIV/AIDS.
This difference in demographic data may be due, at least in part, to how the Point in Time Survey is conducted. Most of the data is collected by Continuums of Care (CoC’s), which are regional or local planning organizations that coordinate funding for housing and services for homeless families and individuals.
The San Joaquin Valley has six Continuums of Care (Kings/Tulare and Fresno/Madera have joint CoCs) some of which have more capacity to plan, conduct, and analyze Point in Time Surveys than others.
The Special Needs Population
The exact definition of “special needs” populations varies greatly amongst different government agencies and can include: formerly homeless individuals, youth transitioning from foster care, people with disabilities, displaced teenaged parents, seniors, and veterans. Overall, however, “special needs populations” generally describe those with an increased risk of
homelessness or those in need of specialized housing accommodations.
Maps 5-8 show the geographic distribution of a few particularly vulnerable groups including low-income elderly, disabled, and veterans as well as foster youth who will soon “age out” of the system. As shown in the maps, the percentages of these subpopulations vary greatly throughout the region.
For instance, Tulare and Kern Counties both have relatively high percentages of elderly and disabled people living in poverty, but have relatively lower rates of low-income veterans and youth in the foster care system. Madera County, on the other hand, has one of the highest rates of poverty amongst veterans but one of the lowest among the disabled and elderly.
It is important for jurisdictions to understand the unique demographics of both their homeless and special needs residents because many funding sources for housing and/or service provision cater to specific subpopulations. For example, there are several grants and programs just for veterans such as HUD-VASH Vouchers, Grants and Per Diem Health Care for Homeless Veterans (HCHV), and Urban Homeless Veterans Reintegration Program (HVRP).
Similarly there are unique housing vouchers for youth transitioning out of foster care (THP-Plus) and specific funding sources to house the mentally ill and formerly homeless (through the Federal Home Loan Banks’ AHP program, Low-Income Housing Tax Credit Set Asides, and the state’s Mental Health Services Act, among others).
Source: 2013 Point in Time Survey Counts
TABLE 6:DEMOGRAPHICS OF THE HOMELESS BY COUNTY
County /Counties
Number of Homeless
People
Percent Unsheltered
Percent recently discharged from
a correctional facility
Percent veterans
Percent with
substance abuse
Percent with mental
illness
Percent with HIV
Percent that were victims of
domestic violence
Kern 1,158 52% 11% 12% 49% 28% 1% 9%
Kings/Tulare
705 42% 18% 7% 30% 15% 0% 24%
Fresno/Madera
3,131 81% 4% 11% 61% 35% 1% 23%
Merced 768 80% 18% 6% 32% 38% 3% 30%
Stanislaus 1,201 54% 6% 7% 11% 10% 0.7% 4%
San Joaquin 1,541 13% No Data 6% 17% 7% 1% 13%
PAGE 17
Non-Hispanic White
Latino/Hispanic
African-American
American Indian
Asian
HOMELESSNESS:BY THE NUMBERS
Special Needs Populations
Fresno
Merced
Kern
Madera
Tulare
Kings
San Joaquin
Stanislaus0.5%
0.5%
0.5%
0.5%
0.4%0.3%
0.6%
0.5%
Fresno
Merced
Kern
Madera
Tulare
Kings
San Joaquin
7%
9%
7%
12%
15%7%
7%
7%
Stanislaus
Fresno
Merced
Kern
Madera
Tulare
Kings
San Joaquin
23%
31%
32%
22%
13%25%
29%
22%
Stanislaus
Fresno
Merced
Kern
Madera
Tulare
Kings
San Joaquin
10%
13%
15%
12%
8%11%
12%
13%
Stanislaus
Percent of Youth Aged 11-20Currently in Foster Care
Percent of Veterans in
Poverty
Map 5:
Map 7:
Map 6:
Map 8:
The following show the distribution of vulnerable special needs population across the eight-county region.
Percent of Elderly in Poverty
Percent of Disabled in Poverty
38%
4% 1%
17%
33%
3,176 2,532
24%58%
1,254
Currently homeless individuals living in the San Joaquin Valley
SAN JOAQUIN VALLEY HOMELESS POPULATION BY RACE
CHRONICALLY HOMELESS
UNSHELTERED/ ON THE STREETS
WOMEN:MEN:
CHILDREN
VICTIM OF DOMESTIC VIOLENCE
DIAGNOSED WITH SEVERE
MENTAL ILLNESS
UNITED STATES
VETERAN
17%25% 9%
8,504
42% SHELTERED
Source: 2013 Point in Time Survey Counts
Source: 2010 US Census and Kids Count 2010 Data
PAGE 18
What Major Changes May Alter the Context of the Region?
Increased Resources for Affordable Housing and Community Development
The economic collapse of 2008 and the subsequent foreclosure crisis, severely impacted local jurisdictions’ projected tax revenues resulting in layoffs, decreases in employee benefits, and cuts to much needed programs and services. For instance, from 2005-2011 Merced reported a loss in the general fund of $5.29 million, Visalia reported having to cut its budget by over $10 million, and perhaps most famously, Stockton declared bankruptcy.
To make matters worse, in 2011, the State of California dissolved redevelopment agencies and (for the most part) the ability of local jurisdictions to use tax increment financing for economic and housing development. Although many jurisdictions throughout the State infamously misused redevelopment funds, for most cities, redevelopment financing was one of the largest and more significant revenue sources for affordable housing.
There are currently a few bills in the State legislature that would reinstate some form of tax-increment financing for the purposes of economic and community development. Furthermore, in the California 2014 Budget, Governor Jerry Brown proposed expanding Infrastructure Finance Districts District (IFDs) to allow for more affordable housing financing. Yet, the extent of money that “Redevelopment 2.0” or IFD reform could actually contribute to affordable housing production is still questionable.
Upsurge in Displaced Bay Area Residents
Unless the San Francisco Bay Area finds a way to better accommodate all of its workers, the North Valley (particularly San Joaquin County) will likely continue to see an influx of commuters and displaced residents from Alameda and Santa Clara counties.
As mentioned previously, San Francisco, Silicon Valley, and the surrounding areas have witnessed an upsurge in housing prices primarily as a result of the increase in high-income technology jobs and the shortage of housing stock. For many families, particularly those working in lower-wage sectors, San Joaquin and Stanislaus County offer more affordable alternatives to the Bay Area (even accounting for long commute times and increased gasoline cost).
An Increase in Sustainable Planning, Infill Development, and Reinvestment in the Urban Core
In 2006, eight Regional Transportation and Planning Agencies representing the eight counties within the San Joaquin Valley came together to develop a long-term regional growth strategy entitled The San Joaquin Blueprint. The Blueprint suggests a higher target density for new residential development and advocates for more walkable communities, more inclusive community collaboration, greater access to transit, and more infill development.
As part of the Sustainable Communities Grant, all fourteen jurisdictions developed projects and plans to achieve these Blueprint goals. Through Climate Action Plans, General
Plan updates, Bicycle and Pedestrian Master Plans, and other land use planning documents, the fourteen grantees took concrete steps towards building healthier, more sustainable communities for years to come.
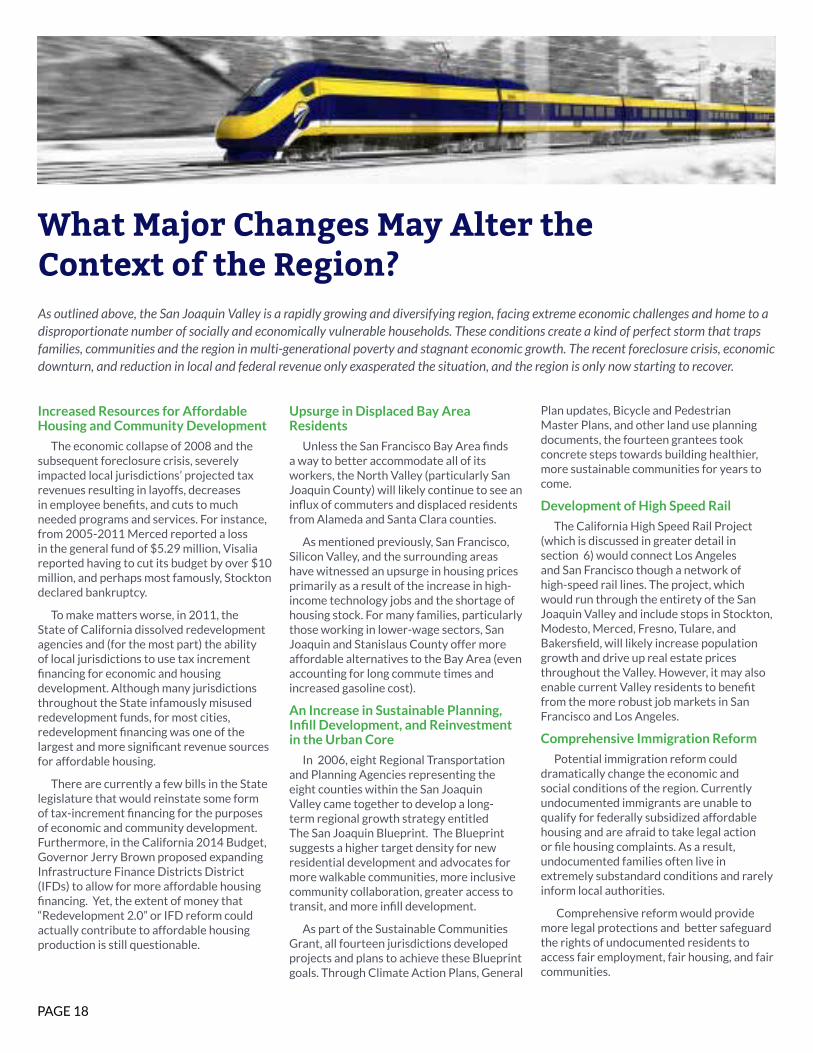
Development of High Speed Rail
The California High Speed Rail Project (which is discussed in greater detail in section 6) would connect Los Angeles and San Francisco though a network of high-speed rail lines. The project, which would run through the entirety of the San Joaquin Valley and include stops in Stockton, Modesto, Merced, Fresno, Tulare, and Bakersfield, will likely increase population growth and drive up real estate prices throughout the Valley. However, it may also enable current Valley residents to benefit from the more robust job markets in San Francisco and Los Angeles.
Comprehensive Immigration Reform
Potential immigration reform could dramatically change the economic and social conditions of the region. Currently undocumented immigrants are unable to qualify for federally subsidized affordable housing and are afraid to take legal action or file housing complaints. As a result, undocumented families often live in extremely substandard conditions and rarely inform local authorities.
Comprehensive reform would provide more legal protections and better safeguard the rights of undocumented residents to access fair employment, fair housing, and fair communities.
As outlined above, the San Joaquin Valley is a rapidly growing and diversifying region, facing extreme economic challenges and home to a disproportionate number of socially and economically vulnerable households. These conditions create a kind of perfect storm that traps families, communities and the region in multi-generational poverty and stagnant economic growth. The recent foreclosure crisis, economic downturn, and reduction in local and federal revenue only exasperated the situation, and the region is only now starting to recover.
PAGE 19
SECTION 2:SEGREGATION
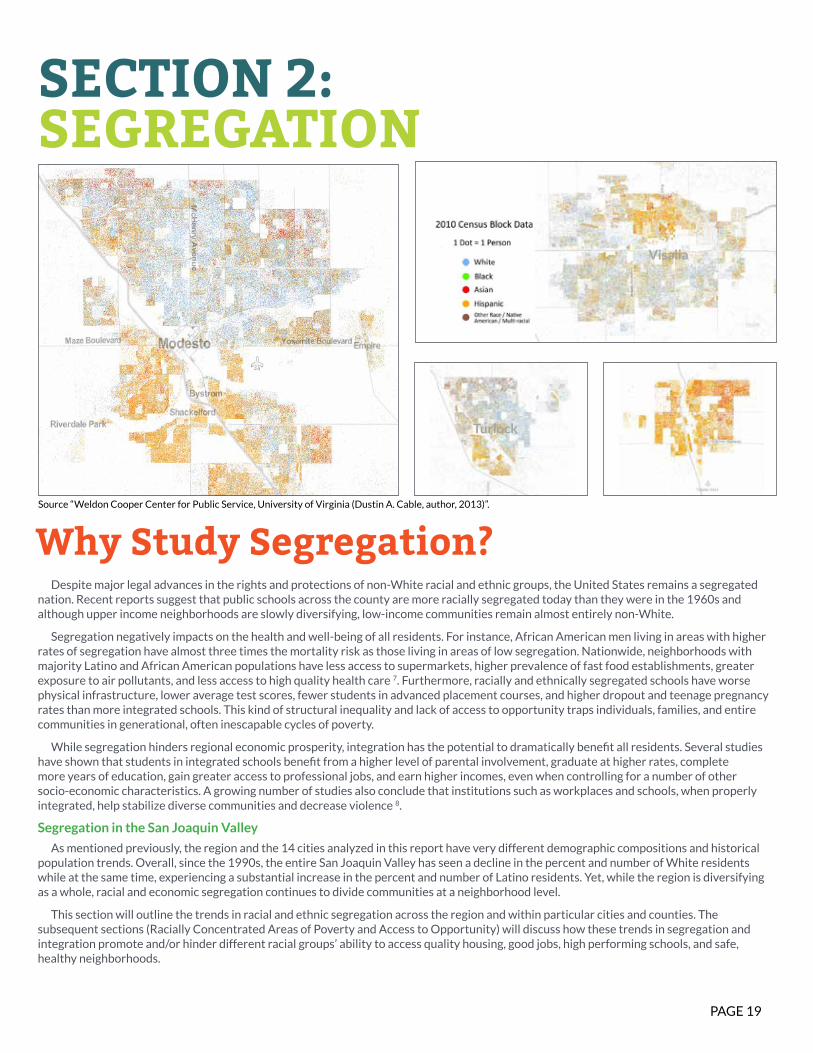
Despite major legal advances in the rights and protections of non-White racial and ethnic groups, the United States remains a segregated nation. Recent reports suggest that public schools across the county are more racially segregated today than they were in the 1960s and although upper income neighborhoods are slowly diversifying, low-income communities remain almost entirely non-White.
Segregation negatively impacts on the health and well-being of all residents. For instance, African American men living in areas with higher rates of segregation have almost three times the mortality risk as those living in areas of low segregation. Nationwide, neighborhoods with majority Latino and African American populations have less access to supermarkets, higher prevalence of fast food establishments, greater exposure to air pollutants, and less access to high quality health care 7. Furthermore, racially and ethnically segregated schools have worse physical infrastructure, lower average test scores, fewer students in advanced placement courses, and higher dropout and teenage pregnancy rates than more integrated schools. This kind of structural inequality and lack of access to opportunity traps individuals, families, and entire communities in generational, often inescapable cycles of poverty.
While segregation hinders regional economic prosperity, integration has the potential to dramatically benefit all residents. Several studies have shown that students in integrated schools benefit from a higher level of parental involvement, graduate at higher rates, complete more years of education, gain greater access to professional jobs, and earn higher incomes, even when controlling for a number of other socio-economic characteristics. A growing number of studies also conclude that institutions such as workplaces and schools, when properly integrated, help stabilize diverse communities and decrease violence 8.
Segregation in the San Joaquin Valley
As mentioned previously, the region and the 14 cities analyzed in this report have very different demographic compositions and historical population trends. Overall, since the 1990s, the entire San Joaquin Valley has seen a decline in the percent and number of White residents while at the same time, experiencing a substantial increase in the percent and number of Latino residents. Yet, while the region is diversifying as a whole, racial and economic segregation continues to divide communities at a neighborhood level.
This section will outline the trends in racial and ethnic segregation across the region and within particular cities and counties. The subsequent sections (Racially Concentrated Areas of Poverty and Access to Opportunity) will discuss how these trends in segregation and integration promote and/or hinder different racial groups’ ability to access quality housing, good jobs, high performing schools, and safe, healthy neighborhoods.
Delano
Why Study Segregation?
Visalia
Turlock
Source “Weldon Cooper Center for Public Service, University of Virginia (Dustin A. Cable, author, 2013)”.
PAGE 20
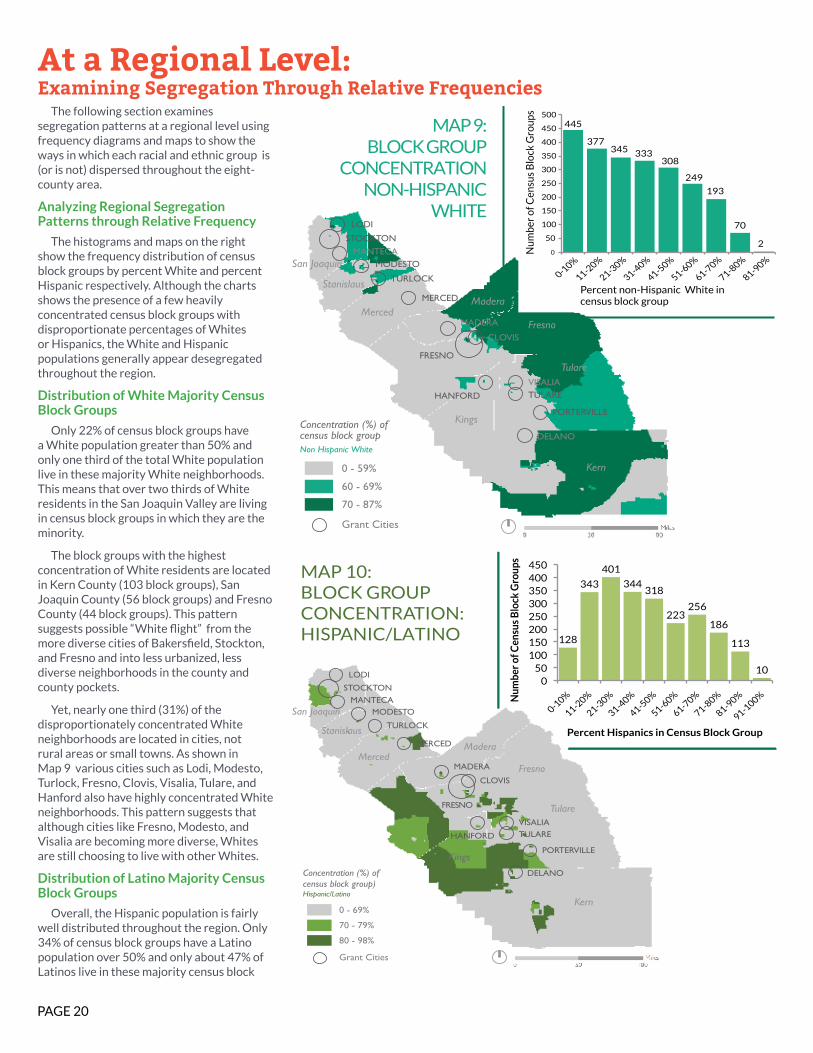
The following section examines segregation patterns at a regional level using frequency diagrams and maps to show the ways in which each racial and ethnic group is (or is not) dispersed throughout the eight-county area.
Analyzing Regional Segregation Patterns through Relative Frequency
The histograms and maps on the right show the frequency distribution of census block groups by percent White and percent Hispanic respectively. Although the charts shows the presence of a few heavily concentrated census block groups with disproportionate percentages of Whites or Hispanics, the White and Hispanic populations generally appear desegregated throughout the region.
Distribution of White Majority Census Block Groups
Only 22% of census block groups have a White population greater than 50% and only one third of the total White population live in these majority White neighborhoods. This means that over two thirds of White residents in the San Joaquin Valley are living in census block groups in which they are the minority.
The block groups with the highest concentration of White residents are located in Kern County (103 block groups), San Joaquin County (56 block groups) and Fresno County (44 block groups). This pattern suggests possible “White flight” from the more diverse cities of Bakersfield, Stockton, and Fresno and into less urbanized, less diverse neighborhoods in the county and county pockets.
Yet, nearly one third (31%) of the disproportionately concentrated White neighborhoods are located in cities, not rural areas or small towns. As shown in Map 9 various cities such as Lodi, Modesto, Turlock, Fresno, Clovis, Visalia, Tulare, and Hanford also have highly concentrated White neighborhoods. This pattern suggests that although cities like Fresno, Modesto, and Visalia are becoming more diverse, Whites are still choosing to live with other Whites.
Distribution of Latino Majority Census Block Groups
Overall, the Hispanic population is fairly well distributed throughout the region. Only 34% of census block groups have a Latino population over 50% and only about 47% of Latinos live in these majority census block
At a Regional Level:Examining Segregation Through Relative Frequencies
TULARE
LODI
STOCKTONMANTECA
MODESTO
TURLOCK
MERCED
MADERA
CLOVIS
FRESNO
DELANO
PORTERVILLE
HANFORD
VISALIA
Kern
Tulare
Kings
Fresno
MaderaMerced
Stanislaus
San Joaquin
Grant Cities
0 - 59%
60 - 69%
70 - 87%
Concentration (%) of census block groupNon Hispanic White
445
377345 333
308
249
193
70
20
50
100
150
200
250
300
350
400
450
500
0-10%
11-20%
21-30%
31-40%
41-50%
51-60%
61-70%
71-80%
81-90%
Num
ber
of C
ensu
s B
lock
Gro
ups
Percent non-Hispanic White in census block group
MAP 9:BLOCK GROUP
CONCENTRATION NON-HISPANIC
WHITE
MAP 10:BLOCK GROUP CONCENTRATION: HISPANIC/LATINO
TULARE
LODI
STOCKTONMANTECA
MODESTO
TURLOCK
MERCED
MADERA
CLOVIS
FRESNO
DELANO
PORTERVILLE
HANFORD
VISALIA
Kern
Tulare
Kings
Fresno
MaderaMerced
Stanislaus
San Joaquin
128
343
401
344318
223256
186
113
100
50100150200250300350400450
0-10%
11-20%
21-30%
31-40%
41-50%
51-60%
61-70%
71-80%
81-90%
91-100%N
umbe
r of
Cen
sus
Blo
ck G
roup
s
Percent Hispanics in Census Block Group
Grant Cities
0 - 69%
70 - 79%
80 - 98%
Concentration (%) of census block group)Hispanic/Latino
PAGE 21
groups. This means that approximately 53% of Latinos are living in neighborhoods in which they are not the majority racial or ethnic group.
As expected, rural areas of the Valley including non-entitlement jurisdictions and unincorporated areas in Fresno, Merced, Tulare, and Kern County all have the highest percent of Latinos and the highest number of majority-Latino census block groups.
Amongst the cities, Fresno appears to have one of the highest rates of Latino segregation. Eleven percent of the region’s total Latino-majority census block groups are located in Fresno and Fresno is the only major city with a census block group exceeding 80% Hispanic/Latino.
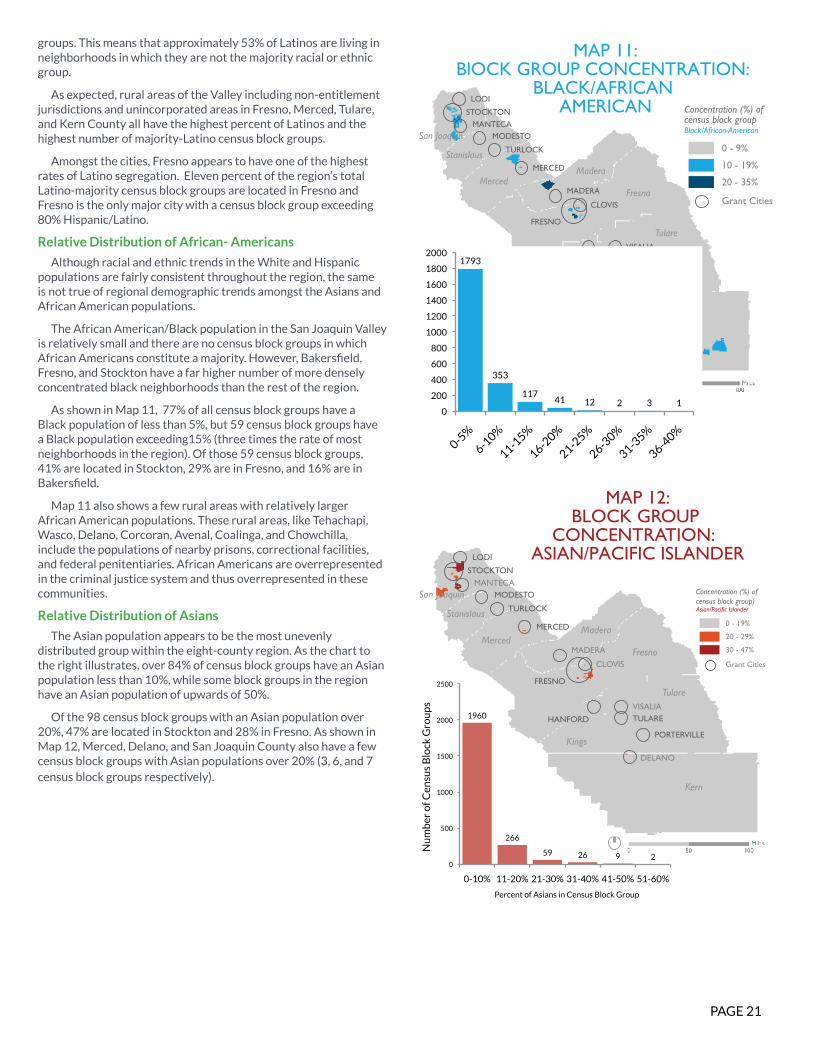
Relative Distribution of African- Americans
Although racial and ethnic trends in the White and Hispanic populations are fairly consistent throughout the region, the same is not true of regional demographic trends amongst the Asians and African American populations.
The African American/Black population in the San Joaquin Valley is relatively small and there are no census block groups in which African Americans constitute a majority. However, Bakersfield, Fresno, and Stockton have a far higher number of more densely concentrated black neighborhoods than the rest of the region.
As shown in Map 11, 77% of all census block groups have a Black population of less than 5%, but 59 census block groups have a Black population exceeding15% (three times the rate of most neighborhoods in the region). Of those 59 census block groups, 41% are located in Stockton, 29% are in Fresno, and 16% are in Bakersfield.
Map 11 also shows a few rural areas with relatively larger African American populations. These rural areas, like Tehachapi, Wasco, Delano, Corcoran, Avenal, Coalinga, and Chowchilla, include the populations of nearby prisons, correctional facilities, and federal penitentiaries. African Americans are overrepresented in the criminal justice system and thus overrepresented in these communities.
Relative Distribution of Asians
The Asian population appears to be the most unevenly distributed group within the eight-county region. As the chart to the right illustrates, over 84% of census block groups have an Asian population less than 10%, while some block groups in the region have an Asian population of upwards of 50%.
Of the 98 census block groups with an Asian population over 20%, 47% are located in Stockton and 28% in Fresno. As shown in Map 12, Merced, Delano, and San Joaquin County also have a few census block groups with Asian populations over 20% (3, 6, and 7 census block groups respectively).
TULARE
LODI
STOCKTONMANTECA
MODESTO
TURLOCK
MERCED
MADERA
CLOVIS
FRESNO
DELANO
PORTERVILLE
HANFORDVISALIA
Kern
Tulare
Kings
Fresno
MaderaMerced
Stanislaus
San Joaquin
1960
266
59 26 9 20
500
1000
1500
2000
2500
0-10% 11-20% 21-30% 31-40% 41-50% 51-60%
Nu
mb
er o
f Cen
sus
Blo
ck G
rou
ps
Percent of Asians in Census Block Group
Grant Cities
0 - 19%
20 - 29%
30 - 47%
Asian/Pacific Islander
Concentration (%) of census block group)
MAP 12:BLOCK GROUP
CONCENTRATION: ASIAN/PACIFIC ISLANDER
TULARE
LODI
STOCKTONMANTECA
MODESTO
TURLOCK
MERCED
MADERA
CLOVIS
FRESNO
DELANO
PORTERVILLE
HANFORD
VISALIA
Kern
Tulare
Kings
Fresno
MaderaMerced
Stanislaus
San Joaquin
1793
353
11741 12 2 3 1
0
200
400
600
800
1000
1200
1400
1600
1800
2000
0-5%
6-10%
11-15%
16-20%
21-25%
26-30%
31-35%
36-40%
Grant Cities
0 - 9%
10 - 19%
20 - 35%
Black/African-American
Concentration (%) of census block group
MAP 11:BlOCK GROUP CONCENTRATION:
BLACK/AFRICAN AMERICAN
PAGE 22
Measuring segregation through dissimilarity and isolation indicesAt the City and County Level
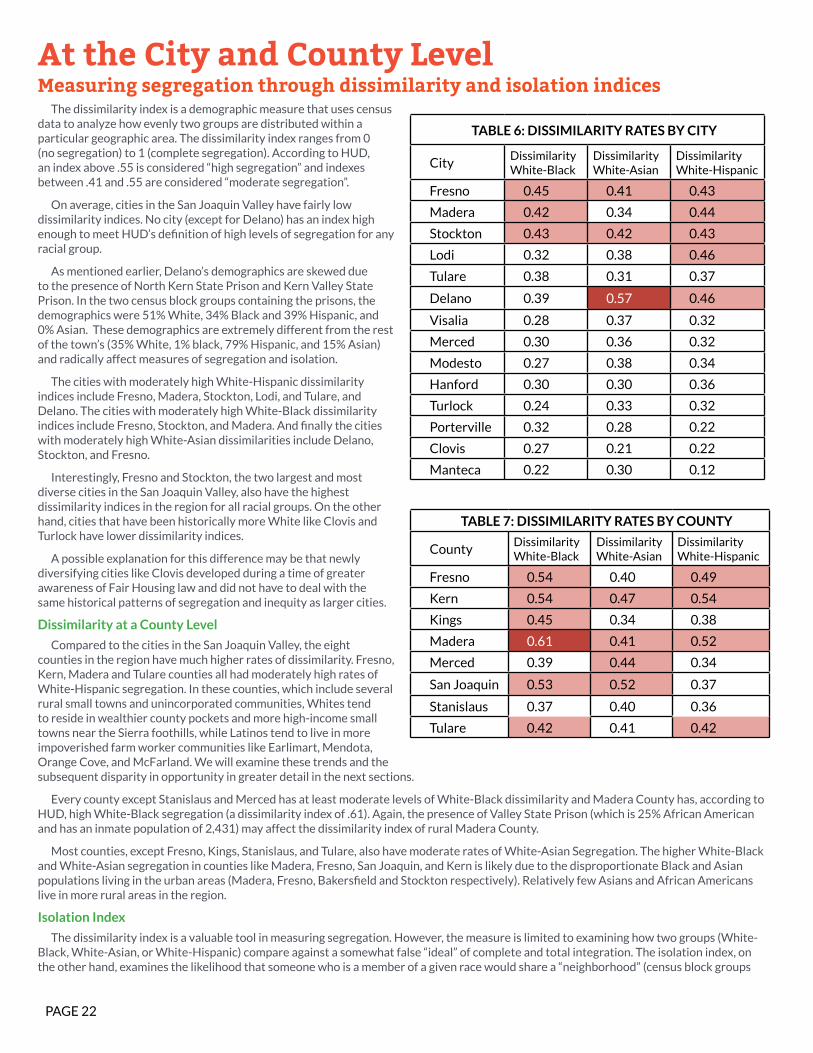
The dissimilarity index is a demographic measure that uses census data to analyze how evenly two groups are distributed within a particular geographic area. The dissimilarity index ranges from 0 (no segregation) to 1 (complete segregation). According to HUD, an index above .55 is considered “high segregation” and indexes between .41 and .55 are considered “moderate segregation”.
On average, cities in the San Joaquin Valley have fairly low dissimilarity indices. No city (except for Delano) has an index high enough to meet HUD’s definition of high levels of segregation for any racial group.
As mentioned earlier, Delano’s demographics are skewed due to the presence of North Kern State Prison and Kern Valley State Prison. In the two census block groups containing the prisons, the demographics were 51% White, 34% Black and 39% Hispanic, and 0% Asian. These demographics are extremely different from the rest of the town’s (35% White, 1% black, 79% Hispanic, and 15% Asian) and radically affect measures of segregation and isolation.
The cities with moderately high White-Hispanic dissimilarity indices include Fresno, Madera, Stockton, Lodi, and Tulare, and Delano. The cities with moderately high White-Black dissimilarity indices include Fresno, Stockton, and Madera. And finally the cities with moderately high White-Asian dissimilarities include Delano, Stockton, and Fresno.
Interestingly, Fresno and Stockton, the two largest and most diverse cities in the San Joaquin Valley, also have the highest dissimilarity indices in the region for all racial groups. On the other hand, cities that have been historically more White like Clovis and Turlock have lower dissimilarity indices.
A possible explanation for this difference may be that newly diversifying cities like Clovis developed during a time of greater awareness of Fair Housing law and did not have to deal with the same historical patterns of segregation and inequity as larger cities.
Dissimilarity at a County Level
Compared to the cities in the San Joaquin Valley, the eight counties in the region have much higher rates of dissimilarity. Fresno, Kern, Madera and Tulare counties all had moderately high rates of White-Hispanic segregation. In these counties, which include several rural small towns and unincorporated communities, Whites tend to reside in wealthier county pockets and more high-income small towns near the Sierra foothills, while Latinos tend to live in more impoverished farm worker communities like Earlimart, Mendota, Orange Cove, and McFarland. We will examine these trends and the subsequent disparity in opportunity in greater detail in the next sections.
Every county except Stanislaus and Merced has at least moderate levels of White-Black dissimilarity and Madera County has, according to HUD, high White-Black segregation (a dissimilarity index of .61). Again, the presence of Valley State Prison (which is 25% African American and has an inmate population of 2,431) may affect the dissimilarity index of rural Madera County.
Most counties, except Fresno, Kings, Stanislaus, and Tulare, also have moderate rates of White-Asian Segregation. The higher White-Black and White-Asian segregation in counties like Madera, Fresno, San Joaquin, and Kern is likely due to the disproportionate Black and Asian populations living in the urban areas (Madera, Fresno, Bakersfield and Stockton respectively). Relatively few Asians and African Americans live in more rural areas in the region.
Isolation Index
The dissimilarity index is a valuable tool in measuring segregation. However, the measure is limited to examining how two groups (White-Black, White-Asian, or White-Hispanic) compare against a somewhat false “ideal” of complete and total integration. The isolation index, on the other hand, examines the likelihood that someone who is a member of a given race would share a “neighborhood” (census block groups
TABLE 7: DISSIMILARITY RATES BY COUNTY
CountyDissimilarity White-Black
Dissimilarity White-Asian
Dissimilarity White-Hispanic
Fresno 0.54 0.40 0.49
Kern 0.54 0.47 0.54
Kings 0.45 0.34 0.38
Madera 0.61 0.41 0.52
Merced 0.39 0.44 0.34
San Joaquin 0.53 0.52 0.37
Stanislaus 0.37 0.40 0.36
Tulare 0.42 0.41 0.42
TABLE 6: DISSIMILARITY RATES BY CITY
CityDissimilarity White-Black
Dissimilarity White-Asian
Dissimilarity White-Hispanic
Fresno 0.45 0.41 0.43
Madera 0.42 0.34 0.44
Stockton 0.43 0.42 0.43
Lodi 0.32 0.38 0.46
Tulare 0.38 0.31 0.37
Delano 0.39 0.57 0.46
Visalia 0.28 0.37 0.32
Merced 0.30 0.36 0.32
Modesto 0.27 0.38 0.34
Hanford 0.30 0.30 0.36
Turlock 0.24 0.33 0.32
Porterville 0.32 0.28 0.22
Clovis 0.27 0.21 0.22
Manteca 0.22 0.30 0.12
PAGE 23
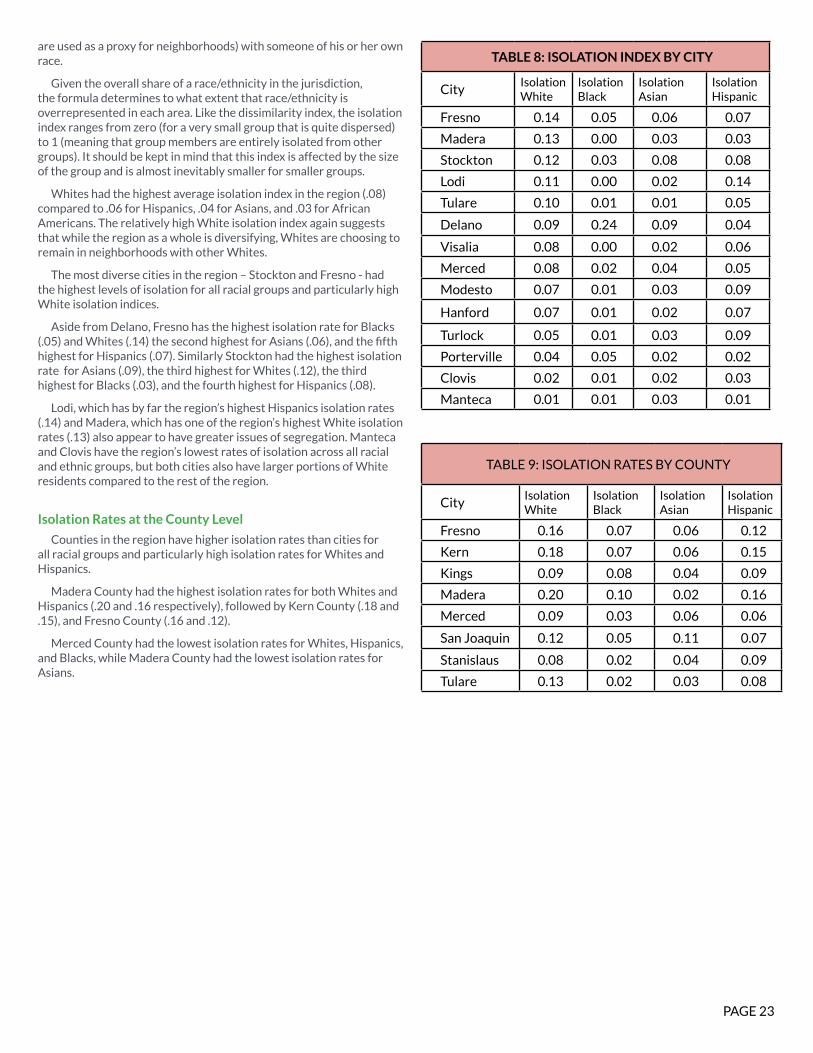
are used as a proxy for neighborhoods) with someone of his or her own race.
Given the overall share of a race/ethnicity in the jurisdiction, the formula determines to what extent that race/ethnicity is overrepresented in each area. Like the dissimilarity index, the isolation index ranges from zero (for a very small group that is quite dispersed) to 1 (meaning that group members are entirely isolated from other groups). It should be kept in mind that this index is affected by the size of the group and is almost inevitably smaller for smaller groups.
Whites had the highest average isolation index in the region (.08) compared to .06 for Hispanics, .04 for Asians, and .03 for African Americans. The relatively high White isolation index again suggests that while the region as a whole is diversifying, Whites are choosing to remain in neighborhoods with other Whites.
The most diverse cities in the region – Stockton and Fresno - had the highest levels of isolation for all racial groups and particularly high White isolation indices.
Aside from Delano, Fresno has the highest isolation rate for Blacks (.05) and Whites (.14) the second highest for Asians (.06), and the fifth highest for Hispanics (.07). Similarly Stockton had the highest isolation rate for Asians (.09), the third highest for Whites (.12), the third highest for Blacks (.03), and the fourth highest for Hispanics (.08).
Lodi, which has by far the region’s highest Hispanics isolation rates (.14) and Madera, which has one of the region’s highest White isolation rates (.13) also appear to have greater issues of segregation. Manteca and Clovis have the region’s lowest rates of isolation across all racial and ethnic groups, but both cities also have larger portions of White residents compared to the rest of the region.
Isolation Rates at the County Level
Counties in the region have higher isolation rates than cities for all racial groups and particularly high isolation rates for Whites and Hispanics.
Madera County had the highest isolation rates for both Whites and Hispanics (.20 and .16 respectively), followed by Kern County (.18 and .15), and Fresno County (.16 and .12).
Merced County had the lowest isolation rates for Whites, Hispanics, and Blacks, while Madera County had the lowest isolation rates for Asians.
TABLE 9: ISOLATION RATES BY COUNTY
CityIsolation White
Isolation Black
Isolation Asian
Isolation Hispanic
Fresno 0.16 0.07 0.06 0.12
Kern 0.18 0.07 0.06 0.15
Kings 0.09 0.08 0.04 0.09
Madera 0.20 0.10 0.02 0.16
Merced 0.09 0.03 0.06 0.06
San Joaquin 0.12 0.05 0.11 0.07
Stanislaus 0.08 0.02 0.04 0.09
Tulare 0.13 0.02 0.03 0.08
TABLE 8: ISOLATION INDEX BY CITY
CityIsolation White
Isolation Black
Isolation Asian
Isolation Hispanic
Fresno 0.14 0.05 0.06 0.07
Madera 0.13 0.00 0.03 0.03
Stockton 0.12 0.03 0.08 0.08
Lodi 0.11 0.00 0.02 0.14
Tulare 0.10 0.01 0.01 0.05
Delano 0.09 0.24 0.09 0.04
Visalia 0.08 0.00 0.02 0.06
Merced 0.08 0.02 0.04 0.05
Modesto 0.07 0.01 0.03 0.09
Hanford 0.07 0.01 0.02 0.07
Turlock 0.05 0.01 0.03 0.09
Porterville 0.04 0.05 0.02 0.02
Clovis 0.02 0.01 0.02 0.03
Manteca 0.01 0.01 0.03 0.01
PAGE 24
Dissimilarity and Isolation Indices
0.00 0.05 0.10 0.15 0.20 0.25 0.30 0.35 0.40 0.45 0.50 DISSIMILARITY INDEX:
Fre
sno
Sto
ckto
n
Mad
era
De
lan
o
Tula
re
Po
rte
rvil
le
Lod
i
Me
rce
d
Han
ford
Vis
alia
Mo
de
sto
Clo
vis
Turl
ock
Man
teca
WHITE-BLACK
Fres
no
Stoc
kton
Mad
era
Lodi
Tula
rePort
ervi
lle
Mer
ced
Han
ford
Visa
lia
Mod
esto
Clov
is
Turlo
ck
Man
teca
Del
ano
0.00
0.05
0.10
0.15
0.20
0.25
0.30 ISOLATION INDEX: AFRICAN AMERICANS
0.1
0.0
0.2
0.3
0.4
0.5
0.6
Fre
sno
Sto
ckto
n
Ma
de
ra
De
lan
o
Tu
lare
Po
rte
rvil
le
Lod
i
Me
rce
d
Ha
nfo
rd
Vis
ali
a
Mo
de
sto
Clo
vis
Tu
rlo
ck
Ma
nte
ca
DISSIMILARITY INDEX: WHITE-ASIAN
0 0.05 0.10 0.15 0.20 0.25 0.30
0.35 0.40 0.45
0.50
Fres
no
Sto
ckto
n
Mad
era
Del
ano
Tula
re
Po
rter
ville
Lod
i
Mer
ced
Han
ford
Vis
alia
Mo
des
to
Clo
vis
Turl
ock
Man
teca
DISSIMILARITY INDEX: WHITE-HISPANIC
0.00
0.02
0.04
0.06
0.08
0.10
0.12
0.14
0.16
Fre
sno
Sto
ckto
n
Mad
era
De
lan
oTu
lare
Po
rte
rvill
e
Lod
i
Me
rce
d
Han
ford
Vis
aliaM
od
est
o
Clo
vis
Turl
ock
Man
teca
ISOLATION INDEX: HISPANICS
Fres
no
Sto
ckto
nM
ader
a
Del
ano
Tula
re
Po
rter
villeLo
di
Mer
ced
Han
ford
Vis
alia
Mo
des
to
Clo
vis
Turl
ock
Man
teca
ISOLATION INDEX: WHITES
0.00 0.02
0.04 0.06 0.08 0.10 0.12
0.14 0.16 0.18
0.01
0.03
0.05
0.07
0.09
0.11
Fres
noStoc
kton
Mad
era
Del
ano
Tula
rePo
rter
ville
LodiM
erce
d
Han
ford
Visa
lia
Mod
esto
Clov
is
Turlo
ckM
ante
ca
ISOLATION INDEX: ASIANS
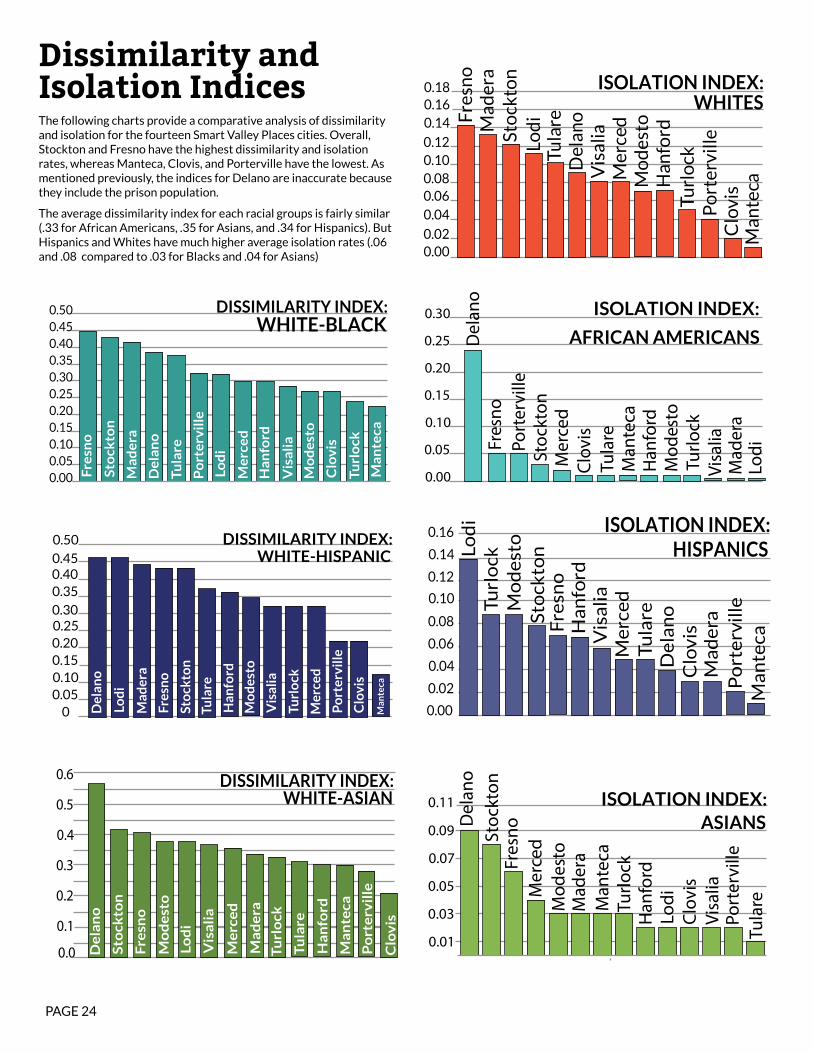
The following charts provide a comparative analysis of dissimilarity and isolation for the fourteen Smart Valley Places cities. Overall, Stockton and Fresno have the highest dissimilarity and isolation rates, whereas Manteca, Clovis, and Porterville have the lowest. As mentioned previously, the indices for Delano are inaccurate because they include the prison population.
The average dissimilarity index for each racial groups is fairly similar (.33 for African Americans, .35 for Asians, and .34 for Hispanics). But Hispanics and Whites have much higher average isolation rates (.06 and .08 compared to .03 for Blacks and .04 for Asians)
PAGE 25
Tales of Two Cities
Multiethnic Segregation
Models of Integration
MADERA LODI
STOCKTON
MANTECA PORTERVILLE
Visualizing Current Patterns ofDissimilarity and Isolation
FRESNO
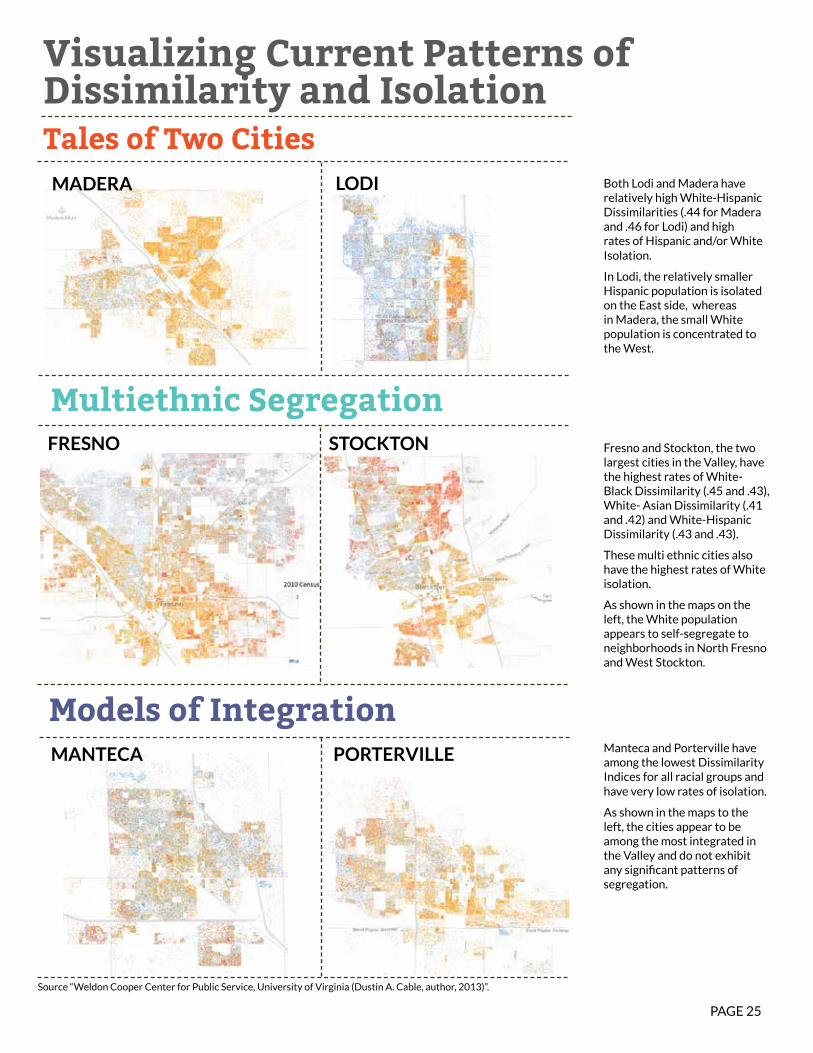
Both Lodi and Madera have relatively high White-Hispanic Dissimilarities (.44 for Madera and .46 for Lodi) and high rates of Hispanic and/or White Isolation.
In Lodi, the relatively smaller Hispanic population is isolated on the East side, whereas in Madera, the small White population is concentrated to the West.
Fresno and Stockton, the two largest cities in the Valley, have the highest rates of White-Black Dissimilarity (.45 and .43), White- Asian Dissimilarity (.41 and .42) and White-Hispanic Dissimilarity (.43 and .43).
These multi ethnic cities also have the highest rates of White isolation.
As shown in the maps on the left, the White population appears to self-segregate to neighborhoods in North Fresno and West Stockton.
Manteca and Porterville have among the lowest Dissimilarity Indices for all racial groups and have very low rates of isolation.
As shown in the maps to the left, the cities appear to be among the most integrated in the Valley and do not exhibit any significant patterns of segregation.
Source “Weldon Cooper Center for Public Service, University of Virginia (Dustin A. Cable, author, 2013)”.
PAGE 26
Changes in Dissimilarity and Isolation from 1990-2010
MERCED
DECREASING DISSIMILARITY INCREASING DISSIMILARITY
PORTERVILLE
STOCKTON
MADERA
MODESTO
FRESNO
MANTECA
TURLOCK
TULARE
HANFORD
CLOVIS
LODI
DELANO
Dissimilarity White- Black
Dissimilarity White- Hispanic
Dissimilarity White- Asian
VISALIA
-0.40 -0.30 -0.20 -0.10 0.00 0.00 0.10 0.20 0.30
-.10
-.10
-.20
-.19
-.09
-.09
+.09
-.11
-.11
-.15
-.11
-.15 -.11
+.11
+.14 +.06
+.09
+.03
+.01
+.01
-.02
-.14
+.08
-.08
-.06
-.06
-.05-.05
-.05
-.05 +.05
-.02
-.02
-.02
-.03
-.03
-.13
-.12
-.10
+.10
MERCED
INCREASING ISOLATIONDECREASING ISOLATION
PORTERVILLE
STOCKTON
MADERA
MODESTO
FRESNO
MANTECA
TURLOCK
TULARE
HANFORD
CLOVIS
LODI
DELANO
AfricanAmerican Isolation
HispanicIsolation
VISALIA
Asian Isolation
WhiteIsolation
-.08-.07
-.07
-.07
-.07
-.07
-.08
-.11
+.23
-.05 -.06
-.06
-.06
.02
+.02
+.02
+.02
+.02
+.08
-.04
+.04
-.04
-.04
-.03
-.03
-.03
-.02
-.02
-.02
-.02
-.02
-.01
-.01
-.01
-.14
-.01
-.01
+.01
-.01
+.02
+.02
+.03
+.03
-0.20 -0.40 -0.10 0.00 0.00 0.10 0.30
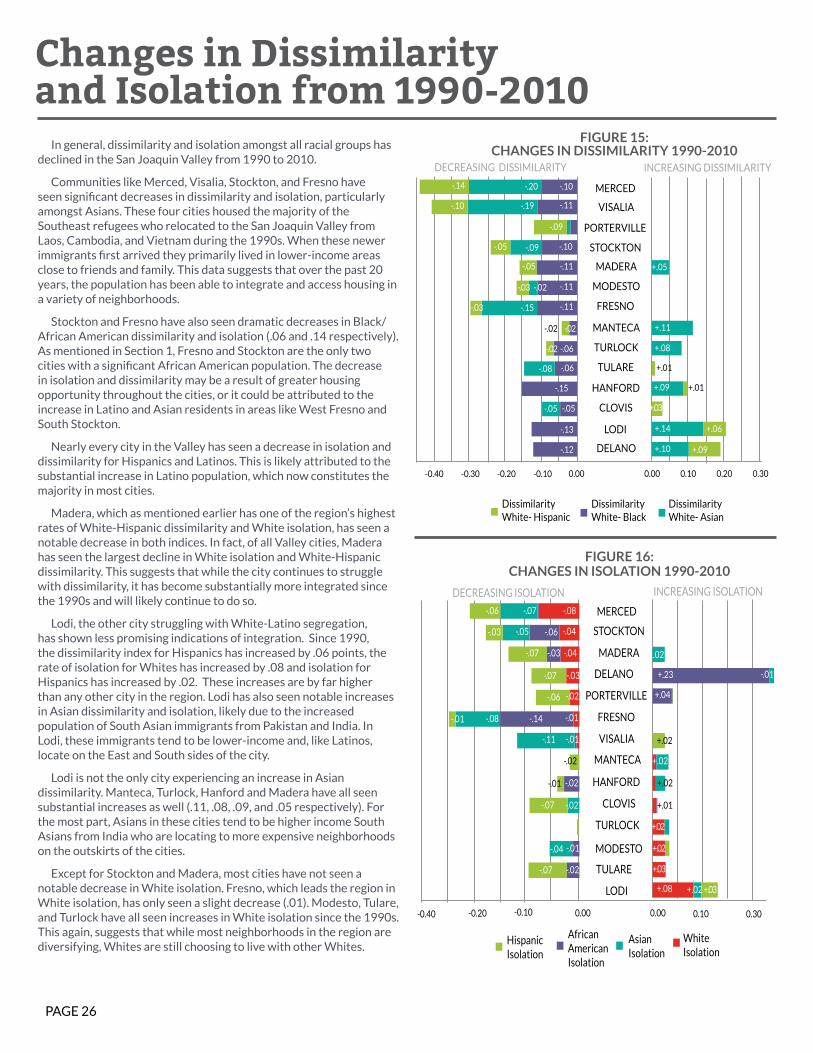
In general, dissimilarity and isolation amongst all racial groups has declined in the San Joaquin Valley from 1990 to 2010.
Communities like Merced, Visalia, Stockton, and Fresno have seen significant decreases in dissimilarity and isolation, particularly amongst Asians. These four cities housed the majority of the Southeast refugees who relocated to the San Joaquin Valley from Laos, Cambodia, and Vietnam during the 1990s. When these newer immigrants first arrived they primarily lived in lower-income areas close to friends and family. This data suggests that over the past 20 years, the population has been able to integrate and access housing in a variety of neighborhoods.
Stockton and Fresno have also seen dramatic decreases in Black/African American dissimilarity and isolation (.06 and .14 respectively). As mentioned in Section 1, Fresno and Stockton are the only two cities with a significant African American population. The decrease in isolation and dissimilarity may be a result of greater housing opportunity throughout the cities, or it could be attributed to the increase in Latino and Asian residents in areas like West Fresno and South Stockton.
Nearly every city in the Valley has seen a decrease in isolation and dissimilarity for Hispanics and Latinos. This is likely attributed to the substantial increase in Latino population, which now constitutes the majority in most cities.
Madera, which as mentioned earlier has one of the region’s highest rates of White-Hispanic dissimilarity and White isolation, has seen a notable decrease in both indices. In fact, of all Valley cities, Madera has seen the largest decline in White isolation and White-Hispanic dissimilarity. This suggests that while the city continues to struggle with dissimilarity, it has become substantially more integrated since the 1990s and will likely continue to do so.
Lodi, the other city struggling with White-Latino segregation, has shown less promising indications of integration. Since 1990, the dissimilarity index for Hispanics has increased by .06 points, the rate of isolation for Whites has increased by .08 and isolation for Hispanics has increased by .02. These increases are by far higher than any other city in the region. Lodi has also seen notable increases in Asian dissimilarity and isolation, likely due to the increased population of South Asian immigrants from Pakistan and India. In Lodi, these immigrants tend to be lower-income and, like Latinos, locate on the East and South sides of the city.
Lodi is not the only city experiencing an increase in Asian dissimilarity. Manteca, Turlock, Hanford and Madera have all seen substantial increases as well (.11, .08, .09, and .05 respectively). For the most part, Asians in these cities tend to be higher income South Asians from India who are locating to more expensive neighborhoods on the outskirts of the cities.
Except for Stockton and Madera, most cities have not seen a notable decrease in White isolation. Fresno, which leads the region in White isolation, has only seen a slight decrease (.01). Modesto, Tulare, and Turlock have all seen increases in White isolation since the 1990s. This again, suggests that while most neighborhoods in the region are diversifying, Whites are still choosing to live with other Whites.
FIGURE 15: CHANGES IN DISSIMILARITY 1990-2010
FIGURE 16: CHANGES IN ISOLATION 1990-2010
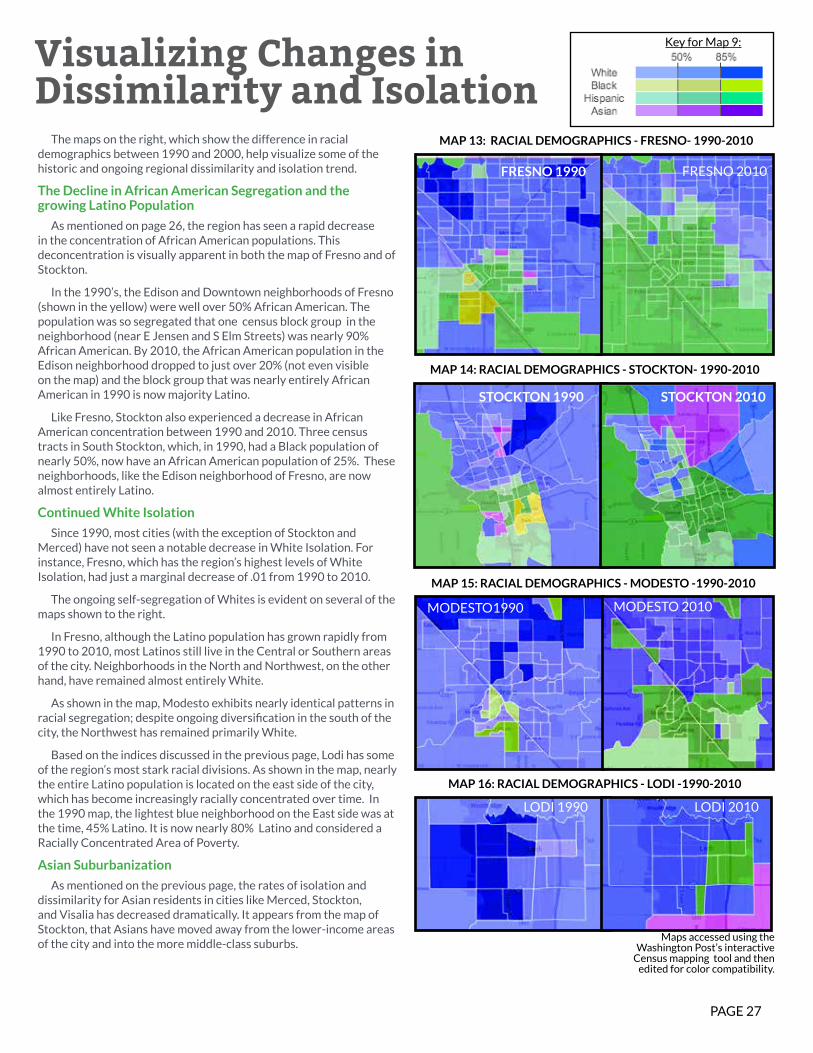
PAGE 27
Visualizing Changes in Dissimilarity and Isolation
FRESNO 2010
The maps on the right, which show the difference in racial demographics between 1990 and 2000, help visualize some of the historic and ongoing regional dissimilarity and isolation trend.
The Decline in African American Segregation and the growing Latino Population
As mentioned on page 26, the region has seen a rapid decrease in the concentration of African American populations. This deconcentration is visually apparent in both the map of Fresno and of Stockton.
In the 1990’s, the Edison and Downtown neighborhoods of Fresno (shown in the yellow) were well over 50% African American. The population was so segregated that one census block group in the neighborhood (near E Jensen and S Elm Streets) was nearly 90% African American. By 2010, the African American population in the Edison neighborhood dropped to just over 20% (not even visible on the map) and the block group that was nearly entirely African American in 1990 is now majority Latino.
Like Fresno, Stockton also experienced a decrease in African American concentration between 1990 and 2010. Three census tracts in South Stockton, which, in 1990, had a Black population of nearly 50%, now have an African American population of 25%. These neighborhoods, like the Edison neighborhood of Fresno, are now almost entirely Latino.
Continued White Isolation
Since 1990, most cities (with the exception of Stockton and Merced) have not seen a notable decrease in White Isolation. For instance, Fresno, which has the region’s highest levels of White Isolation, had just a marginal decrease of .01 from 1990 to 2010.
The ongoing self-segregation of Whites is evident on several of the maps shown to the right.
In Fresno, although the Latino population has grown rapidly from 1990 to 2010, most Latinos still live in the Central or Southern areas of the city. Neighborhoods in the North and Northwest, on the other hand, have remained almost entirely White.
As shown in the map, Modesto exhibits nearly identical patterns in racial segregation; despite ongoing diversification in the south of the city, the Northwest has remained primarily White.
Based on the indices discussed in the previous page, Lodi has some of the region’s most stark racial divisions. As shown in the map, nearly the entire Latino population is located on the east side of the city, which has become increasingly racially concentrated over time. In the 1990 map, the lightest blue neighborhood on the East side was at the time, 45% Latino. It is now nearly 80% Latino and considered a Racially Concentrated Area of Poverty.
Asian Suburbanization
As mentioned on the previous page, the rates of isolation and dissimilarity for Asian residents in cities like Merced, Stockton, and Visalia has decreased dramatically. It appears from the map of Stockton, that Asians have moved away from the lower-income areas of the city and into the more middle-class suburbs.
MODESTO1990 MODESTO 2010
Maps accessed using the Washington Post’s interactive
Census mapping tool and then edited for color compatibility.
STOCKTON 1990 STOCKTON 2010
LODI 1990 LODI 2010
MAP 13: RACIAL DEMOGRAPHICS - FRESNO- 1990-2010
MAP 14: RACIAL DEMOGRAPHICS - STOCKTON- 1990-2010
MAP 15: RACIAL DEMOGRAPHICS - MODESTO -1990-2010
MAP 16: RACIAL DEMOGRAPHICS - LODI -1990-2010
FRESNO 1990
Key for Map 9:
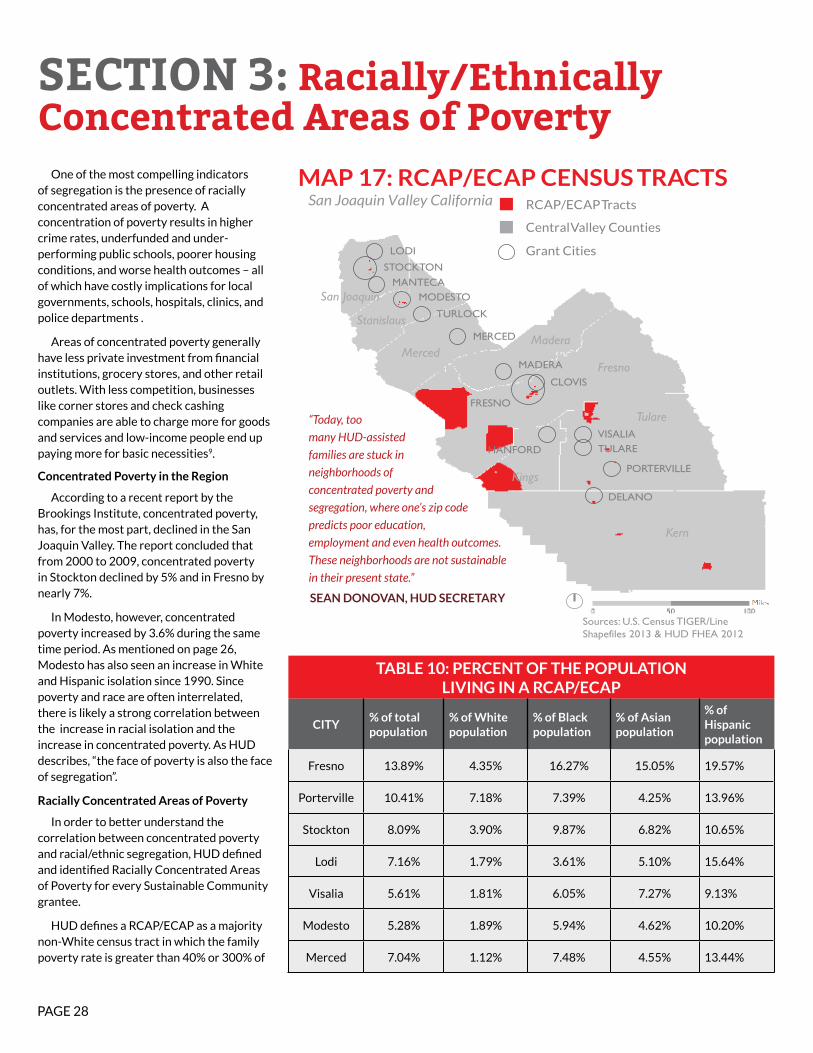
PAGE 28
SECTION 3: Racially/Ethnically Concentrated Areas of Poverty
One of the most compelling indicators of segregation is the presence of racially concentrated areas of poverty. A concentration of poverty results in higher crime rates, underfunded and under-performing public schools, poorer housing conditions, and worse health outcomes – all of which have costly implications for local governments, schools, hospitals, clinics, and police departments .
Areas of concentrated poverty generally have less private investment from financial institutions, grocery stores, and other retail outlets. With less competition, businesses like corner stores and check cashing companies are able to charge more for goods and services and low-income people end up paying more for basic necessities9.
Concentrated Poverty in the Region
According to a recent report by the Brookings Institute, concentrated poverty, has, for the most part, declined in the San Joaquin Valley. The report concluded that from 2000 to 2009, concentrated poverty in Stockton declined by 5% and in Fresno by nearly 7%.
In Modesto, however, concentrated poverty increased by 3.6% during the same time period. As mentioned on page 26, Modesto has also seen an increase in White and Hispanic isolation since 1990. Since poverty and race are often interrelated, there is likely a strong correlation between the increase in racial isolation and the increase in concentrated poverty. As HUD describes, “the face of poverty is also the face of segregation”.
Racially Concentrated Areas of Poverty
In order to better understand the correlation between concentrated poverty and racial/ethnic segregation, HUD defined and identified Racially Concentrated Areas of Poverty for every Sustainable Community grantee.
HUD defines a RCAP/ECAP as a majority non-White census tract in which the family poverty rate is greater than 40% or 300% of
TULARE
LODI
STOCKTONMANTECA
MODESTO
TURLOCK
MERCED
MADERA
CLOVIS
FRESNO
DELANO
PORTERVILLE
HANFORD
VISALIA
Kern
Tulare
Kings
Fresno
MaderaMerced
Stanislaus
San Joaquin
MAP 17: RCAP/ECAP CENSUS TRACTS
10%
Sources: U.S. Census TIGER/Line Shapefiles 2013 & HUD FHEA 2012
San Joaquin Valley California RCAP/ECAP Tracts
Central Valley Counties
Grant Cities
TABLE 10: PERCENT OF THE POPULATION LIVING IN A RCAP/ECAP
CITY% of total population
% of White population
% of Black population
% of Asianpopulation
% of Hispanic population
Fresno 13.89% 4.35% 16.27% 15.05% 19.57%
Porterville 10.41% 7.18% 7.39% 4.25% 13.96%
Stockton 8.09% 3.90% 9.87% 6.82% 10.65%
Lodi 7.16% 1.79% 3.61% 5.10% 15.64%
Visalia 5.61% 1.81% 6.05% 7.27% 9.13%
Modesto 5.28% 1.89% 5.94% 4.62% 10.20%
Merced 7.04% 1.12% 7.48% 4.55% 13.44%
“Today, too
many HUD-assisted
families are stuck in
neighborhoods of
concentrated poverty and
segregation, where one’s zip code
predicts poor education,
employment and even health outcomes.
These neighborhoods are not sustainable
in their present state.”
SEAN DONOVAN, HUD SECRETARY
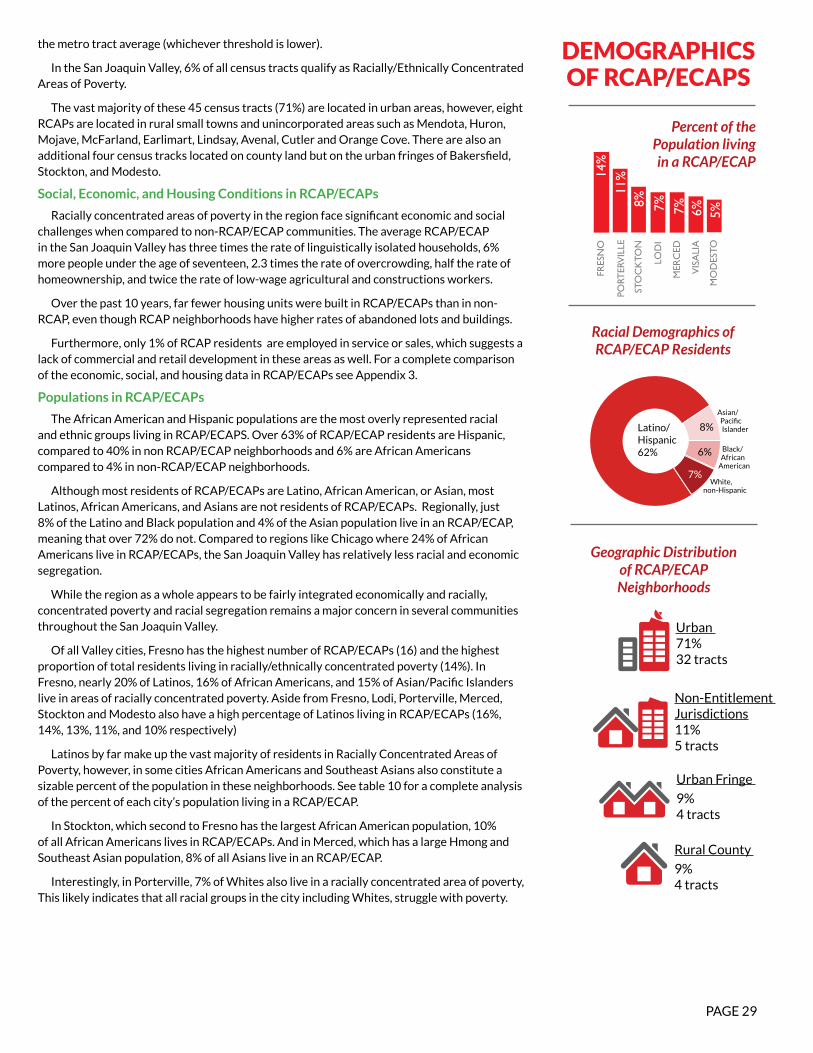
PAGE 29
the metro tract average (whichever threshold is lower).
In the San Joaquin Valley, 6% of all census tracts qualify as Racially/Ethnically Concentrated Areas of Poverty.
The vast majority of these 45 census tracts (71%) are located in urban areas, however, eight RCAPs are located in rural small towns and unincorporated areas such as Mendota, Huron, Mojave, McFarland, Earlimart, Lindsay, Avenal, Cutler and Orange Cove. There are also an additional four census tracks located on county land but on the urban fringes of Bakersfield, Stockton, and Modesto.
Social, Economic, and Housing Conditions in RCAP/ECAPs
Racially concentrated areas of poverty in the region face significant economic and social challenges when compared to non-RCAP/ECAP communities. The average RCAP/ECAP in the San Joaquin Valley has three times the rate of linguistically isolated households, 6% more people under the age of seventeen, 2.3 times the rate of overcrowding, half the rate of homeownership, and twice the rate of low-wage agricultural and constructions workers.
Over the past 10 years, far fewer housing units were built in RCAP/ECAPs than in non-RCAP, even though RCAP neighborhoods have higher rates of abandoned lots and buildings.
Furthermore, only 1% of RCAP residents are employed in service or sales, which suggests a lack of commercial and retail development in these areas as well. For a complete comparison of the economic, social, and housing data in RCAP/ECAPs see Appendix 3.
Populations in RCAP/ECAPs
The African American and Hispanic populations are the most overly represented racial and ethnic groups living in RCAP/ECAPS. Over 63% of RCAP/ECAP residents are Hispanic, compared to 40% in non RCAP/ECAP neighborhoods and 6% are African Americans compared to 4% in non-RCAP/ECAP neighborhoods.
Although most residents of RCAP/ECAPs are Latino, African American, or Asian, most Latinos, African Americans, and Asians are not residents of RCAP/ECAPs. Regionally, just 8% of the Latino and Black population and 4% of the Asian population live in an RCAP/ECAP, meaning that over 72% do not. Compared to regions like Chicago where 24% of African Americans live in RCAP/ECAPs, the San Joaquin Valley has relatively less racial and economic segregation.
While the region as a whole appears to be fairly integrated economically and racially, concentrated poverty and racial segregation remains a major concern in several communities throughout the San Joaquin Valley.
Of all Valley cities, Fresno has the highest number of RCAP/ECAPs (16) and the highest proportion of total residents living in racially/ethnically concentrated poverty (14%). In Fresno, nearly 20% of Latinos, 16% of African Americans, and 15% of Asian/Pacific Islanders live in areas of racially concentrated poverty. Aside from Fresno, Lodi, Porterville, Merced, Stockton and Modesto also have a high percentage of Latinos living in RCAP/ECAPs (16%, 14%, 13%, 11%, and 10% respectively)
Latinos by far make up the vast majority of residents in Racially Concentrated Areas of Poverty, however, in some cities African Americans and Southeast Asians also constitute a sizable percent of the population in these neighborhoods. See table 10 for a complete analysis of the percent of each city’s population living in a RCAP/ECAP.
In Stockton, which second to Fresno has the largest African American population, 10% of all African Americans lives in RCAP/ECAPs. And in Merced, which has a large Hmong and Southeast Asian population, 8% of all Asians live in an RCAP/ECAP.
Interestingly, in Porterville, 7% of Whites also live in a racially concentrated area of poverty, This likely indicates that all racial groups in the city including Whites, struggle with poverty.
Latino/Hispanic62% Black/
African American
White, non-Hispanic
Asian/PacificIslander
6%
8%
7%
FRES
NO
LOD
I
PORT
ERV
ILLE
VIS
ALI
A
MER
CED
MO
DES
TO
STO
CK
TON
14%
7% 6%7% 5%
8%11
%14%
Urban 71%32 tracts
Rural County
9%4 tracts
Non-Entitlement Jurisdictions11%5 tracts
Urban Fringe
9%4 tracts
Percent of the Population living in a RCAP/ECAP
Racial Demographics of RCAP/ECAP Residents
Geographic Distributionof RCAP/ECAPNeighborhoods
DEMOGRAPHICS OF RCAP/ECAPS
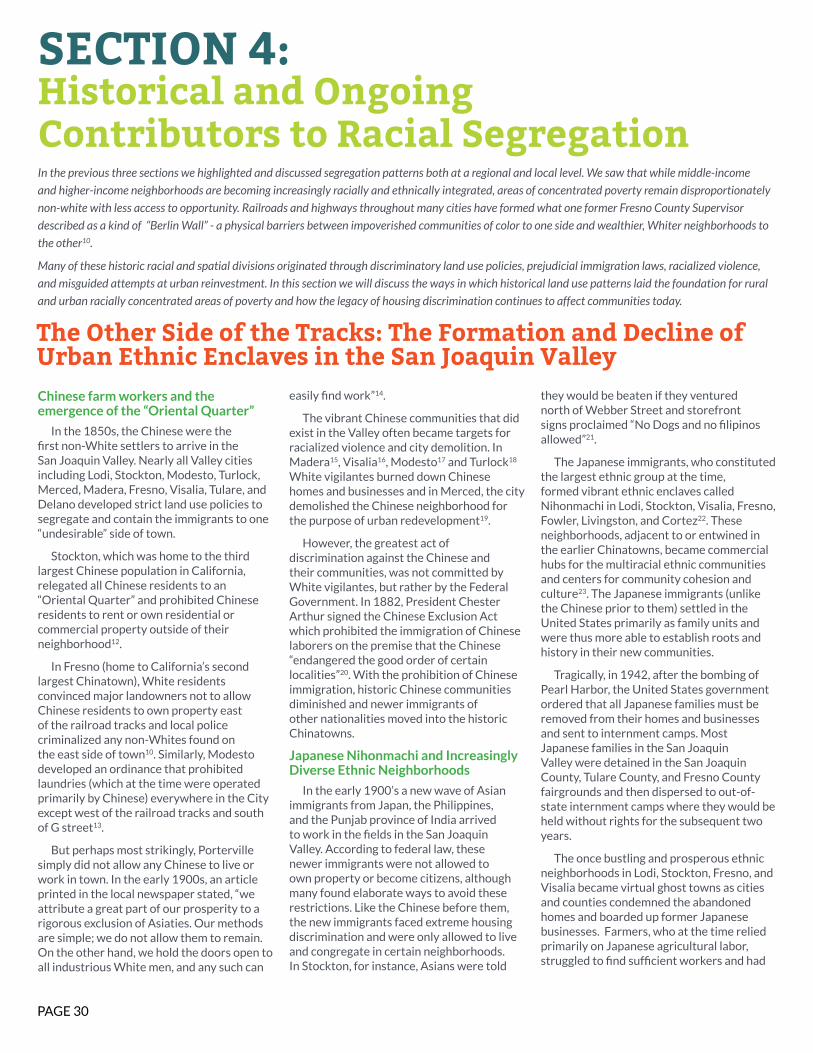
PAGE 30
Chinese farm workers and the emergence of the “Oriental Quarter”
In the 1850s, the Chinese were the first non-White settlers to arrive in the San Joaquin Valley. Nearly all Valley cities including Lodi, Stockton, Modesto, Turlock, Merced, Madera, Fresno, Visalia, Tulare, and Delano developed strict land use policies to segregate and contain the immigrants to one “undesirable” side of town.
Stockton, which was home to the third largest Chinese population in California, relegated all Chinese residents to an “Oriental Quarter” and prohibited Chinese residents to rent or own residential or commercial property outside of their neighborhood12.
In Fresno (home to California’s second largest Chinatown), White residents convinced major landowners not to allow Chinese residents to own property east of the railroad tracks and local police criminalized any non-Whites found on the east side of town10. Similarly, Modesto developed an ordinance that prohibited laundries (which at the time were operated primarily by Chinese) everywhere in the City except west of the railroad tracks and south of G street13.
But perhaps most strikingly, Porterville simply did not allow any Chinese to live or work in town. In the early 1900s, an article printed in the local newspaper stated, “we attribute a great part of our prosperity to a rigorous exclusion of Asiaties. Our methods are simple; we do not allow them to remain. On the other hand, we hold the doors open to all industrious White men, and any such can
easily find work”14.
The vibrant Chinese communities that did exist in the Valley often became targets for racialized violence and city demolition. In Madera15, Visalia16, Modesto17 and Turlock18 White vigilantes burned down Chinese homes and businesses and in Merced, the city demolished the Chinese neighborhood for the purpose of urban redevelopment19.
However, the greatest act of discrimination against the Chinese and their communities, was not committed by White vigilantes, but rather by the Federal Government. In 1882, President Chester Arthur signed the Chinese Exclusion Act which prohibited the immigration of Chinese laborers on the premise that the Chinese “endangered the good order of certain localities”20. With the prohibition of Chinese immigration, historic Chinese communities diminished and newer immigrants of other nationalities moved into the historic Chinatowns.
Japanese Nihonmachi and Increasingly Diverse Ethnic Neighborhoods
In the early 1900’s a new wave of Asian immigrants from Japan, the Philippines, and the Punjab province of India arrived to work in the fields in the San Joaquin Valley. According to federal law, these newer immigrants were not allowed to own property or become citizens, although many found elaborate ways to avoid these restrictions. Like the Chinese before them, the new immigrants faced extreme housing discrimination and were only allowed to live and congregate in certain neighborhoods. In Stockton, for instance, Asians were told
they would be beaten if they ventured north of Webber Street and storefront signs proclaimed “No Dogs and no filipinos allowed”21.
The Japanese immigrants, who constituted the largest ethnic group at the time, formed vibrant ethnic enclaves called Nihonmachi in Lodi, Stockton, Visalia, Fresno, Fowler, Livingston, and Cortez22. These neighborhoods, adjacent to or entwined in the earlier Chinatowns, became commercial hubs for the multiracial ethnic communities and centers for community cohesion and culture23. The Japanese immigrants (unlike the Chinese prior to them) settled in the United States primarily as family units and were thus more able to establish roots and history in their new communities.
Tragically, in 1942, after the bombing of Pearl Harbor, the United States government ordered that all Japanese families must be removed from their homes and businesses and sent to internment camps. Most Japanese families in the San Joaquin Valley were detained in the San Joaquin County, Tulare County, and Fresno County fairgrounds and then dispersed to out-of-state internment camps where they would be held without rights for the subsequent two years.
The once bustling and prosperous ethnic neighborhoods in Lodi, Stockton, Fresno, and Visalia became virtual ghost towns as cities and counties condemned the abandoned homes and boarded up former Japanese businesses. Farmers, who at the time relied primarily on Japanese agricultural labor, struggled to find sufficient workers and had
SECTION 4:Historical and Ongoing Contributors to Racial SegregationIn the previous three sections we highlighted and discussed segregation patterns both at a regional and local level. We saw that while middle-income
and higher-income neighborhoods are becoming increasingly racially and ethnically integrated, areas of concentrated poverty remain disproportionately
non-white with less access to opportunity. Railroads and highways throughout many cities have formed what one former Fresno County Supervisor
described as a kind of “Berlin Wall” - a physical barriers between impoverished communities of color to one side and wealthier, Whiter neighborhoods to
the other10.
Many of these historic racial and spatial divisions originated through discriminatory land use policies, prejudicial immigration laws, racialized violence,
and misguided attempts at urban reinvestment. In this section we will discuss the ways in which historical land use patterns laid the foundation for rural
and urban racially concentrated areas of poverty and how the legacy of housing discrimination continues to affect communities today.
The Other Side of the Tracks: The Formation and Decline of Urban Ethnic Enclaves in the San Joaquin Valley
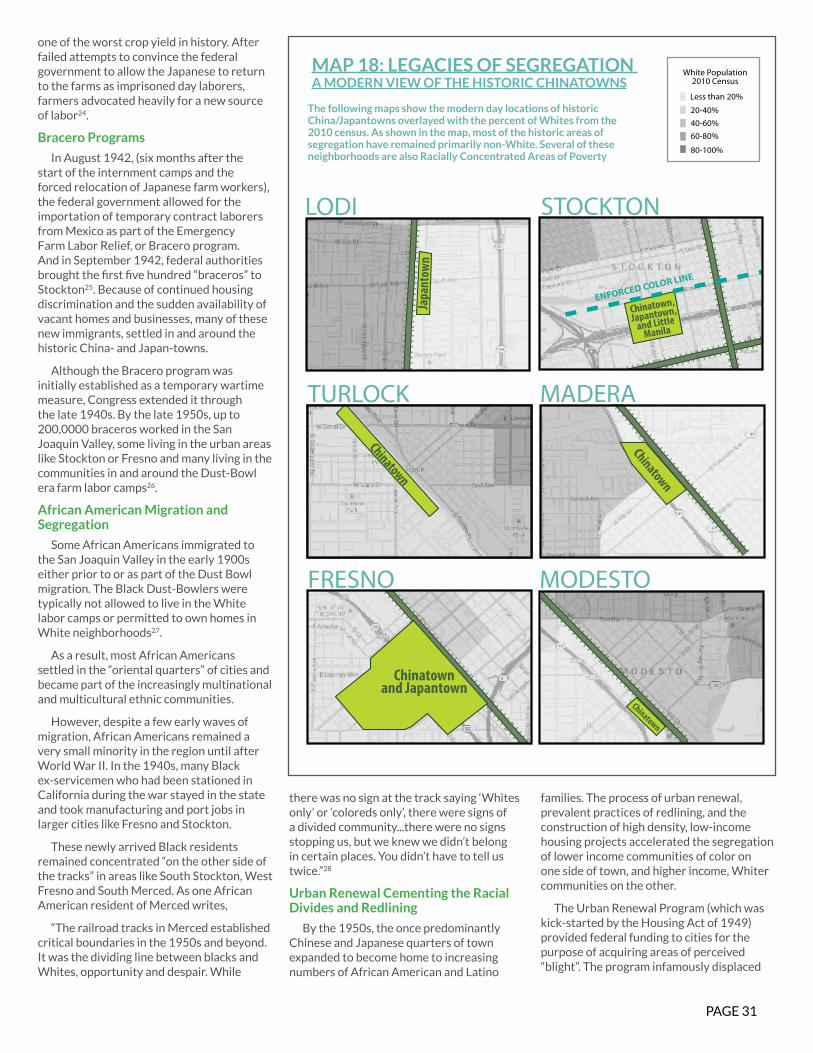
PAGE 31
one of the worst crop yield in history. After failed attempts to convince the federal government to allow the Japanese to return to the farms as imprisoned day laborers, farmers advocated heavily for a new source of labor24.
Bracero Programs
In August 1942, (six months after the start of the internment camps and the forced relocation of Japanese farm workers), the federal government allowed for the importation of temporary contract laborers from Mexico as part of the Emergency Farm Labor Relief, or Bracero program. And in September 1942, federal authorities brought the first five hundred “braceros” to Stockton25. Because of continued housing discrimination and the sudden availability of vacant homes and businesses, many of these new immigrants, settled in and around the historic China- and Japan-towns.
Although the Bracero program was initially established as a temporary wartime measure, Congress extended it through the late 1940s. By the late 1950s, up to 200,0000 braceros worked in the San Joaquin Valley, some living in the urban areas like Stockton or Fresno and many living in the communities in and around the Dust-Bowl era farm labor camps26.
African American Migration and Segregation
Some African Americans immigrated to the San Joaquin Valley in the early 1900s either prior to or as part of the Dust Bowl migration. The Black Dust-Bowlers were typically not allowed to live in the White labor camps or permitted to own homes in White neighborhoods27.
As a result, most African Americans settled in the “oriental quarters” of cities and became part of the increasingly multinational and multicultural ethnic communities.
However, despite a few early waves of migration, African Americans remained a very small minority in the region until after World War II. In the 1940s, many Black ex-servicemen who had been stationed in California during the war stayed in the state and took manufacturing and port jobs in larger cities like Fresno and Stockton.
These newly arrived Black residents remained concentrated “on the other side of the tracks” in areas like South Stockton, West Fresno and South Merced. As one African American resident of Merced writes,
“The railroad tracks in Merced established critical boundaries in the 1950s and beyond.It was the dividing line between blacks and Whites, opportunity and despair. While
there was no sign at the track saying ‘Whites only’ or ‘coloreds only’, there were signs of a divided community...there were no signs stopping us, but we knew we didn’t belong in certain places. You didn’t have to tell us twice.”28
Urban Renewal Cementing the Racial Divides and Redlining
By the 1950s, the once predominantly Chinese and Japanese quarters of town expanded to become home to increasing numbers of African American and Latino
families. The process of urban renewal, prevalent practices of redlining, and the construction of high density, low-income housing projects accelerated the segregation of lower income communities of color on one side of town, and higher income, Whiter communities on the other.
The Urban Renewal Program (which was kick-started by the Housing Act of 1949) provided federal funding to cities for the purpose of acquiring areas of perceived “blight”. The program infamously displaced
Lodi’s Japantown
ENFORCED COLOR LINE
Chinatown,
Japantown, and Little
Manila
STOCKTONLODI
Japa
ntow
n
MADERA
Chinatown
MODESTO
Chinatown
FRESNO
Chinatown and Japantown
TURLOCK
Chinatown
Less than 20%
White Population2010 Census
80-100%
60-80%40-60%20-40%
MAP 18: LEGACIES OF SEGREGATION A MODERN VIEW OF THE HISTORIC CHINATOWNS
The following maps show the modern day locations of historic China/Japantowns overlayed with the percent of Whites from the 2010 census. As shown in the map, most of the historic areas of segregation have remained primarily non-White. Several of these neighborhoods are also Racially Concentrated Areas of Poverty
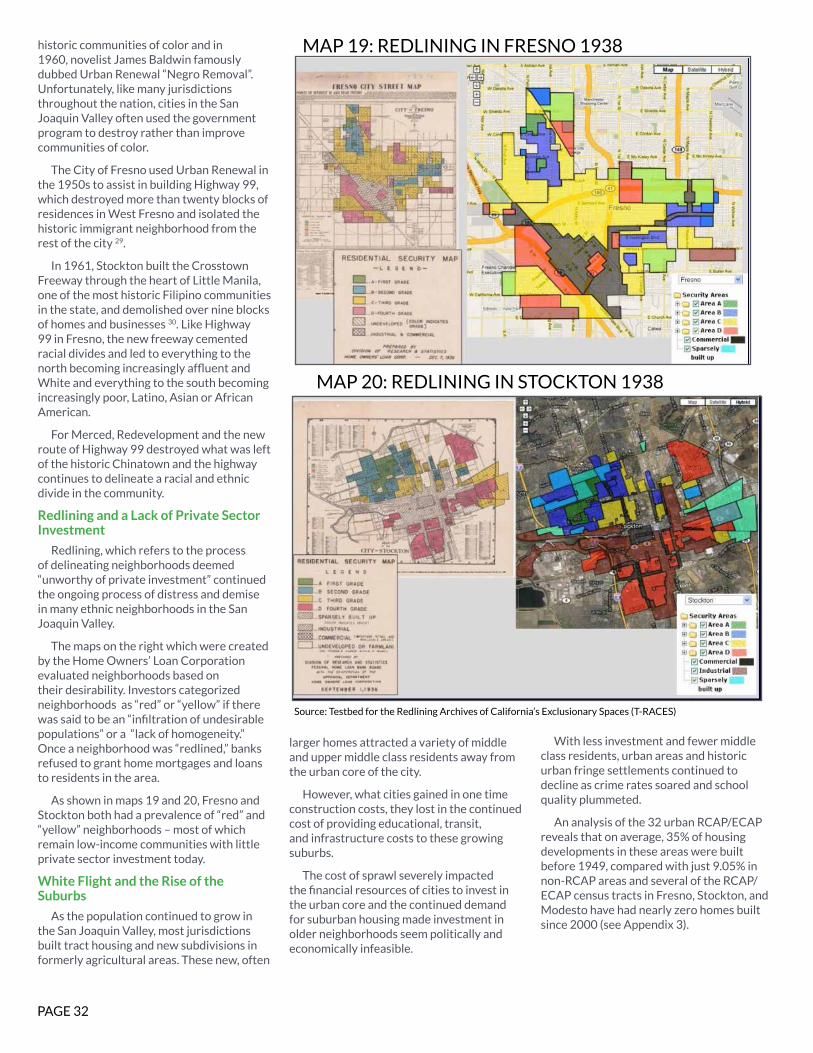
PAGE 32
historic communities of color and in 1960, novelist James Baldwin famously dubbed Urban Renewal “Negro Removal”. Unfortunately, like many jurisdictions throughout the nation, cities in the San Joaquin Valley often used the government program to destroy rather than improve communities of color.
The City of Fresno used Urban Renewal in the 1950s to assist in building Highway 99, which destroyed more than twenty blocks of residences in West Fresno and isolated the historic immigrant neighborhood from the rest of the city 29.
In 1961, Stockton built the Crosstown Freeway through the heart of Little Manila, one of the most historic Filipino communities in the state, and demolished over nine blocks of homes and businesses 30. Like Highway 99 in Fresno, the new freeway cemented racial divides and led to everything to the north becoming increasingly affluent and White and everything to the south becoming increasingly poor, Latino, Asian or African American.
For Merced, Redevelopment and the new route of Highway 99 destroyed what was left of the historic Chinatown and the highway continues to delineate a racial and ethnic divide in the community.
Redlining and a Lack of Private Sector Investment
Redlining, which refers to the process of delineating neighborhoods deemed “unworthy of private investment” continued the ongoing process of distress and demise in many ethnic neighborhoods in the San Joaquin Valley.
The maps on the right which were created by the Home Owners’ Loan Corporation evaluated neighborhoods based on their desirability. Investors categorized neighborhoods as “red” or “yellow” if there was said to be an “infiltration of undesirable populations” or a “lack of homogeneity.” Once a neighborhood was “redlined,” banks refused to grant home mortgages and loans to residents in the area.
As shown in maps 19 and 20, Fresno and Stockton both had a prevalence of “red” and “yellow” neighborhoods – most of which remain low-income communities with little private sector investment today.
White Flight and the Rise of the Suburbs
As the population continued to grow in the San Joaquin Valley, most jurisdictions built tract housing and new subdivisions in formerly agricultural areas. These new, often
larger homes attracted a variety of middle and upper middle class residents away from the urban core of the city.
However, what cities gained in one time construction costs, they lost in the continued cost of providing educational, transit, and infrastructure costs to these growing suburbs.
The cost of sprawl severely impacted the financial resources of cities to invest in the urban core and the continued demand for suburban housing made investment in older neighborhoods seem politically and economically infeasible.
With less investment and fewer middle class residents, urban areas and historic urban fringe settlements continued to decline as crime rates soared and school quality plummeted.
An analysis of the 32 urban RCAP/ECAP reveals that on average, 35% of housing developments in these areas were built before 1949, compared with just 9.05% in non-RCAP areas and several of the RCAP/ECAP census tracts in Fresno, Stockton, and Modesto have had nearly zero homes built since 2000 (see Appendix 3).
MAP 20: REDLINING IN STOCKTON 1938
MAP 19: REDLINING IN FRESNO 1938
Source: Testbed for the Redlining Archives of California’s Exclusionary Spaces (T-RACES)
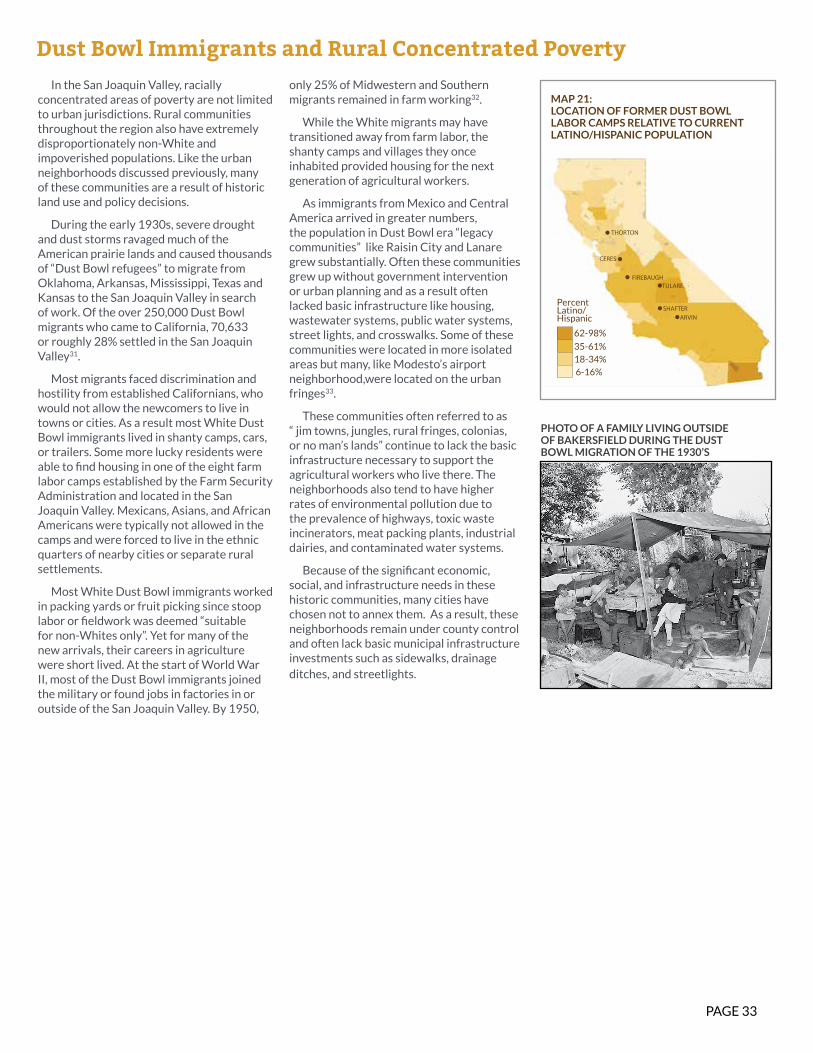
PAGE 33
Dust Bowl Immigrants and Rural Concentrated PovertyIn the San Joaquin Valley, racially
concentrated areas of poverty are not limited to urban jurisdictions. Rural communities throughout the region also have extremely disproportionately non-White and impoverished populations. Like the urban neighborhoods discussed previously, many of these communities are a result of historic land use and policy decisions.
During the early 1930s, severe drought and dust storms ravaged much of the American prairie lands and caused thousands of “Dust Bowl refugees” to migrate from Oklahoma, Arkansas, Mississippi, Texas and Kansas to the San Joaquin Valley in search of work. Of the over 250,000 Dust Bowl migrants who came to California, 70,633 or roughly 28% settled in the San Joaquin Valley31.
Most migrants faced discrimination and hostility from established Californians, who would not allow the newcomers to live in towns or cities. As a result most White Dust Bowl immigrants lived in shanty camps, cars, or trailers. Some more lucky residents were able to find housing in one of the eight farm labor camps established by the Farm Security Administration and located in the San Joaquin Valley. Mexicans, Asians, and African Americans were typically not allowed in the camps and were forced to live in the ethnic quarters of nearby cities or separate rural settlements.
Most White Dust Bowl immigrants worked in packing yards or fruit picking since stoop labor or fieldwork was deemed “suitable for non-Whites only”. Yet for many of the new arrivals, their careers in agriculture were short lived. At the start of World War II, most of the Dust Bowl immigrants joined the military or found jobs in factories in or outside of the San Joaquin Valley. By 1950,
only 25% of Midwestern and Southern migrants remained in farm working32.
While the White migrants may have transitioned away from farm labor, the shanty camps and villages they once inhabited provided housing for the next generation of agricultural workers.
As immigrants from Mexico and Central America arrived in greater numbers, the population in Dust Bowl era “legacy communities” like Raisin City and Lanare grew substantially. Often these communities grew up without government intervention or urban planning and as a result often lacked basic infrastructure like housing, wastewater systems, public water systems, street lights, and crosswalks. Some of these communities were located in more isolated areas but many, like Modesto’s airport neighborhood,were located on the urban fringes33.
These communities often referred to as “ jim towns, jungles, rural fringes, colonias, or no man’s lands” continue to lack the basic infrastructure necessary to support the agricultural workers who live there. The neighborhoods also tend to have higher rates of environmental pollution due to the prevalence of highways, toxic waste incinerators, meat packing plants, industrial dairies, and contaminated water systems.
Because of the significant economic, social, and infrastructure needs in these historic communities, many cities have chosen not to annex them. As a result, these neighborhoods remain under county control and often lack basic municipal infrastructure investments such as sidewalks, drainage ditches, and streetlights.
ARVINSHAFTER
THORTON
CERES
FIREBAUGHTULARE
MAP 21:LOCATION OF FORMER DUST BOWL LABOR CAMPS RELATIVE TO CURRENT LATINO/HISPANIC POPULATION
PHOTO OF A FAMILY LIVING OUTSIDE OF BAKERSFIELD DURING THE DUST BOWL MIGRATION OF THE 1930’S
6-16%18-34%35-61%
62-98%
Percent Latino/Hispanic
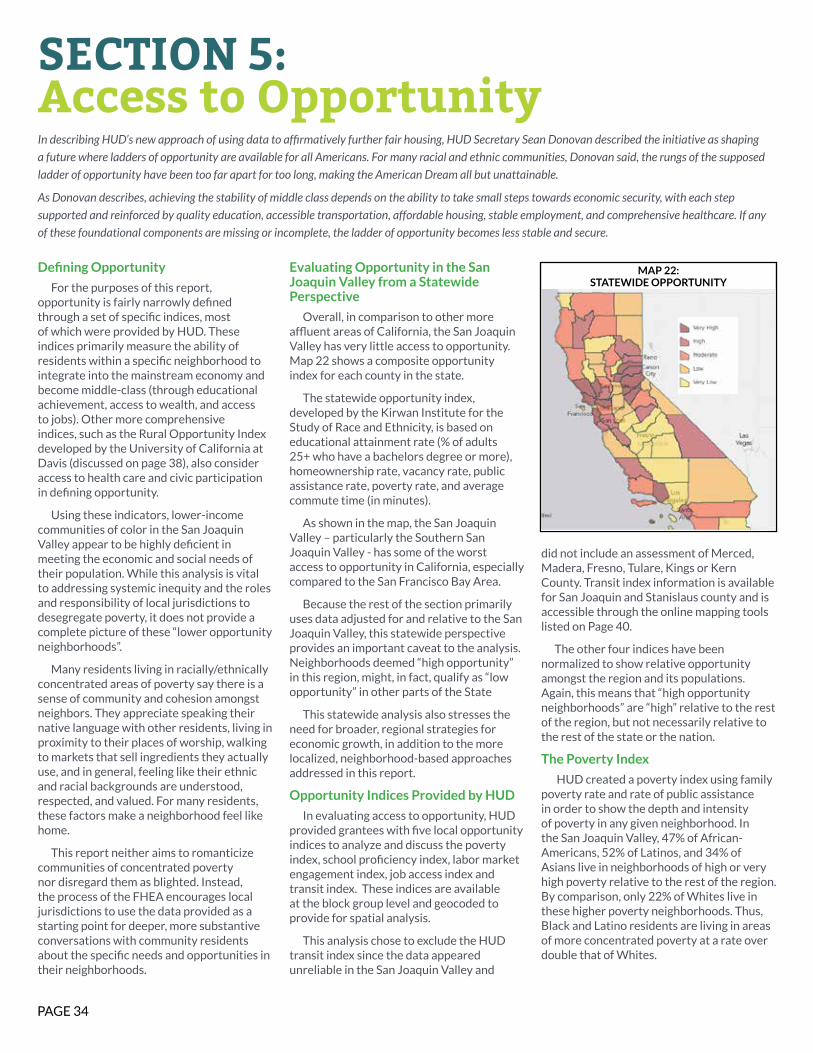
PAGE 34
SECTION 5:Access to OpportunityIn describing HUD’s new approach of using data to affirmatively further fair housing, HUD Secretary Sean Donovan described the initiative as shaping
a future where ladders of opportunity are available for all Americans. For many racial and ethnic communities, Donovan said, the rungs of the supposed
ladder of opportunity have been too far apart for too long, making the American Dream all but unattainable.
As Donovan describes, achieving the stability of middle class depends on the ability to take small steps towards economic security, with each step
supported and reinforced by quality education, accessible transportation, affordable housing, stable employment, and comprehensive healthcare. If any
of these foundational components are missing or incomplete, the ladder of opportunity becomes less stable and secure.
Defining Opportunity
For the purposes of this report, opportunity is fairly narrowly defined through a set of specific indices, most of which were provided by HUD. These indices primarily measure the ability of residents within a specific neighborhood to integrate into the mainstream economy and become middle-class (through educational achievement, access to wealth, and access to jobs). Other more comprehensive indices, such as the Rural Opportunity Index developed by the University of California at Davis (discussed on page 38), also consider access to health care and civic participation in defining opportunity.
Using these indicators, lower-income communities of color in the San Joaquin Valley appear to be highly deficient in meeting the economic and social needs of their population. While this analysis is vital to addressing systemic inequity and the roles and responsibility of local jurisdictions to desegregate poverty, it does not provide a complete picture of these “lower opportunity neighborhoods”.
Many residents living in racially/ethnically concentrated areas of poverty say there is a sense of community and cohesion amongst neighbors. They appreciate speaking their native language with other residents, living in proximity to their places of worship, walking to markets that sell ingredients they actually use, and in general, feeling like their ethnic and racial backgrounds are understood, respected, and valued. For many residents, these factors make a neighborhood feel like home.
This report neither aims to romanticize communities of concentrated poverty nor disregard them as blighted. Instead, the process of the FHEA encourages local jurisdictions to use the data provided as a starting point for deeper, more substantive conversations with community residents about the specific needs and opportunities in their neighborhoods.
Evaluating Opportunity in the San Joaquin Valley from a Statewide Perspective
Overall, in comparison to other more affluent areas of California, the San Joaquin Valley has very little access to opportunity. Map 22 shows a composite opportunity index for each county in the state.
The statewide opportunity index, developed by the Kirwan Institute for the Study of Race and Ethnicity, is based on educational attainment rate (% of adults 25+ who have a bachelors degree or more), homeownership rate, vacancy rate, public assistance rate, poverty rate, and average commute time (in minutes).
As shown in the map, the San Joaquin Valley – particularly the Southern San Joaquin Valley - has some of the worst access to opportunity in California, especially compared to the San Francisco Bay Area.
Because the rest of the section primarily uses data adjusted for and relative to the San Joaquin Valley, this statewide perspective provides an important caveat to the analysis. Neighborhoods deemed “high opportunity” in this region, might, in fact, qualify as “low opportunity” in other parts of the State
This statewide analysis also stresses the need for broader, regional strategies for economic growth, in addition to the more localized, neighborhood-based approaches addressed in this report.
Opportunity Indices Provided by HUD
In evaluating access to opportunity, HUD provided grantees with five local opportunity indices to analyze and discuss the poverty index, school proficiency index, labor market engagement index, job access index and transit index. These indices are available at the block group level and geocoded to provide for spatial analysis.
This analysis chose to exclude the HUD transit index since the data appeared unreliable in the San Joaquin Valley and
did not include an assessment of Merced, Madera, Fresno, Tulare, Kings or Kern County. Transit index information is available for San Joaquin and Stanislaus county and is accessible through the online mapping tools listed on Page 40.
The other four indices have been normalized to show relative opportunity amongst the region and its populations. Again, this means that “high opportunity neighborhoods” are “high” relative to the rest of the region, but not necessarily relative to the rest of the state or the nation.
The Poverty Index
HUD created a poverty index using family poverty rate and rate of public assistance in order to show the depth and intensity of poverty in any given neighborhood. In the San Joaquin Valley, 47% of African-Americans, 52% of Latinos, and 34% of Asians live in neighborhoods of high or very high poverty relative to the rest of the region. By comparison, only 22% of Whites live in these higher poverty neighborhoods. Thus, Black and Latino residents are living in areas of more concentrated poverty at a rate over double that of Whites.
MAP 22:STATEWIDE OPPORTUNITY
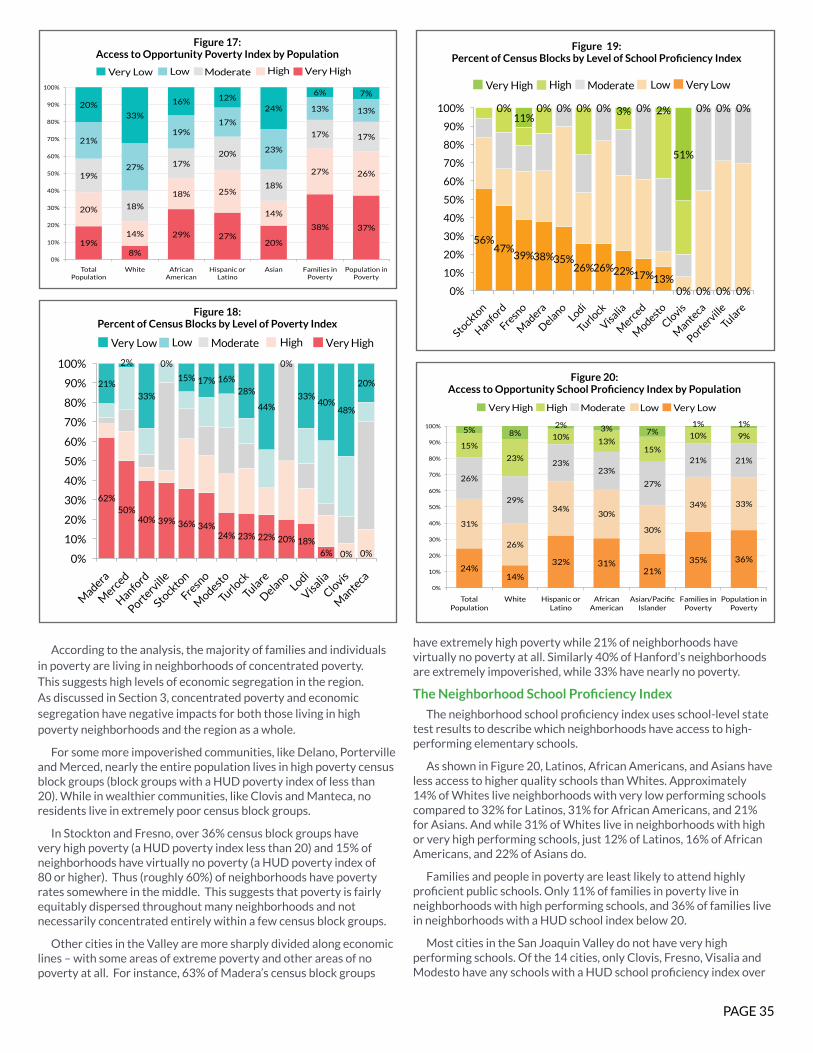
PAGE 35
62%50%
40% 39% 36% 34%24% 23% 22% 20% 18%
6% 0% 0%
21%
2%
33%
0%
15% 17% 16%28%
44%
0%
33%40%
48%
20%
0%
10%
20%
30%
40%
50%
60%
70%
80%
90%
100%
Madera
Merc
ed
Hanford
Porterv
ille
Stockto
n
Fresno
Modesto
Turlock
Tulare
DelanoLodi
Visalia
Clovis
Mante
ca
Low Moderate Very HighHighVery Low
According to the analysis, the majority of families and individuals in poverty are living in neighborhoods of concentrated poverty. This suggests high levels of economic segregation in the region. As discussed in Section 3, concentrated poverty and economic segregation have negative impacts for both those living in high poverty neighborhoods and the region as a whole.
For some more impoverished communities, like Delano, Porterville and Merced, nearly the entire population lives in high poverty census block groups (block groups with a HUD poverty index of less than 20). While in wealthier communities, like Clovis and Manteca, no residents live in extremely poor census block groups.
In Stockton and Fresno, over 36% census block groups have very high poverty (a HUD poverty index less than 20) and 15% of neighborhoods have virtually no poverty (a HUD poverty index of 80 or higher). Thus (roughly 60%) of neighborhoods have poverty rates somewhere in the middle. This suggests that poverty is fairly equitably dispersed throughout many neighborhoods and not necessarily concentrated entirely within a few census block groups.
Other cities in the Valley are more sharply divided along economic lines – with some areas of extreme poverty and other areas of no poverty at all. For instance, 63% of Madera’s census block groups
have extremely high poverty while 21% of neighborhoods have virtually no poverty at all. Similarly 40% of Hanford’s neighborhoods are extremely impoverished, while 33% have nearly no poverty.
The Neighborhood School Proficiency Index
The neighborhood school proficiency index uses school-level state test results to describe which neighborhoods have access to high-performing elementary schools.
As shown in Figure 20, Latinos, African Americans, and Asians have less access to higher quality schools than Whites. Approximately 14% of Whites live neighborhoods with very low performing schools compared to 32% for Latinos, 31% for African Americans, and 21% for Asians. And while 31% of Whites live in neighborhoods with high or very high performing schools, just 12% of Latinos, 16% of African Americans, and 22% of Asians do.
Families and people in poverty are least likely to attend highly proficient public schools. Only 11% of families in poverty live in neighborhoods with high performing schools, and 36% of families live in neighborhoods with a HUD school index below 20.
Most cities in the San Joaquin Valley do not have very high performing schools. Of the 14 cities, only Clovis, Fresno, Visalia and Modesto have any schools with a HUD school proficiency index over
Low Moderate Very HighHighVery Low
19%8%
29% 27%20%
38% 37%
20%
14%
18% 25%
14%
27% 26%19%
18%
17%20%
18%
17% 17%21%
27%
19%17%
23%
13% 13%20%
33%
16% 12%24%
6% 7%
0%
10%
20%
30%
40%
50%
60%
70%
80%
90%
100%
Total Population
White African American
Hispanic or Latino
Asian Families in Poverty
Population in Poverty
24%14%
32% 31%21%
35% 36%
31%
26%
34%30%
30%
34% 33%
26%
29%
23%23%
27%
21% 21%
15%
23%
10%13%
15%
10% 9%5% 8%
2% 3% 7%1% 1%
0%
10%
20%
30%
40%
50%
60%
70%
80%
90%
100%
Total Population
White Hispanic or Latino
African American
Asian/Pacific Islander
Families in Poverty
Population in Poverty
LowModerateVery High High Very Low
Figure 17:Access to Opportunity Poverty Index by Population
Figure 20:Access to Opportunity School Proficiency Index by Population
Figure 18:Percent of Census Blocks by Level of Poverty Index
Figure 19:Percent of Census Blocks by Level of School Proficiency Index
62%50%
40% 39% 36% 34%24% 23% 22% 20% 18%
6% 0% 0%
21%
2%
33%
0%
15% 17% 16%28%
44%
0%
33%40%
48%
20%
0%
10%
20%
30%
40%
50%
60%
70%
80%
90%
100%
Madera
Merc
ed
Hanford
Porterv
ille
Stockto
n
Fresno
Modesto
Turlock
Tulare
DelanoLodi
Visalia
Clovis
Mante
ca
High Moderate Very LowLowVery High
56%47%
39%38%35%26%26%22%17%13%
0% 0% 0% 0%
0%11%
0% 0% 0% 0% 3% 0% 2%
51%
0% 0% 0%
0%
10%
20%
30%
40%
50%
60%
70%
80%
90%
100%
Stockto
n
Hanford
Fresno
Madera
DelanoLodi
Turlock
Visalia
Merc
ed
Modesto
Clovis
Mante
ca
Porterv
ille
Tulare
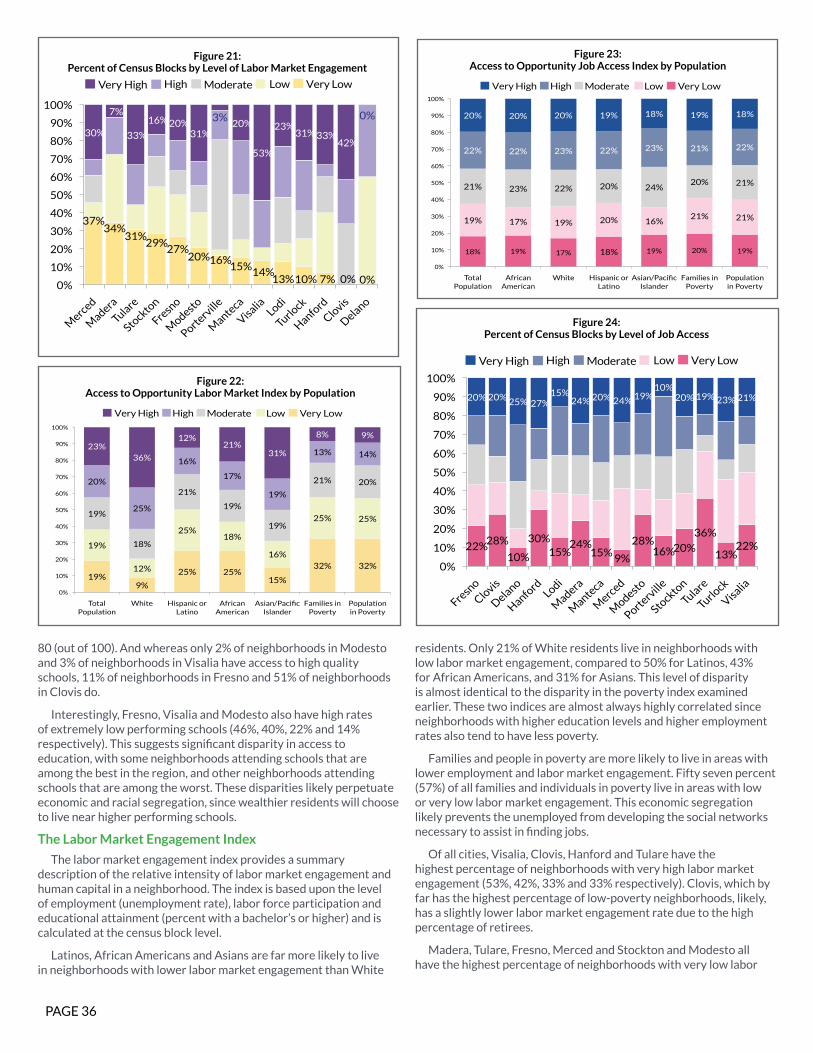
PAGE 36
80 (out of 100). And whereas only 2% of neighborhoods in Modesto and 3% of neighborhoods in Visalia have access to high quality schools, 11% of neighborhoods in Fresno and 51% of neighborhoods in Clovis do.
Interestingly, Fresno, Visalia and Modesto also have high rates of extremely low performing schools (46%, 40%, 22% and 14% respectively). This suggests significant disparity in access to education, with some neighborhoods attending schools that are among the best in the region, and other neighborhoods attending schools that are among the worst. These disparities likely perpetuate economic and racial segregation, since wealthier residents will choose to live near higher performing schools.
The Labor Market Engagement Index
The labor market engagement index provides a summary description of the relative intensity of labor market engagement and human capital in a neighborhood. The index is based upon the level of employment (unemployment rate), labor force participation and educational attainment (percent with a bachelor’s or higher) and is calculated at the census block level.
Latinos, African Americans and Asians are far more likely to live in neighborhoods with lower labor market engagement than White
residents. Only 21% of White residents live in neighborhoods with low labor market engagement, compared to 50% for Latinos, 43% for African Americans, and 31% for Asians. This level of disparity is almost identical to the disparity in the poverty index examined earlier. These two indices are almost always highly correlated since neighborhoods with higher education levels and higher employment rates also tend to have less poverty.
Families and people in poverty are more likely to live in areas with lower employment and labor market engagement. Fifty seven percent (57%) of all families and individuals in poverty live in areas with low or very low labor market engagement. This economic segregation likely prevents the unemployed from developing the social networks necessary to assist in finding jobs.
Of all cities, Visalia, Clovis, Hanford and Tulare have the highest percentage of neighborhoods with very high labor market engagement (53%, 42%, 33% and 33% respectively). Clovis, which by far has the highest percentage of low-poverty neighborhoods, likely, has a slightly lower labor market engagement rate due to the high percentage of retirees.
Madera, Tulare, Fresno, Merced and Stockton and Modesto all have the highest percentage of neighborhoods with very low labor
Figure 21:Percent of Census Blocks by Level of Labor Market Engagement
Figure 24:Percent of Census Blocks by Level of Job Access
High Moderate Very LowLowVery High
22%28%
10%
30%15%
24%15% 9%
28%16%20%
36%
13%22%
20% 20% 25% 27%15%
24% 20% 24% 19%10%
20% 19% 23% 21%
0%
10%
20%
30%
40%
50%
60%
70%
80%
90%
100%
Fresno
Clovis
Delano
Hanford
Lodi
Madera
Mante
ca
Merced
Modesto
Porterville
Stockto
n
Tulare
Turlock
Visalia
18% 19% 17% 18% 19% 20% 19%
19% 17% 19% 20% 16%21% 21%
21% 23% 22% 20% 24%20% 21%
22% 22% 23% 22% 23% 21% 22%
20% 20% 20% 19% 18% 19% 18%
0%
10%
20%
30%
40%
50%
60%
70%
80%
90%
100%
Total Population
African American
White Hispanic or Latino
Asian/Pacific Islander
Families in Poverty
Population in Poverty
LowModerateVery High High Very Low
Figure 23:Access to Opportunity Job Access Index by Population
19%9%
25% 25%15%
32% 32%
19%
12%
25%18%
16%
25% 25%19%
18%
21%
19%
19%
21% 20%20%
25%
16%
17%
19%
13% 14%23%
36%
12%21%
31%
8% 9%
0%
10%
20%
30%
40%
50%
60%
70%
80%
90%
100%
Total Population
White Hispanic or Latino
African American
Asian/Pacific Islander
Families in Poverty
Population in Poverty
LowModerateVery High High Very Low
Figure 22:Access to Opportunity Labor Market Index by Population
62%50%
40% 39% 36% 34%24% 23% 22% 20% 18%
6% 0% 0%
21%
2%
33%
0%
15% 17% 16%28%
44%
0%
33%40%
48%
20%
0%
10%
20%
30%
40%
50%
60%
70%
80%
90%
100%
Madera
Merced
Hanford
Porterville
Stockto
n
Fresno
Modesto
Turlock
Tulare
DelanoLodi
Visalia
Clovis
Mante
ca
High Moderate Very LowLowVery High
56%47%
39%38%35%26%26%22%17%13%
0% 0% 0% 0%
0%11%
0% 0% 0% 0% 3% 0% 2%
51%
0% 0% 0%
0%
10%
20%
30%
40%
50%
60%
70%
80%
90%
100%
Stockto
n
Hanford
Fresno
Madera
DelanoLodi
Turlock
Visalia
Merced
Modesto
Clovis
Mante
ca
Porterville
Tulare
37%34%
31%29%
27%20%16%
15%13%
14%10% 7% 0% 0%
30%
7%
33%
16%20%31%
3%20%
53%
23%31%33%
42%
0%
0%
10%
20%
30%
40%
50%
60%
70%
80%
90%
100%
Merced
Madera
Tulare
Stockto
n
Fresno
Modesto
Porterville
Mante
ca
VisaliaLodi
Turlock
Hanford
Clovis
Delano
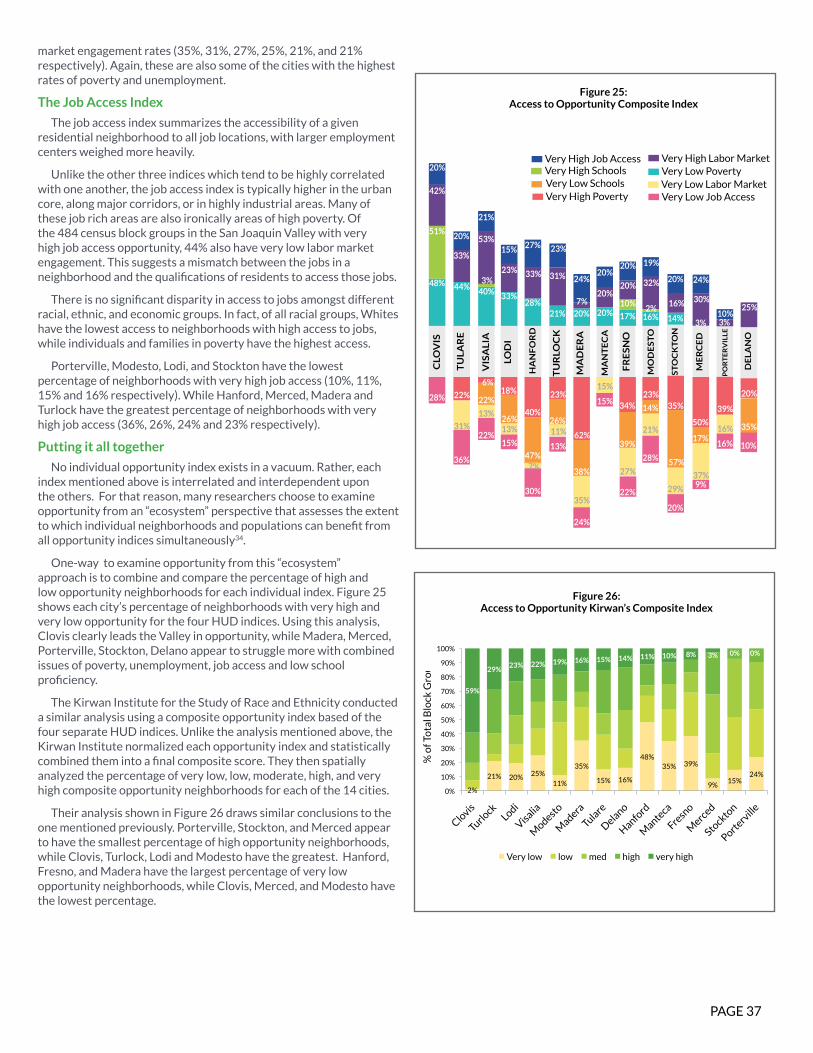
PAGE 37
market engagement rates (35%, 31%, 27%, 25%, 21%, and 21% respectively). Again, these are also some of the cities with the highest rates of poverty and unemployment.
The Job Access Index
The job access index summarizes the accessibility of a given residential neighborhood to all job locations, with larger employment centers weighed more heavily.
Unlike the other three indices which tend to be highly correlated with one another, the job access index is typically higher in the urban core, along major corridors, or in highly industrial areas. Many of these job rich areas are also ironically areas of high poverty. Of the 484 census block groups in the San Joaquin Valley with very high job access opportunity, 44% also have very low labor market engagement. This suggests a mismatch between the jobs in a neighborhood and the qualifications of residents to access those jobs.
There is no significant disparity in access to jobs amongst different racial, ethnic, and economic groups. In fact, of all racial groups, Whites have the lowest access to neighborhoods with high access to jobs, while individuals and families in poverty have the highest access.
Porterville, Modesto, Lodi, and Stockton have the lowest percentage of neighborhoods with very high job access (10%, 11%, 15% and 16% respectively). While Hanford, Merced, Madera and Turlock have the greatest percentage of neighborhoods with very high job access (36%, 26%, 24% and 23% respectively).
Putting it all together
No individual opportunity index exists in a vacuum. Rather, each index mentioned above is interrelated and interdependent upon the others. For that reason, many researchers choose to examine opportunity from an “ecosystem” perspective that assesses the extent to which individual neighborhoods and populations can benefit from all opportunity indices simultaneously34.
One-way to examine opportunity from this “ecosystem” approach is to combine and compare the percentage of high and low opportunity neighborhoods for each individual index. Figure 25 shows each city’s percentage of neighborhoods with very high and very low opportunity for the four HUD indices. Using this analysis, Clovis clearly leads the Valley in opportunity, while Madera, Merced, Porterville, Stockton, Delano appear to struggle more with combined issues of poverty, unemployment, job access and low school proficiency.
The Kirwan Institute for the Study of Race and Ethnicity conducted a similar analysis using a composite opportunity index based of the four separate HUD indices. Unlike the analysis mentioned above, the Kirwan Institute normalized each opportunity index and statistically combined them into a final composite score. They then spatially analyzed the percentage of very low, low, moderate, high, and very high composite opportunity neighborhoods for each of the 14 cities.
Their analysis shown in Figure 26 draws similar conclusions to the one mentioned previously. Porterville, Stockton, and Merced appear to have the smallest percentage of high opportunity neighborhoods, while Clovis, Turlock, Lodi and Modesto have the greatest. Hanford, Fresno, and Madera have the largest percentage of very low opportunity neighborhoods, while Clovis, Merced, and Modesto have the lowest percentage.
Figure 25:Access to Opportunity Composite Index
CLO
VIS
TU
LA
RE
VIS
AL
IA
LOD
I
TU
RLO
CK
MA
DE
RA
FR
ES
NO
ST
OC
KT
ON
MO
DE
ST
O
ME
RC
ED
DE
LA
NO
PO
RT
ER
VIL
LE
MA
NT
EC
A
HA
NF
OR
D
28%
48% 44% 40% 33%
23%
15% 27%
28%20%7% 10%
10%20%
20%20% 32%
19%20%
20%
20%
17% 16%
16%
14% 3% 3%
30%
21%
3%
2%
53%
21%
24%
25%
23%33%
33% 31%
20%51%
42%
20%
24%
36%
22%
22%
6%
22%
26%
47%
26%
38%
39%
34%23%
35%
50%
39%
20%
14%
57%
17%35%
15%
18%15%
62%
30%
40%
13%
23%
24%
22%
28%
20%
16%
16%
37%
29%
21%
27%
15%
35%
11%
7%
13%31%
13%
10%
9%
Very High Job Access Very High Labor MarketVery High Schools Very Low Poverty
Very Low Job AccessVery Low Labor MarketVery Low Schools
Very High Poverty
Figure 26:Access to Opportunity Kirwan’s Composite Index
2%
21% 20% 25%11%
35%
15% 16%
48%35% 39%
9%15%
24%
59%
29%23% 22% 19% 16% 15% 14% 11% 10% 8% 3% 0% 0%
0%
10%
20%
30%
40%
50%
60%
70%
80%
90%
100%
Clovis
Turlock
Lodi
Visalia
Modesto
Madera
Tulare
Delano
Hanford
Mante
ca
Fresno
Merc
ed
Stockto
n
Porterv
ille
% o
f To
tal B
lock
Gro
up
s
Very low low med high very high
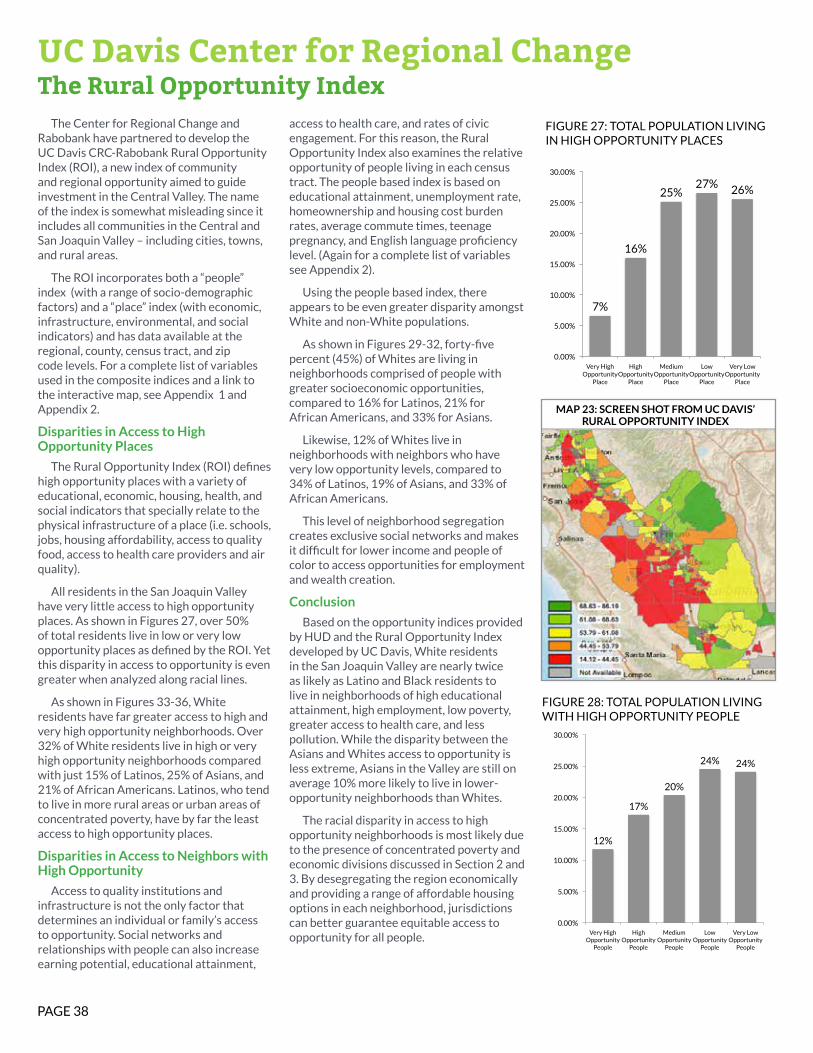
PAGE 38
The Center for Regional Change and Rabobank have partnered to develop the UC Davis CRC-Rabobank Rural Opportunity Index (ROI), a new index of community and regional opportunity aimed to guide investment in the Central Valley. The name of the index is somewhat misleading since it includes all communities in the Central and San Joaquin Valley – including cities, towns, and rural areas.
The ROI incorporates both a “people” index (with a range of socio-demographic factors) and a “place” index (with economic, infrastructure, environmental, and social indicators) and has data available at the regional, county, census tract, and zip code levels. For a complete list of variables used in the composite indices and a link to the interactive map, see Appendix 1 and Appendix 2.
Disparities in Access to High Opportunity Places
The Rural Opportunity Index (ROI) defines high opportunity places with a variety of educational, economic, housing, health, and social indicators that specially relate to the physical infrastructure of a place (i.e. schools, jobs, housing affordability, access to quality food, access to health care providers and air quality).
All residents in the San Joaquin Valley have very little access to high opportunity places. As shown in Figures 27, over 50% of total residents live in low or very low opportunity places as defined by the ROI. Yet this disparity in access to opportunity is even greater when analyzed along racial lines.
As shown in Figures 33-36, White residents have far greater access to high and very high opportunity neighborhoods. Over 32% of White residents live in high or very high opportunity neighborhoods compared with just 15% of Latinos, 25% of Asians, and 21% of African Americans. Latinos, who tend to live in more rural areas or urban areas of concentrated poverty, have by far the least access to high opportunity places.
Disparities in Access to Neighbors with High Opportunity
Access to quality institutions and infrastructure is not the only factor that determines an individual or family’s access to opportunity. Social networks and relationships with people can also increase earning potential, educational attainment,
access to health care, and rates of civic engagement. For this reason, the Rural Opportunity Index also examines the relative opportunity of people living in each census tract. The people based index is based on educational attainment, unemployment rate, homeownership and housing cost burden rates, average commute times, teenage pregnancy, and English language proficiency level. (Again for a complete list of variables see Appendix 2).
Using the people based index, there appears to be even greater disparity amongst White and non-White populations.
As shown in Figures 29-32, forty-five percent (45%) of Whites are living in neighborhoods comprised of people with greater socioeconomic opportunities, compared to 16% for Latinos, 21% for African Americans, and 33% for Asians.
Likewise, 12% of Whites live in neighborhoods with neighbors who have very low opportunity levels, compared to 34% of Latinos, 19% of Asians, and 33% of African Americans.
This level of neighborhood segregation creates exclusive social networks and makes it difficult for lower income and people of color to access opportunities for employment and wealth creation.
Conclusion
Based on the opportunity indices provided by HUD and the Rural Opportunity Index developed by UC Davis, White residents in the San Joaquin Valley are nearly twice as likely as Latino and Black residents to live in neighborhoods of high educational attainment, high employment, low poverty, greater access to health care, and less pollution. While the disparity between the Asians and Whites access to opportunity is less extreme, Asians in the Valley are still on average 10% more likely to live in lower-opportunity neighborhoods than Whites.
The racial disparity in access to high opportunity neighborhoods is most likely due to the presence of concentrated poverty and economic divisions discussed in Section 2 and 3. By desegregating the region economically and providing a range of affordable housing options in each neighborhood, jurisdictions can better guarantee equitable access to opportunity for all people.
UC Davis Center for Regional Change The Rural Opportunity Index
MAP 23: SCREEN SHOT FROM UC DAVIS’ RURAL OPPORTUNITY INDEX
7%
16%
25% 27% 26%
0.00%
5.00%
10.00%
15.00%
20.00%
25.00%
30.00%
Very High Opportunity
Place
High Opportunity
Place
Medium Opportunity
Place
Low Opportunity
Place
Very Low Opportunity
Place
FIGURE 27: TOTAL POPULATION LIVING IN HIGH OPPORTUNITY PLACES
12%
17%
20%
24% 24%
0.00%
5.00%
10.00%
15.00%
20.00%
25.00%
30.00%
Very High Opportunity
People
High Opportunity
People
Medium Opportunity
People
Low Opportunity
People
Very Low Opportunity
People
FIGURE 28: TOTAL POPULATION LIVING WITH HIGH OPPORTUNITY PEOPLE
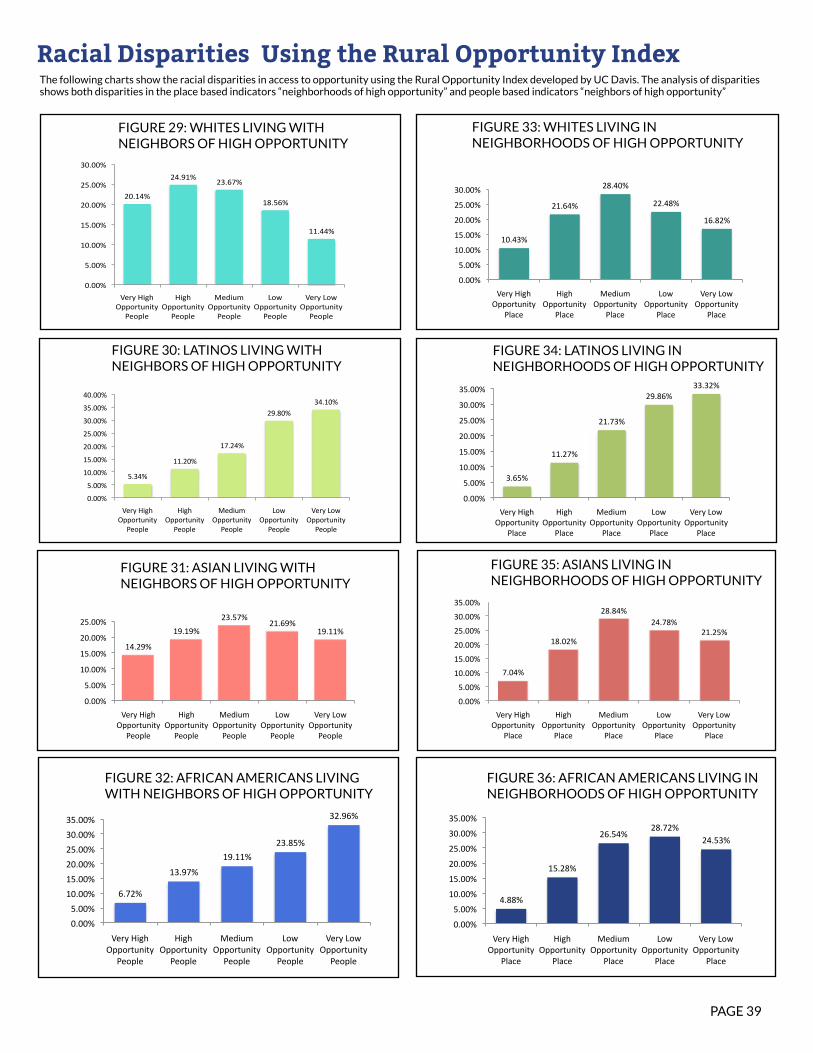
PAGE 39
7.04%
18.02%
28.84% 24.78%
21.25%
0.00%
5.00%
10.00%
15.00%
20.00%
25.00%
30.00%
35.00%
Very High Opportunity
Place
High Opportunity
Place
Medium Opportunity
Place
Low Opportunity
Place
Very Low Opportunity
Place
Asians Living in High Opportunity Neighborhoods
4.88%
15.28%
26.54% 28.72%
24.53%
0.00%
5.00%
10.00%
15.00%
20.00%
25.00%
30.00%
35.00%
Very High Opportunity
Place
High Opportunity
Place
Medium Opportunity
Place
Low Opportunity
Place
Very Low Opportunity
Place
Blacks Living in High Opportunity Neighborhoods
Racial Disparities Using the Rural Opportunity Index
14.29%
19.19%
23.57% 21.69%
19.11%
0.00%
5.00%
10.00%
15.00%
20.00%
25.00%
Very High Opportunity
People
High Opportunity
People
Medium Opportunity
People
Low Opportunity
People
Very Low Opportunity
People
Asians Living with High Opportunity Neighbors
6.72%
13.97%
19.11%
23.85%
32.96%
0.00%
5.00%
10.00%
15.00%
20.00%
25.00%
30.00%
35.00%
Very High Opportunity
People
High Opportunity
People
Medium Opportunity
People
Low Opportunity
People
Very Low Opportunity
People
Blacks Living with High Opportunity Neighbors
10.43%
21.64%
28.40%
22.48%
16.82%
0.00%
5.00%
10.00%
15.00%
20.00%
25.00%
30.00%
Very High Opportunity
Place
High Opportunity
Place
Medium Opportunity
Place
Low Opportunity
Place
Very Low Opportunity
Place
Whites Living in High Opportunity Neighborhoods
20.14%
24.91% 23.67%
18.56%
11.44%
0.00%
5.00%
10.00%
15.00%
20.00%
25.00%
30.00%
Very High Opportunity
People
High Opportunity
People
Medium Opportunity
People
Low Opportunity
People
Very Low Opportunity
People
Whites Living with High Opportunity Neighbors
The following charts show the racial disparities in access to opportunity using the Rural Opportunity Index developed by UC Davis. The analysis of disparities shows both disparities in the place based indicators “neighborhoods of high opportunity” and people based indicators “neighbors of high opportunity”
FIGURE 29: WHITES LIVING WITH NEIGHBORS OF HIGH OPPORTUNITY
FIGURE 32: AFRICAN AMERICANS LIVING WITH NEIGHBORS OF HIGH OPPORTUNITY
FIGURE 35: ASIANS LIVING IN NEIGHBORHOODS OF HIGH OPPORTUNITY
FIGURE 33: WHITES LIVING IN NEIGHBORHOODS OF HIGH OPPORTUNITY
3.65%
11.27%
21.73%
29.86% 33.32%
0.00%
5.00%
10.00%
15.00%
20.00%
25.00%
30.00%
35.00%
Very High Opportunity
Place
High Opportunity
Place
Medium Opportunity
Place
Low Opportunity
Place
Very Low Opportunity
Place
La#nos Living in High Opportunity Neighborhoods
5.34%
11.20%
17.24%
29.80% 34.10%
0.00%
5.00%
10.00%
15.00%
20.00%
25.00%
30.00%
35.00%
40.00%
Very High Opportunity
People
High Opportunity
People
Medium Opportunity
People
Low Opportunity
People
Very Low Opportunity
People
La#nos Living with High Opportunity Neighbors
FIGURE 34: LATINOS LIVING IN NEIGHBORHOODS OF HIGH OPPORTUNITY
FIGURE 31: ASIAN LIVING WITH NEIGHBORS OF HIGH OPPORTUNITY
FIGURE 30: LATINOS LIVING WITH NEIGHBORS OF HIGH OPPORTUNITY
FIGURE 36: AFRICAN AMERICANS LIVING IN NEIGHBORHOODS OF HIGH OPPORTUNITY
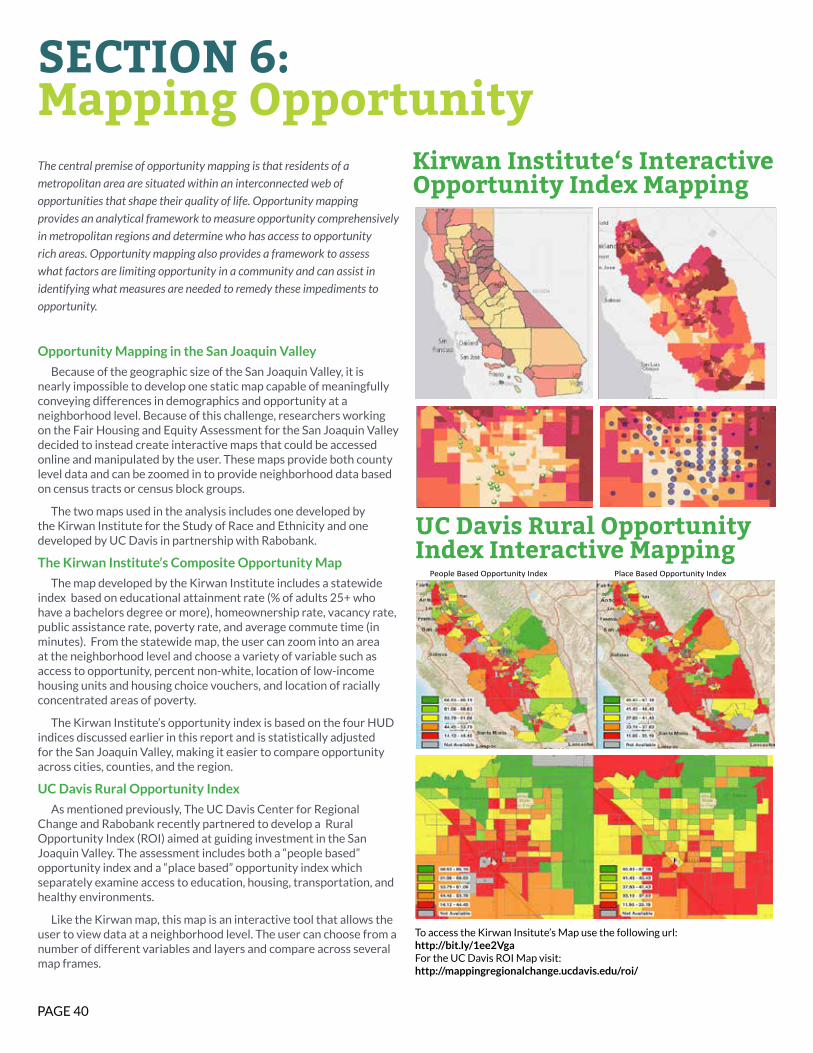
PAGE 40
The central premise of opportunity mapping is that residents of a
metropolitan area are situated within an interconnected web of
opportunities that shape their quality of life. Opportunity mapping
provides an analytical framework to measure opportunity comprehensively
in metropolitan regions and determine who has access to opportunity
rich areas. Opportunity mapping also provides a framework to assess
what factors are limiting opportunity in a community and can assist in
identifying what measures are needed to remedy these impediments to
opportunity.
Opportunity Mapping in the San Joaquin Valley
Because of the geographic size of the San Joaquin Valley, it is nearly impossible to develop one static map capable of meaningfully conveying differences in demographics and opportunity at a neighborhood level. Because of this challenge, researchers working on the Fair Housing and Equity Assessment for the San Joaquin Valley decided to instead create interactive maps that could be accessed online and manipulated by the user. These maps provide both county level data and can be zoomed in to provide neighborhood data based on census tracts or census block groups.
The two maps used in the analysis includes one developed by the Kirwan Institute for the Study of Race and Ethnicity and one developed by UC Davis in partnership with Rabobank.
The Kirwan Institute’s Composite Opportunity Map
The map developed by the Kirwan Institute includes a statewide index based on educational attainment rate (% of adults 25+ who have a bachelors degree or more), homeownership rate, vacancy rate, public assistance rate, poverty rate, and average commute time (in minutes). From the statewide map, the user can zoom into an area at the neighborhood level and choose a variety of variable such as access to opportunity, percent non-white, location of low-income housing units and housing choice vouchers, and location of racially concentrated areas of poverty.
The Kirwan Institute’s opportunity index is based on the four HUD indices discussed earlier in this report and is statistically adjusted for the San Joaquin Valley, making it easier to compare opportunity across cities, counties, and the region.
UC Davis Rural Opportunity Index
As mentioned previously, The UC Davis Center for Regional Change and Rabobank recently partnered to develop a Rural Opportunity Index (ROI) aimed at guiding investment in the San Joaquin Valley. The assessment includes both a “people based” opportunity index and a “place based” opportunity index which separately examine access to education, housing, transportation, and healthy environments.
Like the Kirwan map, this map is an interactive tool that allows the user to view data at a neighborhood level. The user can choose from a number of different variables and layers and compare across several map frames.
SECTION 6:Mapping Opportunity
Kirwan Institute‘s InteractiveOpportunity Index Mapping
UC Davis Rural Opportunity Index Interactive Mapping
People Based Opportunity Index Place Based Opportunity Index
To access the Kirwan Insitute’s Map use the following url: http://bit.ly/1ee2VgaFor the UC Davis ROI Map visit: http://mappingregionalchange.ucdavis.edu/roi/
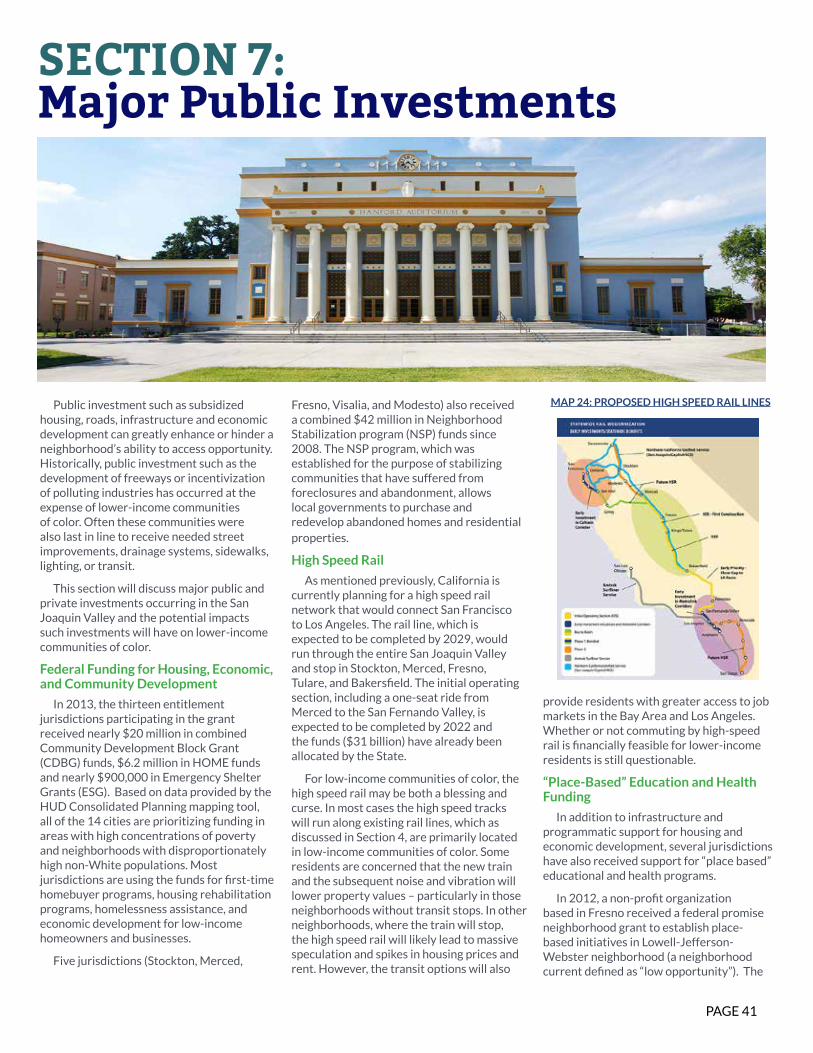
PAGE 41
SECTION 7:Major Public Investments
Public investment such as subsidized housing, roads, infrastructure and economic development can greatly enhance or hinder a neighborhood’s ability to access opportunity. Historically, public investment such as the development of freeways or incentivization of polluting industries has occurred at the expense of lower-income communities of color. Often these communities were also last in line to receive needed street improvements, drainage systems, sidewalks, lighting, or transit.
This section will discuss major public and private investments occurring in the San Joaquin Valley and the potential impacts such investments will have on lower-income communities of color.
Federal Funding for Housing, Economic, and Community Development
In 2013, the thirteen entitlement jurisdictions participating in the grant received nearly $20 million in combined Community Development Block Grant (CDBG) funds, $6.2 million in HOME funds and nearly $900,000 in Emergency Shelter Grants (ESG). Based on data provided by the HUD Consolidated Planning mapping tool, all of the 14 cities are prioritizing funding in areas with high concentrations of poverty and neighborhoods with disproportionately high non-White populations. Most jurisdictions are using the funds for first-time homebuyer programs, housing rehabilitation programs, homelessness assistance, and economic development for low-income homeowners and businesses.
Five jurisdictions (Stockton, Merced,
Fresno, Visalia, and Modesto) also received a combined $42 million in Neighborhood Stabilization program (NSP) funds since 2008. The NSP program, which was established for the purpose of stabilizing communities that have suffered from foreclosures and abandonment, allows local governments to purchase and redevelop abandoned homes and residential properties.
High Speed Rail
As mentioned previously, California is currently planning for a high speed rail network that would connect San Francisco to Los Angeles. The rail line, which is expected to be completed by 2029, would run through the entire San Joaquin Valley and stop in Stockton, Merced, Fresno, Tulare, and Bakersfield. The initial operating section, including a one-seat ride from Merced to the San Fernando Valley, is expected to be completed by 2022 and the funds ($31 billion) have already been allocated by the State.
For low-income communities of color, the high speed rail may be both a blessing and curse. In most cases the high speed tracks will run along existing rail lines, which as discussed in Section 4, are primarily located in low-income communities of color. Some residents are concerned that the new train and the subsequent noise and vibration will lower property values – particularly in those neighborhoods without transit stops. In other neighborhoods, where the train will stop, the high speed rail will likely lead to massive speculation and spikes in housing prices and rent. However, the transit options will also
provide residents with greater access to job markets in the Bay Area and Los Angeles. Whether or not commuting by high-speed rail is financially feasible for lower-income residents is still questionable.
“Place-Based” Education and Health Funding
In addition to infrastructure and programmatic support for housing and economic development, several jurisdictions have also received support for “place based” educational and health programs.
In 2012, a non-profit organization based in Fresno received a federal promise neighborhood grant to establish place-based initiatives in Lowell-Jefferson-Webster neighborhood (a neighborhood current defined as “low opportunity”). The
MAP 24: PROPOSED HIGH SPEED RAIL LINES
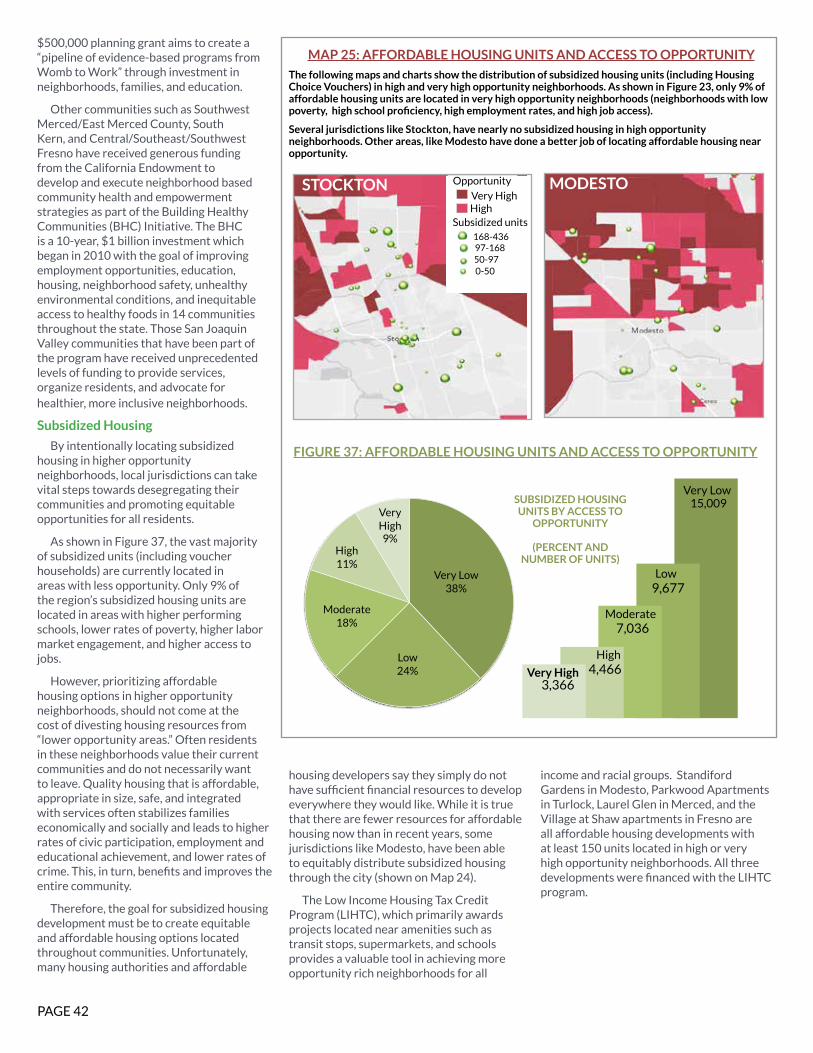
PAGE 42
$500,000 planning grant aims to create a “pipeline of evidence-based programs from Womb to Work” through investment in neighborhoods, families, and education.
Other communities such as Southwest Merced/East Merced County, South Kern, and Central/Southeast/Southwest Fresno have received generous funding from the California Endowment to develop and execute neighborhood based community health and empowerment strategies as part of the Building Healthy Communities (BHC) Initiative. The BHC is a 10-year, $1 billion investment which began in 2010 with the goal of improving employment opportunities, education, housing, neighborhood safety, unhealthy environmental conditions, and inequitable access to healthy foods in 14 communities throughout the state. Those San Joaquin Valley communities that have been part of the program have received unprecedented levels of funding to provide services, organize residents, and advocate for healthier, more inclusive neighborhoods.
Subsidized Housing
By intentionally locating subsidized housing in higher opportunity neighborhoods, local jurisdictions can take vital steps towards desegregating their communities and promoting equitable opportunities for all residents.
As shown in Figure 37, the vast majority of subsidized units (including voucher households) are currently located in areas with less opportunity. Only 9% of the region’s subsidized housing units are located in areas with higher performing schools, lower rates of poverty, higher labor market engagement, and higher access to jobs.
However, prioritizing affordable housing options in higher opportunity neighborhoods, should not come at the cost of divesting housing resources from “lower opportunity areas.” Often residents in these neighborhoods value their current communities and do not necessarily want to leave. Quality housing that is affordable, appropriate in size, safe, and integrated with services often stabilizes families economically and socially and leads to higher rates of civic participation, employment and educational achievement, and lower rates of crime. This, in turn, benefits and improves the entire community.
Therefore, the goal for subsidized housing development must be to create equitable and affordable housing options located throughout communities. Unfortunately, many housing authorities and affordable
housing developers say they simply do not have sufficient financial resources to develop everywhere they would like. While it is true that there are fewer resources for affordable housing now than in recent years, some jurisdictions like Modesto, have been able to equitably distribute subsidized housing through the city (shown on Map 24).
The Low Income Housing Tax Credit Program (LIHTC), which primarily awards projects located near amenities such as transit stops, supermarkets, and schools provides a valuable tool in achieving more opportunity rich neighborhoods for all
income and racial groups. Standiford Gardens in Modesto, Parkwood Apartments in Turlock, Laurel Glen in Merced, and the Village at Shaw apartments in Fresno are all affordable housing developments with at least 150 units located in high or very high opportunity neighborhoods. All three developments were financed with the LIHTC program.
15,009
9,677
7,036
4,466 3,366
Very Low
Low
Moderate
High
Very High
SUBSIDIZED HOUSING UNITS BY ACCESS TO
OPPORTUNITY
(PERCENT AND NUMBER OF UNITS)
MAP 25: AFFORDABLE HOUSING UNITS AND ACCESS TO OPPORTUNITY
FIGURE 37: AFFORDABLE HOUSING UNITS AND ACCESS TO OPPORTUNITY
STOCKTON
The following maps and charts show the distribution of subsidized housing units (including Housing Choice Vouchers) in high and very high opportunity neighborhoods. As shown in Figure 23, only 9% of affordable housing units are located in very high opportunity neighborhoods (neighborhoods with low poverty, high school proficiency, high employment rates, and high job access).
Several jurisdictions like Stockton, have nearly no subsidized housing in high opportunity neighborhoods. Other areas, like Modesto have done a better job of locating affordable housing near opportunity.
Very HighHigh
Opportunity
Subsidized units
50-9797-168168-436
0-50
MODESTO
Very Low38%
Low24%
Moderate18%
High11%
Very High9%
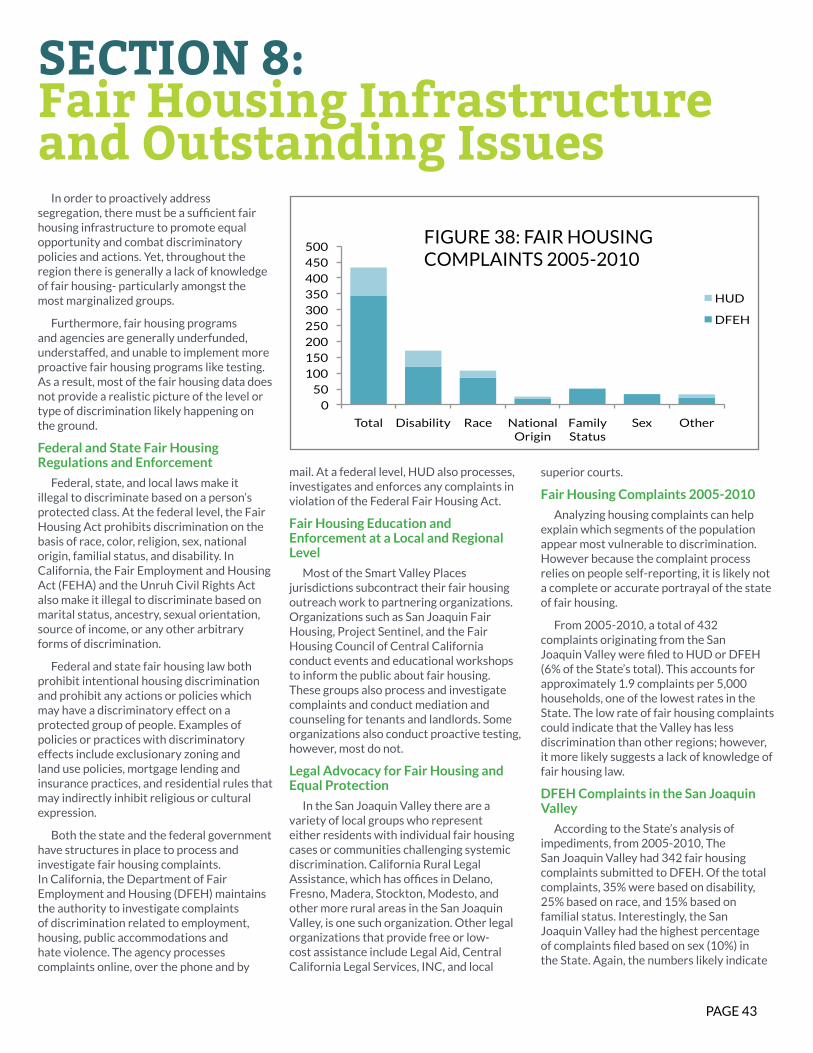
PAGE 43
SECTION 8:Fair Housing Infrastructureand Outstanding Issues
In order to proactively address segregation, there must be a sufficient fair housing infrastructure to promote equal opportunity and combat discriminatory policies and actions. Yet, throughout the region there is generally a lack of knowledge of fair housing- particularly amongst the most marginalized groups.
Furthermore, fair housing programs and agencies are generally underfunded, understaffed, and unable to implement more proactive fair housing programs like testing. As a result, most of the fair housing data does not provide a realistic picture of the level or type of discrimination likely happening on the ground.
Federal and State Fair Housing Regulations and Enforcement
Federal, state, and local laws make it illegal to discriminate based on a person’s protected class. At the federal level, the Fair Housing Act prohibits discrimination on the basis of race, color, religion, sex, national origin, familial status, and disability. In California, the Fair Employment and Housing Act (FEHA) and the Unruh Civil Rights Act also make it illegal to discriminate based on marital status, ancestry, sexual orientation, source of income, or any other arbitrary forms of discrimination.
Federal and state fair housing law both prohibit intentional housing discrimination and prohibit any actions or policies which may have a discriminatory effect on a protected group of people. Examples of policies or practices with discriminatory effects include exclusionary zoning and land use policies, mortgage lending and insurance practices, and residential rules that may indirectly inhibit religious or cultural expression.
Both the state and the federal government have structures in place to process and investigate fair housing complaints. In California, the Department of Fair Employment and Housing (DFEH) maintains the authority to investigate complaints of discrimination related to employment, housing, public accommodations and hate violence. The agency processes complaints online, over the phone and by
mail. At a federal level, HUD also processes, investigates and enforces any complaints in violation of the Federal Fair Housing Act.
Fair Housing Education and Enforcement at a Local and Regional Level
Most of the Smart Valley Places jurisdictions subcontract their fair housing outreach work to partnering organizations. Organizations such as San Joaquin Fair Housing, Project Sentinel, and the Fair Housing Council of Central California conduct events and educational workshops to inform the public about fair housing. These groups also process and investigate complaints and conduct mediation and counseling for tenants and landlords. Some organizations also conduct proactive testing, however, most do not.
Legal Advocacy for Fair Housing and Equal Protection
In the San Joaquin Valley there are a variety of local groups who represent either residents with individual fair housing cases or communities challenging systemic discrimination. California Rural Legal Assistance, which has offices in Delano, Fresno, Madera, Stockton, Modesto, and other more rural areas in the San Joaquin Valley, is one such organization. Other legal organizations that provide free or low-cost assistance include Legal Aid, Central California Legal Services, INC, and local
superior courts.
Fair Housing Complaints 2005-2010
Analyzing housing complaints can help explain which segments of the population appear most vulnerable to discrimination. However because the complaint process relies on people self-reporting, it is likely not a complete or accurate portrayal of the state of fair housing.
From 2005-2010, a total of 432 complaints originating from the San Joaquin Valley were filed to HUD or DFEH (6% of the State’s total). This accounts for approximately 1.9 complaints per 5,000 households, one of the lowest rates in the State. The low rate of fair housing complaints could indicate that the Valley has less discrimination than other regions; however, it more likely suggests a lack of knowledge of fair housing law.
DFEH Complaints in the San Joaquin Valley
According to the State’s analysis of impediments, from 2005-2010, The San Joaquin Valley had 342 fair housing complaints submitted to DFEH. Of the total complaints, 35% were based on disability, 25% based on race, and 15% based on familial status. Interestingly, the San Joaquin Valley had the highest percentage of complaints filed based on sex (10%) in the State. Again, the numbers likely indicate
0
50
100
150
200
250
300
350
400
450
500
Total Disability Race National Origin
Family Status
Sex Other
HUD
DFEH
FIGURE 38: FAIR HOUSING COMPLAINTS 2005-2010
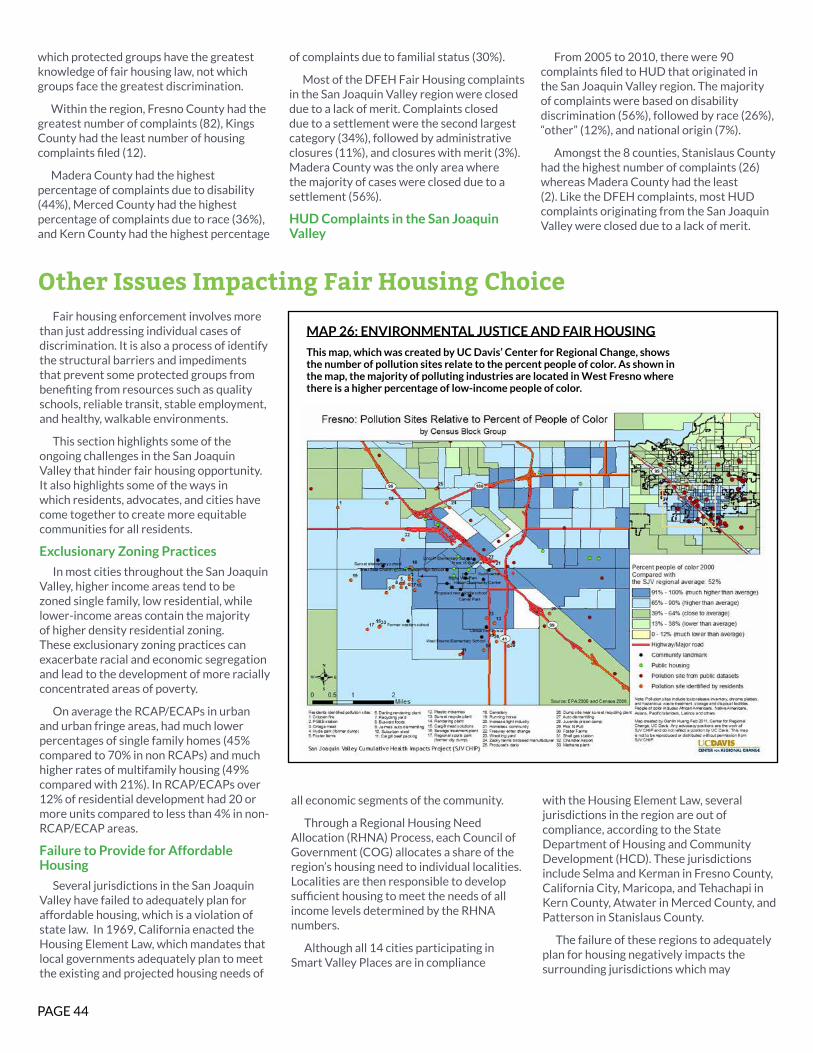
PAGE 44
Fair housing enforcement involves more than just addressing individual cases of discrimination. It is also a process of identify the structural barriers and impediments that prevent some protected groups from benefiting from resources such as quality schools, reliable transit, stable employment, and healthy, walkable environments.
This section highlights some of the ongoing challenges in the San Joaquin Valley that hinder fair housing opportunity. It also highlights some of the ways in which residents, advocates, and cities have come together to create more equitable communities for all residents.
Exclusionary Zoning Practices
In most cities throughout the San Joaquin Valley, higher income areas tend to be zoned single family, low residential, while lower-income areas contain the majority of higher density residential zoning. These exclusionary zoning practices can exacerbate racial and economic segregation and lead to the development of more racially concentrated areas of poverty.
On average the RCAP/ECAPs in urban and urban fringe areas, had much lower percentages of single family homes (45% compared to 70% in non RCAPs) and much higher rates of multifamily housing (49% compared with 21%). In RCAP/ECAPs over 12% of residential development had 20 or more units compared to less than 4% in non-RCAP/ECAP areas.
Failure to Provide for Affordable Housing
Several jurisdictions in the San Joaquin Valley have failed to adequately plan for affordable housing, which is a violation of state law. In 1969, California enacted the Housing Element Law, which mandates that local governments adequately plan to meet the existing and projected housing needs of
all economic segments of the community.
Through a Regional Housing Need Allocation (RHNA) Process, each Council of Government (COG) allocates a share of the region’s housing need to individual localities. Localities are then responsible to develop sufficient housing to meet the needs of all income levels determined by the RHNA numbers.
Although all 14 cities participating in Smart Valley Places are in compliance
with the Housing Element Law, several jurisdictions in the region are out of compliance, according to the State Department of Housing and Community Development (HCD). These jurisdictions include Selma and Kerman in Fresno County, California City, Maricopa, and Tehachapi in Kern County, Atwater in Merced County, and Patterson in Stanislaus County.
The failure of these regions to adequately plan for housing negatively impacts the surrounding jurisdictions which may
which protected groups have the greatest knowledge of fair housing law, not which groups face the greatest discrimination.
Within the region, Fresno County had the greatest number of complaints (82), Kings County had the least number of housing complaints filed (12).
Madera County had the highest percentage of complaints due to disability (44%), Merced County had the highest percentage of complaints due to race (36%), and Kern County had the highest percentage
of complaints due to familial status (30%).
Most of the DFEH Fair Housing complaints in the San Joaquin Valley region were closed due to a lack of merit. Complaints closed due to a settlement were the second largest category (34%), followed by administrative closures (11%), and closures with merit (3%). Madera County was the only area where the majority of cases were closed due to a settlement (56%).
HUD Complaints in the San Joaquin Valley
From 2005 to 2010, there were 90 complaints filed to HUD that originated in the San Joaquin Valley region. The majority of complaints were based on disability discrimination (56%), followed by race (26%), “other” (12%), and national origin (7%).
Amongst the 8 counties, Stanislaus County had the highest number of complaints (26) whereas Madera County had the least (2). Like the DFEH complaints, most HUD complaints originating from the San Joaquin Valley were closed due to a lack of merit.
Other Issues Impacting Fair Housing Choice
MAP 26: ENVIRONMENTAL JUSTICE AND FAIR HOUSING
This map, which was created by UC Davis’ Center for Regional Change, shows the number of pollution sites relate to the percent people of color. As shown in the map, the majority of polluting industries are located in West Fresno where there is a higher percentage of low-income people of color.
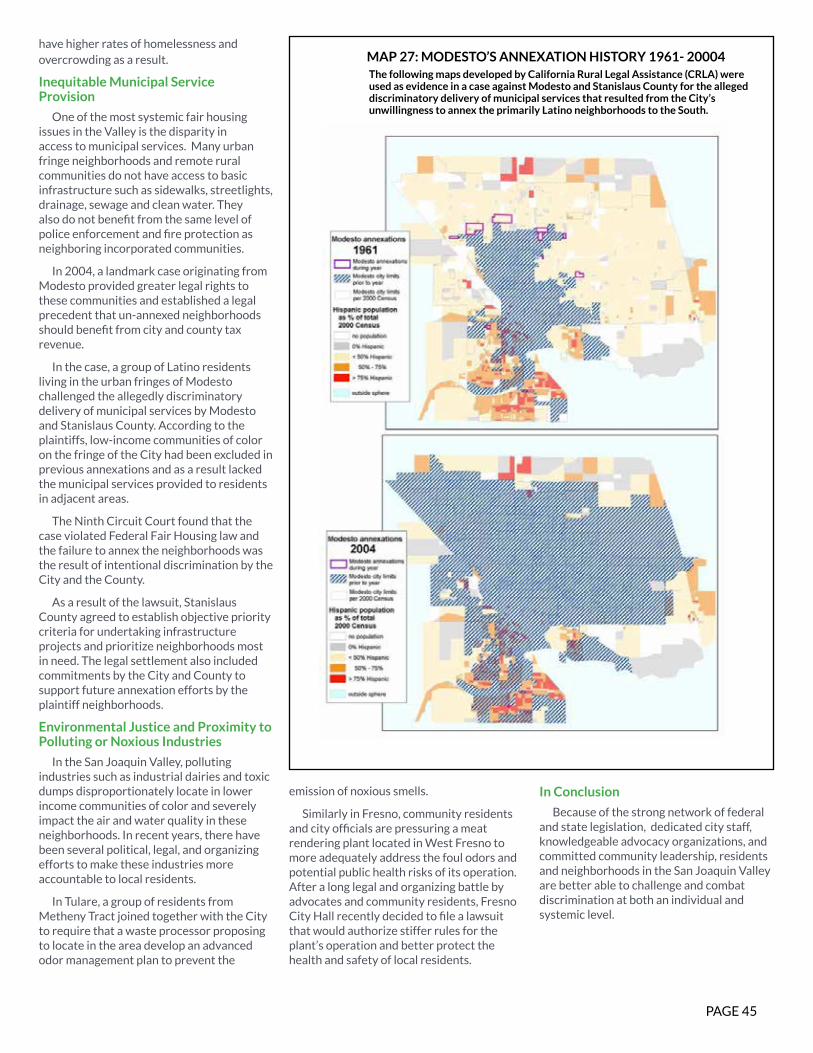
PAGE 45
have higher rates of homelessness and overcrowding as a result.
Inequitable Municipal Service Provision
One of the most systemic fair housing issues in the Valley is the disparity in access to municipal services. Many urban fringe neighborhoods and remote rural communities do not have access to basic infrastructure such as sidewalks, streetlights, drainage, sewage and clean water. They also do not benefit from the same level of police enforcement and fire protection as neighboring incorporated communities.
In 2004, a landmark case originating from Modesto provided greater legal rights to these communities and established a legal precedent that un-annexed neighborhoods should benefit from city and county tax revenue.
In the case, a group of Latino residents living in the urban fringes of Modesto challenged the allegedly discriminatory delivery of municipal services by Modesto and Stanislaus County. According to the plaintiffs, low-income communities of color on the fringe of the City had been excluded in previous annexations and as a result lacked the municipal services provided to residents in adjacent areas.
The Ninth Circuit Court found that the case violated Federal Fair Housing law and the failure to annex the neighborhoods was the result of intentional discrimination by the City and the County.
As a result of the lawsuit, Stanislaus County agreed to establish objective priority criteria for undertaking infrastructure projects and prioritize neighborhoods most in need. The legal settlement also included commitments by the City and County to support future annexation efforts by the plaintiff neighborhoods.
Environmental Justice and Proximity to Polluting or Noxious Industries
In the San Joaquin Valley, polluting industries such as industrial dairies and toxic dumps disproportionately locate in lower income communities of color and severely impact the air and water quality in these neighborhoods. In recent years, there have been several political, legal, and organizing efforts to make these industries more accountable to local residents.
In Tulare, a group of residents from Metheny Tract joined together with the City to require that a waste processor proposing to locate in the area develop an advanced odor management plan to prevent the
emission of noxious smells.
Similarly in Fresno, community residents and city officials are pressuring a meat rendering plant located in West Fresno to more adequately address the foul odors and potential public health risks of its operation. After a long legal and organizing battle by advocates and community residents, Fresno City Hall recently decided to file a lawsuit that would authorize stiffer rules for the plant’s operation and better protect the health and safety of local residents.
In Conclusion
Because of the strong network of federal and state legislation, dedicated city staff, knowledgeable advocacy organizations, and committed community leadership, residents and neighborhoods in the San Joaquin Valley are better able to challenge and combat discrimination at both an individual and systemic level.
MAP 27: MODESTO’S ANNEXATION HISTORY 1961- 20004The following maps developed by California Rural Legal Assistance (CRLA) were used as evidence in a case against Modesto and Stanislaus County for the alleged discriminatory delivery of municipal services that resulted from the City’s unwillingness to annex the primarily Latino neighborhoods to the South.
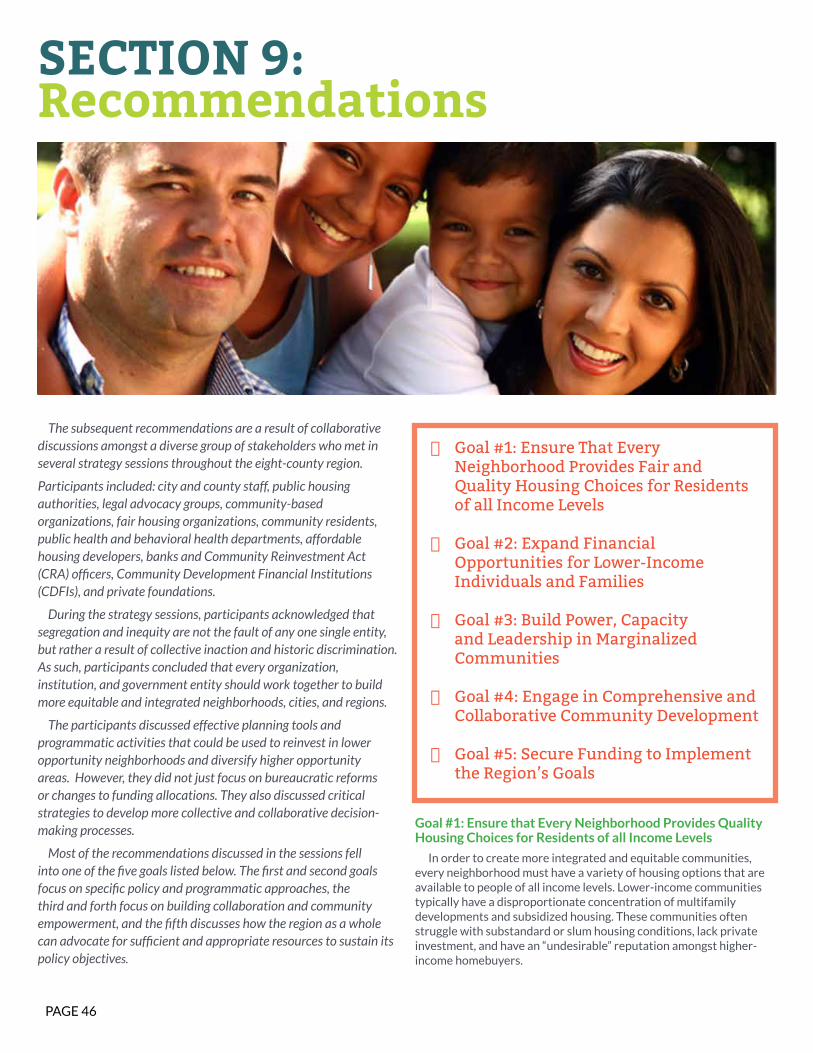
PAGE 46
SECTION 9:Recommendations
Goal #1: Ensure that Every Neighborhood Provides Quality Housing Choices for Residents of all Income Levels
In order to create more integrated and equitable communities, every neighborhood must have a variety of housing options that are available to people of all income levels. Lower-income communities typically have a disproportionate concentration of multifamily developments and subsidized housing. These communities often struggle with substandard or slum housing conditions, lack private investment, and have an “undesirable” reputation amongst higher-income homebuyers.
· Goal #1: Ensure That Every Neighborhood Provides Fair and Quality Housing Choices for Residents of all Income Levels
· Goal #2: Expand Financial Opportunities for Lower-Income Individuals and Families
· Goal #3: Build Power, Capacity and Leadership in Marginalized Communities
· Goal #4: Engage in Comprehensive and Collaborative Community Development
· Goal #5: Secure Funding to Implement the Region’s Goals
The subsequent recommendations are a result of collaborative discussions amongst a diverse group of stakeholders who met in several strategy sessions throughout the eight-county region.
Participants included: city and county staff, public housing authorities, legal advocacy groups, community-based organizations, fair housing organizations, community residents, public health and behavioral health departments, affordable housing developers, banks and Community Reinvestment Act (CRA) officers, Community Development Financial Institutions (CDFIs), and private foundations.
During the strategy sessions, participants acknowledged that segregation and inequity are not the fault of any one single entity, but rather a result of collective inaction and historic discrimination. As such, participants concluded that every organization, institution, and government entity should work together to build more equitable and integrated neighborhoods, cities, and regions.
The participants discussed effective planning tools and programmatic activities that could be used to reinvest in lower opportunity neighborhoods and diversify higher opportunity areas. However, they did not just focus on bureaucratic reforms or changes to funding allocations. They also discussed critical strategies to develop more collective and collaborative decision-making processes.
Most of the recommendations discussed in the sessions fell into one of the five goals listed below. The first and second goals focus on specific policy and programmatic approaches, the third and forth focus on building collaboration and community empowerment, and the fifth discusses how the region as a whole can advocate for sufficient and appropriate resources to sustain its policy objectives.
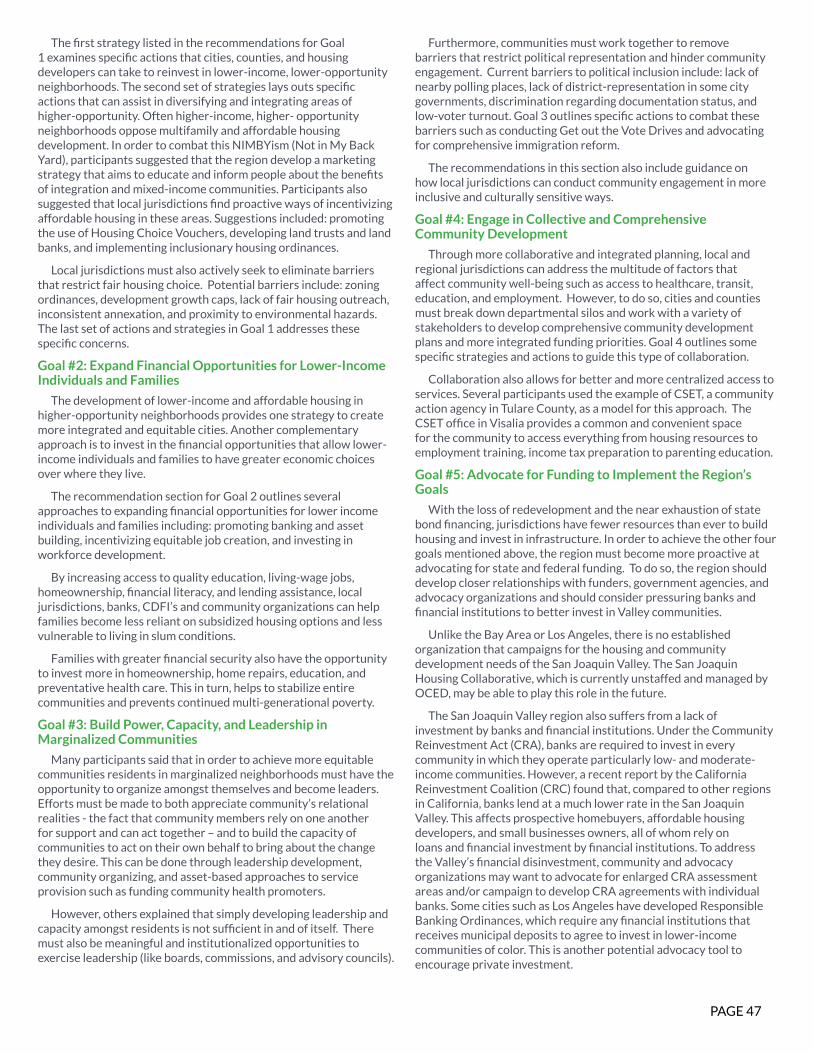
PAGE 47
The first strategy listed in the recommendations for Goal 1 examines specific actions that cities, counties, and housing developers can take to reinvest in lower-income, lower-opportunity neighborhoods. The second set of strategies lays outs specific actions that can assist in diversifying and integrating areas of higher-opportunity. Often higher-income, higher- opportunity neighborhoods oppose multifamily and affordable housing development. In order to combat this NIMBYism (Not in My Back Yard), participants suggested that the region develop a marketing strategy that aims to educate and inform people about the benefits of integration and mixed-income communities. Participants also suggested that local jurisdictions find proactive ways of incentivizing affordable housing in these areas. Suggestions included: promoting the use of Housing Choice Vouchers, developing land trusts and land banks, and implementing inclusionary housing ordinances.
Local jurisdictions must also actively seek to eliminate barriers that restrict fair housing choice. Potential barriers include: zoning ordinances, development growth caps, lack of fair housing outreach, inconsistent annexation, and proximity to environmental hazards. The last set of actions and strategies in Goal 1 addresses these specific concerns.
Goal #2: Expand Financial Opportunities for Lower-Income Individuals and Families
The development of lower-income and affordable housing in higher-opportunity neighborhoods provides one strategy to create more integrated and equitable cities. Another complementary approach is to invest in the financial opportunities that allow lower-income individuals and families to have greater economic choices over where they live.
The recommendation section for Goal 2 outlines several approaches to expanding financial opportunities for lower income individuals and families including: promoting banking and asset building, incentivizing equitable job creation, and investing in workforce development.
By increasing access to quality education, living-wage jobs, homeownership, financial literacy, and lending assistance, local jurisdictions, banks, CDFI’s and community organizations can help families become less reliant on subsidized housing options and less vulnerable to living in slum conditions.
Families with greater financial security also have the opportunity to invest more in homeownership, home repairs, education, and preventative health care. This in turn, helps to stabilize entire communities and prevents continued multi-generational poverty.
Goal #3: Build Power, Capacity, and Leadership in Marginalized Communities
Many participants said that in order to achieve more equitable communities residents in marginalized neighborhoods must have the opportunity to organize amongst themselves and become leaders. Efforts must be made to both appreciate community’s relational realities - the fact that community members rely on one another for support and can act together – and to build the capacity of communities to act on their own behalf to bring about the change they desire. This can be done through leadership development, community organizing, and asset-based approaches to service provision such as funding community health promoters.
However, others explained that simply developing leadership and capacity amongst residents is not sufficient in and of itself. There must also be meaningful and institutionalized opportunities to exercise leadership (like boards, commissions, and advisory councils).
Furthermore, communities must work together to remove barriers that restrict political representation and hinder community engagement. Current barriers to political inclusion include: lack of nearby polling places, lack of district-representation in some city governments, discrimination regarding documentation status, and low-voter turnout. Goal 3 outlines specific actions to combat these barriers such as conducting Get out the Vote Drives and advocating for comprehensive immigration reform.
The recommendations in this section also include guidance on how local jurisdictions can conduct community engagement in more inclusive and culturally sensitive ways.
Goal #4: Engage in Collective and Comprehensive Community Development
Through more collaborative and integrated planning, local and regional jurisdictions can address the multitude of factors that affect community well-being such as access to healthcare, transit, education, and employment. However, to do so, cities and counties must break down departmental silos and work with a variety of stakeholders to develop comprehensive community development plans and more integrated funding priorities. Goal 4 outlines some specific strategies and actions to guide this type of collaboration.
Collaboration also allows for better and more centralized access to services. Several participants used the example of CSET, a community action agency in Tulare County, as a model for this approach. The CSET office in Visalia provides a common and convenient space for the community to access everything from housing resources to employment training, income tax preparation to parenting education.
Goal #5: Advocate for Funding to Implement the Region’s Goals
With the loss of redevelopment and the near exhaustion of state bond financing, jurisdictions have fewer resources than ever to build housing and invest in infrastructure. In order to achieve the other four goals mentioned above, the region must become more proactive at advocating for state and federal funding. To do so, the region should develop closer relationships with funders, government agencies, and advocacy organizations and should consider pressuring banks and financial institutions to better invest in Valley communities.
Unlike the Bay Area or Los Angeles, there is no established organization that campaigns for the housing and community development needs of the San Joaquin Valley. The San Joaquin Housing Collaborative, which is currently unstaffed and managed by OCED, may be able to play this role in the future.
The San Joaquin Valley region also suffers from a lack of investment by banks and financial institutions. Under the Community Reinvestment Act (CRA), banks are required to invest in every community in which they operate particularly low- and moderate-income communities. However, a recent report by the California Reinvestment Coalition (CRC) found that, compared to other regions in California, banks lend at a much lower rate in the San Joaquin Valley. This affects prospective homebuyers, affordable housing developers, and small businesses owners, all of whom rely on loans and financial investment by financial institutions. To address the Valley’s financial disinvestment, community and advocacy organizations may want to advocate for enlarged CRA assessment areas and/or campaign to develop CRA agreements with individual banks. Some cities such as Los Angeles have developed Responsible Banking Ordinances, which require any financial institutions that receives municipal deposits to agree to invest in lower-income communities of color. This is another potential advocacy tool to encourage private investment.
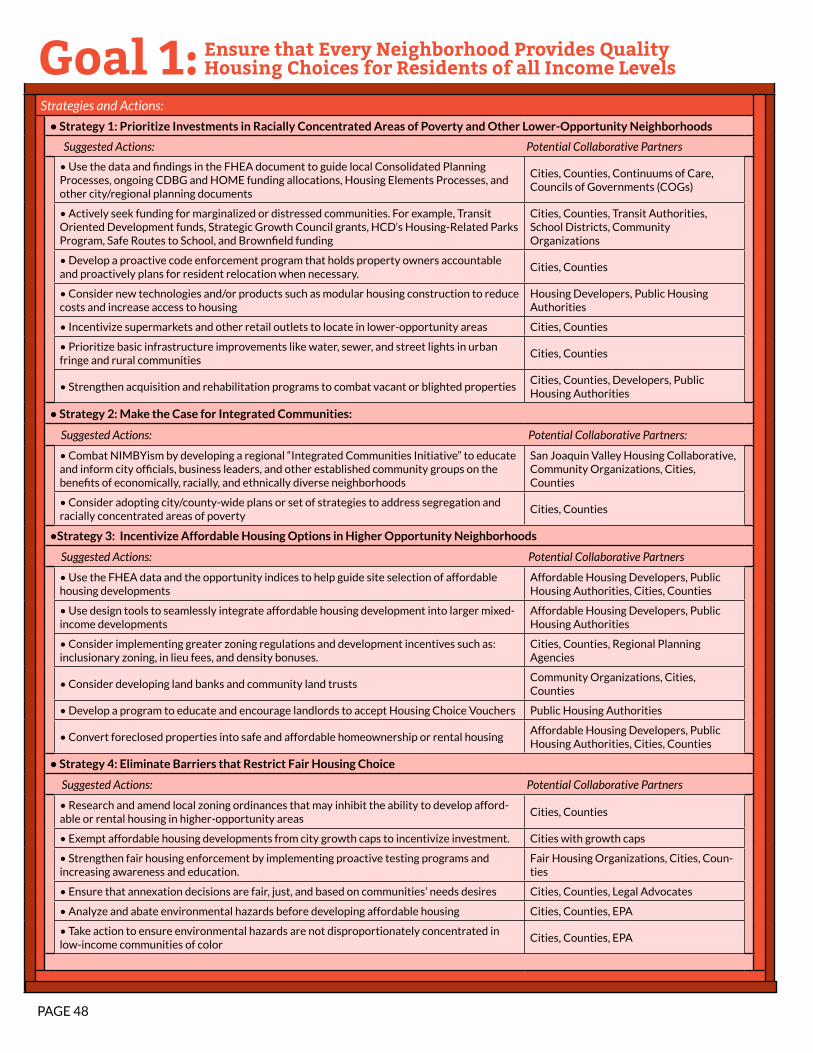
PAGE 48
Strategies and Actions:
• Strategy 1: Prioritize Investments in Racially Concentrated Areas of Poverty and Other Lower-Opportunity Neighborhoods
Suggested Actions: Potential Collaborative Partners
• Use the data and findings in the FHEA document to guide local Consolidated Planning Processes, ongoing CDBG and HOME funding allocations, Housing Elements Processes, and other city/regional planning documents
Cities, Counties, Continuums of Care, Councils of Governments (COGs)
• Actively seek funding for marginalized or distressed communities. For example, Transit Oriented Development funds, Strategic Growth Council grants, HCD’s Housing-Related Parks Program, Safe Routes to School, and Brownfield funding
Cities, Counties, Transit Authorities, School Districts, Community Organizations
• Develop a proactive code enforcement program that holds property owners accountable and proactively plans for resident relocation when necessary.
Cities, Counties
• Consider new technologies and/or products such as modular housing construction to reduce costs and increase access to housing
Housing Developers, Public Housing Authorities
• Incentivize supermarkets and other retail outlets to locate in lower-opportunity areas Cities, Counties
• Prioritize basic infrastructure improvements like water, sewer, and street lights in urban fringe and rural communities
Cities, Counties
• Strengthen acquisition and rehabilitation programs to combat vacant or blighted propertiesCities, Counties, Developers, Public Housing Authorities
• Strategy 2: Make the Case for Integrated Communities:
Suggested Actions: Potential Collaborative Partners:
• Combat NIMBYism by developing a regional “Integrated Communities Initiative” to educate and inform city officials, business leaders, and other established community groups on the benefits of economically, racially, and ethnically diverse neighborhoods
San Joaquin Valley Housing Collaborative, Community Organizations, Cities, Counties
• Consider adopting city/county-wide plans or set of strategies to address segregation and racially concentrated areas of poverty
Cities, Counties
•Strategy 3: Incentivize Affordable Housing Options in Higher Opportunity Neighborhoods
Suggested Actions: Potential Collaborative Partners
• Use the FHEA data and the opportunity indices to help guide site selection of affordable housing developments
Affordable Housing Developers, Public Housing Authorities, Cities, Counties
• Use design tools to seamlessly integrate affordable housing development into larger mixed-income developments
Affordable Housing Developers, Public Housing Authorities
• Consider implementing greater zoning regulations and development incentives such as: inclusionary zoning, in lieu fees, and density bonuses.
Cities, Counties, Regional Planning Agencies
• Consider developing land banks and community land trusts Community Organizations, Cities, Counties
• Develop a program to educate and encourage landlords to accept Housing Choice Vouchers Public Housing Authorities
• Convert foreclosed properties into safe and affordable homeownership or rental housing Affordable Housing Developers, Public Housing Authorities, Cities, Counties
• Strategy 4: Eliminate Barriers that Restrict Fair Housing Choice
Suggested Actions: Potential Collaborative Partners
• Research and amend local zoning ordinances that may inhibit the ability to develop afford-able or rental housing in higher-opportunity areas
Cities, Counties
• Exempt affordable housing developments from city growth caps to incentivize investment. Cities with growth caps
• Strengthen fair housing enforcement by implementing proactive testing programs and increasing awareness and education.
Fair Housing Organizations, Cities, Coun-ties
• Ensure that annexation decisions are fair, just, and based on communities’ needs desires Cities, Counties, Legal Advocates
• Analyze and abate environmental hazards before developing affordable housing Cities, Counties, EPA
• Take action to ensure environmental hazards are not disproportionately concentrated in low-income communities of color
Cities, Counties, EPA
Goal 1: Ensure that Every Neighborhood Provides Quality Housing Choices for Residents of all Income Levels
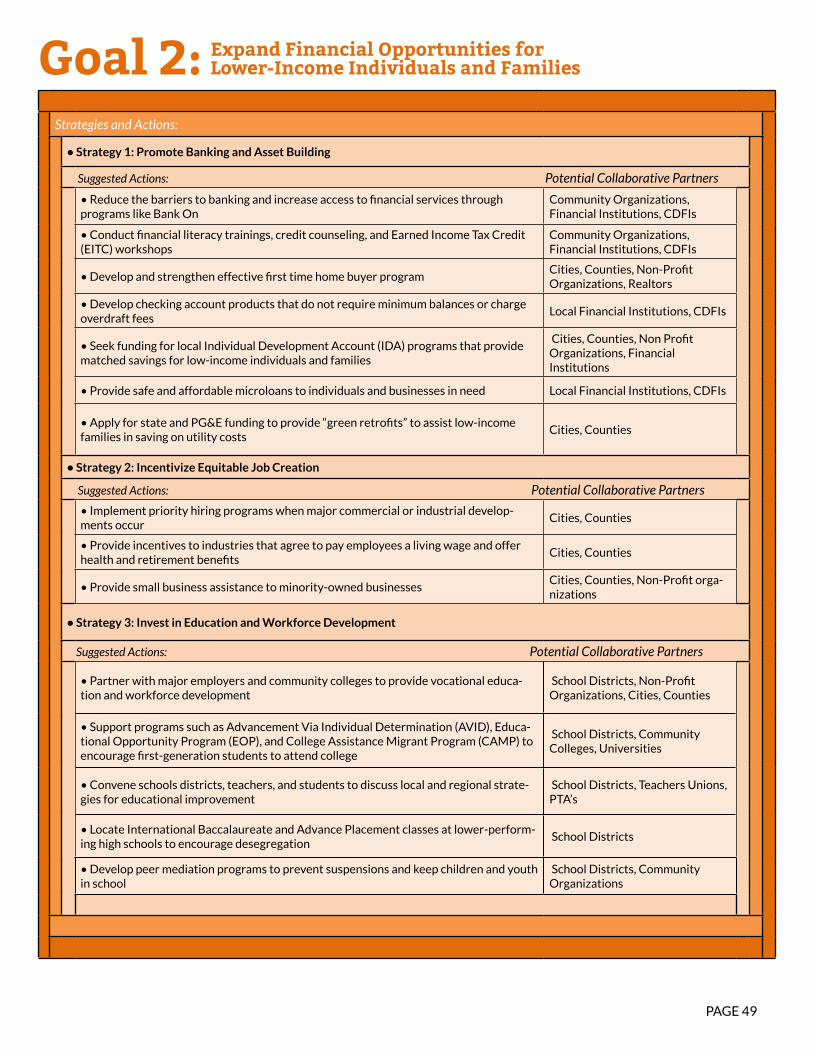
PAGE 49
Strategies and Actions:
• Strategy 1: Promote Banking and Asset Building
Suggested Actions: Potential Collaborative Partners
• Reduce the barriers to banking and increase access to financial services through programs like Bank On
Community Organizations, Financial Institutions, CDFIs
• Conduct financial literacy trainings, credit counseling, and Earned Income Tax Credit (EITC) workshops
Community Organizations, Financial Institutions, CDFIs
• Develop and strengthen effective first time home buyer programCities, Counties, Non-Profit Organizations, Realtors
• Develop checking account products that do not require minimum balances or charge overdraft fees
Local Financial Institutions, CDFIs
• Seek funding for local Individual Development Account (IDA) programs that provide matched savings for low-income individuals and families
Cities, Counties, Non Profit Organizations, Financial Institutions
• Provide safe and affordable microloans to individuals and businesses in need Local Financial Institutions, CDFIs
• Apply for state and PG&E funding to provide “green retrofits” to assist low-income families in saving on utility costs
Cities, Counties
• Strategy 2: Incentivize Equitable Job Creation
Suggested Actions: Potential Collaborative Partners
• Implement priority hiring programs when major commercial or industrial develop-ments occur
Cities, Counties
• Provide incentives to industries that agree to pay employees a living wage and offer health and retirement benefits
Cities, Counties
• Provide small business assistance to minority-owned businesses Cities, Counties, Non-Profit orga-nizations
• Strategy 3: Invest in Education and Workforce Development
Suggested Actions: Potential Collaborative Partners
• Partner with major employers and community colleges to provide vocational educa-tion and workforce development
School Districts, Non-Profit Organizations, Cities, Counties
• Support programs such as Advancement Via Individual Determination (AVID), Educa-tional Opportunity Program (EOP), and College Assistance Migrant Program (CAMP) to encourage first-generation students to attend college
School Districts, Community Colleges, Universities
• Convene schools districts, teachers, and students to discuss local and regional strate-gies for educational improvement
School Districts, Teachers Unions, PTA’s
• Locate International Baccalaureate and Advance Placement classes at lower-perform-ing high schools to encourage desegregation
School Districts
• Develop peer mediation programs to prevent suspensions and keep children and youth in school
School Districts, Community Organizations
Goal 2: Expand Financial Opportunities for Lower-Income Individuals and Families
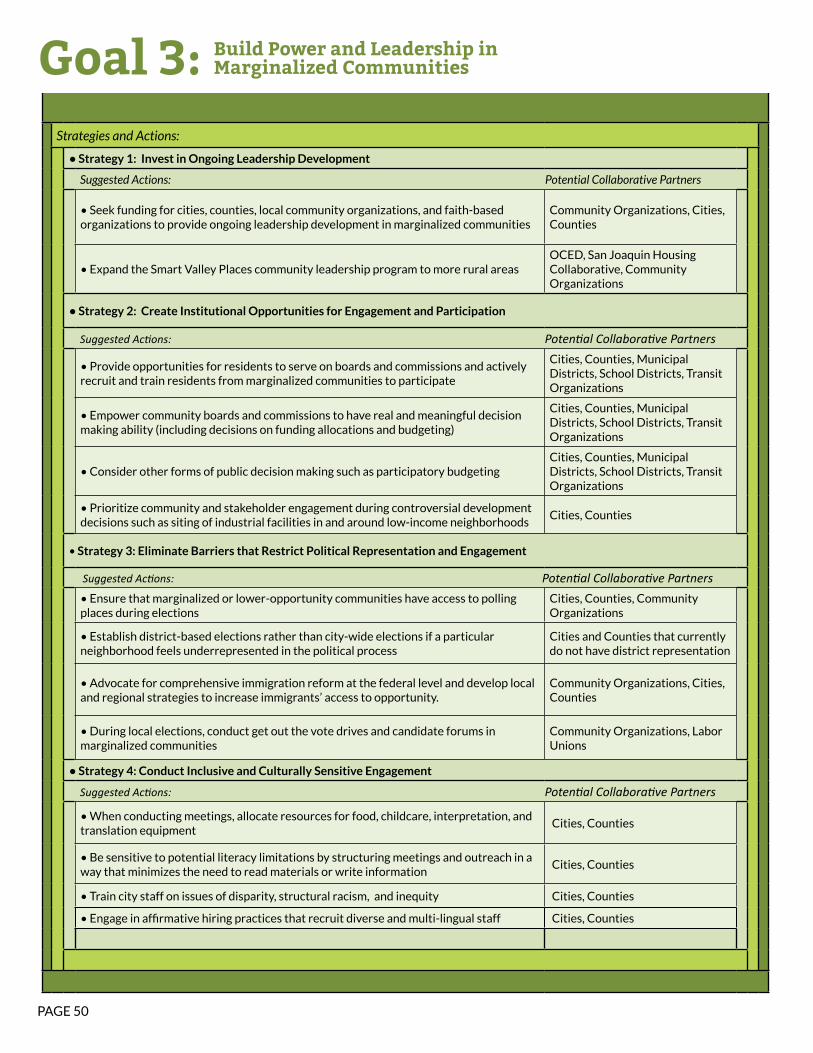
PAGE 50
Goal 3: Build Power and Leadership in Marginalized Communities
Strategies and Actions:
• Strategy 1: Invest in Ongoing Leadership Development
Suggested Actions: Potential Collaborative Partners
• Seek funding for cities, counties, local community organizations, and faith-based organizations to provide ongoing leadership development in marginalized communities
Community Organizations, Cities, Counties
• Expand the Smart Valley Places community leadership program to more rural areas OCED, San Joaquin Housing Collaborative, Community Organizations
• Strategy 2: Create Institutional Opportunities for Engagement and Participation
Suggested Actions: Potential Collaborative Partners
• Provide opportunities for residents to serve on boards and commissions and actively recruit and train residents from marginalized communities to participate
Cities, Counties, Municipal Districts, School Districts, Transit Organizations
• Empower community boards and commissions to have real and meaningful decision making ability (including decisions on funding allocations and budgeting)
Cities, Counties, Municipal Districts, School Districts, Transit Organizations
• Consider other forms of public decision making such as participatory budgetingCities, Counties, Municipal Districts, School Districts, Transit Organizations
• Prioritize community and stakeholder engagement during controversial development decisions such as siting of industrial facilities in and around low-income neighborhoods
Cities, Counties
• Strategy 3: Eliminate Barriers that Restrict Political Representation and Engagement
Suggested Actions: Potential Collaborative Partners
• Ensure that marginalized or lower-opportunity communities have access to polling places during elections
Cities, Counties, Community Organizations
• Establish district-based elections rather than city-wide elections if a particular neighborhood feels underrepresented in the political process
Cities and Counties that currently do not have district representation
• Advocate for comprehensive immigration reform at the federal level and develop local and regional strategies to increase immigrants’ access to opportunity.
Community Organizations, Cities, Counties
• During local elections, conduct get out the vote drives and candidate forums in marginalized communities
Community Organizations, Labor Unions
• Strategy 4: Conduct Inclusive and Culturally Sensitive Engagement
Suggested Actions: Potential Collaborative Partners
• When conducting meetings, allocate resources for food, childcare, interpretation, and translation equipment
Cities, Counties
• Be sensitive to potential literacy limitations by structuring meetings and outreach in a way that minimizes the need to read materials or write information
Cities, Counties
• Train city staff on issues of disparity, structural racism, and inequity Cities, Counties
• Engage in affirmative hiring practices that recruit diverse and multi-lingual staff Cities, Counties
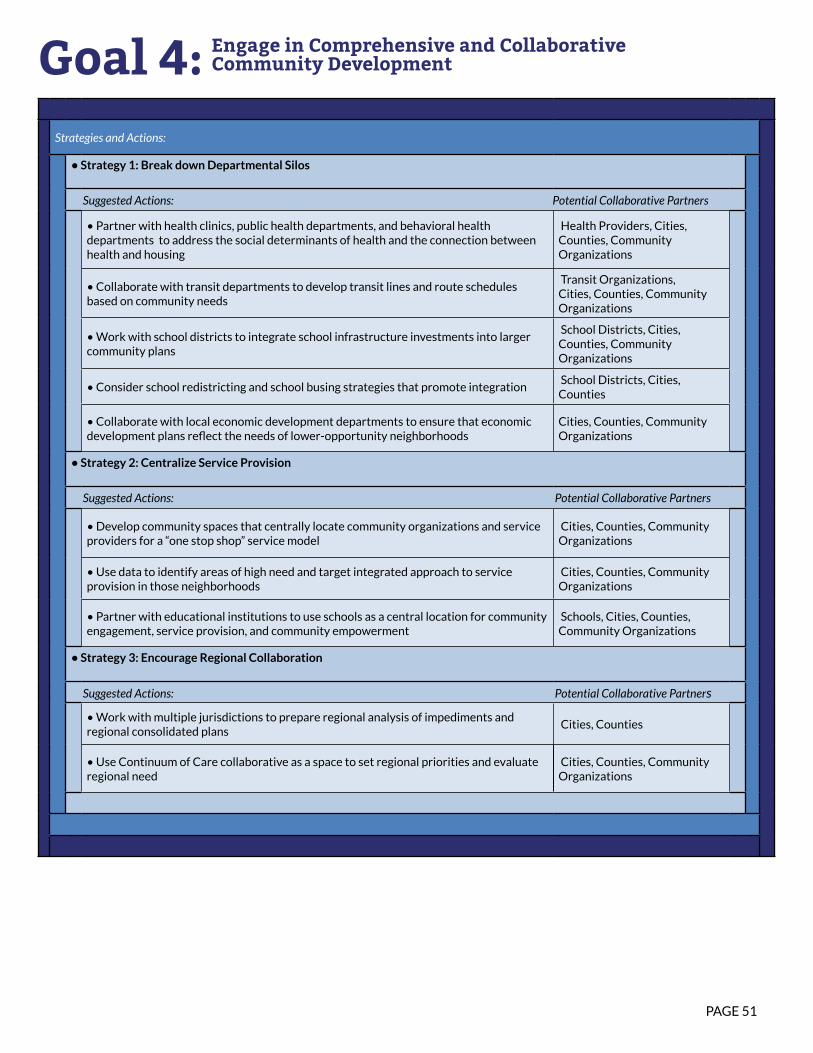
PAGE 51
Goal 4: Engage in Comprehensive and Collaborative Community Development
Strategies and Actions:
• Strategy 1: Break down Departmental Silos
Suggested Actions: Potential Collaborative Partners
• Partner with health clinics, public health departments, and behavioral health departments to address the social determinants of health and the connection between health and housing
Health Providers, Cities, Counties, Community Organizations
• Collaborate with transit departments to develop transit lines and route schedules based on community needs
Transit Organizations, Cities, Counties, Community Organizations
• Work with school districts to integrate school infrastructure investments into larger community plans
School Districts, Cities, Counties, Community Organizations
• Consider school redistricting and school busing strategies that promote integration School Districts, Cities, Counties
• Collaborate with local economic development departments to ensure that economic development plans reflect the needs of lower-opportunity neighborhoods
Cities, Counties, Community Organizations
• Strategy 2: Centralize Service Provision
Suggested Actions: Potential Collaborative Partners
• Develop community spaces that centrally locate community organizations and service providers for a “one stop shop” service model
Cities, Counties, Community Organizations
• Use data to identify areas of high need and target integrated approach to service provision in those neighborhoods
Cities, Counties, Community Organizations
• Partner with educational institutions to use schools as a central location for community engagement, service provision, and community empowerment
Schools, Cities, Counties, Community Organizations
• Strategy 3: Encourage Regional Collaboration
Suggested Actions: Potential Collaborative Partners
• Work with multiple jurisdictions to prepare regional analysis of impediments and regional consolidated plans
Cities, Counties
• Use Continuum of Care collaborative as a space to set regional priorities and evaluate regional need
Cities, Counties, Community Organizations
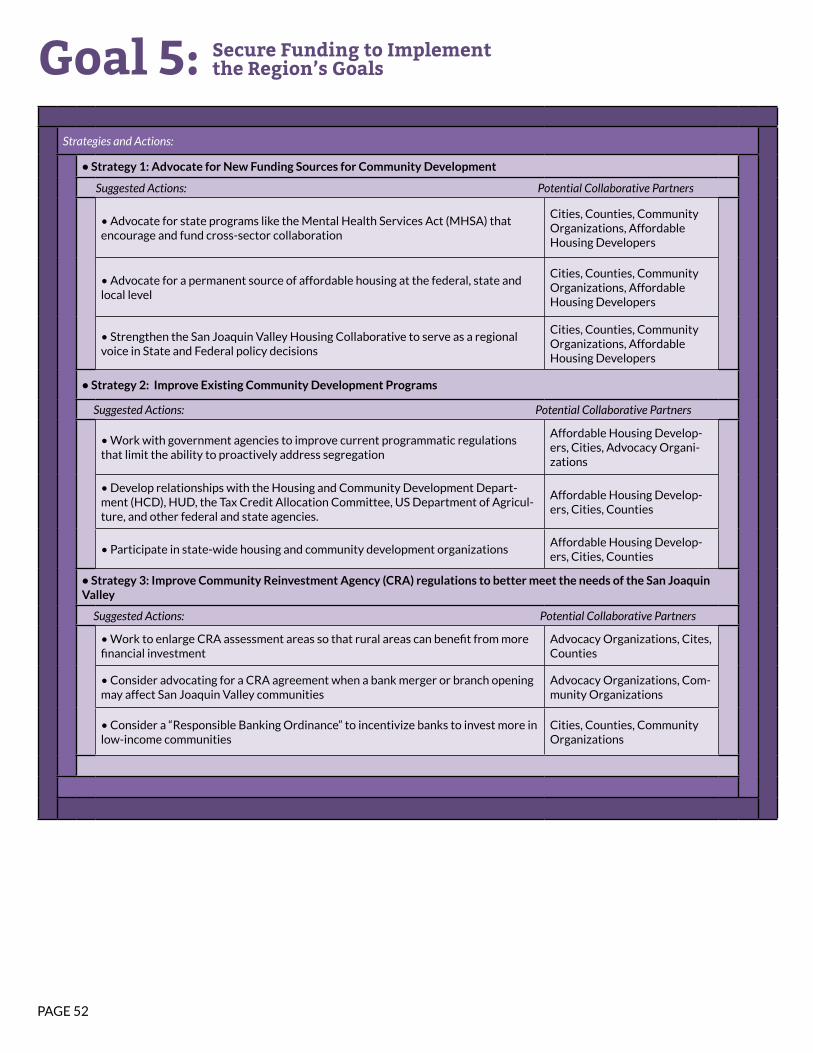
PAGE 52
Goal 5: Secure Funding to Implement the Region’s Goals
Strategies and Actions:
• Strategy 1: Advocate for New Funding Sources for Community Development
Suggested Actions: Potential Collaborative Partners
• Advocate for state programs like the Mental Health Services Act (MHSA) that encourage and fund cross-sector collaboration
Cities, Counties, Community Organizations, Affordable Housing Developers
• Advocate for a permanent source of affordable housing at the federal, state and local level
Cities, Counties, Community Organizations, Affordable Housing Developers
• Strengthen the San Joaquin Valley Housing Collaborative to serve as a regional voice in State and Federal policy decisions
Cities, Counties, Community Organizations, Affordable Housing Developers
• Strategy 2: Improve Existing Community Development Programs
Suggested Actions: Potential Collaborative Partners
• Work with government agencies to improve current programmatic regulations that limit the ability to proactively address segregation
Affordable Housing Develop-ers, Cities, Advocacy Organi-zations
• Develop relationships with the Housing and Community Development Depart-ment (HCD), HUD, the Tax Credit Allocation Committee, US Department of Agricul-ture, and other federal and state agencies.
Affordable Housing Develop-ers, Cities, Counties
• Participate in state-wide housing and community development organizationsAffordable Housing Develop-ers, Cities, Counties
• Strategy 3: Improve Community Reinvestment Agency (CRA) regulations to better meet the needs of the San Joaquin Valley
Suggested Actions: Potential Collaborative Partners
• Work to enlarge CRA assessment areas so that rural areas can benefit from more financial investment
Advocacy Organizations, Cites, Counties
• Consider advocating for a CRA agreement when a bank merger or branch opening may affect San Joaquin Valley communities
Advocacy Organizations, Com-munity Organizations
• Consider a “Responsible Banking Ordinance” to incentivize banks to invest more in low-income communities
Cities, Counties, Community Organizations
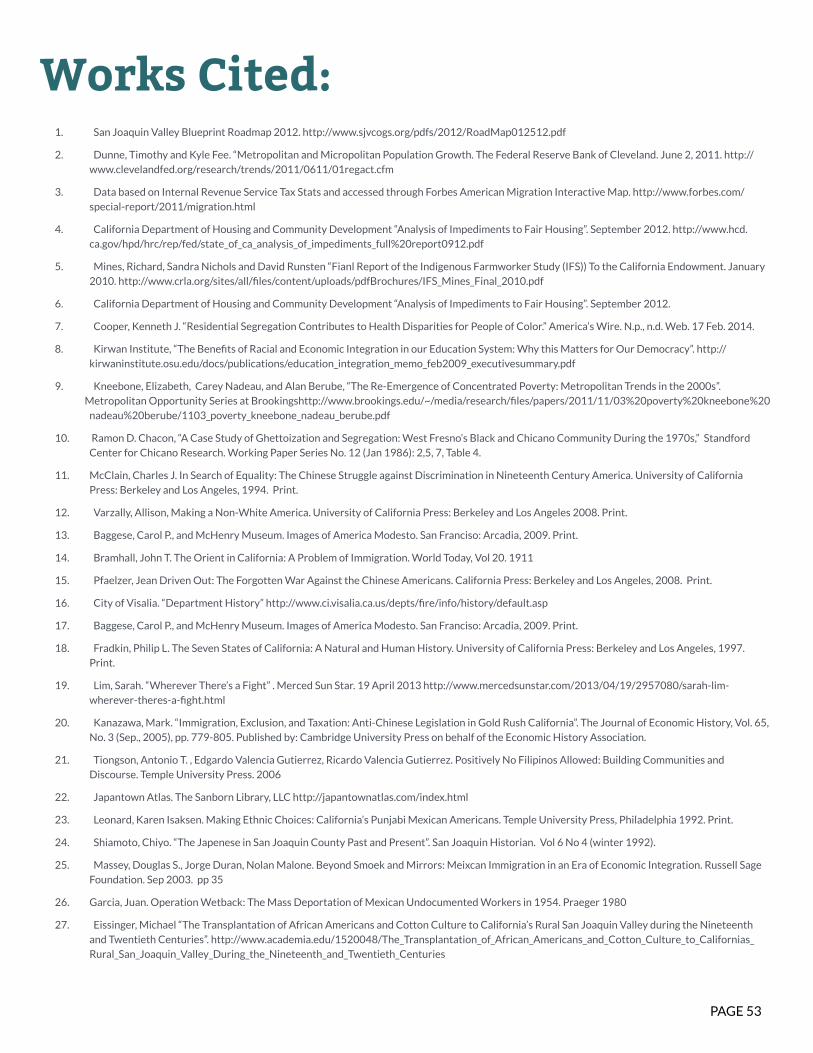
PAGE 53
1. San Joaquin Valley Blueprint Roadmap 2012. http://www.sjvcogs.org/pdfs/2012/RoadMap012512.pdf
2. Dunne, Timothy and Kyle Fee. “Metropolitan and Micropolitan Population Growth. The Federal Reserve Bank of Cleveland. June 2, 2011. http:// www.clevelandfed.org/research/trends/2011/0611/01regact.cfm
3. Data based on Internal Revenue Service Tax Stats and accessed through Forbes American Migration Interactive Map. http://www.forbes.com/ special-report/2011/migration.html
4. California Department of Housing and Community Development “Analysis of Impediments to Fair Housing”. September 2012. http://www.hcd. ca.gov/hpd/hrc/rep/fed/state_of_ca_analysis_of_impediments_full%20report0912.pdf
5. Mines, Richard, Sandra Nichols and David Runsten “Fianl Report of the Indigenous Farmworker Study (IFS)) To the California Endowment. January 2010. http://www.crla.org/sites/all/files/content/uploads/pdfBrochures/IFS_Mines_Final_2010.pdf
6. California Department of Housing and Community Development “Analysis of Impediments to Fair Housing”. September 2012.
7. Cooper, Kenneth J. “Residential Segregation Contributes to Health Disparities for People of Color.” America’s Wire. N.p., n.d. Web. 17 Feb. 2014.
8. Kirwan Institute, “The Benefits of Racial and Economic Integration in our Education System: Why this Matters for Our Democracy”. http:// kirwaninstitute.osu.edu/docs/publications/education_integration_memo_feb2009_executivesummary.pdf
9. Kneebone, Elizabeth, Carey Nadeau, and Alan Berube, “The Re-Emergence of Concentrated Poverty: Metropolitan Trends in the 2000s”. Metropolitan Opportunity Series at Brookingshttp://www.brookings.edu/~/media/research/files/papers/2011/11/03%20poverty%20kneebone%20 nadeau%20berube/1103_poverty_kneebone_nadeau_berube.pdf
10. Ramon D. Chacon, “A Case Study of Ghettoization and Segregation: West Fresno’s Black and Chicano Community During the 1970s,” Standford Center for Chicano Research. Working Paper Series No. 12 (Jan 1986): 2,5, 7, Table 4.
11. McClain, Charles J. In Search of Equality: The Chinese Struggle against Discrimination in Nineteenth Century America. University of California Press: Berkeley and Los Angeles, 1994. Print.
12. Varzally, Allison, Making a Non-White America. University of California Press: Berkeley and Los Angeles 2008. Print.
13. Baggese, Carol P., and McHenry Museum. Images of America Modesto. San Franciso: Arcadia, 2009. Print.
14. Bramhall, John T. The Orient in California: A Problem of Immigration. World Today, Vol 20. 1911
15. Pfaelzer, Jean Driven Out: The Forgotten War Against the Chinese Americans. California Press: Berkeley and Los Angeles, 2008. Print.
16. City of Visalia. “Department History” http://www.ci.visalia.ca.us/depts/fire/info/history/default.asp
17. Baggese, Carol P., and McHenry Museum. Images of America Modesto. San Franciso: Arcadia, 2009. Print.
18. Fradkin, Philip L. The Seven States of California: A Natural and Human History. University of California Press: Berkeley and Los Angeles, 1997. Print.
19. Lim, Sarah. “Wherever There’s a Fight” . Merced Sun Star. 19 April 2013 http://www.mercedsunstar.com/2013/04/19/2957080/sarah-lim- wherever-theres-a-fight.html
20. Kanazawa, Mark. “Immigration, Exclusion, and Taxation: Anti-Chinese Legislation in Gold Rush California”. The Journal of Economic History, Vol. 65, No. 3 (Sep., 2005), pp. 779-805. Published by: Cambridge University Press on behalf of the Economic History Association.
21. Tiongson, Antonio T. , Edgardo Valencia Gutierrez, Ricardo Valencia Gutierrez. Positively No Filipinos Allowed: Building Communities and Discourse. Temple University Press. 2006
22. Japantown Atlas. The Sanborn Library, LLC http://japantownatlas.com/index.html
23. Leonard, Karen Isaksen. Making Ethnic Choices: California’s Punjabi Mexican Americans. Temple University Press, Philadelphia 1992. Print.
24. Shiamoto, Chiyo. “The Japenese in San Joaquin County Past and Present”. San Joaquin Historian. Vol 6 No 4 (winter 1992).
25. Massey, Douglas S., Jorge Duran, Nolan Malone. Beyond Smoek and Mirrors: Meixcan Immigration in an Era of Economic Integration. Russell Sage Foundation. Sep 2003. pp 35
26. Garcia, Juan. Operation Wetback: The Mass Deportation of Mexican Undocumented Workers in 1954. Praeger 1980
27. Eissinger, Michael “The Transplantation of African Americans and Cotton Culture to California’s Rural San Joaquin Valley during the Nineteenth and Twentieth Centuries”. http://www.academia.edu/1520048/The_Transplantation_of_African_Americans_and_Cotton_Culture_to_Californias_ Rural_San_Joaquin_Valley_During_the_Nineteenth_and_Twentieth_Centuries
Works Cited:


