SAN JOAQUIN RIVER WATERSHED - California
41
Central Valley Regional Water Quality Control Board Surface Water Ambient Monitoring Program FY 03-04 Work Plan Table of Contents Table of Contents ......................................................................................................... 1 INTRODUCTION............................................................................................................. 2 SACRAMENTO RIVER WATERSHED ....................................................................... 3 UPPER SACRAMENTO RIVER BASIN ...................................................................... 3 LOWER SACRAMENTO RIVER WATERSHED .................................................... 12 SAN JOAQUIN RIVER WATERSHED ...................................................................... 18 TULARE LAKE BASIN ................................................................................................ 31
Transcript of SAN JOAQUIN RIVER WATERSHED - California

Central Valley Regional Water Quality Control Board
Surface Water Ambient Monitoring Program
FY 03-04 Work Plan
Table of Contents Table of Contents ......................................................................................................... 1 INTRODUCTION............................................................................................................. 2 SACRAMENTO RIVER WATERSHED....................................................................... 3 UPPER SACRAMENTO RIVER BASIN ...................................................................... 3 LOWER SACRAMENTO RIVER WATERSHED .................................................... 12 SAN JOAQUIN RIVER WATERSHED ...................................................................... 18 TULARE LAKE BASIN ................................................................................................ 31

INTRODUCTION The Central Valley covers 40% of the State and stretches from the Oregon border to the northern tip of Los Angeles County (60,000 square miles). This area, which includes all or part of 38 of the State’s 53 counties, totals approximately 75% of the State’s irrigable land. Three major watersheds have been delineated within this region, namely the Sacramento River, San Joaquin River, and Tulare Lake Basins. The Sacramento and San Joaquin Basins cover about one fourth of the total area of the State and furnish roughly 51 percent of the State’s water supply. Surface water from these two basins meet and form the Delta, which ultimately drains to San Francisco Bay. The Tulare Lake Basin is essentially a closed basin comprised of roughly 50 percent valley floor with the remainder comprised of Kings Canyon and Sequoia National Parks and substantial portions of Sierra, Sequioia, Inyo, and Los Padres National Forests. The Kings, Kaweah, Tule, and Kern Rivers, which drain the west face of the Sierra Nevada Mountains, provide the bulk of native surface water supply, which is augmented with imported water from the San Luis Canal/California Aqueduct System, Friant-Kern Canal, and the Delta-Mendota Canal. Comprehensive monitoring and assessment programs are critical for evaluating whether beneficial uses are being protected and for evaluating the success or failure of control programs. Over the years, the Regional Board and other agencies have focused limited resources on the mainstem rivers and water bodies that have the most obvious impairments. Because of this emphasis, limited data is now available for the Delta, the lower Sacramento River, the lower San Joaquin River and a few other water bodies that are located near significant pollutant sources (i.e., Iron Mountain Mine and Penn Mine). Many small tributaries to the mainstem rivers, streams upstream from the major reservoirs, and most of the lakes have received little attention. A review of the monitoring requirements for surface water programs, with estimated staff and contract resources, shows an approximate annual need of 26 PYs and $5,707,000 in contract funds (WMI, 2001) plus an additional 30 PY’s and $4,000,000 for the Ag Waiver Program. There are four specific areas of significant need for monitoring resources. These are: selenium monitoring on the San Joaquin River; an integrated dormant spray evaluation program; a comprehensive toxicity and TIE monitoring program on the San Joaquin River and it’s major tributaries; and loading of methyl mercury to the Delta from upstream sources. Each of these four results from nonpoint sources. A wide variety of agencies and stakeholders are involved in monitoring and assessment activities. An integral part of the Regional Board monitoring strategy is to cooperate with these other programs and stakeholders in implementing monitoring and assessment programs in order to achieve water quality improvement and promote restoration of water resources. All activities proposed in this SWAMP workplan are being coordinated with existing programs operated by local, state, and federal agencies, including but not limited to the TMDL effort, Sacramento River Watershed Program, National Water-Quality Assessment Program by USGS, pesticide evaluation by DPR, nutrient evaluation funded

by the US Fish and Wildlife Service, efforts being initiated under the Ag Waiver Policy, toxicity evaluation efforts by USEPA, and projects funded through CALFED and statewide water quality improvement project grants. A regionwide effort that was identified during the triennial review and began during FY00/01 is the bioassessment and habitat evaluation of effluent and agriculturally dominated water bodies throughout the Central Valley. This effort is being coordinated with the OP TMDL effort, USGS, and DPR in order to identify appropriate water bodies to evaluate within each hydrologic regime of the basin and to maximize use of the resulting data. San Joaquin River bioassessment work is being conducted through the OP TMDL effort with specific details listed in the Central Valley Regional Water Quality Control Board SJR OP Pesticide TMDL Bioassessment Work Plan (2002). Details specific to the Sacramento bioassessment effort are described in the Sacramento River Basin section of this workplan. SWAMP will be implemented slightly differently in each of the major watershed within the Central Valley due to the various approaches to monitoring that have been undertaken in the past. Since each watershed has both a unique set of stakeholders and unique water quality concerns that must be addressed, the management process and the accompanying monitoring program are somewhat watershed specific. Therefore this document is divided into three sections: Sacramento River Basin, San Joaquin River Basin, and Tulare Basin. A common element in all three watersheds is that monitoring programs are designed primarily to address potential nonpoint source impacts, since the most significant water quality problems in the Region result from nonpoint sources (see 1998 Clean Water Act Section 303d List and 1996 Water Quality Assessment). SACRAMENTO RIVER WATERSHED UPPER SACRAMENTO RIVER BASIN PIT RIVER MONITORING Introduction Previous FY SWAMP funds were used to initiate a water quality monitoring program on the Pit River and major tributaries in the reach from the headwaters to McArthur. This monitoring program is described in the 01-02 SWAMP Workplan and in Contract # 01-166-150-0 with (Central Modoc RCD). FY 03-03 SWAMP funds are proposed to continue the Pit River and tributaries monitoring from the time existing contract funding terminates (April 04) through Oct 05. Funding for this monitoring effort is being augmented by a grant from Dept. of Water Resources and this funding is being used to support a Pit River watershed monitoring coordinator. Budget Total - $204,000
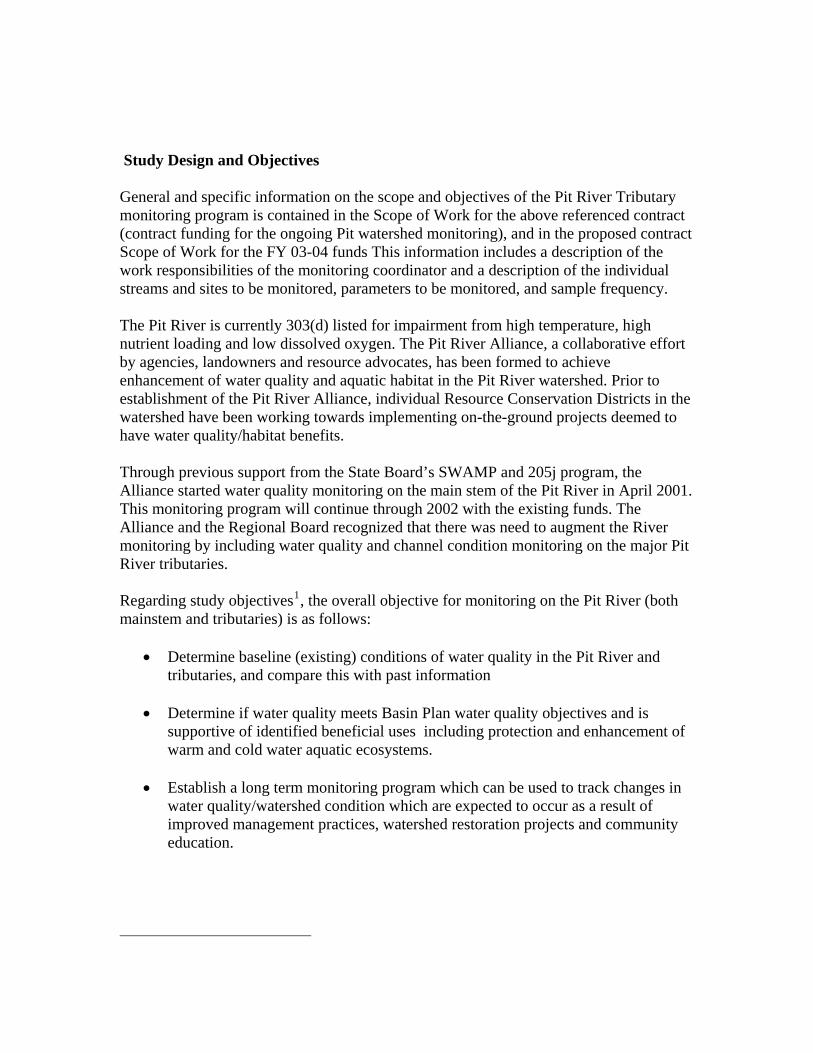
Study Design and Objectives General and specific information on the scope and objectives of the Pit River Tributary monitoring program is contained in the Scope of Work for the above referenced contract (contract funding for the ongoing Pit watershed monitoring), and in the proposed contract Scope of Work for the FY 03-04 funds This information includes a description of the work responsibilities of the monitoring coordinator and a description of the individual streams and sites to be monitored, parameters to be monitored, and sample frequency. The Pit River is currently 303(d) listed for impairment from high temperature, high nutrient loading and low dissolved oxygen. The Pit River Alliance, a collaborative effort by agencies, landowners and resource advocates, has been formed to achieve enhancement of water quality and aquatic habitat in the Pit River watershed. Prior to establishment of the Pit River Alliance, individual Resource Conservation Districts in the watershed have been working towards implementing on-the-ground projects deemed to have water quality/habitat benefits.
Through previous support from the State Board’s SWAMP and 205j program, the Alliance started water quality monitoring on the main stem of the Pit River in April 2001. This monitoring program will continue through 2002 with the existing funds. The Alliance and the Regional Board recognized that there was need to augment the River monitoring by including water quality and channel condition monitoring on the major Pit River tributaries. Regarding study objectives1, the overall objective for monitoring on the Pit River (both mainstem and tributaries) is as follows:
• Determine baseline (existing) conditions of water quality in the Pit River and tributaries, and compare this with past information
• Determine if water quality meets Basin Plan water quality objectives and is
supportive of identified beneficial uses including protection and enhancement of warm and cold water aquatic ecosystems.
• Establish a long term monitoring program which can be used to track changes in
water quality/watershed condition which are expected to occur as a result of improved management practices, watershed restoration projects and community education.

In general, toxicity is not expected to be a significant water quality issue in the Pit River watershed. Important factors impacting, or potentially impacting, beneficial uses are temperature, nutrient enrichment, sediment transport/deposition, and habitat quality. The study design for the Pit River tributaries is a directed study design. Generally speaking, the criteria for selecting streams to be monitored is streams that have permanent year round flow and support fish or other important aquatic resources. Sampling sites are located at the lower end of each stream (i.e. at the confluence with the Pit River) and at selected locations which represent major change in land type and land use (e.g. at the boundary of public and private lands). Sample locations will be designated and recorded using GPS and photos. A specific QAPP for Pit River monitoring will be prepared consistent with SWAMP QA requirements. The Pit River watershed monitoring program is being designed and implemented in collaboration with other local, state and federal agency monitoring programs. The following agencies participate on the Technical Advisory Committee for Pit River watershed monitoring:
• USFS • BLM • CA DFG • UC Cooperative Extension • North Cal Neva RC&D and the individual RCD’s • Private consultants
The Pit River watershed monitoring program is being implemented via a collaborative effort on the part of the various organizations listed above. Deliverables Deliverables from the SWAMP funded Pit River Tributary monitoring program include the following:
• A Pit River Monitoring Coordinator to direct and supervise all data collection and data management activities
• A final study design which includes monitoring parameters, sample locations, sample frequency and sampling methods
• A QAPP • Periodic and final data reports • A Pit River watershed data management program
Schedule Pit River and tributary monitoring will begin April 2004 and continue through fall 2005. A final report will be submitted by Dec 2005. . Other

As currently designed, some parameters (including temperature, flow, turbidity, dissolved oxygen, pH, conductivity and fish populations) will be sampled using field equipment and some parameters will be collected for laboratory analysis (including nutrients, suspended sediment, TOC and pathogens) Analysis of macroinvertebrate samples will be done by the DFG Chico laboratory using funding in the DFG Master Contract. Project Officials The State Water Board's Contract Manager is Dennis R. Heiman, of Region 5, Central Valley Regional Water Quality Control Board. The Contractor’s project director is Todd Sloat.
Scope Of Work
1. Monitoring (chemical, physical and biological) at fixed stations located on the Pit River and its principal tributaries from the headwaters to McArthur. These monitoring stations were selected on the basis that they generally have year-round flow and have (or have potential for) important aquatic resources. The stations were also selected in an effort to provide a balanced geographic coverage throughout the watershed.
2. Seasonal field surveys to characterize and record existing channel and habitat
conditions in selected streams tributary to the Pit River. Guidance and review of the Pit River Watershed Monitoring Program will be provided by a Monitoring and Assessment Technical Advisory Committee (TAC). This committee was established by the Pit River Alliance to assist in design of the monitoring program, program implementation, and data analysis. Project Objectives
1. Implement a monitoring program on the principal tributaries to the Pit River, which documents existing conditions for water quality, channel morphology, aquatic biota and aquatic/riparian habitat.
2. Determine to what extent, if any, beneficial water uses are impaired by
water quality or other stream condition factors.
3. Establish a Pit River and tributary monitoring program which is repeatable and can be used in future monitoring to determine long term trends in watershed condition.
4. Provide a means to document future watershed condition
improvements, which are expected to result from the cumulative

implementation of improved management practices, restoration projects, and watershed education.
Monitoring Technical Advisory Committee Contractor will establish a Pit River Watershed Monitoring Advisory Committee to assist in development of the final monitoring program design, sampling protocol, implementation procedures and data analysis. Contractor will coordinate meetings of the Technical Advisory Committee on an as needed basis. Deliverables: Membership list of the TAC, minutes and agendas for scheduled TAC meetings. Permanent Monitoring Stations Contractor will establish fixed monitoring stations and implement a monitoring program at selected locations on the 25 tributary streams as listed in Attachment A ( station number and location will be adjusted as needed for reasons of access, landowner concerns or other site specific issues). Monitoring parameters and frequency of sampling at each of the fixed locations are as follows:
Pit River Watershed Monitoring Parameters and Sampling Frequency -
1. Flow
• Pit River tributaries – monthly Apr. thru Sept. • Pit River and Fall River - USGS gage readings
2. Temperature • continuous recorders at all sites
3. pH • Pit River tributaries – monthly Apr. thru Sept., once in winter
season (Dec, Jan. or Feb) • Pit River and Fall River – monthly at all sites
4. Conductivity • Pit River tributaries – monthly Apr. thru Sept., once in winter
season • Pit River and Fall River – monthly at all sites
5. Total Organic Carbon • monthly at 5 sites
i. Pit R. @ Canby ii. Pit R. @ Lookout
iii. Pit R. @ Pittville iv. Ash Cr @ Pit R. confluence v. Fall River @ PGE Diversion
6. Turbidity

• Pit River tributaries – monthly Apr. thru Sept., once in winter season
• Pit River and Fall River – monthly at all sites 7. Total Suspended Sediment
• Pit River tributaries – monthly Apr. thru Sept., once in winter season
• Pit River and Fall River – monthly at all sites 8. Nutrients (nitrate nitrogen and total phosphorus)
• Pit River tributaries – monthly Apr. thru Sept., once in winter season
• Pit River and Fall River – monthly at all sites 9. Pathogens (fecal coliform bacteria)
• Pit River and Fall River – monthly at all sites • Pit River tributaries – monthly Apr. thru Sept., once in winter
season 10. Dissolved Oxygen
• 24 hr DO survey @ selected sites during July and August 11. Macroinvertebrates
• Pit River tributaries – all sites in May 04 • Fall River – all sites in May 04 and Oct 04
Deliverables: Interim and final data reports from permanent station monitoring.
Pit River Tributary Monitoring – Permanent Station Location
1. New Pine Creek • @ USFS boundary • @ Goose Lake confluence
2. Willow Creek
• @ USFS boundary (near Bucks Cr.) • @ Goose Lake confluence
3. Lassen Creek
• @ USFS boundary (near Cold Cr. campground) • @ Goose Lake confluence
4. Davis Creek
• @ USFS boundary
5. Joseph Creek • @ USFS boundary • @ Pit River confluence
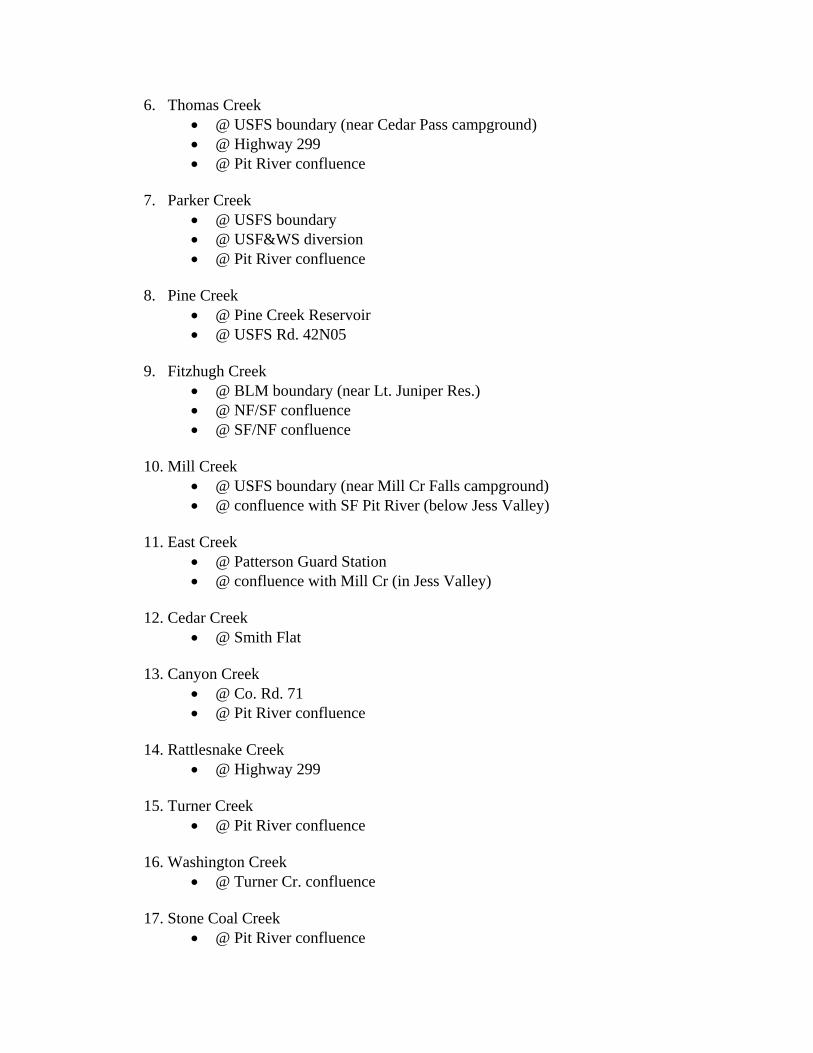
6. Thomas Creek • @ USFS boundary (near Cedar Pass campground) • @ Highway 299 • @ Pit River confluence
7. Parker Creek
• @ USFS boundary • @ USF&WS diversion • @ Pit River confluence
8. Pine Creek
• @ Pine Creek Reservoir • @ USFS Rd. 42N05
9. Fitzhugh Creek
• @ BLM boundary (near Lt. Juniper Res.) • @ NF/SF confluence • @ SF/NF confluence
10. Mill Creek
• @ USFS boundary (near Mill Cr Falls campground) • @ confluence with SF Pit River (below Jess Valley)
11. East Creek
• @ Patterson Guard Station • @ confluence with Mill Cr (in Jess Valley)
12. Cedar Creek
• @ Smith Flat
13. Canyon Creek • @ Co. Rd. 71 • @ Pit River confluence
14. Rattlesnake Creek
• @ Highway 299
15. Turner Creek • @ Pit River confluence
16. Washington Creek • @ Turner Cr. confluence
17. Stone Coal Creek
• @ Pit River confluence

18. Dutch Flat Creek
• @ USFS boundary
19. Butte Creek • @ Highway 299
20. Rush Creek
• @ Highway 299
21. Ash Creek • @ USFS Rd. 39N50 • @ Adin • @ Pit River confluence
22. Willow Creek
• @ Highway 139 (near Hayden Hill) • @ Co. Rd. A-2
23. Juniper Creek
• @ Co. Rd. 417
24. Horse Creek • @ Little Valley
25. Beaver Creek
• @ Co. Rd. 404 • @ Pittville
Channel Reach Surveys Conduct channel and habitat condition surveys on selected tributary streams. Unless otherwise modified by the TAC, field surveys will be conducted in accordance with the protocol already developed and in use by the Alliance and the TAC.
Deliverables: Interim and final data report for the channel reach surveys.
Fall River Channel Survey: Conduct a survey on Fall River for purposes of documenting existing conditions of channel morphology, aquatic vegetation, and aquatic macroinvertebrates, and comparing these existing conditions with previous survey work done by California Department of Water Resources and the Fall River RCD. Design and implementation of the survey will be as follows:
o Channel cross-sections at sites previously surveyed (in upper Fall

River) by DWR and the RCD, and new cross-section measurements at or near the water quality monitoring stations in lower Fall River.
• Aquatic vegetation transects located at similar sites as the channel
cross-sections and performed in accordance with the protocol used by DWR (unless otherwise modified by the TAC).
• Macroinvertebrate sampling at similar sites as the channel and
vegetation transects and performed using the DWR protocol (unless otherwise modified by the TAC).
Deliverables: Survey design report, interim and final data report for Fall River channel survey.
Data Management Collect, store and analyze data from both monitoring procedures outlined in Tasks 3, 4, and 5. Develop a data archive system to permanently store monitoring data. Provide for access to monitoring program data via the Pit River Alliance website. Provide for data transfer to a statewide data management system as required by the SWRCB.
Deliverables: Pit River Watershed Monitoring Database, electronically based information access system.
Quality Assurance Plan The Contractor shall prepare and maintain a Quality Assurance Plan (QAP) in accordance with the EPA QAP Plans for Environmental Data Operations, QA/R5 Interim Final 5/94, where applicable. Submit QAP to Regional Board Quality Assurance/Quality Control Officer, the Contract Manager, and the TAC prior to using and/or implementing quality assurance methods in any sampling or monitoring activities Deliverables: QA Plan to Regional Board Quality Assurance Officer, Contract Manager, and the TAC. Final Report Prepare a technical summary report documenting the results of the two years of monitoring on Pit River tributaries. The report shall include the following components:
• Results of all data collected; • Analysis, storage, and distribution methods used for all data
collected; • Recommendations for continued monitoring of Pit River tributaries
Deliverables: Final Report to be submitted no later than December 30, 2005

LOWER SACRAMENTO RIVER WATERSHED There are 10 hydrologic sub-regions in the Sacramento River Watershed Basin. Five sub-regions are located in the upper (Redding) watershed, and five sub-regions are located in the lower (Sacramento) watershed of the Basin: Redding Sub-Regions 1) Northeast (Pit River, McCloud River, Upper Sacramento R.). 2) Upper Feather River (North/Middle/South Forks Feather u/s Oroville). 3) Westside Sacramento Valley (Cottonwood, Redbank, Elder, Thomes, Stony Creeks). 4) North and East-side Sacramento Valley (Clear, Cow, Bear, Battle, Mill, Deer, Big Chico, Butte Creeks). 5) Sacramento River (Redding to Hamilton City).
Sacramento Sub-Regions 1) Southside of Sacramento Valley (Cache and Putah Watersheds). 2) Yuba and Bear River Watersheds. 3) American River Watershed. 4) Lower Sacramento Valley Floor (Sacramento River Hamilton City to I St Bridge). 5) Sacramento Delta. The vision of the entire Sacramento River Watershed Basin SWAMP program is for a two-component monitoring program consisting of a combination of 1) rotational sub-regional monitoring and 2) limited special screening level studies (including better characterizing of known problems). The following is the long-term 5 year workplan and 2003/2004 annual workplan for the lower Sacramento River Watershed. I. Long Term 5-Year Workplan Goals and Objectives The goals of the SWAMP funded program in the lower Sacramento River Basin of Region 5 are:
1) Conduct ambient monitoring program that addresses all 5 sub-regions of the lower Sacramento River Watershed using consistent and objective monitoring, sampling and analytical methods; consistent data quality assurance protocols; and centralized data management. This monitoring program will be an umbrella program that monitors and interprets data for each hydrologic sub-basin at least one time every five years. Monitoring will build upon and be coordinated with monitoring being conducted by other entities.

2) Document ambient water quality conditions in potentially clean and polluted areas. The scale of these assessments ranges from site-specific to watershed-wide (or sub-region).
3) Conduct special screening level studies as needed for emerging contaminant issues.
4) Identify specific water quality problems preventing the SWRCB, and RWQCB’s, and the public from realizing beneficial uses of water in targeted watersheds.
5) Provide the data to assist in evaluation of the overall effectiveness of water quality regulatory programs in protecting beneficial uses of waters of the state.
The objectives of the SWAMP funded program in the lower Sacramento River Basin of Region 5 are:
1) Gather and conduct preliminary analysis of existing water quality data to identify data gaps and/or suspected problems needing better characterization.
2) Assess at least one hydrologic sub-basin in the lower Sacramento River Basin a year and rotate back through each sub-basin at least once every five years.
3) Identify beneficial uses in each sub-region and assess attainment and protection of those uses.
4) Incorporate and coordinate relevant and available monitoring data from other agencies and watershed groups in final interpretation of sub-regional assessments.
Methods to Achieve Objectives The methods used to achieve objectives of the SWAMP funded program in the lower Sacramento River Basin of Region 5 are:
1) Monitoring may include chemical, physical, and/or biological analyses. The type of monitoring analyses used in each fiscal year of SWAMP monitoring will depend upon a preliminary analysis of available information.
2) Prior to any monitoring, the preliminary analysis of existing water quality data will be used to identify data gaps and/or suspected problems needing better characterization.
3) Other programs/groups collecting monitoring data, such as TMDL’s, Ag Waiver, watershed groups (grant projects), and other will be valuable for identification of data gaps, identification of suspected problems needing better characterization, and for use in interpretation and final reporting of each rotational cycle of sub-regional monitoring data. Such analysis will be used to focus rotational and/or screening level monitoring efforts each fiscal year.
4) Priority may be given to coordinating SWAMP monitoring with CVRWQCB programs as based upon data gaps, needs, and available funding.
Deliverables due date(s)

Deliverables due date(s) for the SWAMP funded program in the lower Sacramento River Basin of Region 5 are:
1) Deliverable due dates will depend on the types of monitoring conducted each fiscal year, the workload of the laboratory conducting the analyses, and the time frame to get the funds into an executed contract.
2) All SWAMP monitoring data will be reported in final reports. Final reports will summarize existing water quality data and data gaps, analyze and interpret new data, and include relationship of data to protection and attainment of beneficial uses.
3) Final reports will be due for each fiscal year of SWAMP funding within 1 year of receiving final copies of all raw data.
4) All SWAMP monitoring data will be entered into the SWAMP database. Lower Sacramento River Hydrologic Unit Matrix The completed hydrologic unit matrix for the SWAMP funded program in the lower Sacramento River Basin of Region 5 is below.
Lower Sac SWAMP
Basins
Hydrological Basin
Hydrologic
Unit
Status1,2
1 Sacramento Delta
510.00 Planned for 07/08
Valley-Putah-Cache
511.00 02/03 - underway
Putah Creek
512.00 Planned for 06/07
2
Cache Creek
513.00 Planned for 06/07
American River
514.00 00/01 and 01/02 underway; Planned for 04/05
3 Valley-American
519.00 00/01, 01/02, and 02/03
underway Marysville
515.00 00/01, 01/02, and 02/03 underway
Bear River
516.00 Planned for 05/06
4
Yuba River
517.00 Planned for 05/06
5 Colusa Basin
520.00 00/01, 01/02, and 02/03 underway
1Status reflects project specific monitoring for fiscal years 2000/2001, 2001/2002, and 2002/2003. Fiscal years 2000/2001 through 2001/2002 consisted of a biological assessment project of agriculture-dominated waterways and effluent-dominated waterways. Fiscal year 2002/2003

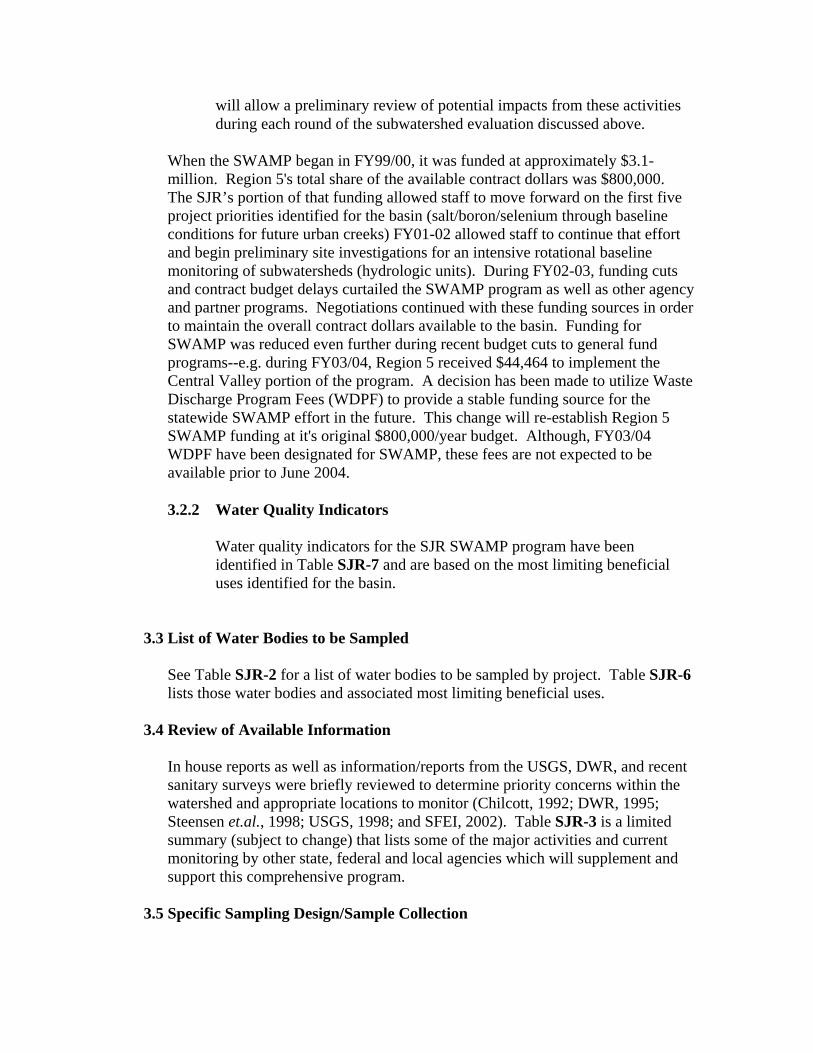
monitoring is currently underway and includes agricultural stormwater monitoring, sediment-bound contaminant investigation, and estrogenic endocrine disruption assays. Please see earlier workplans for more information.2Specific hydrological units for 03/04 SWAMP monitoring have not been determined. II. 2003/2004 Annual Workplan Goals and Objectives The goals and objectives of the SWAMP funded program in the lower Sacramento River Basin of Region 5 are the same as for the 5-year plan except for goal #2 which only applies to the long-term rotational monitoring. Methods to Achieve Objectives The methods used to achieve objectives of the SWAMP funded program in the lower Sacramento River Basin of Region 5 are the same as for the 5-year plan. Monitoring Plan Development of the monitoring approach for the 2003/2004 annual workplan has included coordination with CVRWQCB regulatory program needs, and available data from other agency programs and projects. This coordination has resulted in identification of a need for investigation of aquatic life beneficial uses in select types of Central Valley waterways. In addition, follow up metals analyses will be conducted in the Dry Creek Watershed (HU 519 Valley-American) on ambient toxicity detected by routine NPDES monitoring. Limited sediment-bound contaminant analyses will also be conducted as follow-up to 2002/2003 SWAMP monitoring. A monitoring plan will be developed prior to initiation of this investigation. Deliverables due date(s) Deliverables due date(s) for the SWAMP funded program in the lower Sacramento River Basin of Region 5 are the same as for the 5-year plan. Responsibility Matrix The responsibility matrix for the 2003/2004 Annual Workplan for the SWAMP funded program in the lower Sacramento River Basin of Region 5 is below.
Responsible Organization Task SWRCB RWQCBs Contractors
Develop contract(s) for monitoring services.
n n n
n

Responsible Organization Task SWRCB RWQCBs Contractors Identify water bodies or sites of concern and clean sites to be monitored. Identify site-specific locations with potential beneficial use impacts or unimpacted conditions that will be monitored.
n
Decide if concern is related to objectives focused on location or trends of impacts.
n
Select monitoring objective(s) based on potential beneficial use impact(s) or need to identify baseline conditions.
n
Identify already-completed monitoring and research efforts focused on potential problem, monitoring objective, or clean conditions.
n n
Make decision on adequacy of available information.
n n
Prepare site-specific study design based on monitoring objectives, the assessment of available information, sampling design, and
n (Work Plan
Review Role) n n

Responsible Organization Task SWRCB RWQCBs Contractors indicators.
Implement study design. (Collect and analyze samples.)
n
Track study progress. Review quality assurance information and make assessments on data quality. Adapt study as needed.
n (Review Role) n n
Report data through SWRCB web site.
n n
(Coordination Role)
n
Prepare written report of data.
n n n
III. Intra-agency Coordination Activities Intra-agency coordination activities for the lower Sacramento River SWAMP funded program for fiscal year 2003/2004 will include meetings and monitoring discussions with:
1) Agricultural Waiver Program Staff 2) Total Maximum Daily Load Program Staff 3) NPDES Staff 4) Grant Project Contract Managers 5) Relevant watershed groups
IV. Inter-agency Coordination Activities Other relevant monitoring will be evaluated as part of the inter-agency coordination activities for the lower Sacramento River SWAMP funded program for fiscal year 2003/2004. Such coordination will include meetings and/or monitoring discussions with:
1) US EPA

2) University of California 3) US Geological Survey 4) Department of Pesticide Regulation 5) Department of Fish and Game
The level of coordination will depend upon available resources. At minimum, contact with relevant agencies will be made and review of existing monitoring approach and framework will be conducted to ensure a coordinated monitoring approach that will best meet the needs of the CVRWQCB and stakeholders. SAN JOAQUIN RIVER WATERSHED 1.0 Introduction The San Joaquin River flows northward and drains the portion of the Central Valley south of the Sacramento-San Joaquin Delta and north of the Tulare Lake Basin. The San Joaquin River Basin covers 15,880 square miles and yields an average annual surface runoff of about 1.6 million acre feet. The Basin includes the entire area drained by the San Joaquin River and all watersheds tributary to the river. The principal streams in the basin are the San Joaquin River and its larger tributaries: the Cosumnes, Mokelumne, Calaveras, Stanislaus, Tuolumne, Merced, Chowchilla, and Fresno Rivers. Major reservoirs and lakes include Camanche, Pardee, New Hogan, New Melones, Don Pedro, McClure, and Millerton. The lower Basin (below Millerton Reservoir) has had a highly managed hydrology since implementation of the Central Valley Project (CVP) in 1951. Most of the San Joaquin River flow is diverted into the Friant-Kern Canal, leaving the river channel upstream of the Mendota Pool dry except during periods of wet weather flow and major snow melt. Poorer quality (higher salinity) water is imported from the Delta for irrigation along the west side of the river to replace water lost through diversion of the upper San Joaquin River flows. During the irrigation season, the flows in the river between the Mendota Pool and Salt Slough consist largely of groundwater accretions. Salt Slough and Mud Slough are the principal drainage arteries for the Grassland Sub-Watershed and add significantly to the flows and waste loads in the San Joaquin River upstream of its confluence with the Merced River. Discharges from three major river systems, the Merced, Tuolumne, and Stanislaus Rivers, which drain the Sierra Nevada, dominate flow and quality of discharges from the east side of the Lower San Joaquin River Basin. Flows from the west side of the river basin are dominated by agricultural return flows since west side streams are ephemeral and their downstream channels are used to transport agricultural return flows to the main river channel. Major land use along the San Joaquin Valley floor is agricultural, with over 2.1 million irrigated acres, representing 22% of the irrigated acreage in California. Urban growth along the I-5 corridor between Fresno and Stockton is rapidly converting historical agricultural lands to urban areas as more and more people choose to commute from the

Central Valley to the Bay Area. This rapid conversion of rural areas is leading to increased potential for stormwater and urban impacts to local waterways. The San Joaquin River Watershed can be broken into smaller units to address specific problems. One such area is the Grassland Watershed, a 370,000-acre area west of the San Joaquin River between the Tulare Lake Basin and the Orestimba Creek alluvial fan. The watershed contains managed wetlands, irrigated agriculture and a 97,000-acre drainage project area, which is the primary source of selenium to the San Joaquin River. Mud Slough (north) and Salt Slough are tributary to the river and serve as the only drainage outlets for the Grassland Watershed. In 1985, an extensive water quality survey to evaluate the impacts of agricultural drainage on the lower San Joaquin River was initiated. Although a number of issues of concern were identified, salt, boron and selenium impacts were the priority and the resulting multi-agency water quality monitoring program focused its limited resources on evaluating these constituents The area has since been the focus of the Region’s subsurface agricultural drainage program and considerable staff effort and resources have been directed to the effort of developing a comprehensive monitoring program, insuring stakeholder involvement, and adopting Basin Plan Amendments and Waste Discharge Requirements in order to develop a workable and comprehensive selenium control program. Maintaining the existing program and expanding it to facilitate real-time monitoring activities are priorities in the basin. Other issues of concern include: aquatic toxicity from water born pesticides; aquatic life impacts from pesticides in bed sediment; habitat impacts from sedimentation; elevated nutrient and BOD levels; pathogens; elevated temperatures; impacts from abandoned mines, timber harvesting and grazing; and establishing baseline condition in rural coast range streams in areas slated for future urban development. The proposed comprehensive SWAMP program builds upon this established framework. Table SJR-1 lists the projects within the basin by priority and provides a summary of anticipated costs. Specific details for each project including site locations, parameters to be monitored and frequency, and cost are described in Table SJR-2. A general description of each project is listed in the overview of the general approach (SJR 3.2.1). 2.0 5 Year Plan The SJR SWAMP program continues to work toward the objectives set forward in this workplan and is heavily dependant upon future funding. Annual assessment of data and changes in resource allocations may affect the future priority of the listed objective(s).
2.1 Objectives
• Continue baseline monitoring of the Main Stem SJR River and Drainage Basin sites.
• Complete the first 5-yr cycle of the Intensive Rotational Basin Program. • Continue assessment of data to produce bi-annual reports and help
reevaluate program priorities. • Provide funding for the creation of a crosswalk that will transfer all existing
SWAMP data within the CVRWQCB database to the SWAMP database.

• Compile data to produce draft report on first 5-yr cycle of the Intensive Rotational Basin Program.
• Develop web page on CVRWQCB web site for more timely dissemination of program objectives and WQ data to the public.
Anticipated Time Line
Objectives FY03-04 FY04-05 FY05-06 FY06-07 FY07-08
Continue Main Stem and Drainage Basin monitoring
• • • • •
Complete 1st cylce of Rotational Basin Monitoring Program
•
Assessment of SWAMP Data
• • • • •
Draft Bi-Annual Reports • • •
Transfer existing data from CVRWQCB database to SWAMP database
• •
Draft Report of 1st cycle (5-yr) Rotational Basin Program
• •
Anticipated Time Line
Objectives FY03-04 FY04-05 FY05-06 FY06-07 FY07-08
Develop web page for release of WQ data
•
3.0 Annual Plan
3.1Objectives
There are two main objectives in the SJR SWAMP program. The first objective is to insure that the most limiting beneficial uses in a specific water body are being protected and identify sources of potential impairment. The most limiting beneficial uses identified for the water bodies in the San Joaquin River Basin (Table SJR-6) are drinking water, aquatic life, irrigation water supply, recreation, and in the case of selenium, wildlife (specifically waterfowl). To evaluate beneficial use protection, results obtained from this program will be evaluated against narrative and numeric water quality objectives in The Water Quality Control Plan (Bruns, 1998), [which includes specific numeric objectives for selenium, boron and molybdenum that were adopted as part of the selenium control program, numeric electrical conductivity objective adopted as part of the

Bay/Delta program, and narrative criteria for toxicity] as well as narrative and numeric water quality goals listed in A Compilation of Water Quality Goals (Marshack, 2000)[See summary table SJR-7.] To identify potential sources of impairment, site selection has focused on locations representing subwatersheds within the basin and/or specific land uses.
The second objective is to determine, overtime, if implementation efforts are improving water quality. To help meet this objective, permanent monitoring locations have been selected along the main stem of the San Joaquin River and also at sites representing drainage flows into the main stem from five sub-basins. These sites will allow evaluation of water quality both over time and over water year types that can range from flood to critically dry years.
In meeting these two summary objectives, the design of the SJR monitoring program satisfies a number of the site-specific objectives identified in SWRCB (2000), as noted in Table SJR-6.
3.2 General Study Design
Sampling efforts are coordinated on the Water Year timeline1 in order to account for the temporal differences between normal, wet, dry and critical runoff years (SWRCB, 1995). Review and adjustments to all SWAMP program activities will be made upon evaluation of Water Year 2001 and 2002 data, which is expected to be completed by July 2004. Current focus is on the lower SJR and tributaries on the valley floor representing sub-watershed areas just prior to discharge into the lower SJR. Future augmentations will allow more randomized sampling of the upper watersheds during sub-basin rotations, which can in turn be coordinated with upper basin activities of pathogen source identification, abandoned mines, and grazing. Frequency of monitoring and selection of constituents have been adjusted to account for the arid nature of the watershed, it’s highly modified hydrology and the dominant role that storm water flows and irrigation return flows play in overall hydrology. For instance, special sampling events are scheduled during winter storms to catch the initial and ongoing flushes of the watershed, while overall sampling frequency is increased during the irrigation season to evaluate agricultural return flow impacts.
During FY02-03 and 03-04, monitoring activities related to the OP-TMDL, DO-TMDL and Ag Waiver efforts are scheduled to escalate in the San Joaquin River Basin; therefore, current design has eliminated pesticide, bioassessment and a majority of nutrient analyses from the overall program design.
3.2.1 Overview of General Approach 1 A water year lasts from 01 October through 30 September of the following year.

A general description of the projects prioritized in Table SJR-1 follows.
Salt/Boron/Selenium Program: This project would allow continued participation in the multi-agency monitoring effort to evaluate the effectiveness and environmental impacts of the Grassland Bypass Project on selenium, salt and boron concentrations within the Grassland Watershed and the Lower San Joaquin River (SFEI, 2002).
Expansion for Real Time Monitoring: This project allows expanded monitoring of salt and boron in assorted inflows to the Lower San Joaquin River (including an increase in the number of sites as well as the frequency of analyses), in order to facilitate the use of a “Real Time Model” to balance discharges of fresh and saline inflows to meet salt and boron water quality objectives at the boundary of the Sacramento-San Joaquin Delta.
Main Stem of the San Joaquin River: The San Joaquin River serves as the drainage channel for the entire 16,000 square mile basin and discharges into the Sacramento-San Joaquin Delta. Eight sites, each one downstream of a major inflow to the lower river, will be monitored weekly, monthly, or quarterly (depending on the constituent) to determine overall water quality and potential source of the constituent. In addition to selenium, salt, and boron, evaluations may be conducted for dissolved oxygen, pH, temperature, hardness, general minerals, trace elements, nutrients, pesticides, total suspended solids, total organic carbon, and water column toxicity.
Drainage Basin Inflows to the lower San Joaquin River: Based on evaluations conducted during the Inland Surface Water Plan (ISWP, 1993) and initial TMDL evaluations (ref), six subwatersheds have been identified in the San Joaquin River Basin(Figure SJR-1):
1. Northeast Basin: Comprised of the Cosumnes, Mokelumne, and
Calaveras Watersheds as well as eastside areas draining into the Sacramento-San Joaquin Delta downstream of Vernalis.
2. Eastside Basin: Comprised of the Stanislaus, Tuolumne, and Merced Watersheds as well as eastside valley floor areas draining directly to the main stem of the San Joaquin River.
3. Southeast Basin: Eastside areas draining into the San Joaquin River upstream of the San Joaquin River at Lander Avenue (Hwy 165).
4. Grassland Basin: Westside drainage into the San Joaquin River upstream of the Orestimba Creek watershed. Encompasses the Grassland Watershed (specifically identified within the Basin Plan (Bruns, 1998) which in turn encompasses the Drainage Project Area (97,000-acres of intensively farmed land that discharges selenium enriched subsurface agricultural drainage).

5. Northwest Basin: Westside drainage into the San Joaquin River between the Grassland Basin and the Sacramento-San Joaquin Delta.
6. Delta Basin: Westside drainage into and including the Lower Sacramento and Lower San Joaquin River systems.
Each sub-area is bounded by either the Sierra Nevada or Coast Range and is comprised of like land uses and drainage patterns. All natural and constructed water bodies have been identified in each sub-area as well as potential water quality concerns and major representative discharges to the lower river (ISWP, 1992). Multi-constituent monitoring is to be conducted at these representative discharges from each basin on monthly basis and twice a month during the irrigation season (February through August). The monitoring will allow an evaluation of the potential water quality concerns within the drainage basins as well as the relative impacts from the basins on the lower river.
Baseline Conditions for Future Urban Creek: Land use patterns in the basin are changing as traditionally rural areas are developing into an urban corridor between Fresno and Stockton, and demand continues to increase for housing in the Bay Area. A completely new city of 55,000 is slated for development between 2000 and 2003 and will completely surround Mountain House Creek. Mt. House Creek currently receives drainage from agricultural and pasture lands. This project will develop a record of baseline conditions and aid in evaluation of urban impacts on existing water bodies.
Intensive Rotational Basin Monitoring: The majority of monitoring efforts in the San Joaquin River Basin are focused on the valley floor and lower river reach. The Intensive Basin Program will evaluate surface water quality in the five identified subwatersheds that are tributary to the San Joaquin River on a five-year rotational basis and determine if beneficial uses are impaired. Data generated from this program will be used to evaluate overall water quality in the subwatershed, determine 303d listing and/or delisting, identify potential water quality concerns related to land use, and be used to help support and develop drinking water policy decisions. Approximately 15 sites will be selected from each of the 5 basins during the year that basin is monitored, in addition to the long-term monitoring sites already incorporated as part of the Drainage Basin Inflow project. At a minimum, the additional sites will be evaluated for EC, pH, temperature, turbidity, dissolved oxygen, total coliform, and E. coli twice a month. Expanded analyses will be funding dependent. Pathogens/Bacteria: All surface water bodies within the basin have potential municipal supply designated as a beneficial use. In addition, the San Joaquin River discharges to the Sacramento-San Joaquin Delta and can impact water supplies delivered to southern California. A major

concern with water supplies used for drinking water and recreation is contamination by pathogens and bacteria. This project will identify baseline pathogen/bacteria conditions within the five sub-basins described in Intensive Basin Rotational Monitoring and potential sources. If resources are available, this project will extend into the main stem of the San Joaquin River on a quarterly basis.
Total Organic Carbon: Drinking water groups have identified total organic carbon (TOC) as a constituent of high priority due to the potential for trihalomethane formation during chlorination of water supplies. TOC will be monitored on a weekly basis at 15 sites in the sub-basins described in Intensive Basin Rotational Monitoring to support the drinking water aspect of the Intensive Basin Program. This project will identify baseline TOC conditions within the five sub-basins and identify potential sources. It will then link back to the Main Stem program by correlating Intensive Basin findings to those found along the main stem.
Storm Events: The lower San Joaquin River has a highly managed hydrology with flow patterns and water quality primarily impacted by water year type (wet, normal, dry), storm events, and irrigation return flows. Frequency of standardized monitoring has been developed to emphasize predictable irrigation patterns. This project will focus on intensive monitoring of key sites distributed throughout the basin during two major storm events (greater than two inches of rain in a 72-hour period). Monitoring will be conducted every six to twelve hours depending on accessibility, while continuous samplers will be distributed to five sites in order to determine changing concentrations over time and flow patterns. Review of data will help to determine and change future storm sampling events.
Algal Bloom in Hidden Reservoir: Excessive algal Blooms have been observed in Hidden Reservoir (a.k.a. Hensley Lake). The Fresno River Watershed has been identified as the contributor of nutrients. SWAMP funds will be used to begin identifying sources of nitrates and phosphorus in the Fresno River Watershed.
Abandoned Mines: Mercury has been identified as a major contaminant of placer deposits in the Sierra Nevada. In addition, abandoned mercury mines exist in the coast ranges of the San Joaquin River Basin. This project will allow a preliminary review of potential mercury contamination from such sources during each round of the subwatershed evaluation discussed above. This project would build upon current efforts being put forth by the Regional Board Mercury TMDL program.
Grazing and Timber Harvest: Impacts from grazing and timber harvest have not been evaluated within the San Joaquin River Basin. This project
will allow a preliminary review of potential impacts from these activities during each round of the subwatershed evaluation discussed above.
When the SWAMP began in FY99/00, it was funded at approximately $3.1-million. Region 5's total share of the available contract dollars was $800,000. The SJR’s portion of that funding allowed staff to move forward on the first five project priorities identified for the basin (salt/boron/selenium through baseline conditions for future urban creeks) FY01-02 allowed staff to continue that effort and begin preliminary site investigations for an intensive rotational baseline monitoring of subwatersheds (hydrologic units). During FY02-03, funding cuts and contract budget delays curtailed the SWAMP program as well as other agency and partner programs. Negotiations continued with these funding sources in order to maintain the overall contract dollars available to the basin. Funding for SWAMP was reduced even further during recent budget cuts to general fund programs--e.g. during FY03/04, Region 5 received $44,464 to implement the Central Valley portion of the program. A decision has been made to utilize Waste Discharge Program Fees (WDPF) to provide a stable funding source for the statewide SWAMP effort in the future. This change will re-establish Region 5 SWAMP funding at it's original $800,000/year budget. Although, FY03/04 WDPF have been designated for SWAMP, these fees are not expected to be available prior to June 2004.
3.2.2 Water Quality Indicators
Water quality indicators for the SJR SWAMP program have been identified in Table SJR-7 and are based on the most limiting beneficial uses identified for the basin.
3.3 List of Water Bodies to be Sampled
See Table SJR-2 for a list of water bodies to be sampled by project. Table SJR-6 lists those water bodies and associated most limiting beneficial uses.
3.4 Review of Available Information
In house reports as well as information/reports from the USGS, DWR, and recent sanitary surveys were briefly reviewed to determine priority concerns within the watershed and appropriate locations to monitor (Chilcott, 1992; DWR, 1995; Steensen et.al., 1998; USGS, 1998; and SFEI, 2002). Table SJR-3 is a limited summary (subject to change) that lists some of the major activities and current monitoring by other state, federal and local agencies which will supplement and support this comprehensive program.
3.5 Specific Sampling Design/Sample Collection

Site locations and frequencies are listed in Table SJR-2. Sample collection procedures are listed in the Ag Subsurface Drainage Program Procedures Manual (Chilcott, et. al., 1996) and updated draft appendices. 3.6 Laboratory Analyses
Table SJR-4 lists laboratories and analytical methods used during FY01-02. Continued use of these laboratories will depend on future funding and availability of a blanket resolution to allow augmentation of current analytical contracts.
3.6 Data Quality Evaluation and Data Reporting
To maintain the integrity of the monitoring activities, specific QA/QC procedures have been developed. These procedures include precise sample preparation, collection, and processing activities, as well as, development of check samples (blanks, splits, spikes) to determine precision and accuracy of laboratory analyses--both in-house and by contract laboratories. All activities are governed by an internal Quality Assurance Project Plan (QAPP) (Chilcott, et. al., 1996), and updated appendices. Updates to these QAPP’s will be consistent with the pending master SWAMP QAPP.
3.7 Deliverable Products
The State Board will receive water year reports by project every two years with interim draft water quality information (EC, pH, Temp, Boron, Selenium, TSS, TOC) for San Joaquin River and Grassland Bypass Project sites is available on the web at: http://www.swrcb.ca.gov/rwqcb5/programs/agunit/bypass/disclaim.htm. Data at these sites is updated on a monthly basis and is usually available within 10 weeks of collection.
3.8 Desired Milestone Schedule
Activities specifically slated for FY03-04 include:
Complete funded monitoring identified in Table SJR-2 o Coordinate fieldwork internally and with outside agencies to meet
sampling schedule outlined in Table SJR-2 Augment existing laboratory contracts or develop new contracts and
subcontracts through the Master Contract for: o CSUS Foundation Student interns o DFG Master Sediment chemistry and toxicity,
equipment o Sierra Foothill Lab TSS, BOD, Toxicity testing, TOC

Update scope of work for water column toxicity, TOC, and bacteria analyses under Department of Fish and Game Master Contract
Update scope of work for sediment toxicity and sediment chemistry analyses under Department of Fish and Game Master Contract
Prepare a scope of work for equipment and supplies under Department of Fish and Game Master Contract
Update QAPP’s for following monitoring programs based on WY 01-03 data: o Main stem of the San Joaquin River o Drainage Basin Inflows to the San Joaquin River o Baseline conditions for future urban creeks o Intensive Rotational Basin Monitoring
Continue QA/QC comparisons for sample methods and laboratory analysis through coordination with other agency groups and internal laboratories
Complete the creation of the San Joaquin River SWAMP Website which will allow access to San Joaquin River Water Quality
Complete draft reports on the following topics o Water Quality chapter for the GBP Annual Report (Water Year 2001) o Water Quality within the Grassland Watershed (Water Year 2001) o Water Quality in the Lower San Joaquin River (Water Year 2001) o Phase I Intensive Basin Program
Complete Phase II Intensive Basin Program o Complete field monitoring o Draft initial findings
Start coordination efforts for Phase III: Intensive Basin Program o Establish contacts in the Orestimba, Salado, and Del Puerto River
Watersheds o Site selection o Begin monitoring in October 2004
3.9 Desired “Sample Throughput” Schedule
Throughput schedule will depend on lab being utilized and final contract agreement.
3.10 Budget
See Table SJR-2 for summary costs by project. The costs listed in Tables SJR-2 assume the use of the Master Contract for water column testing, sediment toxicity testing, and augmentation of an existing student contract for field work and data tracking. The listed costs assume that monitoring programs currently under development by the University of California, US Fish and Wildlife Service, and US Geological Survey will be in place by July 2004. Waste Discharge Permit Fees which total $329,800 for the SJR SWAMP program are not expected to be available until after July 1, 2004. Monitoring listed in Table SJR-2 under WDPF is subject to change pending final assessment of

WY01/02 data and review of FY04-05 inter and intra agency monitoring programs within the basin.
Summary Notes – SJR SWAMP Program
The previous discussion has applied to contract dollars. A severe shortfall exists in staffing necessary to maintain the program. Staff is needed to establish and maintain analytical and student contracts; establish and update QAPPs for each project; oversee and participate with students in sample collection, sample processing, data quality review, data entry and verification in data bases; prepare annual report; coordinate with federal, state and local agencies conducting monitoring within the Basin; and disseminate that information to area stakeholders.
Table SJR-5 indicates available staffing resources and additional resources necessary to adequately address monitoring issues.
4.0 Coordinated Activities
All available funding is being utilized for directed sampling activities to better characterize the extent and source of known and suspected water quality impairments. Activities are being coordinated with internal as well as external agency sampling efforts in order to meet the specific needs identified above, maximize limited resources, and insure comparability of data. These agency efforts include:
• Department of Pesticide Regulation: dormant spray evaluation program; • USEPA: toxicity and TIE monitoring program; • Central Valley RWQCB:
o Organophosphate Total Maximum Daily Load (OP TMDL) dormant spray evaluation program;
o Mercury TMDL (loading of Methyl Mercury); o Agricultural Waiver Discharge Evaluation; o Dissolved Oxygen TMDL effort.
• US Fish and Wildlife Service: Nutrient Survey; • USGS: Phase II National Ambient Water Quality Monitoring (NAWQA)
Program
4.1 Working Relationships

Responsible Organization Task SWRCB RWQCBs Contractors Develop contract(s) for monitoring services.
n n n
Identify water bodies or sites of concern and clean sites to be monitored.
n
Identify site-specific locations with potential beneficial use impacts or unimpacted conditions that will be monitored.
n
Decide if concern is related to objectives focused on location or trends of impacts.
n
Select monitoring objective(s) based on potential beneficial use impact(s) or need to identify baseline conditions.
n
Identify already-completed
monitoring and research efforts focused on potential problem, monitoring objective, or clean conditions.
n
n

Responsible Organization Task SWRCB RWQCBs Contractors Make decision on adequacy of available information. Prepare site-specific study design based on monitoring objectives, the assessment of available information, sampling design, and indicators.
n (Work Plan
Review Role) n
Implement study design. (Collect and analyze samples.)
n n
Track study progress. Review quality assurance information and make assessments on data quality. Adapt study as needed.
n (Review Role) n n
Report data through SWRCB web site.
n n
(Coordination Role)
n
Prepare written report of data.
n n
REFERENCES:
Bruns, J.A., 1998. The Water Quality Control Plan (Basin Plan) for the California Regional Water Quality Control Board Central Valley Region; Fourth Edition 1998. Regional Water Quality Control Board, Central Valley Region Report.

Chilcott, J., 1992. Consideration of Water Body Designations to Comply with Provisions of the Water Quality Control Plan for Inland Surface Waters of California (ISWP). Regional Water Quality Control Board, Central Valley Region Report. Chilcott, J., Laguna, C., Dinkler, L., 1996. Agricultural Subsurface Drainage Program Procedures Manual. Regional Water Quality Control Board, Central Valley Region Report DWR (California Department of Water Resources 1995). California Water Supply Outlook, October 1994 through September 1995. Division of Flood Management. Marshack, J.B., 2000. A Compilation of Water Quality Goals. Regional Water Quality Control Board, Central Valley Region Report. Oppenheimer, E.I., Grober, L.F., Leva, D.A., Tadlock, T.A., Davis, H.H., Nichol, G.D., 2002. Total Maximum Daily Load for Salinity and Boron in the Lower San Joaquin River. Regional Water Quality Control Board, Central Valley Region Report. SFEI (San Francisco Estuary Institutes). 2002. Grassland Bypass Project Annual Report: October 1, 1999 through September 30, 2000. Prepared for the Grassland bypass Project Oversight Committee. Richmond, CA. Steensen, Ross A., Chilcott, Jeanne E., Grober, Les F., Jensen, Laura D. Eppinger, Jan L., Burns, Thomas, 1998. Compilation of Electrical Conductivity, Boron, and Selenium Water Quality Data for the Grassland Watershed and San Joaquin River May 1985- September 1995. Regional Water Quality Control Board, Central Valley Region Report. SWRCB (State Water Resources Control Board, Cal EPA). 1995. Water Quality Control Plan for the San Francisco Bay/Sacramento-San Joaquin Delta Estuary. SWRCB (State Water Resources Control Board), 2000. Proposal for a Comprehensive Ambient Surface Water Quality Monitoring Program, Report to the Legislature, November 30, 2000. USGS (United States Geological Survey) Dubrovsky, Neil M., Kratzer, Charles R., Brown, Larry R. Gronberg, JoAnn M., Burow, Karen R., 1998. Water Quality in the San Joaquin-Tulare Basin, California, 1992-1995. U.S. Geological Survey Circular 1159. WMI (Watershed Management Initiative), 2001. Central Valley Regional Water Quality Control Board Watershed Management Initiative Chapter. Regional Water Quality Control Board, Central Valley Region Report. TULARE LAKE BASIN PART 1 – 5 YEAR LONG TERM PLAN:

Vision, Goals, and Objectives The Tulare Lake Basin is divided into six watershed management areas: Kern County Basin Tulare Lake Basin Tule Basin Kaweah Basin Kings Basin Westside Basin VISION: The vision of the Tulare Lake Basin SWAMP is for a two-component monitoring program consisting of a combination of 1) rotational watershed management area monitoring and 2) limited special screening level studies (including better characterization of known problems). Prior to any monitoring, a preliminary analysis of existing water quality data will be used to identify data gaps and/or suspected problems needing better characterization. Other programs/groups collecting monitoring data, such as TMDL’s, Ag Waiver, watershed groups (grant projects), and others will be valuable for the identification of data gaps, identification of suspected problems needing better characterization, and for use in interpretation and final reporting of each rotational cycle of watershed management area monitoring data. Such analysis will be used to focus rotational and/or screening level monitoring efforts each fiscal year. All SWAMP monitoring data will be reported in final reports and submitted to the SWAMP database. Final reports will summarize existing water quality data and data gaps, analyze and interpret new data, and include relationship of data to protection and attainment of beneficial uses. GOALS:
1) Conduct ambient monitoring program that addresses all 6 watershed management areas of the Tulare Lake Basin using consistent and objective monitoring, sampling, and analytical methods; consistent data quality assurance protocols; and centralized data management. This monitoring program will be an umbrella program that monitors and interprets data for each watershed management area at least one time every five years.
2) Document ambient water quality conditions in potentially clean and polluted areas. The scale of these assessments ranges from site-specific to watershed wide.
3) Conduct limited special screening level studies as needed for emerging contaminant issues.
4) Identify specific water quality problems preventing the SWRCB, RWQCB’s and the public from realizing beneficial uses of water in targeted watersheds.
5) Provide the data to evaluate the overall effectiveness of water quality regulatory programs in protecting beneficial uses of waters of the state.

6) Determine whether there is an association between land use and water quality impacts.
OBJECTIVES:
1) Gather and conduct preliminary analysis of existing water quality data to identify data gaps and/or suspected problems needing better characterization.
2) Assess one watershed management area per year and rotate back through each watershed management area at least once every five years.
3) Identify beneficial uses in each watershed management area and assess attainment and protection of those uses.
4) Incorporate and coordinate relevant and available monitoring data from other agencies and watershed groups in final interpretation of watershed management area assessments.
Indication Selection:
Indicators (monitoring tools and methods) of water quality conditions and beneficial use attainment in rotational and/or screening level monitoring efforts will be selected based upon preliminary analyses of existing information, suspected water quality problems, and data gaps.
PART 2 –ANNUAL PLAN:
4.0 Specific Activities Planned for FY 2003-04 (Section 4 refers to previous years workplans)
Activities planned for FY 2003-04, will be to continue baseline water quality monitoring for the water bodies listed in section 4.1 as funding will allow. Due to issues with contracts in the past two fiscal years it has been difficult to have samples analyzed for all of the constituents we originally proposed during each sampling event. Therefore, we are continuing baseline monitoring as needed on water bodies listed as one through six in the following section. The Kern River and the Upper Kings have been identified through complaints from citizens groups identifying them as potentially impaired. Past monitoring has not provided enough data to determine any impairment. During the summer of 2002 a forest fire, known as the McNally Fire occurred in the upper Kern River watershed. The following wet season the river and Lake Isabella had visible sediment and debris. We propose to continue monitoring the Kern River and Lake Isabella through this fiscal year to monitor any continued effects from the fire. To more efficiently use SWAMP funding the primary focus of sampling for FY 2003-04 will be on the Kern and Kings Watershed Basins. If funding and staffing allow for additional sampling other water bodies listed in section 4.1 will be performed. 4.1 List of Water Bodies to be Sampled in 2003-04

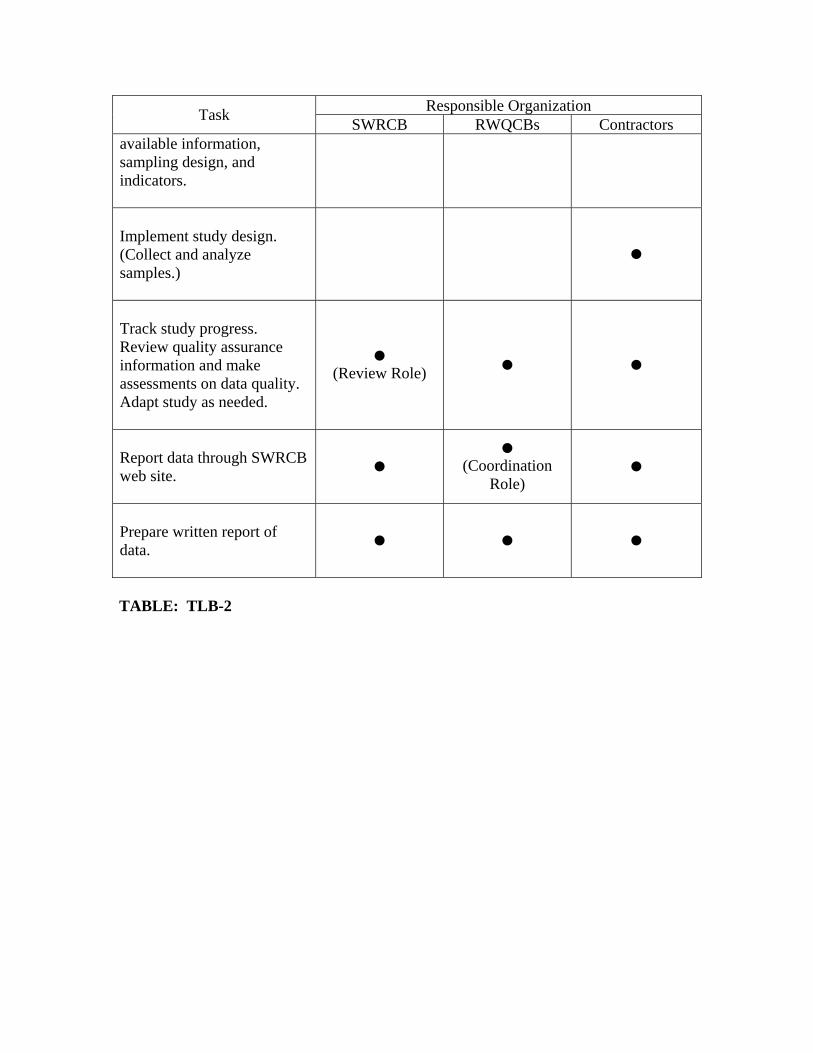
With SWAMP funding for FY 2003-04, baseline monitoring for the following underlined water bodies will continue. If additional funds become available in the second half of FY 2003-04 monitoring will be performed on the other water bodies listed with priority on the lower portions of the Kings, Kaweah, and Tule. Table TLB-2 provides a listing of monitoring parameters.
1. Ten Mile Creek, including Hume Lake
2. South Fork of the Kings River and tributaries
3. Kings River and tributaries
4. Kern River and tributaries, including Lake Isabella
5. Kaweah River and tributaries, including Lake Kaweah
6. Tule River and tributaries, including Lake Success and Elk Bayou
7. Mendota Pool
8. Panoche Creek
9. San Carlos Creek
4.2 Review of Available Information Data available from self monitoring reports, citizen monitoring data, United States Army Corp of Engineers, Federal Energy Regulatory Commission renewal projects, and any other current monitoring done by state, federal, or local agencies will be reviewed. 4.3 Specific Sampling Design/Sample Collection Site locations and frequencies will be developed for each watershed to be monitored. Sample sites will be designated using a Global Positioning System (GPS) and photographic documentation. Each watershed and related number of sampling sites are listed in Table 7 below:
TABLE 7 SAMPLING SITES AND ANALYSIS
FISCAL YEAR 2002-2003
Watershed Number of Sample Sites
Sample Analysis Frequency of Sampling
Ten Mile Creek
5
Physical Properties Nutrient and Bacteria
Quarterly
Kings River, South Fork
5
Physical Properties Nutrient and Bacteria
Quarterly

Watershed Number of Sample Sites
Sample Analysis Frequency of Sampling
Kings River
7
Physical Properties Nutrient and Bacteria
Quarterly
Kern River
18
Physical Properties Nutrient and Bacteria
Quarterly
Tule River
14
Physical Properties Nutrient and Bacteria
Quarterly
Kaweah River
14
Physical Properties Nutrient and Bacteria
Quarterly
Mendota Pool
6
Physical Properties Nutrient and Bacteria Inorganic Chemistry
March, April, May
Panoche Creek
4
Physical Properties Inorganic Chemistry
Quarterly
San Carlos Creek
4
Physical Properties Inorganic Chemistry Turbidity
Quarterly
Sample and collection procedures will follow all SWAMP QAPP guidelines. 4.4 Laboratory Analyses Laboratory analyses will depend on future funding and assessment needs for the watersheds to be monitored. Twining Laboratories, Inc. will perform the bacteria count, standard metals and minerals analysis (this is currently coming out of our office laboratory contract as the master contract amendment has not been encumbered); and University of California, Davis, Division of Environmental Studies, Limnology Lab will perform the nutrient analysis. 4.5 Data Quality Evaluation and Data Reporting To maintain data reliability and quality, monitoring activities will follow the SWAMP QAPP. Sampling activities will follow specific quality assurance/quality control procedures as outlined in the SWAMP QAPP. Data collected from other sources will be reviewed and assessed for reliability and quality based on the inclusion of quality assurance and laboratory reports. 4.6 Deliverable Products

For each watershed monitoring project an annual water year report will be prepared. In addition, copies of all reports and laboratory analysis will be submitted to the State of California, State Water Resources Control Board. 4.7 Desired Milestone Schedule Anticipated milestones are described in Table 8:
TABLE 8 ANTICIPATED MILESTONES
FISCAL YEAR 2003-2004
Milestone Projected Start Date Projected Date of Completion
Quarterly Sampling
1 September 2003
30 June 2004
Identifying Sampling Sites
1 August 2003
1 September 2004
Evaluation of Data 1 September 2003 1 October 2004 Preparation of Annual Report
30 June 2004
1 October 2004
Activities specifically slated for FY 03-04 include: Complete funded monitoring for water bodies listed in section 4.1
Coordinate field work internally and with citizen monitoring groups to complete quarterly sampling of sites.
Augment existing laboratory contracts or develop subcontracts through the Master Contract for: Twining Laboratories Water chemistry* UCD Nutrients** DFG Master Equipment, Sample Collection & Analysis
*We will not be amending this contract, we will use our existing office contract until funds through the DFG master contract become available. **We will use the remaining funds in the UCD contract. There are no plans to develop a new contract.
Start coordination efforts for expanding monitoring to Lower Kings River, Mendota Pool, Panoche Creek, and San Carlos Creek Establish agreement with Kings River Conservation District to collect lower
Kings River samples. Site Selection.

4.8 Desired “Sample Throughput” Schedule Throughput schedule will depend on laboratory being used and the final contract agreements and/or task orders. 4.9 Budget See attached Monitoring and Assessment Budget Table TLB-2. The costs listed in TLB-2 assume the use of existing laboratory contracts, use of the Master Contract, sample collection and analysis as needed, and data tracking. The listed costs assume the use of existing contracts without significant cost increases. Summary Notes – Tulare Lake Basin SWAMP Program The above discussion has applied to contract dollars. A severe shortfall exists in staffing necessary to maintain the program. Staff is needed to establish and maintain analytical contracts; establish and update QAPPs for each project; oversee and participate in sample collection, sample processing, data quality review, data entry and verification of data bases; prepare annual report; coordinate with federal, state, and local agencies conducting monitoring within the Basin; compile and evaluate existing data from other sources; and disseminate that information to area stakeholders. To perform these tasks we estimate a minimum of 2.0 PYs is still needed, currently the Tulare Lake Basin is allocated 0.3 PY. 4.10 Working Relationships (Intra & Interagency Coordination)
The following decision matrix describes the general relationships for implementing the regional monitoring portion of SWAMP. The SWAMP staff includes the contract manager for all grants that are currently funded to do surface water monitoring. Staff will work closely with these citizen monitoring groups on the development of their monitoring plans and QAPP development. Due to the time line for the Ag Waivers monitoring, SWAMP staff will look at that type of monitoring during FY 04-05. The three waterbodies on the 303d list are not to the point of TMDL development. However, SWAMP staff will work with citizen monitoring through the current grants and TMDL staff as needed to reduce any duplication in efforts. During the current fiscal year inter agency working relationships include close coordination with the United States Forest Service, Greenhorn Ranger District for Lake Isabella, and the United States Army Corps of Engineers for Lake Kaweah and Lake Success, these agencies have been providing us with staff and a boat to do sampling on these lakes. The Kings River Resource Conservation District has provided us with access to sampling locations on the lower Kings River.
Responsible Organization Task SWRCB RWQCBs Contractors

Responsible Organization Task SWRCB RWQCBs Contractors
Develop contract(s) for monitoring services.
n n n
Identify water bodies or sites of concern and clean sites to be monitored.
n
Identify site-specific locations with potential beneficial use impacts or unimpacted conditions that will be monitored.
n
Decide if concern is related to objectives focused on location or trends of impacts.
n
Select monitoring objective(s) based on potential beneficial use impact(s) or need to identify baseline conditions.
n
Identify already-completed monitoring and research efforts focused on potential problem, monitoring objective, or clean conditions.
n n
Make decision on adequacy of available information.
n n
Prepare site-specific study design based on monitoring objectives, the assessment of
n (Work Plan
Review Role) n n
Responsible Organization Task SWRCB RWQCBs Contractors available information, sampling design, and indicators.
Implement study design. (Collect and analyze samples.)
n
Track study progress. Review quality assurance information and make assessments on data quality. Adapt study as needed.
n (Review Role) n n
Report data through SWRCB web site.
n n
(Coordination Role)
n
Prepare written report of data.
n n n
TABLE: TLB-2

TOTAL ESTIMATED COST $24,960.00
I. MONITORING LOCATIONS 1. Ten Mile Creek, including Hume Lake 2. South Fork of the Kings River and tributaries 3. Kings River and tributaries 4. Kern River and tributaries, including Lake Isabella II. MONITORING PARAMETERS - EXPECTED 2003-2004 BUDGET1 1. Field Parameters
ParameterA. Total
Samples2 Method Frequency EC 160 Water Sample Quarterly DO 160 Water Sample Quarterly PH 160 Water Sample Quarterly Temperature 160 Water Sample Quarterly Sample Cost $0.00 Total Cost $0.00 2. Nutrients
ConstituentB. Total
Samples2 Method Frequency Nitrate 160 Water Sample Quarterly TKN 160 Water Sample Quarterly Phosphate 160 Water Sample Quarterly Ammonia 160 Water Sample Quarterly Analysis Cost $ 90.00 Total Cost $14,400.00 3. Pathogens C. Constituent Total Samples2 Method Frequency Total Coliform 160 Water Sample Quarterly Fecal Coliform 160 Water Sample Quarterly E. Coli 160 Water Sample Quarterly Analysis Cost $ 66.00 Total Cost $10,560.00

1Extent of water bodies to be sampled has been reduced due to funding uncertainty during first half of FY 03-04 and available PYs. Amended budget and Task Orders will be provided when FY03-04 funds are released to the Region. 2 40 samples per quarter.