San Francisco, CA 10/17/2012 Beyond the patient: Studying whole healthcare systems using claims...
30
1 San Francisco, CA 10/17/2012 Beyond the patient: Studying whole healthcare systems using claims data
-
Upload
opal-wright -
Category
Documents
-
view
213 -
download
0
Transcript of San Francisco, CA 10/17/2012 Beyond the patient: Studying whole healthcare systems using claims...

San Francisco, CA10/17/2012
Beyond the patient: Studying whole healthcare systems using
claims data

2
The important questions in healthcare are no longer about individual patients; they are about systems of care.
People Systems
Time Systems
Geographic Systems
Coordination of Care
Episodes of Care
Access to Care

3
Decision-makers will turn to complex analysis when we prove it’s better, faster, and cheaper.
Do we need another dermatologist in Tulsa?
Is offering chiropractic coverage worth it?
How can we measure ambulatory care quality effectively and fairly?
Intuition
Systems Analysis New data collection
Systems Analysis

4
HOW SHOULD PATIENTS AND PROVIDERS BE ORGANIZED?

5
We know very little about how we should build organizations to coordinate care.
Emphasis on primary care
workforceLimited panel of providers
Close coordination
between providers
• Reduced cost• Better patient
relationships
• Consistency of care• Transparency for
patients
• Reduced redundancy
• Higher quality
• “Weakest link” total quality
• Consolidation-related price increases
• Market power
• Cronyism• Groupthink

6
Existing direct comparisons produce robust results.
Social network analysis provides access to more definitions of coordination.
And more degrees of coordination.
VS.
But are not dynamic.

7
Social network analysis provides the vocabulary for talking about people systems.
Density: Extent to which every provider is connected
to every other provider
Clustering: Extent to which providers form natural
groups
Degree: The number of providers any individual provider connects with

8
To study the provider and patient social networks, we can derive a network from claims data.
Providers are linked to patients by claims.
Each patient can see many providers.

9
The most important links are the ones between doctors who share many patients.

10
Each patient’s network is unique.
Weak Links = Low Density
Strong Links = High Density

11
Results: High density may reduce total claims, not average cost.
Average cost ofservices
Total claims
ProviderDensity

12
Social network analysis helps us balance costs and benefits of coordination.
Information Noise
Collaboration Collusion
Consolidation Diversity
13
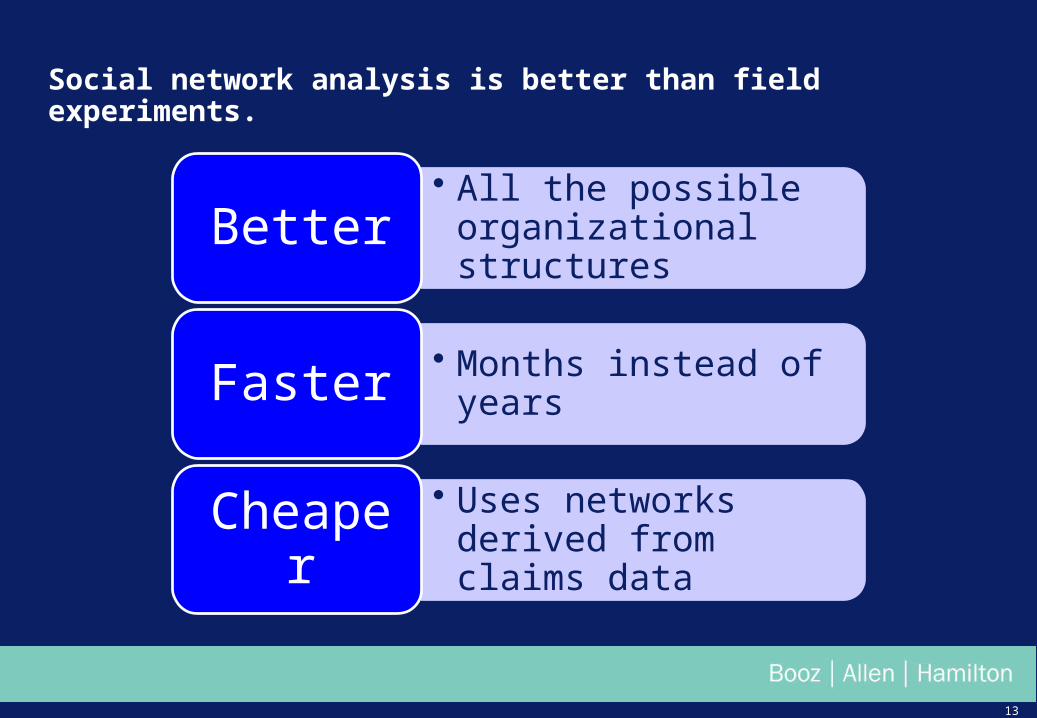
Social network analysis is better than field experiments.
• All the possible organizational structures
Better
• Months instead of yearsFaster
• Uses networks derived from claims dataCheaper

14
HOW IS HEALTHCARE CHANGING?
15
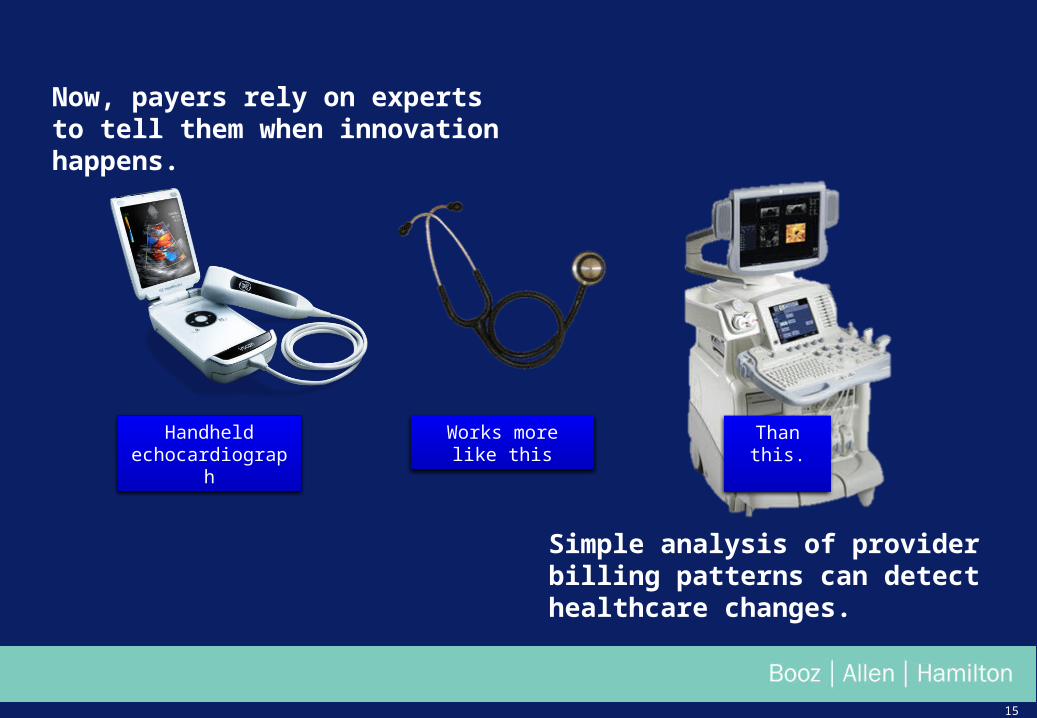
Now, payers rely on experts to tell them when innovation happens.
Simple analysis of provider billing patterns can detect healthcare changes.
Handheld echocardiograph
Works more like this
Than this.
16
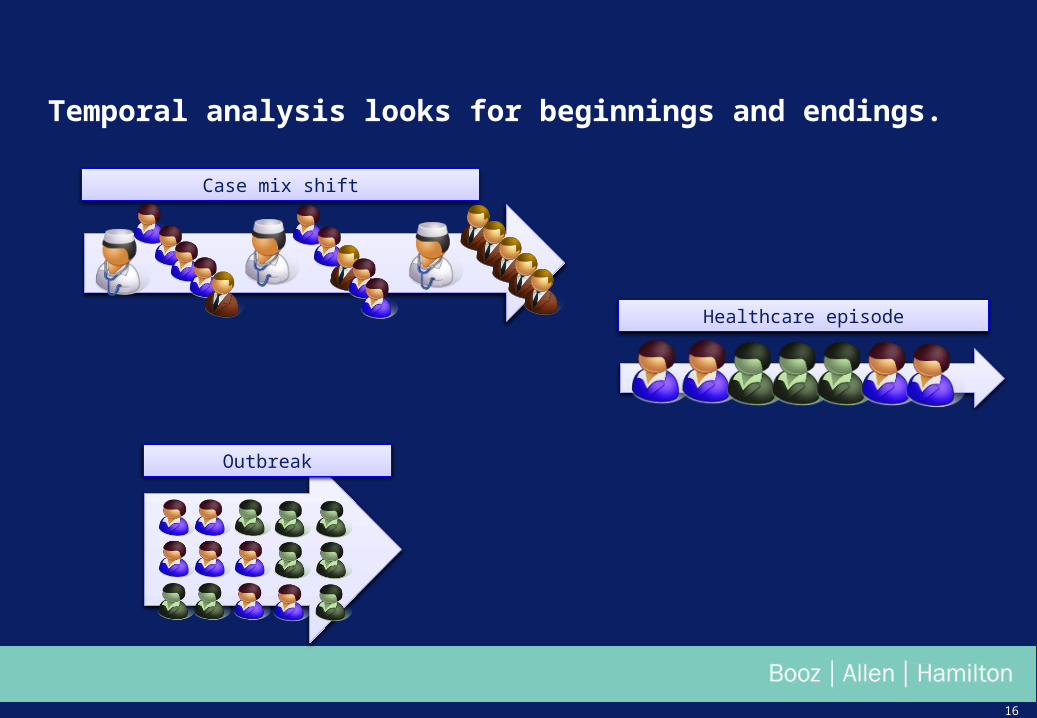
Temporal analysis looks for beginnings and endings.
Healthcare episode
Case mix shift
Outbreak
17
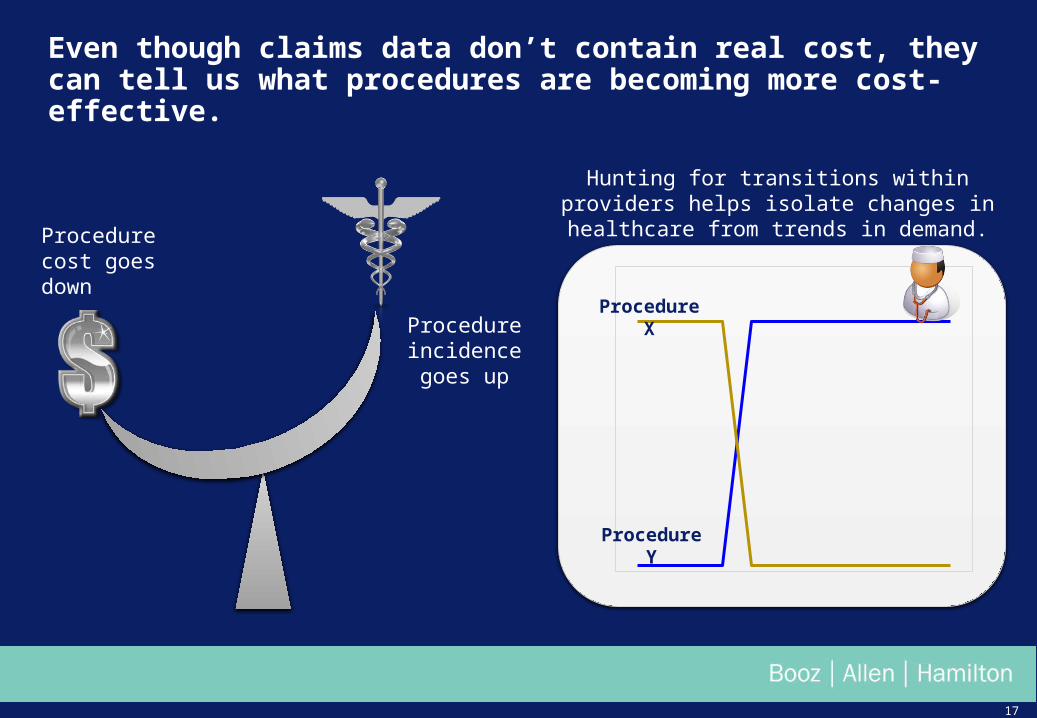
Even though claims data don’t contain real cost, they can tell us what procedures are becoming more cost-effective.
Procedure cost goes down
Procedure incidence goes
up
Procedure X
Procedure Y
Hunting for transitions within providers helps isolate changes in healthcare from trends in
demand.

18
The innovation detector spotted major healthcare innovations in 2009 data.
Stereoscopic X-ray Guidance• Made cheaper by ability to retrofit existing
devices with the capability.• Data say 43 providers switched in 2009.
Digital Mammography• Made more cost-effective by an increase in
reimbursement.• Data say 46 providers switched in 2009.
Transthoracic echocardiogram with color and doppler
• Made more possible by real-time 3D echo systems
• Data say 48 providers switched in 2009.

19
Event detection is better than MOST expert judgment.
• No profit motives or specialized expertiseBetter
• Days instead of monthsFaster
• A handful of analystsCheaper

20
WHERE SHOULD PROVIDERS BE?

21
Existing research on access focuses on matching one thing.
Location-based simulation methods permit measurement of true access.
Ethnic Concordance
Physical Access

22
Lipids
Ethnic disparities in preventive care persist despite equal healthcare coverage.
Differences in lipids panel rates between White and
African American Medicare beneficiaries
darker color=greater disparity

23
We measured true access by measuring how many doctors local, similar people go to
Providers
Patients
Access is location
And patient-provider match.
Access for each African-American is the number of doctors that her neighbors
used.

24
We measured individual healthcare disparity using simulation.
Where care is low for everyone,
ethnic disparities are low.
Where care is low just for African-Americans,
disparities are high.
Comparing each person to a random match
And repeating
Creates a personalized measure of healthcare
disadvantage.

25
Results: Access to facilities may have a bigger impact on preventive care disparities than access to office-based providers.
Access to Office-Based Providers
Access to Facilities
Preventive Care Disparity

26
We can use space to operationalize complex concepts like culture.
Income
Population density
Instead of getting data from several
sources and trying to combine
them…
Language
We can control for variation by analyzing
each person with respect to the neighborhood.

27
Geospatial methods are much better than other data analysis techniques for questions about location.
• No variance estimation issuesBetter
• Days instead of monthsFaster
• A single data sourceCheaper

28
DESIGNING EVIDENCE-BASED HEALTHCARE SYSTEMS

29
Evidence-based healthcare means evidence-based systems.
Field experiments and expert intuition are not fast or agile enough.
Innovations in computing and analysis give us the tools to analyze systems better, faster, and cheaper using the data we already have.
As champions of analytics, we should be promoting the simple uses of these data for making everyday business decisions better.