SAN FRANCISCO BAY · water mix to form a rich and unique ecosystem that benefits fish, wildlife and...
101
HOW WATER FLOWING TO THE OCEAN SUSTAINS CALIFORNIA’S GREATEST AQUATIC ECOSYSTEM THE FRESHWATER-STARVED ESTUARY SAN FRANCISCO BAY:
Transcript of SAN FRANCISCO BAY · water mix to form a rich and unique ecosystem that benefits fish, wildlife and...

HOW WATER FLOWING TO THE OCEAN SUSTAINS
CALIFORNIA’S GREATEST AQUATIC ECOSYSTEM
THE FRESHWATER-STARVED ESTUARY
SAN FRANCISCO BAY:


PREPARED FOR: BY:
SAN FRANCISCO BAY:
THE FRESHWATER-STARVED ESTUARY
HOW WATER FLOWING TO THE OCEAN SUSTAINS CALIFORNIA’S
GREATEST AQUATIC ECOSYSTEM
SEPTEMBER 2016

The Bay Institute is the research, policy and advocacy arm of bay.org, a nonprofit organization dedicated to protecting, restoring and inspiring conservation of San Francisco Bay and its watershed, from the Sierra to the sea. Since 1981, the Bay Institute’s scientists and policy experts have worked to secure stronger protections for endangered species, water quality, and estuarine habitats; reform how California manages its water resources; and design and promote comprehensive ecological restoration projects and programs in San Francisco Bay, the Sacramento-San Joaquin Delta, the Central Valley watershed, and the Gulf of the Farallones.
San Francisco Bay: The Freshwater-Starved Estuary was commissioned by the San Francisco Estuary Partnership, which provided the majority of the funding for the project. Additional support was provided by Ben Hammett; Robert and Anne Layzer; Robin and Peter Frazier; Corinne and Mike Doyle; Morgan and Bill Tarr; Steven and Susan Machtinger; and the Bay Institute Aquarium Foundation.
The report was researched and written by staff of the Bay Institute’s Rivers and Delta Program: Alison Weber-Stover (Staff Scientist), Greg Reis (Staff Scientist), and Jonathan Rosenfield, Ph.D. (Conservation Biologist and Lead Scientist), with assistance from Peter Vorster (Hydrogeographer), under the direction of Gary Bobker (Program Director), who also co-authored and edited the report. Report design and production was overseen by Ashley Spiker (http://www.thespikerexperience.com).
THE BAY INSTITUTEPier 35, The Embarcadero at Beach Street mailing address: Pier 39, Box #200 San Francisco, CA 94133
www.thebayinstitute.org

EXECUTIVE SUMMARY
INTRODUCTION
WHERE HAS ALL THE FRESHWATER GONE? PATTERNS OF NATURAL AND ALTERED FLOW TO SAN FRANCISCO BAY
STARVING THE BAY:HOW FLOW REDUCTIONS DAMAGE KEY COMPONENTS OF THE BAY’S ECOSYSTEM
WHO SUFFERS FROM THE BAY’S STARVATION DIET?HOW FISH, WILDLIFE, AND PEOPLE ARE HARMED BY A FRESHWATER-STARVED BAY
TURNING THE FLOW BACK ON:WHAT CAN BE DONE TO REVIVE THE FLOW-STARVED ESTUARY?
ENDNOTES
REFERENCES
GLOSSARY
i
1
6
16
34
56
63
66
79
TABLE OF CONTENTS

INTRODUCTIONTHE INFLOW OF FRESH WATER DRIVES THE HEALTH OF THE SAN FRANCISCO BAY ESTUARY AND ITS WATERSHED, FROM MOUNTAIN RIVERS TO THE PACIFIC OCEAN OUTSIDE THE GOLDEN GATE
San Francisco Bay is an estuary, where salt water and fresh water mix to form a rich and unique ecosystem that benefits fish, wildlife and people. Fresh water sustains the Bay ecosystem. Drastic changes to Bay inflow place the ecosystem, and the services it provides to all of us, at risk.
EXECUTIVE SUMMARY
THE FRESHWATER-STARVED ESTUARY
SAN FRANCISCO BAY:

California’s water wars – the fight over how much water cities, agriculture and the environment will get – are fought upstream, in the Bay’s watershed and in areas that take water out of it. But downstream, in the Bay estuary and nearby coastal waters, is where the outcomes of radically altering and reducing flows can be seen most clearly. These outcomes include fish and wildlife species at serious risk of extinction, degraded water quality, shrinking beaches and marshes, and so much more.
Tulare Lake Basin
San Joaquin River Basin
Delta
Sacramento River Basin
Gulf of the Farallones
WHERE HAS ALL THE FRESH WATER GONE?
FRESH WATER NATURALLY FLOWED TO THE BAY – UNTIL WE STARTED CAPTURING AND REDIRECTING MOST OF IT, ESPECIALLY DURING ECOLOGICALLY CRITICAL PERIODS
Historically, most Bay inflow came from winter rains and spring snowmelt, which kept the upper estuary fresh most of the year and created increasing-ly brackish and saline habitats moving downstream to the Golden Gate. The Bay’s fish and wildlife evolved to take advantage of these patterns of flow and habitat. But, after building thousands of dams, over 600 large reservoirs, and 1,300 miles of diversion canals throughout the Bay’s watershed, the flow that now reaches San Francisco Bay is on average less than 50%, and in some years less than 35%, of what it would be without those impairments. Ecolog-ically critical winter and spring flows have been cut even more, with about a third of the seasonal unimpaired runoff and, just one-fourth of the runoff from some storms reaching the Bay.
0
50,000
100,000
150,000
200,000
250,000
300,000
Oct Nov Dec Jan Feb Mar Apr May Jun Jul Aug Sep
FRES
HWAT
ER F
LOW
TO
SF
ESTU
ARY
(CFS
)
WY 2013 BAY INFLOW
Unimpaired Bay Inflow (est)
Actual Bay Inflow
75% of peak captured12/2/12
37% of peak captured 12/23/12
78% captured11/21/12
63% of peak captured 3/31/13
FRES
HW
ATE
R FL
OW
TO
SF
BAY
75% of peak captured 12/2/12
78% captured 11/21/12
Bay Inflow
81%
19%
1930-1949
Bay Inflow
Delta Exports
Upstream Withdrawls 68%6%
26%
1950-1974
Bay Inflow
Delta Exports
Upstream Withdrawls
46%
19%
35%
1975-1994
Bay Inflow
Delta Exports
Upstream Withdrawls 51%
18%
31%
1995-2014
Bay Inflow
Delta Exports
Upstream Withdrawls
Delta Exports
UpstreamDiversion
ii
Exports and diverions are greater than outflow 55% of time since the first time it happened in 1972
1930-‐19491950-‐19741975-‐20141995-‐2014
77%
23%
1930-1949
66% 6%
29%
1950-1974
47%
18%
36%
1975-2014 1975 - 2014

THE CHANGE IS SO EXTREME THAT THE SAN FRANCISCO BAY ECOSYSTEM NOW EXPERIENCES A DEVASTATING, PERMANENT DROUGHT
Between 1975 and 2014, the unimpaired runoff in the watershed was only low enough to create a “supercritically dry’” year once, in 1977. But upstream diversions captured so much runoff during those four decades that the Bay experienced “supercritically dry” conditions – the amount of inflow typical in extreme drought – in 19 years instead of only one. The resulting collapse of the Bay’s ecosystem is no surprise.
STARVING THE BAYEXTREME FLOW REDUCTIONS DAMAGE THE BAY’S ECOSYSTEM
How much fresh water makes it to the estuary, when, and for how long, shapes the Bay’s ecosystem. Reducing Bay inflows so dramatically shifts the size and location of the ecologi-cally important salinity mixing zone, reduces the inflow of nutrients, food, and sediment from the watershed that are vital components of fish and wildlife habitat; allows pollutants to accumulate; and facilitates invasions by undesirable non-native species.
SALINITY
The transition from fresh water to the ocean forms a gradient of increasingly saline habitats that are critically important for the estuary’s fish and wildlife. The amount and timing of inflow determines where and how extensive these productive low salinity habitats are. Winter and spring inflows move the critically important low salinity zone downstream in the upper reaches of San Francisco Bay. The abundance and distribution of many estuarine fish and invertebrate populations are strongly and persistently associated with the location of this zone; when it moves downstream, native species numbers increase.
Periods when the average salinity was as high as in the past half-century previously occurred only three times in the last 1,600 years – during recent droughts, January – July salinity was the highest it has been in 400 years. Reducing Bay inflow this drastically forces the low salinity zone to move upstream, exposing larval and juvenile fish to poor water quality and habitat conditions in the Delta, facilitating the spread of
50 32 32 54 40 69 40 67 88 42 27 70 36 24 26 21 25 32 47 40 76 68 73 82 61 62 40 29 41 60 43 76 39 34 28 34 61 38 42 33
% of unimpaired

2009 FEB - JUN ACTUAL SALINITY
28% OF UNIMPAIRED FLOW
invasive non-native species, and driving population declines of native species. Shifting the salinity field upstream also brings salty water to fresh and brackish water marshes, reducing the productivity of wetland habitats and number of plant and animal species in them, and slowing the formation of new soil.
Further downstream, persistent increased salinities from reduced inflow displace the native invertebrate community in the Central Bay, allowing non-native sea squirts to dominatethe subtidal zone. In the South Bay, freshwater inflows riding on the surface over a deeper, saltier layer support the base of the food web with large plankton blooms; the effect is dampened when flows are reduced. Similarly, outside the Golden Gate, a plume of brackish water that forms when winter and spring flows to the Bay ride on the surface, stimulates plankton growthand facilitates the movement of nutrient-rich bottom water into the Bay. Because so much fresh water is captured upstream, salinity at the estuary’s downstream boundary has increased and the brackish water plume has diminished. In combination with warming seas, reduced flows from the Bay to nearshore waters are likely to lower productivity and increase the risk of starvation and reproductive failure in seabirds, fish, and marine mammals.
Photo Credit: David Sanger
iv
ESTIMATED FEB-JUN 2009 SALINITY AT 100% UNIMPAIRED
FLOW

SEDIMENT
Higher Bay inflows carry more sediment (gravel, silt, and other particles), which helps form and maintain wetlands and beaches, and make the estuary’s waters more turbid, or cloudy, protecting fish and invertebrates from predators. But dams and diversions capture sediment and reduce sediment-carrying flows. Sand makes up 70% of the Sacramento River’s sediment load when flows are high; reducing flows helped cut the sediment load in half between 1957 and 2001. Flow reduction combined with other factors facilitated the shrinking of sandy beaches in the Bay by two-thirds, a 50% increase in coastal erosion, and a decline of up to 40% in turbidity in the upper estuary.
POLLUTION
When Bay inflows are low, concentrations of chemical and biological contaminants build up, sometimes to toxic levels, and increase the amount of time these pollutants spend in the estuary. Heavy metals and synthetic compounds like copper, mercury, PCBs and silver are more readily incorporated by aquatic organisms, at lower flows. The trace element selenium, which causes birth defects and reproductive mortality in many species, accumulates more rapidly in clams, and the fish
and birds that prey on them, when flows are at the low levels seen in recent years. Low flows also encourage toxic algae blooms, which produce neurotoxins that build up in the environment and can kill animals and sicken people. These blooms are becoming more frequent in the upper estuary, and their toxins are detectable throughout the Bay.
FOOD WEB PRODUCTIVITY
San Francisco Bay is a highly productive nursery for fish, birds, mammals, and invertebrates like crabs and shrimp. Freshwater inflow stimulates the Bay estuary’s food web by increasing production of fish and large planktonic animals that thrive in the muddy waters and wetlands that are created and sustained by sediment-laden peak flows. Flows also transport some of these organisms to other parts of the estuary, where they become prey for other species. Altering flows alters the food web. As flows decline, the biomass of important inver-tebrate prey populations like Bay shrimp declines correspondingly; water clarity increases, increasing the rate of predation on food prey species; and non-native species colonize the estuary, competing with or preying on native species. If the amount and timing of Bay inflows are allowed to more closely approximate natural patterns, these effects can be reversed.

WHO SUFFERS FROM THE BAY’S FRESH WATER STARVATION DIET?
The Bay ecosystem supports more than 750 plant and animal species, including four unique runs of Chinook salmon, and millions of waterbirds. Seven million residents and more than twice as many visitors enjoy seafood produced locally in this estuary, recreate along its shores or in its waters, and draw satisfaction from its wetlands and wildlife. Reducing Bay inflows puts all of these values at risk.
VIABLE FISH AND WILDLIFE POPULATIONS NEED FRESH WATER
Conditions in the flow-starved estuary are very different from those in which native plants and animals evolved. As a result, some of the most common species, like Delta smelt, Chinook salmon, and sturgeon, are now among the rarest. What these and many other species – organisms that vary in their life histories, role in the food web, and location in the estuary – have in common is the strong relationship between flow and healthy populations.
To be viable, the Bay’s plants and animal populations need to be:
• abundant (higher populations ensure long-term survival through a range of different conditions)
• diverse (increased variation among individuals increases the odds that some will respond successfully to changing environmental stresses)
• productive (faster population growth rates allow species to exploit good conditions in a variable environment); and
• spatially distributed (exists in a large enough area reduces the risks posed by local catastrophes)
ABUNDANCE
Reproduction, growth, and migration of many species, from invertebrates to forage fish to migrating salmon, are timed to occur during the critical winter and spring months when flows are higher. The number of individuals in these populations is strongly influenced by how much Bay inflow occurs during this period – this is one of the best-documented facts known about the Bay estuary. The dramatic decline in abundance of many populations closely tracks the dramatic decline in winter – spring Bay inflows; that is, less flow has resulted in less fish – for some species, populations are at record or near record low levels. In contrast, the abundance of many non-native species is inversely propor-tional to flow, increasing under low flow conditions. Flows in the fall also create brackish water habitat for Delta smelt and help returning adult salmon find their home spawning grounds.
MORE FRESHWATER = MORE FISH
Years
vi

DIVERSITY
A population with more diverse individuals is less vulnerable to extinction because it has a portfolio of possible behavioral and ecological responses to changing or variable conditions. Restricting the amount and timing of flows year after year favors the survival of a small subset of individuals that are only able to prosper under a limited set of conditions. For instance, nearly eliminating peak Bay inflows from the San Joaquin River and replacing them with small artificial pulses that occur during just one month narrows the migration window for Chinook salmon, in essence gambling that these fish will reach the ocean exactly when food supplies and other conditions are good. The collapse of California’s salmon fisheries shows that this gamble has not paid off. SPATIAL DISTRIBUTION
When all individuals in a population are concentrated in a small area, the population is more vulnerable to extinction due to localized catastrophes. Lower Bay inflows significantly reduce the size of the low salinity habitat that many species depend on. Low inflows also shift this habitat– and the populations using it – upstream, exposing imperiled fish to the giant Delta pumps, where on average 9 million fish are screened out of the exported water each year - most do not survive from the experience. In addition, to creating important habitat types, freshwater inflows to the Bay also help transport organisms between essential habitats. By degrading water quality, eliminating signals that fish and wildlife use to orient themselves, and even drying up sections of rivers, low Bay inflows can prevent populations from spreading out or migrating.
PRODUCTIVITY
Fish and wildlife populations that can grow quickly can rebound quickly following times when conditions are poor. The Bay estuary’s species evolved to rebound in wetter years after periods of drought. But the Bay’s “permanent drought” means that wet years are infrequent and much less wet, and drier years are extremely dry and nearly continuous. As a result, the higher flows that would allow populations to rebound rarely occur, and the growth rate is limited or even negative.

DRIVING RECREATIONAL AND COMMERCIAL FISHERIES TO THE EDGE?
The flow and habitat conditions that once prevailed in San Francisco Bay made the area a hub of commercial and recre-ational fishing activity on the West Coast, with important fisheries for salmon, sturgeon, smelt, striped bass, and other species. The long-term trend of reducing Bay inflows has been a major factor in the loss of thousands of fishing jobs over the past few decades and the historic closure of the ocean salmon fishery in 2008-2010. While deteriorating ocean conditions, upstream habitat degradation, and poor hatchery management also played a role, scientists studying the closure have identified better flow conditions as one of the few actions that can be taken to restore the salmon fishery. Starry flounder, sturgeon, and splittail are other commercially valuable fisheries that depend on adequate flows and that are also at risk.
Photo Credit: Richard Eskite
FLOW (AND FORAGE FISH) IS FOR THE BIRDS…
Forage fish (small fish and large invertebrates) that are food items for many larger fish, bird and mammal species perform a crucial function in the estuary’s food web. For instance, fish-eating birds, such as pelicans, terns, and cormorants, rely on the existence of sufficient forage fish populations to feed them. Populations of many once common native forage fish species, like smelt, salmon, and shrimp, have declined dramat-ically in response to extreme reductions in Bay inflows and are now well below the levels needed to maintain viable populations of other fish, pelagic seabirds and marine mammals, so these other populations are at risk of collapsing too. Also, as reduced inflows reduce the area of brackish and freshwater wetlands or convert them to salt marsh, their habitat value for many bird populations is likely to diminish.
…AND THE WHALES
Marine mammals like seals and whales are a great tourist attraction in the Bay Area and the Northern California coast. By diminishing productivity and constricting the estuary’s food web, reduced Bay inflows produce cascading effects that eventually create problems for these species. For example, Orca whales outside the Golden Gate prey on Chinook salmon, which were histori-cally abundant and high in fat content; dwindling salmon runs threaten the local whale population.
viii

… AND THE PEOPLE
Bay Area residents and tourists don’t just benefit from Bay inflows by catching fish, buying local seafood, or going whale watching. They also wade, swim, sail and kayak its waters and play on its beaches and in its wetlands. But low flows degrade water quality in general and are now beginning to cause periodic harmful algae blooms, in particular. Some cyanobac-teria blooms produce neurotoxins powerful enough to make humans sick and kill small mammals; although the blooms occur in the upper estuary, neurotoxins produced upstream have been detected in the Central Bay. Low Bay inflows also threaten the continued existence of beaches and wetlands throughout the region. As rising sea levels and other forces erode these popular areas, water diversions limit the peak flows that would normally resupply them with sediment.
A Bay Area where it’s hard to catch salmon, see pelicans or Orca whales, find today’s local catch at the restaurant, hang out at the beach, or even be in contact with the water? This is a high price to pay for ignoring the effect of the radical alteration of Bay inflows on the many ecosystem services and economic benefits that the San Francisco Bay estuary provides.
Photo Credit: David Ferris
TURNING THE FLOW BACK ONFortunately, there are actions that Californians can take to avoid that increasingly likely scenario.
ADOPT STRONGER WATER QUALITY STANDARDS FOR THE BAY ESTUARY NOW
Overwhelming evidence demonstrates that today’s 21-year old Bay-Delta water quality standards do not require nearly enough flow to protect the beneficial uses of the San Francisco Bay Estuary’s waters as mandated by the Clean Water Act. That finding has been confirmed time and again by policy makers, regulatory agencies, and independent science review panels. Yet California is still years away from completing the update of its standards begun in 2009, despite the federal requirement to review standards every three years. It’s time to end the delays and adopt new standards that require enough flow to restore estuarine productivity and viable fish and wildlife populations, discourage the establishment and spread of invasive non-native species, and use indicators of biological and ecosystem health to measure progress and increase effectiveness.
REQUIRE ALL WATER DIVERTERS TO CONTRIBUTE THEIR FAIR SHARE
The primary responsibility for meeting Bay estuary water quality standards falls on a small subset of water districts that get water from the federal and state water projects. These agencies represent a quarter or less of total water use in the Bay’s watershed. Requiring all water users, including those with senior water rights, to contribute a fair share would spread the burden more equitably and generate millions of acre-feet of additional water to restore the estuary. It’s also time to more broadly overhaul California’s antiquated water rights system,

which favors older water claims over the needs and public benefits generated by different water uses; this system has also awarded the right to use five times more water in California than occurs naturally, on average.
REDUCE RELIANCE ON THE DELTA AS A SOURCE OF WATER SUPPLY
In 2009, California adopted a landmark policy to reduce reliance on water supplies from the Delta region of the upper estuary and increase local self-reliance in areas that take water out of the Delta. California has only begun to tap the potential for local self-reliance; using water more efficiently, reusing and recycling water, cleaning up degraded water, capturing and reusing stormwater runoff, and storing water underground in aquifers could save up to 14 million acre-feet of water – over half the total amount of water used for human use throughout the Bay’s watershed each year – each year. Implementing the new policy could also significantly reduce California’s carbon footprint;for instance, transporting water via the State Water Project represents about 3% of the state’s total energy consumption. Setting targets for conserving water in the agricultural sector – which uses about 80% of the state’s developed water supplies – would generate additional water to restore a healthy Bay estuary and establish greater parity between agriculture and the urban sector, which is required to achieve a per-person conservation target of 20% by 2020.
Photo Credit: Fernand Ivaldi Getty Images
INTEGRATE FLOW AND HABITAT RESTORATION TO BATTLE CLIMATE CHANGE
Wetlands and beaches not only provide important habitat for fish and wildlife; they also act as natural flood barriers to protect shoreline communities in the Bay Area and Northern California. Loss of sediment supply and rising sea levels threaten to erode these benefits by literally eroding wetlands and beaches to nothing. Freshwater flow regimes that help maintain wetlands and beaches should be a part of efforts to design, evaluate, and permit restoration of these critical areas.
WE MUST ACT NOW
The science overwhelmingly indicates that more freshwater flow, following a more natural pattern, must reach the San Francisco Bay estuary to restore its fish, wildlife, water quality, food web, marshes, beaches, coastal fisheries, and other public benefits. The only barriers to action are the general lack of understand-ing about the severely degraded condition of this freshwater flow-starved estuary and the lack of political will to change the unsustainable way California manages its water resources. Can
Californians be made aware of the pending collapse of the Bay estuary ecosystem – and the loss of all that ecosystem provides us – and motivated to demand action now? Can decision-makers at every level – federal, state, and local – be prevailed upon to take the steps necessary to prevent the destruction of California’s greatest aquatic ecosystems before it is too late? The window of opportunity to protect this treasure is closing rapidly.
x


INTRODUCTION
The San Francisco Bay estuary is one of the world’s great ecosystems – a natural treasure comparable in scale and importance to the Everglades, Chesapeake Bay or the Great Lakes. Like these other large ecosystems, the health of San
Francisco Bay is at risk from many environmental insults. Contaminated agricultural runoff and legacy pollutants poison aquatic food webs. Invasive plants and animals compete with native species for food and habitat. Only a small fraction of its
THE FLOW OF FRESH WATER DRIVES THE HEALTH OF THE BAY AND ITS WATERSHED, FROM MOUNTAIN RIVERS TO THE PACIFIC OCEAN OUTSIDE THE GOLDEN GATE
Butter Lupine Photo Credit: David Sanger
1

THE BAY IS A MAJOR BUT UNAPPRECIATED CASUALTY IN CALIFORNIA’S “WATER WARS”
original wetlands remain. But perhaps the most serious and seemingly intractable threat comes from the large-scale and unsustainable diversion of the fresh water that should flow to the Bay from its vast watershed in California’s Central Valley (“Bay inflow”). The radical alteration of Bay inflow is intimately connected to every other problem that threatens the Bay estuary’s ecosystems. The inescapable facts are that the Bay estuary is being starved of the freshwater flow that makes it California’s greatest aquatic ecosystem – and that people don’t understand that fresh water flowing to the ocean is what keeps the Bay alive.
Freshwater flows define the San Francisco Bay estuary. As the place where fresh water and saltwater mix, the estuary provides a unique brackish water ecosystem for hundreds of plant and animal species – many found nowhere else on Earth. San Francisco Bay is the most famous and recognizable part of this estuary, an ecosystem formed by the mixture of fresh water from the rivers and streams of California’s Central Valley and salt water from the ocean. When freshwater inflow to an estuary is drastically altered, as in it has been for San Francisco Bay, the very nature of the ecosystem is changed, with dramatic conse-quences for the fish and wildlife that depend on the estuary’s unique habitats. Ultimately, people who enjoy the many benefits this ecosystem offers – from its fishable and swimmable waters to its beaches and rich wetland habitats – lose out when we deny the estuary the freshwater flow it needs.
The long-standing conflicts over how much water should be diverted from the estuary and its watershed to provide water for irrigation, industry, and drinking water supplies are often depicted as occurring far upstream from San Francisco Bay. News stories
describe battles over how much water should be held back in the thousands of reservoirs in the Bay’s watershed, or diverted from Central Valley rivers, or exported by the giant pumps in the Sacramento-San Joaquin Delta, in order to be delivered to cities and farms. Government agencies and water districts fight over appropriate limits on water extractions in order to safeguard water quality, fish, and wildlife. People debate whether agribusi-ness should grow thirsty crops that depend on government subsidies and water from overdrafted groundwater basins and distant watersheds, and whether agricultural water use should be metered in our semi-arid environment.
What is rarely mentioned is that the outcomes of all battles in these water wars affect the Bay and the coastal ocean outside
the Golden Gate. Most of the freshwater flow that shaped these environments historical-ly is captured today in a massive system of reservoirs, siphons and pumps. The loss of
freshwater flow is harming the Bay and the nearshore marine ecosystems, the fish and wildlife that depend on them, and the humans that benefit from and enjoy them (Figure 1).
Figure 1: The amount and timing of critical freshwater inputs to the estuary are a function of what nature provides and the amount of water humans divert and store upstream. Unsustainable water diversions lead to altered ecological processes and degraded habitats which produce cascading effects on many beneficial uses that people gain from a functioning estuary ecosystem. The amount of fresh water reaching San Francisco Bay generates myriad public benefits, including healthy fish and wildlife populations, improved water quality, viable commercial and recreational fisheries, and ample recreational opportunities such as enjoying beaches or viewing wildlife.

WEATHER & CLIMATE
WATER TO SAN FRANCISCO BAY
Municipal, industrial, and agricultural water diversion & land use
RECREATIONAL OPPORTUNITIES
WEATHER & CLIMATEWEATHER & CLIMATE
Municipal, industrial, and agricultural water diversion & land use
WATER TO SAN FRANCISCO BAYWATER TO SAN FRANCISCO BAYWATER TO SAN FRANCISCO BAYWATER TO SAN FRANCISCO BAY
HABITATLow Salinity Zone, Brackish and Freshwater
Marshes, Beaches, Mudflats
ECOLOGICAL PROCESSESSalinity, Transport, Sediment Supply (Wetland and
Beach Formation), Water Quality, Food Web
HEALTHY FISH & WILDLIFE
VIBRANT COMMERCIAL &
SPORT FISHERIESWATER
QUALITY
PUBLIC BENEFITS
3

CALIFORNIA’S PAST INVESTMENTS IN THE BAY ARE AT RISK Californians have invested a half-century of effort and billions of dollars to control water pollution, restore wetlands and prevent exotic species from being introduced to the Bay estuary. But that enormous financial and social investment is at risk unless we let a larger share of the watershed’s runoff flow downhill to the Bay. Californians can protect their investment in the Bay by changing the water use and water management practices that prevent us from protecting the freshwater flows that support this majestic ecosystem and the jobs that rely on its health.
This report describes how:
• The Bay’s natural freshwater flow regime has been altered by the world’s largest system for capturing and moving water;
• The estuary’s vital ecological processes, including salinity distribution, transport of sediments, nutrients, and food, pollution control, habitat availability, and food web dynamics, are damaged by these alterations to the natural runoff pattern; and,
• The living beings that depend on the health of the Bay, from simple aquatic plants, to forage fish, to migrating salmon, to marine mammals, to humans, are at serious risk from the loss of services the Bay ecosystem provides.
enormous financial and social investment is at risk unless we let


WHERE HAS ALL THE FRESH WATER GONE?PATTERNS OF NATURAL AND ALTERED FLOW TO SAN FRANCISCO BAY
San Francisco Bay is part of the largest estuary on the west coast of the Americas. The estuary extends from the inland Delta where the Sacramento and San Joaquin Rivers of California’s Central Valley converge, out to the nearshore coastal waters
of the Gulf of the Farallones. The Bay itself encompasses four major embayments – Suisun Bay, San Pablo Bay, Central Bay, and the South Bay (Figure 2).
Photo Credit: The Bay Institute

Tulare Lake Basin
San Joaquin River Basin
Delta
Sacramento River Basin
Gulf of the Farallones
THE SAN FRANCISCO BAY ESTUARY AND ITS WATERSHEDFigure 2: From the peaks of the mountain ranges surrounding the Central Valley to the Golden Gate, the San Francisco Bay watershed historically drained up to 40% of California’s land area. Most of the Bay’s inflow comes from rivers and streams that flow into the Sacramento and San Joaquin Rivers and then is funneled through the Delta to the Bay. Locally important creeks and rivers that discharge directly into the Bay contribute about 10% of the Bay’s freshwater inflow. The once vast Tulare Lake periodically overflowed into the San Joaquin River, but now the basin of this dry lakebed contributes water to the Bay only in the wettest years.
Sacramento - San Joaquin DeltaPhoto Credit: David Sanger
7

Freshwater flow drives everything that happens here. The Bay’s vast watershed now drains about a third of the land area of California, collecting surface and ground water from the Sacramento and San Joaquin River watersheds, and in excep-tionally wet years, from the Tulare Lake Basin, south of Fresno (which contributed water to the Bay more frequently before the construction of the current water supply system). Smaller rivers and creeks that flow directly into the Bay such as the Napa River, Guadalupe River, Sonoma Creek, Coyote Creek, Alameda Creek, San Francisquito Creek and Walnut Creek contribute less than 10% of inflow1.
The natural pattern of freshwater inflow to the Bay is shaped by California’s Mediterranean climate. About 80% of the annual precipitation in the Bay’s watershed occurs from November through March2. Winter storms can deposit large amounts of rain or snow in a matter of days, increasing runoff dramati-cally for short periods and periodically freshening the Bay. As temperatures warm in the spring, accumulated water held in the mountain snowpack – the state’s largest “reservoir” – melts and flows into the Bay, with high runoff that freshens the Bay for a much longer period than the peak flows that follow winter rainstorms. The high volume of the spring flow establishes an ecologically important salinity gradient in the estuary, which creates freshwater habitats in the Delta and parts of northern San Francisco Bay and increasingly brackish water habitats closer to the Golden Gate. As freshwater flows to the Bay decline in late summer and early fall, the zone of brackish water moves upstream as far as the
FRESH WATER NATURALLY FLOWED TO THE BAY….
western part of the Delta. Except under drought conditions, the Delta remains a freshwater ecosystem throughout the year3.
As discussed later in this report, the estuary’s native species have adapted to this naturally variable pattern of inflow to the Bay. The first pulses of runoff from winter storms trigger the migratory journeys of juvenile salmon and cue fish that live in the Delta and northern San Francisco Bay to begin to move to spawning areas. The large winter floods and spring snowmelt shape habitat availability in the estuary and drive numerous essential ecological processes downstream.
High year-to year variability in precip-itation and runoff is characteristic of a Mediterranean climate. Multi-year wet periods and dry periods (droughts) also are typical. Since the mid-1970s, the Bay’s watershed
has experienced three very dry periods (1976-1977, 1987-1992, and 2012-2015) and two extended wet periods (1978-1986; 1995-2000). Within the last millennium, the watershed has experienced even longer (decade- to century-long) droughts and wet periods4. The high variability between seasons and across years and the resulting shifts in the estuary’s salinity were probably essential in limiting the establishment of invasive non-native species prior to the 20th century.
By draining and filling wetlands and floodplains for conversion to agriculture and denuding hillsides for mining and logging, Californians began to change the pattern of runoff from the Bay’s watershed in the latter half of the 19th century. These actions reduced the watershed’s capacity to absorb snowmelt
… UNTIL WE DISRUPTED THE PATTERN – AND RADICALLY REDUCED FLOWS TO THE BAY

and storm runoff and increased the sediment load in rivers and streams. Agricultural diversions upstream of the estuary also increasingly reduced the total amount of fresh water that made it to the estuary. The impact on Bay inflows throughout the watershed became more pronounced in the 1920s and 1930s as flood control projects were built in the Sacramento Valley, the construction of dams and use of motorized pumps for wells drove the tremendous expansion of irrigated agriculture, and growing Bay Area cities started importing water from rivers that drained to the Bay. Urban landscapes, with their impermeable surfaces, further decreased the watershed’s ability to retain or slow runoff from periodic storms. Much larger inflow changes resulted from the construction and operation of the massive federal Central Valley Project (CVP) – including Shasta Dam on the Sacramento River, Friant Dam on the San Joaquin River, and the Tracy Pumping Plant in the Delta – in the 1940s and 1950s.
The final component in the radical alteration of the Bay’s hydrology came in the 1960s and 1970s when the State Water Project (SWP) began operating the Banks Pumping Plant in the Delta that exports water to cities in the southern Bay Area and Southern California and agriculture in the San Joaquin Valley. Together, the state and federal Delta pumping facilities are part of the world’s largest water storage and conveyance system; they have become the single largest extractor of the Bay watershed’s fresh water. Since 1985 the combined CVP/SWP exports from the Delta have averaged over 5 million acre-feet per year, and over 6 million acre-feet per year in the period from 2000 to 2007 (Figure 3).
Since the SWP began exporting water from the Delta, a variety of state, federal, and local water agencies have constructed many more large dams and canals throughout the Sierra Nevada and Central Valley to capture, store and transport watershed runoff. Thousands of dams, over 600 large reservoirs, and 1300
miles of aqueducts now store and re-distribute over 30 million acre-feet of water, roughly equivalent to the surface water runoff from the entire watershed in an average year5.
This massive transformation of the watershed has dramatical-ly altered every component of the natural Bay inflow pattern, including the magnitude and timing of flows, the frequency and duration of high flow events, and the variability between high and low flows. The magnitude of the reduction in freshwater flow inputs is revealed by comparing the amount of water that actually reaches the Bay to the amount that would have reached the Bay if there were no dams, diversions, or exports of water (“unimpaired flow” or “unimpaired runoff”). The percentage of annual unimpaired flow that actually reached the Bay prior to the completion of Shasta Dam (1945) was much greater than it has been since the SWP began withdrawing major amounts of flow from the Bay’s watershed, in 1968. Since 1975, total annual flow is on average less than 50% of what it would be without storage in dams, diversions, and direct exports from the Delta (Figure 3). In some years, it is less than 35% (Figure 5, left panel). Worse yet, even greater reductions in flow during the ecologically important winter and spring seasons occur frequently.
9

TAKING MORE FRESHWATER FROM THE BAY OVER TIME
0
10
20
30
40
50
60
70
80
90
1930 1940 1950 1960 1970 1980 1990 2000 2010
WA
TER
VOLU
ME
(MA
F)
WATER YEAR
TAKING MORE FRESHWATER FROM THE BAY OVER TIME
Bay InflowDelta ExportsUpstream Diversion
1968
1977 1995 2008
Exports and diverions are greater than outflow 55% of time since the first time it happened in 1972
1930-‐19491950-‐19741975-‐20141995-‐2014
77%
23%
1930-1949
66% 6%
29%
1950-1974
47%
18%
36%
1975-2014 Bay Inflow
81%
19%
1930-1949
Bay Inflow
Delta Exports
Upstream Withdrawls 68%6%
26%
1950-1974
Bay Inflow
Delta Exports
Upstream Withdrawls
46%
19%
35%
1975-1994
Bay Inflow
Delta Exports
Upstream Withdrawls 51%
18%
31%
1995-2014
Bay Inflow
Delta Exports
Upstream Withdrawls
Delta Exports
UpstreamDiversion
Exports and diverions are greater than outflow 55% of time since the first time it happened in 1972
1930-‐19491950-‐19741975-‐20141995-‐2014
77%
23%
1930-1949
66% 6%
29%
1950-1974
47%
18%
36%
1975-2014
Exports and diverions are greater than outflow 55% of time since the first time it happened in 1972
1930-‐19491950-‐19741975-‐20141995-‐2014
77%
23%
1930-1949
66% 6%
29%
1950-1974
47%
18%
36%
1975-2014 1930 - 1949 1950 - 1974 1975 - 2014

Figure 3: The amount of fresh water that would flow to San Francisco Bay from California’s Central Valley (bars, top panel) varies tremendously from one year to the next. By contrast, the amount of available Central Valley runoff that is diverted or stored upstream (aqua bars) or exported from the estuary (green bars) for agricultural, industrial and municipal uses has increased steadily over the last half century. As a result, the proportion of water diverted or exported from the estuary has also dramatically increased over the same time period (pie charts, bottom panel), leaving less water to flow into the Bay (grey). Recently, diversions and exports of water have averaged approximately half of the amount available – in dry years, much less than half the runoff reaches the Bay. Important years identified in the figure, include 1968, when the State Water Project began exporting water from the Delta; 1977, a record drought year; 1995, when water quality standards for the estuary were last updated; and 2008, when new federal protections for imperiled Delta smelt, Chinook salmon, steelhead, and green sturgeon were issued.
SAN FRANCISCO BAY’S DEVASTATING, PERMANENT
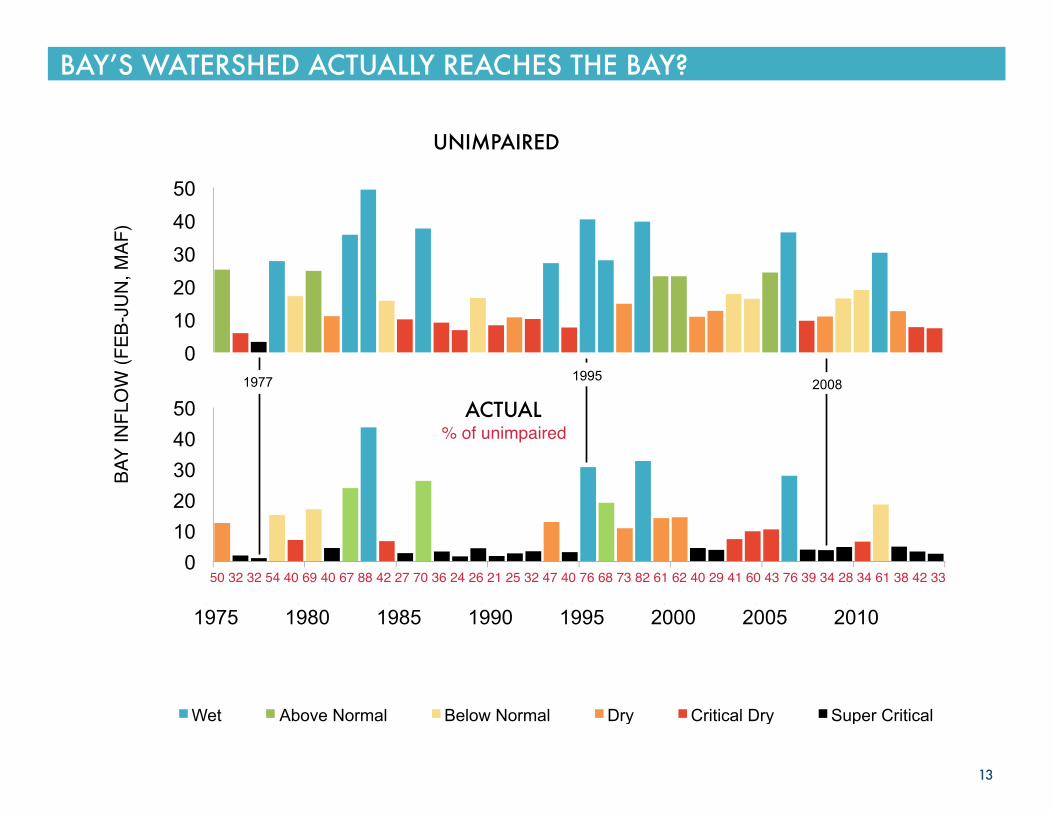
DROUGHTBecause Bay inflows have been drastically reduced and flow patterns radically altered, the estuary has experienced extreme drought conditions for much of the past four decades. The amount of runoff associated with the very driest years was once the exception. It is now the new normal. The overall change in Bay inflows from human water use has been so severe that the Bay ecosystem is experiencing a nearly permanent drought (Figure 4). The driest winter – spring period in the last 95 years occurred in 1977. But because so much runoff is now captured (especially during the winter and spring months), the estuary experienced 1977-like, “super-critically dry” conditions in 19 years, or almost half the years between 1975 and 2014. In contrast, wet year conditions (in which native species have the best chance to recover from persistently low Bay inflows) occurred in the Bay’s watershed in 25% of the past 40 years. But actual flows to the Bay resembled those of wet years in just four years during the 1975-2014 period. During six of the past 10 years less than 40% of the unimpaired runoff available in the winter and spring made it to the estuary.
11
About 80% of the water diverted from the Bay’s watershed is used for agricultural irrigation. Photo credit: Fernand Ivaldi, Getty Images

Figure 4: The Bay’s vast watershed receives massive volumes of snow and rain in some years and very little in other years. Most of this water becomes runoff during the winter and spring months and many native species have evolved to capitalize on this pulse of water. The percentage of available runoff that reaches the Bay decreases as the combined total of watershed diversions and Delta exports increase. By dividing winter-spring runoff conditions into categories, the bar charts to the right show when Wet (blue), Normal (green), Below Normal (yellow), Dry (orange), Critically Dry (red), and Super Critically Dry (black) years occurred in the Bay’s watershed (upper bar graph; “unimpaired”) and the corresponding conditions that actually occurred in the Bay (lower bar graph, “actual”). Each of these categories represent one-fifth of the years as measured by their unimpaired runoff, except for the Super Critically Dry category, which represents the driest single year (~2.5%) of the 40 years represented here.
The pie charts show the relative frequency of these different hydrological conditions as they occurred in the Bay’s watershed (upper pie chart, “unimpaired”) and what the Bay’s ecosystem actually experienced (lower pie chart, “actual”). As a result of intensive water diversion and exports, the estuary and its unique and valuable fish and wildlife species have experienced extremely dry conditions throughout most of the past four decades. For example, Super Critically Dry conditions, which occurred naturally only in 1977, are by far the most common conditions experienced in the estuary these days. Wet conditions occurred in the Bay less than half as frequently as they did in the watershed that feeds it. Years 1995 and 2008, marked on the bar graphs, correspond to state and federal actions that reserved relatively minor amounts of water for fish, and have failed to modify or mitigate the trend of intensive and growing diversion of Bay inflows.
Wet
Above Normal
Below Normal
Dry
Cri4cal
Super Cri4cal
Wet
Above Normal
Below Normal
Dry
Cri4cal
Super Cri4cal
Wet
Above Normal
Below Normal
Dry
Cri4cal
Super Cri4cal
Wet
Above Normal
Below Normal
Dry
Cri4cal
Super Cri4cal
UNIMPAIRED WINTER-SPRING RUNOFF CONDITIONS IN THE BAY’S
CENTRAL VALLEY WATERSHED 1975-2014
ACTUAL WINTER-SPRING INFLOW CONDITIONS
IN THE BAY 1975-2014
PERMANENT DROUGHT: HOW MUCH OF THE WATER IN THE
0 10 20 30 40 50
BAY
OU
TFLO
W
(FEB
-JUN
, MA
F)
UNIMPAIRED Wet Above Normal Below Normal Dry Critical Dry Super Critical
BAY
OU
TFLO
W
(FEB
-JUN
, MA
F)
0 10 20 30 40 50
1975 1980 1985 1990 1995 2000 2005 2010
ACTUAL
50 32 32 54 40 69 40 67 88 42 27 70 36 24 26 21 25 32 47 40 76 68 73 82 61 62 40 29 41 60 43 76 39 34 28 34 61 38 42 33
% of unimpaired
1995 2008 1977
BAY’S WATERSHED ACTUALLY REACHES THE BAY?
0 10 20 30 40 50
BAY
OU
TFLO
W
(FEB
-JUN
, MA
F)
UNIMPAIRED Wet Above Normal Below Normal Dry Critical Dry Super Critical
0 10 20 30 40 50
1975 1980 1985 1990 1995 2000 2005 2010
ACTUAL
50
32 32
54
40
69
40
67
88
42 27
70
36 24 26 21 25 32
47
76
40
68
73
82
61 62
40 29 41 60 43
76
39 34 28 34
61
38 42 33
% of unimpaired
1977 2008 1995
BAY
INFL
OW
(FEB
-JU
N, M
AF)
0 10 20 30 40 50
BAY
OU
TFLO
W
(FEB
-JUN
, MA
F)
UNIMPAIRED Wet Above Normal Below Normal Dry Critical Dry Super Critical
0 10 20 30 40 50
1975 1980 1985 1990 1995 2000 2005 2010
ACTUAL
50
32 32
54
40
69
40
67
88
42 27
70
36 24 26 21 25 32
47
76
40
68
73
82
61 62
40 29 41 60 43
76
39 34 28 34
61
38 42 33
% of unimpaired
1977 2008 1995
0 10 20 30 40 50
BAY
OU
TFLO
W
(FEB
-JUN
, MA
F)
UNIMPAIRED Wet Above Normal Below Normal Dry Critical Dry Super Critical
0 10 20 30 40 50
1975 1980 1985 1990 1995 2000 2005 2010
ACTUAL
50 32 32 54 40 69 40 67 88 42 27 70 36 24 26 21 25 32 47 40 76 68 73 82 61 62 40 29 41 60 43 76 39 34 28 34 61 38 42 33
% of unimpaired
1995 2008 1977
13
50 32 32 54 40 69 40 67 88 42 27 70 36 24 26 21 25 32 47 40 76 68 73 82 61 62 40 29 41 60 43 76 39 34 28 34 61 38 42 33
% of unimpaired

The change in total annual flow to the estuary is only one indicator of the massive changes in inflow to the Bay as a result of how California uses its limited water supply. The natural seasonal timing of flow has been modified as well (Figure 5, middle panel). For example, although over three quarters of the Bay’s unimpaired inflow arrives as winter storms and spring snowmelt, the percentage of available runoff that actually made it to the Bay between February and June reached as low of 28% in 2009. During the last decade, only an average of 35% of unimpaired runoff made it to the Bay during May, making this the most impaired month of the year. In contrast, state water quality regulators report that 75% of unimpaired Bay inflow during the winter-spring period is necessary to fully protect the estuary ecosystem6; and in fact, scientific studies from around the world indicate that ecosystem function is severely impaired if less than 80% of freshwater flows remain in rivers7. When instead just one-third or less of these ecologically vital flows are allowed to make it to the Bay, there is absolutely no reason to expect any other outcome except ecological collapse.
Even seasonal and monthly averages don’t reveal the full impact of the change to Bay inflows – short-dura-tion peak flows have been severely reduced, and nearly eliminated in many cases (Figure 5, right panel). In all but the wettest years, the brief pulses of flow that follow rainstorms and snowmelt events – and which are so important to migrating fish like salmon – have been virtually eliminated, as reservoirs, river diversions, and exports from the Delta capture these critical flow spikes. The biggest winter floods have been severely curtailed8. For example, in late November and December of 2013, 75-78% of the peak flows
were captured in reservoirs, diverted upstream, or exported directly from the Delta. The precious runoff that does still make it to the Bay—from below dams and the few remaining undammed watersheds—could be further curtailed if one or more new and expanded dam and diversion projects, most of which would be very expensive, produce low yields, and be partly subsidized by taxpayer funding, are built and operated.
DRYING UP ECOLOGICALLY CRITICAL PERIODS
Upstream dams and diversions capture the majority of runoff in the Bay’s watershed. Photo Credit: California Department of Water Resources

A BAY CHANGED: ALTERATIONS TO FRESHWATER FLOW
Figure 5: Water storage, diversion, and export changes the natural pattern of freshwater flow in multiple ways. The total amount of water diverted from the estuary and its watershed for human use increased steadily over time, resulting in less and less fresh water making it downstream annually (left panel). The timing of the freshwater flow that remains is also radically altered by human water management practices. For example, the seasonal timing of flow has been changed such that proportionately less water arrives during the ecologically critical spring months (center panel). Also, diversions have a disproportionate effect on short-term peak flows, which native species rely on to orient their migrations or to spawn (right panel).
Compared to the amount of runoff in the Bay’s Central Valley watershed each year, the amount of water that actually reaches the Bay has been declining steadily over time. A greater proportion of available runoff (the “percentage of unimpaired flow”) reaches the estuary in wetter years; during dry years the Bay receives proportionately less of the water available. This occurs because the total amount of water that humans divert and store in reservoirs does not vary much in response to annual hydrology.
The fraction of water that would arrive in the estuary during different seasons without storage and diversions (unimpaired conditions; left pie chart) and what actually arrives after the effect of human water management (right chart, numbers are volume in thousands of acre feet). Not only is the volume of freshwater flow reduced, but the distribution of this flow across seasons is altered as well. For example, under unimpaired conditions, 37% of the Central Valley’s runoff would flow to the estuary during the spring, but only 28% of the (much smaller) volume that actually makes it downstream arrives during the spring. This disproportionate reduction in fresh water flowing into the estuary during the spring occurs during the very season when native fish and wildlife population are most responsive to freshwater flow.
Estimated flow to San Francisco Bay during a year in the absence of storage or diversions (green line) compared with the estimated flow that actually reached the estuary (blue line). The difference between unimpaired and actual inflow on key dates shows that natural early season peaks in flow are largely eliminated by storage and diversion operations. Native species rely on pulses of water (which result from periodic rainfall and snowmelt events) to orient during migration and to cue important life cycle transitions. California’s water management practices eliminate this important natural signal. The loss of short duration peak flows puts native species at a disadvantage and facilitates invasion by non-native species.
ANNUAL SEASONAL PEAK FLOWS
0%
10%
20%
30%
40%
50%
60%
70%
80%
90%
100%
1930 1940 1950 1960 1970 1980 1990 2000 2010
BAY
INFL
OW
(A
S %
OF
UN
IMPA
IRED
INFL
OW
)
YEAR
Freshwater flows to San Francisco Bay have been reduced over timeto only 50% of the runoff in the watershed (Feb-Jun)
14%
42% 37%
6%
UNIMPAIRED 1995-2014
Fall Winter Spring Summer
15%
48%
28%
9%
ACTUAL 1995-2014
0
50,000
100,000
150,000
200,000
250,000
300,000
Oct Nov Dec Jan Feb Mar Apr May Jun Jul Aug Sep
FRES
HWAT
ER F
LOW
TO
SF
ESTU
ARY
(CFS
)
WY 2013 BAY INFLOW
Unimpaired Bay Inflow (est)
Actual Bay Inflow
75% of peak captured12/2/12
37% of peak captured 12/23/12
78% captured11/21/12
63% of peak captured 3/31/13
14%
42% 37%
6%
UNIMPAIRED 1995-2014
Fall Winter Spring Summer
15%
48%
28%
9%
ACTUAL 1995-2014
14%
42% 37%
6%
UNIMPAIRED 1995-2014
Fall Winter Spring Summer
15%
48%
28%
9%
ACTUAL 1995-2014
14%
42% 37%
6%
UNIMPAIRED 1995-2014
Fall Winter Spring Summer
15%
48%
28%
9%
ACTUAL 1995-2014
ANN
UAL
BAY
INFL
OW
(A
S %
OF
UN
IMPA
IRED
INFL
OW
)
Data source: CDEC and DWR Dayflow
CU
BIC
FEE
T PE
R SE
CO
ND
11,336
1,960 4,027
12,809
5,043
9,078
2,235
1,393 75% of peak captured 12/2/12
78% captured 11/21/12
15

STARVING THE BAYHOW FLOW REDUCTIONS DAMAGE KEY COMPONENTS OF THE BAY’S ECOSYSTEM
As rivers approach the sea, salty and fresh water mix to form an estuary. In addition to diluting what would otherwise be seawater, the freshwater flowing into an estuary creates unique and productive ecosystems. Estuaries contain special fresh water and brackish (low salinity) habitats that shift position dynamically in response to the tides and seasonal or annual
variations in fresh water flow. The balance between fresh and salt water determines the size and shape of these estuarine environments and their capacity to support the fish and wildlife species that have evolved to specialize in them.
How much freshwater flow makes it as far as the estuary, when it
American avocet Photo Credit: Judy Irving
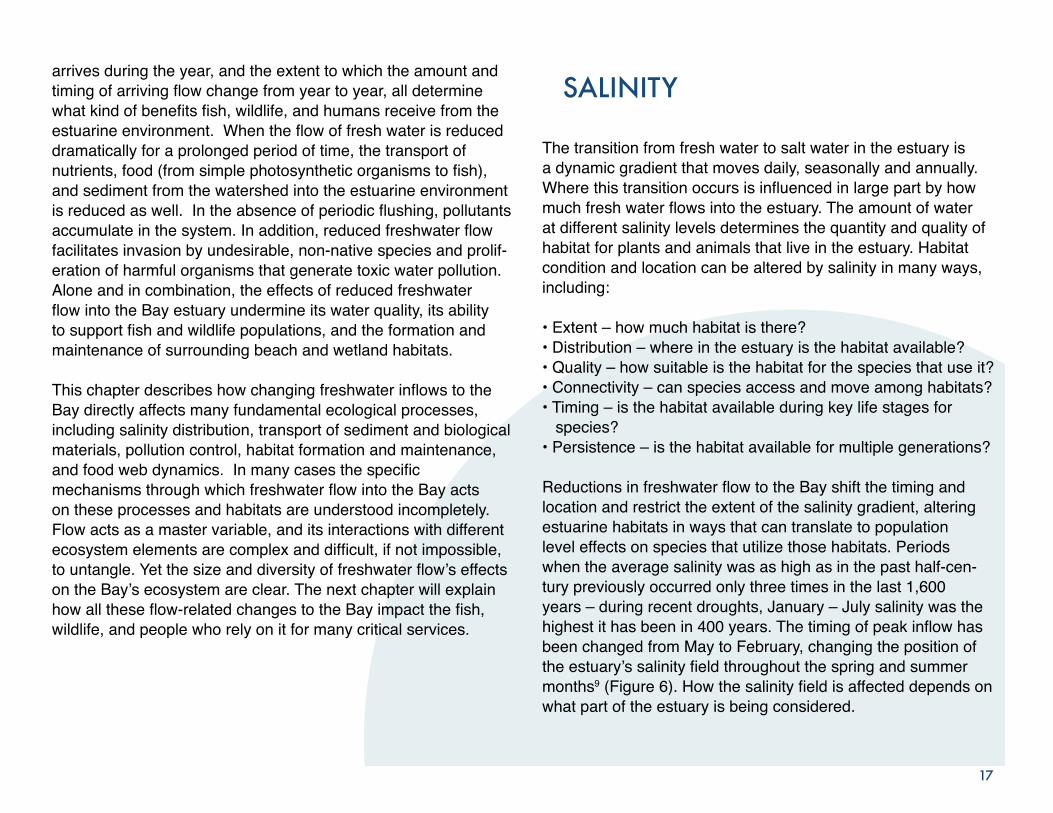
arrives during the year, and the extent to which the amount and timing of arriving flow change from year to year, all determine what kind of benefits fish, wildlife, and humans receive from the estuarine environment. When the flow of fresh water is reduced dramatically for a prolonged period of time, the transport of nutrients, food (from simple photosynthetic organisms to fish), and sediment from the watershed into the estuarine environment is reduced as well. In the absence of periodic flushing, pollutants accumulate in the system. In addition, reduced freshwater flow facilitates invasion by undesirable, non-native species and prolif-eration of harmful organisms that generate toxic water pollution. Alone and in combination, the effects of reduced freshwater flow into the Bay estuary undermine its water quality, its ability to support fish and wildlife populations, and the formation and maintenance of surrounding beach and wetland habitats.
This chapter describes how changing freshwater inflows to the Bay directly affects many fundamental ecological processes, including salinity distribution, transport of sediment and biological materials, pollution control, habitat formation and maintenance, and food web dynamics. In many cases the specific mechanisms through which freshwater flow into the Bay acts on these processes and habitats are understood incompletely. Flow acts as a master variable, and its interactions with different ecosystem elements are complex and difficult, if not impossible, to untangle. Yet the size and diversity of freshwater flow’s effects on the Bay’s ecosystem are clear. The next chapter will explain how all these flow-related changes to the Bay impact the fish, wildlife, and people who rely on it for many critical services.
The transition from fresh water to salt water in the estuary is a dynamic gradient that moves daily, seasonally and annually. Where this transition occurs is influenced in large part by how much fresh water flows into the estuary. The amount of water at different salinity levels determines the quantity and quality of habitat for plants and animals that live in the estuary. Habitat condition and location can be altered by salinity in many ways, including:
• Extent – how much habitat is there? • Distribution – where in the estuary is the habitat available?• Quality – how suitable is the habitat for the species that use it?• Connectivity – can species access and move among habitats?• Timing – is the habitat available during key life stages for species?• Persistence – is the habitat available for multiple generations?
Reductions in freshwater flow to the Bay shift the timing and location and restrict the extent of the salinity gradient, altering estuarine habitats in ways that can translate to population level effects on species that utilize those habitats. Periods when the average salinity was as high as in the past half-cen-tury previously occurred only three times in the last 1,600 years – during recent droughts, January – July salinity was the highest it has been in 400 years. The timing of peak inflow has been changed from May to February, changing the position of the estuary’s salinity field throughout the spring and summer months9 (Figure 6). How the salinity field is affected depends on what part of the estuary is being considered.
SALINITY
17

THE EFFECT OF WATER DIVERSION ON SALINITY IN THE BAY
2009 FEB - JUN ACTUAL SALINITY
28% OF UNIMPAIRED FLOW
In 2009, a Dry year in the Bay’s watershed, only 28% of available runoff from the Central Valley made it to the Bay; the rest was diverted, stored, or exported. Because there was so little fresh water, Central Bay, San Pablo Bay, and even parts of Suisun Bay became very salty.
Had no water been stored, diverted, or exported, the salinity distribution in 2009 would have looked more like this (the actual salinity distribution in 1980). Fish and wildlife that use freshwater and brackish habitats would have been able to use all of Suisun Bay and most of San Pablo Bay.
ESTIMATED FEB-JUN 2009 SALINITY AT 100%
UNIMPAIRED FLOW
Figure 6: Water diversions and exports affect the distribution of salinity throughout the Bay. Most aquatic organisms are sensitive to the salinity of their habitat; thus, changes in salinity distribution reflect changes in habitat availability for many of the Bay’s species. These maps show the actual distribution of salinity in one Dry year (2009; left panel) and what the salinity distribution would have looked like without diversion or export of fresh water (right panel).
Data sources: U.S. Environmental Protection Agency. Salinity Gradient - Coarse-grid version of UnTRIM San Francisco Bay-Delta Model, Delta Modeling Associates. Basemap - ESRI, DeLorme, BEBCO, NAANGDC, & other contributors
GROUND ZERO: THE SALINITY TRANSFORMATION OF NORTHERN SAN FRANCISCO BAY AND THE DELTA
Bay fish and their prey benefit from lower salinities at critical times: A unique and ecologically critical area known as the low salinity zone (LSZ) occurs in the upper, northern part of the estuary. This zone is especially important for juvenile fish and invertebrates10. Historically, as freshwater flows naturally increased in the winter and spring, the LSZ was located in the broad, shallow reaches of Suisun and San Pablo Bays, and shifted gradually upstream in the summer and fall. Numerous scientific studies over many decades have documented the powerful and persistent correlations between the abundance of many of the Bay’s fish populations, including longfin smelt, starry flounder, and striped bass, with the position of the LSZ in the ecologically sensitive winter and spring period11. That is, the number of fish of many estuarine populations increases as the LSZ moves downstream in response to increasing flows. How fish and invertebrate populations are distributed is also correlated with the location of the LSZ, with benefits decreasing as the zone shifts upstream with less inflow. For example, the position of the LSZ during the winter and spring affects the exposure of larval and juvenile fish to diversion into the large export pumps in the southern Delta12. The abundance and distri-bution of Delta smelt are also correlated with the location of the LSZ in the fall13.
Several types of zooplankton (small invertebrate animals) are also strongly affected by the position of the LSZ, including mysid shrimp, Bay shrimp, and seasonal populations of other small zooplankton14. These organisms are essential food for the Bay’s fish and wildlife populations. The historic zooplankton
community in the LSZ has been devastated over the past three decades by a combination of reduced freshwater inflows to the Bay, increased water exports from the Delta, and the introduction of non-native invasive species15. Allowing more of the Central Valley’s natural flow of fresh water to reach the estuary during the spring is one of the few tools available to improve the distri-bution and increase the abundance of important zooplankton species in the open waters of San Francisco Bay.
Exotic species invade when salinities are less variable: Reducing inflows not only constrains the downstream movement of the LSZ but also generally keeps the salinity field more uniform and less dynamic from season to season and year to year in the upper reaches of the estuary. This reduced salinity variation is a primary factor in the establishment and success of undesirable non-native plant and animal species. For example, establishment of nuisance species such as the overbite clam appears to have reduced phytoplankton abundance in the upper estuary16. There is evidence that exotic zooplankton invasions are facilitated by consistently low inflow to San Francisco Bay17. Some introduced species, like inland silverside – a voracious predator – increase in abundance during periods when flows are low18. Once established, these invaders contribute to deteriorat-ing habitat conditions for native species by competing for food, space and other important habitat needs.
19

Wetlands change as salinity changes: The freshwater and tidal marshes and riparian areas that occur on the margins of the upper estuary buffer the land from tides and storm surges and support over 500 fish and wildlife species, including a large number of rare species such as Suisun song sparrow, San Francisco common yellowthroat, California black rail, and giant garter snake19. Restoring wetland habitat is a high priority for current management efforts; currently, less than one tenth of historic wetland remains around the Bay and only 4% in the Delta20.
Ridgway’s Rail (formerly, Clapper Rail) is one of many species native to the San Francisco Bay area that are endangered. These secretive birds, which rarely fly, forage in tidal mudflats and make their homes in the upper vegetated zone of the marshes that once dominated the Bay’s margin. Photo Credit: David Sanger
Pollen records indicate that extended periods with higher than average salinity have previously occurred only three times in the last 1,600 years21. Since 1950, primarily as a result of flow reductions and flow pattern alterations throughout the Bay’s watershed, we are now experiencing the fourth such period22. Tidal marshes with higher salinity have lower numbers of plant species and are less productive23. Even short-term changes in freshwater inflows can convert freshwater marsh to brackish marsh, and brackish marsh to salt marsh; as temperatures, atmospheric CO2, and salinities all rise, the longer-term impact of wetland conversion could have large consequences on ecosystem function24.

Small shifts in salinities can affect how seeds germinate, grow, and are distributed; which species occur; and how much food the marsh provides for fish and wildlife25. For instance, during the short but severe 1976-77 drought, a marsh at the east end of the Carquinez Strait became much more saline and plant composition shifted, with bulrush decreasing and salt-toler-ant pickleweed invading. These changes can be long lasting; according to one study, when salts accumulate in tidal marsh soils, “larger pulses of fresh water of greater duration will be required to reduce soil salinities in the marsh and promote germination and recruitment”26.
Marsh formation is critical as a tool for adapting to climate change. Salinity plays a key role in the rate at which marshes can rise in response to changing sea levels. Organic matter accumulates faster in freshwater marshes, and the rate of soil formation decreases with increasing salinity27. Absent sufficient freshwater inflow, sea level rise will push the salinity field further inland, reducing the area available for brackish and freshwater habitats in the upper reaches of the estuary. The resulting conversion of brackish and freshwater wetlands to salt marsh will reduce the amount of marsh area that can buffer the impact of rising seas. As marshes erode, so too do the benefits of flood regulation and water quality control that they provide to communities along the estuary’s shores. Also, reductions in the area of less saline marsh habitat will affect species like black rails that depend on vegetation not found in salt marshes.
Farther downstream, the saltier Central and South Bays also experience major salinity changes when freshwater runoff into
LOOKING DOWNSTREAM: SALINITY CHANGES IN CENTRAL AND SOUTH SAN FRANCISCO BAY ARE ALSO A PROBLEM
the Bay is high. In the winter and spring— the time of year when human activity alters flows the most – reducing Bay inflow can change salinity distribution in the Central and South Bay even more than in the upper estuary28. During the 1987-1992 drought, for example, when inland water diversions and exports reached (then) record high levels, the winter – spring salinity at Fort Point, under the Golden Gate Bridge, was the highest experienced in 400 years29.
Species in Central Bay shift in response to flow-related salinity changes: What kinds of species are present in the Bay near San Francisco, and how they interact, are influenced by freshwater inflow and the salinity field. For instance, rates of growth, repro-duction and migration for invertebrates in the Bay like oysters, barnacles, and sea squirts (sessile marine invertebrates) are highly affected by freshwater inflows. When winter inflows are reduced, large non-native sea squirt species dominate the inver-tebrate community, competing for space and limiting populations of other species, such as oysters. Although prolonged exposure to fresh water during very high flood flows may kill oysters, new oyster populations readily establish at lower salinities, probably in response to the limiting effects of higher flows on their invasive competitors30.
Seasonal salinity stratification dominates the South Bay: During the summer and fall, the lagoon-like South Bay is about as salty as the ocean, with circulation driven by the tides and winds. But, in winter, high freshwater inflow from the upper estuary can cause strong density-driven currents to form, with fresher water on top and saltier water on the bottom—a phenomenon known as stratification. As Bay inflow diminishes through the spring, and as more saline water outside the Golden Gate is drawn into the Bay by tides, the Central Bay becomes saltier and a density-driv-en current of more saline water flows into the South Bay along the bottom. The South Bay is usually stratified in the spring, and unstratified in summer and fall. This seasonal pattern causes a
21

spring peak in phytoplankton productivity31, and many fish species respond positively to the changes in South Bay salinity associated with the variation in Bay inflow32.
Salinity changes in the saltiest part of the estuary – the Gulf of the Farallones, just west of the Golden Gate – are also most influenced by the seasonality and magnitude of freshwater flows. During winter and spring, outflows from the Bay create a plume of brackish water (as low as 20 parts per thousand [ppt] salinity and up to 5 meters deep), stimulating phytoplankton growth and contributing to overall foodweb productivity in the Gulf of the Farallones, a protected marine sanctuary33. At times, this plume briefly extends as far offshore as the Farallon Islands and Cordell Bank. The plume tends to turn to the north in winter, extending as far as Ft. Bragg, CA. During the summer when flows are lower, the plume is smaller but still extends outside the Golden Gate, turning to the south34.
Plankton and larger organisms such as salmon, sharks, and marine mammals all converge at the plume front. Birds that nest on the Farallon Islands also feed at the plume front. But this highly productive, flow-driven habitat is being diminished. Bay inflow accounts for 86% of the variability in salinity at the Golden Gate35. Salinity at the ocean boundary has increased by 12 parts per million per year since 192036, showing that the brackish water plume has become substantially reduced over time37.
BEYOND THE BAY: FLOW EFFECTS ARE FELT IN THE GULF OF THE FARALLONES
The Bay – ocean connection is a two way street: Increased inflow to the Bay and subsequent outflow to the ocean during the spring increases the exchange of water, nutrients, and organisms in both directions. Wind-driven coastal upwelling brings denser, cooler, nutrient-rich, saltwater closer to the ocean surface. As this marine water flows into the Bay, it benefits bottom-feeding organisms38. When spring inflows to and outflows from the Bay are reduced, not only are the ecological benefits of the brackish water plume at the surface affected, but the importation of saltier water along the bottom is also cut back, reducing nutrient inputs to the Bay’s benthic habitats39.
Sevengill shark Credit: Aquarium of the Bay
These two phenomena – upwelling of nutrient-rich water and the brackish plume – interact to form the rich marine ecosystem of the Gulf of the Farallones. Reducing inflows to the Bay not only limits the benefits the Bay receives from both of these ecologi-cally important processes, but may also affect the productivity of coastal environments. Indeed, the state of our scientific under-standing indicates that freshwater flows into the estuary have multiple effects that reach far downstream into marine environ-ments. According to a recent study:
“The effects of [freshwater flow from the watershed] propagated further down the estuary salinity gradient than [effects from the Pacific Ocean] that propagated up the estuary salinity gradient, exemplifying the role of variable freshwater outflow as an important driver of biotic communities in river-dominated estuaries.”40
In plain English, freshwater flow impacts downstream areas more than the more saline habitats downstream impact the fresher upstream areas. As the effects of climate change become more acute, the benefits of freshwater flow for coastal waters will become even more critical. Warming ocean conditions, weaker upwelling, and shifts in the Pacific Decadal and North Pacific Gyre Oscillation are reducing marine produc-tivity along the California coast with cascading effects on the food web41. As productivity declines, birds, fish and marine mammals are more likely to starve and less likely to reproduce successfully. For these creatures, improving freshwater flows would help grow the food items, such as juvenile salmon, that are an important part of the offshore food web, and would also restore seasonal brackish surface water habitats in the Gulf of the Farallones, supplying fuel for the marine ecosystem outside the Golden Gate and potentially helping to offset oceanic climate change effects.
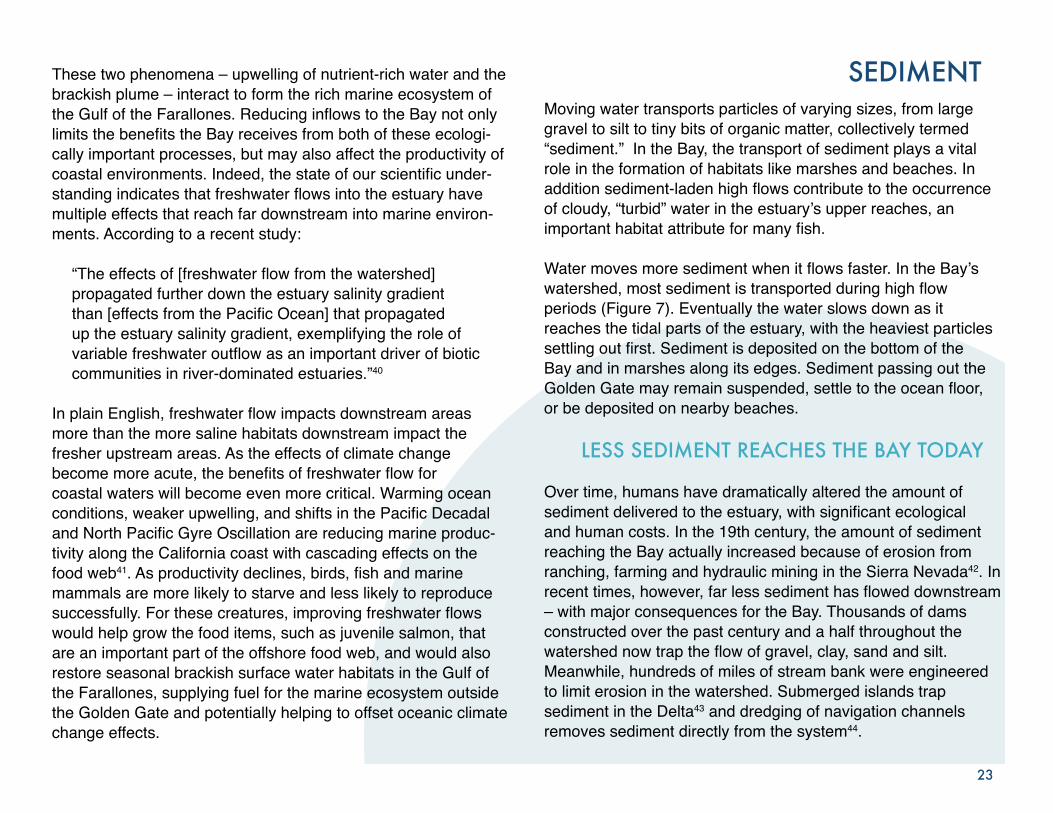
Moving water transports particles of varying sizes, from large gravel to silt to tiny bits of organic matter, collectively termed “sediment.” In the Bay, the transport of sediment plays a vital role in the formation of habitats like marshes and beaches. In addition sediment-laden high flows contribute to the occurrence of cloudy, “turbid” water in the estuary’s upper reaches, an important habitat attribute for many fish.
Water moves more sediment when it flows faster. In the Bay’s watershed, most sediment is transported during high flow periods (Figure 7). Eventually the water slows down as it reaches the tidal parts of the estuary, with the heaviest particles settling out first. Sediment is deposited on the bottom of the Bay and in marshes along its edges. Sediment passing out the Golden Gate may remain suspended, settle to the ocean floor, or be deposited on nearby beaches.
LESS SEDIMENT REACHES THE BAY TODAY
Over time, humans have dramatically altered the amount of sediment delivered to the estuary, with significant ecological and human costs. In the 19th century, the amount of sediment reaching the Bay actually increased because of erosion from ranching, farming and hydraulic mining in the Sierra Nevada42. In recent times, however, far less sediment has flowed downstream – with major consequences for the Bay. Thousands of dams constructed over the past century and a half throughout the watershed now trap the flow of gravel, clay, sand and silt. Meanwhile, hundreds of miles of stream bank were engineered to limit erosion in the watershed. Submerged islands trap sediment in the Delta43 and dredging of navigation channels removes sediment directly from the system44.
SEDIMENT
23

0
10000
20000
30000
40000
50000
60000
70000
1-‐Dec 6-‐Dec 11-‐Dec 16-‐Dec 21-‐Dec 26-‐Dec 31-‐Dec 5-‐Jan 10-‐Jan 15-‐Jan 20-‐Jan 25-‐Jan 30-‐Jan
BAY
INFL
OW
Freshwater Flow
Freshwater Flow
DEC 23 DEC 25 DEC 30 JAN 3
Images from NASA
FRESHWATER FLOW MOVES SEDIMENT INTO AND THROUGH THE BAY
BA
Y I
NF
LO
W (
CF
S)

Figure 7: Peak flows of fresh water into the estuary carry sediment through San Francisco Bay and beyond. The graph above shows flow during a brief pulse of freshwater flow in the days following a December 2014 storm. When Bay inflows increase, a plume of suspended sediment is transported downstream, as seen in the satellite photos of San Francisco Bay from December 23, 2014 to January 3, 2015. Sediment suspended in the Bay’s waters from these infrequent, but critically important, peak flow events is important for restoring tidal marshes and maintaining habitat for native fishes. Sediment supplies to the Bay and nearshore ocean have been limited by physical changes to the landscape (e.g., they are trapped behind dams and removed by dredging) and by elimination of the higher peak flows that could mobilize the sediments that remain. New projects to store or divert large amounts of water upstream of the Bay could siphon off more of the declining suspended sediment supply and further truncate the peak flows that carry that sediment downstream.
Capturing more water upstream and regulating downstream releases traps large volumes of sediment in reservoirs, limits erosion and overbank flooding along Central Valley rivers and tributaries, and reduces the frequency of flood events that would otherwise allow more sediment to reach the Bay45. Peak flows that can mobilize significant amounts of sediment occur much less often, and when they do, they carry much less sediment than previously46. Sediment input from the largest source in the Bay’s watershed, the Sacramento River, declined by half between 1957 and 200147.
Many estuarine fish species respond to water turbidity – reduced visibility due to suspended sediments – in order to evade predators, find food, and move between habitat areas. Because the amount of sediments available for resuspension in the
Bay has declined, turbidity has been dramatically decreased – by 36% in 199948 and by as much as 40% in the Delta49. The occurrence of clearer water is believed to expose highly endangered fish species like salmon and Delta smelt, and other organisms to increased risk from predators50 and lost feeding opportunities51.
A healthy sediment supply is crucial to the persistence of marsh and beach habitats throughout the estuary. As they become saltier due to reduced inflows, the brackish and freshwater marshes of the upper estuary require even larger amounts of sediment to maintain their physical form and elevation52. The problem is magnified by accelerating sea level rise, which will drown the Bay’s existing wetlands unless they gain elevation. Maintaining low Bay inflows – or further reducing them – at the same time that sea levels rise, will ensure continued loss of this unique estuarine habitat. Reducing sediment inputs to wetlands undermines California’s large-scale investment of time, money and energy to restore them.53. These and all types of wetlands are not just habitats for fish and wildlife; they also function as barriers against the effects of sea level rise on at-risk human communities and valuable infrastructure around the Bay; insuf-ficient sediment inputs will make it more difficult to provide and maintain these barriers54.
Bay inflows also transport sediments that feed and maintain local beaches, and these areas shrink or are lost as sediment inputs decrease. Twenty-three miles of sandy beaches in the Bay have been reduced to 7 miles, and most of the remaining beaches are in different locations than historical beaches55. Outside the Golden Gate, the coastline is the most rapidly eroding section in the state, with erosion accelerating 50% since the 1980s56.
IT’S CLEAR – AND THAT’S THE PROBLEM
FEEDING HUNGRY MARSHES AND BEACHES
25
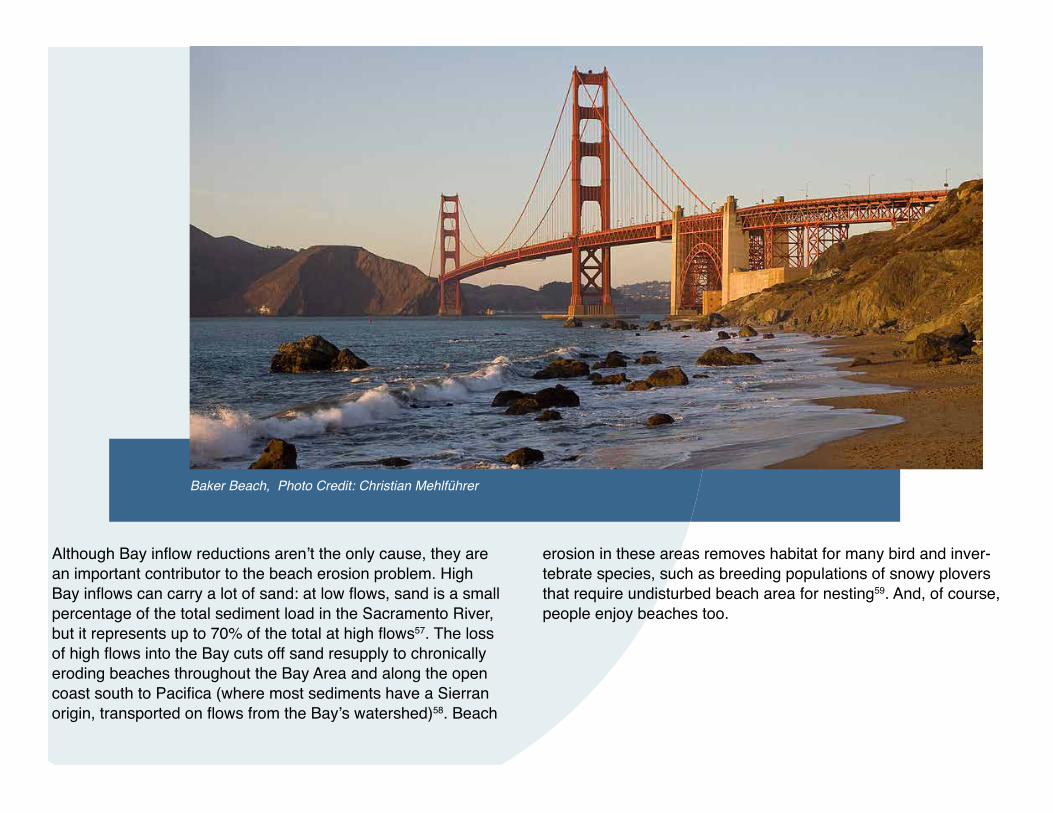
Although Bay inflow reductions aren’t the only cause, they are an important contributor to the beach erosion problem. High Bay inflows can carry a lot of sand: at low flows, sand is a small percentage of the total sediment load in the Sacramento River, but it represents up to 70% of the total at high flows57. The loss of high flows into the Bay cuts off sand resupply to chronically eroding beaches throughout the Bay Area and along the open coast south to Pacifica (where most sediments have a Sierran origin, transported on flows from the Bay’s watershed)58. Beach
erosion in these areas removes habitat for many bird and inver-tebrate species, such as breeding populations of snowy plovers that require undisturbed beach area for nesting59. And, of course, people enjoy beaches too.
Baker Beach, Photo Credit: Christian Mehlführer

POLLUTIONPreventing pollution before it happens by eliminating or reducing toxic inputs to air, land, and water is always the best policy. In conjunction with that approach, maintaining adequate freshwater flow into the Bay helps to dilute the concentration of chemical and biological contaminants before they reach levels that are toxic and decreases the amount of time these substances spend in the Bay where the dilution factor is much lower than in ocean waters. Conversely, when freshwater flows are reduced for long periods, both naturally occurring and synthetic contaminants can increase to toxic levels.
TOXIC POLLUTANTS DO MORE HARM WHEN FLOWS ARE LOW
The amount of Bay inflow is known to significantly affect how readily available some heavy metals are to aquatic organisms like shellfish60. Silver and copper concentrations in benthic organisms in the South Bay typically decrease after winter inflows lower salinities, especially in years with higher flows. Reducing Bay inflows from the Central Valley could also reduce the effectiveness of processes that assimilate and neutralize waste in the South Bay61.
Significant amounts of “legacy” contaminants from past mining and industrial practices are embedded in the Bay’s sediments, where they can be taken up by benthic organisms and then bioaccumulate in the foodweb. Over the past 20 years, for instance, mercury and PCB (Polychlorinated Biphenyl) concen-trations in fish have persisted at high levels, limiting consumption of popular fish species62, even long after being phased out from human use. Low flows can exacerbate the transfer of contam-
inants from the sediment to the food web; in Suisun Bay, for instance, the concentration of mercury in suspended sediment is higher at low Bay inflows (because waves resuspend bottom sediment) and lower at higher inflows63.
Selenium is a naturally occurring element, essential, in trace amounts, for animal cell function. But it is highly toxic at even slightly higher doses, causing birth defects, reproductive failure, or death. The primary sources of selenium in the Bay’s watershed include discharges into the Bay from oil refineries and irrigation runoff from selenium-laden soils on the west side of the San Joaquin Valley.
Low flows promote uptake and integration of selenium into the food web64. Low flows are specifically correlated with higher selenium concentrations in clams65. As a result, diving ducks, sturgeon, and Sacramento splittail, which eat clams, can develop deformities and reproductive problems because of the elevated selenium levels associated with low flows66. Selenium concentrations in clams rise to a level of concern when Bay inflows are less than 7,000 cfs67; these extremely low Bay inflow levels occurred in 2014 and 2015 when the State of California relaxed minimum water quality and flow requirements in order to increase deliveries for agricultural irrigation in the Central Valley.
27

TOXIC ALGAL BLOOMS – CAN REDUCING FLOWS GENERATE NEUROTOXINS?
When freshwater flows are reduced to low levels, the estuary can become a good environment for harmful organisms that generate dangerous toxins.
Cyanobacteria (also known as “blue green algae”) are ancient photosynthetic ancestors of modern plants and algae. Some of the chemicals produced by cyanobacteria are extremely toxic to humans and wildlife. Periodic proliferation of certain cyanobac-teria (such as Microcystis aeruginosa) are called “harmful algal blooms” or HABs. These blooms produce neurotoxins that can kill fish, aquatic mammals, waterfowl, and even dogs68. When these toxins get into drinking water supplies they are a real risk to human health.
Blooms of toxic cyanobacteria are occurring with increasing frequency in the upper estuary69. Toxins produced by HABs have been detected in invertebrates and fish throughout the entire estuary70. Organisms that are not killed outright by these toxins can transfer the poisons to their predators; the toxins become more concentrated as they move up the food chain (in a process known as “biomagnification”).
A recent review prepared for the California Environmental Protection Agency concluded that HABs in the Bay estuary are more frequent when water moves more slowly (increased residence time) and water clarity is high71; both of these conditions occur when inflows are low. The fact is that low flows not only fail to dilute or flush pollutants but also actually provide the very conditions that support the growth of organisms that generate powerful toxins. In this case, maintaining adequate
inflows is a crucial element in preventing the creation of powerful toxins that threaten people and the environment.
Estuaries are highly productive nursery habitats for fish, birds, mammals, and invertebrates like crabs and shrimp. The San Francisco Bay estuary is no exception. Beginning in the 19th century, San Francisco was the center of major commercial and recreational fisheries for salmon, sturgeon, herring, smelt, rockfish, halibut, flounder, and crab. The Bay’s bounty played a large role in feeding the growing population of central and northern California and even Oregon.
FOOD WEB PRODUCTIVITY
Cyanobacteria bloom, Photo Credit: US Geological Survey

Not surprisingly, this natural productivity depends on the many environmental processes that are driven or influenced by how much fresh water makes it to the estuary. As river flows reach the upper estuary, they slow down and spread out into a mosaic of shallow waters, mudflats and brackish and freshwater marshes; all of the critical inputs of nutrients, sediments and food the flow brings supports the growth of phytoplankton (tiny aquatic plants) and zooplankton (very small invertebrate animals), and a host of larger creatures that feed on them, in the water column and along the wetland margins. These freshwater and brackish habitats are more productive than the saltier ones downstream72 and a large number of rare species are only found there73. Even though there are many factors that affect productivity, the science is clear that productivity of the food web in estuaries is closely tied to freshwater inflow74, and that flow’s stimulation of the food web has an important impact on survival and growth rates of many species75.
One way to focus on how the estuary’s food web works is to take a closer look at the production of juvenile Chinook salmon from the Bay’s Central Valley watershed. Production of juvenile salmon emigrating from the Central Valley’s rivers is strongly correlated with the amount and timing of freshwater flow76. River flows carry these young fish downstream to the estuary, along with the nutrients, sediments, and food that stimulate productivity. The estuary’s muddy waters and wetlands (a result of sediments transported from upstream) provide cover and abundant food that allow the young salmon to survive and grow, along with other small fish and invertebrates. Some of the young salmon become prey for larger species,
including birds and mammals. The survivors migrate on currents driven by inflows and the tides, and some become food in distant parts of the estuary, even outside the Golden Gate. The juvenile Chinook salmon produced in the Bay’s watershed eventually become one of the primary food items in the diet of the Orca whales that reside in the Gulf of the Farallones77. This means that even creatures that rarely enter the Bay rely on the produc-tivity of the food web driven by the amount and seasonal timing of Bay inflow (Figure 8).
29

FRESHWATER FLOWS AFFECT FOOD WEBS IN THE BAY AND BEYOND
PREDATORSSome predatory species like starry flounder respond directly to annual changes in Bay inflow rates, declining as inflows decrease. Many other species, including seals, otters, osprey, pelicans, halibut, and sharks, are affected indirectly when populations of “forage fish” prey species decline in response to flow reductions. For example, Orca whales outside the Golden Gate are impacted when the numbers of their preferred prey, Chinook salmon, shrink in response to reduced freshwater flows throughout the Bay’s watershed.
SECONDARY CONSUMERSMost of San Francisco Bay’s fish are secondary consumers that feed on invertebrates. Many respond directly to changes in the timing and volume of water flowing from rivers into the Bay, including sturgeon, juvenile salmon, longfin smelt, Delta smelt, and juvenile striped bass. Although many mechanisms contribute to the positive response of different fish species, all these species are likely impacted by how changing freshwater flows affect production and distribution of their invertebrate prey (the primary consumers).
PRIMARY CONSUMERSThe Bay’s primary consumers (shrimp, copepods, shellfish, and other very small species which eat primary producers, like algae and plants) are essential for transferring energy and nutrients in the Bay’s waters to the fish and wildlife species we all enjoy. Many fish and bird species would starve without them. Flow rates also influence how and when these prey species occur and which animals get to eat them.
PRIMARY PRODUCERSThe food web is founded on small organisms that convert sunlight and nutrients into biological material. Bay inflows affect factors like spatial distribution ofprimary producers (or phytoplankton).
species decline in response to flow reductions. For example, Orca whales outside the Golden

Figure 8: San Francisco Bay and the nearshore ocean support an incredible array of fish, bird, mammal, and invertebrate species that are linked together in a complex food web. Freshwater flows into the estuary have direct effects on the productivity of this food web – major decreases in fresh water flows and/or changes in the timing of that flow lead to smaller populations of many key organisms. The creatures that feed on these “flow-dependent” species, including birds and mammals that live in the nearshore ocean, are indirectly impacted by declines in their food supply. Human water diversions in the Bay’s watershed have had measurable (and often dramatic) negative effects on the food web of San Francisco Bay and the nearshore ocean.
HARD TIMES FOR THE UPPER ESTUARY FOOD WEB
Freshwater flows into the estuary are an extremely powerful driver of productivity in northern San Francisco Bay and the Delta. Over many decades, scientists have documented strong and persistent statistical relationships between winter – spring inflows and the abundance of major invertebrate prey populations like Bay shrimp78. In years with low inflows, Bay shrimp biomass correspondingly declines79. Under natural runoff patterns, inflows are high enough in most years to support a productive ecosystem. The human-made “permanent drought” experienced in the Bay, however, in combination with other factors, has had catastrophic effects on the food web. Primary production in the Delta declined 43% between 1975 and 199580. One flow-related factor is the long-term decline in suspended solids entering the estuary on peak inflows, and the resulting increase in water clarity, which increases predation risk for many species. Another factor driving the decline in food web productiv-ity is the almost complete loss of fresh water inflow from the San Joaquin River basin portion of the Bay’s watershed81 (most of which is either diverted upstream or exported by the giant Delta pumps).
An additional alteration to the Bay’s food web is invasion by exotic (non-native) species, which can displace native fish and wildlife populations82. Reduced inflows favor the spread of invasive species83, probably because flow reductions undermine the ability of native species to dominate their historical habitats. The extent of change varies by location, with the biggest changes in the historically fresh and brackish portions of the upper estuary, which are increasingly dominated by invasive species over time84. The most dramatic example of food web alteration by an exotic species is the colonization of this region in the 1980s by the overbite clam; this one species filters large amounts of phytoplankton from the water column, leaving less energy available for all the other species that feed on plankton or its consumers. The overbite clam invasion coincided with a dry period when reservoir operations and water diversions prevented more than three-quarters of the Central Valley’s winter-spring unimpaired runoff from reaching the Bay85. The conjunction of these stressors has been implicated in multiple changes in the structure and functions of the upper estuary’s low salinity zone86.
Overbite clam
Photo Credit: Luis A. Solórzano
31

Despite these major changes, many fish and zooplankton of the upper estuary continue to respond positively when estuary inflows increase because the flow-related mechanisms that drive their productivity have not changed87. In addition, the effect of the overbite clam may be ameliorated at higher flow levels as their abundance fluctuates in response to salinity changes88, with the population responding to shifts in the extent and location of the low salinity zone89. Indeed, increases in freshwater flow may help control a wide range of nuisance species in the estuary, such as Brazilian waterweed (Egeria densa), toxic algae, jellyfish, clams, and inland silverside90.
To make matters even worse in the post-invasion world, declining inflows in recent years have facilitated the occurrence of harmful algal blooms of cyanobacteria in the Delta and upper estuary. When such blooms occur, they can change phyto-plankton community composition and toxin levels91. The new fact on the ground is that the loss of inflows has not only been undermining the ability of the food web to support native species in the upper estuary, but now it is actually helping create a new food web that is toxic to fish, wildlife and humans.
Because fresh water is less dense than saltier water, freshwater inflow from the upper estuary rides on the surface of the water column as it enters the South Bay in the spring. This sets up strong density-driven currents in the South Bay92, which in turn provide the right conditions for a spring plankton bloom93. When South Bay waters become stratified during and after these spring inflows, sun penetrates the fresher surface waters allowing algal cells to grow94, unchecked by the large population of grazing organisms that live on the bottom of the Bay95. How large these
THE FAR SIDE: PLANKTON IN THE SOUTH BAY AND OUTSIDE THE GOLDEN GATE
plankton blooms are “is directly related to the intensity and duration of river-driven density stratification”96, and when Bay inflows are very high exceptionally large blooms occur as a result97.
As mentioned earlier, the surface plume of brackish water that flows out the Golden Gate in winter and spring creates a highly productive environment that makes an important contri-bution to the richness of the marine ecosystem in the Gulf of the Farallones National Marine Sanctuary98. The plume front creates a food-rich habitat where invertebrates, fish, birds, and marine mammals all converge to eat and be eaten. Flows into the Bay and then onward to coastal waters also directly facilitate the transport of nutrients and organisms and cue stages in the outmigration of juvenile Chinook salmon and other fish which are important food sources for marine mammals like Orca whales.
Orcas near Golden Gate Bridge Photo Credit: Jennifer Hagerty


HOW FISH, WILDLIFE, AND PEOPLE ARE HARMED BY A FRESHWATER-STARVED BAY
Photo Credit: Judy Irving
WHO SUFFERS FROM THE BAY’S STARVATION DIET?
Every day, the seven million of us who live in the Bay Area can enjoy San Francisco Bay by walking along its shores, gazing at it from our cars, homes, or offices, or by swimming in or boating on its waters. Each year, more than twice that many people visit the region to enjoy this spectacular estuary, its
waters, and its natural bounty. The benefits that people derive from vibrant fish and wildlife populations, good water quality, and diverse natural settings are all tied to making sure enough fresh water makes it into the Bay. In other words, Bay inflow isn’t just good for the Bay ecosystem but is one of the foundations for the
Chinook salmon Photo Credit: Bay.org

quality of life and the strength of the economy in the Bay Area.
The San Francisco Bay estuary supports some 750 species of plants and animals, and many more are found throughout its vast watershed. Nowhere else on Earth do so many distinct types of Chinook salmon use one place as a migratory corridor and juvenile rearing area. The Bay’s wetlands are home to over a million waterbirds, including many unique native species, and an important food source and resting place for millions of migrating birds. These species all evolved in response to predictable natural patterns of inflow to the Bay.
Cold freshwater flows in rivers throughout the Bay’s watershed provide excellent conditions for spawning of a wide range of fish species, like Chinook salmon, Sacramento splittail, green and white sturgeon, and steelhead. The emerging year-class of juvenile fish then migrate into the Bay where they join a complex food web of resident and migratory species living in the open waters, wetlands, and nearby terrestrial habitats. Most species in the Bay are affected in some way by the freshwater pulses that flow through it and mix with its more saline marine waters (Figure 9). As explained in the previous chapter, all the critical processes that make the Bay estuary a productive place for
fish and wildlife – from the transport of fish, food, nutrients and sediments in Bay inflow to the formation of low salinity zones, wetlands and beaches – are shaped by how much freshwater flow arrives, when it arrives, how frequently it occurs, and how long it lasts. There are many examples, unfortunately, of what happens when the flow is no longer big enough, doesn’t last long enough, isn’t frequent enough, or doesn’t occur at the right time.
35
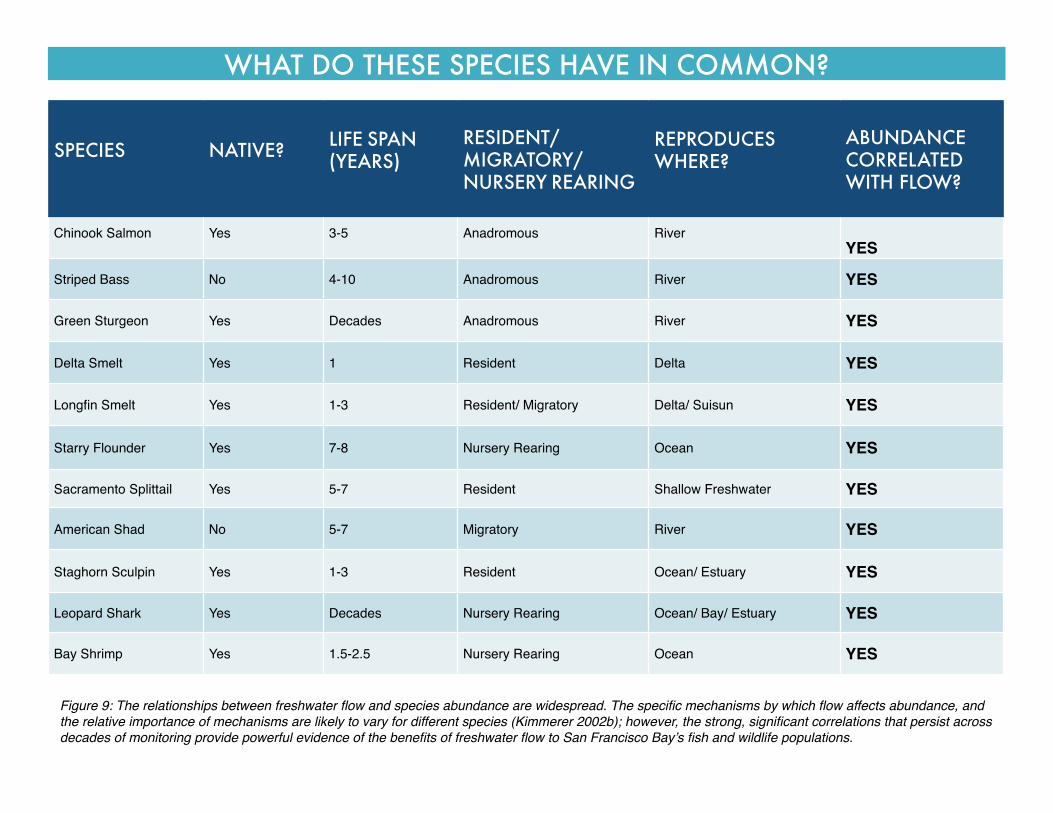
WHAT DO THESE SPECIES HAVE IN COMMON?
SPECIES NATIVE? LIFE SPAN(YEARS)
RESIDENT/MIGRATORY/NURSERY REARING
REPRODUCES WHERE?
ABUNDANCE CORRELATED WITH FLOW?
Chinook Salmon Yes 3-5 Anadromous RiverYES
Striped Bass No 4-10 Anadromous River YES
Green Sturgeon Yes Decades Anadromous River YES
Delta Smelt Yes 1 Resident Delta YES
Longfin Smelt Yes 1-3 Resident/ Migratory Delta/ Suisun YES
Starry Flounder Yes 7-8 Nursery Rearing Ocean YES
Sacramento Splittail Yes 5-7 Resident Shallow Freshwater YES
American Shad No 5-7 Migratory River YES
Staghorn Sculpin Yes 1-3 Resident Ocean/ Estuary YES
Leopard Shark Yes Decades Nursery Rearing Ocean/ Bay/ Estuary YES
Bay Shrimp Yes 1.5-2.5 Nursery Rearing Ocean YES
Figure 9: The relationships between freshwater flow and species abundance are widespread. The specific mechanisms by which flow affects abundance, and the relative importance of mechanisms are likely to vary for different species (Kimmerer 2002b); however, the strong, significant correlations that persist across decades of monitoring provide powerful evidence of the benefits of freshwater flow to San Francisco Bay’s fish and wildlife populations.

VIABLE POPULATIONS OF FISH AND WILDLIFE NEED FRESH WATER
The massive transformation of the Bay’s watershed by tens of thousands of dams, canals, pumps, and wells has changed the patterns of flow to the Bay so much that the current conditions bear little resemblance to those in which the Bay’s native fish and wildlife evolved. The result is a system where native species are in decline – some very close to extinction – while nuisance non-native species increasingly take advantage of the altered ecosystem.
Populations of many aquatic organisms at different levels of the food web have sharply declined, and six native fish species - Delta smelt, longfin smelt, steelhead, green sturgeon, and the winter and spring runs of Chinook salmon – that used to be among the most common in the estuary are now listed as in danger of extinction by the federal government and/or the State of California (Figure 10). To have viable populations, these species need to be:
• abundant (have enough individuals to ensure long-term survival through a range of different conditions)
• diverse (have enough variation among individuals to ensure that some will respond successfully to changing environmental stresses)
• productive (able to grow the population fast enough to exploit good conditions in a variable environment); and • spatially distributed (exist in a large enough area to avoid catastrophic localized pressures).
American shad Photo Credit: Brian Currier
37
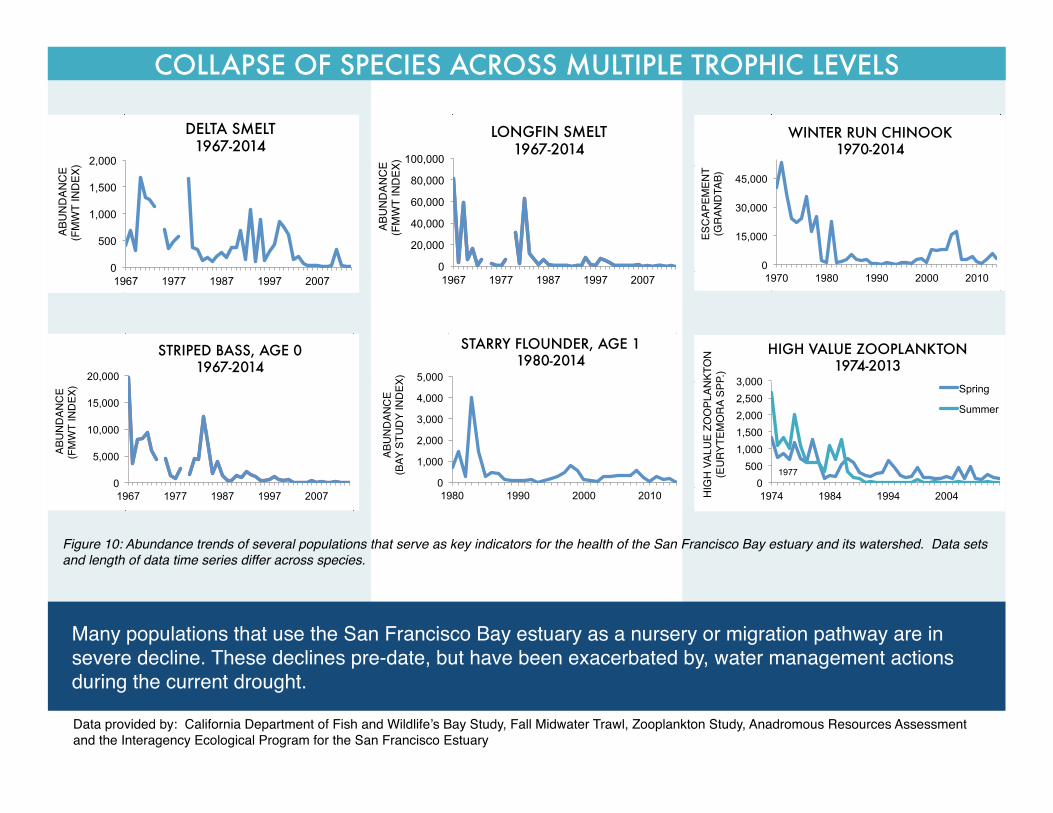
COLLAPSE OF SPECIES ACROSS MULTIPLE TROPHIC LEVELS
Many populations that use the San Francisco Bay estuary as a nursery or migration pathway are in severe decline. These declines pre-date, but have been exacerbated by, water management actions during the current drought.
Data provided by: California Department of Fish and Wildlife’s Bay Study, Fall Midwater Trawl, Zooplankton Study, Anadromous Resources Assessment and the Interagency Ecological Program for the San Francisco Estuary
0
500
1,000
1,500
2,000
1967 1977 1987 1997 2007
ABU
NDAN
CE
(FM
WT
INDE
X)
DELTA SMELT 1967-2014
0
5,000
10,000
15,000
20,000
1967 1977 1987 1997 2007
ABU
NDAN
CE
(FM
WT
INDE
X)
STRIPED BASS, AGE 0 1967-2014
0
20,000
40,000
60,000
80,000
100,000
1967 1977 1987 1997 2007
ABU
NDAN
CE
(FM
WT
INDE
X)
LONGFIN SMELT 1967-2014
0
1,000
2,000
3,000
4,000
5,000
1980 1990 2000 2010
ABUN
DANC
E (B
AY S
TUDY
INDE
X)
STARRY FLOUNDER, AGE 1 1980-2014
0
15,000
30,000
45,000
1970 1980 1990 2000 2010
ESCA
PEMEN
T(GRA
NDTAB)
WINTER RUN CHINOOK 1970-2014
1977 0
500 1,000 1,500 2,000 2,500 3,000
1974 1984 1994 2004
ABUN
DANC
E(Z
OO
PLAN
KTO
N ST
UDY)
HIGH VALUE ZOOPLANKTON 1974-2013
Spring
Summer
HIG
H V
ALU
E ZO
OPL
ANKT
ON
(E
URY
TEM
OR
A SP
P.)
Figure 10: Abundance trends of several populations that serve as key indicators for the health of the San Francisco Bay estuary and its watershed. Data sets and length of data time series differ across species.

The outlook for these populations is grim in large part because Bay inflows are no longer adequate to maintain the services the Bay ecosystem once provided to support abundant, diverse, productive and spatially distributed populations.
One of the best-documented facts about the estuary is the strong, persistent relationship between freshwater flow and healthy populations of key species. Over the past few decades many scientific studies have documented the critical role freshwater flows play in maintaining viable populations of native fish and wildlife, and the productive habitats and food webs that support them, in estuaries in general and the San Francisco Bay estuary in particular99. This overwhelming body of evidence has led federal and state regulators and resource managers, as well as numerous scientific review panels, to conclude that current freshwater inflows to the Bay estuary are no longer adequate to sustain native fish and wildlife populations100.
Obviously, the more individuals of a particular plant or animal species there are, the less vulnerable that species is to extinction risks from natural or human disturbances like habitat destruction or toxic pollution. Native fish species such as Delta smelt, longfin smelt, and Chinook salmon were among the most abundant species in the Bay ecosystem until the second half of the 20th century, but are now among the most rare species, and altering and reducing flows has been the main reason for their decline.
How much Bay inflow there is during critical times in fish life cycles strongly affects abundance: Critical parts of the life cycle of many fish species in the Bay estuary – such as reproduction, growth, and migration – are timed to occur during the winter and
ABUNDANCE: LESS FLOW, LESS FISH
spring months because the inflow from rainfall and snowmelt during this period was naturally higher, creating beneficial habitat conditions. The amount of timing and flow in any winter – spring period has a large effect on how populations of these species respond during the months and years following101 (Figure 11).
During the winter and spring, the migration of juveniles of fish species like Chinook salmon, steelhead, and sturgeon is cued by rising flow levels, and the young fish make their way along with the flow from their natal rivers through the estuary to the ocean. More Chinook salmon survive the journey when flows are higher102.
At the same time, small forage fish like Delta smelt and longfin smelt, important parts of the estuary food web, respond to increasing flows by moving to spawning areas in the upper estuary and breeding. Longfin, once the most common native fish residing in the estuary and now one of the rarest, respond dramatically to flow changes – their abundance is tightly and positively correlated to winter – spring Bay inflows103. No other factors, including the impact of invasive species, appear to affect longfin population dynamics during the first few months of life104.
During the spring months young starry flounder (another species caught by recreational and commercial fishermen) migrate into the Bay estuary from the ocean to mature105. The number of one-year-old starry flounder rearing in the estuary in a given year is strongly correlated to the amount of freshwater inflow in the previous spring106.
39

1967-1970 Avg. 37,720
2011-2014 Avg. 179.5
100
1,000
10,000
100,000
1
10
100
1,000
10,000
100,000
1967 1977 1987 1997 2007
JAN
- JU
N O
UTF
LOW
YEAR (1967-2014)
LONGFIN SMELT
DECLINING BAY INFLOWS = DECLINING FISH POPULATIONS
Abu
ndan
ce19
93 =
0
1980-1984 Avg.1,608 2011-2014 Avg.
157
1
10
100
1,000
10,000
100,000
1
10
100
1,000
1980 1990 2000 2010
M
AR
- MA
Y O
UTF
LOW
ABU
ND
AN
CE
IND
EX
YEAR (1980-2014)
STARRY FLOUNDER
1980-1984 Avg. 226.9
2010-2013 Avg. 147.8
10
100
1,000
10,000
100,000
1
10
100
1,000
1980 1990 2000 2010
MA
R - M
AY
OU
TFLO
W
ABU
DA
NC
E IN
DEX
YEAR (1980-2013)
BAY SHRIMP
1980-1984 Avg. 226.9
2010-2013 Avg. 147.8
10
100
1,000
10,000
100,000
1
10
100
1,000
1980 1990 2000 2010
MA
R - M
AY
OU
TFLO
W
ABU
DA
NC
E IN
DEX
YEAR (1980-2013)
BAY SHRIMP
1967-‐1991 38,130
2009-‐2014 Avg. 6,894
0
2,000
4,000
6,000
8,000
10,000
12,000
0
20,000
40,000
60,000
80,000
100,000
120,000
1952 1962 1972 1982 1992 2002 2012
SALM
ON
PRO
DU
CTI
ON
PRODUCTION YEAR (1952-2014)
SAN JOAQUIN RIVER CHINOOK SALMON PRODUCTION
Chinook salmon production (the estimated number of fish from a given watershed that reach age-2 in the ocean) is highly correlated with freshwater flow rates that occurred when juvenile salmon migrated to the ocean, two years earlier. The figure matches production of naturally spawned Chinook salmon from the San Joaquin River with the river’s flow to the estuary two years earlier, during outmigration of that same cohort of fish.
Figure 11: Strong correlations between abundance (blue lines, left vertical axis; abundance indices from biological sampling programs) and winter-spring inflow into San Francisco Bay (green bars, right vertical axis; “Bay Inflow”) have persisted for many decades for fish species and their invertebrate prey. Longfin smelt were once the estuary’s most common resident fish and a key component of a commercial smelt fishery; this population has declined by orders of magnitude and is strongly and significantly correlated with freshwater flow rates. Starry flounder, a predatory fish, generally increase in years following those with high freshwater flows into the estuary. Bay shrimp are prey for smelt, flounder, and a host of other fish and bird species; their population tracks closely with springtime Bay inflows.
Bay Inflow Abundance Index
JAN
-JU
N B
AY
IN
FLO
WM
AR
-MA
Y B
AY
IN
FLO
WM
AR
-MA
Y B
AY
IN
FLO
W
SA
N J
OA
QU
IN F
EB-J
UN
FL
OW
TO
ES
TUA
RY,
CFS
San Joaquin River Flow during juvenile migration
San Joaquin River Chinook Production (measured in the ocean 2 years later)
180
227 148
Longfin smelt - Recent average decline 99.5%
Starry flounder – Recent average decline 90%
Bay Shrimp - Recent average decline 35%
Chinook salmon - Recent average decline 89%
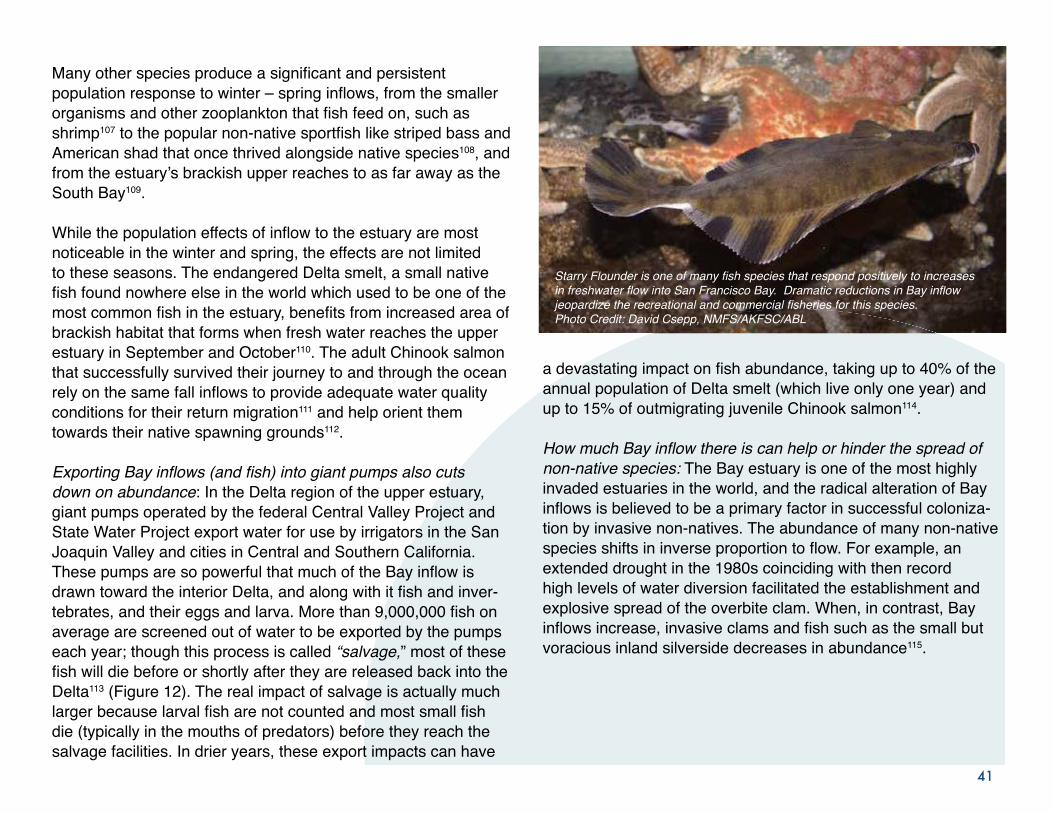
Many other species produce a significant and persistent population response to winter – spring inflows, from the smaller organisms and other zooplankton that fish feed on, such as shrimp107 to the popular non-native sportfish like striped bass and American shad that once thrived alongside native species108, and from the estuary’s brackish upper reaches to as far away as the South Bay109.
While the population effects of inflow to the estuary are most noticeable in the winter and spring, the effects are not limited to these seasons. The endangered Delta smelt, a small native fish found nowhere else in the world which used to be one of the most common fish in the estuary, benefits from increased area of brackish habitat that forms when fresh water reaches the upper estuary in September and October110. The adult Chinook salmon that successfully survived their journey to and through the ocean rely on the same fall inflows to provide adequate water quality conditions for their return migration111 and help orient them towards their native spawning grounds112.
Exporting Bay inflows (and fish) into giant pumps also cuts down on abundance: In the Delta region of the upper estuary, giant pumps operated by the federal Central Valley Project and State Water Project export water for use by irrigators in the San Joaquin Valley and cities in Central and Southern California. These pumps are so powerful that much of the Bay inflow is drawn toward the interior Delta, and along with it fish and inver-tebrates, and their eggs and larva. More than 9,000,000 fish on average are screened out of water to be exported by the pumps each year; though this process is called “salvage,” most of these fish will die before or shortly after they are released back into the Delta113 (Figure 12). The real impact of salvage is actually much larger because larval fish are not counted and most small fish die (typically in the mouths of predators) before they reach the salvage facilities. In drier years, these export impacts can have
a devastating impact on fish abundance, taking up to 40% of the annual population of Delta smelt (which live only one year) and up to 15% of outmigrating juvenile Chinook salmon114.
How much Bay inflow there is can help or hinder the spread of non-native species: The Bay estuary is one of the most highly invaded estuaries in the world, and the radical alteration of Bay inflows is believed to be a primary factor in successful coloniza-tion by invasive non-natives. The abundance of many non-native species shifts in inverse proportion to flow. For example, an extended drought in the 1980s coinciding with then record high levels of water diversion facilitated the establishment and explosive spread of the overbite clam. When, in contrast, Bay inflows increase, invasive clams and fish such as the small but voracious inland silverside decreases in abundance115.
Starry Flounder is one of many fish species that respond positively to increases in freshwater flow into San Francisco Bay. Dramatic reductions in Bay inflow jeopardize the recreational and commercial fisheries for this species. Photo Credit: David Csepp, NMFS/AKFSC/ABL
41

NUMBER OF FISH SALVAGED AT THE STATE AND FEDERAL PUMPS IN THE DELTA 1993 – 2011SELECTED FISH SPECIES 1993-2011
AverageANNUAL SALVAGE
MaximumSTATUS
American shad 1,022,700 2,510,184
Bluegill 127,133 394,952
Channel catfish 45,799 131,484
Chinook salmon (winter run)
Chinook salmon (spring run)
Chinook salmon (fall run)
Chinook salmon (late-fall run)
Delta smelt 29,918 154,820
Green sturgeon 58 363
Inland silverside 62,838 142,652
Largemouth bass 54,180 234,198
Longfin 6,228 97,686
Prickly sculpin 76,403 274,691
Steelhead (Rainbow trout) 5,278 18,580
Redear sunfish 1,609 5,611
Riffle sculpin 155 798
Sacramento sucker 3,443 27,362
Sacramento splittail 1,201,585 8,989,639
Striped bass 1,773,079 13,451,203
Threadfin shad 3,823,099 9,046,050
White catfish 296,543 941,972
White sturgeon 151 873
Yellowfin goby 193,399 1,189,962
AVERAGE YEARLY SALVAGE TOTAL: 9,237,444
51,955 183,890
STATUS KEYEndangered - Federal
Endangered - California
Threatened - Federal
Threatened - California
Native to CA
Recent decline
Important Fishery
Commercial/Sport Fisheries Destroyed
Protection Removed(for political reasons; species
has not recovered)
LEGEND
Figure 12 Fish were selected to encompass the wide range of species and life history types that are affected by water
pumps.
“Average annual salvage” is mean yearly salvage from 1/1993 through 12/2011;
“Maximum salvage” is the value for the calendar year with the highest salvage
numbers (years differ amoung species).
These numbers underestimate the actual fish kills by not counting the fish that
slipped through the bypass system and were killed by the pumps, and by not
including indirect mortality. “Yearly Total” refers only to the 20 species listed.

SPECIES OF FISH COMMONLY COLLECTED AT THE STATE FISH SALVAGE FACILITY PHOTO: CA DWR
DIVERSITY: IT’S ALL IN THE TIMING
“Don’t put all your eggs in one basket” is common advice for investors. Likewise, populations comprised of diverse individuals that exhibit a range of life history behaviors and genetic predis-positions are more resilient to environmental disturbances of all kinds and less vulnerable to the risk of extinction. California’s natural regime of extended winter rains and spring snowmelt and high year-to-year variability favors a wide variety of responses by the individuals within a population. Constraining the volume and timing of peak flows year after year selects for a small segment of behavioral and ecological responses that are able to utilize habitats during limited windows of availability (Figure 13). For instance, the dramatic decline of Bay inflows in the winter and spring limits the spawning period for Delta smelt, making the fish less able to capitalize on good conditions that may occur during the multi-month spawning and rearing seasons116. When the window of suitable spawning conditions for Delta smelt is reduced and limited to the same narrow timeframe year after year, some rare but valuable life-history strategies no longer pay off. The genetic variants that allow for these different strategies may decline or even disappear – meaning that the population’s ability to grow is compromised, even when good conditions return117.
Hedging your bets is the best way to plan a migration: Chinook salmon experience a similar dilemma. Historically,
different juvenile migration strategies have succeeded under different conditions118. But, as shorter and less frequent peak flow periods and lower flow volumes occur with increasing regularity during their juvenile migrations, the salmon life history types that can survive such conditions are favored over other life-history types. The period when flows are provided to support the outmigration of juvenile fall-run Chinook salmon from the San Joaquin River (the state’s second largest river) is limited to one month, and even that requirement was relaxed during the recent drought.
Restricting the migration window and limiting the flows that cue migration undermines the life-history diversity (in this case, the size and time at which juveniles migrate) that have allowed Chinook salmon to survive natural (and extreme) fluctuations in
43

IMPACTS TO FRESHWATERD
IFFE
REN
CES
BET
WEE
N E
STIM
ATED
U
NIM
PAIR
ED A
ND
AC
TUAL
FLO
W P
ATTE
RN
SEX
AMPL
ES O
F FL
OW
DEP
END
ENT
SPEC
IES
AND
LIF
E ST
AGES
LIV
ING
IN T
HE
BAY
0
50,000
100,000
150,000
200,000
250,000
300,000
Oct$ Nov$ Dec$ Jan$ Feb$ Mar$ Apr$ May$ Jun$ Jul$ Aug$ Sep$
FRES
HWAT
ER F
LOW
TO
SF
BAY
(CFS
)
WY 2009 BAY INFLOW
65% of peak captured
79% of peak captured
84% of peak captured
79% of peak captured
0
50,000
100,000
150,000
200,000
250,000
300,000
Oct$ Nov$ Dec$ Jan$ Feb$ Mar$ Apr$ May$ Jun$ Jul$ Aug$ Sep$
WY 2010 BAY INFLOW
70% of peak captured
52% of peak captured 80% of peak
captured
69% of peak captured
0
50,000
100,000
150,000
200,000
250,000
300,000
Oct$0
50,000
100,000
150,000
200,000
250,000
300,000
Oct Nov Dec Jan Feb Mar Apr May Jun Jul Aug Sep
55% of peak captured 11/4/08
72% of peak captured 1/27/09
78% of peak captured 5/7/09
75% of peak captured 3/5/09
Oct Nov Dec Jan Feb Mar Apr May Jun Jul Aug Sep
60% of peak captured 10/17/09
50% of peak captured 1/23/10
77% of peak captured 6/9/10
53% of peak captured 3/1/10
Oct Nov Dec Jan Feb Mar Apr May Jun Jul Aug Sep Oct Nov Dec Jan Feb Mar Apr May Jun Jul Aug SepAdultsJuveniles AdultsJuvenilesAdultsJuvenilesAdultsJuvenilesAdult Juveniles
Species
Chin
ook
Salm
on
Winter
Spring
Fall
Late Fall
Bay ShrimpMysid ShrimpHigh-Value Zooplankton
Steelhead
Longfin SmeltSplittailDelta SmeltStarry FlounderAmerican Shad
NovNov JulJan Feb Mar Apr May Jun OctOct Dec AugDec Jan Feb Mar Apr May Jun Jul Aug
BAY INFLOW WATER YEAR 2009 BAY INFLOW WATER YEAR 2010
Oct Nov Dec Jan Feb Mar Apr May Jun Jul Aug Sep Oct Nov Dec Jan Feb Mar Apr May Jun Jul Aug SepAdultsJuveniles AdultsJuvenilesAdultsJuvenilesAdultsJuvenilesAdult Juveniles
Chin
ook
Salm
on
Winter
Spring
Fall
Late Fall
Species
Steelhead
Bay ShrimpMysid ShrimpHigh-Value Zooplankton
Longfin SmeltSplittailDelta SmeltStarry FlounderAmerican Shad
Only 28% of the Central Valley watershed’s runoff made it to the Bay between February and June 2009, the lowest percentage of available flow since 1990. Peak flow events in January, February, March, and early May were virtually eliminated; this deprived juvenile salmon (all four distinct populations) and numerous other species of the ecological benefits associated with these short-term pulses of fresh water.
Sixty-five percent of Central Valley runoff was diverted during the winter-spring of 2010, and high percentages were diverted during peak flow periods that species like Chinook salmon rely on to find their way through the Delta to the Ocean.
Figure 13: Overlap in timing of freshwater flow and presence of different species life-stages in San Francisco Bay and the Delta. Top panels show, for years 2009-2012, the rate of freshwater flow into the Bay (Bay Inflow, orange line) in comparison to what would have flowed had there been no dams or
diversions upstream of the estuary (unimpaired flow, blue line). Lower panels show the seasonal timing of several species that use the estuary to
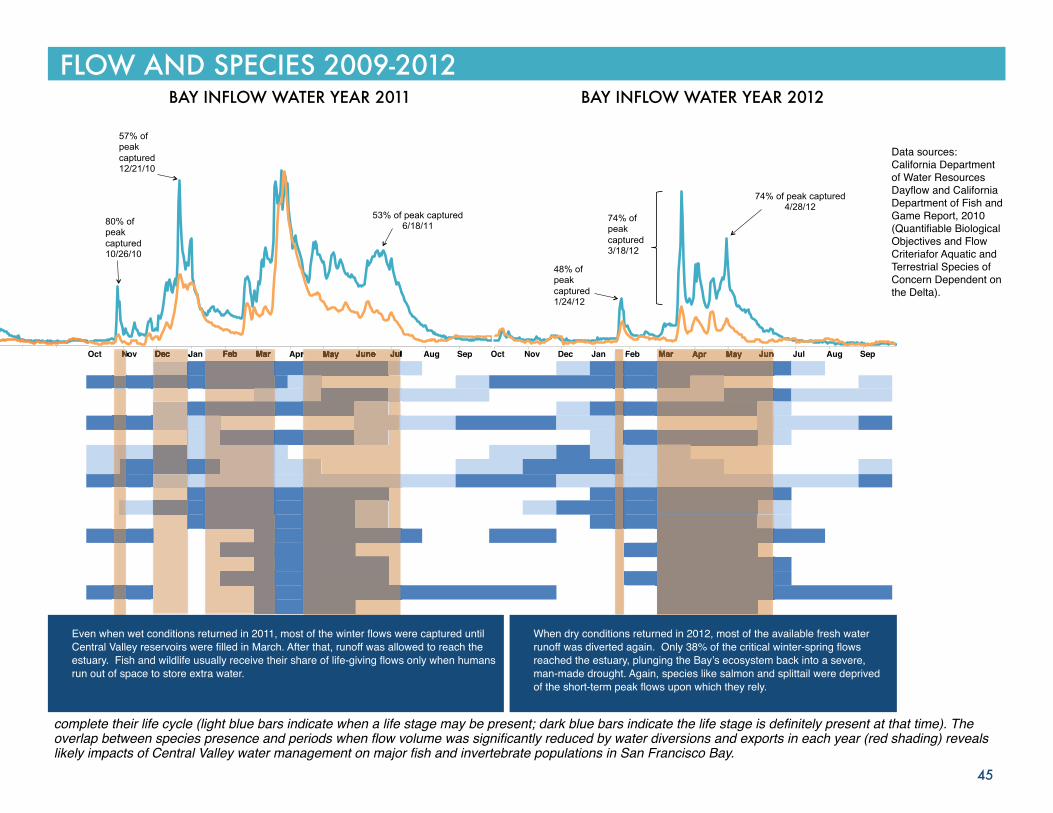
FLOW AND SPECIES 2009-2012
0Oct$ Nov$ Dec$ Jan$ Feb$ Mar$ Apr$ May$ Jun$ Jul$ Aug$ Sep$
WY 2011 BAY INFLOW
85% of peak captured
67% of peak captured
58% of peak captured
17% of peak captured
80% of peak captured 10/26/10
57% of peak captured 12/21/10
53% of peak captured 6/18/11
0
50,000
100,000
150,000
200,000
250,000
300,000
Oct$ Nov$ Dec$ Jan$ Feb$ Mar$ Apr$ May$ Jun$ Jul$ Aug$ Sep$
WY 2012 BAY INFLOW
75% of peak captured 64% of
peak captured
77% of peak captured
Oct Nov Dec Jan Feb Mar Apr May Jun Jul Aug Sep
80% of peak captured 10/26/10
57% of peak captured 12/21/10
53% of peak captured 6/18/11
1% of peak captured 3/23/11
Oct Nov Dec Jan Feb Mar Apr May Jun Jul Aug Sep
74% of peak captured 3/18/12
48% of peak captured 1/24/12
74% of peak captured 4/28/12
BAY INFLOW WATER YEAR 2011 BAY INFLOW WATER YEAR 2012
Oct Nov Dec Jan Feb Mar Apr May June Jul Aug Sep Oct Nov Dec Jan Feb Mar Apr May Jun Jul Aug SepNovNovNovNov JanJanDecDecDec AprApr JulJulAprApr MayMayMay JuneJuneJune JulJulJul JunJunMarMar AprApr MayMay JunJunFebFebFeb MarMarMar
Data sources: California Department of Water Resources Dayflow and California Department of Fish and Game Report, 2010 (Quantifiable Biological Objectives and Flow Criteriafor Aquatic and Terrestrial Species of Concern Dependent on the Delta).
Even when wet conditions returned in 2011, most of the winter flows were captured until Central Valley reservoirs were filled in March. After that, runoff was allowed to reach the estuary. Fish and wildlife usually receive their share of life-giving flows only when humans run out of space to store extra water.
When dry conditions returned in 2012, most of the available fresh water runoff was diverted again. Only 38% of the critical winter-spring flows reached the estuary, plunging the Bay’s ecosystem back into a severe, man-made drought. Again, species like salmon and splittail were deprived of the short-term peak flows upon which they rely.
45
complete their life cycle (light blue bars indicate when a life stage may be present; dark blue bars indicate the life stage is definitely present at that time). The overlap between species presence and periods when flow volume was significantly reduced by water diversions and exports in each year (red shading) reveals likely impacts of Central Valley water management on major fish and invertebrate populations in San Francisco Bay.

their environment for millennia. This loss of diversity in juvenile migration strategies likely led to the unprecedented closures of California’s ocean fishery in 2008 and following years119. The net effect of reducing migration diversity is to gamble that a small subset of the fish that migrate during such short windows will reach the ocean exactly when food supplies, temperatures, and other conditions are adequate. Salmon thrived in the Bay estuary by hedging their bets about when to go to the ocean; restricting those opportunities eliminates large portions of the population that might capitalize on changing conditions, and makes the dwindling remnant much more susceptible to extreme population swings.
In the context of what defines a viable population, productivity refers to a population’s ability to grow; it is the balance between birth rate and death rate. Populations that have a high capacity for population growth can rebound quickly after periods with poor environmental conditions120. In estuaries, both river inputs and ocean conditions affect productivity of different species to different degrees. Scientific research in the Bay estuary suggests that freshwater inflows have greater ecological effects on this particular estuary than the effect of ocean waters moving inland into less saline environments121 (Figure 14).
As with abundance, there is strong scientific evidence linking population growth in native fish species like longfin smelt and Chinook salmon to freshwater inflows to the estuary122. In the variable conditions that typify an estuary, many aquatic organisms evolved to rebound rapidly in wetter years following poor conditions in drier years. But these species must now contend with the Bay’s human-made “permanent drought”. In terms of the actual conditions experienced by the estuary’s fish and wildlife, wet years are infrequent and much less wet, and drier years are extremely dry and nearly continuous. As a result,
PRODUCTIVITY
in most years the population’s rate of growth is constrained, and the higher flows that would allow the population to rebound rarely occur.
Food web productivity also improves with increases in freshwater flow to the estuary. Productivity in this sense has been degraded by the direct and indirect effects of reducing inflows, as described in the previous chapter. One of those effects is the successful establishment of invasive species, whose growing numbers can displace native fish and wildlife populations by competing for food and habitat. The effects are not confined to the winter and spring months. For example, the prevailing theory about why anchovies are no longer abundant in the upper estuary in summer and fall is that the local population simply left the area when food web productivity was reduced123. This effect has been attributed to the effect of the overbite clam on production of anchovy prey; however, the clam’s invasion itself appears to have been facilitated by the extreme reduction in inflow. Species such as Pacific herring feeding in the summertime may also be negatively affected by reduced food web productivity in the Bay124.
Salmon Photo Credit: Bay.org

JUVENILE AND ADULT SURVIVAL
FRESHWATER FLOW DRIVES MULTIPLE MECHANISMS THAT AFFECT PRODUCTION OF FISH IN THE BAY
FEC
UN
DIT
Y
SPAW
NIN
G
HAB
ITAT
PREY
DEN
SITY
DIS
EASE
CO
NTA
MIN
ANTS
PRED
ATIO
N
REA
RIN
G
HAB
ITAT
Flow and ocean conditions affect prey abundance in the Bay which can affect female growth and body size
Suitable spawning substrate with appropriate temperature,salinity, and flow rate
Water temperature, nutrient and food transport, productivity of microscopic organisms, contaminants, disease
Water temperature, flow rates through the estuary (residence time), fish distribution
Toxin concentrations, frequency of harmful algal blooms
Turbidity, flow rate, and predator abundance
Prey abundance, flow rates, temperature, salinity, turbidity, contaminant loads
Figure 14: A generalized view of factors driving population fluctuations for many of the fish populations that depend on the Bay to complete their life cycle. The forces that produce each ecological feature and their impact on different fish species are too numerous to list; the key point is that freshwater flows into the estuary affect each of these drivers. The strength of the influence of freshwater flow or ocean impacts varies by species and by location of the life-history stage in question.
FreshwaterImpacts
OceanImpacts
ECO
LOG
ICAL
FEA
TUR
E GENERALIZED MODEL OF BAY FISH ABUNDANCE
IS T
HE
PRO
DU
CT
OF.
..FL
OW
AF
FEC
TS...
SPAWNING SUCCESS
PRIN
CIP
ALLY
M
OD
IFIE
D B
Y...
Prey abundance which can affect female size
Amount of spawning habitat available for species that spawn in the Bay watershed’s rivers and in the estuary by modifying temperature, salinity, and other environmental conditions
Prey production and distribution throughout the Bay by influencing nutrient, and food transport, contaminant concentrations, and disease spread; ocean conditions affect abundance of certain prey species that enter the Bay
Residence time and fish distribution
Conditions that promote harmful algal blooms and dilutes concentrations of other contaminants
Transport of small fish and turbidity (cloudiness) of water, which hide small fish and reduce predation rates
Salinity, turbidity, flow rates, and prey availability that affect rearing success. Ocean conditions (such as upwelling) influence rearing success for some species in the lower Estuary
47

SPATIAL DISTRIBUTION: THE ADVANTAGES OF SPREADING OUT IN THE LANDSCAPE
Populations are less vulnerable to extinction risk from both degraded local conditions and catastrophic events when they are more widely distributed in the landscape125. How much freshwater flow makes it downstream has a profound effect on how much habitat of different types is created and where it is located throughout the landscape of the estuary, in turn affecting where particular species can be found and how many individuals of that species can utilize a particular habitat (Figure 15). Because many native aquatic organisms in the Bay estuary have evolved to exploit its unique brackish water habitats, resident species such as Delta smelt and longfin smelt are typically associated with a narrow band of habitat in the Low Salinity Zone. When inflow to the estuary is reduced, the LSZ contracts in response, shrinking available habitat for the smelt and related species126. As the band of usable LSZ habitat contracts, it also moves upstream, shifting the distribution of longfin and Delta smelt upstream towards the Delta and increasing the number of fish that are lost to the giant south Delta pumps run by the federal Central Valley Project and State Water Project127.
Adequate distribution isn’t just a problem for resident fish. Flows can be so low in reaches of the southern Delta and the San Joaquin River basin that their use as migratory corridors by Chinook salmon and other species is impaired or eliminated128, and water quality becomes so degraded that fish passage is blocked129. The inability to sustain the distribution of Chinook and other salmonids in the San Joaquin Valley portion of the Bay’s watershed is highly problematic as a result of reduced freshwater flows130. In effect, this loss of spatial distribu-tion makes all of the estuary’s salmonid populations dependent on conditions in the Sacramento River valley; any problems there (e.g., a spill of toxic chemicals, disease outbreaks) could eliminate the Central Valley’s production of salmonids.
Figure 15: The spatial distribution of many species changes in response to variation in freshwater inputs to the estuary. These maps show the distribution of three fish species across a range of Bay inflows and salinity gradients during the spring. For example, in an extremely wet year (like 1983) the distribution of Delta smelt (top row) extends throughout the upper estuary during the spring. In contrast, distribution of this native fish is limited to Suisun Bay and the Delta when the combined effect of drier conditions and high diversion levels makes Bay inflows extremely low, such as 1988. Starry flounder (bottom row) prefer habitats with intermediate salinities that are broadly available under high flow conditions, but less widespread when conditions are very dry. The wettest year (1983) is depicted for each species on the left hand side of the figure; drier years are shown to the right hand side. In the absence of water diversions or exports, salinity conditions similar to those depicted on the left would have occurred in 10 years between 1975-2014, but they actually occurred in only 4 of those years. By contrast, Super Critically Dry years only occurred naturally in one year (1977) during this four decade period, but similarly extreme conditions in the estuary actually occurred for 19 years – almost half the time.
Data sources: U.S. Environmental Protection Agency; California Department of Fish and Wildlife and the Interagency Ecological Program San Francisco Bay Study; Delta Modeling Associates (Salinity Gradient, Coarse-grid version of UnTRIM San Francisco Bay-Delta Model); and ESRI, DeLorme, BEBCO, NAANGDC, & other contributors (Basemap).

FISH DISTRIBUTION CHANGES IN RESPONSE TO THE SALINITY FIELD
DRY
STAR
RY F
LOU
ND
ERLO
NG
FIN
SM
ELT
DEL
TA S
MEL
T
SEASONAL SALINITY GRADIENT
Sea
sona
l Sal
inity
Gra
dien
t Fe
b - J
une
1983 1993 1988
1983 1980 1981
1983 2000 1992
Seas
onal
Sal
inity
Gra
dien
t Ja
n - J
une
Seas
onal
Sal
inity
Gra
dien
t Pr
ior Y
ear M
arch
- Ju
ne
WET
49

FORAGE FISH – WHEN THE FOOD WEB IS THE SUM OF ITS PARTS
Collectively, small fish and large invertebrates that swim in open water are known as “forage fish.” They represent the prey base for larger fish, sea birds, and marine mammals, which often do not distinguish one kind of fish from another. Declines in forage fish populations are a known threat to populations of seabirds131 and marine mammals132. Because of their crucial function in estuarine and marine food webs, global declines in forage fish have become a concern for scientists, ecosystem managers, and some fishing communities.
The populations of many forage fish species that were historically the most abundant in the estuary, such as longfin smelt, striped bass,
FLOW IS FOR THE BIRDS, TOOAmerican shad, Bay shrimp, and mysid shrimp, have declined dramatically in recent decades. Unlike many other areas of the world where they are overfished, forage fisheries are generally well managed in the Bay and nearshore coastal waters of California. Instead, these population declines are directly related to the long-term trend of reducing Bay inflow – indeed, a reliance on freshwater flow is the only thing some of these forage fish have in common (Figure 9). Forage fish have an ecological value much greater than their physical size. Without sufficient Bay inflow to provide the habitat conditions that allow forage fish populations to thrive, populations of other fish, birds, and marine mammals that rely on forage fish in the Bay and the Gulf of the Farallones are at risk of collapsing too.
Fish, invertebrates, and other aquatic plants and animals aren’t the only creatures that benefit from Bay inflows, and suffer when they are reduced. The Bay estuary is also home to a diverse community of both resident and migratory birds. A critical part of the Pacific Flyway, the estuary provides crucial habitat for millions of migrating waterfowl and shorebirds, representing over 200 species. However, many bird populations that use the estuary are declining, and currently twenty-two bird species are listed as threatened, endangered, or species of special concern in this estuary133.
Great Egret, one of many native bird species that relies on the fish and invertebrates produced by the
San Francisco Bay foodweb. The effects of freshwater flow rates extend throughout the Bay ecosystem and
beyond. Photo credit: David Sanger

It takes a fishery to support an aviary: Many factors are to blame for declines in bird populations, including urbanization, contam-inants, and direct habitat loss. But long-term reductions in freshwater flows to the estuary likely contribute significantly to the pressure on the Bay’s waterbird populations because of the resulting decline in the abundance of forage fish and the degradation of wetland habitat and water quality. Protecting fish-eating birds, such as pelicans, terns, and cormorants, requires production of a sufficient forage fish prey base. But populations of many fish species that depend on adequate inflows to the estuary have dropped well below the levels that are needed to maintain viable populations of pelagic seabirds134.
Throughout the estuary many bird species are closely associated with wetland marshes135, and large areas of the upper estuary, especially in Suisun Marsh, are managed to provide fresh and slightly brackish habitat for ducks. As reducing inflows makes the estuary more saline over time, the diversity and composition of wetland vegetation will change as well, affecting its habitat value for bird species. Salinity-induced wetland vegetation shifts in recent years have been as extreme as experienced in the most severe natural drought periods in California’s history136. Changing salinities can limit the diversity of seeds stored in the soil and the productivity, diversity, and composition of wetlands137. Animal species that depend on these marshes are likely also impacted by salinity and vegetation changes resulting from reduced inflow138. Finally, impaired water quality that is exacerbated or caused by low inflows also harms the Bay’s many bird populations.
DRIVING RECREATIONAL AND COMMERCIAL FISHERIES INTO THE ABYSS?
It would be a sadder and poorer world if Californians allow the San Francisco Bay estuary to become so impaired that its unique and wonderful aquatic life, and the birds and mammals that feed on it, disappears forever. But the consequences are not only ecological, or spiritual, or esthetic – there are extremely significant economic costs as well. The Bay Area has always been a major hub of the Pacific Coast’s commercial fishing industry. Bay Area residents and tourists from across the globe come to San Francisco Bay in order to enjoy the pursuit of salmon, sturgeon, and many other game fish and, if they’re lucky, to bring home a delicious dinner.
“Fish-friendly water management” is the only option: Today, Chinook salmon are one of the most recognizable and cherished fish on the Pacific Coast, and their production in the Bay’s watershed supports a commercial and ocean recre-ational fishery that extends all the way from Monterey Bay to Oregon. But these valuable fisheries are extremely vulnerable to changes in Bay inflows. The long-term trend of flow alteration (combined with habitat degradation and poor hatchery management) in the watershed, and the associated declines in salmon production, has been a contributing factor to the loss of thousands of jobs and the beaching of hundreds of boats in the fishing industry139. When these long-term problems overlapped with poor ocean conditions, fishing for Chinook salmon off the California coast was closed completely in 2008 and 2009 (and through most of 2010). At the time, much attention was focused on the role of ocean conditions (and their relationship to global climate change); however, the most comprehensive scientific study of the unprecedented closure of the fishery noted that decades of poor habitat conditions in their freshwater nurseries
51

San Francisco Bay is home to both commercial and recreational fisheries such as Pacific herring pictured in this photo. Fisheries for many species like salmon and starry flounder depend on the health of the Bay ecosystem, including numerous ecological processes that are driven by freshwater flows to the estuary. Photo Credit: David Sanger
had set the stage for this collapse and called for “…more fish-friendly water management…” as one of the few actions that might prevent the problem from recurring140. If California wants to preserve its salmon fisheries, the only effective antidote for poor ocean conditions is to improve flow conditions upstream of the Golden Gate.
It’s not just salmon on the plate: The Bay supports many other important fisheries, including the nation’s last major urban commercial fishery (for Pacific herring). For instance, there is a valuable sport and recreational fishery for starry flounder, a predatory fish, which once produced hundreds of metric tons in California141. The flounder population in the estuary grows or contracts depending on how much water flows into the Bay during the spring142. In addition, tourists and Bay Area residents pay substantial amounts of money (for tackle, licenses, and a boat ride) to try to catch white sturgeon in the Bay; the spawning success of these giant fish is directly related to flow from the watershed into the estuary143. Sacramento splittail, an endemic species that depends on periodic flooding to inundate its spawning habitats, are also a staple of recreational and subsistence fishing in the upstream portions of the estuary. Invertebrates, like oysters and Dungeness crab, are also much sought after, and again maintenance and restoration of their habitats and populations requires more careful management of freshwater flows to the Bay. Unless flow conditions are improved, these fisheries could all go the way of the once vibrant fisheries for Delta smelt and longfin, two species that were once ubiquitous in the estuary but are now so rare that they are listed as endangered. As these fisheries disappear, the fishing communities that depend on them – from small towns along the coast to families who rely on subsistence fishing in the Delta to the seafood-related businesses of Fisherman’s Wharf – are at risk as well.
MARINE MAMMALS SUFFER WHEN REDUCING FLOWS REDUCES THEIR
FOOD SUPPLY
There are few more amazing and thrilling experiences for Bay Area residents and visitors than to observe sea lions and seals hauling up onto local docks and piers, or to take a whale-watching trip to see the Orca whales (the “Southern Resident killer whale” population) that feed and migrate right outside the Golden Gate. These protected marine mammal species eat fish and other organisms that rely on the estuary and its Central Valley watershed as spawning and rearing grounds. By diminishing the estuary’s productivity and changing its food web, reducing Bay inflows can produce cascading effects that eventually create problems for local marine mammal populations. For example, the local Southern Resident killer whale population specializes in eating Chinook salmon; the abundance, reproductive success, and mortality rates of resident Orcas are linked to prey limitation caused by recent Chinook salmon declines144. Orca whales have come to rely on Chinook salmon because they are large fish with a high fat content that were historically abundant throughout the year, so the decline of salmon stocks has had dire consequences for resident Orcas. Dwindling supplies of salmon are believed to restrict the recovery of the local population145. As a result of mismanaging flows in the estuary and its watershed, the future of these two iconic species in the Bay Area is uncertain.
53

NEARSHORE OCEAN SAN PABLO, CENTRAL, AND SOUTH BAYS
SUISUN BAY AND MARSH DELTA
PROCESSES AFFECTED BY FRESHWATER FLOWS
BIOLOGICAL EFFECTS ASSOCIATED WITH FRESHWATER FLOWS
• Sediment transport (turbidity)
• Nutrient transport• Beach formation
• Sediment transport (turbidity)
• Nutrient transport• Marsh accretion• Changes in the availability
of habitats with different salinities
• Water column stratification
• Sediment transport (turbidity)• Nutrient transport• Marsh accretion• Changes in the availability
and location of habitats with different salinities
• Residence time • Food web productivity • Gravitational circulation, fish
and wildlife migrations
• Sediment transport (turbidity)• Nutrient transport• Marsh accretion• Residence time• Floodplain innundation• Fish and wildlife migrations• Contaminant loading • Toxic algal production • Keep brackish water “at bay”,
maintains agricultural and drinking water quality
• Increase food web productivity
• Improve survival and fitness of resident Orca whales and other marine mammal populations
• Create/maintain/improve beach habitats
• Increase fishery productivity
oductivity
• Control wetland plant species composition and distribution
• Improve abundance and distribution of many native species including those that become food for other species
• Increase fishery productivity
• Create/maintain/improve brackish marsh habitat
• Prevent harmful algal blooms• Improve abundance and
distribution of many native species
• Increase fishery productivity • Control spread of invasive
species• Reduce entrainment of
endangered fish at Delta export pumps
• Improve abundance and distribution of many native species, including those that become food for other species
• Increase fishery productivity • Create/maintain/improve
brackish marsh habitat
FRESHWATER FLOWS
Figure 16: Most fresh water comes to San Francisco Bay from rivers of the Central Valley’s watershed, via the Sacramento-San Joaquin Delta (upper right). The effects of flowing fresh water (including the transport of food, nutrients, sediments, and organisms produced upstream) can be felt throughout San Francisco Bay and into the nearshore Pacific Ocean. Along the journey from the rivers to the ocean, freshwater flows affect numerous processes and habitats, generating a variety of biological outcomes. Generally speaking, managing water diversions upstream of the Bay in a more sustainable manner will lead to higher flow rates, more natural variability in those flow rates, and increasing benefits for the larger San Francisco Bay ecosystem and the people who live in and visit the Bay Area.
CASCADING EFFECTS OF FRESHWATER FLOW IN THE SAN FRANCISCO BAY ESTUARY

PEOPLE ARE THE ULTIMATE LOSERS FROM LOW BAY INFLOWS
Clearly, people benefit from a healthy San Francisco Bay in many ways (Figure 16). When the Bay’s fish and wildlife populations are thriving, they provide enormous commercial and recreational opportunities, from taking your family to discover the unique plants and animals of the Bay’s wetlands and beaches to going whale watching or salmon fishing, and they feed millions of people each year. Collectively, the Bay’s natural resources make San Francisco one of the most attractive places in the world to live and visit.
People don’t just benefit from observing wildlife and eating seafood, but regularly enjoy direct contact with the Bay. Many “play in the Bay” when they wade, swim, sail, or kayak in its waters; these activities are only enjoyable when the Bay’s waters are clean and there are wetlands and beaches to visit. When Bay inflows decline, water quality and the ability to resupply beaches and wetlands with sediment declines as well.
Don’t go near the water without a hazmat suit: We now know that low inputs of Bay inflow not only degrade water quality but also are beginning to cause periodic harmful algae blooms in the estuary. These harmful “algae” (actually, cyanobacteria) produce neurotoxins powerful enough to make humans sick and even to kill dogs, otters, and other small mammals146. The Microcystis cyanobacteria blooms more frequently when low fresh water flows reduce flushing and decrease turbidity in the Delta147. Although this species blooms only in the fresh water of the upper estuary, its toxin can be transported downstream; in fact, the neurotoxin was recently detected in invertebrates in the saltier waters of the Central Bay148. Thus, the problem of low Bay inflow not only harms fish and wildlife but also
threatens water quality and recreational opportunities for people throughout the larger Bay Area. This alarming development has the potential to reverse the positive effects of our decades old, multi-billion dollar investment in cleaning up the Bay’s waters.
The reduction of Bay inflows also poses a threat to the continued existence of the beaches and wetlands that surround the Bay and the coastal areas nearby the Golden Gate, popular recreational sites that attract both residents and tourists throughout the year. These special environments rely on a continuous supply of sediments to maintain themselves in the face of ongoing erosion from storm runoff and waves. Delivery of sediments to the Bay and coastal environments, and our ability to maintain these important features, is controlled in part by how much freshwater inflow we allow to reach the estuary. As Bay inflows are constricted by human water diversions, they mobilize less sediment; many of the Bay Area’s beaches and wetlands are rapidly eroding for lack of sediment resupply. As sea levels rise, the resupply problem will become even more critical.
A Bay Area where it’s hard to catch salmon, see pelicans or Orca whales, find a bowl of cioppino made with today’s local catch, hang out at the beach, or even be in contact with the water? This is a high price to pay for tolerating California’s unsustainable approach to managing its aquatic resources, where so little freshwater flow is allowed to make the life-giving journey to San Francisco Bay and the Golden Gate.
The time is now for Californians to decide whether we really want to pay that price – or the choice will be made for us; the loss of the many ecosystem services and economic benefits the Bay still provides today will become just another cautionary tale to pass on to future generations.
55

WHAT CAN BE DONE TO REVIVE THE FRESHWATER-STARVED ESTUARY?
Photo Credit: David Sanger
TURNING THE FLOW BACK ON
Fortunately, there’s still time to avoid the increasingly likely scenario where native fish species go extinct; toxic algal blooms become common; recreational and commercial fisheries are permanently closed; marshes erode, grow more saline and less diverse; and the Bay Area’s tourism and recreational portfolio loses value.
To avoid that scenario, Californians must choose a different pathway for how we manage flows and water supplies in the future. As mentioned in the beginning of this report, while most of the outcomes of water management conflicts are experienced downstream in the Bay, most of the causes – and the solutions –

manifest themselves in the Bay’s watershed. Here are some of the essential elements of a watershed-wide solution pathway.
The federal Clean Water Act requires the states to adopt, and obtain federal approval of, standards that fully protect designated beneficial uses of water, and then to review them every three years to ensure they are achieving their purpose. California last updated water quality standards for the Bay estuary, over 20 years ago, in 1995. In this estuary, the beneficial uses of water most sensitive to human alteration and degradation and most at risk of being extinguished are related to fish and wildlife, including estuarine habitat, fish migration, and coldwater habitat. Many policy-makers, regulators, and independent scientific reviewers have concluded over the last decade that the freshwater flows required by the 1995 standards are not sufficient to protect fish and wildlife beneficial uses of the estuary. For example, the Governor’s Delta Vision Task Force, the California State Water Resources Control Board, the California Department of Fish and Wildlife, the National Research Council, and the U.S. Environmental Protection Agency149 have all made such findings. The promulgation of new, more protective flow standards by the Water Board and the EPA that require substantially more inflow to San Francisco Bay is the single most pressing item on the agenda for saving the estuary. Delays in completing the update, begun in 2009, must come to an end, and new standards updated in short order.
ADOPT STRONGER WATER QUALITY STANDARDS FOR THE BAY ESTUARY NOW, AND UPDATE THEM BASED ON WHETHER ECOLOGICAL TARGETS ARE BEING MET
A wealth of scientific evidence supports increasing required flows to save native fish and wildlife populations and restore
productivity of the estuarine. But the record also indicates that increased flows and flow variability help control the spread or damage caused by invasive species that have colonized the estuary, and suggests that they might control new invasions as well. Federal and state regulators should consider developing and adopting additional flow require-ments that are specifically designed to provide conditions that inhibit the establishment and spread of invasive species.
Get SMART: The new standards for flow (and other water quality parameters) should not only be fully protective of the most sensitive fish and wildlife beneficial uses, but also be linked to a set of biological performance measures that define the desired outcomes for fish and wildlife beneficial uses using SMART (specific, measurable, achievable, relevant, and time-bound) objectives150. These SMART objectives should include targets for population viability of key species (i.e., abundance, diversity, productivity, and distribution, as discussed in the previous chapter) and targets for ecological conditions associated with population response (e.g., temperature or habitat availabili-ty). Although the Clean Water Act requires triennial review of standards, most standards are not updated more often than once in a generation, and the process is usually politically controver-sial. Measuring progress toward achieving SMART biological objectives can allow regulators to adjust flows and other environ-mental safeguards, within a narrow pre-determined range, to achieve better, more timely protection of fish and wildlife uses of the estuary. This adaptive management approach also lends itself to efforts to improve our understanding of the flow regimes, including magnitude, duration, seasonality, and frequency of flows, that will effectively suppress invasive species.
57

REQUIRE ALL WATER DIVERTERS TO CONTRIBUTE THEIR FAIR SHARE
Currently, the federal Central Valley Project and the State Water Project are assigned the primary responsibility for releasing water from their reservoirs to achieve the flow and water quality standards for the Bay estuary. Strictly speaking, this first and foremost affects the contractors served by the projects, who have water rights that are junior to others in the watershed. The strange reality is that irrigation districts and cities with senior rights, including those parties who exchanged their senior water rights for delivery contracts with the projects, are not directly required by regulators to help attain water quality standards set for the Bay and Delta. This leaves a subset of water users, representing a quarter or less of total diversions, as the parties primarily responsible for meeting water quality standards for the entire estuary151. Updated water quality standards that require all water users, including senior water rights holders, to contribute a fair share of the total flow needed to meet standards that are designed to stablize and restore the estuarine ecosystem could generate millions of acre-feet of additional freshwater flows to the Bay Estuary; spreading the obligation among a larger group of water diverters would reduce inequities in current water allocations, as well. Everyone should be responsible for protecting public resources before anyone receives the public’s water to use for their own private gain. Any pathway that fails to set and integrate the obligations of this larger subset of water users will not generate sufficient flow to solve the estuary’s problems.
More broadly, California’s archaic water rights system needs to be modified to reflect the realities of twenty-first century society, law and climate. Not only are different water users treated differently based on priority in time rather than urgency
of need, but the state’s water resources are wildly over-allo-cated as a result of historically awarding the right to use water without examining whether adequate supplies exist. Total water rights allocations in California equal five times California’s mean annual runoff, and water rights in major river systems in the Bay’s watershed account for up to 1000% of natural supply152. As long as water rights are so over-allocated, there will always be pressure to withdraw more water from the Bay’s watershed than is sustainable in the long term, and corresponding political pressure to weaken water quality standards or other flow-related environmental protections. In the past, water rights reform and groundwater management were both considered third rails in California politics; now the first phases of groundwater reform have become a reality, but not before over-exploitation of these resources caused some communities to run out of water and the earth’s surface to subside. The time to consider updating our water rights system has also come; reform needs to happen before the even more awful to contemplate impacts of over-allo-cation become irreversible.
The upper estuary is ground zero in the battle over how water is managed – and mismanaged – in California, and it is here that the magnitude of the effects of unsustainable water diversions on fish, wildlife, habitat, and ecological processes are most apparent. In 2009 the California Legislature recognized the vulnerability of the upper estuary and the need to reduce human pressure on this ecosystem by passing the Sacramento – San Joaquin Delta Reform Act, which among other things set a new state policy:
REDUCE RELIANCE ON THE DELTA AS A SOURCE OF WATER SUPPLY

Regional self-reliance in areas now exporting water from the Bay’s watershed means using less water to provide the samegoods and services (e.g., through water efficiency, conservation, leak reduction); using water more than once before disposing of it (water recycling); cleaning up degraded water so that it can be used for productive purposes (brackish water reclamation); using local runoff for nonpotable water use (stormwater capture and reuse); and storing water underground in groundwater aquifers during wet years (conjunctive use, water banking, stormwater recharge). According to a 2014 review by the Pacific Institute and the Natural Resources Defense Council, up to 14 million acre-feet of water per year – over half the total amount of water used for human use throughout the Bay’s watershed each year – could be saved from combined investments in these strategies154.
These approaches can also reduce the carbon footprint of water management and respond to shifts in hydrology caused by climate change. Increasing local self-reliance avoids expending the energy needed to transport imported water long distances from its source. For instance, transporting water via the State Water Project represents about 3% of the state’s total energy consumption155. Using the natural capacity of groundwater basins to clean and store storm runoff for later use reduces
much of the energy and expense associated with capturing, treating, and disposing of stormwater. Expanding that capacity by enlarging flood basins and floodways and reoperating existing reservoirs can temporarily capture more of the larger floods that will be typical of a warming climate, and then divert these flows to groundwater recharge areas.
Town and country together: Regional self-reliance also requires that the inequities between urban and agricultural water uses be addressed. Urban water users generally pay a much higher cost for water, invest more in conservation and other demand management strategies, and are held to a higher standard for using water efficiently (e.g., the state’s mandated target of reducing per capita water use in the urban sector by 20% vs. the absence of any quantitative target for reducing use in the irrigation sector). Targets for saving water and becoming locally self-reliant should be set as appropriate for each economic sector and each region of the state; permitting and funding decisions by local, state and federal agencies should be linked to performance in meeting these targets.
59
… to reduce reliance on the Delta in meeting California’s future water supply needs through a statewide strategy of investing in improved regional supplies, conservation, and water use efficiency. Each region that depends on water from the Delta watershed shall improve its regional self-reliance for water through investment in water use efficiency, water recycling, advanced water technologies, local and regional water supply projects, and improved regional coordination of local and regional water supply efforts.153

INTEGRATE FLOW AND HABITAT RESTORATION TO BATTLE CLIMATE CHANGE
The decline of sediment inputs from reducing Bay inflows has contributed to the erosion of marshlands and beaches throughout the Bay estuary and nearby coastal areas. That problem is now greatly magnified by the effect of climate change on sea levels. Rising sea levels are a challenge to the continued existence and quality of the Bay estuary’s marshes and to life and property for human communities along the shoreline of the Bay and coastal areas. Significant efforts have been underway for decades to acquire and restore wetland areas around the estuary; more recently, there is serious interest in innovative approaches like combining marsh restoration with construction of earthen levees in order to establish a low-cost and effective regional network of flood barriers156. Providing for a more natural pattern of higher winter and spring inflows to the Bay will increase sediment resupply to restored marshes and “horizontal levees,” helping maintain them long after the initial construction effort. Restored freshwater and brackish marshes also need enough freshwater inflows at the right times of year to maintain their species composition and diversity. Marsh restoration and flood protection efforts, as well as beach rehabilitations, should consider flow regime requirements during design and evaluation of projects, and as part of the permitting process where appropriate.
WE MUST ACT NOWThe science overwhelmingly indicates that more freshwater flow, following a more natural pattern, must reach the San Francisco Bay estuary to restore its fish, wildlife, water quality, food web, marshes, beaches, coastal fisheries, and other public benefits. The only barriers to action are the general lack of understand-ing about the severely degraded condition of this freshwater flow-starved estuary and the lack of political will to change the unsustainable way California manages its water resources. Can Californians be made aware of the pending collapse of the Bay estuary ecosystem – and the loss of all which that ecosystem provides us – and motivated to demand action now? Can decision-makers at every level – federal, state, and local – be prevailed upon to take the steps necessary to prevent the destruction of California’s greatest aquatic ecosystems before it is too late? The window of opportunity to protect this treasure is closing rapidly.
60
Wetlands Photo Credit: David Sanger


ENDNOTES1 Conomos 1979; McKee et al. 2013; Barnard et al. 2013a; SFEP 20152 TBI 19983 Ibid.4 Stine 1994, 1996; Austin 20155 TBI 19986 SWRCB 20107 Richter et al. 20118 Florsheim and Dettinger 2015; SFEP 20159 Knowles 200210 Odum 1970; SFEP 201511 Jassby et al. 1995; Kimmerer 2002 a,b12 USFWS 1995; Dege and Brown 2004; Grimaldo et al. 200913 Feyrer et al. 2007, 2010; Sommer et al. 2011; IEP 201514 Kimmerer 2002 a,b 15 Cloern and Jassby 2012; SFEP 201516 Nichols et al. 1990, Alpine and Cloern 199217 Winder et al. 201118 Majardja et al. 201519 Lyons et al. 2005; Callaway et al. 200720 TBI 199821 Malamud-Roam and Ingram 2003; Malamud-Roam and Ingram 200422 Byrne et al. 200123 Sanderson et al. 2000; Stralberg et al. 201124 Callaway et al. 200725 Takekawa et al. 2006; Parker et al. 2011; Stralberg et al. 201126 Callaway et al. 200727 Goals Project 2015
28 Peterson et al. 199629 Stahle et al. 200130 Chang et al. 201431 Cloern 1983; Conomos et al. 197932 Pearson 198933 Hurst and Bruland 200834 Largier et al. 201135 Peterson et al. 199436 Fox et al. 199137 TBI 199838 Cloern et al. 201239 Largier 199640 Feyrer et al. 201541 NOAA 201542 McKee et al. 200243 PWA 2002 as cited in McKee et al. 200244 Schoellhamer 200945 Kondolf, 2000; McGrath 2001 pers comm as cited in McKee et al. 2002; SFEP 201546 Schoellhamer et al. 2013; SFEP 201547 Wright and Schoellhamer 200448 Barnard et al. 2013a49 Wright & Schoellhamer 2004; Cloern et al. 201150 IEP MAST 2015; Gregory 1993; Gregory and Levings 199851 Baskerville-Bridges 2004, Feyrer et al. 2007, Nobriga et al. 2008, Grimaldo et al. 2009, Sommer and Mejia 2013; Thompson et al. 201052 Nyman et al. 1990, Callaway et al. 2007
62

53 Stralberg et al. 201154 TBI 201355 Goals Project 199956 Barnard et al. 2013a57 Porterfield 198058 Barnard et al. 2013b and 2013c59 Tobias 201460 Nichols & Pamatmat 198861 Nichols et al. 198662 SFEI 201563 Leatherbarrow et al. 200464 Luoma and Presser 2009.65 Stewart 201366 Okamoto 201467 Ibid.68 Malbrouck and Kestemont 2006; Miller et al. 201069 Lehman et al. 2005; Berg and Sutula 201570 Lehman et al. 2010; UC Santa Cruz 201571 Berg and Sutula 201572 Sanderson et al. 2000; Stralberg et al. 2011; Callaway et al. 200773 Lyons et al. 2005, Callaway et al. 200774 Feyrer et al. 2015; Arthington 2012; SFEP 201575 Robins et al. 200676 Williams 2006; Cunningham et al. 201577 NMFS 200978 Jassby et al. 1995; Kimmerer 2002a79 Baxter et al. 1999; Kimmerer 2002a80 Jassby et al. 200281 Jassby and Cloern 2000 cited in Jassby 200882 Nichols et al. 1986, Cloern and Jassby 201283 Winder et al. 2011 and sources cited therein84 SOTER 2015
85 Jassby et al. 200286 Winder and Jassby 2010, Winder et al. 2011, Cloern and Jassby 201287 e.g., Kratville 2008; Nobriga and Rosenfield 2015.88 Peterson and Vassieriers 201089 Nichols et al. 1990, Winder et al. 201190 Moyle 2008, Berg and Sutula 2015; Mahardja et al. 201591 Lehman et al. 201092 Walters et al. 198593 Cloern 1996; Conomos et al. 197994 Conomos et al. 197995 Monismith, et al. 1996; Cloern 199696 Cloern et al. 1984; Cloern et al. 198997 Cloern 199698 Hurst and Bruland 200899 Bunn and Arthington 2002; Poff and Zimmerman 2010; Pearson 1989; CDFG 1992; Jassby et al. 1995; Baxter et al. 1999; Kimmerer 2002a; Monismith et al. 2002; Rosenfield and Baxter 2007; Sommer et al. 2007; Kimmerer et al. 2009; Feyrer et al. 2015100 SWRCB 2010; CDFG 2010; NRC 2010101 Stevens and Miller 1983; Jassby et al. 1995; Kimmerer 2002a, b; Mac Nally et al. 2010; Thomson et al. 2010102 Michel et al. 2015103 Rosenfield and Baxter 2007104 Nobriga and Rosenfield 2016105 Hughes et al. 2014106 Kimmerer 2002a107 Jassby et al. 1995; Kimmerer 2002a108 Baxter et al. 2010; Kimmerer 2002a; Jassby et al. 1995109 Pearson 1989110 Feyrer et al. 2010111 Jassby and Van Nieuwenhuyse 2005112 Healy 1991; Quinn 2005; Marston et al. 2012

113 TBI 2012114 Kimmerer 2008; Cunningham et al. 2015115 Nichols et al. 1990; Peterson and Vassieriers 2010; Mahardja et al. 2015116 Bennett 2005; J. Hobbs, U.C. Davis, personal communication, December 3, 2009117 Bennett 2005; Fisch et al. 2011118 Hilborn et al. 2003; Satterthwaite et al. 2014; Sturrock et al. 2015119 Lindley et al 2009120 TBI et al. 2010121 Feyrer et al. 2015122 Nobriga and Rosenfield 2015; Sturrock et al 2015; Stevens and Miller 1983123 Kimmerer 2006124 Kimmerer 2002a; T. Grenier pers. Comm. 2014125 e.g., Macarthur and Wilson 1967; Rosenfield 2002126 Kimmerer et al. 2009; Feyrer et al. 2007, 2010127 Grimaldo et al. 2009128 Marston et al. 2012129 Jassby and van Nieuwenhuyse 2005130 SWRCB 2010; CDFG 2010131 Cury et al. 2011132 Ford and Ellis 2006; Ford et al. 2010; Ward et al. 2009133 Audubon California 2016134 Cury et al. 2011135 Takekawa et al. 2006136 Byrne et al. 2001137 Jin 2008; Parker et al. 2011138 Takekawa et al. 2006139 e.g., American Sportfishing Association 2009 and PFMC 2015140 Lindley et al. 2009141 Ralston 2005142 Kimmerer 2002a143 Kohlhorst 1991; Israel et al. 2009
144 Ford and Ellis 2006; Ford et al. 2010; Ward et al. 2009145 Ford et al. 2010146 Miller et al. 2010147 Berg and Sutula 2015148 UC Santa Cruz 2015149 Governor’s Delta Vision Blue Ribbon Task Force, 2008; SWRCB 2010; NRC 2010; USEPA 2012150 TBI et al 2010, exhibit 1; SEP Group 2015, unpublished151 DWR 2013a; USBR 2012; USBR 2016152 Grantham and Viers 2014153 California Water Code Section 85021154 Pacific Institute and NRDC 2014155 CDWR 2013b156 ESA/PWA 2013
64

REFERENCESAlpine, A. E., and J. E. Cloern. 1992. Trophic interactions and direct physical effects control phytoplankton biomass and production in an estuary Limnology and Oceanography 37:946-955.
American Sportfishing Association. 2009. Economic Data Supports Efforts to Recover California’s Salmon Fisheries. Available at: http://asafishing.org/newsroom/news-releases/economic-data-supports-efforts-to-recover-californias-salmon-fisheries/
Arthington, A. H. 2012. Environmental Flows: Saving Rivers in the Third Millennium. UC Press.
Audubon California. 2016. Protecting bird habitat in the Bay-Delta region. Website: http://ca.audubon.org/protecting-bird-habitat-bay-delta-region
Austin, J. T. 2015. Floods and Droughts in the Tulare Lake Basin, 2nd edition. Sequoia Parks Conservancy, Three Rivers, California. (see also http://www.tulare-basinwatershed.org/latest-news/making-sense-water-tulare-basin)
Barnard, P.L., D.H. Schoellhamer, B. E. Jaffe, and L. J. McKee. 2013 (a). Sediment transport in the San Francisco Bay Coastal System: an overview. Marine Geology, Special Issue San Francisco Bay 345, 3–19
Barnard, P.L., L. H. Erikson, E. Elias, P. Dartnell. 2013 (b). Sediment transport patterns in the San Francisco Bay Coastal System from cross-validation of bedform asymmetry and modeled residual flux. Marine Geology, Special Issue San Francisco Bay 345, 74–97
Barnard, P.L., A. C. Foxgrover, E. P. L. Elias, L. H. Erikson, J. R. Hein, M. McGann, K. Mizell, R. J. Rosenbauer, P. W. Swarzenski, R. K. Takesue, F. L. Wong, and D. L. Woodrow. 2013 (c). Integration of bed characteristics, geochemical tracers, current measurements, and numerical modeling for assessing provenance of beach sand in the San Francisco Bay Coastal System. Marine Geology 345, 181–206
Baskerville-Bridges, B., J. C. Lindberg, and S. I. Doroshov. 2004. The effect of light intensity, alga concentration, and prey density on the feeding behavior of Delta smelt larvae. American Fisheries Society, Special Publication 39:219-228.
Baxter, R., R. Breuer, L. Brown, L. Conrad, F. Feyrer, S. Fong, K. Gehrts, L. Grimaldo, B. Herbold, P. Hrodey, A. Mueller-Solger, T. Sommer, and K. Souza. 2010. Pelagic Organism Decline Work Plan and Synthesis of Results. Interagency Ecological Program, Sacramento, CA.

Baxter, R., K. Hieb, S. DeLeon, K. Fleming, and J. Orsi. 1999. Report on the 1980-1995 Fish, Shrimp, and Crab Sampling in the San Francisco Estuary, California, Technical Report 63. Editor J. Orsi. California Department of Fish and Game, Stockton, CA, #3075994.
Bennett, W.A. 2005. Critical assessment of the Delta smelt population in the San Francisco Estuary, California. San Francisco Estuary and Watershed Science 3(2): [Article 1]. Available from: http://repositories.cdlib.org/jmie/sfews/vol3/iss2/art1
Berg, M., and M. Sutula. 2015. Factors affecting growth of cyanobacteria with special emphasis on the Sacramento-San Joaquin Delta. Southern California Coastal Water Research Project Technical Report No. 869. Prepared for: The Central Valley Regional Water Quality Control Board and The California Environmental Protection Agency State Water Resources Control Board (Agreement Number 12-135-250). Available at: http://ftp.sccwrp.org/pub/download/DOCUMENTS/TechnicalReports/869_FactorsAffectGrowthOfCyanobacteria-1.pdf
Bunn, S. E., and Arthington, A. H., 2002. Basic principles and ecological consequences of altered flow regimes for aquatic biodiversity. Environmental Management 30:492–507.
Byrne, R., B. L. Ingram, S. Starratt, F. Malamud-Roam, J. N. Collins, and M. E. Conrad. 2001. Carbon-isotope, diatom and pollen evidence for late Holocene salinity change in a brackish marsh in the San Francisco estuary. Quaternary Research 55:66–76.
California Department of Fish and Game (CDFG). 1992. Estuary Dependent Species. Exhibit WRINT-DFG-Exhibit # 6 entered by the California Department of Fish and Game for the State Water Resources Control Board 1992 Water Quality/Water Rights Proceedings on the San Francisco Bay/Sacramento – San Joaquin Delta.
California Department of Fish and Game (CDFG). 2010. Quantifiable Biological Objectives and Flow Criteriafor Aquatic and Terrestrial Species of Concern Dependent on the Delta. Report prepared pursuant to the Sacramento-San Joaquin Delta Reform Act of 2009.
California Department of Water Resources (DWR). 2013a. California Water Plan Update 2013: Investing in Innovation & Infrastructure. Bulletin 160-13.
California Department of Water Resources. 2013b. North-Of-The-Delta Offstream Storage Project EIR/EIS, Preliminary Administrative Draft (Chapter 31: Power, Production and Energy). Available at: http://www.water.ca.gov/storage/docs/NODOS%20Project%20Docs/NODOS_Prelim_Admin_Draft_EIR/31-Power_Energy_prelim_admin_draft_Dec2013_w_figures.pdf
California Water Code Section 85021
Callaway, J. C., V. T. Parker, M. C. Vasey, and L. M. Schile. 2007. Emerging issues for the restoration of tidal marsh ecosystems in the context of predicted climate change. Madroño 54(3):234–248.
66

Chang, A. L., A. K. Deck, P. D. Malm, K. Willits, S. Attoe, J. L. Fisher, and S. G. Morgan. 2014. Great place to live, but I wouldn’t want to raise my kids there: Linking habitat quality and population dynamics of Olympia oysters in San Francisco Bay. State of the Estuary Conference 2014. Handout for poster?
Cloern, J. E. 1984. Temporal dynamics and ecological significance of salinity stratification in an estuary (South San Francisco Bay, USA). Oceanologica Acra 7,137-141.
Cloern, JE. 1996. Phytoplankton bloom dynamics in coastal ecosystems: a review with some general lessons from sustained investigation of San Francisco Bay, California. Reviews of Geophysics 34:127-168
Cloern, J. E., A. E. Alpine, B. E. Cole, R. L. Wong, J. F. Arthur, and M. D. Ball. 1983. River discharge controls phytoplankton dynamics in the northern San Francisco Bay estuary. Estuarine, Coastal and Shelf Science 16:415-429.
Cloern, J. and A. Jassby. 2012. Drivers of change in estuarine-coastal ecosystems: discoveries form four decades of study in San Francisco Bay. Reviews of Geophysics, 50, RG4001, doi:10.1029/2012RG000397.
Cloern, J. E., N. Knowles, L. R. Brown, D. Cayan, M. D. Dettinger, T. L. Morgan, D. H. Schoellhamer, M. T. Stacey, M. van der Wegen, R. W. Wagner, and A. D. Jassby. 2011. Projected evolution of California’s San Francisco Bay-Delta-river system in a century of climate change. PLoS One 6:e24465.
Cloern, J. E., T. M. Powell, and L. M. Huzzey. 1989. Spatial and temporal variability in South San Francisco Bay (USA). II. Temporal changes in salinity, suspended sediments, and phytoplankton biomass and productivity over tidal time scales. Estuarine, Coastal and Shelf Science 28:599-613.
Conomos, T. J. 1979. Properties and circulation of San Francisco Bay waters. Pages 47-84 in T. J. Conomos, ed. San Francisco Bay: The Urbanized Estuary. Pacific Division, Amer. Assoc. Advance. Sci., San Francisco, Ca.
Cunningham, C., N. Hendrix, E. Dusek-Jennings, R. Lessard, and R. Hilborn. 2015. Delta Chinook Final Report to the Delta Science Panel.
Cury, P. M., I. L. Boyd, S. Bonhommeau, T. Anker-Nilssen, R. J. M. Crawford, R. W. Furness, J. A. Mills, E. J. Murphy, H. Österblom, M. Paleczny, J. F. Piatt, J.-P. Roux, L. Shannon, and W. J. Sydeman. 2011. Global Seabird Response to Forage Fish Depletion—One-Third for the Birds. Science 334:1703-1706.
Dege, M., and L. R. Brown. 2004. Effect of outflow on spring and summertime distribution of larval and juvenile fishes in the upper San Francisco Estuary. Pages 49–65 in F. Feyrer, L. R. Brown, R. L. Brown, and J. J. Orsi, editors. Early life history of fishes in the San Francisco estuary and watershed. American Fisheries Society, Symposium 39, Bethesda, Maryland.
ESA/PWA. 2013. Analysis Of The Costs And Benefits Of Using Tidal Marsh Restoration As A Sea Level Rise Adaptation Strategy In San Francisco Bay. Prepared for the Bay Institute.Available at: http://thebayinstitute.blob.core.windows.net/assets/FINAL%20D211228.00%20Cost%20and%20Benefits%20of%20Marshes%20022813.pdf

Feyrer, F., J. E. Cloern, L. R. Brown, M. A. Fish, K. A. Hieb, and R. D. Baxter. 2015. Estuarine Fish Communities Respond to Climate Variability over both River and Ocean Basins. Global change biology.
Feyrer, F., K. Newman, M. Nobriga, and T. Sommer. 2010. Modeling the Effects of Future Outflow on the Abiotic Habitat of an Imperiled Estuarine Fish. Estuaries and Coasts 34:120-128.
Feyrer, F., M. L. Nobriga, T. R. Sommer. 2007. Multidecadal trends for three declining fish species: habitat patterns and mechanisms in the San Francisco Estuary, California, USA. Canadian Journal Fisheries and Aquatic Sciences 64:723-734.
Fisch, K.M., J.M. Henderson, R.S. Burton, and B. May. 2011. Population genetics and conservation implications for the endangered delta smelt in the San Francisco Bay-Delta. Conservation Genetics 12:1421–1434.
Florsheim, J. L. and M. D. Dettinger. 2015. Promoting Atmospheric-River and Snowmelt-Fueled Biogeomorphic Processes by Restoring River-Floodplain Connectivity in California’s Central Valley. Chapter 6 in © Springer New York 2015 P. F. Hudson, H. Middelkoop (eds.), Geomorphic Approaches to Integrated Floodplain Management of Lowland Fluvial Systems in North America and Europe, DOI 10.1007/978-1-4939-2380-9_6.
Ford, J. K. B. & Ellis, G. M. 2006 Selective foraging by fish-eating killer whales Orcinus orca in British Columbia. Mar. Ecol. Prog. Ser. 316, 185 – 199. (doi:10.3354/ meps316185)
Ford JKB, Ellis GM, Olesiuk PF, Balcomb KC. 2010. Linking killer whale survival and prey abundance: food limitation in the oceans’ apex predator? Biology Letters 6: 139–142.
Fox, J.P., T.R. Mongan, and W.J. Miller. 1991. Long term annual and seasonal trends and surface salinity of San Francisco Bay. Journal of Hydrology 122:93-117.Goals Project. 1999. Baylands Ecosystem Habitat Goals. A report of habitat recommendations prepared by the San Francisco Bay Area Wetlands Ecosystem Goals Project. U.S. Environmental Protection Agency, San Francisco, Calif./S.F. Bay Regional Water Quality Control Board, Oakland, Calif.http://baylandsgoals.org/wp-content/uploads/2015/10/1999sfbaygoals031799.pdf
Goals project. 2015. The Baylands and Climate Change: What We Can Do. Baylands Ecosystem Habitat Goals Science Update 2015 prepared by the San Francisco Bay Area Wetlands Ecosystem Goals Project. California State Coastal Conservancy, Oakland, CA.
Governor’s Delta Vision Blue Ribbon Task Force, 2008. Our Vision for the California Delta.
Grantham, T.E., and J.H. Viers. 2014. 100 years of California’s water rights system: patterns, trends and uncertainty. Environmental Research Letters.
68

Grimaldo, L. F., T. Sommer. N. Van Ark, G. Jones, E. Holland, P. B. Moyle, and B. Herbold. 2009. Factors affecting fish entrainment into massive water diversions in a tidal freshwater estuary: can fish losses be managed? North American Journal of Fisheries Management 29:1253–1270.
Healy, M.C. 1991. Life history of Chinook salmon (Oncorhynchus tshawytscha), in Pacific salmon life histories, C. Groot and L. Margolis, editors, University of British Columbia Press, Vancouver, British Columbia, B.C. pp. 311-393.
Hilborn, R., Quinn, T.P., Schindler, D.E., and Rogers, D.E. 2003. Biocomplexity and fisheries sustainability. Proc. Natl. Acad. Sci. U.S.A.100(11): 65646568. doi:10.1073/pnas.1037274100.PMID:12743372.
Hughes, B. B., M. D. Levey, J. A. Brown, M. C. Fountain, A. B. Carlisle, S. Y. Litvin, C. M. Greene, W. N. Heady, and M. G. Gleason. 2014. Nursery Functions of U.S. West Coast Estuaries: The State of Knowledge for Juveniles of Focal Invertebrate and Fish Species. The Nature Conservancy, Arlington, VA. 168pp.
Hurst, M. P. and K. W. Bruland. 2008. The effects of the San Francisco Bay plume on trace metal and nutrient distributions in the Gulf of the Farallones. Geochimica et Cosmochimica Acta 72:395-411.
Interagency Ecological Program Management, Analysis and Synthesis Team (IEP MAST). 2015. An updated conceptual model of Delta Smelt biology: our evolving understanding of an estuarine fish. Technical Report 90.
Israel, J., A. Drauch, M. Gingras, and M. Donnellan. 2009. Life history conceptual model for White Sturgeon (Acipenser transmontanus). California Department of Fish and Game, Delta Regional Ecosystem Restoration and Implementation Program.
Jassby, A.D. 2008. Phytoplankton in the Upper San Francisco Estuary: Recent biomass trends, their causes and their trophic significance. San Francisco Estuary and Watershed Science 6:Article 2.
Jassby, A. D., J. E. Cloern, and B. E. Cole. 2002. Annual Primary Production: Patterns and Mechanisms of Change in a Nutrient-Rich Tidal Ecosystem. Limnology and Oceanography 47:698-712.
Jassby, A. D., W. J. Kimmerer, S. G. Monismith, C. Armor, J. E. Cloern, T. M. Powell, J. R. Schubel, and T. J. Vendlinski. 1995. Isohaline Position as a Habitat Indicator for Estuarine Populations. Ecological Applications 5:272-289.
Jassby, A. D. and E. E. Van Nieuwenhuyse. 2005. Low dissolved oxygen in an estuarine channel (San Joaquin River, California): Mechanisms and models based on long-term time series. San Francisco Estuary and Watershed Science 2:1–33.
Jin, C. 2008. Biodiversity dynamics of freshwater wetland ecosystems affected by secondary salinisation and seasonal hydrology variation: a model-based study. Hydrobiologia 598:257-270.
Kimmerer, W. J. 2002a. Effects of freshwater flow on abundance of estuarine organisms: Physical effects or trophic linkages? Marine Ecology Progress Series 243:39-55.
Kimmerer, W.J. 2002b. Physical, biological, and management responses to variable freshwater flow into the San Francisco Estuary. Estuaries 25:1275–1290.
Kimmerer, W. 2006. Response of anchovies dampens effects of the invasive bivalve Corbula amurensis on the San Francisco Estuary foodweb. Marine Ecology Progress Series 324:218.
Kimmerer, W.J. 2008. Losses of Sacramento River Chinook salmon and Delta smelt to entrainment in water diversions in the Sacramento-San Joaquin Delta. San Francisco Estuary and Watershed Science 6(2). http://www.escholarship.org/uc/ item/7v92h6fs/. Accessed April 2015
Kimmerer, W. J., E. S. Gross, and M. L. MacWilliams. 2009. Is the Response of Estuarine Nekton to Freshwater Flow in the San Francisco Estuary Explained by Variation in Habitat Volume? Estuaries and Coasts 32:375-389.
Knowles, N. 2002. Natural and management influences on freshwater inflows and salinity in the San Francisco Estuary at monthly to interannual scales. Water Resources Research: 38: 25-21-25-11.
Kohlhorst, D.W., L.W. Botsford, J. S. Brennan, and G. M. Caillet. 1991. Aspects of the structure and dynamics of an exploited central California population of white sturgeon(Acipenser transmontanus). Acipenser, P. Williot., Ed. CEMAGREF Publ., 277-293.
Kondolf, G. 2000. Changes in flow regime and sediment budget in the Sacramento-San Joaquin river system since 1850: implications for restoration planning.in CALFED Bay-Delta Program Science Conference 2000 Abstracts.
Kratville, D. 2008. Final Species Life History Conceptual Model Sacramento Splittail, Pogonichthys macrolepidotus. Sacramento-San Joaquin DeltaRegional Ecosystem Restoration Implementation Plan, California Department of Fish and Wildlife, Ecosystem Restoration Program.
Largier, J. 1996. Hydrodynamic exchange between San Francisco Bay and the Ocean: The role of ocean circulation and stratification. In San Francisco Bay: The ecosystem. Pacific Division, American Association for the Advancement of Science, 69-104.
Largier, J., B. Cheng, and K. Higgason. 2011. Climate Change Impacts: Gulf of the Farallones and Cordell Bank National Marine Sanctuaries.Report of a Joint Working Group of the Gulf of the Farallones and Cordell Bank National Marine Sanctuaries Advisory Councils. Page 121 in Marine Sanctuaries Conservation Series ONMS-11-04. National Oceanic and Atmospheric Administration, Office of National Marine Sanctuaries, Silver Spring, Maryland.
Leatherbarrow J., McKee L., Ganju N., Schoellhamer D., Flegal R. July 25 2003. Presentation to RMP Sources, Pathways, and Loadings Workgroup: Quantifying loads of sediment and contaminants entering San Francisco Bay from the Central Valley: The Mallard Island Study http://www.sfei.org/sites/default/files/SPLWG_july2003_Item3a.pdf
70

Lehman, P., G. Boyer, C. Hall, S. Waller, and K. Gehrts. 2005. Distribution and toxicity of a new colonial Microcystis aeruginosa bloom in the San Francisco Bay Estuary, California. Hydrobiologia 541:87-99.
Lindley, S.T., C.B. Grimes, M.S. Mohr, W. Peterson, J. Stein, J.T. Anderson, L.W. Botsford, D.L. Bottom, C.A. Busack, T.K. Collier, J. Ferguson, J.C. Garza, A.M. Grover, D.G. Hankin, R.G. Kope P.W. Lawson, A. Low, R.B. MacFarlane, K. Moore, M. Palmer-Zwahlen, F.B. Schwing, J. Smith, C. Tracy, R. Webb, B.K. Wells, and T.H. Williams. 2009. What caused the Sacramento River fall Chinook salmon collapse? NOAA Technical Memorandum. NOAA-TM-NMFS-SWFSC-447. US Department of Commerce.
Luoma, Samuel N. and Presser, Theresa S. 2009. Emerging Opportunities in Management of Selenium Contamination. Environ. Sci. Technol. 43: 8483-8487.
Lyons, K. G., C. A. Brighham, B. H. Traut, and M. Schwartz. 2005. Rare species and ecosystem functioning. Conservation Biology 19:1019-1024.
MacArthur, R.H. and E.O. Wilson. 1967. The Theory of Island Biogeography. Princeton University Press. Princeton, NJ.
Mac Nally, R., J. R. Thomson, W. J. Kimmerer, F. Feyrer, K. B. Newman, A. Sih, W. A. Bennett, L. Brown, E. Fleishman, S. D. Culberson, and G. Castillo. 2010. Analysis of pelagic species decline in the upper San Francisco Estuary using multivariate autoregressive modeling (MAR). Ecological Applications 20:1417-1430.
Mahardja, B., J. L. Conrad, L. Lusher, and B. Schreier. 2015. Abundance trends, distribution, and habitat associations of the invasive Mississippi Silverside (Menidia audens) in the Sacramento-San Joaquin Delta. Submitted to San Francisco Estuary and Watershed Science.
Malamud-Roam, F., and B. L. Ingram. 2003. Holocene sediment records from San Francisco Estuary tidal marshes and their relevance to California paleo-climate variability. Page 213 in XVI Congress of the International Union for Quaternary Research; shaping the Earth; a Quaternary perspective. International Union.
Malamud-Roam, F., and B. L. Ingram. 2004. Late Holocene δ13C and pollen records of paleosalinity from tidal marshes in the San Francisco Bay estuary, California. Quaternary Research 62:134-14.
Malbrouck, C. & and P. Kestemont, 2006. Effects of microcystins on fish. Environmental Toxicology and Chemistry 25: 72–86.
Marston, D. Mesick, C. Hubbard, A., Stanton, D., Fortmann-Roe, S., Tsao, S., and Heyne, T. 2012. Delta Flow Factors Influencing Stray Rate of Escaping Adult San Joaquin River Fall-Run Chinook Salmon (Oncorhynchus tshawytscha). San Francisco Estuary and Watershed Science, 10(4). Permalink: http://www.eschol-arship.org/uc/item/6f88q6pf
McGrath 2001. James McGrath, Port of Oakland, oral comm., December 2001 as cited in McKee et al. 2002.

McKee, L., N. Ganju, D. Schoellhamer, J. Davis, D. Yee, J. Leatherbarrow, and R. Hoenicke. 2002. Estimates of Suspended-sediment Flux Entering San Francisco Bay from the Sacramento and San Joaquin Delta. SFEI Contribution 65.
McKee, L.J., Lewicki, M., Schoellhamer, D.H., and Ganju, N.K., 2013. Comparison of sediment supply to San Francisco Bay from Coastal and Sierra Nevada watersheds. Marine Geology 345:47–62.
Michel, C. J., A. J. Ammann, S. T. Lindley, P. T. Sandstrom, E. D. Chapman, M. J. Thomas, G. P. Singer, A. P. Klimley, and R. B. MacFarlane. 2015. Chinook salmon outmigration survival in wet and dry years in California’s Sacramento River. Canadian Journal of Fisheries and Aquatic Sciences.
Miller M.A., R.M. Kudela, A. Mekebri, D. Crane, S. C. Oates, et al. 2010. Evidence for a Novel Marine Harmful Algal Bloom: Cyanotoxin (Microcystin) Transfer from Land to Sea Otters. PLoS ONE 5(9): e12576. doi:10.1371/journal.pone.0012576.
Monismith, S., Burau, J.R., and Stacey, M., 1996. Stratification dynamics and gravitational circulation in northern San Francisco Bay, In Hollibaugh, J.T., (ed.), San Francisco Bay: The Ecosystem. Pacific Division of the American Association for the Advancement of Science, San Francisco, p. 123–153. Available from http://www.waterboards.ca.gov/waterrights/water_issues/programs/bay_delta/docs/cmnt091412/sldmwa/monismith_etal_1996.pdf
Monismith, S. G., W. Kimmerer, J. R. Burau, and M. T. Stacey. 2002. Structure and Flow-Induced Variability of the Subtidal Salinity Field in Northern San Francisco Bay. Journal of Physical Oceanography [J. Phys. Oceanogr.]. 32:3003-3019.
Moyle, P. B. 2008. The Future of Fish in Response to Large-Scale Change in the San Francisco Estuary, California. American Fisheries Society Symposium 64:357-374.
National Marine Fisheries Service (NMFS). 2009. Central Valley Salmon Recovery Plan – public Draft.
National Oceanic and Atmospheric Administration (NOAA). 2015. 2015 Elevated California Sea Lions Strandings in California: FAQs. Available at http://www.westcoast.fisheries.noaa.gov/mediacenter/faq_2015_ca_sea_lion_strandings.pdf
National Research Council (NRC). 2010. A Scientific Assessment of Alternatives for Reducing Water Management Effects on Threatened and Endangered Fishes in California’s Bay Delta. Committee on Sustainable Water and Environmental Management in the California Bay-Delta; ISBN: 0-309-12803-X, 104 pages.
Nichols, F. H., J. E. Cloern, S. N. Luoma, and D. H. Peterson. 1986. The Modification of an Estuary. Science 231:567-573.
Nichols, F.H., J.K. Thompson, and L.E. Schemel. 1990. Remarkable invasion of San-Francisco Bay (California, USA) by the Asian clam Potamocorbula amurensis. 2. Displacement of a former community. Marine Ecology Progress Series 66: 95–101.
72

Nichols, Frederic H. & Pamatmat, Mario M. 1988. The Ecology of the soft-bottom benthos of San Francisco Bay: A community profile. USFWS Biological Report 85(7.19). 73 pp. Available at http://www.nwrc.usgs.gov/techrpt/85-7-23.pdf
Nobriga, M. L., and J. A. Rosenfield. 2016. Population Dynamics of an Estuarine Forage Fish: Disaggregating Forces Driving Long-Term Decline of Longfin Smelt in California’s San Francisco Estuary. Transactions of the American Fisheries Society 145:44-58.
Nobriga, M.L., T.R. Sommer, F. Feyrer, and K. Fleming. 2008. Long-term Trends in summertime habitat suitability for Delta smelt (Hypomesus transpacificus). San Francisco Estuary and Watershed Science. 6(1):, Article 1.
Nyman, J., R. DeLaune, and W. Patrick. 1990. Wetland soil formation in the rapidly subsiding Mississippi River deltaic plain: Mineral and organic matter relation-ships. Estuarine, Coastal and Shelf Science 31:57-69.
Odum, W.E. 1970. Insidious alteration of the estuarine environment. Trans. Am. Fish Soc., 88, 836-847.
Okamoto, A.R. 2014. Shifts in selenium spike. Estuary News, June 2014, Vol. 23 No. 2.
Pacific Fishery Management Council (PFMC). 2015. Stock Assessment and Fishery Evaluation (SAFE) Documents: Review of 2015 Ocean Salmon Fisheries, Appendix D: Historical Economic Data. Available at: http://www.pcouncil.org/wp-content/uploads/2016/02/salsafe2015_Appendix_D.pdf
Pacific Institute and Natural Resources Defense Council (NRDC). 2014. The untapped potential of CA’s water supply. available at: http://pacinst.org/publication/ca-water-supply-solutions/
Parker, V. T., J. C. Callaway, L. M. Schile, M. C. Vasey, and E. R. Herbert. 2011. Climate Change and San Francisco Bay-Delta Tidal Wetlands. San Francisco Estuary and Watershed Science 9.
Pearson, D.E. 1989. Survey of fishes and water properties of South San Francisco Bay, California, 1973-1982. NOAA-NMFS Technical Report 78.
Peterson, D.H., D.R. Cayan, J. DiLeo, M. Noble, and M. Dettinger, 1994. The role of climate in estuarine variability. American Scientist, 83, 58-67. (27)
Peterson, D. H., D. R. Cayan, M. D. Dettinger, M. A. Noble, L. G. Riddle, L. E. Schemel, R. E. Smith, R. J. Uncles AND R. A. Walters. 1996. San Francisco Bay Salinity: Observations, Numerical Simulation, and Statistical Models.
Peterson, H. and Vayssieres, M. 2010. Benthic Assemblage Variability in the Upper San Francisco Estuary: A 27-Year Retrospective. San Francisco Estuary and Watershed Science, 8(1). Available at: http://escholarship.org/uc/item/4d0616c6

Poff, N.L., Zimmerman, J.K.H., 2010. Ecological responses to altered flow regimes: a literature review to inform the science and management of environmental flows. Freshw. Biol. 55, 194–205.
Porterfield, G. 1980. Sediment transport of streams tributary to San Francisco, San Pablo, and Suisun Bays, California, 1909–1966. U.S. Geolological Survey Water Resour. Invest. Rep., 80‐64, 91 pp.
PWA 2002. Phillip Williams, Phillip Williams & Associates, oral comm., March 2002 as cited in McKee et al. 2002 (PWA 2002).
Quinn, T.P., 2005. The behavior and ecology of Pacific salmon and trout. Seattle: University of Washington Press.
Ralston, S. 2005. An assessment of starry flounder off California, Oregon, and Washington. NOAA Fisheries, Southwest Fisheries Science Center.
Richter, B. D., M. M. Davis, C. Apse, and C. Konrad. 2011. A presumptive standard for environmental flow protection. River Research and Applications 28:1312-1321.
Robins J., Mayer D, Stauton-Smith J, Halliday I, Sawynok B, Sellin M. 2006. Variable growth rates of the tropical estuarine fish barramundi Lates calcarifer (Bloch) under different freshwater flow conditions. Journal of Fish Biology 69:379-391.
Rosenfield, J. A. 2002. Pattern and process in the geographical ranges of freshwater fishes. Global Ecology and Biogeography 11:323-332.
Rosenfield, J. A., and R. D. Baxter. 2007. Population dynamics and distribution patterns of longfin smelt in the San Francisco estuary. Transactions of the American Fisheries Society 136:1577-1592.
Sanderson, E. W, S. L. Ustin, and T. Foin. 2000. The influence of tidal channels on the distribution of salt marsh plant species in Petaluma Marsh, CA, USA. Plant Ecology 146:29-41.
San Francisco Estuary Institute (SFEI). 2015. The Pulse of the Bay: The State of Bay Water Quality, 2015 and 2065. SFEI Contribution #759. San Francisco Estuary Institute, Richmond, CA. Available at: http://www.sfei.org/sites/default/files/biblio_files/2015_RMP_PULSE.pdf
San Francisco Estuary Partnership (SFEP). 2015. The State of the Estuary Report (SOTER).
Satterthwaite, W.H., S.M. Carlson, S.D. Allen-Moran, S. Vincenzi, S.J. Bograd, B.K. Wells. 2014. Match-mismatch dynamics and the relationship between ocean-entry timing and relative ocean recoveries of Central Valley fall run Chinook salmon. Marine Ecology Progress Series. 511: 237–248.
74

Scientific Evaluation Process (SEP) Group. unpublished. Interim objectives for restoring Chinook salmon (Oncorhynchus tshawytscha) and O. myiss in the Stanislaus River, Administrative Draft. (The SEP Group includes scientific experts from American Rivers, The Bay Institute, The Nature Conservancy, Trout Unlimited, and state and federal agencies). September 2015.
Schoellhamer, D. 2009. Suspended sediment in the Bay: Past a tipping point. Oakland, CA: San Francisco Estuary Institute, 56–65. Available: http://www.sfei.org/sites/default/files/RMP_Pulse09_no583_final4web.pdf.
Schoellhamer, D. H., S. A. Wright, J. Z. Drexler. 2013. Adjustment of the San Francisco estuary and watershed to decreasing sediment supply in the 20th century. Marine Geology 345:63-71.
Sommer, T., C. Armor, R. Baxter, R. Breuer, L. Brown, M. Chotkowski, S. Culberson, F. Feyrer, M. Gingras, B. Herbold, W. Kimmerer, A. Mueller-Solger, M. Nobriga, and K. Souza. 2007. The collapse of pelagic fishes in the Upper San Francisco Estuary. Fisheries (Bethesda) 32:270-277.
Sommer, T., F. H. Mejia, M. L. Nobriga, F. Feyrer, and L. Grimaldo. 2011. The spawning migration of delta smelt in the upper San Francisco Estuary. San Francisco Estuary and Watershed Science 9.
Sommer, T., and F. Mejia. 2013. A place to call home: a synthesis of delta smelt habitat in the upper San Francisco Estuary. San Francisco Estuary and Watershed Science 11(2). Available at: http://www.escholarship.org/uc/ item/32c8t244.
Stahle, D. W., M. D. Therrell, and M. K. Cleaveland. 2001. Ancient Blue Oaks Reveal Human Impact on San Francisco Bay Salinity. EOS, Transactions of the American Geophysical Union 82:141-145.
State Water Resources Control Board (SWRCB). 2010. Development of Flow Criteria for the Sacramento- San Joaquin Delta Ecosystem. Prepared Pursuant to the Sacramento-San Joaquin Delta Reform Act of 2009. http://www.waterboards.ca.gov/waterrights/water_issues/programs/bay_delta/deltaflow/docs/final_rpt080310.pdf
Stewart, A.R., Luoma, S.N., Elrick, K.A., Carter,J.L., and van der Wegen, M. 2013. Influence of estuarine processes on spatiotemporal variation in bioavailable selenium. Marine Ecology Progress Series 492:41-56.
Stevens, D.E. & and L.W. Miller. 1983. Effects of river flow on abundance of young Chinook salmon, American shad, longfin smelt, and delta smelt in the Sacra-mento-San Joaquin River system. North American Journal of Fisheries Management 3:425-437.
Stine, S. 1994. Extreme and persistent drought in California and Patagonia during mediaeval time. Letters to Nature, Department of Geography and Environmen-tal Studies, California State University, Hayward, California, v. 369.
Stine, S. 1996. Climate, 1650-1850. In Sierra Nevada Ecosystem Project (SNEP): Final Report to Congress. Vol. II: Assessments and Scientific Basis for R-37 Management Options. University of California. Wildland Resources Center Report No. 37. University of California, Davis, CA. 1528 pp.
Stralberg, D., M. Brennan, J.C. Callaway, J. K. Wood, L. M. Schile, D. Jongsomjit, M. Kelly, T. Parker, and S. Crooks, 2011. Evaluating Tidal Marsh Sustainability in the Face of Sea Level Rise: A Hybrid Modeling Approach Applied to San Francisco Bay. PLoS ONE 6(11).
Sturrock, A. M., J. D. Wikert, T. Heyne, C. Mesick, A. E. Hubbard, T. M. Hinkelman, P. K. Weber, G. E. Whitman, J. J. Glessner, and R. C. Johnson. 2015. Recon-structing the Migratory Behavior and Long-Term Survivorship of Juvenile Chinook Salmon under Contrasting Hydrologic Regimes. PLoS One 10:e0122380.
Takekawa, J. W., H. Spautz, N. Nur, J. L. Greenier, K. Malamud-Roam, J. C. Nordby, A. Cohen, F. Malamud-Roam, and S. E. Wainwright-De la Cruz. 2006. Environmental threats to tidal marsh vertebrates of the San Francisco Bay Estuary. Studies in Avian Biology 32:176-197.
The Bay Institute (TBI). 1998. From the Sierra to the Sea: The Ecological History of the San Francisco Bay-Delta Watershed. Available at www.bay.org/publica-tions/from -the-sierra-to-the-sea-the-ecological-history-of-the-san-francisco-bay-delta-waters
The Bay Institute (TBI). 2010. Gone with the Flow. Available at http://www.thebayinstitute.org/resources/publications/gone-with-the-flow
The Bay Institute (TBI). 2012. Collateral Damage. Available at http://www.thebayinstitute.org/resources/publications/collateral-damage
The Bay Institute, American Rivers, Environmental Defense Fund, Natural Heritage Institute, and Natural Resources Defense Council. [TBI et al. 2010 exhibits 1-4]. 2010. Written Testimony of Jonathan Rosenfield, Christina Swanson, John Cain, et al. Before the State Water Resources Control Board, Exhibits 1-4, summary, and closing comments. Available at: http://www.bay.org/publications/flow-criteria-for-the-delta-ecosystem
Thomson, J. R., W. J. Kimmerer, L. R. Brown, K. B. Newman, R. Mac Nally, W. A. Bennett, F. Feyrer, and E. Fleishman. 2010. Bayesian change point analysis of abundance trends for pelagic fishes in the upper San Francisco Estuary. Ecological Applications 20:1431-1448.
Tobias, Jimmy. September 16, 2014. Ocean Beach’s Sand Supply Dries Up, Leaving Plovers Squeezed. Bay Nature. Available at http://baynature.org/article/ocean-beachs-sand-supply-dries-leaving-plovers-stranded/
U.S. Bureau of Reclamation (USBR). 2012. 2012 deliveries summary. Available at: http://www.usbr.gov/mp/cvo/12deliv.html
U.S. Bureau of Reclamation (USBR). 2016. New Melones operations modeling spreadsheet.
U.S. Environmental Protection Agency USEPA). 2012. Water Quality Challenges in the San Francisco Bay/Sacramento-San Joaquin Delta Estuary: EPA’s Action Plan.
76

U.S. Fish and Wildlife Service (USFWS). 1995a. Recovery plan for the Sacramento/San Joaquin Delta native fishes.
University of California, Santa Cruz. 2015. Assessing SPATT in San Francisco Bay. SFEI Contract 1051. Final Report. Submitted to San Francisco Estuary Institute. Available at: http://sfbaynutrients.sfei.org/sites/default/files/SPATT Final Report May2015.pdf
Walters, R.A., Cheng, R.T., Conomos, T.J. 1985. Time scales of circulation and mixing processes of San Francisco Bay waters. Hydrobiologia 129, 13-36.
Ward, E. J., E. E. Holmes, and K. C. Balcomb. 2009. Quantifying the effects of prey abundance on killer whale reproduction. Journal of Applied Ecology 46: 632–640.
Williams, J. G. 2006. Central Valley Salmon: A Perspective on Chinook and Steelhead in the Central Valley of California. San Francisco Estuary and Watershed Science 4.
Winder, M., and A. D. Jassby. 2010. Shifts in zooplankton community structure: Implications for food-web processes in the upper San Francisco Estuary, Estuaries Coasts, 34(4), 675–690, doi:10.1007/s12237-010-9342
Winder, M., A. D. Jassby, and R. Mac Nally. 2011. Synergies between climate anomalies and hydrological modifications facilitate estuarine biotic invasions, Ecol. Lett., 14, 749–757, doi:10.1111/j.1461-0248.2011.01635.x
Wright, S.A., D.H. Schoellhamer. 2004. Trends in the sediment yield of the Sacramento River, California, 1957–2001. San Francisco Estuary and Watershed Science 2 (2).

GLOSSARY
78
AbundanceThe number of individuals in a population. Often measured as an index calculated based on the number of individuals detected per sample.
Actual Flow or RunoffThe amount of fresh water flowing past a point, measured or calculated at that point or calculated based as the sum of upstream measurements throughout a watershed; in contrast to unimpaired flow or runoff (see below).
Acre Foot (AF) The amount of water required to cover 1 acre to a depth of 1 foot (approx. the area of an American football field). An acre-foot is approximately 326,000 gallons or 1,233.5 cubic meters.
AlgaeChlorophyll containing single or multi-celled organisms that lives in fresh or salt water.
Anadromous FishFish that are born in freshwater, migrate to the ocean, and return to fresh water in order to as adults to spawn. Anadromous fish in the Bay’s watershed include Chinook salmon, steelhead, striped bass, white sturgeon, green sturgeon, and American shad.
AquiferAn underground geological formation that holds water.
Bay A body of water connected to an ocean or lake, formed by an indentation of the shoreline.

Bay InflowFreshwater flows to San Francisco Bay, originating upstream from its Central Valley watershed, measured or estimated where the Delta enters Suisun Bay (the uppermost portion of San Francisco Bay), and not including the relatively small amount of flow from the local watersheds directly surrounding the Bay.
BenthicBottom-dwelling. Refers to organisms that live on the bottom of a water body or the habitat along the bed of a river, estuary, lake, or sea.
Brackish waterSlightly salty water, characteristic of estuarine habitats.
Central Valley Project (CVP) The federally operated water storage, diversion, and conveyance system that provides water from California’s Central Valley and the Trinity River to agricultural, municipal, and industrial users in the Central Valley and Bay Area. Major facilities include Shasta, Trinity, Folsom, Friant, and New Melones Dams (and their reservoirs), the Delta Cross Channel, the Delta-Mendota Canal, the Jones (Tracy) Pumping Plant, and San Luis Reservoir among others.
CFSCubic feet per second, a rate of flow measured as a volume of water (cubic feet) passing a point in one second. A flow of 1cfs equals about 2 acre-feet per day or enough to fill a 32-gallon trashcan in just over 4 seconds.
DeltaThe uppermost portion of the San Francisco Bay estuary, the Delta is the roughly triangular area formed at the western edge of the Central Valley by the confluence of the Sacramento and San Joaquin Rivers. Bay inflow from the Central Valley passes through the Delta as do numerous types of migratory fish species.
DiversionSee “Water Diversion”

80
DroughtAn extended period, lasting more than one year, during which precipitation and runoff is well below average. Different from the seasonal drought experienced in California every year from late spring through early fall when very little or no rain falls.
EcosystemThe biological and abiotic (non-living) parts of the environment in a particular area and the interaction of those parts.
Endangered SpeciesSpecies or distinct populations of plants and animals that are protected by federal or state laws that are specifically intended to prevent extinction and to protect habitats of those species.
ErosionThe wearing away of the land surface by wind or water.
ExportSee “Water Export”
EstuaryA partly enclosed coastal body of brackish water with one or more rivers or streams flowing into it, and with a free connection to the open ocean. Estuaries are formed by the mixing of fresh water and saline water and represent a transition zone between river environments and marine environments.
HabitatThe physical, chemical, and biological context within which an organism or assemblage of organisms live.
Harmful algal bloom (HAB, aka Toxic algal bloom) A proliferation of cyanobacteria that cause negative impacts to other organisms via natural production of toxins.
Introduced (or “exotic”) speciesPopulations of plants and animals that are not native to a specific area, which become established and self-sustaining after individuals have been transported into an ecosystem intentionally or unintentionally. Introduced species may alter the natural ecology of an area, via competition for resources, alteration of ecosystem processes and native habitats, and/or predation on native species.

MicrocystisA genus of cyanobacteria that lives in fresh water and produces a powerful toxin (microcystin).
MAFMillion acre-feet.
NutrientAny substance, which enhances the growth of plants and animals.
Pacific FlywayA major north-south corridor for migratory birds on the west coast of the Americas, extending from Alaska to Patagonia. Every year, migratory birds travel some or all of this distance both in spring and in fall, following food sources, heading to breeding grounds, or travelling to overwintering sites.
PlanktonA diverse group of organisms that live in the water column of large bodies of water and that cannot swim against a current. Includes photosynthet-ic organisms (phytoplankton) and tiny primary consumers (zooplankton). They provide a crucial source of food to many large aquatic organisms, such as fish and whales.
Population Viability The ability of a population to persist and to avoid extinction. The viability of a population reflects the number of individuals, changes in the birth rate, mortality rate, fecundity, genetic and life-history diversity of individuals in a population, and geographic distribution.
ProductivityRelates to factors such as birth, maturation, and death rates that determine a population’s growth rate.
Residence TimeThe average amount of time that a moving particle (e.g., molecule of water) spends in a particular area.
RunoffThe portion of precipitation that enters surface waters during a given period of time. In California, on average about one-third of the precipitation becomes runoff while the rest is “consumed” – evaporated and transpired – by plants or evaporated from the ground.

SalmonA common name for at least six species of fish. Four races of Chinook salmon reproduce in the rivers of the Central Valley – more distinct populations of this species than in any other single watershed in their range. Named for the time of year during which they re-enter freshwater and begin their migration upstream to spawn, these races (or “runs”) are the spring, fall, late-fall and winter runs.
Salinity GradientThe spatial distribution of the range of salinities between fresh and marine that is one of the defining characteristics of any estuarine ecosystem. This gradient generates a range of habitats and ecological assemblages composed of organisms with different tolerances for salinity.
San Francisco BayThe central portion of the Bay estuary, composed of the open water embayments (from north to south, Suisun, San Pablo, Central and South Bays) upstream of the Golden Gate and downstream from the Delta.
San Francisco Bay EstuaryThe area – of which San Francisco Bay is the central region – where fresh water and salt water mix, from the tidally influenced portions of the Sacramento – San Joaquin Delta where river flows enter the estuary to local nearshore waters in the Gulf of the Farallones outside the Golden Gate.
SedimentFine soil or mineral particles that settle to the bottom of the water or are suspended in the water.
Spatial DistributionThe arrangement of a population in space. Not to be confused with dispersal, which is the movement of individuals away from the area where they were born. Distribution patterns can change throughout a species’ life cycle – the population is generally considered to be at greatest risk when its geographic range is most limited or in life stages that are least mobile.
State Water Project (SWP)The state-operated water storage, diversion, and conveyance system that provides water from the Feather River and “surplus” water to agricultur-al, municipal, and industrial users. Major facilities include Oroville Dam and Reservoir, the Banks Delta Pumping Plant, the California, South Bay, and North Bay Aqueducts, San Luis Reservoir, and Castaic Lake.
82

TAFThousand acre-feet.
Toxic Algal Blooms (see Harmful Algal Blooms)
Trophic LevelsThe relative position an organism occupies in a food web – what it eats and what eats it. The word trophic derives from the Greek trophē referring to food or feeding. Phytoplankton are primary producers. Organisms that eat phytoplankton are primary consumers. Organisms that eat animals (either as part of their diet or exclusively) are secondary consumers. These organisms all exist at different trophic levels. Individuals may change trophic levels as they pass through different life stages.
TurbidityThe cloudiness or haziness of water caused by tiny particles -- similar to smoke in air. Turbidity is roughly the opposite of water clarity.
Unimpaired Flow or RunoffQuantity of water that would have flowed passed a point without upstream dams or water diversions (which would “impair” the runoff from reaching that point). Unimpaired runoff is calculated with existing land use (but without dams and diversions) and does not assume that the landscape has been returned to its historic, “natural” state.
WatershedThe total land surface that drains water to a particular waterbody.
Water DiversionRemoval of water from its natural course in order to serve human purposes (e.g., agricultural irrigation).
Water ExportA specific type of water diversion where water is removed from its watershed of origin and transported to an entirely different watershed or moved back upstream in the same watershed. The largest export project involves pumping water from the Delta portion of the San Francisco Bay Estuary via the State Water Project and federal Central Valley Project pumps to the San Joaquin Valley and Southern California.

WetlandsAreas where saturation with water is the dominant factor determining the nature of soil development. These areas can be identified, even when soils are temporarily drier, by unique plants that have adapted to oxygen-deficient (anaerobic) soils. Wetlands may be very productive and diverse habitats and influence the rate of flow and water quality in adjacent environments.