SAN FRANCISCO 49ERS 49ERS NFL COMPOSITE RECORDS · san francisco 49ers 2017 season 430 media guide...
95
SAN FRANCISCO 49ERS MEDIA GUIDE 2017 SEASON 430 CURRENT NFC TEAMS OPPONENT REG. SEASON PLAYOFFS TOTAL Arizona 29-22 - 29-22 Atlanta 46-30-1 1-1 47-31-1 Carolina 7-12 1-0 8-12 Chicago 30-31-1 3-0 33-31-1 Dallas 15-12-1 2-5 17-17-1 Detroit 36-27-1 1-1 37-28-1 Green Bay 27-31-1 3-4 30-35-1 L.A. Rams 67-64-3 1-0 68-64-3 Minnesota 19-21-1 4-1 23-22-1 New Orleans 47-26-2 1-0 48-26-2 N.Y. Giants 15-16 4-4 19-20 Philadelphia 18-12-1 1-0 19-12-1 Seattle 15-21 0-1 15-22 Tampa Bay 17-5 0-1 17-6 Washington 17-9-1 3-1 20-10-1 CURRENT AFC TEAMS OPPONENT REG. SEASON PLAYOFFS TOTAL Baltimore 2-3 0-1 2-4 Buffalo 6-6 - 6-6 Cincinnati 9-4 2-0 11-4 Cleveland 7-12 - 7-12 Denver 6-7 1-0 7-7 Houston 2-1 - 2-1 Indianapolis 18-25 - 18-25 Jacksonville 2-2 - 2-2 Kansas City 7-5 - 7-5 L.A. Chargers 6-7 1-0 7-7 Miami 5-7 1-0 6-7 New England 8-5 - 8-5 N.Y. Jets 10-3 - 10-3 Oakland 6-7 - 6-7 Pittsburgh 11-10 - 11-10 Tennessee 8-5 - 8-5 49ERS NFL COMPOSITE RECORDS (1950-PRESENT) YEAR RECORD FINISH 1970 11-4-1 NFC West Champions 1971 10-6 NFC West Champions 1972 8-6-1 NFC West Champions 1981 16-3 Super Bowl XVI Champions 1983 11-7 NFC West Champions 1984 18-1 Super Bowl XIX Champions 1986 10-6-1 NFC West Champions 1987 13-3 NFC West Champions 1988 13-6 Super Bowl XXIII Champions 1989 17-2 Super Bowl XXIV Champions 1990 15-3 NFC West Champions 1992 15-3 NFC West Champions 1993 11-7 NFC West Champions 1994 16-3 Super Bowl XXIX Champions 1995 11-6 NFC West Champions 1997 14-4 NFC West Champions 2002 11-7 NFC West Champions 2011 14-4 NFC West Champions 2012 13-5-1 NFC Champions 49ERS CHAMPIONSHIPS (1950-PRESENT) 1946 (9-5) Lawrence T. Shaw, Coach L 7 New York Yanks, S-8 21 W 21 Miami Seahawks, S-15 14 W 32 Brooklyn Dodgers, S-22 13 L 7 at Chicago Rockets, S-29 21 W 34 at Miami Seahawks, O-7 7 W 23 at Los Angeles Dons, O-12 14 L 14 at Buffalo Bisons, 0-18 17 W 34 at Cleveland Browns, O-27 20 W 27 Buffalo Bisons, N-2 14 L 7 Cleveland Browns, N-10 14 L 9 at New York Yanks, N-17 10 W 30 at Brooklyn Dodgers, N-24 14 W 14 Chicago Rockets, N-30 0 W 48 Los Angeles Dons, D-8 7 307 189 1948 (12-2) Lawrence T. Shaw, Coach W 35 Buffalo Bills, A-29 14 W 36 Brooklyn Dodgers, S-5 20 W 41 New York Yanks, S-12 0 W 36 Los Angeles Dons, S-19 14 W 38 at Buffalo Bills, S-26 28 W 31 at Chicago Rockets, O-1 14 W 56 at Baltimore Colts, O-10 14 W 21 at New York Yanks, O-17 7 W 21 Baltimore Colts, O-24 10 W 44 Chicago Rockets, N-7 21 L 7 at Cleveland Browns, N-14 14 W 63 at Brooklyn Dodgers, N-21 40 L 28 Cleveland Browns, N-28 31 W 38 at Los Angeles Dons, D-5 21 495 248 1947 (8-4-2) Lawrence T. Shaw, Coach W 23 Brooklyn Dodgers, A-31 7 W 17 Los Angeles Dons, S-7 14 W 14 Baltimore Colts, S-14 7 L 16 New York Yanks, S-21 21 W 41 at Buffalo Bills, S-28 24 T 28 at Baltimore Colts, O-5 28 W 42 Chicago Rockets, O-12 28 L 7 Cleveland Browns, O-26 14 W 26 at Los Angeles Dons, N-2 16 L 16 at New York Yanks, N-9 24 L 14 at Cleveland Browns, N-16 37 W 41 at Chicago Rockets, N-21 16 W 21 at Brooklyn Dodgers, N-27 7 T 21 Buffalo Bills, D-7 21 327 264 1949 (9-3/10-4) Lawrence T. Shaw, Coach W 31 Baltimore Colts, A-28 17 W 42 Chicago Hornets, S-4 7 W 42 Los Angeles Dons, S-18 14 L 17 at Buffalo Bills, S-25 28 W 42 at Chicago Hornets, S-30 24 W 56 Cleveland Browns, O-9 28 W 51 Buffalo Bills, O-16 7 L 3 at New York Yanks, O-23 24 L 28 at Cleveland Browns, O-30 30 W 28 at Baltimore Colts, N-6 10 W 41 at Los Angeles Dons, 11-13 24 W 35 New York Yanks, N-27 14 416 227 AAFC PLAYOFF - DEC. 4 (at San Francisco - Kezar) W 17 New York Yanks 7 AAFC CHAMPIONSHIP GAME - DEC. 11 (at Cleveland) L 7 at Cleveland Browns 21 49ERS YEARLY RESULTS ALL-AMERICA FOOTBALL CONFERENCE (1946-49)
Transcript of SAN FRANCISCO 49ERS 49ERS NFL COMPOSITE RECORDS · san francisco 49ers 2017 season 430 media guide...

SAN FRANCISCO 49ERS
M E D I A G U I D E2 0 1 7 S E A S O N 430
CURRENT NFC TEAMSOPPONENT REG. SEASON PLAYOFFS TOTALArizona 29-22 - 29-22 Atlanta 46-30-1 1-1 47-31-1Carolina 7-12 1-0 8-12Chicago 30-31-1 3-0 33-31-1Dallas 15-12-1 2-5 17-17-1Detroit 36-27-1 1-1 37-28-1Green Bay 27-31-1 3-4 30-35-1L.A. Rams 67-64-3 1-0 68-64-3Minnesota 19-21-1 4-1 23-22-1New Orleans 47-26-2 1-0 48-26-2N.Y. Giants 15-16 4-4 19-20Philadelphia 18-12-1 1-0 19-12-1Seattle 15-21 0-1 15-22Tampa Bay 17-5 0-1 17-6Washington 17-9-1 3-1 20-10-1
CURRENT AFC TEAMSOPPONENT REG. SEASON PLAYOFFS TOTALBaltimore 2-3 0-1 2-4Buffalo 6-6 - 6-6Cincinnati 9-4 2-0 11-4Cleveland 7-12 - 7-12Denver 6-7 1-0 7-7 Houston 2-1 - 2-1Indianapolis 18-25 - 18-25Jacksonville 2-2 - 2-2Kansas City 7-5 - 7-5L.A. Chargers 6-7 1-0 7-7Miami 5-7 1-0 6-7 New England 8-5 - 8-5 N.Y. Jets 10-3 - 10-3Oakland 6-7 - 6-7Pittsburgh 11-10 - 11-10Tennessee 8-5 - 8-5
49ERS NFL COMPOSITE RECORDS(1950-PRESENT)
YEAR RECORD FINISH1970 11-4-1 NFC West Champions1971 10-6 NFC West Champions1972 8-6-1 NFC West Champions1981 16-3 Super Bowl XVI Champions1983 11-7 NFC West Champions1984 18-1 Super Bowl XIX Champions1986 10-6-1 NFC West Champions1987 13-3 NFC West Champions1988 13-6 Super Bowl XXIII Champions1989 17-2 Super Bowl XXIV Champions1990 15-3 NFC West Champions1992 15-3 NFC West Champions1993 11-7 NFC West Champions1994 16-3 Super Bowl XXIX Champions1995 11-6 NFC West Champions1997 14-4 NFC West Champions2002 11-7 NFC West Champions2011 14-4 NFC West Champions2012 13-5-1 NFC Champions
49ERS CHAMPIONSHIPS (1950-PRESENT)
1946 (9-5)Lawrence T. Shaw, Coach
L 7 New York Yanks, S-8 21W 21 Miami Seahawks, S-15 14W 32 Brooklyn Dodgers, S-22 13L 7 at Chicago Rockets, S-29 21W 34 at Miami Seahawks, O-7 7W 23 at Los Angeles Dons, O-12 14L 14 at Buffalo Bisons, 0-18 17W 34 at Cleveland Browns, O-27 20W 27 Buffalo Bisons, N-2 14L 7 Cleveland Browns, N-10 14L 9 at New York Yanks, N-17 10W 30 at Brooklyn Dodgers, N-24 14W 14 Chicago Rockets, N-30 0W 48 Los Angeles Dons, D-8 7 307 189
1948 (12-2)Lawrence T. Shaw, Coach
W 35 Buffalo Bills, A-29 14W 36 Brooklyn Dodgers, S-5 20W 41 New York Yanks, S-12 0W 36 Los Angeles Dons, S-19 14W 38 at Buffalo Bills, S-26 28W 31 at Chicago Rockets, O-1 14W 56 at Baltimore Colts, O-10 14W 21 at New York Yanks, O-17 7W 21 Baltimore Colts, O-24 10W 44 Chicago Rockets, N-7 21L 7 at Cleveland Browns, N-14 14W 63 at Brooklyn Dodgers, N-21 40L 28 Cleveland Browns, N-28 31W 38 at Los Angeles Dons, D-5 21 495 248
1947 (8-4-2)Lawrence T. Shaw, Coach
W 23 Brooklyn Dodgers, A-31 7W 17 Los Angeles Dons, S-7 14W 14 Baltimore Colts, S-14 7L 16 New York Yanks, S-21 21W 41 at Buffalo Bills, S-28 24T 28 at Baltimore Colts, O-5 28W 42 Chicago Rockets, O-12 28L 7 Cleveland Browns, O-26 14W 26 at Los Angeles Dons, N-2 16L 16 at New York Yanks, N-9 24L 14 at Cleveland Browns, N-16 37W 41 at Chicago Rockets, N-21 16W 21 at Brooklyn Dodgers, N-27 7T 21 Buffalo Bills, D-7 21 327 264
1949 (9-3/10-4)Lawrence T. Shaw, Coach
W 31 Baltimore Colts, A-28 17W 42 Chicago Hornets, S-4 7W 42 Los Angeles Dons, S-18 14L 17 at Buffalo Bills, S-25 28W 42 at Chicago Hornets, S-30 24W 56 Cleveland Browns, O-9 28W 51 Buffalo Bills, O-16 7L 3 at New York Yanks, O-23 24L 28 at Cleveland Browns, O-30 30W 28 at Baltimore Colts, N-6 10W 41 at Los Angeles Dons, 11-13 24W 35 New York Yanks, N-27 14 416 227
AAFC PLAYOFF - DEC. 4(at San Francisco - Kezar)
W 17 New York Yanks 7
AAFC CHAMPIONSHIP GAME - DEC. 11(at Cleveland)
L 7 at Cleveland Browns 21
49ERS YEARLY RESULTSALL-AMERICA FOOTBALL CONFERENCE (1946-49)

SAN FRANCISCO 49ERS
M E D I A G U I D E2 0 1 7 S E A S O N 431
1950 (3-9)Lawrence T. Shaw, Coach
L 17 New York Yanks (29,600), S-17 21L 20 Chicago Bears (35,558), S-24 32L 14 Los Angeles Rams (27,262), O-1 35L 7 at Detroit (17,337), O-8 24L 24 at New York Yanks (5,740), O-12 29W 28 Detroit (27,350), O-22 27W 17 Baltimore (14,800), O-29 14L 21 at Los Angeles Rams (15,952), N-5 28L 14 at Cleveland (28,786), N-12 34L 0 at Chicago Bears (35,105), N-19 17L 21 at Green Bay (13,186), N-26 25W 30 Green Bay (19,204), D-10 14 213 300
TEAM STATISTICS 49ers OppTOTAL FIRST DOWNS 201 204 By Rushing 107 111 By Passing 83 81 By Penalties 11 12TOTAL YARDS GAINED 3,830 3,951 By Rushing 1,955 1,662 By Passing 1,875 2,289TOTAL PLAYS FROM SCRIMMAGE 906 903 Rushes 460 443 Average Gain Per Rush 4.25 3.75FORWARD PASSES ATTEMPTED 326 347 Number Completed 164 164 Per Cent Completed 50.3 47.3 Yards Lost Passing 325 248 Passes Had Intercepted 25 22 Yards Gained Per Pass 5.8 6.6 Yards Gained Per Completion 11.4 14.0PUNTS 63 62 Total Yardage of Punts 2,440 2,443 Average Length 38.7 39.4 Net avg. per punt 32.0 32.2KICKOFF RETURNS 45 61 Total Yards Returned 800 1014 Average Length of Return 20.0 24.7PENALTIES 93 71 Yards Penalized 851 599 Net Loss/Gain -252 252FUMBLES 35 39 Own Fumbles Recovered 14 18 Opponents’ Fumbles Recovered 21 21FIELD GOALS 4 7 Field Goals Attempted 8 14TOTAL POINTS SCORED 213 300 Touchdowns Scored 29 40 Touchdowns Rushing 14 17 Touchdowns Passing 14 16 Touchdown Returns 1 7 Extra Points 27 35 Safeties 0 2SCORING TDs Ru Pa Int Fu KO Pu PAT FG S PtsSoltau, Gordy 1 0 1 0 0 0 0 26/28 4/7 0 44Perry, Joe 6 5 1 0 0 0 0 0/0 0/0 0 36Cason, Jim 4 1 3 0 0 0 0 0/0 0/0 0 24Albert, Frank 3 3 0 0 0 0 0 0/0 0/0 0 18Beals, Alyn 3 0 3 0 0 0 0 0/0 0/0 0 18Strzykalski, John 3 2 1 0 0 0 0 0/0 0/0 0 18Sitko, Emil 3 1 2 0 0 0 0 0/0 0/0 0 18Gehrke, Fred 2 1 1 0 0 0 0 0/0 0/0 0 12Banducci, Bruno 1 0 1 0 0 0 0 0/0 0/0 0 6Livingston, Howie 1 0 0 1 0 0 0 0/0 0/0 0 6Salata, Paul 1 0 1 0 0 0 0 0/0 0/0 0 6Standlee, Norm 1 1 0 0 0 0 0 0/0 0/0 0 6Nix, Jack 0 0 0 0 0 0 0 1/1 0/0 0 149ERS 29 14 14 1 0 0 0 27/29 4/7 0 213OPPONENTS 40 17 16 3 3 1 0 35/39 7/14 2 300
RUSHING Att Yds Avg LG TDPerry, Joe 124 647 5.2 78t 5Strzykalski, John 136 612 4.5 38 2Albert, Frank 53 272 5.1 42 3Cason, Jim 38 129 3.4 24t 1Sitko, Emil 23 105 4.6 15 1Cathcart, Sam 33 76 2.3 17 0Gehrke, Fred 22 69 3.1 12 1Standlee, Norm 12 23 1.9 8 1Wagner, Lowell 2 5 2.5 3 0Cathcart, Royal 3 5 1.7 3 0Powers, Jim 3 4 1.3 3 0Lillywhite, Verl 7 4 0.6 5 0Garlin, Don 3 3 1.0 2 0Shoener, Hal 1 1 1.0 1 049ERS 460 1,955 4.3 78t 14OPPONENTS 443 1,662 3.8 57t 17RECEIVING No Yds Avg LG TDLoyd, Alex 32 402 12.6 38 0Cason, Jim 30 374 12.5 43 3Strzykalski, John 24 187 7.8 28 1Beals, Alyn 22 315 14.3 38 3Soltau, Gordy 14 170 12.1 28 1Perry, Joe 13 69 5.3 16 1Nix, Jack 9 114 12.7 50 0Cathcart, Sam 7 99 14.1 24 0Salata, Paul 5 46 9.2 17 1Sitko, Emil 3 43 14.3 28t 2Gehrke, Fred 3 29 9.7 13 1Bruce, Gail 1 10 10.0 10 0Lillywhite, Verl 1 6 6.0 6 0Banducci, Bruno Lat 11 11t 149ERS 164 1,875 11.4 50 14OPPONENTS 164 2,289 14.0 72t 16INTERCEPTIONS No Yds Avg LG TDPowers, Jim 5 42 8.4 26 0Livingston, Howie 4 99 24.8 35t 1Wagner, Lowell 4 12 3.0 8 0Cathcart, Sam 3 58 19.3 19 0Grgich, Visco 1 37 37.0 37 0Cason, Jim 1 22 22.0 22 0Shoener, Hal 1 14 14.0 14 0Lillywhite, Verl 1 11 11.0 11 0Wismann, Pete 1 5 5.0 5 0Bruce, Gail 1 4 4.0 4 049ERS 22 304 13.8 37 1OPPONENTS 25 429 17.2 50 3KICKOFF RETURNS No Yds Avg LG TDCathcart, Sam 13 311 23.9 62 0Perry, Joe 12 223 18.6 27 0Shoener, Hal 4 53 13.3 17 0Gehrke, Fred 2 57 28.5 32 0Cason, Jim 2 48 24.0 25 0Lillywhite, Verl 2 36 18.0 21 0Garlin, Don 1 24 24.0 24 0Sandifer, Dan 1 19 19.0 19 0Standlee, Norm 1 17 17.0 17 0Matthews, Clay 1 10 10.0 10 0Evans, Ray 1 2 2.0 2 049ERS 40 800 20.0 62 0OPPONENTS 41 1,014 24.7 37 1PUNT RETURNS No Yds Avg LG TDCason, Jim 11 173 15.7 33 0Cathcart, Sam 16 185 11.6 29 0Gehrke, Fred 5 44 8.8 19 0Wagner, Lowell 1 4 4.0 4 049ERS 33 406 12.3 33 0OPPONENTS 37 413 11.2 27 0PUNTING No Yds Avg LG BlkLillywhite, Verl 26 1,016 39.1 57 0Albert, Frank 37 1,424 38.5 64 149ERS 63 2,440 38.7 64 1OPPONENTS 62 2,443 39.4 57 0PASSING Att Comp Pct Yds LG TD Int QBAlbert, Frank 306 155 50.7 1,767 43 14 23 52.3Powers, Jim 20 9 45.0 108 50 0 2 22.549ERS 326 164 50.3 1,875 50 14 25 50.3OPPONENTS 347 164 47.3 2,289 72t 16 22 57.9
Rookie Names in Italics
49ERS YEARLY RESULTS AND STATISTICSNATIONAL FOOTBALL LEAGUE (1950-PRESENT)

SAN FRANCISCO 49ERS
M E D I A G U I D E2 0 1 7 S E A S O N 432
1951 (7-4-1)Lawrence T. Shaw, Coach
W 24 Cleveland (48,263), S-30 10L 14 at Philadelphia (23,827), O-6 21W 28 at Pittsburgh (27,124), O-14 24L 7 at Chicago Bears (42,296), O-21 13W 44 Los Angeles Rams (49,538), O-28 17L 16 at Los Angeles Rams (54,346), N-4 23W 19 New York Yanks (25,538), N-11 14L 21 Chicago Cards (19,658), N-18 27T 10 at New York Yanks (10,184), N-25 10W 20 at Detroit (46,467), D-2 10W 31 Green Bay (15,121), D-9 19W 21 Detroit (27,276), D-16 17 255 205
RUSHING Att Yds Avg LG TDPerry, Joe 136 677 5.0 58t 3Lillywhite, Verl 67 397 5.9 60t 1Schabarum, Pete 76 311 4.1 67 2Strzykalski, John 81 296 3.7 13 3Arenas, Joe 34 183 5.4 15 3Strickland, Bishop 34 165 4.9 15 0Albert, Frank 35 146 4.2 34 3Monachino, Jim 21 74 3.5 7 2Standlee, Norm 16 65 4.1 13 0White, Bob 8 33 4.1 9 0Tittle, Y.A. 13 18 1.4 5 1Cason, Jim 1 5 5.0 5 0Soltau, Gordy 1 -4 -4.0 -4 049ERS 523 2,366 4.5 67 18OPPONENTS 417 1,549 3.7 61 9
RECEIVING No Yds Avg LG TDSoltau, Gordy 59 826 14.0 48t 7Wilson, Billy 18 268 14.9 38 3Perry, Joe 18 167 9.3 35 1Beals, Alyn 12 126 10.5 22 0Strzykalski, John 12 105 8.8 13 0Lillywhite, Verl 11 125 11.4 29 1Schabarum, Pete 10 162 16.2 47 0Jessup, Bill 7 99 14.1 31 1White, Bob 3 36 12.0 22 0Arenas, Joe 1 12 12.0 12t 1Berry, Rex 1 12 12.0 12 0Cason, Jim 1 8 8.0 8 0Monachino, Jim 1 6 6.0 6 0Johnson, Bill 0 3 0.0 3 049ERS 154 1,955 12.7 48t 14OPPONENTS 158 2,313 14.6 81t 15
INTERCEPTIONS No Yds Avg LG TDWagner, Lowell 9 115 12.8 40 0Cason, Jim 8 147 18.4 65t 1Berry, Rex 4 77 19.3 38 0Powers, Jim 4 73 18.3 28 0Lillywhite, Verl 3 47 15.7 24 0Wismann, Pete 2 12 6.0 10 0Carapella, Al 1 11 11.0 11 0White, Bob 1 11 11.0 11 0Brown, Hardy 1 5 5.0 5 049ERS 33 498 15.1 65t 1OPPONENTS 19 223 11.7 62 0
KICKOFF RETURNS No Yds Avg LG TDArenas, Joe 21 542 25.8 49 0Cason, Jim 10 196 19.6 41 0Nomellini, Leo 2 27 13.5 16 0Perry, Joe 1 32 32.0 32 0Strickland, Bishop 1 14 14.0 14 0Collins, Ray 1 6 6.0 6 0Banducci, Bruno 1 3 3.0 3 0Wilson, Billy 1 0 0.0 0 049ERS 38 820 21.6 49 0OPPONENTS 44 957 21.8 63 0
PUNT RETURNS No Yds Avg LG TDArenas, Joe 21 272 13.0 51 0Cason, Jim 13 115 8.9 20 0Nomellini, Leo 1 20 20.0 20t 149ERS 35 407 11.6 51 1OPPONENTS 21 140 6.7 58 0
PUNTING No Yds Avg LG BlkAlbert, Frank 34 1,506 44.3 66 0Lillywhite, Verl 20 848 42.4 75 049ERS 54 2,354 43.6 75 0OPPONENTS 70 2,826 40.4 67 1
PASSING Att Comp Pct Yds LG TD Int QBTittle, Y.A. 114 63 55.3 808 48t 8 9 68.2Albert, Frank 166 90 54.2 1,116 47 5 10 60.2Perry, Joe 1 1 100.0 31 31t 1 0 158.349ERS 281 154 54.8 1,955 48t 14 19 65.2OPPONENTS 353 158 44.8 2,313 81t 15 33 41.9
TEAM STATISTICS 49ers OppTOTAL FIRST DOWNS 237 188 By Rushing 134 91 By Passing 92 84 By Penalties 11 13TOTAL YARDS GAINED 4,321 3,862 By Rushing 2,366 1,549 By Passing 1,955 2,313TOTAL PLAYS FROM SCRIMMAGE 915 900 Rushes 523 417 Average Gain Per Rush 4.5 3.7FORWARD PASSES ATTEMPTED 281 353 Number Completed 154 158 Per Cent Completed 54.8 44.8 Yards Lost Passing 308 212 Passes Had Intercepted 9 33 Yards Gained Per Pass 7.0 6.5 Yards Gained Per Completion 12.7 14.6PUNTS 54 70 Total Yardage of Punts 2,354 2,826 Average Length 43.6 40.4 Net avg. per punt 39.4 33.4KICKOFF RETURNS 53 49 Total Yards Returned 820 957 Average Length of Return 21.6 21.8PENALTIES 75 68 Yards Penalized 694 526 Net Loss/Gain -168 168FUMBLES 26 22 Own Fumbles Recovered 6 13 Opponents’ Fumbles Recovered 9 20FIELD GOALS 6 13 Field Goals Attempted 18 24TOTAL POINTS SCORED 255 205 Touchdowns Scored 34 24 Touchdowns Rushing 19 9 Touchdowns Passing 14 15 Touchdown Returns 1 0 Extra Points 31 22 Safeties 1 0
SCORING TDs Ru Pa Int Fu KO Pu PAT FG S PtsSoltau, Gordy 7 0 7 0 0 0 0 30/32 6/18 0 90Arenas, Joe 4 3 1 0 0 0 0 0/0 0/0 0 24Perry, Joe 4 3 1 0 0 0 0 0/0 0/0 0 24Albert, Frank 3 3 0 0 0 0 0 0/0 0/0 0 18Strzykalski, John 3 3 0 0 0 0 0 0/0 0/0 0 18Wilson, Billy 3 0 3 0 0 0 0 0/0 0/0 0 18Lillywhite, Verl 2 1 1 0 0 0 0 0/0 0/0 0 12Monachino, Jim 2 2 0 0 0 0 0 0/0 0/0 0 12Schabarum, Pete 2 2 0 0 0 0 0 0/0 0/0 0 12Cason, Jim 1 0 0 1 0 0 0 0/0 0/0 0 6Jessup, Bill 1 0 1 0 0 0 0 0/0 0/0 0 6Nomellini, Leo 1 0 0 0 0 0 1 0/0 0/0 0 6Tittle, Y.A. 1 1 0 0 0 0 0 0/0 0/0 0 6Tanner, Hampton 0 0 0 0 0 0 0 0/0 0/0 1 2Bruce, Gail 0 0 0 0 0 0 0 1/1 0/0 0 149ERS 34 18 14 1 0 0 1 31/33 6/18 1 255OPPONENTS 24 9 15 0 0 0 0 22/24 13/24 0 205
Rookie Names in Italics

SAN FRANCISCO 49ERS
M E D I A G U I D E2 0 1 7 S E A S O N 433
1952 (7-5)Lawrence T. Shaw, Coach
W 17 Detroit (52,750), S-28 3W 37 at Dallas Texans (12,566), O-5 14W 28 at Detroit (42,842), O-12 0W 40 at Chicago Bears (46,338), O-19 16W 48 Dallas Texans (26,887), O-26 21L 17 Chicago Bears (58,255), N-2 20L 14 at New York Giants (54,230), N-9 23W 23 at Washington (30,863), N-16 17L 9 at Los Angeles Rams (64,450), N-23 35L 21 Los Angeles Rams (49,420), N-30 34L 7 Pittsburgh (13,886), D-7 24W 24 Green Bay (17,579), D-14 14 285 221
RUSHING Att Yds Avg LG TDPerry, Joe 158 725 4.6 78t 8McElhenny, Hugh 98 684 7.0 89t 6Arenas, Joe 44 183 4.2 14 0Albert, Frank 22 87 4.0 29 1Boone, J.R. 24 72 3.0 12 0Strzykalski, John 16 53 3.3 11 0Aldridge, Ben 13 36 2.8 11 0White, Bob 24 33 1.4 17 1Cathcart, Sam 6 21 3.5 7 0Standlee, Norm 2 8 4.0 9 Berry, Rex 1 7 7.0 7 0Nomellini, Leo 1 5 5.0 5 0Meyers, Bob 1 2 2.0 2 0Tittle, Y.A. 11 -11 -1.0 4 049ERS 421 1,905 4.5 89t 16OPPONENTS 412 1,566 3.8 51 10
RECEIVING No Yds Avg LG TDSoltau, Gordy 55 774 14.1 49t 7McElhenny, Hugh 26 367 14.1 77 3Boone, J.R. 25 461 18.4 53 1Wilson, Billy 23 304 13.2 40 3Perry, Joe 15 81 5.4 17 0White, Bob 12 173 14.4 60 2Jessup, Bill 6 108 18.0 58 1Arenas, Joe 5 47 9.4 14 1Aldridge, Ben 4 22 5.5 16 1Cathcart, Sam 2 15 7.5 13 0Henke, Ed 1 13 13.0 13 0Wagner, Lowell 1 6 6.0 6 0Strzykalski, John 1 4 4.0 4 0Banducci, Bruno 1 -4 -4.0 -4 049ERS 177 2,371 13.4 77 19OPPONENTS 151 1,929 12.8 90t 15
INTERCEPTIONS No Yds Avg LG TDWagner, Lowell 6 69 11.5 30 0Cathcart, Sam 3 64 21.3 30 0Powers, Jim 2 37 18.5 23 0Berry, Rex 2 27 13.5 23 0Cason, Jim 2 4 2.0 4 0Burke, Don 1 35 35.0 35t 1Brown, Hardy 1 16 16.0 16 049ERS 17 252 14.8 35t 1OPPONENTS 23 299 13.0 38 0
KICKOFF RETURNS No Yds Avg LG TDArenas, Joe 11 291 26.5 47 0McElhenny, Hugh 18 396 22.0 40 0Brown, Hardy 2 31 15.5 23 0O’Donahue, Pat 2 17 8.5 10 0Burke, Don 1 25 25.0 25 0Cathcart, Sam 1 20 20.0 20 0Nomellini, Leo 1 18 18.0 18 049ERS 36 798 22.2 47 0OPPONENTS 52 1,242 23.9 52 0
PUNT RETURNS No Yds Avg LG TDMcElhenny, Hugh 20 284 14.2 94t 1Boone, J.R. 11 66 6.0 17 0Arenas, Joe 7 40 5.7 13 0Cathcart, Sam 1 23 23.0 23 0O’Donahue, Pat 1 23 23.0 23t 149ERS 40 436 10.9 94t 2OPPONENTS 29 359 12.4 82t 1
PUNTING No Yds Avg LG BlkAlbert, Frank 68 2,899 42.6 70 049ERS 68 2,899 42.6 70 0OPPONENTS 78 3,218 41.3 66 0
PASSING Att Comp Pct Yds LG TD Int QBAlbert, Frank 129 71 55.0 964 60t 8 10 67.5Tittle, Y.A. 208 106 51.0 1,407 77 11 12 66.3Arenas, Joe 1 0 0.0 0 0 0 0 39.6Cathcart, Sam 1 0 0.0 0 0 0 1 0.0Powers, Jim 1 0 0.0 0 0 0 0 39.6Perry, Joe 2 0 0.0 0 0 0 0 39.649ERS 342 177 51.8 2,371 77 19 23 64.6OPPONENTS 342 151 44.2 1,929 90t 15 17 56.3
TEAM STATISTICS 49ers OppTOTAL FIRST DOWNS 213 167 By Rushing 97 81 By Passing 104 76 By Penalties 12 10TOTAL YARDS GAINED 4,276 3,495 By Rushing 1,905 1,566 By Passing 2,371 1,929TOTAL PLAYS FROM SCRIMMAGE 884 887 Rushes 421 412 Average Gain Per Rush 5.0 3.8FORWARD PASSES ATTEMPTED 342 342 Number Completed 174 151 Per Cent Completed 51.8 44.2 Yards Lost Passing 396 291 Passes Had Intercepted 23 17 Yards Gained Per Pass 5.8 4.8 Yards Gained Per Completion 13.6 12.8PUNTS 68 78 Total Yardage of Punts 2,899 3,218 Average Length 42.6 41.3 Net avg. per punt 36.8 34.6KICKOFF RETURNS 58 50 Total Yards Returned 798 1,242 Average Length of Return 22.2 23.9PENALTIES 79 65 Yards Penalized 628 530 Net Loss/Gain -98 98FUMBLES 26 31 Own Fumbles Recovered 13 13 Opponents’ Fumbles Recovered 18 13FIELD GOALS 6 10 Field Goals Attempted 12 21TOTAL POINTS SCORED 285 221 Touchdowns Scored 38 27 Touchdowns Rushing 16 10 Touchdowns Passing 19 15 Touchdown Returns 3 2 Extra Points 35 27 Field Goals 6 10 Safeties 2 1
SCORING TDs Ru Pa Int Fu KO Pu PAT FG S PtsSoltau, Gordy 7 0 7 0 0 0 0 34/36 6/12 0 94McElhenny, Hugh 10 6 3 0 0 0 1 0/0 0/0 0 60Perry, Joe 8 8 0 0 0 0 0 0/0 0/0 0 48White, Bob 3 1 2 0 0 0 0 0/0 0/0 0 18Wilson, Billy 3 0 3 0 0 0 0 0/0 0/0 0 18O’Donahue, Pat 1 0 0 0 0 0 1 1/1 0/0 0 7Albert, Frank 1 1 0 0 0 0 0 0/0 0/0 0 6Aldridge, Ben 1 0 1 0 0 0 0 0/0 0/0 0 6Arenas, Joe 1 0 1 0 0 0 0 0/0 0/0 0 6Boone, J.R. 1 0 1 0 0 0 0 0/0 0/0 0 6Burke, Don 1 0 0 1 0 0 0 0/0 0/0 0 6Jessup, Bill 1 0 1 0 0 0 0 0/0 0/0 0 6Momsen, Bob 0 0 0 0 0 0 0 0/0 0/0 1 2Powell, Charlie 0 0 0 0 0 0 0 0/0 0/0 1 249ERS 38 16 19 1 0 0 2 35/37 6/12 2 285OPPONENTS 27 10 15 0 1 0 1 27/27 10/21 1 221
Rookie Names in Italics

SAN FRANCISCO 49ERS
M E D I A G U I D E2 0 1 7 S E A S O N 434
1953 (9-3)Lawrence T. Shaw, Coach
W 31 Philadelphia (25,000), S-27 21W 31 Los Angeles Rams (41,446), O-4 30L 21 at Detroit (56,080), O-11 24W 35 at Chicago Bears (36,909), O-18 28L 10 Detroit (52,300), O-25 14W 24 Chicago Bears (26,308), N-1 14W 31 at Los Angeles Rams (85,856), N-8 27L 21 at Cleveland (80,698), N-15 23W 37 at G.B. in Milwaukee (16,378), N-22 7W 38 at Baltimore (26,005), N-29 21W 48 Green Bay (31,337), D-6 14W 45 Baltimore (23,932), D-13 14 372 237
RUSHING Att Yds Avg LG TDPerry, Joe 192 1,018 5.3 51t 10McElhenny, Hugh 112 503 4.5 33 3Arenas, Joe 72 380 5.3 60t 6Mixon, Billy 25 176 7.0 33 1Schabarum, Pete 18 104 5.8 23 0Tittle, Y.A. 14 41 2.9 14 6Monachino, Jim 4 10 2.5 5 0Wagner, Lowell 1 4 4.0 4 0Ledyard, Hal 1 3 3.0 3 0Bahnsen, Ken 1 1 1.0 1 0Powers, Jim 3 -10 -3.3 0 049ERS 443 2,230 5.0 60t 26OPPONENTS 398 1,548 3.9 48 12
RECEIVING No Yds Avg LG TDWilson, Billy 51 840 16.5 61t 10Soltau, Gordy 43 620 14.4 54t 6McElhenny, Hugh 30 474 15.8 71 2Perry, Joe 19 191 10.1 60t 3Arenas, Joe 10 113 11.3 38 1Schabarum, Pete 10 96 9.6 31 0Babcock, Harry 7 59 8.4 13 0Monachino, Jim 2 9 4.5 9 0Mixon, Billy 1 7 7.0 7 0Hogland, Doug 1 -2 -2.0 -2 049ERS 174 2,407 13.8 71 22OPPONENTS 173 2,100 12.1 66t 17
INTERCEPTIONS No Yds Avg LG TDBerry, Rex 7 142 20.3 29 1Wagner, Lowell 6 135 22.5 32 0Bruney, Fred 5 59 11.8 23 0Arenas, Joe 2 29 14.5 17 0Morton, John 2 16 8.0 9 0Brown, Hardy 1 7 7.0 7 049ERS 23 388 16.9 32 1OPPONENTS 19 204 10.7 30 0
KICKOFF RETURNS No Yds Avg LG TDArenas, Joe 16 551 34.4 82 0McElhenny, Hugh 15 368 24.5 55 0Schabarum, Pete 2 50 25.0 27 0Bruney, Fred 2 46 23.0 25 0Perry, Joe 2 21 10.5 11 0Babcock, Harry 2 3 1.5 3 0Berry, Rex 1 37 37.0 37 0Bahnsen, Ken 1 21 21.0 21 0Nomellini, Leo 1 5 5.0 5 0Brown, Hardy 1 3 3.0 3 049ERS 43 1,105 25.7 82 0OPPONENTS 59 1,264 21.4 78 0
PUNT RETURNS No Yds Avg LG TDMcElhenny, Hugh 15 104 6.9 25 0 Arenas, Joe 8 93 11.6 50 0 Berry, Rex 7 42 6.0 17 0 Schabarum, Pete 2 0 0.0 0 0 Bruney, Fred 1 11 11.0 11 0 49ERS 33 250 7.6 50 0 OPPONENTS 27 109 4.0 13 0
PUNTING No Yds Avg LG BlkPowers, Jim 42 1,706 40.6 55 149ERS 42 1,706 40.6 55 1OPPONENTS 60 2,457 41.0 61 0
PASSING Att Comp Pct Yds LG TD Int QBTittle, Y.A. 259 149 57.5 2,121 71t 20 16 84.2Powers, Jim 49 22 44.9 259 28 1 2 51.3McElhenny, Hugh 3 2 66.7 13 11t 1 0 115.3Perry, Joe 1 1 100.0 14 14 0 0 118.8Arenas, Joe 1 0 0.0 0 0 0 0 39.6Ledyard, Hal 9 0 0.0 0 0 0 0 39.649ERS 322 174 54.0 2,407 71t 22 18 77.8OPPONENTS 356 173 48.6 1,877 66t 17 23 53.6
TEAM STATISTICS 49ers OppTOTAL FIRST DOWNS 243 206 By Rushing 128 99 By Passing 99 95 By Penalties 16 12TOTAL YARDS GAINED 4,398 3,425 By Rushing 2,230 1,548 By Passing 2,168 1,877TOTAL PLAYS FROM SCRIMMAGE 825 830 Rushes 443 398 Average Gain Per Rush 5.0 3.9FORWARD PASSES ATTEMPTED 322 356 Number Completed 174 173 Per Cent Completed 54.0 48.6 Yards Lost Passing 239 223 Passes Had Intercepted 19 23 Yards Gained Per Pass 6.7 5.3 Yards Gained Per Completion 12.5 10.8PUNTS 42 60 Total Yardage of Punts 1,706 2,457 Average Length 40.6 41.0 Net avg. per punt 37.5 35.8KICKOFF RETURNS 49 69 Number Returned 43 59 Total Yards Returned 1,105 1,264 Average Length of Return 25.7 21.4PENALTIES 90 71 Yards Penalized 772 615 Net Loss/Gain -157 157FUMBLES 28 33 Own Fumbles Recovered 9 16 Opponents’ Fumbles Recovered 17 19FIELD GOALS 10 9 Field Goals Attempted 13 16TOTAL POINTS SCORED 372 237 Touchdowns Scored 49 30 Touchdowns Rushing 26 12 Touchdowns Passing 22 17 Touchdown Returns 1 1 Extra Points 48 30 Field Goals 10 9 Safeties 0 0
SCORING TDs Ru Pa Int Fu KO Pu PAT FG S PtsSoltau, Gordy 6 0 6 0 0 0 0 48/49 10/15 0 114Perry, Joe 13 10 3 0 0 0 0 0/0 0/3 0 78Wilson, Billy 10 0 10 0 0 0 0 0/0 0/0 0 60Arenas, Joe 7 6 1 0 0 0 0 0/0 0/0 0 42Tittle, Y.A. 6 6 0 0 0 0 0 0/0 0/0 0 36McElhenny, Hugh 5 3 2 0 0 0 0 0/0 0/0 0 30Berry, Rex 1 0 0 1 0 0 0 0/0 0/0 0 6Mixon, Billy 1 1 0 0 0 0 0 0/0 0/0 0 649ERS 49 26 22 1 0 0 0 48/49 10/18 0 372OPPONENTS 30 12 17 0 1 0 0 30/30 9/16 0 237
Rookie Names in Italics

SAN FRANCISCO 49ERS
M E D I A G U I D E2 0 1 7 S E A S O N 435
1954 (7-4-1)Lawrence T. Shaw, Coach
W 41 Washington (32,085), S-26 7T 24 at Los Angeles Rams (79,208), O-3 24W 23 at G.B. in Milwaukee (15,571), O-10 17W 27 at Chicago Bears (42,935), O-17 24W 37 Detroit (58,891), O-24 31L 27 Chicago Bears (49,833), O-31 31L 34 Los Angeles Rams (58,758), N-7 42L 7 at Detroit (58,431), N-14 48W 31 at Pittsburgh (37,001), N-20 3L 13 at Baltimore (23,875), N-28 17W 35 Green Bay (32,012), D-5 0W 10 Baltimore (25,456), D-11 7 313 251
RUSHING Att Yds Avg LG TDPerry, Joe 173 1,049 6.1 58 8Johnson, John Henry 129 681 5.3 38t 9McElhenny, Hugh 64 515 8.1 60t 6Schabarum, Pete 21 79 3.8 16 1Arenas, Joe 11 77 7.0 26 0Tittle, Y.A. 28 68 2.4 10 4Mixon, Billy 7 19 2.7 7 0Cassara, Frank 3 17 5.7 10 0Galiffa, Arnie 1 2 2.0 2 0Tidwell, Billy 1 1 1.0 1 0Cason, Jim 2 1 0.5 3 0Jessup, Bill 1 -5 -5.0 -5 0Brown, Pete 1 -6 -6.0 -6 049ERS 442 2,498 5.7 60t 28OPPONENTS 348 1,371 3.9 43t 8RECEIVING No Yds Avg LG TDWilson, Billy 60 830 13.8 43 5Jessup, Bill 30 565 18.8 68t 3Johnson, John Henry 28 183 6.5 34 0Perry, Joe 26 203 7.8 70 0Soltau, Gordy 22 316 14.4 42 2McElhenny, Hugh 8 162 20.3 53 0Babcock, Harry 6 91 15.2 33 0Schabarum, Pete 4 70 17.5 42 0Arenas, Joe 2 12 6.0 12 0Cassara, Frank 1 12 12.0 12 049ERS 187 2,444 13.1 70 10OPPONENTS 193 3,015 15.6 78t 24INTERCEPTIONS No Yds Avg LG TDBerry, Rex 3 69 23.0 34t 1Brown, Hardy 3 42 14.0 41t 1Williams, John 3 28 9.3 15 0Arenas, Joe 3 26 8.7 26 0Carapella, Al 2 40 20.0 27 0Mixon, Billy 2 6 3.0 3 0Brown, Pete 1 47 47.0 47 0Toneff, Bob 1 15 15.0 15 0Schabarum, Pete 1 9 9.0 9 049ERS 19 282 14.8 47 2OPPONENTS 12 167 13.9 33 0KICKOFF RETURNS No Yds Avg LG TDArenas, Joe 16 362 22.6 41 0Tidwell, Billy 10 287 28.7 65 0McElhenny, Hugh 8 210 26.3 51 0Johnson, John Henry 2 25 12.5 19 0Schabarum, Pete 1 34 34.0 34 0Toneff, Bob 1 10 10.0 10 0Hogland, Doug 1 2 2.0 2 049ERS 39 930 23.9 65 0OPPONENTS 57 1,145 20.1 43 0PUNT RETURNS No Yds Avg LG TDArenas, Joe 23 117 5.1 23 0McElhenny, Hugh 8 78 9.8 32 0Tidwell, Billy 3 0 0.0 17 0Schabarum, Pete 2 10 5.0 10 049ERS 36 205 5.7 32 0OPPONENTS 40 269 6.7 47 0PUNTING No Yds Avg LG BlkBrown, Pete 49 1,837 37.5 51 0Brown, Hardy 10 384 38.4 58 0Berry, Rex 1 0 0.0 0 049ERS 60 2,221 37.0 58 0OPPONENTS 59 2,420 41.0 60 0PASSING Att Comp Pct Yds LG TD Int QBTittle, Y.A. 295 170 57.6 2,205 70 9 9 78.7Cason, Jim 13 7 53.9 40 25 0 1 27.7Duncan, Maury 14 4 28.6 82 29 0 2 11.9Galiffa, Arnie 12 3 25.0 54 25 0 0 45.8Johnson, John Henry 2 1 50.0 10 10t 1 0 104.2Brown, Pete 1 1 100.0 19 19 0 0 118.8Perry, Joe 1 1 100.0 34 34 0 0 118.8Schabarum, Pete 1 0 0.0 0 0 0 0 39.6Tidwell, Billy 1 0 0.0 0 0 0 0 39.649ERS 340 187 55.0 2,444 70 10 12 73.0OPPONENTS 374 193 51.6 2,649 78t 24 19 74.8
TEAM STATISTICS 49ers OppTOTAL FIRST DOWNS 252 207 By Rushing 125 74 By Passing 109 122 By Penalties 18 11TOTAL YARDS GAINED 4,704 4,020 By Rushing 2,498 1,371 By Passing 2,206 2,649TOTAL PLAYS FROM SCRIMMAGE 863 800 Rushes 442 348 Average Gain Per Rush 5.7 3.9FORWARD PASSES ATTEMPTED 340 374 Number Completed 187 193 Per Cent Completed 55.0 51.6 Yards Lost Passing 238 366 Passes Had Intercepted 12 19 Yards Gained Per Pass 6.5 7.1 Yards Gained Per Completion 11.8 13.7PUNTS 60 59 Total Yardage of Punts 2,221 2,420 Average Length 37.0 41.0 Net avg. per punt 32.2 34.8KICKOFF RETURNS 51 64 Number Returned 39 57 Total Yards Returned 930 1,145 Average Length of Return 23.8 20.1PENALTIES 73 51 Yards Penalized 614 426 Net Loss/Gain -188 188FUMBLES 30 29 Own Fumbles Recovered 17 14 Opponents’ Fumbles Recovered 18 13FIELD GOALS 12 9 Field Goals Attempted 21 19TOTAL POINTS SCORED 313 251 Touchdowns Scored 40 32 Touchdowns Rushing 28 8 Touchdowns Passing 10 24 Touchdown Returns 2 0 Extra Points 37 32 Field Goals 12 9 Safeties 0 0
SCORING TDs Ru Pa Int Fu KO Pu PAT FG S PtsSoltau, Gordy 2 0 2 0 0 0 0 31/33 11/18 0 76Perry, Joe 8 8 0 0 0 0 0 6/7 1/3 0 57Johnson, John Henry 9 9 0 0 0 0 0 0/0 0/0 0 54McElhenny, Hugh 6 6 0 0 0 0 0 0/0 0/0 0 36Wilson, Billy 5 0 5 0 0 0 0 0/0 0/0 0 30Tittle, Y.A. 4 4 0 0 0 0 0 0/0 0/0 0 24Jessup, Bill 3 0 3 0 0 0 0 0/0 0/0 0 18Berry, Rex 1 0 0 1 0 0 0 0/0 0/0 0 6Brown, Hardy 1 0 0 1 0 0 0 0/0 0/0 0 6Schabarum, Pete 1 1 0 0 0 0 0 0/0 0/0 0 649ERS 40 28 10 2 0 0 0 37/40 12/21 0 313OPPONENTS 32 8 24 0 0 0 0 32/32 9/19 0 251
Rookie Names in Italics

SAN FRANCISCO 49ERS
M E D I A G U I D E2 0 1 7 S E A S O N 436
1955 (4-8)Norman P. Strader, Coach
L 14 Los Angeles Rams (58,772), S-25 23L 3 Cleveland (43,595), O-2 38W 20 at Chicago Bears (41,651), O-9 19W 27 at Detroit (50,179), O-16 24L 23 Chicago Bears (56,350), O-23 34W 38 Detroit (44,831), O-30 21L 14 at Los Angeles Rams (71,832), N-6 27L 0 at Washington (25,112), N-13 7L 21 at G.B. in Milwaukee(19,099), N-20 27L 14 at Baltimore (33,485), N-27 26L 7 Green Bay (32,897), D-4 28W 35 Baltimore (33,471), D-11 24 216 308
RUSHING Att Yds Avg LG TDPerry, Joe 156 701 4.5 42 2McElhenny, Hugh 90 327 3.6 44 4Moegle, Dicky 41 235 5.7 39 5Arenas, Joe 37 150 4.1 30 0Tittle, Y.A. 23 114 5.0 35 0Johnson, John Henry 19 69 3.6 12 1Laughlin, Bud 20 58 2.9 14 0Hardy, Carroll 15 37 2.5 14 0Harkey, Lem 6 27 4.5 15 0Duncan, Maury 1 -5 -5.0 -5 049ERS 408 1,713 4.2 44 12OPPONENTS 538 2,135 4.0 49 24
RECEIVING No Yds Avg LG TDWilson, Billy 53 831 15.7 72t 7Soltau, Gordy 26 358 13.8 36 1Perry, Joe 19 55 2.9 19 1Arenas, Joe 13 255 19.6 53t 2Hardy, Carroll 12 338 28.2 78t 4McElhenny, Hugh 11 203 18.5 55t 2Laughlin, Bud 8 54 6.8 27 0Moegle, Dicky 4 94 23.5 53 0Babcock, Harry 3 31 10.3 16 0Johnson, John Henry 2 6 3.0 11 049ERS 151 2,225 14.7 78t 17OPPONENTS 147 2,045 13.9 60t 10
INTERCEPTIONS No Yds Avg LG TDMoegle, Dicky 6 50 8.3 37 0Berry, Rex 3 69 23.0 44t 1Brown, Hardy 2 28 14.0 18 0Madreos, George 2 23 11.5 19 0Luna, Bob 2 0 0.0 0 0Johnson, John Henry 1 29 29.0 29 0Matthews, Clay 1 19 19.0 13 0Carr, Paul 1 11 11.0 11 0Stolhandski, Tom 1 6 6.0 6 0Arenas, Joe 1 0 0.0 0 0Campbell, Marion 1 0 0.0 0 0Powell, Charlie (lat) 0 7 7 049ERS 21 242 11.5 44t 1OPPONENTS 28 299 10.7 55t 2
KICKOFF RETURNS No Yds Avg LG TDArenas, Joe 24 594 24.8 42 0Moegle, Dicky 10 249 24.9 61 0McElhenny, Hugh 9 189 21.0 31 0Hardy, Carroll 3 65 21.7 30 0Laughlin, Bud 1 25 25.0 25 0Toneff, Bob 1 13 13.0 13 0Hazeltine, Matt 1 9 9.0 9 0Powell, Charlie 1 2 2.0 2 0Palatella, Lou 1 1 1.0 1 049ERS 51 1,147 22.5 61 0OPPONENTS 37 865 23.4 56 0
PUNT RETURNS No Yds Avg LG TDArenas, Joe 21 55 2.6 7 0Moegle, Dicky 8 36 4.5 21 0McElhenny, Hugh 7 10 1.4 10 0Berry, Rex 1 11 11.0 11 0Johnson, John Henry 1 6 6.0 6 0Carapella, Al 1 0 0.0 0 049ERS 39 118 3.0 21 0OPPONENTS 40 369 9.2 37 1
PUNTING No Yds Avg LG BlkLuna, Bobby 63 2,558 40.6 63 349ERS 63 2,558 40.6 63 3OPPONENTS 59 2,559 43.4 73 0
PASSING Att Comp Pct Yds LG TD Int QBTittle, Y.A. 287 147 51.2 2,185 78t 17 28 56.6Duncay, Maury 12 4 33.3 40 27 0 0 43.8Arenas, Joe 1 0 0.0 0 0 0 0 39.6Moegle, Dicky 1 0 0.0 0 0 0 0 39.6Perry, Joe 2 0 0.0 0 0 0 0 39.649ERS 303 151 49.8 2,225 78t 17 28 54.4OPPONENTS 311 147 47.3 2,045 60t 10 21 51.5
TEAM STATISTICS 49ers OppTOTAL FIRST DOWNS 204 250 By Rushing 102 132 By Passing 80 103 By Penalties 13 15TOTAL YARDS GAINED 3,651 4,008 By Rushing 1,713 2,135 By Passing 1,938 1,873TOTAL PLAYS FROM SCRIMMAGE 786 930 Rushes 408 538 Average Gain Per Rush 4.2 4.0FORWARD PASSES ATTEMPTED 303 311 Number Completed 151 147 Per Cent Completed 49.8 47.3 Yards Lost Passing 287 172 Passes Had Intercepted 28 21 Yards Gained Per Pass 6.4 6.0 Yards Gained Per Completion 12.8 12.7PUNTS 63 59 Total Yardage of Punts 2,558 2,559 Average Length 40.6 43.4 Net avg. per punt 34.4 38.8KICKOFF RETURNS 51 59 Number Returned 51 37 Total Yards Returned 1,097 867 Average Length of Return 25.5 23.4PENALTIES 64 58 Yards Penalized 541 528FUMBLES 25 19 Own Fumbles Recovered 7 6 Opponents’ Fumbles Recovered 13 18FIELD GOALS 3 12 Field Goals Attempted 12 24TOTAL POINTS SCORED 216 298 Touchdowns Scored 30 37 Touchdowns Rushing 12 24 Touchdowns Passing 17 10 Touchdowns Returns 1 3 Extra Points 27 36 Field Goals 3 12 Safeties 0 2
SCORING TDs Ru Pa Int Fu KO Pu PAT FG S PtsSoltau, Gordy 1 0 1 0 0 0 0 27/30 3/12 0 42Wilson, Billy 7 0 7 0 0 0 0 0/0 0/0 0 42McElhenny, Hugh 6 4 2 0 0 0 0 0/0 0/0 0 36Moegle, Dicky 5 5 0 0 0 0 0 0/0 0/0 0 30Hardy, Carroll 4 0 4 0 0 0 0 0/0 0/0 0 24Perry, Joe 3 2 1 0 0 0 0 0/0 0/0 0 18Arenas, Joe 2 0 2 0 0 0 0 0/0 0/0 0 12Berry, Rex 1 0 0 1 0 0 0 0/0 0/0 0 6Johnson, John Henry 1 1 0 0 0 0 0 0/0 0/0 0 649ERS 30 12 17 1 0 0 0 27/30 3/12 0 216OPPONENTS 37 24 10 2 0 0 1 36/37 12/24 2 298
Rookie Names in Italics

SAN FRANCISCO 49ERS
M E D I A G U I D E2 0 1 7 S E A S O N 437
1956 (5-6-1)Frank C. Albert, Coach
L 21 New York Giants (41,751), S-30 38W 33 Los Angeles Rams (56,489), O-7 30L 7 at Chicago Bears (47,526), O-14 31L 17 at Detroit (55,662), O-21 20L 21 Chicago Bears (52,612), O-28 38L 13 Detroit (46,708), N-4 17L 6 at Los Angeles Rams (69,828), N-11 30W 17 at Green Bay (17,986), N-18 16T 10 at Philadelphia (19,326), N-25 10W 20 at Baltimore (37,227), D-2 17W 38 Green Bay (32,433), D-8 20W 30 Baltimore (43,791), D-16 17 233 284
RUSHING Att Yds Avg LG TDMcElhenny, Hugh 185 916 5.0 86t 8Perry, Joe 115 520 4.5 39 3Johnson, John Henry 80 301 3.8 54 2Tittle, Y.A. 24 67 2.8 13 4Moegle, Dicky 7 18 2.6 12 0Morrall, Earl 6 10 1.7 8 0McCormick, Tom 2 4 2.0 2 049ERS 419 1,836 4.4 86t 17OPPONENTS 481 2,192 4.6 59t 18
RECEIVING No Yds Avg LG TDWilson, Billy 60 889 14.8 77t 5Conner, Clyde 22 362 16.5 49 1Soltau, Gordy 18 299 16.6 33 1Perry, Joe 18 104 5.8 20 0McElhenny, Hugh 16 193 12.1 22 0Arenas, Joe 14 226 16.1 50 1Johnson, John Henry 8 90 11.3 28 0Moegle, Dicky 3 79 26.3 37 0Jessup, Bill 2 7 3.5 10 0Smith, Charlie 1 13 13.0 13 049ERS 162 2,262 14.0 77t 8OPPONENTS 147 2,115 14.4 69t 12 INTERCEPTIONS No Yds Avg LG TDMoegle, Dicky 6 75 12.5 31t 1Berry, Rex 3 20 6.7 20 0Carr, Paul 2 18 9.0 11 0Maderos, George 2 2 1.0 2 0Hazeltine, Matt 1 7 7.0 7 0Sharkey, Ed 1 4 4.0 4 0Holladay, Bob 1 0 0.0 0 0Smith, Ernie 1 0 0.0 0 049ERS 17 126 7.4 31t 1OPPONENTS 19 330 17.4 35 0
KICKOFF RETURNS No Yds Avg LG TDArenas, Joe 27 801 29.7 96 1McElhenny, Hugh 13 300 23.1 36 0Moegle, Dicky 2 39 19.5 22 0Maderos, George 2 21 10.5 12 0Johnson, John Henry 1 23 23.0 23 0Goad, Paul 1 18 18.0 18 0McCormick, Tom 1 18 18.0 18 0Smith, Charlie 1 14 14.0 14 0Carr, Paul 1 11 11.0 11 0Gonzaga, John 1 6 6.0 6 0Herchman, Bill 1 6 6.0 6 049ERS 51 1,257 24.7 96t 1OPPONENTS 42 988 23.5 45 0
PUNT RETURNS No Yds Avg LG TDArenas, Joe 19 117 6.2 67 1McElhenny, Hugh 15 38 2.5 12 0Moegle, Dicky 1 5 5.0 5 049ERS 35 160 4.6 67 1OPPONENTS 35 123 3.5 16 0
PUNTING No Yds Avg LG BlkMorrall, Earl 45 1,705 37.9 57 0Jessup, Bill 14 563 40.2 63 049ERS 59 2,268 38.4 63 0OPPONENTS 42 1,709 40.7 56 0
PASSING Att Comp Pct Yds LG TD Int QBTittle, Y.A. 218 124 56.9 1,641 77t 7 12 68.6Morrall, Earl 78 38 48.7 621 37 1 6 48.1McElhenny, Hugh 1 0 0.0 0 0 0 1 0.049ERS 297 162 54.6 2,262 77t 8 19 61.6OPPONENTS 279 147 52.7 2,329 69t 12 17 69.7
TEAM STATISTICS 49ers OppTOTAL FIRST DOWNS 221 236 By Rushing 101 124 By Passing 107 103 By Penalties 13 9TOTAL YARDS GAINED 3,813 4,162 By Rushing 1,836 2,192 By Passing 1,977 1,970TOTAL PLAYS FROM SCRIMMAGE 795 827 Rushes 419 481 Average Gain Per Rush 4.4 4.6FORWARD PASSES ATTEMPTED 297 279 Number Completed 162 147 Per Cent Completed 54.6 52.7 Yards Lost Passing 285 145 Passes Had Intercepted 19 17 Yards Gained Per Pass 6.7 7.1 Yards Gained Per Completion 12.2 13.4PUNTS 59 42 Total Yardage of Punts 2,268 1,709 Average Length 38.4 40.7 Net avg. per punt 36.0 36.4KICKOFF RETURNS 62 51 Number Returned 51 42 Total Yards Returned 1,257 988 Average Length of Return 24.7 23.5PENALTIES 57 37 Yards Penalized 562 321FUMBLES 17 27 Own Fumbles Recovered 5 10 Opponents’ Fumbles Recovered 17 12FIELD GOALS 13 14 Field Goals Attempted 20 25TOTAL POINTS SCORED 233 284 Touchdowns Scored 28 35 Touchdowns Rushing 17 23 Touchdowns Passing 8 12 Touchdowns Returns 3 0 Extra Points 26 32 Field Goals 13 14 Safeties 0 0
SCORING TDs Ru Pa Int Fu KO Pu PAT FG S PtsSoltau, Gordy 1 0 1 0 0 0 0 26/28 13/20 0 71McElhenny, Hugh 8 8 0 0 0 0 0 0/0 0/0 0 48Wilson, Billy 5 0 5 0 0 0 0 0/0 0/0 0 30Tittle, Y.A. 4 4 0 0 0 0 0 0/0 0/0 0 24Arenas, Joe 3 0 1 0 0 1 1 0/0 0/0 0 18Perry, Joe 3 3 0 0 0 0 0 0/0 0/0 0 18Johnson, John Henry 2 2 0 0 0 0 0 0/0 0/0 0 12Conner, Clyde 1 0 1 0 0 0 0 0/0 0/0 0 6Moegle, Dicky 1 0 0 1 0 0 0 0/0 0/0 0 649ERS 28 17 8 1 0 1 1 26/28 13/20 0 233OPPONENTS 35 23 12 0 0 0 0 32/34 14/25 0 284
Rookie Names in Italics

SAN FRANCISCO 49ERS
M E D I A G U I D E2 0 1 7 S E A S O N 438
1957 (8-4/8-5)Frank C. Albert, Coach
L 10 Chicago Cards (35,743), S-29 20W 23 Los Angeles Rams (59,637), O-6 20W 21 at Chicago Bears (45,310), O-13 17W 24 at G.B. in Milwaukee (18,919), O-20 14W 21 Chicago Bears (56,693), O-27 17W 35 Detroit (59,702), N-3 31L 24 at Los Angeles Rams (102,368), N-10 37L 10 at Detroit (56,915), N-17 31L 21 at Baltimore (50,073), N-24 27W 27 at New York Giants (54,121), D-1 17W 17 Baltimore (59,950), D-8 13W 27 Green Bay (59,100), D-15 20 287 295
NFC PLAYOFF - DEC. 22(at San Francisco - Kezar Stadium)
L 27 Detroit (60,118) 31
RUSHING Att Yds Avg LG TDMcElhenny, Hugh 102 478 4.7 61 1Perry, Joe 97 454 4.7 34 3Babb, Gene 102 330 3.2 19 3Tittle, Y.A. 40 220 5.5 45 6Barnes, Larry 20 78 3.9 16 0Moegle, Dicky 9 48 5.3 18t 1Arenas, Joe 5 14 2.8 7t 1Brodie, John 2 0 0.0 0 049ERS 377 1,622 4.6 61 15OPPONENTS 434 1,847 4.3 49 23
RECEIVING No Yds Avg LG TDWilson, Billy 52 757 14.6 40 6McElhenny, Hugh 37 458 12.4 43 2Conner, Clyde 30 412 13.7 41 4Owens, R.C. 27 395 14.6 46t 5Babb, Gene 20 141 7.1 17 0Perry, Joe 15 130 8.7 17 0Soltau, Gordy 5 47 9.4 18 0Jessup, Bill 2 29 14.5 22 0Powell, Charlie 1 27 27.0 27 0Arenas, Joe 1 10 10.0 10 0Barnes, Larry 1 1 1.0 1 049ERS 191 2,407 12.6 46t 17OPPONENTS 182 2,582 14.2 82t 13
INTERCEPTIONS No Yds Avg LG TDMoegle, Dicky 8 107 13.4 40 0Stits, Bill 2 28 14.0 20 0Hazeltine, Matt 2 22 11.0 14 0Walker, Val Joe 2 20 10.0 12 0Smith, J.D. 2 17 8.5 12 0Herchman, Bill 1 54 54.0 54t 1Rubke, Karl 1 16 16.0 16 049ERS 18 264 14.7 54t 1OPPONENTS 18 336 18.7 75t 1
KICKOFF RETURNS No Yds Avg LG TDArenas, Joe 24 657 27.4 64 0Smith, J.D. 14 368 26.3 38 0Hazeltine, Matt 1 23 23.0 23 0Carr, Paul 1 10 10.0 10 0Jessup, Bill 1 8 8.0 8 0Babb, Gene 1 0 0.0 0 0Palatella, Lou (lat) 0 30 0.0 0 049ERS 42 1,096 26.1 64 0OPPONENTS 45 928 20.6 33 0
PUNT RETURNS No Yds Avg LG TDArenas, Joe 25 80 3.2 26 0McElhenny, Hugh 10 41 4.1 13 0Hazeltine, Matt 1 1 1.0 1 0Moegle, Dicky 1 0 0.0 0 049ERS 37 122 3.3 26 0OPPONENTS 35 205 5.9 28 0
PUNTING No Yds Avg LG BlkJessup, Bill 38 1,656 43.6 62 0Barnes, Larry 19 894 47.1 86 049ERS 57 2,550 44.7 86 0OPPONENTS 47 1,894 40.3 62 0
PASSING Att Comp Pct Yds LG TD Int QBTittle, Y.A. 279 176 63.1 2,157 46t 13 15 80.0Brodie, John 21 11 52.4 160 28 2 3 69.6Arenas, Joe 3 3 100.0 92 33t 2 0 158.3Barnes, Larry 1 1 100.0 -2 -2 0 0 79.1Perry, Joe 1 0 0.0 0 0 0 0 39.649ERS 305 191 62.6 2,407 46t 17 18 81.1OPPONENTS 332 182 54.8 2,582 82t 13 18 70.6
TEAM STATISTICS 49ers OppTOTAL FIRST DOWNS 223 239 By Rushing 92 107 By Passing 115 117 By Penalties 16 15TOTAL YARDS GAINED 3,658 4,248 By Rushing 1,622 1,847 By Passing 2,036 2,401TOTAL PLAYS FROM SCRIMMAGE 754 837 Rushes 377 434 Average Gain Per Rush 4.6 4.3FORWARD PASSES ATTEMPTED 305 332 Number Completed 191 182 Per Cent Completed 62.6 54.8 Yards Lost Passing 371 181 Passes Had Intercepted 18 18 Yards Gained Per Pass 6.7 7.2 Yards Gained Per Completion 10.7 13.2PUNTS 57 47 Total Yardage of Punts 2,550 1,894 Average Length 44.7 40.3 Net avg. per punt 39.7 36.9KICKOFF RETURNS 56 56 Number Returned 42 45 Total Yards Returned 1,096 928 Average Length of Return 26.1 20.6PENALTIES 66 55 Yards Penalized 629 502FUMBLES 22 25 Own Fumbles Recovered 8 9 Opponents’ Fumbles Recovered 16 14FIELD GOALS 9 13 Field Goals Attempted 15 24TOTAL POINTS SCORED 260 264 Touchdowns Scored 33 32 Touchdowns Rushing 15 18 Touchdowns Passing 17 13 Touchdowns Returns 1 1 Extra Points 33 31 Field Goals 9 13 Safeties 1 1
SCORING TDs Ru Pa Int Fu KO Pu PAT FG S PtsSoltau, Gordy 0 0 0 0 0 0 0 33/33 9/15 0 60Tittle, Y.A. 6 6 0 0 0 0 0 0/0 0/0 0 36Wilson, Billy 6 0 6 0 0 0 0 0/0 0/0 0 36Owens, R.C. 5 0 5 0 0 0 0 0/0 0/0 0 30Conner, Clyde 4 0 4 0 0 0 0 0/0 0/0 0 24Babb, Gene 3 3 0 0 0 0 0 0/0 0/0 0 18McElhenny, Hugh 3 1 2 0 0 0 0 0/0 0/0 0 18Perry, Joe 3 3 0 0 0 0 0 0/0 0/0 0 18Arenas, Joe 1 1 0 0 0 0 0 0/0 0/0 0 6Herchman, Bill 1 0 0 1 0 0 0 0/0 0/0 0 6Moegle, Dicky 1 1 0 0 0 0 0 0/0 0/0 0 6Nomellini, Leo 0 0 0 0 0 0 0 0/0 0/0 1 249ERS 33 15 17 1 0 0 0 33/33 9/15 1 260OPPONENTS 32 18 13 1 0 0 0 31/32 13/24 1 264
Rookie Names in Italics

SAN FRANCISCO 49ERS
M E D I A G U I D E2 0 1 7 S E A S O N 439
1958 (6-6)Frank C. Albert, Coach
W 23 Pittsburgh (51,856), S-28 20L 3 Los Angeles Rams (59,826), O-5 33L 6 at Chicago Bears (45,310), O-12 28W 30 at Philadelphia (33,110), O-19 24L 14 Chicago Bears (59,441), O-26 27W 24 Detroit (59,350), N-2 21L 7 at Los Angeles Rams (95,082), N-9 56L 21 at Detroit (54,523), N-16 35W 33 at G.B. in Milwaukee (43,819), N-23 12L 27 at Baltimore (57,557), N-30 35W 48 Green Bay (50,793), D-7 21W 21 Baltimore (58,334), D-14 12 257 324
RUSHING Att Yds Avg LG TDPerry, Joe 125 758 6.1 73t 4McElhenny, Hugh 113 451 4.0 34 6Smith, J.D. 26 209 8.0 80t 3Pace, Jim 52 161 3.1 34 2Tittle, Y.A. 22 35 1.6 12 2Woodson, Abe 2 12 6.0 9 0Babb, Gene 7 9 1.3 4 0Atkins, Bill 1 5 5.0 5 0Brodie, John 11 -12 -1.1 6 149ERS 359 1,628 4.5 80t 18OPPONENTS 380 2,038 5.4 73t 16
RECEIVING No Yds Avg LG TDConner, Clyde 49 512 10.4 26 5Wilson, Billy 43 592 13.8 44t 5Owens, R.C. 40 620 15.5 48 1McElhenny, Hugh 31 366 11.8 59t 2Perry, Joe 23 218 9.5 64t 1Pace, Jim 10 59 5.9 24 0Dugan, Fred 9 122 13.6 23 0Soltau, Gordy 7 77 11.0 22 0Smith, J.D. 6 59 9.8 23 0Jessup, Bill 5 66 13.2 26t 149ERS 223 2,691 12.1 64t 15OPPONENTS 163 2,218 13.6 81t 25
INTERCEPTIONS No Yds Avg LG TDRidlon, Jim 4 10 2.5 3 0Hazeltine, Matt 3 30 10.0 17 1Stits, Bill 3 3 1.0 2 0Mertens, Jerry 2 16 8.0 11 0Woodson, Abe 1 44 44.0 44 0Atkins, Bill 1 6 6.0 6 0Toneff, Bob 1 5 5.0 5 0Matuszak, Marv 1 0 0.0 0 049ERS 16 114 7.1 44 1OPPONENTS 29 448 15.5 70t 2
KICKOFF RETURNS No Yds Avg LG TDSmith, J.D. 15 356 23.7 39 0Woodson, Abe 11 239 21.7 34 0Pace, Jim 8 134 16.8 36 0McElhenny, Hugh 2 31 15.5 18 0Babb, Gene 2 30 15.0 19 0Connolly, Ted 1 0 0.0 0 049ERS 39 790 20.3 39 0OPPONENTS 42 739 17.6 30 0
PUNT RETURNS No Yds Avg LG TDMcElhenny, Hugh 24 93 3.9 49 0Woodson, Abe 7 53 7.6 38 0Jessup, Bill 2 0 0.0 0 0Pace, Jim 2 0 0.0 0 049ERS 35 146 4.2 49 0OPPONENTS 36 132 3.7 22 0
PUNTING No Yds Avg LG BlkAtkins, Bill 25 983 39.3 51 0Jessup, Bill 23 856 37.2 59 049ERS 48 1,839 38.3 59 0OPPONENTS 49 1,995 40.7 59 0
PASSING Att Comp Pct Yds LG TD Int QBBrodie, John 172 103 59.9 1,224 61t 6 13 61.8Tittle, Y.A. 208 120 57.7 1,467 64t 9 15 63.9McElhenny, Hugh 2 0 0.0 0 0 0 0 39.6Jessup, Bill 1 0 0 0 0 1 0.049ERS 383 223 58.2 2,691 64t 15 29 61.4OPPONENTS 341 163 47.8 2,218 81t 25 16 73.9
TEAM STATISTICS 49ers OppTOTAL FIRST DOWNS 237 227 By Rushing 93 106 By Passing 126 106 By Penalties 18 15TOTAL YARDS GAINED 4,111 4,010 By Rushing 1,628 2,038 By Passing 2,483 1,972TOTAL PLAYS FROM SCRIMMAGE 811 787 Rushes 359 380 Average Gain Per Rush 4.5 5.4FORWARD PASSES ATTEMPTED 383 341 Number Completed 223 163 Per Cent Completed 58.2 47.8 Yards Lost Passing 208 246 Passes Had Intercepted 29 16 Yards Gained Per Pass 6.5 5.8 Yards Gained Per Completion 11.1 12.1PUNTS 48 49 Total Yardage of Punts 1,839 1,995 Average Length 38.3 40.7 Net avg. per punt 35.6 37.3KICKOFF RETURNS 50 50 Number Returned 39 42 Total Yards Returned 790 739 Average Length of Return 20.3 17.6PENALTIES 58 52 Yards Penalized 619 510FUMBLES 31 32 Own Fumbles Recovered 20 17 Opponents’ Fumbles Recovered 15 11FIELD GOALS 8 10 Field Goals Attempted 21 17TOTAL POINTS SCORED 257 324 Touchdowns Scored 34 42 Touchdowns Rushing 18 15 Touchdowns Passing 15 25 Touchdowns Returns 1 2 Extra Points 29 40 Field Goals 8 10 Safeties 0 1
SCORING TDs Ru Pa Int Fu KO Pu PAT FG S PtsSoltau, Gordy 0 0 0 0 0 0 0 29/33 8/21 0 53McElhenny, Hugh 8 6 2 0 0 0 0 0/0 0/0 0 48Conner, Clyde 5 0 5 0 0 0 0 0/0 0/0 0 30Perry, Joe 5 4 1 0 0 0 0 0/0 0/0 0 30Wilson, Billy 5 0 5 0 0 0 0 0/0 0/0 0 30Smith, J.D. 3 3 0 0 0 0 0 0/0 0/0 0 18Pace, Jim 2 2 0 0 0 0 0 0/0 0/0 0 12Tittle, Y.A. 2 2 0 0 0 0 0 0/0 0/0 0 12Brodie, John 1 1 0 0 0 0 0 0/0 0/0 0 6Hazeltine, Matt 1 0 0 1 0 0 0 0/0 0/0 0 6Jessup, Bill 1 0 1 0 0 0 0 0/0 0/0 0 6Owens, R.C. 1 0 1 0 0 0 0 0/0 0/0 0 649ERS 34 18 15 1 0 0 0 29/33 8/21 0 257OPPONENTS 42 15 25 2 0 0 0 40/41 10/17 1 324
Rookie Names in Italics
SAN FRANCISCO 49ERS
M E D I A G U I D E2 0 1 7 S E A S O N 440
1959 (7-5)Howard W. Hickey, Coach
W 24 Philadelphia (41,697), S-27 14W 34 Los Angeles Rams (56,028), O-4 0L 20 at Green Bay (32,150), O-11 21W 34 at Detroit (52,585), O-18 13W 20 Chicago Bears (59,045), O-25 17W 33 Detroit (59,064), N-1 7W 24 at Los Angeles Rams (94,276), N-8 16L 3 at Chicago Bears (42,157), N-15 14L 14 at Baltimore (56,007), N-22 45W 21 at Cleveland (53,763), N-29 20L 14 Baltimore (59,075), D-5 34L 14 Green Bay (55,997),D-13 36 255 237
RUSHING Att Yds Avg LG TDSmith, J.D. 207 1,036 5.0 73t 10Perry, Joe 139 602 4.3 40 3McElhenny, Hugh 18 67 3.7 19 1Roberts, C.R. 10 67 6.7 46t 1Lyles, Lenny 13 28 2.2 13t 1Tittle, Y.A. 11 24 2.2 22 0Moegle, Dicky 3 9 3.0 4 0Brodie, John 5 6 1.2 6 0Owens, R.C. 1 0 0.0 0 049ERS 407 1,839 4.5 73t 16OPPONENTS 433 1,974 4.6 48 17
RECEIVING No Yds Avg LG TDWilson, Billy 44 540 12.3 57t 4McElhenny, Hugh 22 329 15.0 72 3Owens, R.C. 17 347 20.4 75t 3Conner, Clyde 13 162 12.5 37t 1Smith, J.D. 13 133 10.2 21t 1Perry, Joe 12 53 4.4 15 0Dugan, Fred 6 72 12.0 13 0Lyles, Lenny 3 33 11.0 18 0Moegle, Dicky 1 12 12.0 12 0Tittle, Y.A. 1 4 4.0 4 049ERS 132 1,685 12.8 75t 12OPPONENTS 176 2,272 12.9 67 15
INTERCEPTIONS No Yds Avg LG TDBaker, Dave 5 75 15.0 29 0Woodson, Abe 4 20 5.0 14 0Mertens, Jerry 2 56 28.0 30t 1Tubbs, Jerry 2 32 16.0 21 0Dove, Eddie 1 6 6.0 6 049ERS 14 189 13.5 30t 1OPPONENTS 22 272 12.4 57t 1
KICKOFF RETURNS No Yds Avg LG TDWoodson, Abe 13 382 29.4 105t 1Lyles, Lenny 25 565 22.6 46 0Hazeltine, Matt 2 26 13.0 26 0Herchman, Bill 1 7 7.0 7 049ERS 41 980 23.9 105t 1OPPONENTS 40 924 23.1 80 0
PUNT RETURNS No Yds Avg LG TDWoodson, Abe 15 143 9.5 65 0Dove, Eddie 22 126 5.7 62 049ERS 37 269 7.3 65 0OPPONENTS 35 186 5.3 21 0
PUNTING No Yds Avg LG BlkDavis, Tommy 59 2,694 45.7 71 049ERS 59 2,694 45.7 71 0OPPONENTS 57 2,370 41.6 59 0
PASSING Att Comp Pct Yds LG TD Int QBTittle, Y.A. 199 102 51.3 1,331 75t 10 15 58.0Brodie, John 64 30 46.9 354 34 2 7 35.0Moegle, Dicky 1 0 0.0 0 0 0 0 39.649ERS 264 132 50.0 1,685 75t 12 22 50.8OPPONENTS 341 176 51.6 2,261 67 15 14 70.2
TEAM STATISTICS 49ers OppTOTAL FIRST DOWNS 182 238 By Rushing 93 123 By Passing 76 102 By Penalties 13 13TOTAL YARDS GAINED 3,388 4,018 By Rushing 1,839 1,974 By Passing 1,549 2,044TOTAL PLAYS FROM SCRIMMAGE 756 844 Rushes 407 433 Average Gain Per Rush 4.5 4.6FORWARD PASSES ATTEMPTED 264 341 Number Completed 132 176 Per Cent Completed 50.0 51.6 Yards Lost Passing 136 228 Passes Had Intercepted 22 14 Yards Gained Per Pass 5.9 6.0 Yards Gained Per Completion 11.7 11.6PUNTS 59 57 Total Yardage of Punts 2,694 2,370 Average Length 45.7 41.6 Net avg. per punt 40.8 34.8KICKOFF RETURNS 49 50 Number Returned 41 40 Total Yards Returned 980 924 Average Length of Return 23.9 23.1PENALTIES 57 45 Yards Penalized 489 417FUMBLES 24 34 Own Fumbles Recovered 14 12 Opponents’ Fumbles Recovered 22 10FIELD GOALS 12 5 Field Goals Attempted 26 13TOTAL POINTS SCORED 255 237 Touchdowns Scored 31 32 Touchdowns Rushing 16 16 Touchdowns Passing 12 15 Touchdowns Returns 3 1 Extra Points 31 28 Field Goals 12 5 Safeties 1 1
SCORING TDs Ru Pa Int Fu KO Pu PAT FG S PtsDavis, Tommy 0 0 0 0 0 0 0 31/31 12/26 0 67Smith, J.D. 11 10 1 0 0 0 0 0/0 0/0 0 66McElhenny, Hugh 4 1 3 0 0 0 0 0/0 0/0 0 24Wilson, Billy 4 0 4 0 0 0 0 0/0 0/0 0 24Owens, R.C. 3 0 3 0 0 0 0 0/0 0/0 0 18Perry, Joe 3 3 0 0 0 0 0 0/0 0/0 0 18Conner, Clyde 1 0 1 0 0 0 0 0/0 0/0 0 6Hazeltine, Matt 1 0 0 0 1 0 0 0/0 0/0 0 6Lyles, Lenny 1 1 0 0 0 0 0 0/0 0/0 0 6Mertens, Jerry 1 0 0 1 0 0 0 0/0 0/0 0 6Roberts, C.R. 1 1 0 0 0 0 0 0/0 0/0 0 6Woodson, Abe 1 0 0 0 0 1 0 0/0 0/0 0 6Krueger, Charlie 0 0 0 0 0 0 0 0/0 0/0 1 249ERS 31 16 12 1 1 1 0 31/31 12/26 1 255OPPONENTS 32 16 15 1 0 0 0 28/31 5/13 1 237
Rookie Names in Italics

SAN FRANCISCO 49ERS
M E D I A G U I D E2 0 1 7 S E A S O N 441
1960 (7-5)Howard W. Hickey, Coach
L 19 New York Giants (44,598), S-25 21W 13 Los Angeles Rams (53,633), O-2 9W 14 at Detroit (49,825), O-9 10L 10 at Chicago Bears (48,226), O-16 27L 14 at G.B. in Milwaukee (39,914), O-23 41W 25 Chicago Bears (55,071), O-30 7L 0 Detroit (48,447), N-6 24W 26 at Dallas (10,000), N-20 14W 30 at Baltimore (57,808), N-27 22W 23 at Los Angeles Rams (77,254), D-4 7L 0 Green Bay (53,612), D-10 13W 34 Baltimore (57,269), D-18 10 208 205
RUSHING Att Yds Avg LG TDSmith, J.D. 174 780 4.5 41 5McElhenny, Hugh 95 347 3.7 38 0Roberts, C.R. 73 213 2.9 30 2Brodie, John 18 171 9.5 30 1Perry, Joe 36 95 2.6 21 1Tittle, Y.A. 10 61 6.1 28 0Waters, Bobby 1 8 8.0 8 0Woodson, Abe 4 4 1.0 4 0Norton, Ray 2 2 1.0 9 049ERS 413 1,681 4.1 41 9OPPONENTS 363 1,587 4.4 62 14
RECEIVING No Yds Avg LG TDConner, Clyde 38 531 14.0 65t 2Owens, R.C. 37 532 14.4 42 6Smith, J.D. 36 181 5.0 21 1Stickles, Monty 22 252 11.5 28 0McElhenny, Hugh 14 114 8.1 45 1Mackey, Dee 12 159 13.3 25 0Roberts, C.R. 9 49 5.4 27 0Wilson, Billy 3 51 17.0 19t 1Perry, Joe 3 -3 -1.0 3 049ERS 174 1,866 10.7 65t 11OPPONENTS 140 2,001 14.3 91t 11
INTERCEPTIONS No Yds Avg LG TDBaker, Dave 10 96 9.6 28 0Dove, Eddie 3 29 9.7 29 0Kelley, Gordon 2 10 5.0 10 0Mertens, Jerry 2 0 0.0 0 0Woodson, Abe 2 0 0.0 0 0Harrison, Bob 1 6 6.0 6 049ERS 20 141 7.1 29 0OPPONENTS 12 159 13.3 26 0
KICKOFF RETURNS No Yds Avg LG TDLyles, Lenny 17 526 30.9 97t 1Woodson, Abe 17 498 29.3 64 0Colchico, Dan 5 68 13.6 18 0Roberts, C.R. 3 60 20.0 25 0Clark, Monte 1 15 15.0 15 049ERS 43 1,167 27.1 97t 1OPPONENTS 38 769 20.2 45 0
PUNT RETURNS No Yds Avg LG TDWoodson, Abe 13 174 13.4 48 0Dove, Eddie 11 43 3.9 7 049ERS 24 217 9.0 48 0OPPONENTS 28 182 6.5 31 0
PUNTING No Yds Avg LG BlkDavis, Tommy 62 2,737 44.1 74 0Baker, Dave 3 143 47.7 55 049ERS 65 2,880 44.3 74 0OPPONENTS 62 2,561 41.3 65 0
PASSING Att Comp Pct Yds LG TD Int QBBrodie, John 207 103 49.8 1,111 65t 6 9 57.5Tittle, Y.A. 127 69 54.3 694 45 4 3 70.8Waters, Bobby 2 2 100.0 61 41t 1 0 158.349ERS 336 174 51.8 1,866 65t 11 12 64.4OPPONENTS 293 140 47.8 2,001 91t 11 20 54.4
TEAM STATISTICS 49ers OppTOTAL FIRST DOWNS 201 180 By Rushing 90 82 By Passing 96 89 By Penalties 15 9TOTAL YARDS GAINED 3,260 3,405 By Rushing 1,681 1,587 By Passing 1,579 1,818TOTAL PLAYS FROM SCRIMMAGE 849 738 Rushes 413 363 Average Gain Per Rush 4.1 4.4FORWARD PASSES ATTEMPTED 336 293 Number Completed 174 140 Per Cent Completed 51.8 47.8 Yards Lost Passing 287 183 Passes Had Intercepted 12 20 Yards Gained Per Pass 4.7 6.2 Yards Gained Per Completion 9.1 13.0PUNTS 65 62 Total Yardage of Punts 2,880 2,556 Average Length 44.3 41.3 Net avg. per punt 40.9 36.8KICKOFF RETURNS 43 57 Number Returned 43 38 Total Yards Returned 1,167 769 Average Length of Return 27.1 20.2PENALTIES 63 64 Yards Penalized 604 580FUMBLES 14 15 Own Fumbles Recovered 10 7 Opponents’ Fumbles Recovered 8 4FIELD GOALS 12 10 Field Goals Attempted 26 20TOTAL POINTS SCORED 208 205 Touchdowns Scored 21 25 Touchdowns Rushing 9 13 Touchdowns Passing 11 11 Touchdowns Returns 1 1 Extra Points 21 23 Field Goals 8 10 Safeties 2 1
SCORING TDs Ru Pa Int Fu KO Pu PAT FG S PtsDavis, Tommy 0 0 0 0 0 0 0 21/21 19/32 0 78Owens, R.C. 6 0 6 0 0 0 0 0/0 0/0 0 36Smith, J.D. 6 5 1 0 0 0 0 0/0 0/0 0 36Conner, Clyde 2 0 2 0 0 0 0 0/0 0/0 0 12Roberts, C.R. 2 2 0 0 0 0 0 0/0 0/0 0 12Brodie, John 1 1 0 0 0 0 0 0/0 0/0 0 6Lyles, Lenny 1 0 0 0 0 1 0 0/0 0/0 0 6McElhenny, Hugh 1 0 1 0 0 0 0 0/0 0/0 0 6Perry, Joe 1 1 0 0 0 0 0 0/0 0/0 0 6Wilson, Billy 1 0 1 0 0 0 0 0/0 0/0 0 6Krueger, Charlie 0 0 0 0 0 0 0 0/0 0/0 1 2Nomellini, Leo 0 0 0 0 0 0 0 0/0 0/0 1 2Wittenborn, John 0 0 0 0 0 0 0 0/0 0/3 0 049ERS 21 9 11 0 0 1 0 21/21 19/35 2 208OPPONENTS 25 13 11 0 1 0 0 23/25 10/20 1 205
Rookie Names in Italics
SAN FRANCISCO 49ERS
M E D I A G U I D E2 0 1 7 S E A S O N 442
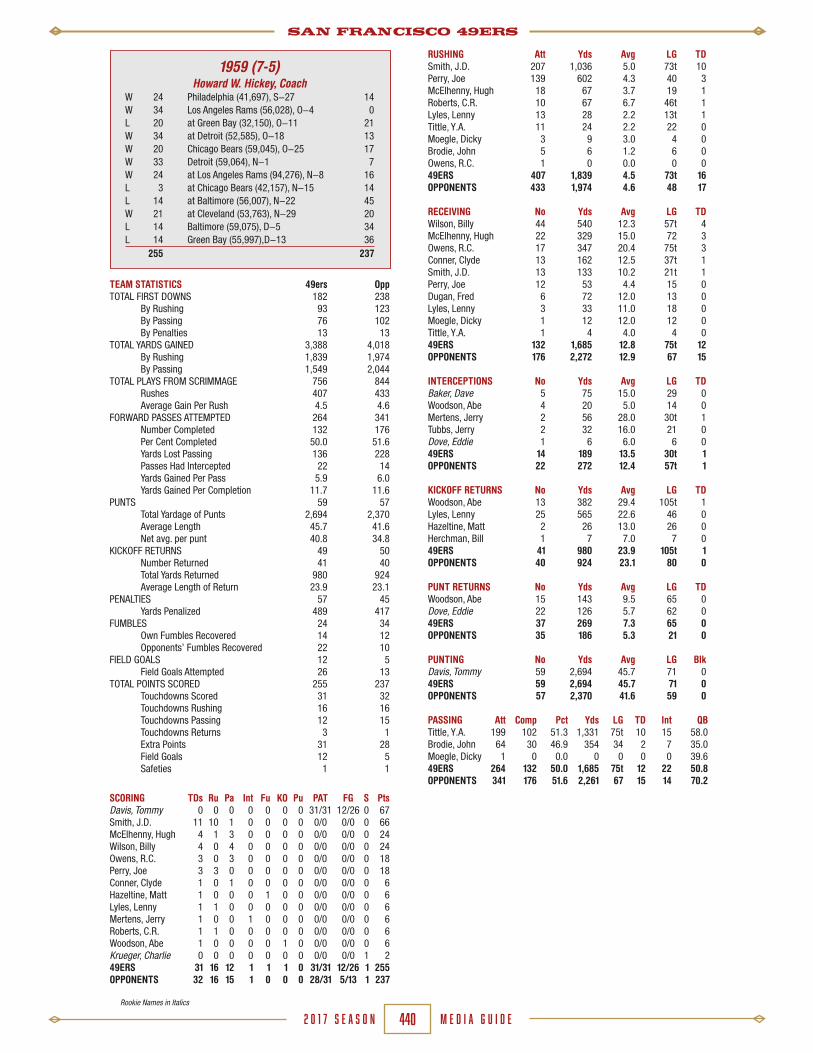
1961 (7-6-1)Howard W. Hickey, Coach
W 35 Washington (43,412), S-17 3L 10 at Green Bay (38,624), S-24 30W 49 at Detroit (53,155), O-1 0W 35 Los Angeles Rams (59,004), O-8 0W 38 at Minnesota (34,415), O-15 24L 0 at Chicago Bears (49,070), O-22 31L 10 at Pittsburgh (19,686), O-29 20T 20 Detroit (56,878), N-5 20L 7 at Los Angeles Rams (63,766), N-12 17W 41 Chicago Bears (52,972), N-19 31W 38 Minnesota (48,905), N-26 28L 17 at Baltimore (57,641), D-3 20W 22 Green Bay (55,722), D-10 21L 24 Baltimore (45,517), D-16 27 346 272
RUSHING Att Yds Avg LG TDSmith, J.D. 167 823 4.9 33 8Kilmer, Billy 96 509 5.3 31 10Roberts, C.R. 63 338 5.4 54 1Waters, Bobby 47 233 5.0 35 3Brodie, John 28 90 3.2 29 2McIlhenny, Don 8 30 3.8 15 0Woodson, Abe 14 23 1.6 14 0Lockett, J.W. 11 18 1.6 9 1Cooper, Bill 8 17 2.1 6 1Messer, Dale 3 13 4.3 6 0Norton, Ray 2 -2 -1.0 2 0Thomas, Aaron 1 -15 -15.0 -15 0Owens, R.C. (lat) 0 23 23 149ERS 448 2,100 4.7 54 27OPPONENTS 419 1,701 4.1 44 13
RECEIVING No Yds Avg LG TDOwens, R.C. 55 1,032 18.8 54 5Stickles, Monty 43 794 18.5 54 5Smith, J.D. 28 343 12.3 57 1Thomas, Aaron 15 301 20.1 70t 2Conner, Clyde 11 177 16.1 45 1Casey, Bernie 10 185 18.5 51 1Roberts, C.R. 10 83 8.3 19 0Woodson, Abe 8 74 9.3 28 0Lockett, J.W. 4 35 8.8 0Messer, Dale 3 33 11.0 14 049ERS 187 3,057 16.4 70t 15OPPONENTS 196 2,874 14.7 80t 18 INTERCEPTIONS No Yds Avg LG TDBaker, Dave 6 123 20.5 40 0Johnson, Jimmy 5 116 23.2 63 0Dove, Eddie 3 41 13.7 28 0Harrison, Bob 2 14 7.0 9 0Hazeltine, Matt 1 26 26.0 26 0Woodson, Abe 1 2 2.0 2 0Kelley, Gordon 1 0 0.0 0 049ERS 19 322 17.0 63 0OPPONENTS 19 249 13.1 36 0
KICKOFF RETURNS No Yds Avg LG TDWoodson, Abe 27 782 29.0 98t 1Smith, J.D. 7 158 22.6 33 0McIlhenny, Don 6 189 31.5 49 0Cooper, Bill 3 44 14.7 20 0Messer, Dale 3 36 12.0 14 0Norton, Ray 1 60 60.0 60 0Kammerer, Carlton 1 18 18.0 18 0Lockett, J.W. 1 15 15.0 15 049ERS 49 1,302 26.6 98t 1OPPONENTS 58 1,368 23.6 78 0
PUNT RETURNS No FC Yds Avg LG TDWoodson, Abe 16 3 172 10.8 80t 1Dove, Eddie 6 8 49 8.2 20 0Messer, Dale 2 4 11 5.5 6 049ERS 24 15 232 9.7 80t 1OPPONENTS 32 6 269 8.4 39t 1
PUNTING No Yds Avg LG BlkDavis, Tommy 50 2,269 45.4 67 0Kilmer, Billy 9 364 40.4 64 049ERS 59 2,633 44.6 67 0OPPONENTS 62 2,725 44.0 64 0
PASSING Att Comp Pct Yds LG TD Int QBBrodie, John 283 155 54.8 2,588 70t 14 12 84.7Kilmer, Billy 34 19 55.9 286 28 0 4 44.1Waters, Bobby 28 13 46.4 183 26 1 2 50.2Smith, J.D. 1 0 0.0 0 0 0 1 0.049ERS 346 187 54.1 3,057 70t 15 19 75.5OPPONENTS 380 196 51.6 2,874 80t 18 19 71.5
TEAM STATISTICS 49ers OppTOTAL FIRST DOWNS 258 234 By Rushing 116 90 By Passing 132 132 By Penalties 10 12TOTAL YARDS GAINED 4,904 4,181 By Rushing 2,100 1,701 By Passing 2,804 2,480TOTAL PLAYS FROM SCRIMMAGE 875 890 Rushes 448 419 Average Gain Per Rush 4.7 4.1FORWARD PASSES ATTEMPTED 346 380 Number Completed 187 196 Per Cent Completed 54.0 51.6 Yards Lost Passing 253 394 Passes Had Intercepted 19 19 Yards Gained Per Pass 8.1 6.5 Yards Gained Per Completion 15.0 12.7PUNTS 59 62 Total Yardage of Punts 2,633 2,725 Average Length 44.6 44.0 Net avg. per punt 40.1 40.2KICKOFF RETURNS 49 58 Total Yards Returned 1,287 1,368 Average Length of Return 26.6 23.6PENALTIES 65 56 Yards Penalized 635 456FUMBLES 25 21 Own Fumbles Recovered 8 9 Opponents’ Fumbles Recovered 12 17FIELD GOALS 12 16 Field Goals Attempted 22 29TOTAL POINTS SCORED 346 272 Touchdowns Scored 44 32 Touchdowns Rushing 27 13 Touchdowns Passing 15 18 Touchdowns Returns 2 1 Extra Points 44 32 Field Goals 12 16 Safeties 1 0SCORING TDs Ru Pa Int Fu KO Pu PAT FG S PtsDavis, Tommy 0 0 0 0 0 0 0 44/44 12/22 0 80Kilmer, Billy 10 10 0 0 0 0 0 0/0 0/0 0 60Smith, J.D. 9 8 1 0 0 0 0 0/0 0/0 0 54Owens, R.C. 6 1 5 0 0 0 0 0/0 0/0 0 36Stickles, Monty 5 0 5 0 0 0 0 0/0 0/0 0 30Waters, Bobby 3 3 0 0 0 0 0 0/0 0/0 0 18Brodie, John 2 2 0 0 0 0 0 0/0 0/0 0 12Thomas, Aaron 2 0 2 0 0 0 0 0/0 0/0 0 12Woodson, Abe 2 0 0 0 0 1 1 0/0 0/0 0 12Casey, Bernie 1 0 1 0 0 0 0 0/0 0/0 0 6Conner, Clyde 1 0 1 0 0 0 0 0/0 0/0 0 6Cooper, Bill 1 1 0 0 0 0 0 0/0 0/0 0 6Lockett, J.W. 1 1 0 0 0 0 0 0/0 0/0 0 6Roberts, C.R. 1 1 0 0 0 0 0 0/0 0/0 0 6Krueger, Charlie 0 0 0 0 0 0 0 0/0 0/0 1 249ERS 44 27 15 0 0 1 1 44/44 12/22 1 346OPPONENTS 32 13 18 0 0 0 1 32/32 16/29 0 272
Rookie Names in Italics

SAN FRANCISCO 49ERS
M E D I A G U I D E2 0 1 7 S E A S O N 443
1962 (6-8)Howard W. Hickey, Coach
L 14 Chicago (46,052), S-16 30L 24 at Detroit (51,032), S-23 45W 21 Minnesota (38,407), S-30 7W 21 at Baltimore (54,148), O-7 13W 34 at Chicago (48,902), O-14 27L 13 at G.B. in Milwaukee (46,012), O-21 31L 14 Los Angeles Rams (51,033), O-28 28L 3 Baltimore (44,875), N-4 22L 24 Detroit (43,449), N-11 38W 24 at Los Angeles Rams (42,554), N-18 17W 24 at St. Louis (17,532), N-25 17W 35 at Minnesota (33,076), D-2 12L 21 Green Bay (53,769), D-9 31L 10 Cleveland (35,274), D-15 13 282 331
RUSHING Att Yds Avg Lg TDSmith, J.D. 258 907 3.5 28 6Kilmer, Billy 93 478 5.1 35 5Brodie, John 37 258 7.0 21 4Gaiters, Bob 36 158 4.4 53 0Waters, Bobby 12 42 3.5 14 0Vollenweider, Jim 11 37 3.4 10 0Roberts, C.R. 9 19 2.1 12 0Cooper, Bill 2 -2 -1.0 2 0Thomas, Aaron 1 -9 -9.0 -9 0Winston, Lloyd 1 -15 -15.0 -15 049ERS 460 1,873 4.1 53 15OPPONENTS 464 2,241 4.8 77t 21
RECEIVING No Yds Avg LG TDCasey, Bernie 53 819 15.5 48t 6Johnson, Jimmy 34 627 18.4 80t 4Conner, Clyde 24 240 10.0 18 4Stickles, Monty 22 366 16.6 48 3Smith, J.D. 21 197 9.4 47 1Kilmer, Billy 16 152 9.5 70 1Vollenweider, Jim 4 21 5.3 10 0Messer, Dale 3 30 10.0 15 0McFarland, Kay 3 24 8.0 16 0Gaiters, Bob 2 13 6.5 13 0Roberts, C.R. 2 0 0.0 1 0Winston, Lloyd 1 2 2.0 2 049ERS 185 2,491 13.5 80t 19OPPONENTS 164 2,494 15.2 73t 17
INTERCEPTIONS No Yds Avg LG TDWoodson, Abe 2 31 15.5 31 0Hazeltine, Matt 2 24 12.0 12 0Pine, Ed 2 16 8.0 13 0Mertens, Jerry 2 0 0.0 0 0Messer, Dale 1 35 35.0 35 0Kammerer, Carlton 1 13 13.0 13 0Ridlon, Jim 1 8 8.0 8 0Dove, Eddie 1 0 0.0 0 049ERS 12 127 10.6 35 0OPPONENTS 19 334 17.6 55t 3
KICKOFF RETURNS No Yds Avg LG TDWoodson, Abe 37 1,157 31.3 79 0Gaiters, Bob 11 273 24.8 47 0Vollenweider, Jim 6 113 18.8 45 0Messer, Dale 4 112 28.0 43 0Winston, Lloyd 3 67 22.3 29 0Cooper, Bill 1 17 17.0 17 049ERS 62 1,739 28.1 79 0OPPONENTS 51 1,140 22.4 40 0
PUNT RETURNS No FC Yds Avg LG TDWoodson, Abe 19 3 179 9.4 85t 1Dove, Eddie 5 2 21 4.2 10 0Messer, Dale 3 8 7 2.3 7 049ERS 27 13 207 7.7 85t 1OPPONENTS 32 5 285 8.9 31 0
PUNTING No Yds Avg LG BlkDavis, Tommy 48 2,188 45.6 82 049ERS 48 2,188 45.6 82 0OPPONENTS 61 2,720 44.6 75 0
PASSING Att Comp Pct Yds LG TD Int QBBrodie, John 304 175 57.6 2,272 80t 18 16 79.0Kilmer, Billy 13 8 61.5 191 73 1 3 91.5Waters, Bobby 6 2 33.3 28 15 0 0 49.349ERS 323 185 57.3 2,491 80t 19 19 77.0OPPONENTS 296 164 55.4 2,494 73t 17 12 85.6
TEAM STATISTICS 49ers OppTOTAL FIRST DOWNS 239 240 By Rushing 112 107 By Passing 112 113 By Penalties 15 20TOTAL YARDS GAINED 3,941 4,549 By Rushing 1,873 2,241 By Passing 2,068 2,308TOTAL PLAYS FROM SCRIMMAGE 854 841 Rushes 460 464 Average Gain Per Rush 4.1 4.8FORWARD PASSES ATTEMPTED 323 296 Number Completed 185 164 Per Cent Completed 57.3 55.4 Yards Lost Passing 423 186 Passes Had Intercepted 19 12 Yards Gained Per Pass 7.7 8.4 Yards Gained Per Completion 13.5 15.2PUNTS 48 61 Total Yardage of Punts 2,188 2,721 Average Length 45.6 44.6KICKOFF RETURNS 62 51 Total Yards Returned 1,739 1,140 Average Length of Return 28.0 22.4PENALTIES 63 57 Yards Penalized 636 626FUMBLES 24 22 Own Fumbles Recovered 10 14 Opponents’ Fumbles Recovered 8 14FIELD GOALS 10 12 Field Goals Attempted 23 20TOTAL POINTS SCORED 282 331 Touchdowns Scored 36 42 Touchdowns Rushing 15 22 Touchdowns Passing 19 17 Touchdowns Returns 2 3 Extra Points 36 39 Field Goals 10 20 Safeties 0 2
SCORING TDs Ru Pa Int Fu KO Pu PAT FG S PtsDavis, Tommy 0 0 0 0 0 0 0 36/36 10/23 0 66Smith, J.D. 7 6 1 0 0 0 0 0/0 0/0 0 42Casey, Bernie 6 0 6 0 0 0 0 0/0 0/0 0 36Kilmer, Billy 6 5 1 0 0 0 0 0/0 0/0 0 36Brodie, John 4 4 0 0 0 0 0 0/0 0/0 0 24Conner, Clyde 4 0 4 0 0 0 0 0/0 0/0 0 24Johnson, Jimmy 4 0 4 0 0 0 0 0/0 0/0 0 24Stickles, Monty 3 0 3 0 0 0 0 0/0 0/0 0 18Woodson, Abe 2 0 0 0 1 0 1 0/0 0/0 0 1249ERS 36 15 19 0 1 0 1 36/36 10/23 0 282OPPONENTS 42 22 17 3 0 0 0 39/42 12/20 2 331
Rookie Names in Italics

SAN FRANCISCO 49ERS
M E D I A G U I D E2 0 1 7 S E A S O N 444
1963 (2-12)Coach*
L 20 Minnesota (30,781), S-15 24L 14 Baltimore (31,006), S-22 20L 14 at Minnesota (28,567), S-29 45L 3 at Detroit (44,088), O-6 26L 3 at Baltimore (56,962), O-13 20W 20 Chicago (35,837), O-20 14L 21 at Los Angeles Rams (45,532), O-27 28L 7 Detroit (33,511), N-3 45W 31 Dallas (29,563), N-10 24L 14 at New York Giants (62,982), N-17 48L 10 at G.B. in Milwaukee (45,905), N-24 28L 17 Los Angeles Rams (33,321), D-1 21L 7 at Chicago (46,994), D-8 27L 17 Green Bay (31,031), D-14 21 198 391* Coach Red Hickey resigned after third game and Jack Christiansen was appointed his successor.
RUSHING Att Yds Avg Lg TDSmith, J.D. 162 560 3.5 52t 5Lisbon, Don 109 399 3.7 25 0Winston, Lloyd 27 127 4.7 38 1Vollenweider, Jim 47 124 2.6 12 2Perry, Joe 24 98 4.1 16 0Brodie, John 7 63 9.0 24 0McHan, Lamar 17 59 3.5 15 0Lind, Mike 8 26 3.3 7 0Waters, Bobby 5 -2 -0.4 8 049ERS 406 1,454 3.6 52t 8OPPONENTS 488 2,076 4.3 51t 20
RECEIVING No Yds Avg LG TDCasey, Bernie 47 762 16.2 68t 7Lisbon, Don 21 259 12.3 51 2Knafelc, Gary 18 221 12.3 45t 2Smith, J.D. 17 196 11.5 40 1Conner, Clyde 16 247 15.4 42 0Stickles, Monty 11 152 13.8 31 0McFarland, Kay 11 126 11.5 33 1Johnson, Jimmy 6 63 10.5 15 0Perry, Joe 4 12 3.0 8 0Lind, Mike 2 13 6.5 8 0Winston, Lloyd 2 13 6.5 10 0Vollenweider, Jim 1 26 26.0 26 049ERS 156 2,090 13.4 68t 13OPPONENTS 244 3,581 14.7 70t 27
INTERCEPTIONS No Yds Avg LG TDAlexander, Kermit 5 72 14.4 38 0Woodson, Abe 3 61 20.3 61 0Johnson, Jimmy 2 36 18.0 36 0Dowdle, Mike 2 6 3.0 6 0Kimbrough, Elbert 1 45 45.0 45 0Pine, Ed 1 1 1.0 1 049ERS 14 221 15.8 61 0OPPONENTS 22 283 12.9 52 1
KICKOFF RETURNS No Yds Avg LG TDWoodson, Abe 29 935 32.2 103t 3Alexander, Kermit 24 638 26.6 46 0Vollenweider, Jim 4 75 18.8 23 0Cooper, Bill 2 8 4.0 8 0St.Clair, Bob 2 3 1.5 3 0Stickles, Monty 1 0 0.0 0 049ERS 62 1,659 26.8 103t 3OPPONENTS 37 816 22.1 45 0
PUNT RETURNS No FC Yds Avg LG TDWoodson, Abe 13 7 95 7.3 51 0Messer, Dale 5 12 4 0.8 3 049ERS 18 19 99 5.5 51 0OPPONENTS 50 5 587 11.7 90t 2
PUNTING No Yds Avg LG BlkDavis, Tommy 73 3,311 45.4 64 249ERS 73 3,311 45.4 64 2OPPONENTS 55 2,373 43.2 68 0
PASSING Att Comp Pct Yds LG TD Int QBMcHan, Lamar 195 83 42.6 1,243 68t 8 11 54.3Waters, Bobby 88 42 47.7 435 42 1 6 37.8Brodie, John 61 30 49.2 367 44t 3 4 57.2Lisbon, Don 2 1 50.0 45 45t 1 0 135.4Davis, Tommy 1 0 0.0 0 0 0 0 39.6Perry, Joe 1 0 0.0 0 0 0 0 39.6Vollenweider, Jim 1 0 0.0 0 0 0 1 0.049ERS 349 156 44.7 2,090 68t 13 22 50.4OPPONENTS 450 244 54.2 3,581 70t 27 14 87.5
TEAM STATISTICS 49ers OppTOTAL FIRST DOWNS 183 304 By Rushing 87 121 By Passing 87 168 By Penalties 9 15TOTAL YARDS GAINED 3,281 5,447 By Rushing 1,454 2,076 By Passing 1,827 3,371TOTAL PLAYS FROM SCRIMMAGE 790 963 Rushes 406 488 Average Gain Per Rush 3.6 4.3FORWARD PASSES ATTEMPTED 349 450 Number Completed 156 244 Per Cent Completed 44.7 54.2 Sacks/Yards Lost 35/263 25/210 Passes Had Intercepted 22 14 Yards Gained Per Pass 6.0 8.0 Yards Gained Per Completion 13.4 14.7PUNTS 73 55 Total Yardage of Punts 3,311 2,371 Average Length 45.4 43.1KICKOFF RETURNS 62 37 Total Yards Returned 1,659 816 Average Length of Return 26.8 22.1PENALTIES 51 73 Yards Penalized 439 667FUMBLES 25 27 Own Fumbles Recovered 17 14 Opponents’ Fumbles Recovered 13 8FIELD GOALS 10 12 Field Goals Attempted 31 20TOTAL POINTS SCORED 198 391 Touchdowns Scored 24 51 Touchdowns Rushing 8 20 Touchdowns Passing 13 27 Touchdowns Returns 3 4 Extra Points 24 50 Field Goals 10 20 Safeties 0 1
SCORING TDs Ru Pa Int Fu KO Pu PAT FG S PtsDavis, Tommy 0 0 0 0 0 0 0 24/24 10/31 0 54Casey, Bernie 7 0 7 0 0 0 0 0/0 0/0 0 42Smith, J.D. 6 5 1 0 0 0 0 0/0 0/0 0 36Woodson, Abe 3 0 0 0 0 3 0 0/0 0/0 0 18Knafelc, Gary 2 0 2 0 0 0 0 0/0 0/0 0 12Lisbon, Don 2 0 2 0 0 0 0 0/0 0/0 0 12Vollenweider, Jim 2 2 0 0 0 0 0 0/0 0/0 0 12McFarland, Kay 1 0 1 0 0 0 0 0/0 0/0 0 6Winston, Lloyd 1 1 0 0 0 0 0 0/0 0/0 0 649ERS 24 8 13 0 0 3 0 24/24 10/31 0 198OPPONENTS 51 20 27 1 1 0 2 50/51 11/27 1 391
Rookie Names in Italics
SAN FRANCISCO 49ERS
M E D I A G U I D E2 0 1 7 S E A S O N 445
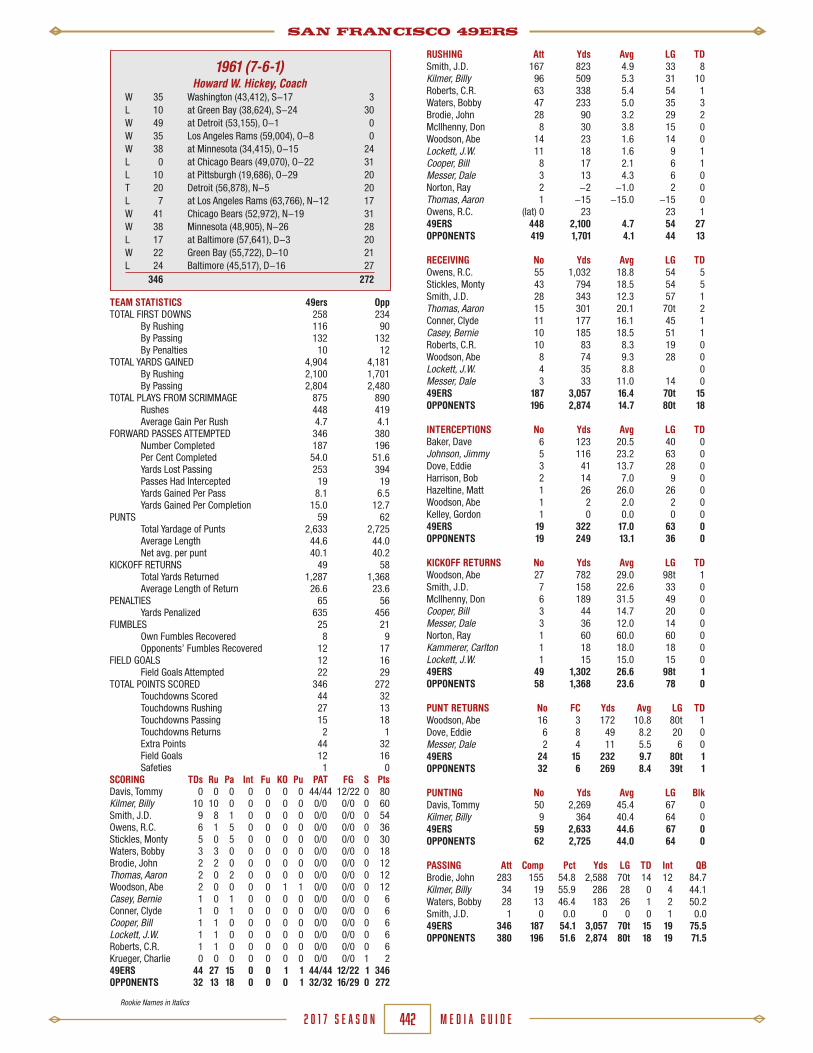
1964 (4-10)Jack Christiansen, Coach
L 17 Detroit (33,204), S-13 26W 28 at Philadelphia (57,352), S-20 24L 13 St. Louis (30,969), S-27 23W 31 Chicago (33,132), O-4 21L 14 at G.B. in Milwaukee (47,380), O-11 24L 14 at Los Angeles Rams (54,355), O-18 42L 22 Minnesota (31,845), O-25 27L 7 at Baltimore (60,213), N-1 37L 7 at Minnesota (40,408), N-8 24W 24 Green Bay (38,483), N-15 14L 21 at Chicago (46,772), N-22 23L 3 Baltimore (33,642), N-29 14W 28 Los Angeles Rams (31,791), D-6 7L 7 at Detroit (41,854), D-13 24 236 330
RUSHING Att Yds Avg LG TDKopay, Dave 75 271 3.6 18 0Lind, Mike 100 256 2.6 21 7Mira, George 18 177 9.8 37 0Lisbon, Don 55 162 3.0 14 0Brodie, John 27 135 5.0 38 2Lewis, Gary 43 115 2.7 17 1Kilmer, Billy 36 113 3.1 14 0Smith, J.D. 13 55 4.2 16 0Johnson, Rudy 16 48 3.0 24 149ERS 383 1,332 3.5 38 11OPPONENTS 442 1,560 3.5 32 11
RECEIVING No Yds Avg LG TDCasey, Bernie 58 808 13.9 63t 4Stickles, Monty 40 685 17.1 53t 3Parks, Dave 36 703 19.5 83t 8Lind, Mike 25 178 7.1 26 0Kopay, Dave 20 135 6.8 30 2Lisbon, Don 13 104 8.0 39t 1Kilmer, Billy 11 136 12.4 35 0Lewis, Gary 7 73 10.4 47 0McFarland, Kay 5 67 13.4 33 0Johnson, Rudy 5 21 4.2 12 0Messer, Dale 4 72 18.0 28 0Poole, Bob 1 8 8.0 8 049ERS 225 2,990 13.3 83t 18OPPONENTS 232 3,135 13.5 82t 23
INTERCEPTIONS No Yds Avg LG TDAlexander, Kermit 5 65 13.0 24 0Johnson, Jimmy 3 65 21.7 43 0Kimbrough, Elbert 2 3 1.5 3 0Woodson, Abe 2 1 0.5 1 0Dowdle, Mike 1 14 14.0 14 0Wilcox, Dave 1 6 6.0 6 0Hazeltine, Matt 1 1 1.0 1 049ERS 15 155 10.3 43 0OPPONENTS 22 530 24.1 97t 2
KICKOFF RETURNS No Yds Avg LG TDWoodson, Abe 32 880 27.5 70 0Alexander, Kermit 20 483 24.2 44 0Kopay, Dave 2 30 15.0 16 0Lewis, Gary 1 0 0.0 0 0Pine, Ed 1 0 0.0 0 0Thomas, John 1 0 0.0 0 049ERS 57 1,393 24.4 70 0OPPONENTS 37 883 23.9 41 0
PUNT RETURNS No FC Yds Avg LG TDAlexander, Kermit 21 5 189 9.0 70t 1Woodson, Abe 22 8 133 6.1 26 049ERS 43 13 322 7.5 70t 1OPPONENTS 50 5 540 10.8 68t 2
PUNTING No Yds Avg LG BlkDavis, Tommy 79 3,599 45.6 68 0 49ERS 79 3,599 45.6 68 0OPPONENTS 75 3,426 45.7 74 0
PASSING Att Comp Pct Yds LG TD Int QBBrodie, John 392 193 49.2 2,498 83t 14 16 64.6Mira, George 53 23 43.4 331 79t 2 5 37.5Kilmer, Billy 14 8 57.1 92 24 1 1 71.1Lind, Mike 1 1 100.0 69 69t 1 0 158.3Kopay, Dave 1 0 0.0 0 0 0 0 39.649ERS 461 225 48.8 2,990 83t 18 22 62.9OPPONENTS 434 232 53.5 3,135 82t 23 16 79.0
TEAM STATISTICS 49ers OppTOTAL FIRST DOWNS 233 255 By Rushing 76 90 By Passing 136 138 By Penalties 21 27TOTAL YARDS GAINED 4,073 4,404 By Rushing 1,332 1,560 By Passing 2,741 2,844TOTAL PLAYS FROM SCRIMMAGE 871 920 Rushes 383 443 Average Gain Per Rush 3.5 3.5FORWARD PASSES ATTEMPTED 461 434 Number Completed 225 232 Per Cent Completed 48.8 53.5 Sacks/Yards Lost 27/249 43/297 Passes Had Intercepted 22 15 Yards Gained Per Pass 6.5 7.2 Yards Gained Per Completion 13.3 13.5PUNTS 79 76 Total Yardage of Punts 3,603 3,481 Average Length 45.6 45.8KICKOFF RETURNS 57 37 Total Yards Returned 1,393 883 Average Length of Return 24.4 23.9PENALTIES 79 76 Yards Penalized 741 783FUMBLES 42 33 Own Fumbles Recovered 18 19 Opponents’ Fumbles Recovered 14 24FIELD GOALS 8 17 Field Goals Attempted 25 34TOTAL POINTS SCORED 236 330 Touchdowns Scored 30 40 Touchdowns Rushing 11 11 Touchdowns Passing 18 23 Touchdowns Returns 1 6 Extra Points 30 39 Field Goals 8 20 Safeties 1 0
SCORING TDs Ru Pa Int Fu KO Pu PAT FG S PtsDavis, Tommy 0 0 0 0 0 0 0 30/30 8/25 0 54Parks, Dave 8 0 8 0 0 0 0 0/0 0/0 0 48Lind, Mike 7 7 0 0 0 0 0 0/0 0/0 0 42Casey, Bernie 4 0 4 0 0 0 0 0/0 0/0 0 24Stickles, Monty 3 0 3 0 0 0 0 0/0 0/0 0 18Brodie, John 2 2 0 0 0 0 0 0/0 0/0 0 12Kopay, Dave 2 0 2 0 0 0 0 0/0 0/0 0 6Alexander, Kermit 1 0 0 0 0 0 1 0/0 0/0 0 6Lewis, Gary 1 1 0 0 0 0 0 0/0 0/0 0 6Johnson, Rudy 1 1 0 0 0 0 0 0/0 0/0 0 6Lisbon, Don 1 0 1 0 0 0 0 0/0 0/0 0 6Team 0 0 0 0 0 0 0 0/0 0/0 0 249ERS 30 11 18 0 0 0 1 30/30 8/25 0 236OPPONENTS 40 11 23 2 2 0 2 39/40 17/34 0 330
Rookie Names in Italics

SAN FRANCISCO 49ERS
M E D I A G U I D E2 0 1 7 S E A S O N 446
1965 (7-6-1)Jack Christiansen, Coach
W 52 Chicago (31,211), S-19 24W 27 Pittsburgh (28,161), S-26 17L 24 at Baltimore (57,342), O-3 27L 10 at Green Bay (50,858), O-10 27W 45 at Los Angeles Rams (34,703), O-17 21L 41 Minnesota (40,673), O-24 42L 28 Baltimore (43,575), O-31 34L 31 at Dallas (30,531), N-7 39W 27 at Detroit (52,570), N-14 21W 30 Los Angeles Rams (39,253), N-21 27W 45 at Minnesota (36,748), N-28 24W 17 Detroit (38,483), D-5 14L 20 at Chicago (43,400), D-12 61T 24 Green Bay (45,710), D-19 24 421 402
RUSHING Att Yds Avg Lg TDWillard, Ken 189 778 4.1 32 5Crow, John David 132 514 3.9 30 2Lewis, Gary 52 256 4.9 60t 3Kopay, Dave 28 81 2.9 10 2Mira, George 5 64 12.8 25 0Brodie, John 15 60 4.0 13 1Davis, Tommy 1 21 21.0 21 0Johnson, Rudy 6 9 1.5 4 049ERS 428 1,783 4.2 60t 13OPPONENTS 405 1,535 3.8 50t 20
RECEIVING No Yds Avg LG TDParks, Dave 80 1,344 16.8 53t 12Casey, Bernie 59 765 13.0 59t 8Stickles, Monty 35 343 9.8 22 1Willard, Ken 32 253 7.9 29t 4Crow, John David 28 493 17.6 54 7Kopay, Dave 11 147 13.4 44 1Lewis, Gary 10 25 2.5 12 0McFarland, Kay 8 106 13.3 35t 1Johnson, Rudy 3 49 16.3 28 0Messer, Dale 2 41 20.5 37 0Burke, Vern 2 38 19.0 27t 1Poole, Bob 2 29 14.5 15 049ERS 272 3,633 13.4 59t 35OPPONENTS 225 3,290 14.6 80t 24
INTERCEPTIONS No Yds Avg LG TDJohnson, Jimmy 6 47 7.8 26 0Alexander, Kermit 3 23 7.7 15 0Kimbrough, Elbert 2 5 2.5 5 0Wilcox, Dave 1 16 16.0 16 0Hazeltine, Matt 1 6 6.0 6 049ERS 13 97 7.5 26 0OPPONENTS 21 232 11.1 33 3
KICKOFF RETURNS No Yds Avg LG TDAlexander, Kermit 32 741 23.2 46 0Lewis, Gary 15 355 23.7 39 0Johnson, Rudy 4 71 17.8 27 0Swinford, Wayne 4 61 15.3 22 0Messer, Dale 1 27 27.0 27 0Kopay, Dave 1 21 21.0 21 0Cerne, Joe 1 0 0.0 0 0Rubke, Karl 1 0 0.0 0 049ERS 59 1,276 21.6 46 0OPPONENTS 59 1,566 26.5 99t 1
PUNT RETURNS No FC Yds Avg LG TDAlexander, Kermit 35 7 262 7.5 40 0Swinford, Wayne 2 11 18 9.0 18 0Lewis, Gary 1 0 3 3.0 3 049ERS 38 18 283 7.5 40 0OPPONENTS 33 7 408 12.4 85t 1
PUNTING No Yds Avg LG BlkDavis, Tommy 54 2,471 45.8 65 049ERS 54 2,471 45.8 65 0OPPONENTS 62 2,599 41.9 90 0
PASSING Att Comp Pct Yds LG TD Int QBBrodie, John 391 242 61.9 3,112 59t 30 16 95.3Mira, George 58 28 48.3 460 46 4 3 76.8Crow, John David 4 2 50.0 61 45t 1 1 95.8Willard, Ken 1 0 0.0 0 0 0 1 0.049ERS 454 272 59.9 3,633 59t 35 21 91.8OPPONENTS 447 225 50.3 3,290 80t 24 13 80.5
TEAM STATISTICS 49ers OppTOTAL FIRST DOWNS 292 259 By Rushing 97 94 By Passing 172 139 By Penalties 23 26TOTAL YARDS GAINED 5,270 4,640 By Rushing 1,783 1,535 By Passing 3,487 3,105TOTAL PLAYS FROM SCRIMMAGE 901 878 Rushes 428 405 Average Gain Per Rush 4.2 3.8FORWARD PASSES ATTEMPTED 454 448 Number Completed 272 225 Per Cent Completed 59.9 50.2 Sacks/Yards Lost 19/146 25/197 Passes Had Intercepted 21 13 Yards Gained Per Pass 8.0 7.4 Yards Gained Per Completion 13.4 14.7PUNTS 54 62 Total Yardage of Punts 2,474 2,598 Average Length 45.8 41.9KICKOFF RETURNS 59 59 Total Yards Returned 1,276 1,566 Average Length of Return 21.6 26.1PENALTIES 79 71 Yards Penalized 785 727FUMBLES 33 34 Own Fumbles Recovered 14 17 Opponents’ Fumbles Recovered 17 19FIELD GOALS 17 14 Field Goals Attempted 27 27TOTAL POINTS SCORED 421 402 Touchdowns Scored 53 52 Touchdowns Rushing 13 20 Touchdowns Passing 35 24 Touchdowns Returns 5 8 Extra Points 52 48 Field Goals 17 14 Safeties 0 0
SCORING TDs Ru Pa Int Fu KO Pu PAT FG S PtsDavis, Tommy 0 0 0 0 0 0 0 52/53 17/27 0 103Parks, Dave 12 0 12 0 0 0 0 0/0 0/0 0 72Crow, John David 9 2 7 0 0 0 0 0/0 0/0 0 54Willard, Ken 9 5 4 0 0 0 0 0/0 0/0 0 54Casey, Bernie 8 0 8 0 0 0 0 0/0 0/0 0 48Kopay, Dave 4 2 1 0 1 0 0 0/0 0/0 0 24Lewis, Gary 3 3 0 0 0 0 0 0/0 0/0 0 18Brodie, John 1 1 0 0 0 0 0 0/0 0/0 0 6Burke, Vern 1 0 1 0 0 0 0 0/0 0/0 0 6Chapple, Jack 1 0 0 0 1 0 0 0/0 0/0 0 6Krueger, Charlie 1 0 0 0 1 0 0 0/0 0/0 0 6McFarland, Kay 1 0 1 0 0 0 0 0/0 0/0 0 6Miller, Clark 1 0 0 0 1 0 0 0/0 0/0 0 6Stickles, Monty 1 0 1 0 0 0 0 0/0 0/0 0 6Wilcox, Dave 1 0 0 0 1 0 0 0/0 0/0 0 649ERS 53 13 35 0 5 0 0 52/53 17/27 0 421OPPONENTS 52 20 24 3 3 1 1 48/52 14/27 0 402
Rookie Names in Italics
SAN FRANCISCO 49ERS
M E D I A G U I D E2 0 1 7 S E A S O N 447
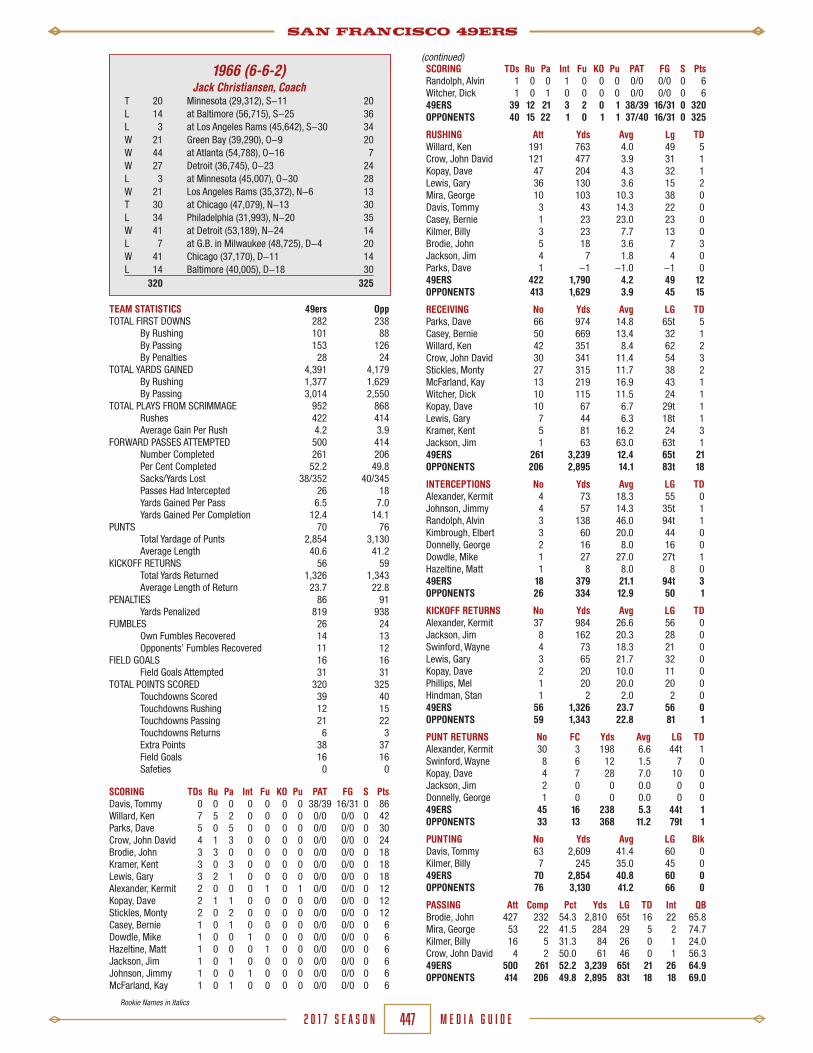
1966 (6-6-2)Jack Christiansen, Coach
T 20 Minnesota (29,312), S-11 20L 14 at Baltimore (56,715), S-25 36L 3 at Los Angeles Rams (45,642), S-30 34W 21 Green Bay (39,290), O-9 20W 44 at Atlanta (54,788), O-16 7W 27 Detroit (36,745), O-23 24L 3 at Minnesota (45,007), O-30 28W 21 Los Angeles Rams (35,372), N-6 13T 30 at Chicago (47,079), N-13 30L 34 Philadelphia (31,993), N-20 35W 41 at Detroit (53,189), N-24 14L 7 at G.B. in Milwaukee (48,725), D-4 20W 41 Chicago (37,170), D-11 14L 14 Baltimore (40,005), D-18 30 320 325
SCORING TDs Ru Pa Int Fu KO Pu PAT FG S PtsRandolph, Alvin 1 0 0 1 0 0 0 0/0 0/0 0 6Witcher, Dick 1 0 1 0 0 0 0 0/0 0/0 0 649ERS 39 12 21 3 2 0 1 38/39 16/31 0 320OPPONENTS 40 15 22 1 0 1 1 37/40 16/31 0 325
RUSHING Att Yds Avg Lg TDWillard, Ken 191 763 4.0 49 5Crow, John David 121 477 3.9 31 1Kopay, Dave 47 204 4.3 32 1Lewis, Gary 36 130 3.6 15 2Mira, George 10 103 10.3 38 0Davis, Tommy 3 43 14.3 22 0Casey, Bernie 1 23 23.0 23 0Kilmer, Billy 3 23 7.7 13 0Brodie, John 5 18 3.6 7 3Jackson, Jim 4 7 1.8 4 0Parks, Dave 1 -1 -1.0 -1 049ERS 422 1,790 4.2 49 12OPPONENTS 413 1,629 3.9 45 15
RECEIVING No Yds Avg LG TDParks, Dave 66 974 14.8 65t 5Casey, Bernie 50 669 13.4 32 1Willard, Ken 42 351 8.4 62 2Crow, John David 30 341 11.4 54 3Stickles, Monty 27 315 11.7 38 2McFarland, Kay 13 219 16.9 43 1Witcher, Dick 10 115 11.5 24 1Kopay, Dave 10 67 6.7 29t 1Lewis, Gary 7 44 6.3 18t 1Kramer, Kent 5 81 16.2 24 3Jackson, Jim 1 63 63.0 63t 149ERS 261 3,239 12.4 65t 21OPPONENTS 206 2,895 14.1 83t 18
INTERCEPTIONS No Yds Avg LG TDAlexander, Kermit 4 73 18.3 55 0Johnson, Jimmy 4 57 14.3 35t 1Randolph, Alvin 3 138 46.0 94t 1Kimbrough, Elbert 3 60 20.0 44 0Donnelly, George 2 16 8.0 16 0Dowdle, Mike 1 27 27.0 27t 1Hazeltine, Matt 1 8 8.0 8 049ERS 18 379 21.1 94t 3OPPONENTS 26 334 12.9 50 1
KICKOFF RETURNS No Yds Avg LG TDAlexander, Kermit 37 984 26.6 56 0Jackson, Jim 8 162 20.3 28 0Swinford, Wayne 4 73 18.3 21 0Lewis, Gary 3 65 21.7 32 0Kopay, Dave 2 20 10.0 11 0Phillips, Mel 1 20 20.0 20 0Hindman, Stan 1 2 2.0 2 049ERS 56 1,326 23.7 56 0OPPONENTS 59 1,343 22.8 81 1
PUNT RETURNS No FC Yds Avg LG TDAlexander, Kermit 30 3 198 6.6 44t 1Swinford, Wayne 8 6 12 1.5 7 0Kopay, Dave 4 7 28 7.0 10 0Jackson, Jim 2 0 0 0.0 0 0Donnelly, George 1 0 0 0.0 0 049ERS 45 16 238 5.3 44t 1OPPONENTS 33 13 368 11.2 79t 1
PUNTING No Yds Avg LG BlkDavis, Tommy 63 2,609 41.4 60 0Kilmer, Billy 7 245 35.0 45 049ERS 70 2,854 40.8 60 0OPPONENTS 76 3,130 41.2 66 0
PASSING Att Comp Pct Yds LG TD Int QBBrodie, John 427 232 54.3 2,810 65t 16 22 65.8Mira, George 53 22 41.5 284 29 5 2 74.7Kilmer, Billy 16 5 31.3 84 26 0 1 24.0Crow, John David 4 2 50.0 61 46 0 1 56.349ERS 500 261 52.2 3,239 65t 21 26 64.9OPPONENTS 414 206 49.8 2,895 83t 18 18 69.0
TEAM STATISTICS 49ers OppTOTAL FIRST DOWNS 282 238 By Rushing 101 88 By Passing 153 126 By Penalties 28 24TOTAL YARDS GAINED 4,391 4,179 By Rushing 1,377 1,629 By Passing 3,014 2,550TOTAL PLAYS FROM SCRIMMAGE 952 868 Rushes 422 414 Average Gain Per Rush 4.2 3.9FORWARD PASSES ATTEMPTED 500 414 Number Completed 261 206 Per Cent Completed 52.2 49.8 Sacks/Yards Lost 38/352 40/345 Passes Had Intercepted 26 18 Yards Gained Per Pass 6.5 7.0 Yards Gained Per Completion 12.4 14.1PUNTS 70 76 Total Yardage of Punts 2,854 3,130 Average Length 40.6 41.2KICKOFF RETURNS 56 59 Total Yards Returned 1,326 1,343 Average Length of Return 23.7 22.8PENALTIES 86 91 Yards Penalized 819 938FUMBLES 26 24 Own Fumbles Recovered 14 13 Opponents’ Fumbles Recovered 11 12FIELD GOALS 16 16 Field Goals Attempted 31 31TOTAL POINTS SCORED 320 325 Touchdowns Scored 39 40 Touchdowns Rushing 12 15 Touchdowns Passing 21 22 Touchdowns Returns 6 3 Extra Points 38 37 Field Goals 16 16 Safeties 0 0
SCORING TDs Ru Pa Int Fu KO Pu PAT FG S PtsDavis, Tommy 0 0 0 0 0 0 0 38/39 16/31 0 86Willard, Ken 7 5 2 0 0 0 0 0/0 0/0 0 42Parks, Dave 5 0 5 0 0 0 0 0/0 0/0 0 30Crow, John David 4 1 3 0 0 0 0 0/0 0/0 0 24Brodie, John 3 3 0 0 0 0 0 0/0 0/0 0 18Kramer, Kent 3 0 3 0 0 0 0 0/0 0/0 0 18Lewis, Gary 3 2 1 0 0 0 0 0/0 0/0 0 18Alexander, Kermit 2 0 0 0 1 0 1 0/0 0/0 0 12Kopay, Dave 2 1 1 0 0 0 0 0/0 0/0 0 12Stickles, Monty 2 0 2 0 0 0 0 0/0 0/0 0 12Casey, Bernie 1 0 1 0 0 0 0 0/0 0/0 0 6Dowdle, Mike 1 0 0 1 0 0 0 0/0 0/0 0 6Hazeltine, Matt 1 0 0 0 1 0 0 0/0 0/0 0 6Jackson, Jim 1 0 1 0 0 0 0 0/0 0/0 0 6Johnson, Jimmy 1 0 0 1 0 0 0 0/0 0/0 0 6McFarland, Kay 1 0 1 0 0 0 0 0/0 0/0 0 6
(continued)
Rookie Names in Italics

SAN FRANCISCO 49ERS
M E D I A G U I D E2 0 1 7 S E A S O N 448
1967 (7-7)Jack Christiansen, Coach
W 27 at Minnesota (39,638), S-17 21W 38 Atlanta (30,207), S-24 7L 7 at Baltimore (60,238), O-1 41W 27 at Los Angeles Rams (60,424), O-8 24W 28 at Philadelphia (60,825), O-15 27W 27 New Orleans (34,285), O-22 13L 3 Detroit (37,990), O-29 45L 7 Los Angeles Rams (53,194), N-5 17L 28 at Washington (50,326), N-12 31L 0 at Green Bay (50,861), N-19 13L 9 Baltimore (44,815), N-26 26L 14 Chicago (25,613), D-3 28W 34 at Atlanta (51,798), D-10 28W 24 Dallas (27,182), D-16 16 273 337
RUSHING Att Yds Avg Lg TDWillard, Ken 169 510 3.0 20 5Crow, John David 113 479 4.2 39 2Lewis, Gary 67 342 5.1 52 6Cunningham, Doug 43 212 4.9 64t 2Brodie, John 20 147 7.4 15 1Mira, George 7 23 3.3 9 0Kopay, Dave 6 21 3.5 10 0Spurrier, Steve 5 18 3.6 9 0Windsor, Bob 1 7 7.0 7 0Tucker, Bill 3 5 1.7 3 049ERS 434 1,764 4.1 64t 16OPPONENTS 407 1,698 4.1 73 17
RECEIVING No Yds Avg LG TDWitcher, Dick 46 705 15.3 63t 3Randle, Sonny 33 502 15.2 58 4Crow, John David 31 373 12.0 59t 3Parks, Dave 26 313 12.0 43 2Willard, Ken 23 242 10.5 25 1Windsor, Bob 21 254 12.1 55t 2Lewis, Gary 21 218 10.4 32t 1Cunningham, Doug 13 121 9.3 29 0Stickles, Monty 7 86 12.3 19 0Tucker, Bill 2 22 11.0 12 0Myers, Chip 2 13 6.5 8 0Kopay, Dave 2 11 5.5 11 0Olerich, Dave 1 2 2.0 2 049ERS 228 2,862 12.6 63t 16OPPONENTS 212 2,755 13.0 82t 19
INTERCEPTIONS No Yds Avg LG TDAlexander, Kermit 5 72 14.4 48 0Gonsoulin, Austin 3 9 3.0 5 0Johnson, Jimmy 2 68 34.0 38 0Wilcox, Dave 2 17 8.5 17 0Jackson, Jim 1 22 22.0 22 0Nunley, Frank 1 7 7.0 7 0Miller, Clark 1 3 3.0 3 0Phillips, Mel 1 0 0.0 0 049ERS 16 198 12.4 48 0OPPONENTS 26 292 11.2 37 3
KICKOFF RETURNS No Yds Avg LG TDCunningham, Doug 31 826 26.7 94 0Tucker, Bill 9 199 22.1 26 0Lewis, Gary 9 190 21.1 33 0Swinford, Wayne 2 51 25.5 32 0Nunley, Frank 2 0 0.0 0 0Kopay, Dave 1 21 21.0 21 0Windsor, Bob 1 21 21.0 21 0Alexander, Kermit 1 18 18.0 18 049ERS 56 1,326 23.7 94 0OPPONENTS 54 1311 24.3 97t 1
PUNT RETURNS No FC Yds Avg LG TDCunningham, Doug 27 7 249 9.2 57 0Alexander, Kermit 6 1 64 10.7 31 0Tucker, Bill 1 0 1 1.0 1 0Gonsoulin, Austin 1 0 0 0.0 0 0Lewis, Gary 0 1 0 0.0 0 049ERS 35 9 314 9.0 57 0OPPONENTS 29 18 175 6.0 58t 1
PUNTING No Yds Avg LG BlkSpurrier, Steve 73 2,745 37.6 61 149ERS 73 2,745 37.6 61 1OPPONENTS 70 3,063 43.8 60 0
PASSING Att Comp Pct Yds LG TD Int QBBrodie, John 349 168 48.1 2,013 63t 11 16 57.6Mira, George 65 35 53.8 592 58 5 3 91.3Spurrier, Steve 50 23 46.0 211 21 0 7 18.4Crow, John David 5 2 40.0 46 25 0 0 73.849ERS 469 228 48.6 2,862 63t 16 26 56.3OPPONENTS 403 212 52.6 2,755 82t 19 16 73.6
TEAM STATISTICS 49ers OppTOTAL FIRST DOWNS 242 237 By Rushing 101 92 By Passing 121 128 By Penalties 20 17TOTAL YARDS GAINED 4,418 4,044 By Rushing 1,764 1,698 By Passing 2,654 2,346TOTAL PLAYS FROM SCRIMMAGE 929 858 Rushes 434 407 Average Gain Per Rush 4.1 4.1FORWARD PASSES ATTEMPTED 469 403 Number Completed 228 212 Per Cent Completed 48.6 52.6 Sacks/Yards Lost 26/208 48/409 Passes Had Intercepted 26 16 Yards Gained Per Pass 6.1 5.8 Yards Gained Per Completion 12.6 13.0PUNTS 73 70 Total Yardage of Punts 2,745 3,063 Average Length 37.6 43.8KICKOFF RETURNS 56 54 Total Yards Returned 1,326 1,311 Average Length of Return 23.7 24.3PENALTIES 89 64 Yards Penalized 931 596FUMBLES 20 24 Own Fumbles Recovered 10 11 Opponents’ Fumbles Recovered 13 10FIELD GOALS 14 17 Field Goals Attempted 33 35TOTAL POINTS SCORED 273 337 Touchdowns Scored 33 41 Touchdowns Rushing 16 17 Touchdowns Passing 16 19 Touchdowns Returns 1 5 Extra Points 33 40 Field Goals 14 17 Safeties 0 0
SCORING TDs Ru Pa Int Fu KO Pu PAT FG S PtsDavis, Tommy 0 0 0 0 0 0 0 33/33 14/33 0 75Lewis, Gary 7 6 1 0 0 0 0 0/0 0/0 0 42Willard, Ken 6 5 1 0 0 0 0 0/0 0/0 0 36Crow, John David 5 2 3 0 0 0 0 0/0 0/0 0 30Randle, Sonny 4 0 4 0 0 0 0 0/0 0/0 0 24Windsor, Bob 3 0 2 0 1 0 0 0/0 0/0 0 18Witcher, Dick 3 0 3 0 0 0 0 0/0 0/0 0 18Cunningham, Doug 2 2 0 0 0 0 0 0/0 0/0 0 12Parks, Dave 2 0 2 0 0 0 0 0/0 0/0 0 12Brodie, John 1 1 0 0 0 0 0 0/0 0/0 0 649ERS 33 16 16 0 1 0 0 33/33 14/33 0 273OPPONENTS 41 17 19 3 0 1 1 40/41 17/35 0 337
Rookie Names in Italics

SAN FRANCISCO 49ERS
M E D I A G U I D E2 0 1 7 S E A S O N 449
1968 (7-6-1)Dick Nolan, Coach
L 10 at Baltimore (56,864)/S-15 27W 35 St. Louis (27,557), S-22 17W 28 Atlanta (27,477), S-29 13L 10 at Los Angeles Rams (69,520), O-6 24L 14 Baltimore (32,822), O-13 42W 26 at New York Giants (62,958), O-20 10W 14 at Detroit (53,555), O-27 7L 21 Cleveland (31,359), N-3 33L 19 at Chicago (46,978), N-10 27T 20 Los Angeles Rams (41,815), N-17 20W 45 at Pittsburgh (21,408), N-24 28W 27 Green Bay (47,218), D-1 20L 20 Minnesota (29,049), D-8 30W 14 at Atlanta (44,977), D-15 12 303 310
RUSHING Att Yds Avg LG TDWillard, Ken 227 967 4.3 69t 7Lewis, Gary 141 573 4.1 22 1Tucker, Bill 30 135 4.5 18 3Brodie, John 18 71 3.9 15 0Daniels, Clem 12 37 3.1 11 0Cunningham, Doug 6 7 1.2 5 0Mira, George 1 5 5.0 5 0Crow, John David 4 4 1.0 3 0Lee, Dwight 2 1 0.5 1 0McNeil, Clifton 1 -1 -1.0 -1 0Spurrier, Steve 1 -15 -15.0 -15 049ERS 443 1,784 4.0 69t 11OPPONENTS 447 1,766 4.0 32 15
RECEIVING No Yds Avg LG TDMcNeil, Clifton 71 994 14.0 65t 7Witcher, Dick 39 531 13.6 59t 1Willard, Ken 36 232 6.4 20 0Crow, John David 31 531 17.1 54t 5Lewis, Gary 27 244 9.0 33 3Tucker, Bill 15 197 13.1 59t 4Windsor, Bob 8 146 18.3 62 2McFarland, Kay 5 140 28.0 65 1Randle, Sonny 3 44 14.7 29t 1Cunningham, Doug 2 25 12.5 16 0Daniels, Clem 2 23 11.5 16 049ERS 239 3,107 13.0 65t 24OPPONENTS 201 2,547 12.7 60 19
INTERCEPTIONS No Yds Avg LG TDAlexander, Kermit 9 155 17.2 66t 1Randolph, Alvin 4 60 15.0 40 0Beard, Ed 2 93 46.5 69 0Fuller, Johnny 2 3 1.5 3 0Hindman, Stan 1 25 25.0 25t 1Johnson, Jimmy 1 25 25.0 25 0Belk, Bill 1 6 6.0 6t 149ERS 20 367 18.4 69 3OPPONENTS 23 390 17.0 90 1
KICKOFF RETURNS No Yds Avg LG TDAlexander, Kermit 20 300 15.0 35 0Cunningham, Doug 14 286 20.4 38 0Daniels,Clem 10 266 26.6 29 0Tucker, Bill 5 103 20.6 30 0Lee, Dwight 2 43 21.5 22 0Hays, Harold 2 21 10.5 13 0Nunley, Frank 2 0 0.0 0 0Fuller, Johnny 1 23 23.0 23 0Banaszek, Cas 1 15 15.0 15 0Olerich,Dave 1 4 4.0 4 0Hart, Tommy 1 3 3.0 3 0Peoples, Woody 1 0 0.0 0 049ERS 60 1,064 17.7 38 0OPPONENTS 56 1,163 20.8 96t 1
PUNT RETURNS No FC Yds Avg LG TDAlexander, Kermit 24 13 87 3.6 26 0Fuller, Johnny 12 8 33 2.8 9 049ERS 36 21 120 3.3 26 0OPPONENTS 31 23 238 7.7 27 0
PUNTING No Yds Avg LG BlkSpurrier, Steve 68 2,651 39.0 54 049ERS 68 2,651 39.0 54 0OPPONENTS 68 2,856 42.0 55 0
PASSING Att Comp Pct Yds LG TD Int QBBrodie, John 404 234 57.9 3,020 65t 22 21 78.0Mira, George 11 4 36.4 44 43t 1 1 36.2McNeil, Clifton 2 1 50.0 43 43t 1 1 95.849ERS 417 239 57.3 3,107 65t 24 23 77.1OPPONENTS 415 201 48.4 2,547 60 19 20 63.2
TEAM STATISTICS 49ers OppTOTAL FIRST DOWNS 260 250 By Rushing 98 111 By Passing 141 124 By Penalties 21 15TOTAL YARDS GAINED 4,709 4,020 By Rushing 1,784 1,706 By Passing 2,925 2,244TOTAL PLAYS FROM SCRIMMAGE 887 896 Rushes 443 445 Average Gain Per Rush 4.0 4.0FORWARD PASSES ATTEMPTED 417 416 Number Completed 239 291 Per Cent Completed 57.3 48.4 Sacks/Yards Lost 27/182 35/304 Passes Had Intercepted 23 20 Yards Gained Per Pass 6.5 4.9 Yards Gained Per Completion 13.0 12.7PUNTS 68 68 Total Yardage of Punts 2,651 2,856 Average Length 39.0 42.0KICKOFF RETURNS 60 54 Total Yards Returned 1,064 1,163 Average Length of Return 17.7 20.8PENALTIES 90 71 Yards Penalized 794 656FUMBLES 26 22 Own Fumbles Recovered 12 11 Opponents’ Fumbles Recovered 11 14FIELD GOALS 11 22 Field Goals Attempted 24 32TOTAL POINTS SCORED 303 310 Touchdowns Scored 39 35 Touchdowns Rushing 11 12 Touchdowns Passing 24 19 Touchdowns Returns 4 4 Extra Points 36 34 Field Goals 11 22 Safeties 0 0
SCORING TDs Ru Pa Int Fu KO Pu PAT FG S PtsDavis, Tommy 0 0 0 0 0 0 0 26/26 9/16 0 53McNeil, Clifton 7 0 7 0 0 0 0 0/0 0/0 0 42Tucker, Bill 7 3 4 0 0 0 0 0/0 0/0 0 42Willard, Ken 7 7 0 0 0 0 0 0/0 0/0 0 42Crow, John David 5 0 5 0 0 0 0 0/0 0/0 0 30Lewis, Gary 4 1 3 0 0 0 0 0/0 0/0 0 24Patera, Dennis 0 0 0 0 0 0 0 8/11 2/8 0 14Windsor, Bob 2 0 2 0 0 0 0 0/0 0/0 0 12Witcher, Dick 2 0 1 0 1 0 0 0/0 0/0 0 12Alexander, Kermit 1 0 0 1 0 0 0 0/0 0/0 0 6Belk, Bill 1 0 0 1 0 0 0 0/0 0/0 0 6Hindman, Stan 1 0 0 1 0 0 0 0/0 0/0 0 6McFarland, Kay 1 0 1 0 0 0 0 0/0 0/0 0 6Randle, Sonny 1 0 1 0 0 0 0 0/0 0/0 0 649ERS 39 11 24 3 1 0 0 36/39 11/24 0 303OPPONENTS* 35 12 19 1 1 1 0 34/35 22/32 0 310*had one return of a blocked FGA
Rookie Names in Italics

SAN FRANCISCO 49ERS
M E D I A G U I D E2 0 1 7 S E A S O N 450
1969 (4-8-2)Dick Nolan, Coach
L 12 at Atlanta (45,940), S-21 24L 7 at G.B. in Milwaukee (48,184), S-28 14T 17 Washington (35,184), O-5 17L 21 Los Angeles Rams (45,995), O-12 27L 7 Atlanta (28,684), O-19 21W 24 at Baltimore (60,238), O-26 21L 14 Detroit (35,100), N-2 26L 30 at Los Angeles Rams (73,975), N-9 41W 20 Baltimore (38,472), N-16 17L 38 at New Orleans (71,448), N-23 43T 24 at Dallas (62,348), N-27 24W 42 Chicago (32,826), D-6 21L 7 at Minnesota (43,028), D-14 10W 14 Philadelphia (25,391), D-21 13 277 319
RUSHING Att Yds Avg LG TDWillard, Ken 171 557 3.3 18 7Cunningham, Doug 147 541 3.7 33 3Thomas, Jimmy 23 190 8.3 75t 1Tucker, Bill 20 72 3.6 24t 2Brodie, John 11 62 5.6 15 0Spurrier, Steve 5 49 9.8 29 0Windsor, Bob 5 39 7.8 13 0Davis, Tommy 2 21 10.5 16 0Lewis, Gary 4 5 1.3 4 0Moore, Gene 2 4 2.0 2 0Washington, Gene 1 -4 -4.0 -4 049ERS 391 1,536 3.9 75t 13OPPONENTS 422 1,704 4.0 41 14
RECEIVING No Yds Avg LG TDWashington, Gene 51 711 13.9 52 3Cunningham, Doug 51 484 9.5 58 0Windsor, Bob 49 597 12.2 32 2Willard, Ken 36 326 9.1 36 3Witcher, Dick 33 435 13.2 49 3Thomas, Jimmy 18 364 20.2 75t 5McNeil, Clifton 17 255 15.0 80t 3Tucker, Bill 14 104 7.4 18t 2Johnson, Leo 4 42 10.5 14 0Kwalick, Ted 2 32 16.0 31 1Moore, Gene 2 28 14.0 24 0Edwards, Earl 1 1 1.0 1 049ERS 278 3,379 12.2 80t 22OPPONENTS 205 2,726 13.3 93 22
INTERCEPTIONS No Yds Avg LG TDAlexander, Kermit 5 39 7.8 22 0Johnson, Jimmy 5 18 3.6 18 0Wilcox, Dave 2 17 8.5 17 0Taylor, Roosevelt 2 15 7.5 15 0Randolph, Alvin 2 10 5.0 5 0Woitt, Johnny 1 57 57.0 57t 1Fuller, Johnny 1 31 31.0 31 0Nunley, Frank 1 7 7.0 7 0Krueger, Charlie 1 0 0.0 0 049ERS 20 194 9.7 57t 1OPPONENTS 26 304 11.7 38 1
KICKOFF RETURNS No Yds Avg LG TDSmith, Noland 14 315 22.5 60 0Cunningham, Doug 9 207 23.0 30 0Fuller, Johnny 8 155 19.4 28 0Lewis, Gary 5 155 31.0 34 0Alexander, Kermit 3 47 15.7 24 0Edwards, Earl 3 3 1.0 3 0Taylor, Roosevelt 1 16 16.0 16 0Wilcox, Dave 1 10 10.0 10 0Kwalick, Ted 1 0 0.0 0 0Sniadecki, Jim 1 0 0.0 0 0Tucker, Bill 1 0 0.0 0 049ERS 47 908 19.3 60 0OPPONENTS 43 1,186 27.6 87t 1
PUNT RETURNS No FC Yds Avg LG TDSmith, Noland 10 4 46 4.6 18 0Fuller, Johnny 5 4 12 2.4 7 0Alexander, Kermit 4 3 -18 -4.5 0 0Cunningham, Doug 3 11 23 7.7 14 049ERS 22 22 63 2.9 18 0OPPONENTS 39 14 293 7.5 50 0
PUNTING No Yds Avg LG BlkKilgore, Jon 36 1,451 40.3 72 0Davis, Tommy 23 955 41.5 55 0Spurrier, Steve 12 468 39.0 57 049ERS 71 2,874 40.5 72 0OPPONENTS 65 2,629 40.5 60 0
PASSING Att Comp Pct Yds LG TD Int QBBrodie, John 347 194 55.9 2,405 80t 16 15 74.9Spurrier, Steve 146 81 55.5 926 75t 5 11 54.8Cunningham, Doug 3 3 100.0 48 31 1 0 158.349ERS 496 278 56.1 3,379 80t 22 26 70.1OPPONENTS 402 205 51.0 2,726 93 22 20 70.3
TEAM STATISTICS 49ers OppTOTAL FIRST DOWNS 235 242 By Rushing 84 91 By Passing 153 128 By Penalties 16 23TOTAL YARDS GAINED 4,694 4,175 By Rushing 1,536 1,704 By Passing 3,158 2,471TOTAL PLAYS FROM SCRIMMAGE 914 854 Rushes 391 422 Average Gain Per Rush 3.9 4.0FORWARD PASSES ATTEMPTED 496 402 Number Completed 278 205 Per Cent Completed 56.0 51.0 Sacks/Yards Lost 27/221 30/255 Passes Had Intercepted 26 20 Yards Gained Per Pass 6.4 5.5 Yards Gained Per Completion 11.4 12.1PUNTS 71 65 Total Yardage of Punts 2,874 2,629 Average Length 40.5 40.4KICKOFF RETURNS 47 43 Total Yards Returned 901 1,186 Average Length of Return 19.3 27.6PENALTIES 85 70 Yards Penalized 845 671FUMBLES 25 26 Own Fumbles Recovered 13 14 Opponents’ Fumbles Recovered 12 12FIELD GOALS 6 15 Field Goals Attempted 21 36TOTAL POINTS SCORED 277 319 Touchdowns Scored 37 39 Touchdowns Rushing 13 14 Touchdowns Passing 22 22 Touchdowns Returns 2 3 Extra Points 35 38 Field Goals 6 15 Safeties 0 0
SCORING TDs Ru Pa Int Fu KO Pu PAT FG S PtsWillard, Ken 10 7 3 0 0 0 0 0/0 0/0 0 60Thomas, Jimmy 6 1 5 0 0 0 0 0/0 0/0 0 36Gavric, Momcilo 0 0 0 0 0 0 0 22/24 3/11 0 31Tucker, Bill 4 2 2 0 0 0 0 0/0 0/0 0 24Davis, Tommy 0 0 0 0 0 0 0 13/13 3/10 0 22Cunningham, Doug 3 3 0 0 0 0 0 0/0 0/0 0 18McNeil, Clifton 3 0 3 0 0 0 0 0/0 0/0 0 18Washington, Gene 3 0 3 0 0 0 0 0/0 0/0 0 18Witcher, Dick 3 0 3 0 0 0 0 0/0 0/0 0 18Windsor, Bob 2 0 2 0 0 0 0 0/0 0/0 0 12Kwalick, Ted 1 0 1 0 0 0 0 0/0 0/0 0 6Lakes, Roland 1 0 0 0 1 0 0 0/0 0/0 0 6Woitt, Johnny 1 0 0 1 0 0 0 0/0 0/0 0 6Team 0 0 0 0 0 0 0 0/0 0/0 1 249ERS 37 13 22 1 1 0 0 35/37 6/21 1 277OPPONENTS 39 14 22 1 1 1 0 38/39 15/36 1 319
Rookie Names in Italics

SAN FRANCISCO 49ERS
M E D I A G U I D E2 0 1 7 S E A S O N 451
1970 (10-3-1/11-4-1)NFC West Champions
Dick Nolan, CoachW 26 Washington (34,984), S-20 17W 34 Cleveland (37,502), S-27 31L 20 at Atlanta (58,850), O-4 21W 20 at Los Angeles Rams (77,272), O-11 6T 20 New Orleans (39,446), O-18 20W 19 Denver (39,515), O-25 14W 26 Green Bay (59,335), N-1 10W 37 at Chicago (45,607), N-8 16W 30 at Houston (43,040), N-15 20L 7 at Detroit (56,232), N-22 28L 13 Los Angeles Rams (59,602), N-29 30W 24 Atlanta (41,387), D-6 20W 38 at New Orleans (61,940), D-13 27W 38 at Oakland Raiders (54,535), D-20 7 352 267
NFC PLAYOFF - DEC. 27(at Bloomington, MN - Metropolitan Stadium)
W 17 Minnesota (45,103) 14
NFC CHAMPIONSHIP - JAN. 3(at San Francisco - Kezar Stadium)
L 10 Dallas (59,364) 17
SCORING TDs Ru Pa Int Fu KO Pu PAT FG S PtsWindsor, Bob 2 0 2 0 0 0 0 0/0 0/0 0 12Witcher, Dick 2 0 2 0 0 0 0 0/0 0/0 0 12Johnson, Jimmy 1 0 0 1 0 0 0 0/0 0/0 1 8Isenbarger, John 1 0 1 0 0 0 0 0/0 0/0 0 6Kwalick, Ted 1 0 1 0 0 0 0 0/0 0/0 0 6Phillips, Mel 1 0 0 1 0 0 0 0/0 0/0 0 6Taylor, Bruce* 1 0 0 0 0 0 0 0/0 0/0 0 6Randolph, Alvin 0 0 0 0 0 0 0 0/0 0/0 1 249ERS 41 13 25 2 0 0 0 39/41 21/31 2 352OPPONENTS 32 12 19 0 1 0 0 30/32 15/24 0 267* had one ret. of blkd FGARUSHING Att Yds Avg LG TDWillard, Ken 236 789 3.3 20 7Cunningham, Doug 128 443 3.5 25 3Tucker, Bill 42 137 3.3 11 1Thomas, Jimmy 31 89 2.9 14 0Kwalick, Ted 3 65 21.7 45 0Isenbarger, John 18 43 2.4 27 0Brodie, John 9 29 3.2 12t 2Strong, Jim 2 3 1.5 3 0Spurrier, Steve 2 -18 -9.0 -5 049ERS 471 1,580 3.4 45 13OPPONENTS 425 1,799 4.2 80t 12RECEIVING No Yds Avg LG TDWashington, Gene 53 1,100 20.8 79t 12Cunningham, Doug 35 209 6.0 29 0Windsor, Bob 31 363 11.7 35 2Willard, Ken 31 259 8.4 32 3Witcher, Dick 22 288 13.1 28 2Tucker, Bill 17 108 6.4 28t 1Thomas, Jimmy 12 221 18.4 61t 3Kwalick, Ted 10 148 14.8 26t 1Isenbarger, John 8 158 19.8 61t 1Riley, Preston 7 136 19.4 68 049ERS 226 2,990 13.2 79t 25OPPONENTS 185 2,434 13.2 69 19INTERCEPTIONS No Yds Avg LG TDTaylor, Bruce 3 70 23.3 70 0Phillips, Mel 3 49 16.3 35t 1Nunley, Frank 3 42 14.0 24 0Taylor, Roosevelt 3 27 9.0 19 0Vanderbundt, Skip 3 18 6.0 18 0Wilcox, Dave 2 46 23.0 35 0Johnson, Jimmy 2 36 18.0 36t 1Fuller, Johnny 1 20 20.0 20 0Hart, Tommy 1 0 0.0 0 0Randolph, Alvin 1 0 0.0 0 049ERS 22 308 14.0 70 2OPPONENTS 10 95 9.5 29 0KICKOFF RETURNS No Yds Avg LG TDTucker, Bill 25 577 23.1 43 0Taylor, Bruce 12 190 15.8 25 0Thomas, Jimmy 6 177 29.5 55 0Beard, Ed 2 8 4.0 8 0Fuller, Johnny 1 8 8.0 8 0Belk, Bill 1 7 7.0 7 0Riley, Preston 1 0 0.0 0 0Windsor, Bob 1 0 0.0 0 049ERS 49 967 19.7 43 0OPPONENTS 58 1,362 23.5 62 0PUNT RETURNS No FC Yds Avg LG TDTaylor, Bruce 43 10 516 12.0 76 0Fuller, Johnny 4 2 29 7.3 12 0Riley, Preston 1 0 5 5.0 5 049ERS 48 12 550 11.5 76 0OPPONENTS 38 21 180 4.7 16 0PUNTING No Yds Avg LG BlkSpurrier, Steve 75 2,877 38.4 58 049ERS 75 2,877 38.4 58 0OPPONENTS 82 3,309 40.4 57 1PASSING Att Comp Pct Yds LG TD Int QBBrodie, John 378 223 59.0 2,941 79t 24 10 93.8Spurrier, Steve 4 3 75.0 49 26 1 0 155.2Isenbarger, John 1 0 0.0 0 0 0 0 39.649ERS 383 226 59.0 2,990 79t 25 10 94.7OPPONENTS 384 185 48.2 2,434 69 19 22 61.3
TEAM STATISTICS 49ers OppTOTAL FIRST DOWNS 237 213 By Rushing 86 81 By Passing 125 110 By Penalties 26 22TOTAL NET YARDS 4,503 3,972 Net Yards Rushing 1,580 1,799 Net Yards Passing 2,923 2,173TOTAL PLAYS FROM SCRIMMAGE 862 839 Rushes 471 425 Average Gain Per Rush 3.4 4.2FORWARD PASSES ATTEMPTED 383 384 Number Completed 226 185 Per Cent Completed 59.0 48.2 Quarterback Sacks 8 30 Yards Lost 67 261 Passes Had Intercepted 10 22 Yards Gained Per Pass 7.5 5.3 Yards Gained Per Completion 13.2 13.2PUNTS 75 82 Total Yardage of Punts 2,877 3,309 Average Length 38.4 40.4KICKOFF RETURNS 49 58 Total Yards Returned 967 1,362 Average Length of Return 19.7 23.5PENALTIES 88 87 Yards Penalized 997 965FUMBLES 24 35 Own Fumbles Recovered 9 15 Opponents’ Fumbles Recovered 20 15FIELD GOALS 21 15 Field Goals Attempted 31 24TOTAL POINTS SCORED 352 267 Touchdowns Scored 41 32 Touchdowns Rushing 13 12 Touchdowns Passing 25 19 Touchdowns Returns 3 1 Extra Points 39 30 Field Goals 21 15 Safeties 1 0
SCORING TDs Ru Pa Int Fu KO Pu PAT FG S PtsGossett, Bruce 0 0 0 0 0 0 0 39/41 21/31 0 102Washington, Gene 12 0 12 0 0 0 0 0/0 0/0 0 72Willard, Ken 10 7 3 0 0 0 0 0/0 0/0 0 60Cunningham, Doug 3 3 0 0 0 0 0 0/0 0/0 0 18Thomas, Jimmy 3 0 3 0 0 0 0 0/0 0/0 0 18Brodie, John 2 2 0 0 0 0 0 0/0 0/0 0 12Tucker, Bill 2 1 1 0 0 0 0 0/0 0/0 0 12
(continued)
Rookie Names in Italics

SAN FRANCISCO 49ERS
M E D I A G U I D E2 0 1 7 S E A S O N 452
1971 (9-5/10-6)NFC West Champions
Dick Nolan, CoachL 17 at Atlanta (56,990), S-19 20W 38 at New Orleans (81,595), S-26 20W 31 at Philadelphia (65,358), O-3 3L 13 Los Angeles Rams (44,000), O-10 + 20W 13 Chicago (44,133), O-17 0W 26 at St. Louis (50,419), O-24 14W 27 New England (45,092), O-31 10W 13 at Minnesota (49,784), N-7 9L 20 New Orleans (45,138), N-14 26L 6 at Los Angeles Rams (80,050), N-21 17W 24 at New York Jets (62,936), N-28 21L 17 Kansas City (45,306), MON/D-6 26W 24 Atlanta (44,584), D-12 3W 31 Detroit (45,580), D-19 27 300 216
NFC PLAYOFF - DEC. 26(at San Francisco - Candlestick Park)
W 24 Washington (45,327) 20
NFC CHAMPIONSHIP - JAN. 2(at Irving - Texas Stadium)
L 3 Dallas (63,409) 14+ -First 49ers’ regular season game at Candlestick Park.
SCORING TDs Ru Pa Int Fu KO Pu PAT FG S PtsWitcher, Dick 3 0 3 0 0 0 0 0/0 0/0 0 18Schreiber, Larry 1 0 1 0 0 0 0 1/1 0/0 0 7Blue, Forrest 1 0 0 0 1 0 0 0/0 0/0 0 6Cunningham, Doug 1 1 0 0 0 0 0 0/0 0/0 0 6Hart, Tommy 1 0 0 0 1 0 0 0/0 0/0 0 6Taylor, Bruce* 1 0 0 0 0 0 0 0/0 0/0 0 6Thomas, Jimmy 1 1 0 0 0 0 0 0/0 0/0 0 649ERS 33 12 18 0 2 0 0 33/33 23/36 0 300OPPONENTS 23 4 17 1 1 0 0 21/23 19/33 0 216* had one ret. of blkd FGA
RUSHING Att Yds Avg LG TDWillard, Ken 216 855 4.0 49 4Washington, Vic 191 811 4.3 42 3Schreiber, Larry 34 180 5.3 23 0Cunningham, Doug 25 98 3.9 14 1Kwalick, Ted 6 62 10.3 28 0Brodie, John 14 45 3.2 12 3Thomas, Jimmy 3 36 12.0 25t 1Isenbarger, John 5 34 6.8 22 0Windsor, Bob 1 21 21.0 21 0Spurrier, Steve 1 2 2.0 2 0McCann, Jim 2 -15 -7.5 -6 049ERS 498 2,129 4.3 49 12OPPONENTS 408 1,668 4.1 64t 4
RECEIVING No Yds Avg LG TDKwalick, Ted 52 664 12.8 42t 5Washington, Gene 46 884 19.2 71t 4Washington, Vic 36 317 8.8 40 4Willard, Ken 27 202 7.5 33 1Cunningham, Doug 19 188 9.9 28 0Witcher, Dick 18 250 13.9 50t 3Schreiber, Larry 3 79 26.3 46 1Riley, Preston 3 39 13.0 24 0Thomas, Jimmy 3 33 11.0 14 0Windsor, Bob 2 32 16.0 30 049ERS 209 2,688 12.9 71t 18OPPONENTS 152 2,309 15.2 61t 17
INTERCEPTIONS No Yds Avg LG TDTaylor, Bruce 3 68 22.7 49 0Johnson, Jimmy 3 16 5.3 10 0Taylor, Roosevelt 3 13 4.3 13 0Fuller, Johnny 2 57 28.5 57 0Simpson, Mike 1 15 15.0 15 0Vanderbundt, Skip 1 10 10.0 10 0Nunley, Frank 1 7 7.0 7 049ERS 14 186 13.3 57 0OPPONENTS 24 385 16.0 39 1
KICKOFF RETURNS No Yds Avg LG TDWashington, Vic 33 858 26.0 74 0Cunningham, Doug 6 121 20.2 27 0Windsor, Bob 4 66 16.5 25 0Kwalick, Ted 2 9 4.5 5 0Beard, Ed 1 21 21.0 21 049ERS 85 1,653 19.5 74 1OPPONENTS 61 1,467 24.1 65 0
PUNT RETURNS No FC Yds Avg LG TDTaylor, Bruce 34 10 235 6.9 38 0Fuller, Johnny 3 2 31 10.3 13 0Riley, Preston 1 0 2 2.0 2 0Vanderbundt, Skip 1 0 0 0.0 0 049ERS 39 12 268 6.9 38 0OPPONENTS 19 17 44 2.3 10 0
PUNTING No Yds Avg LG BlkMcCann, Jim 49 1,897 38.7 54 1Spurrier, Steve 2 77 38.5 40 049ERS 51 1,974 38.7 54 1OPPONENTS 73 2,898 39.7 60 0
PASSING Att Comp Pct Yds LG TD Int QBBrodie, John 387 208 53.7 2,642 71t 18 24 65.0Spurrier, Steve 4 1 25.0 46 46 0 0 75.049ERS 391 209 53.5 2,688 71t 18 24 65.0OPPONENTS 341 152 44.6 2,309 61t 17 14 67.0
TEAM STATISTICS 49ers OppTOTAL FIRST DOWNS 257 199 By Rushing 113 80 By Passing 122 96 By Penalties 22 23TOTAL NET YARDS 4,706 3,679 Net Yards Rushing 2,129 1,668 Net Yards Passing 2,577 2,011TOTAL PLAYS FROM SCRIMMAGE 900 787 Rushes 498 408 Average Gain Per Rush 4.3 4.1FORWARD PASSES ATTEMPTED 391 341 Number Completed 209 152 Per Cent Completed 53.5 44.6 Quarterback Sacks 11 38 Yards Lost 111 298 Passes Had Intercepted 11 14 Yards Gained Per Pass 6.4 5.3 Yards Gained Per Completion 12.9 15.2PUNTS 51 73 Total Yardage of Punts 1,974 2,898 Average Length 38.7 39.7KICKOFF RETURNS 85 61 Total Yards Returned 1,653 1,467 Average Length of Return 19.5 24.1PENALTIES 88 75 Yards Penalized 961 610FUMBLES 33 31 Own Fumbles Recovered 15 15 Opponents’ Fumbles Recovered 15 18FIELD GOALS 23 19 Field Goals Attempted 36 33TOTAL POINTS SCORED 300 216 Touchdowns Scored 33 23 Touchdowns Rushing 12 4 Touchdowns Passing 18 17 Touchdowns Returns 3 2 Extra Points 33 21 Field Goals 23 19 Safeties 0 0
SCORING TDs Ru Pa Int Fu KO Pu PAT FG S PtsGossett, Bruce 0 0 0 0 0 0 0 32/32 23/36 101Washington, Vic 7 3 4 0 0 0 0 0/0 0/0 42Kwalick, Ted 5 0 5 0 0 0 0 0/0 0/0 30Willard, Ken 5 4 1 0 0 0 0 0/0 0/0 30Washington, Gene 4 0 4 0 0 0 0 0/0 0/0 24Brodie, John 3 3 0 0 0 0 0 0/0 0/0 18
(continued)
Rookie Names in Italics

SAN FRANCISCO 49ERS
M E D I A G U I D E2 0 1 7 S E A S O N 453
1972 (8-5-1/8-6-1)NFC West Champions
Dick Nolan, CoachW 34 San Diego (56,906), S-17 3L 20 at Buffalo (45,825), S-24 27W 37 at New Orleans (69,840), O-1 2L 7 at Los Angeles Rams (77,382), O-8 31L 17 New York Giants (53,284), O-15 23T 20 New Orleans (53,571), O-22 20W 49 at Atlanta (58,850), O-29 14L 24 at G.B. in Milwaukee (47,897), N-5 34W 24 Baltimore (57,225), N-12 21W 34 at Chicago (65,201), N-19 21W 31 -at Dallas (65,214)-THU (Thanksgiving Day), N-23 10L 16 Los Angeles Rams (60,175), MON/D-4 26W 20 Atlanta (57,523), D-10 0W 20 Minnesota (58,502), D-16 17 353 249
NFC PLAYOFF - DEC. 23(at San Francisco - Candlestick Park)
L 28 Dallas (59,746) 30
SCORING TDs Ru Pa Int Fu KO Pu PAT FG S PtsSimpson, Mike 1 0 0 1 0 0 0 0/0 0/0 0 6Thomas, Jimmy 1 1 0 0 0 0 0 0/0 0/0 0 6Witcher, Dick 1 0 1 0 0 0 0 0/0 0/0 0 649ERS 43 11 27 3 1 1 0 41/42 18/29 0 353OPPONENTS 28 12 14 1 1 0 0 28/28 17/29 1 249
RUSHING Att Yds Avg LG TDWashington, Vic 141 468 3.3 33 3Schreiber, Larry 118 420 3.6 20 2Willard, Ken 100 345 3.5 23 4Thomas, Jimmy 52 250 4.8 22 1Spurrier, Steve 11 51 4.6 15 0Cunningham, Doug 8 32 4.0 12 0Reed, Joe 4 22 5.5 22 0Kwalick, Ted 5 11 2.2 10 0Isenbarger, John 3 9 3.0 7 0Brodie, John 3 8 2.7 4 149ERS 445 1,616 3.6 33 11OPPONENTS 446 1,847 4.1 68 12
RECEIVING No Yds Avg LG TDWashington, Gene 46 918 20.0 62t 12Washington, Vic 43 393 9.1 33 1Kwalick, Ted 40 751 18.8 81t 9Schreiber, Larry 31 283 9.1 64t 1Willard, Ken 24 131 5.5 15 1Thomas, Jimmy 15 148 9.9 29 0Riley, Preston 11 156 14.2 28t 1Isenbarger, John 3 66 22.0 33 1Witcher, Dick 3 22 7.3 17 1Beasley, Terry 1 20 20.0 20 049ERS 217 2,888 13.3 81t 27OPPONENTS 169 2,582 15.3 85t 14
INTERCEPTIONS No Yds Avg LG TDJohnson, Jimmy 4 18 4.5 15 0Wilcox, Dave 3 12 4.0 9 0Vanderbundt, Skip 2 58 29.0 37t 2Simpson, Mike 2 32 16.0 32t 1Taylor, Bruce 2 4 2.0 2 0Nunley, Frank 1 12 12.0 12 0Beard, Ed 1 10 10.0 10 0Fuller, Johnny 1 0 0.0 0 0Hall, Windlan 1 0 0.0 0 0Hart, Tommy 1 0 0.0 0 0Phillips, Mel 1 0 0.0 0 049ERS 19 146 7.7 37t 3OPPONENTS 24 240 10.0 35t 1
KICKOFF RETURNS No Yds Avg LG TDWashington, Vic 27 771 28.6 98t 1McGill, Ralph 10 192 19.2 30 0Schreiber, Larry 2 41 20.5 25 0Hoskins, Bob 2 17 8.5 17 0 Beard, Ed 2 -1 -0.5 1 0Nunley, Frank 1 21 21.0 21 049ERS 44 1,041 23.7 98t 1OPPONENTS 66 1,530 23.2 75 0
PUNT RETURNS No FC Yds Avg LG TDMcGill, Ralph 22 0 219 10.0 33 0Taylor, Bruce 21 8 145 6.9 41 0Fuller, Johnny 1 1 9 9.0 9 049ERS 44 9 373 8.5 41 0OPPONENTS 20 29 70 3.5 34 0
PUNTING No Yds Avg LG BlkMcCann, Jim 64 2,542 39.7 63 149ERS 64 2,542 39.7 63 1OPPONENTS 72 3,123 43.4 65 0
PASSING Att Comp Pct Yds LG TD Int QBSpurrier, Steve 269 147 54.7 1,983 81t 18 16 75.9Brodie, John 110 70 63.6 905 53 9 8 86.4Isenbarger, John 1 0 0.0 0 0 0 0 39.649ERS 380 217 57.1 2,888 81t 27 24 78.7OPPONENTS 366 169 46.2 2,582 85t 14 19 61.1
TEAM STATISTICS 49ers OppTOTAL FIRST DOWNS 234 221 By Rushing 87 96 By Passing 129 105 By Penalties 18 20TOTAL NET YARDS 4,351 4,026 Net Yards Rushing 1,616 1,847 Net Yards Passing 2,735 2,179TOTAL PLAYS FROM SCRIMMAGE 847 858 Rushes 445 446 Average Gain Per Rush 3.6 4.1FORWARD PASSES ATTEMPTED 380 366 Number Completed 217 169 Per Cent Completed 57.1 46.2 Quarterback Sacks 22 46 Yards Lost 153 403 Passes Had Intercepted 24 19 Avg. Net Passing per Game 195.4 155.6PUNTS 64 72 Total Yardage of Punts 2,542 3,123 Average Length 39.7 43.4KICKOFF RETURNS 44 66 Total Yards Returned 1,041 1,530 Average Length of Return 23.7 23.2PENALTIES 73 81 Yards Penalized 664 677FUMBLES 30 40 Own Fumbles Recovered 17 23 Opponents’ Fumbles Recovered 17 13FIELD GOALS 18 17 Field Goals Attempted 29 29TOTAL POINTS SCORED 353 249 Touchdowns Scored 43 28 Touchdowns Rushing 11 12 Touchdowns Passing 27 14 Touchdowns Returns 5 2 Extra Points 41 28 Field Goals 18 17 Safeties 0 1
SCORING TDs Ru Pa Int Fu KO Pu PAT FG S PtsGossett, Bruce 0 0 0 0 0 0 0 41/42 18/29 0 95Washington, Gene 12 0 12 0 0 0 0 0/0 0/0 0 72Kwalick, Ted 9 0 9 0 0 0 0 0/0 0/0 0 54Washington, Vic 5 3 1 0 0 1 0 0/0 0/0 0 30Willard, Ken 5 4 1 0 0 0 0 0/0 0/0 0 30Schreiber, Larry 3 2 1 0 0 0 0 0/0 0/0 0 18Vanderbundt, Skip 3 0 0 2 1 0 0 0/0 0/0 0 18Brodie, John 1 1 0 0 0 0 0 0/0 0/0 0 6Isenbarger, John 1 0 1 0 0 0 0 0/0 0/0 0 6Riley, Preston 1 0 1 0 0 0 0 0/0 0/0 0 6
(continued)
Rookie Names in Italics
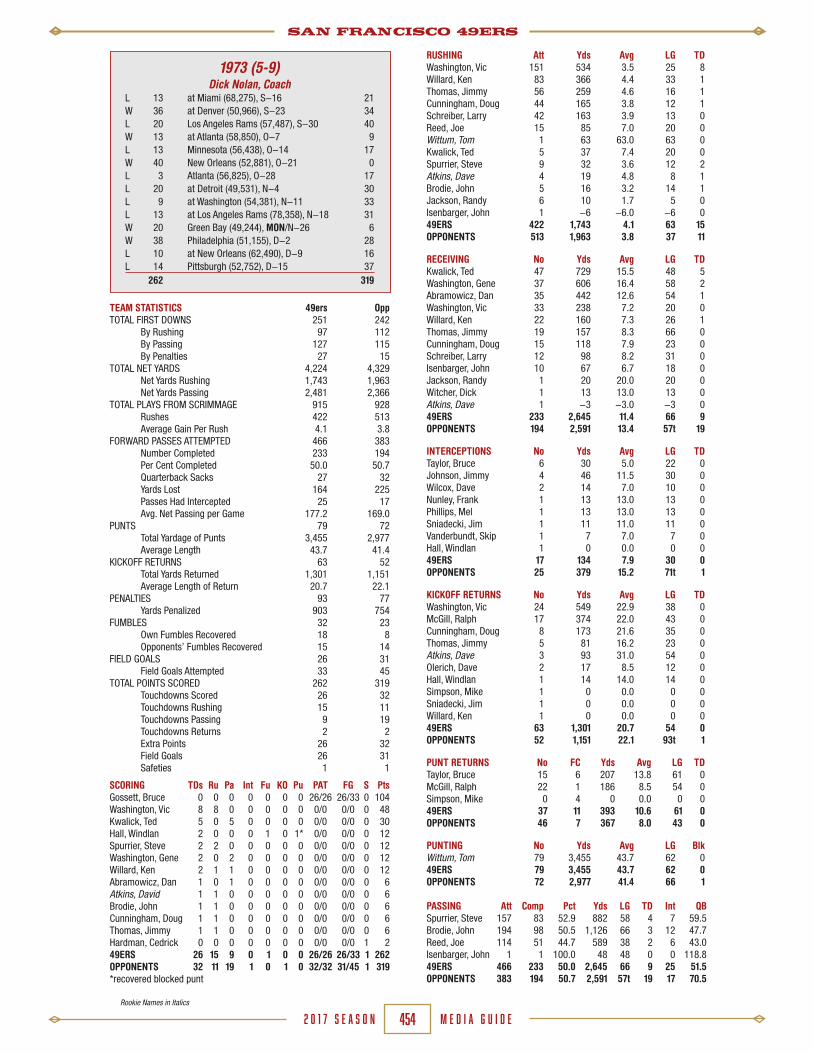
SAN FRANCISCO 49ERS
M E D I A G U I D E2 0 1 7 S E A S O N 454
1973 (5-9)Dick Nolan, Coach
L 13 at Miami (68,275), S-16 21W 36 at Denver (50,966), S-23 34L 20 Los Angeles Rams (57,487), S-30 40W 13 at Atlanta (58,850), O-7 9L 13 Minnesota (56,438), O-14 17W 40 New Orleans (52,881), O-21 0L 3 Atlanta (56,825), O-28 17L 20 at Detroit (49,531), N-4 30L 9 at Washington (54,381), N-11 33L 13 at Los Angeles Rams (78,358), N-18 31W 20 Green Bay (49,244), MON/N-26 6W 38 Philadelphia (51,155), D-2 28L 10 at New Orleans (62,490), D-9 16L 14 Pittsburgh (52,752), D-15 37 262 319
RUSHING Att Yds Avg LG TDWashington, Vic 151 534 3.5 25 8Willard, Ken 83 366 4.4 33 1Thomas, Jimmy 56 259 4.6 16 1Cunningham, Doug 44 165 3.8 12 1Schreiber, Larry 42 163 3.9 13 0Reed, Joe 15 85 7.0 20 0Wittum, Tom 1 63 63.0 63 0Kwalick, Ted 5 37 7.4 20 0Spurrier, Steve 9 32 3.6 12 2Atkins, Dave 4 19 4.8 8 1Brodie, John 5 16 3.2 14 1Jackson, Randy 6 10 1.7 5 0Isenbarger, John 1 -6 -6.0 -6 049ERS 422 1,743 4.1 63 15OPPONENTS 513 1,963 3.8 37 11
RECEIVING No Yds Avg LG TDKwalick, Ted 47 729 15.5 48 5Washington, Gene 37 606 16.4 58 2Abramowicz, Dan 35 442 12.6 54 1Washington, Vic 33 238 7.2 20 0Willard, Ken 22 160 7.3 26 1Thomas, Jimmy 19 157 8.3 66 0Cunningham, Doug 15 118 7.9 23 0Schreiber, Larry 12 98 8.2 31 0Isenbarger, John 10 67 6.7 18 0Jackson, Randy 1 20 20.0 20 0Witcher, Dick 1 13 13.0 13 0Atkins, Dave 1 -3 -3.0 -3 049ERS 233 2,645 11.4 66 9OPPONENTS 194 2,591 13.4 57t 19
INTERCEPTIONS No Yds Avg LG TDTaylor, Bruce 6 30 5.0 22 0Johnson, Jimmy 4 46 11.5 30 0Wilcox, Dave 2 14 7.0 10 0Nunley, Frank 1 13 13.0 13 0Phillips, Mel 1 13 13.0 13 0Sniadecki, Jim 1 11 11.0 11 0Vanderbundt, Skip 1 7 7.0 7 0Hall, Windlan 1 0 0.0 0 049ERS 17 134 7.9 30 0OPPONENTS 25 379 15.2 71t 1
KICKOFF RETURNS No Yds Avg LG TDWashington, Vic 24 549 22.9 38 0McGill, Ralph 17 374 22.0 43 0Cunningham, Doug 8 173 21.6 35 0Thomas, Jimmy 5 81 16.2 23 0Atkins, Dave 3 93 31.0 54 0Olerich, Dave 2 17 8.5 12 0Hall, Windlan 1 14 14.0 14 0Simpson, Mike 1 0 0.0 0 0Sniadecki, Jim 1 0 0.0 0 0Willard, Ken 1 0 0.0 0 049ERS 63 1,301 20.7 54 0OPPONENTS 52 1,151 22.1 93t 1
PUNT RETURNS No FC Yds Avg LG TDTaylor, Bruce 15 6 207 13.8 61 0McGill, Ralph 22 1 186 8.5 54 0Simpson, Mike 0 4 0 0.0 0 049ERS 37 11 393 10.6 61 0OPPONENTS 46 7 367 8.0 43 0
PUNTING No Yds Avg LG BlkWittum, Tom 79 3,455 43.7 62 049ERS 79 3,455 43.7 62 0OPPONENTS 72 2,977 41.4 66 1
PASSING Att Comp Pct Yds LG TD Int QBSpurrier, Steve 157 83 52.9 882 58 4 7 59.5Brodie, John 194 98 50.5 1,126 66 3 12 47.7Reed, Joe 114 51 44.7 589 38 2 6 43.0Isenbarger, John 1 1 100.0 48 48 0 0 118.849ERS 466 233 50.0 2,645 66 9 25 51.5OPPONENTS 383 194 50.7 2,591 57t 19 17 70.5
TEAM STATISTICS 49ers OppTOTAL FIRST DOWNS 251 242 By Rushing 97 112 By Passing 127 115 By Penalties 27 15TOTAL NET YARDS 4,224 4,329 Net Yards Rushing 1,743 1,963 Net Yards Passing 2,481 2,366TOTAL PLAYS FROM SCRIMMAGE 915 928 Rushes 422 513 Average Gain Per Rush 4.1 3.8FORWARD PASSES ATTEMPTED 466 383 Number Completed 233 194 Per Cent Completed 50.0 50.7 Quarterback Sacks 27 32 Yards Lost 164 225 Passes Had Intercepted 25 17 Avg. Net Passing per Game 177.2 169.0PUNTS 79 72 Total Yardage of Punts 3,455 2,977 Average Length 43.7 41.4KICKOFF RETURNS 63 52 Total Yards Returned 1,301 1,151 Average Length of Return 20.7 22.1PENALTIES 93 77 Yards Penalized 903 754FUMBLES 32 23 Own Fumbles Recovered 18 8 Opponents’ Fumbles Recovered 15 14FIELD GOALS 26 31 Field Goals Attempted 33 45TOTAL POINTS SCORED 262 319 Touchdowns Scored 26 32 Touchdowns Rushing 15 11 Touchdowns Passing 9 19 Touchdowns Returns 2 2 Extra Points 26 32 Field Goals 26 31 Safeties 1 1
SCORING TDs Ru Pa Int Fu KO Pu PAT FG S PtsGossett, Bruce 0 0 0 0 0 0 0 26/26 26/33 0 104Washington, Vic 8 8 0 0 0 0 0 0/0 0/0 0 48Kwalick, Ted 5 0 5 0 0 0 0 0/0 0/0 0 30Hall, Windlan 2 0 0 0 1 0 1* 0/0 0/0 0 12Spurrier, Steve 2 2 0 0 0 0 0 0/0 0/0 0 12Washington, Gene 2 0 2 0 0 0 0 0/0 0/0 0 12Willard, Ken 2 1 1 0 0 0 0 0/0 0/0 0 12Abramowicz, Dan 1 0 1 0 0 0 0 0/0 0/0 0 6Atkins, David 1 1 0 0 0 0 0 0/0 0/0 0 6Brodie, John 1 1 0 0 0 0 0 0/0 0/0 0 6Cunningham, Doug 1 1 0 0 0 0 0 0/0 0/0 0 6Thomas, Jimmy 1 1 0 0 0 0 0 0/0 0/0 0 6Hardman, Cedrick 0 0 0 0 0 0 0 0/0 0/0 1 249ERS 26 15 9 0 1 0 0 26/26 26/33 1 262OPPONENTS 32 11 19 1 0 1 0 32/32 31/45 1 319*recovered blocked punt
Rookie Names in Italics

SAN FRANCISCO 49ERS
M E D I A G U I D E2 0 1 7 S E A S O N 455
1974 (6-8)Dick Nolan, Coach
W 17 at New Orleans (65,071), S-15 13W 16 at Atlanta (47,686), S-22 10L 3 Cincinnati (49,895), S-29 21L 9 St. Louis (47,675), O-6 34L 13 at Detroit (45,199), MON/O-14 17L 14 at Los Angeles Rams (74,070), O-20 37L 24 Oakland Raiders (58,524), O-27 35L 13 Los Angeles Rams (57,526), MON/N-4 15L 14 at Dallas (50,018), N-10 20W 34 at Chicago (42,731), N-17 0W 27 Atlanta (45,435), N-24 0L 0 at Cleveland (24,559), D-1 7W 7 Green Bay (45,475), D-8 6W 35 New Orleans (40,418), D-15 21 226 236
RUSHING Att Yds Avg LG TDJackson, Wilbur 174 705 4.1 64 0Schreiber, Larry 174 634 3.6 21 3Johnson, Sammy 44 237 5.4 32 2Williams, Delvin 36 201 5.6 71t 3Reed, Joe 16 107 6.7 27 0Owen, Tom 16 36 2.3 7 1Snead, Norm 1 25 25.0 25 0Moore, Manfred 10 24 2.4 8 1Wittum, Tom 1 13 13.0 13 0Washington, Gene 2 4 2.0 7 0Morrison, Dennis 1 0 0.0 0 0Mitchell, Tom 1 -2 -2.0 -2 0Beasley, Terry 1 -3 -3.0 -3 049ERS 477 1,981 4.2 71t 10OPPONENTS 503 2,033 4.0 33 13
RECEIVING No Yds Avg LG TDSchreiber, Larry 30 217 7.2 16 1Washington, Gene 29 615 21.2 58t 6Abramowicz, Dan 25 369 14.8 30 1Jackson, Wilbur 23 190 8.3 31 2Mitchell, Tom 19 262 13.8 25 0Beasley, Terry 17 253 14.9 68t 3Kwalick, Ted 13 231 17.8 36 2Johnson, Sammy 11 106 9.6 23 0Moore, Manfred 2 29 14.5 26 0Williams, Delvin 1 9 9.0 9 049ERS 170 2,281 13.4 68t 15OPPONENTS 178 2,178 12.2 64t 14
INTERCEPTIONS No Yds Avg LG TDMcGill, Ralph 5 71 14.2 45 0Nunley, Frank 4 30 7.5 20 0Johnson, Jimmy 3 50 16.7 37 0Holmes, Mike 3 26 8.7 14 0Vanderbundt, Skip 2 22 11.0 18 0Phillips, Mel 1 27 27.0 27 0Wilcox, Dave 1 21 21.0 21t 1Taylor, Bruce 1 0 0.0 0 049ERS 20 247 12.4 45 1OPPONENTS 28 409 14.6 55 1
KICKOFF RETURNS No Yds Avg LG TDHolmes, Mike 25 612 24.5 57 0 Moore, Manfred 18 398 22.1 51 0Jackson, Wilbur 5 103 20.6 30 0Johnson, Sammy 2 31 15.5 17 0West, Robert 1 0 0.0 0 049ERS 51 1,144 22.4 57 0OPPONENTS 51 1,099 21.6 59 0
PUNT RETURNS No FC Yds Avg LG TDMcGill, Ralph 20 3 166 8.3 47 0Moore, Manfred 5 0 149 29.8 88t 1Holmes, Mike 9 0 45 5.0 22 0Taylor, Bruce 10 2 38 3.8 21 049ERS 44 5 398 9.1 88t 1OPPONENTS 46 2 491 10.7 45 0
PUNTING No Yds Avg LG BlkWittum, Tom 68 2,800 41.2 67 1Gossett, Bruce 2 56 28.0 31 049ERS 70 2,856 40.8 67 1OPPONENTS 74 2,922 39.5 61 0
PASSING Att Comp Pct Yds LG TD Int QBOwen, Tom 184 88 47.8 1,327 68t 10 15 56.1Morrison, Dennis 51 21 41.2 227 26 1 5 21.9Reed, Joe 74 29 39.2 316 58t 2 7 22.1Snead, Norm 48 30 62.5 368 39t 2 1 91.3Abramowicz, Dan 1 1 100.0 41 41 0 0 118.8Spurrier, Steve 3 1 33.3 2 2 0 0 42.449ERS 361 170 47.1 2,281 68t 15 28 49.2OPPONENTS 339 178 52.5 2,178 64t 14 20 61.8
TEAM STATISTICS 49ers OppTOTAL FIRST DOWNS 227 232 By Rushing 101 113 By Passing 104 101 By Penalties 22 18TOTAL NET YARDS 3,988 3,964 Net Yards Rushing 1,981 2,033 Net Yards Passing 2,007 1,931TOTAL PLAYS FROM SCRIMMAGE 873 870 Rushes 477 503 Average Gain Per Rush 4.2 4.0FORWARD PASSES ATTEMPTED 361 339 Number Completed 170 178 Per Cent Completed 47.1 52.5 Quarterback Sacks 34 28 Yards Lost 267 247 Passes Had Intercepted 28 20 Avg. Net Passing per Game 143.4 137.9PUNTS 70 74 Total Yardage of Punts 2,856 2,922 Average Length 40.8 39.5KICKOFF RETURNS 51 51 Total Yards Returned 1,144 1,099 Average Length of Return 22.4 21.6PENALTIES 63 85 Yards Penalized 606 830FUMBLES 31 38 Own Fumbles Recovered 17 18 Opponents’ Fumbles Recovered 20 14FIELD GOALS 11 12 Field Goals Attempted 24 19TOTAL POINTS SCORED 226 236 Touchdowns Scored 28 29 Touchdowns Rushing 10 13 Touchdowns Passing 15 14 Touchdowns Returns 3 2 Extra Points 25 26 Field Goals 11 12 Safeties 0 0
SCORING TDs Ru Pa Int Fu KO Pu PAT FG S PtsGossett, Bruce 0 0 0 0 0 0 0 25/27 11/24 0 58Washington, Gene 6 0 6 0 0 0 0 0/0 0/0 0 36Schreiber, Larry 4 3 1 0 0 0 0 0/0 0/0 0 24Beasley, Terry 3 0 3 0 0 0 0 0/0 0/0 0 18Williams, Delvin 3 3 0 0 0 0 0 0/0 0/0 0 18Jackson, Wilbur 2 0 2 0 0 0 0 0/0 0/0 0 12Johnson, Sammy 2 2 0 0 0 0 0 0/0 0/0 0 12Kwalick, Ted 2 0 2 0 0 0 0 0/0 0/0 0 12Moore, Manfred 2 1 0 0 0 0 1 0/0 0/0 0 12Abramowicz, Dan 1 0 1 0 0 0 0 0/0 0/0 0 6Belk, Bill 1 0 0 0 1 0 0 0/0 0/0 0 6Owen, Tom 1 1 0 0 0 0 0 0/0 0/0 0 6Wilcox, Dave 1 0 0 1 0 0 0 0/0 0/0 0 649ERS 28 10 15 1 1 0 1 25/27 11/24 0 226OPPONENTS 29 13 14 1 1 0 0 26/29 12/19 0 236
Rookie Names in Italics

SAN FRANCISCO 49ERS
M E D I A G U I D E2 0 1 7 S E A S O N 456
1975 (5-9)Dick Nolan, Coach
L 17 at Minnesota (48,418), S-21 27L 14 Los Angeles Rams (55,072), S-28 23W 20 at Kansas City (54,490), O-5 3L 3 Atlanta (43,719), O-12 17W 35 New Orleans (39,654), O-19 21L 16 at New England (60,358), O-26 24L 17 Detroit (42,683), N-2 28W 24 at Los Angeles Rams (78,995), N-9 23W 31 Chicago (41,319), N-16 3W 16 at New Orleans (40,328), N-23 6L 17 at Philadelphia (56,694), N-30 27L 13 Houston (43,767), D-7 27L 9 at Atlanta (38,501), D-14 31L 23 New York Giants (33,939), D-21 26 255 286
RUSHING Att Yds Avg LG TDWilliams, Delvin 117 631 5.4 52 3Schreiber, Larry 134 337 2.5 15 5Jackson, Wilbur 78 303 3.9 44 0Johnson, Sammy 55 185 3.4 26t 3Spurrier, Steve 15 91 6.7 14 0Snead, Norm 9 30 3.3 10 1Johnson, Kermit 4 25 6.3 19 0Moore, Manfred 3 10 3.3 4 0Beasley, Terry 1 5 5.0 5 0Owen, Tom 1 1 1.0 1 0Hayes, Bob 2 -2 -1.0 -1 0Holmes, Mike 1 -4 -4.0 -4 0Washington, Gene 1 -4 -4.0 -4 0Wittum, Tom 1 -10 -10.0 -10 049ERS 422 1,598 3.8 52 12OPPONENTS 518 1,829 3.5 26t 14
RECEIVING No Yds Avg LG TDWashington, Gene 44 735 16.7 68t 9Schreiber, Larry 40 289 7.2 20 1Williams, Delvin 34 370 10.9 30 1Mitchell, Tom 25 366 14.6 60t 3Johnson, Sammy 23 177 7.7 20 0Beasley, Terry 20 297 14.9 28 0Jackson, Wilbur 17 128 7.5 20 0Holmes, Mike 16 220 13.8 25 1Hayes, Bob 6 119 19.8 36 0Larson, Bill 5 64 12.8 24 0Wittum, Tom 2 29 14.5 18 0Moore, Manfred 1 11 11.0 11 0Fahnhorst, Keith 1 1 1.0 1 049ERS 234 2,806 12.0 68t 15OPPONENTS 228 2,521 11.1 65t 15
INTERCEPTIONS No Yds Avg LG TDTaylor, Bruce 3 29 9.7 15 0Vanderbundt, Skip 2 36 18.0 21 0Johnson, Jimmy 2 0 0.0 0 0Allen, Nate 1 37 37.0 37t 1McGill, Ralph 1 27 27.0 27 0Nunley, Frank 1 6 6.0 6 0Phillips, Mel 1 3 3.0 3 049ERS 11 138 12.6 37t 1OPPONENTS 19 212 11.2 74 0
KICKOFF RETURNS No Yds Avg LG TDMoore, Manfred 26 650 25.0 52 0Johnson, Sammy 17 400 23.5 41 0Johnson, Kermit 6 135 22.5 27 0Baker, Wayne 4 45 11.3 15 0Holmes, Mike 2 59 29.5 44 0Hart, Jeff 2 28 14.0 14 0Williams, Delvin 1 24 24.0 24 0Hall, Windlan 1 18 18.0 18 0Fahnhorst, Keith 1 13 13.0 13 049ERS 60 1,372 22.9 52 0OPPONENTS 48 1,061 22.1 50 0
PUNT RETURNS No FC Yds Avg LG TDTaylor, Bruce 16 1 166 10.4 66 0Moore, Manfred 16 0 160 10.0 17 0McGill, Ralph 31 0 290 9.4 34 049ERS 63 1 616 9.8 66 0OPPONENTS 43 1 490 11.4 76 0
PUNTING No Yds Avg LG BlkWittum, Tom 67 2,804 41.9 64 349ERS 67 2,804 41.9 64 3OPPONENTS 84 3,536 42.1 56 3
PASSING Att Comp Pct Yds LG TD Int QBSnead, Norm 189 108 57.1 1,337 60t 9 10 73.0Spurrier, Steve 207 102 49.3 1,151 68t 5 7 60.3Owens, Tom 51 24 47.1 318 24 1 2 57.5Johnson, Sammy 2 0 0.0 0 0 0 0 39.6Washington, Gene 1 0 0.0 0 0 0 0 39.649ERS 450 234 52.0 2,806 68t 15 19 64.9OPPONENTS 411 228 55.5 2,521 63t 15 11 74.9
TEAM STATISTICS 49ers OppTOTAL FIRST DOWNS 240 253 By Rushing 86 102 By Passing 133 130 By Penalties 21 21TOTAL NET YARDS 4,158 4,026 Net Yards Rushing 1,598 1,829 Net Yards Passing 2,560 2,197TOTAL PLAYS FROM SCRIMMAGE 905 969 Rushes 422 518 Average Gain Per Rush 3.8 3.5FORWARD PASSES ATTEMPTED 450 411 Number Completed 234 228 Per Cent Completed 52.0 55.5 Quarterback Sacks 33 40 Yards Lost 246 324 Passes Had Intercepted 19 11 Avg. Net Passing per Game 114.1 156.9PUNTS 67 84 Total Yardage of Punts 2,804 3,536 Average Length 41.9 42.1KICKOFF RETURNS 60 48 Total Yards Returned 1,372 1,061 Average Length of Return 22.9 22.1PENALTIES 89 86 Yards Penalized 693 702FUMBLES 44 34 Own Fumbles Recovered 19 18 Opponents’ Fumbles Recovered 16 25FIELD GOALS 14 17 Field Goals Attempted 28 22TOTAL POINTS SCORED 255 286 Touchdowns Scored 31 34 Touchdowns Rushing 12 14 Touchdowns Passing 15 15 Touchdowns Returns 4 5 Extra Points 27 31 Field Goals 14 17 Safeties 0 0
SCORING TDs Ru Pa Int Fu KO Pu PAT FG S PtsMike-Mayer, Steve 0 0 0 0 0 0 0 27/31 14/28 0 69Washington, Gene 9 0 9 0 0 0 0 0/0 0/0 0 54Schreiber, Larry 6 5 1 0 0 0 0 0/0 0/0 0 36Williams, Delvin 4 3 1 0 0 0 0 0/0 0/0 0 24Johnson, Sammy 3 3 0 0 0 0 0 0/0 0/0 0 18Mitchell, Tom 3 0 3 0 0 0 0 0/0 0/0 0 18Allen, Nate 1 0 0 1 0 0 0 0/0 0/0 0 6Hart, Tommy 1 0 0 0 1 0 0 0/0 0/0 0 6Holmes, Mike 1 0 1 0 0 0 0 0/0 0/0 0 6McGill, Ralph 1 0 0 0 1 0 0 0/0 0/0 0 6Snead, Norm 1 1 0 0 0 0 0 0/0 0/0 0 6Washington, Dave* 1 0 0 0 0 0 1 0/0 0/0 0 649ERS 31 12 15 1 2 0 1 27/31 14/28 0 255OPPONENTS 34 14 15 0 4 0 1 31/34 17/22 0 286*returned blocked punt
Rookie Names in Italics

SAN FRANCISCO 49ERS
M E D I A G U I D E2 0 1 7 S E A S O N 457
1976 (8-6)Monte Clark, Coach
W 26 at Green Bay (54,628), S-12 14L 12 Chicago (44,158), S-19 19W 37 at Seattle (59,108), S-26 21W 17 New York Jets (42,961), O-3 6W 16 at Los Angeles Rams (84,483), MON/O-11 0W 33 New Orleans (43,160), O-17 3W 15 Atlanta (50,240), SUN/O-23 0L 20 at St. Louis (50,365), O-31 (OT) 23L 21 Washington (56,134), N-7 24L 16 at Atlanta (20,058), N-14 21L 3 Los Angeles Rams (57,909), N-21 23W 20 Minnesota (56,775), MON/N-29 16L 7 at San Diego (33,539), D-5 (OT) 13W 27 at New Orleans (42,536), D-12 7 270 190
RUSHING Att Yds Avg LG TDWilliams, Delvin 248 1,203 4.9 80t 7Jackson, Wilbur 200 792 4.0 24 1Johnson, Kermit 32 99 3.1 16 1Plunkett, Jim 19 95 5.0 12 0Hofer, Paul 18 74 4.1 17 0Bull, Scott 15 66 4.4 18 2Johnson, Sammy 24 52 2.2 12 2Ferrell, Bob 9 28 3.1 11 1Domres, Marty 4 18 4.5 8 0Lash, Jim 3 5 1.7 8 0McGee, Willie 3 12 4.0 19 0Washington, Gene 1 3 3.0 3 049ERS 576 2,447 4.3 80t 14OPPONENTS 487 1,786 3.7 29 10
RECEIVING No Yds Avg LG TDWashington, Gene 33 457 13.8 55t 6Jackson, Wilbur 33 324 9.8 32 1Williams, Delvin 27 283 10.5 85t 2Mitchell, Tom 20 240 12.0 27 1McGee, Willie 13 269 20.7 52t 4Lash, Jim 13 190 14.6 43 0Johnson, Sammy 5 52 10.4 24 0Hofer, Paul 4 45 11.3 13t 1Harrison, Ken 3 65 21.7 41 0Johnson, Kermit 1 11 11.0 11 0Obradovich, Jim 1 11 11.0 11 0Ferrell, Bob 1 9 9.0 9 0Rivera, Steve 1 7 7.0 7 049ERS 155 1,963 12.7 85t 15OPPONENTS 180 2,349 13.1 77t 13
INTERCEPTIONS No Yds Avg LG TDRhodes, Bruce 3 42 14.0 30 0Phillips, Mel 2 14 7.0 14 0Vanderbundt, Skip 2 8 4.0 8 0Johnson, Jimmy 1 17 17.0 17 0Nunley, Frank 1 12 12.0 12 049ERS 9 93 10.3 30 0OPPONENTS 21 253 12.1 43 2
KICKOFF RETURNS No Yds Avg LG TDLeonard, Anthony 26 553 21.3 39 0Hofer, Paul 5 91 18.2 23 0Johnson, Kermit 4 114 28.5 40 0Mitchell, Tom 2 7 3.5 7 0Ferrell, Bob 1 12 12.0 12 049ERS 38 777 20.5 40 0OPPONENTS 46 924 20.1 38 0
PUNT RETURNS No FC Yds Avg LG TDRhodes, Bruce 16 2 142 8.9 22 0Leonard, Anthony 35 5 293 8.4 60t 1McGill, Ralph 10 1 103 10.3 50 1Taylor, Bruce 3 1 16 5.3 11 0Rivera, Steve 1 0 3 3.0 3 049ERS 65 9 557 8.6 60t 2OPPONENTS 52 2 351 6.8 25 0
PUNTING No Yds Avg LG BlkWittum, Tom 89 3,634 40.8 68 249ERS 89 3,634 40.8 68 2OPPONENTS 108 4,327 40.1 72 1
PASSING Att Comp Pct Yds LG TD Int QBPlunkett, Jim 243 126 51.9 1,592 85t 13 16 63.0Domres, Marty 14 7 50.0 101 41 0 1 44.0Bull, Scott 48 21 43.8 252 30 2 4 36.6Williams, Delvin 1 1 100.0 18 18 0 0 118.849ERS 306 155 50.7 1,963 85t 15 21 58.8OPPONENTS 374 180 48.1 2,249 77t 13 9 68.8
TEAM STATISTICS 49ers OppTOTAL FIRST DOWNS 242 218 By Rushing 131 94 By Passing 91 102 By Penalties 20 22TOTAL NET YARDS 4,085 3,562 Net Yards Rushing 2,447 1,786 Net Yards Passing 1,638 1,776TOTAL PLAYS FROM SCRIMMAGE 916 922 Rushes 576 487 Average Gain Per Rush 4.3 3.7FORWARD PASSES ATTEMPTED 306 374 Number Completed 155 180 Per Cent Completed 50.7 48.1 Quarterback Sacks 34 61 Yards Lost 325 573 Passes Had Intercepted 21 9 Avg. Net Passing per Game 117.0 126.9PUNTS 91 108 Total Yardage of Punts 3,634 4,327 Average Length 39.9 40.1KICKOFF RETURNS 38 46 Total Yards Returned 777 924 Average Length of Return 20.5 20.1PENALTIES 102 94 Yards Penalized 848 906FUMBLES 30 37 Own Fumbles Recovered 18 21 Opponents’ Fumbles Recovered 16 12FIELD GOALS 16 6 Field Goals Attempted 28 21TOTAL POINTS SCORED 270 190 Touchdowns Scored 32 25 Touchdowns Rushing 14 10 Touchdowns Passing 15 13 Touchdowns Returns 3 2 Extra Points 26 20 Field Goals 16 6 Safeties 2 1SCORING TDs Ru Pa Int Fu KO Pu PAT FG S PtsMike-Mayer, Steve 0 0 0 0 0 0 0 26/30 16/28 0 74Williams, Delvin 9 7 2 0 0 0 0 0/0 0/0 0 54Washington, Gene 6 0 6 0 0 0 0 0/0 0/0 0 36McGee, Willie 4 0 4 0 0 0 0 0/0 0/0 0 24Bull, Scott 2 2 0 0 0 0 0 0/0 0/0 0 12Jackson, Wilbur 2 1 1 0 0 0 0 0/0 0/0 0 12Johnson, Sammy 2 2 0 0 0 0 0 0/0 0/0 0 12Elam, Cleveland 1 0 0 0 1 0 0 0/0 0/0 0 6Ferrell, Bob 1 1 0 0 0 0 0 0/0 0/0 0 6Hofer, Paul 1 0 1 0 0 0 0 0/0 0/0 0 6Johnson, Kermit 1 1 0 0 0 0 0 0/0 0/0 0 6Leonard, Anthony 1 0 0 0 0 0 1 0/0 0/0 0 6McGill, Ralph 1 0 0 0 0 0 1 0/0 0/0 0 6Mitchell, Tom 1 0 1 0 0 0 0 0/0 0/0 0 6Hart, Tommy 0 0 0 0 0 0 0 0/0 0/0 1 2Team 0 0 0 0 0 0 0 0/0 0/0 1 249ERS 32 14 15 0 1 0 2 26/30 16/28 2 270OPPONENTS 25 10 13 2 0 0 0 20/24 6/21 1 190
Rookie Names in Italics

SAN FRANCISCO 49ERS
M E D I A G U I D E2 0 1 7 S E A S O N 458
1977 (5-9)Ken Meyer, Coach
L 0 at Pittsburgh (48,046), MON/S-19 27L 15 Miami (40,503), S-25 19L 14 at Los Angeles Rams (55,466), O-2 34L 0 Atlanta (38,009), O-9 7L 17 at New York Giants (70,366), O-16 20W 28 Detroit (39,392), O-23 7W 20 Tampa Bay (34,750), O-30 10W 10 at Atlanta (46,577), N-6 3W 10 at New Orleans (41,564), N-13 (OT) 7L 10 Los Angeles Rams (56,779), N-20 23W 20 New Orleans (33,702), N-27 17L 27 at Minnesota (40,745), D-4 28L 35 Dallas (55,848), MON/D-12 42L 14 at G.B. in Milwaukee (44,902), D-18 16 220 260
RUSHING Att Yds Avg LG TDWilliams, Delvin 268 931 3.5 40 7Jackson, Wilbur 179 780 4.4 80 7Ferrell, Bob 41 160 3.9 12 1Hofer, Paul 34 106 3.1 10 0Plunkett, Jim 28 71 2.5 9 1Bull, Scott 5 20 4.0 8 0Harrison, Kenny 6 15 2.5 15 0Williams, Dave 2 6 3.0 6 0McGee, Willie 1 -3 -3.0 -3 049ERS 564 2,086 3.7 80 16OPPONENTS 551 1,869 3.4 42t 16
RECEIVING No Yds Avg LG TDWashington, Gene 32 638 19.9 47t 5Jackson, Wilbur 22 169 7.7 24 0Williams, Dave 20 179 9.0 17 2Mitchell, Tom 19 226 11.9 31 0Harrison, Ken 15 217 14.5 46 1Seal, Paul 13 230 17.7 47t 1Hofer, Paul 5 46 9.2 16 0Lash, Jim 3 22 7.3 16 0McGee, Willie 2 27 13.5 14 0Obradovich, Jim 2 16 8.0 11 0Ferrell, Bob 2 12 6.0 7 0Cline, Tony 1 15 15.0 15 049ERS 136 1,797 13.2 47t 9OPPONENTS 139 1,948 14.0 73t 14
INTERCEPTIONS No Yds Avg LG TDWashington, Dave 2 68 34.0 50 0Phillips, Mel 2 23 11.5 23 0McGill, Ralph 1 30 30.0 30 0Harper, Willie 1 6 6.0 6 0Vanderbundt, Skip 1 6 6.0 6 0Leonard, Anthony 1 0 0.0 0 049ERS 8 133 16.6 50 0OPPONENTS 17 298 17.5 42 1
KICKOFF RETURNS No Yds Avg LG TDHofer, Paul 36 871 24.2 48 0Williams, Delvin 4 122 30.5 80t 1Jennings, Rick 3 60 20.0 24 0Ferrell, Bob 3 35 11.7 17 0Leonard, Anthony 1 68 68.0 68 0Obradovich, Jim 1 9 9.0 9 0Williams, Dave 1 9 9.0 9 049ERS 49 1,174 24.0 80t 1OPPONENTS 48 1,025 21.4 92t 1
PUNT RETURNS No FC Yds Avg LG TDLeonard, Anthony 22 2 154 7.0 19 0Black, Stan 13 1 38 2.9 11 0Jennings, Rick 7 1 32 4.6 13 0Rivera, Steve 3 0 7 2.3 3 0Williams, Dave 1 0 60 60.0 60 0Elia, Bruce 1 0 1 1.0 1 0Baldassin, Mike 1 1 0 0.0 0 049ERS 48 5 292 6.1 60 0OPPONENTS 47 6 444 9.5 63 0
PUNTING No Yds Avg LG BlkWittum, Tom 77 2,801 36.4 54 349ERS 77 2,801 36.4 54 3OPPONENTS 86 3,228 37.5 62 1
PASSING Att Comp Pct Yds LG TD Int QBPlunkett, Jim 248 128 51.6 1,693 47t 9 14 62.1Bull, Scott 24 7 29.2 89 26 0 2 7.8Wittum, Tom 3 1 33.3 15 15 0 0 50.7Harrison, Kenny 1 0 0.0 0 0 0 0 39.6Williams, Delvin 1 0 0.0 0 0 0 1 39.649ERS 277 136 49.1 1,797 47t 9 17 55.3OPPONENTS 270 139 51.5 1,948 73t 14 8 80.0
TEAM STATISTICS 49ers OppTOTAL FIRST DOWNS 219 221 By Rushing 126 107 By Passing 81 94 By Penalties 12 20TOTAL NET YARDS 3,594 3,457 Net Yards Rushing 2,086 1,869 Net Yards Passing 1,508 1,588TOTAL PLAYS FROM SCRIMMAGE 877 863 Rushes 564 551 Average Gain Per Rush 3.7 3.4FORWARD PASSES ATTEMPTED 277 270 Number Completed 136 139 Per Cent Completed 49.1 51.5 Quarterback Sacks 36 42 Yards Lost 289 360 Passes Had Intercepted 17 8 Avg. Net Passing per Game 107.7 113.4PUNTS 80 86 Total Yardage of Punts 2,801 3,228 Average Length 35.0 37.5KICKOFF RETURNS 49 48 Total Yards Returned 1,174 1,025 Average Length of Return 24.0 21.4PENALTIES 99 96 Yards Penalized 830 820FUMBLES 27 21 Own Fumbles Recovered 19 11 Opponents’ Fumbles Recovered 10 8FIELD GOALS 11 13 Field Goals Attempted 19 22TOTAL POINTS SCORED 220 260 Touchdowns Scored 27 32 Touchdowns Rushing 16 16 Touchdowns Passing 9 14 Touchdowns Returns 2 2 Extra Points 25 29 Field Goals 11 13 Safeties 0 0
SCORING TDs Ru Pa Int Fu KO Pu PAT FG S PtsWilliams, Delvin 9 7 2 0 0 0 0 0/0 0/0 0 54Wersching, Ray 0 0 0 0 0 0 0 23/23 10/17 0 53Jackson, Wilbur 7 7 0 0 0 0 0 0/0 0/0 0 42Washington, Gene 5 0 5 0 0 0 0 0/0 0/0 0 30Baldassin, Mike 1 0 0 0 0 0 1* 0/0 0/0 0 6Ferrell, Bob 1 1 0 0 0 0 0 0/0 0/0 0 6Harrison, Kenny 1 0 1 0 0 0 0 0/0 0/0 0 6Plunkett, Jim 1 1 0 0 0 0 0 0/0 0/0 0 6Seal, Paul 1 0 1 0 0 0 0 0/0 0/0 0 6Williams, Dave 1 0 0 0 0 1 0 0/0 0/0 0 6Wittum, Tom 0 0 0 0 0 0 0 2/4 1/2 0 549ERS 27 16 9 0 0 1 1 25/27 11/19 0 220OPPONENTS 32 16 14 1 0 1 0 29/32 13/22 0 260*recovered blocked punt
Rookie Names in Italics
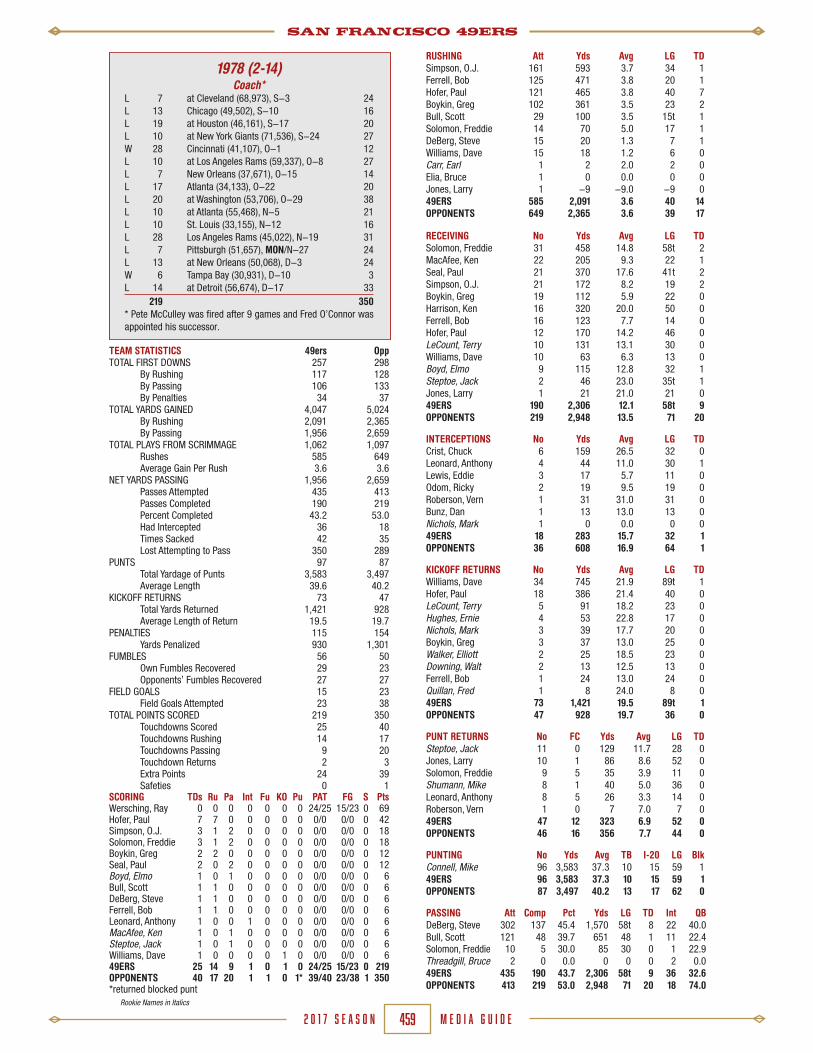
SAN FRANCISCO 49ERS
M E D I A G U I D E2 0 1 7 S E A S O N 459
1978 (2-14)Coach*
L 7 at Cleveland (68,973), S-3 24L 13 Chicago (49,502), S-10 16L 19 at Houston (46,161), S-17 20L 10 at New York Giants (71,536), S-24 27W 28 Cincinnati (41,107), O-1 12L 10 at Los Angeles Rams (59,337), O-8 27L 7 New Orleans (37,671), O-15 14L 17 Atlanta (34,133), O-22 20L 20 at Washington (53,706), O-29 38L 10 at Atlanta (55,468), N-5 21L 10 St. Louis (33,155), N-12 16L 28 Los Angeles Rams (45,022), N-19 31L 7 Pittsburgh (51,657), MON/N-27 24L 13 at New Orleans (50,068), D-3 24W 6 Tampa Bay (30,931), D-10 3L 14 at Detroit (56,674), D-17 33 219 350* Pete McCulley was fired after 9 games and Fred O’Connor was appointed his successor.
RUSHING Att Yds Avg LG TDSimpson, O.J. 161 593 3.7 34 1Ferrell, Bob 125 471 3.8 20 1Hofer, Paul 121 465 3.8 40 7Boykin, Greg 102 361 3.5 23 2Bull, Scott 29 100 3.5 15t 1Solomon, Freddie 14 70 5.0 17 1DeBerg, Steve 15 20 1.3 7 1Williams, Dave 15 18 1.2 6 0Carr, Earl 1 2 2.0 2 0Elia, Bruce 1 0 0.0 0 0Jones, Larry 1 -9 -9.0 -9 049ERS 585 2,091 3.6 40 14OPPONENTS 649 2,365 3.6 39 17
RECEIVING No Yds Avg LG TDSolomon, Freddie 31 458 14.8 58t 2MacAfee, Ken 22 205 9.3 22 1Seal, Paul 21 370 17.6 41t 2Simpson, O.J. 21 172 8.2 19 2Boykin, Greg 19 112 5.9 22 0Harrison, Ken 16 320 20.0 50 0Ferrell, Bob 16 123 7.7 14 0Hofer, Paul 12 170 14.2 46 0LeCount, Terry 10 131 13.1 30 0Williams, Dave 10 63 6.3 13 0Boyd, Elmo 9 115 12.8 32 1Steptoe, Jack 2 46 23.0 35t 1Jones, Larry 1 21 21.0 21 049ERS 190 2,306 12.1 58t 9OPPONENTS 219 2,948 13.5 71 20
INTERCEPTIONS No Yds Avg LG TDCrist, Chuck 6 159 26.5 32 0Leonard, Anthony 4 44 11.0 30 1Lewis, Eddie 3 17 5.7 11 0Odom, Ricky 2 19 9.5 19 0Roberson, Vern 1 31 31.0 31 0Bunz, Dan 1 13 13.0 13 0Nichols, Mark 1 0 0.0 0 049ERS 18 283 15.7 32 1OPPONENTS 36 608 16.9 64 1
KICKOFF RETURNS No Yds Avg LG TDWilliams, Dave 34 745 21.9 89t 1Hofer, Paul 18 386 21.4 40 0LeCount, Terry 5 91 18.2 23 0Hughes, Ernie 4 53 22.8 17 0Nichols, Mark 3 39 17.7 20 0Boykin, Greg 3 37 13.0 25 0Walker, Elliott 2 25 18.5 23 0 Downing, Walt 2 13 12.5 13 0Ferrell, Bob 1 24 13.0 24 0Quillan, Fred 1 8 24.0 8 049ERS 73 1,421 19.5 89t 1OPPONENTS 47 928 19.7 36 0
PUNT RETURNS No FC Yds Avg LG TDSteptoe, Jack 11 0 129 11.7 28 0Jones, Larry 10 1 86 8.6 52 0Solomon, Freddie 9 5 35 3.9 11 0Shumann, Mike 8 1 40 5.0 36 0Leonard, Anthony 8 5 26 3.3 14 0Roberson, Vern 1 0 7 7.0 7 049ERS 47 12 323 6.9 52 0OPPONENTS 46 16 356 7.7 44 0
PUNTING No Yds Avg TB I-20 LG BlkConnell, Mike 96 3,583 37.3 10 15 59 149ERS 96 3,583 37.3 10 15 59 1OPPONENTS 87 3,497 40.2 13 17 62 0
PASSING Att Comp Pct Yds LG TD Int QBDeBerg, Steve 302 137 45.4 1,570 58t 8 22 40.0Bull, Scott 121 48 39.7 651 48 1 11 22.4Solomon, Freddie 10 5 30.0 85 30 0 1 22.9Threadgill, Bruce 2 0 0.0 0 0 0 2 0.049ERS 435 190 43.7 2,306 58t 9 36 32.6OPPONENTS 413 219 53.0 2,948 71 20 18 74.0
TEAM STATISTICS 49ers OppTOTAL FIRST DOWNS 257 298 By Rushing 117 128 By Passing 106 133 By Penalties 34 37TOTAL YARDS GAINED 4,047 5,024 By Rushing 2,091 2,365 By Passing 1,956 2,659TOTAL PLAYS FROM SCRIMMAGE 1,062 1,097 Rushes 585 649 Average Gain Per Rush 3.6 3.6NET YARDS PASSING 1,956 2,659 Passes Attempted 435 413 Passes Completed 190 219 Percent Completed 43.2 53.0 Had Intercepted 36 18 Times Sacked 42 35 Lost Attempting to Pass 350 289PUNTS 97 87 Total Yardage of Punts 3,583 3,497 Average Length 39.6 40.2KICKOFF RETURNS 73 47 Total Yards Returned 1,421 928 Average Length of Return 19.5 19.7PENALTIES 115 154 Yards Penalized 930 1,301FUMBLES 56 50 Own Fumbles Recovered 29 23 Opponents’ Fumbles Recovered 27 27FIELD GOALS 15 23 Field Goals Attempted 23 38TOTAL POINTS SCORED 219 350 Touchdowns Scored 25 40 Touchdowns Rushing 14 17 Touchdowns Passing 9 20 Touchdown Returns 2 3 Extra Points 24 39 Safeties 0 1SCORING TDs Ru Pa Int Fu KO Pu PAT FG S PtsWersching, Ray 0 0 0 0 0 0 0 24/25 15/23 0 69Hofer, Paul 7 7 0 0 0 0 0 0/0 0/0 0 42Simpson, O.J. 3 1 2 0 0 0 0 0/0 0/0 0 18Solomon, Freddie 3 1 2 0 0 0 0 0/0 0/0 0 18Boykin, Greg 2 2 0 0 0 0 0 0/0 0/0 0 12Seal, Paul 2 0 2 0 0 0 0 0/0 0/0 0 12Boyd, Elmo 1 0 1 0 0 0 0 0/0 0/0 0 6Bull, Scott 1 1 0 0 0 0 0 0/0 0/0 0 6DeBerg, Steve 1 1 0 0 0 0 0 0/0 0/0 0 6Ferrell, Bob 1 1 0 0 0 0 0 0/0 0/0 0 6Leonard, Anthony 1 0 0 1 0 0 0 0/0 0/0 0 6MacAfee, Ken 1 0 1 0 0 0 0 0/0 0/0 0 6Steptoe, Jack 1 0 1 0 0 0 0 0/0 0/0 0 6Williams, Dave 1 0 0 0 0 1 0 0/0 0/0 0 649ERS 25 14 9 1 0 1 0 24/25 15/23 0 219OPPONENTS 40 17 20 1 1 0 1* 39/40 23/38 1 350*returned blocked punt
Rookie Names in Italics
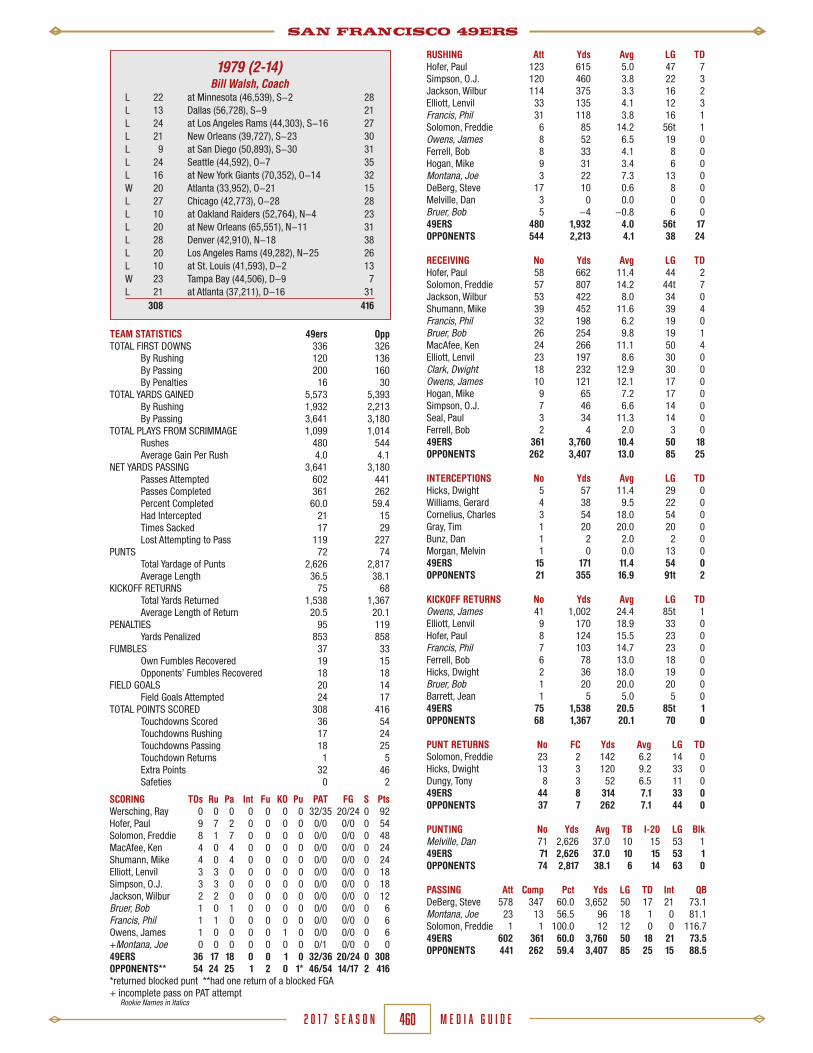
SAN FRANCISCO 49ERS
M E D I A G U I D E2 0 1 7 S E A S O N 460
1979 (2-14)Bill Walsh, Coach
L 22 at Minnesota (46,539), S-2 28L 13 Dallas (56,728), S-9 21L 24 at Los Angeles Rams (44,303), S-16 27L 21 New Orleans (39,727), S-23 30L 9 at San Diego (50,893), S-30 31L 24 Seattle (44,592), O-7 35L 16 at New York Giants (70,352), O-14 32W 20 Atlanta (33,952), O-21 15L 27 Chicago (42,773), O-28 28L 10 at Oakland Raiders (52,764), N-4 23L 20 at New Orleans (65,551), N-11 31L 28 Denver (42,910), N-18 38L 20 Los Angeles Rams (49,282), N-25 26L 10 at St. Louis (41,593), D-2 13W 23 Tampa Bay (44,506), D-9 7L 21 at Atlanta (37,211), D-16 31 308 416
RUSHING Att Yds Avg LG TDHofer, Paul 123 615 5.0 47 7Simpson, O.J. 120 460 3.8 22 3Jackson, Wilbur 114 375 3.3 16 2Elliott, Lenvil 33 135 4.1 12 3Francis, Phil 31 118 3.8 16 1Solomon, Freddie 6 85 14.2 56t 1Owens, James 8 52 6.5 19 0Ferrell, Bob 8 33 4.1 8 0Hogan, Mike 9 31 3.4 6 0Montana, Joe 3 22 7.3 13 0DeBerg, Steve 17 10 0.6 8 0Melville, Dan 3 0 0.0 0 0Bruer, Bob 5 -4 -0.8 6 049ERS 480 1,932 4.0 56t 17OPPONENTS 544 2,213 4.1 38 24
RECEIVING No Yds Avg LG TDHofer, Paul 58 662 11.4 44 2Solomon, Freddie 57 807 14.2 44t 7Jackson, Wilbur 53 422 8.0 34 0Shumann, Mike 39 452 11.6 39 4Francis, Phil 32 198 6.2 19 0Bruer, Bob 26 254 9.8 19 1MacAfee, Ken 24 266 11.1 50 4Elliott, Lenvil 23 197 8.6 30 0Clark, Dwight 18 232 12.9 30 0Owens, James 10 121 12.1 17 0Hogan, Mike 9 65 7.2 17 0Simpson, O.J. 7 46 6.6 14 0Seal, Paul 3 34 11.3 14 0Ferrell, Bob 2 4 2.0 3 049ERS 361 3,760 10.4 50 18OPPONENTS 262 3,407 13.0 85 25
INTERCEPTIONS No Yds Avg LG TDHicks, Dwight 5 57 11.4 29 0Williams, Gerard 4 38 9.5 22 0Cornelius, Charles 3 54 18.0 54 0Gray, Tim 1 20 20.0 20 0Bunz, Dan 1 2 2.0 2 0Morgan, Melvin 1 0 0.0 13 049ERS 15 171 11.4 54 0OPPONENTS 21 355 16.9 91t 2
KICKOFF RETURNS No Yds Avg LG TDOwens, James 41 1,002 24.4 85t 1Elliott, Lenvil 9 170 18.9 33 0Hofer, Paul 8 124 15.5 23 0Francis, Phil 7 103 14.7 23 0Ferrell, Bob 6 78 13.0 18 0 Hicks, Dwight 2 36 18.0 19 0Bruer, Bob 1 20 20.0 20 0Barrett, Jean 1 5 5.0 5 049ERS 75 1,538 20.5 85t 1OPPONENTS 68 1,367 20.1 70 0
PUNT RETURNS No FC Yds Avg LG TDSolomon, Freddie 23 2 142 6.2 14 0Hicks, Dwight 13 3 120 9.2 33 0Dungy, Tony 8 3 52 6.5 11 049ERS 44 8 314 7.1 33 0OPPONENTS 37 7 262 7.1 44 0
PUNTING No Yds Avg TB I-20 LG BlkMelville, Dan 71 2,626 37.0 10 15 53 149ERS 71 2,626 37.0 10 15 53 1OPPONENTS 74 2,817 38.1 6 14 63 0
PASSING Att Comp Pct Yds LG TD Int QBDeBerg, Steve 578 347 60.0 3,652 50 17 21 73.1Montana, Joe 23 13 56.5 96 18 1 0 81.1Solomon, Freddie 1 1 100.0 12 12 0 0 116.749ERS 602 361 60.0 3,760 50 18 21 73.5OPPONENTS 441 262 59.4 3,407 85 25 15 88.5
TEAM STATISTICS 49ers OppTOTAL FIRST DOWNS 336 326 By Rushing 120 136 By Passing 200 160 By Penalties 16 30TOTAL YARDS GAINED 5,573 5,393 By Rushing 1,932 2,213 By Passing 3,641 3,180TOTAL PLAYS FROM SCRIMMAGE 1,099 1,014 Rushes 480 544 Average Gain Per Rush 4.0 4.1NET YARDS PASSING 3,641 3,180 Passes Attempted 602 441 Passes Completed 361 262 Percent Completed 60.0 59.4 Had Intercepted 21 15 Times Sacked 17 29 Lost Attempting to Pass 119 227PUNTS 72 74 Total Yardage of Punts 2,626 2,817 Average Length 36.5 38.1KICKOFF RETURNS 75 68 Total Yards Returned 1,538 1,367 Average Length of Return 20.5 20.1PENALTIES 95 119 Yards Penalized 853 858FUMBLES 37 33 Own Fumbles Recovered 19 15 Opponents’ Fumbles Recovered 18 18FIELD GOALS 20 14 Field Goals Attempted 24 17TOTAL POINTS SCORED 308 416 Touchdowns Scored 36 54 Touchdowns Rushing 17 24 Touchdowns Passing 18 25 Touchdown Returns 1 5 Extra Points 32 46 Safeties 0 2
SCORING TDs Ru Pa Int Fu KO Pu PAT FG S PtsWersching, Ray 0 0 0 0 0 0 0 32/35 20/24 0 92Hofer, Paul 9 7 2 0 0 0 0 0/0 0/0 0 54Solomon, Freddie 8 1 7 0 0 0 0 0/0 0/0 0 48MacAfee, Ken 4 0 4 0 0 0 0 0/0 0/0 0 24Shumann, Mike 4 0 4 0 0 0 0 0/0 0/0 0 24Elliott, Lenvil 3 3 0 0 0 0 0 0/0 0/0 0 18Simpson, O.J. 3 3 0 0 0 0 0 0/0 0/0 0 18Jackson, Wilbur 2 2 0 0 0 0 0 0/0 0/0 0 12Bruer, Bob 1 0 1 0 0 0 0 0/0 0/0 0 6Francis, Phil 1 1 0 0 0 0 0 0/0 0/0 0 6Owens, James 1 0 0 0 0 1 0 0/0 0/0 0 6+Montana, Joe 0 0 0 0 0 0 0 0/1 0/0 0 049ERS 36 17 18 0 0 1 0 32/36 20/24 0 308OPPONENTS** 54 24 25 1 2 0 1* 46/54 14/17 2 416*returned blocked punt **had one return of a blocked FGA+ incomplete pass on PAT attempt
Rookie Names in Italics

SAN FRANCISCO 49ERS
M E D I A G U I D E2 0 1 7 S E A S O N 461
1980 (6-10)Bill Walsh, Coach
W 26 at New Orleans (58,621), S-7 23W 24 St. Louis (49,999), S-14 (OT) 21W 37 at New York Jets (50,608), S-21 27L 17 Atlanta (56,518), S-28 20L 26 at Los Angeles Rams (62,188), O-5 48L 14 at Dallas (63,399), O-12 59L 17 Los Angeles Rams (55,360), O-19 31L 23 Tampa Bay (51,925), O-26 24L 13 at Detroit (78,845), N-2 17L 16 at G.B. in Milwaukee (54,475), N-9 23L 13 at Miami (45,135), N-16 17W 12 New York Giants (38,574), N-23 0W 21 New England (45,254), N-30 17W 38 New Orleans (37,949), D-7 (OT) 35L 10 at Atlanta (55,767), D-14 35L 13 Buffalo (37,476), D-21 18 320 415
RUSHING Att Yds Avg LG TDCooper, Earl 171 720 4.2 47 5Elliott, Lenvil 76 341 4.5 20 2Hofer, Paul 60 293 4.9 26t 1Woods, Don 50 229 4.6 23 0Montana, Joe 32 77 2.4 11 2Solomon, Freddie 8 56 7.0 11 0Francis, Phil 7 36 5.1 14 0DeBerg, Steve 6 4 0.7 7 0Patton, Ricky 1 1 1.0 1 0Ramson, Eason 2 -2 -1.0 4 0Miller, Jim 2 -12 -6.0 0 049ERS 415 1,743 4.2 47 10OPPONENTS 556 2,218 4.0 48 20
RECEIVING No Yds Avg LG TDCooper, Earl 83 567 6.8 66t 4Clark, Dwight 82 991 12.1 71t 8Solomon Freddie 48 658 13.7 93t 8Hofer, Paul 41 467 11.4 28 2Young, Charle 29 325 11.2 41 2Elliott, Lenvil 27 285 10.6 45t 1Ramson, Eason 21 179 8.5 22 2Woods, Don 20 171 8.6 23 0Owens, James 9 133 14.8 29 0Francis, Phil 3 23 7.7 15 049ERS 363 3,799 10.5 93t 27OPPONENTS 327 3,958 12.1 81t 29
INTERCEPTIONS No Yds Avg LG TDHicks, Dwight 4 73 18.3 44 0Churchman, Ricky 4 7 1.8 7 0Leopold, Bobby 2 23 11.5 13 0Turner, Keena 2 15 7.5 11 0Williams, Gerard 1 28 28.0 28 0Rhodes, Ray 1 25 25.0 25 0Johnson, Charles 1 15 15.0 15 0Puki, Craig 1 0 0.0 0 0Tautolo, Terry 1 0 0.0 0 049ERS 17 186 10.9 44 0OPPONENTS 26 319 12.3 48 2
KICKOFF RETURNS No Yds Avg LG TDOwens, James 31 726 23.4 101t 1Elliott, Lenvil 18 321 17.8 32 0Anderson, Terry 6 104 17.3 22 0Solomon, Freddie 5 60 12.0 32 0 Francis, Phil 4 61 15.3 32 0Patton, Ricky 4 43 10.8 19 0Johnson, Charles 2 10 5.0 22 0Ramson, Eason 1 18 1.8 18 0Tautolo, Terry 1 16 16.0 16 0Young, Charle 1 14 14.0 14 0Hughes, Ernie 1 10 10.0 10 0Hofer, Paul 1 2 2.0 2 049ERS 75 1,385 18.5 101t 1OPPONENTS 58 1,203 20.7 52 0
PUNT RETURNS No FC Yds Avg LG TDSolomon, Freddie 27 3 298 11.0 57t 2Hicks, Dwight 12 3 58 4.8 10 0Robinson, Jimmy 3 0 36 12.0 21 0Churchman, Ricky 2 0 16 8.0 13 0Ferrell, Bob 1 0 1 1.0 1 049ERS 45 6 409 9.1 57t 2OPPONENTS 48 11 530 11.0 43 0
PUNTING No Yds Avg TB I-20 LG BlkMiller, Jim 77 3,152 40.9 5 11 65 049ERS 77 3,152 40.9 5 11 65 0OPPONENTS 67 2,560 38.2 6 10 64 0
PASSING Att Comp Pct Yds LG TD Int QBMontana, Joe 273 176 64.5 1,795 71t 15 9 87.8DeBerg, Steve 321 186 57.9 1,998 93t 12 17 66.7Solomon, Freddie 1 0 0.0 0 0 0 0 39.6Woods, Don 2 1 50.0 6 6 0 0 56.349ERS 597 363 60.8 3,799 93t 27 26 76.2OPPONENTS 495 327 66.1 3,958 81t 29 17 95.7
TEAM STATISTICS 49ers OppTOTAL FIRST DOWNS 298 341 By Rushing 105 137 By Passing 171 185 By Penalties 22 19TOTAL YARDS GAINED 5,320 5,969 By Rushing 1,743 2,218 By Passing 3,577 3,751TOTAL PLAYS FROM SCRIMMAGE 1,042 556 Rushes 415 556 Average Gain Per Rush 4.2 4.0NET YARDS PASSING 3,577 3,751 Passes Attempted 597 495 Passes Completed 363 327 Percent Completed 60.8 66.1 Had Intercepted 26 17 Times Sacked 30 31 Lost Attempting to Pass 222 207PUNTS 77 67 Total Yardage of Punts 3,152 2,560 Average Length 40.9 38.2KICKOFF RETURNS 75 58 Total Yards Returned 1,385 1,203 Average Length of Return 18.5 20.7PENALTIES 109 92 Yards Penalized 933 286FUMBLES 39 34 Own Fumbles Recovered 25 17 Opponents’ Fumbles Recovered 17 14FIELD GOALS 15 17 Field Goals Attempted 19 26TOTAL POINTS SCORED 320 415 Touchdowns Scored 40 52 Touchdowns Rushing 10 20 Touchdowns Passing 27 29 Touchdown Returns 3 3 Extra Points 33 50 Safeties 1 1
SCORING TDs Ru Pa Int Fu KO Pu PAT FG S PtsWersching, Ray 0 0 0 0 0 0 0 33/39 15/19 0 78Solomon, Freddie 10 0 8 0 0 0 2 0/0 0/0 0 60Cooper, Earl 9 5 4 0 0 0 0 0/0 0/0 0 54Clark, Dwight 8 0 8 0 0 0 0 0/0 0/0 0 48Elliott, Lenvil 3 2 1 0 0 0 0 0/0 0/0 0 18Hofer, Paul 3 1 2 0 0 0 0 0/0 0/0 0 18Montana, Joe 2 2 0 0 0 0 0 0/0 0/0 0 12Ramson, Eason 2 0 2 0 0 0 0 0/0 0/0 0 12Young, Charle 2 0 2 0 0 0 0 0/0 0/0 0 12Owens, James 1 0 0 0 0 1 0 0/0 0/0 0 6Stuckey, Jim 0 0 0 0 0 0 0 0/0 0/0 1 249ERS 40 10 27 0 0 1 2 33/39 15/19 1 320OPPONENTS 52 20 29 2 1 0 0 50/52 17/26 0 415
Rookie Names in Italics

SAN FRANCISCO 49ERS
M E D I A G U I D E2 0 1 7 S E A S O N 462
1981 (13-3/16-3)NFC West Champions – World Champions
Bill Walsh, CoachL 17 at Detroit (62,123), S-6 24W 28 Chicago (49,520), S-13 17L 17 at Atlanta (56,653), S-20 34W 21 New Orleans (44,433), S-27 14W 30 at Washington (51,843), O-4 17W 45 Dallas (57,574), O-11 14W 13 at G.B. in Milwaukee (50,171), O-18 3W 20 Los Angeles Rams (59,190), O-25 17W 17 at Pittsburgh (52,878), N-1 14W 17 Atlanta (59,127), N-8 14L 12 Cleveland (52,445), N-15 15W 33 at Los Angeles Rams (63,456), N-22 31W 17 New York Giants (57,186), N-29 10W 21 at Cincinnati (56,796), D-6 3W 28 Houston (55,707), D-13 6W 21 at New Orleans (43,639), D-20 17 357 250
NFC PLAYOFF - JAN. 3(at San Francisco - Candlestick Park)
W 38 New York Giants (58,360) 24NFC CHAMPIONSHIP - JAN. 10
(at San Francisco - Candlestick Park)W 28 Dallas (60,525) 27
SUPER BOWL XVI - JAN. 24(at Pontiac, Michigan - Silverdome)
W 26 Cincinnati (81,270) 21
SCORING TDs Ru Pa Int Fu KO Pu PAT FG S PtsMontana, Joe 2 2 0 0 0 0 0 0/0 0/0 0 12Cooper, Earl 1 1 0 0 0 0 0 0/0 0/0 0 6Easley, Walt 1 1 0 0 0 0 0 0/0 0/0 0 6Hofer, Paul 1 1 0 0 0 0 0 0/0 0/0 0 6Ring, Bill 1 0 1 0 0 0 0 0/0 0/0 0 6Wilson, Mike 1 0 1 0 0 0 0 0/0 0/0 0 649ERS 43 17 20 4 1 1 0 42/42 19/29 0 357OPPONENTS 30 10 16 2 1 0 1 29/30 13/23 0 250RUSHING Att Yds Avg LG TDPatton, Ricky 152 543 3.6 28 4Cooper, Earl 98 330 3.4 23 1Davis, Johnny 94 297 3.2 14 7Easley, Walt 76 224 2.9 9 1Hofer, Paul 60 193 3.2 12 1Ring, Bill 22 106 4.8 16 0Montana, Joe 25 95 3.8 20t 2Lawrence, Amos 13 48 3.7 14 1Solomon, Freddie 9 43 4.8 16 0Clark, Dwight 3 32 10.7 18 0Elliott, Lenvil 7 29 4.1 9 0Benjamin, Guy 1 1 1.0 1 049ERS 560 1,941 3.5 28 17OPPONENTS 464 1,918 4.1 29 10RECEIVING No Yds Avg LG TDClark, Dwight 85 1,105 13.0 78t 4Solomon, Freddie 59 969 16.4 60t 8Cooper, Earl 51 477 9.4 50 0Young, Charle 37 400 10.8 29 5Hofer, Paul 27 244 9.0 22 0Patton, Ricky 27 195 7.2 31t 1Wilson, Michael 9 125 13.9 27t 1Easley, Walt 9 62 6.9 21 0Elliott, Lenvil 7 81 11.6 19 0Ramson, Eason 4 45 11.3 16 0Ring, Bill 3 28 9.3 21 1Shumann, Mike 3 21 7.0 8 0Lawrence, Amos 3 10 3.3 5 0Davis, Johnny 3 -1 -0.3 3 0Peets, Brian 1 5 5.0 5 049ERS 328 3,766 11.5 78t 20OPPONENTS 273 3,135 11.5 67 16INTERCEPTIONS No Yds Avg LG TDHicks, Dwight 9 239 26.6 72 1Lott, Ronnie 7 117 16.7 41t 3Williamson, Carlton 4 44 11.0 28 0Wright, Eric 3 26 8.7 26 0McColl, Milt 1 22 22.0 22 0Reynolds, Jack 1 0 0.0 0 0Martin, Saladin 1 0 0.0 0 0Turner, Keena 1 0 0.0 0 049ERS 27 448 16.6 72 4OPPONENTS 13 297 22.9 101t 2KICKOFF RETURNS No Yds Avg LG TDLawrence, Amos 17 437 25.7 92t 1Ring, Bill 10 217 21.7 29 0Lott, Ronnie 7 111 15.9 20 0Wilson, Mike 4 67 16.8 22 0Jones, Arrington 3 43 14.3 22 0Hicks, Dwight 1 22 22.0 22 0Ramson, Eason 1 12 12.0 12 0Patton, Ricky 1 0 0.0 0 0Davis, Johnny 1 0 0.0 0 049ERS 45 909 20.2 92t 1OPPONENTS 67 1,389 20.7 55 0PUNT RETURNS No FC Yds Avg LG TDSolomon, Freddie 29 6 173 6.0 19 0Hicks, Dwight 19 4 171 9.0 39 049ERS 48 10 344 7.2 39 0OPPONENTS 57 8 664 11.7 58t 1PUNTING No Yds Avg TB I-20 LG BlkMiller, Jim 93 3,858 41.5 15 14 65 049ERS 93 3,858 41.5 15 14 65 0OPPONENTS 83 3,433 41.4 5 17 66 0PASSING Att Comp Pct Yds LG TD Int QBMontana, Joe 488 311 63.7 3,565 78t 19 12 88.4Benjamin, Guy 26 15 57.7 171 27 1 1 74.4Easley, Walt 1 1 100.0 5 5 0 0 87.5Solomon, Freddie 1 1 100.0 25 25 0 0 118.8Clark, Dwight 1 0 0.0 0 0 0 0 39.649ERS 517 328 63.4 3,766 78t 20 13 87.7OPPONENTS 514 273 53.1 3,135 67 16 27 60.2
TEAM STATISTICS 49ers OppTOTAL FIRST DOWNS 317 280 By Rushing 110 113 By Passing 183 144 By Penalties 24 23TOTAL YARDS GAINED 5,484 4,763 By Rushing 1,941 1,918 By Passing 3,543 2,845TOTAL PLAYS FROM SCRIMMAGE 1,106 1,014 Rushes 560 464 Average Gain Per Rush 3.5 4.1NET YARDS PASSING 3,543 2,845 Passes Attempted 517 514 Passes Completed 328 273 Percent Completed 63.4 53.1 Had Intercepted 13 27 Times Sacked 29 36 Lost Attempting to Pass 223 290PUNTS 93 83 Total Yardage of Punts 3,858 3,433 Average Length 41.5 41.4KICKOFF RETURNS 45 67 Total Yards Returned 909 1,389 Average Length of Return 20.2 20.7PENALTIES 92 108 Yards Penalized 752 866FUMBLES 26 36 Own Fumbles Recovered 14 15 Opponents’ Fumbles Recovered 21 12FIELD GOALS 19 13 Field Goals Attempted 29 23TOTAL POINTS SCORED 357 250 Touchdowns Scored 43 30 Touchdowns Rushing 17 10 Touchdowns Passing 20 16 Touchdown Returns 6 4 Extra Points 42 29 Safeties 0 1SCORING TDs Ru Pa Int Fu KO Pu PAT FG S PtsWersching, Ray 0 0 0 0 0 0 0 30/30 17/23 0 81Solomon, Freddie 8 0 8 0 0 0 0 0/0 0/0 0 48Davis, Johnny 7 7 0 0 0 0 0 0/0 0/0 0 42Patton, Ricky 5 4 1 0 0 0 0 0/0 0/0 0 30Young, Charle 5 0 5 0 0 0 0 0/0 0/0 0 30Clark, Dwight 4 0 4 0 0 0 0 0/0 0/0 0 24Bahr, Matt 0 0 0 0 0 0 0 12/12 2/6 0 18Lott, Ronnie 3 0 0 3 0 0 0 0/0 0/0 0 18Hicks, Dwight 2 0 0 1 1 0 0 0/0 0/0 0 12Lawrence, Amos 2 1 0 0 0 1 0 0/0 0/0 0 12
(continued)
Rookie Names in Italics

SAN FRANCISCO 49ERS
M E D I A G U I D E2 0 1 7 S E A S O N 463
1982 (3-6)Bill Walsh, Coach
L 17 Los Angeles Raiders (59,748), S-12 23L 21 at Denver (73,899), S-19 24W 31 at St. Louis (38,064), N-21 20L 20 New Orleans (51,611), N-28 23W 30 at Los Angeles Rams (58,574), THU/D-2 24L 37 San Diego (51,988), SAT/D-11 41L 7 Atlanta (53,234), SUN/D-19 17W 26 at Kansas City (24,319), D-26 13L 20 Los Angeles Rams (54,256), J-2 21 209 206
RUSHING Att Yds Avg LG TDMoore, Jeff 85 281 3.3 19 4Ring, Bill 48 183 3.8 11 1Montana, Joe 30 118 3.9 21 1Cooper, Earl 24 77 3.2 9 0Williams, Vince 20 68 3.4 12 0Easley, Walt 5 11 2.2 5 0Lawrence, Amos 5 7 1.4 4 0Nehemiah, Renaldo 1 -1 -1.0 -1 0Solomon, Freddie 1 -4 -4.0 -4 049ERS 219 740 3.4 21 6OPPONENTS 303 1,199 4.0 54 9
RECEIVING No Yds Avg LG TDClark, Dwight 60 913 15.2 51 5Moore, Jeff 37 405 11.0 55 4Francis, Russ 23 278 12.1 26 2Young, Charle 22 189 8.6 30 0Solomon, Freddie 19 323 17.0 46t 3Cooper, Earl 19 153 8.1 20 1Ring, Bill 13 94 7.2 15 0Nehemiah, Renaldo 8 161 20.1 55 1Wilson, Mike 6 80 13.3 27 1Williams, Vince 4 33 8.3 13 0Ramson, Eason 2 27 13.5 21 0Lawrence, Amos 2 12 6.0 6 049ERS 215 2,668 12.4 55 17OPPONENTS 158 1,949 12.3 46 14
INTERCEPTIONS No Yds Avg LG TDHicks, Dwight 3 5 1.7 3 0Lott, Ronnie 2 95 47.5 83t 1Wright, Eric 1 31 31.0 31 0Horn, Bob 1 19 19.0 19 0Reynolds, Jack 1 0 0.0 0 0Harper, Willie 1 0 0.0 0 049ERS 9 150 16.7 83t 1OPPONENTS 11 130 11.8 32 0
KICKOFF RETURNS No Yds Avg LG TDMcLemore, Dana 16 353 22.1 45 0Lawrence, Amos 9 190 21.1 30 0Ring, Bill 6 145 24.2 41 0Ramson,Eason 2 20 10.0 13 0Ferrari, Ron 2 19 9.5 11 0Moore, Jeff 1 15 15.0 15 049ERS 36 742 20.6 45 0OPPONENTS 40 857 21.4 55 0
PUNT RETURNS No FC Yds Avg LG TDMcLemore, Dana 7 0 156 22.3 93t 1Solomon, Freddie 13 1 122 9.4 27 0Hicks, Dwight 10 1 54 5.4 13 0Ring, Bill 0 1 0 0.0 0 049ERS 30 3 332 11.1 93t 1OPPONENTS 20 4 224 11.2 67t 1
PUNTING No Yds Avg TB I-20 LG BlkMiller, Jim 44 1,676 38.1 3 11 80 149ERS 44 1,676 38.1 3 11 80 1OPPONENTS 50 2,134 42.7 5 10 58 0
PASSING Att Comp Pct Yds LG TD Int QBMontana, Joe 346 213 61.6 2,613 55 17 11 88.0Francis, Russ 1 1 100.0 45 45 0 0 118.8Benjamin, Guy 1 1 100.0 10 10 0 0 108.349ERS 348 215 61.8 2,668 55 17 11 88.6OPPONENTS 278 158 56.8 1,949 46 14 9 82.0
TEAM STATISTICS 49ers OppTOTAL FIRST DOWNS 183 170 By Rushing 49 71 By Passing 121 88 By Penalties 13 11TOTAL YARDS GAINED 3,242 3,035 By Rushing 740 1,199 By Passing 2,502 1,836TOTAL PLAYS FROM SCRIMMAGE 587 596 Rushes 219 303 Average Gain Per Rush 3.4 4.0NET YARDS PASSING 2,502 1,836 Passes Attempted 348 278 Passes Completed 215 158 Percent Completed 61.8 56.8 Had Intercepted 11 9 Times Sacked 20 15 Lost Attempting to Pass 166 113PUNTS 45 50 Total Yardage of Punts 1,676 2,134 Average Length 37.2 42.7KICKOFF RETURNS 36 40 Total Yards Returned 742 847 Average Length of Return 20.6 21.4PENALTIES 45 58 Yards Penalized 451 542FUMBLES 17 14 Own Fumbles Recovered 7 4 Opponents’ Fumbles Recovered 10 10FIELD GOALS 12 13 Field Goals Attempted 17 19TOTAL POINTS SCORED 209 206 Touchdowns Scored 25 24 Touchdowns Rushing 6 9 Touchdowns Passing 17 14 Touchdown Returns 2 1 Extra Points 23 23 Safeties 0 0AVG. TIME OF POSSESSION 28:31 31:29
SCORING TDs Ru Pa Int Fu KO Pu PAT FG S PtsWersching, Ray 0 0 0 0 0 0 0 23/25 12/17 0 59Moore, Jeff 8 4 4 0 0 0 0 0/0 0/0 0 48Clark, Dwight 5 0 5 0 0 0 0 0/0 0/0 0 30Solomon, Freddie 3 0 3 0 0 0 0 0/0 0/0 0 18Francis, Russ 2 0 2 0 0 0 0 0/0 0/0 0 12Cooper, Earl 1 0 1 0 0 0 0 0/0 0/0 0 6Lott, Ronnie 1 0 0 1 0 0 0 0/0 0/0 0 6McLemore, Dana 1 0 0 0 0 0 1 0/0 0/0 0 6Montana, Joe 1 1 0 0 0 0 0 0/0 0/0 0 6Nehemiah, Renaldo 1 0 1 0 0 0 0 0/0 0/0 0 6Ring, Bill 1 1 0 0 0 0 0 0/0 0/0 0 6Wilson, Mike 1 0 1 0 0 0 0 0/0 0/0 0 649ERS 25 6 17 1 0 0 1 23/25 12/17 0 209OPPONENTS 24 9 14 0 0 0 1 23/24 13/19 0 206
Rookie Names in Italics

SAN FRANCISCO 49ERS
M E D I A G U I D E2 0 1 7 S E A S O N 464
1983 (10-6/11-7)NFC West Champions
Bill Walsh, CoachL 17 Philadelphia (55,775), SAT/S-3 22W 48 at Minnesota (58,167), THU/S-8 17W 42 at St. Louis (38,130), S-18 27W 24 Atlanta (57,814), S-25 20W 33 at New England (54,293), O-2 13L 7 Los Angeles Rams (59,119), O-9 10W 32 at New Orleans (68,134), O-16 13W 45 at Los Angeles Rams (66,070), O-23 35L 13 New York Jets (54,796), O-30 27L 17 Miami (57,832), N-6 20W 27 New Orleans (40,022), N-13 0L 24 at Atlanta (32,782), N-20 28L 3 at Chicago (40,483), N-27 13W 35 Tampa Bay (49,773), D-4 21W 23 at Buffalo (38,039), D-11 10W 42 Dallas (59,957), MON/D-19 17 432 293
NFC PLAYOFF - DEC. 31(at San Francisco - Candlestick Park)
W 24 Detroit (58,386)-SAT 23
NFC CHAMPIONSHIP - JAN. 8(at Washington, DC - RFK Stadium)
L 21 Washington (55,363) 24
SCORING TDs Ru Pa Int Fu KO Pu PAT FG S PtsHicks, Dwight 2 0 0 2 0 0 0 0/0 0/0 0 12Montana, Joe 2 2 0 0 0 0 0 0/0 0/0 0 12Ring, Bill 2 2 0 0 0 0 0 0/0 0/0 0 12Wright, Eric 2 0 0 2 0 0 0 0/0 0/0 0 12Board, Dwaine 1 0 0 0 1 0 0 0/0 0/0 0 6Collier, Tim 1 0 0 1 0 0 0 0/0 0/0 0 6McLemore, Dana 1 0 0 0 0 0 1 0/0 0/0 0 6Moore, Jeff 1 1 0 0 0 0 0 0/0 0/0 0 6Nehemiah, Renaldo 1 0 1 0 0 0 0 0/0 0/0 0 6Ramson, Eason 1 0 1 0 0 0 0 0/0 0/0 0 649ERS 51 17 27 5 1 0 1 51/51 25/30 0 432OPPONENTS 35 10 23 1 1 0 1 32/33 17/27 0 293RUSHING Att Yds Avg LG TDTyler, Wendell 176 856 4.9 39 4Craig, Roger 176 725 4.1 71 8Montana, Joe 61 284 4.7 18 2Ring, Bill 64 254 4.0 25 2Moore, Jeff 15 43 2.9 14 1Orosz, Tom 2 39 19.5 23 0Monroe, Carl 10 23 2.3 5 0Clark, Dwight 3 18 6.0 9 0Cavanaugh, Matt 1 8 8.0 8 0Ramson, Eason 1 3 3.0 3 0Solomon, Freddie 1 3 3.0 3 0Benjamin, Guy 1 1 1.0 1 049ERS 511 2,257 4.4 71 17OPPONENTS 449 1,936 4.3 49 10RECEIVING No Yds Avg LG TDClark, Dwight 70 840 12.0 46t 8Craig, Roger 48 427 8.9 23 4Tyler, Wendell 34 285 8.4 26 2Francis, Russ 33 357 10.8 25 4Solomon, Freddie 31 662 21.4 77t 4Wilson, Mike 30 433 14.4 49 0Ring, Bill 23 182 7.9 24 0Moore, Jeff 19 206 10.8 34 0Nehemiah, Renaldo 17 236 13.9 27 1Ramson, Eason 17 125 7.4 16 1Cooper, Earl 15 207 13.8 73t 3Monroe, Carl 2 61 30.5 50 049ERS 339 4,021 11.9 77t 27OPPONENTS 322 3,701 11.5 76t 23INTERCEPTIONS No Yds Avg LG TDWright, Eric 7 164 23.4 60t 2Williamson, Carlton 4 51 12.8 26 0Lott, Ronnie 4 22 5.5 22 0Collier, Tim 3 32 10.7 32t 1Hicks, Dwight 2 102 51.0 62t 2Leopold, Bobby 2 13 6.5 9 0Harper, Willie 1 37 37.0 37 0Pillers, Lawrence 1 16 16.0 16 049ERS 24 437 18.2 62t 5OPPONENTS 12 168 14.0 43t 1KICKOFF RETURNS No Yds Avg LG TDMcLemore, Dana 30 576 19.2 39 0Monroe, Carl 8 152 19.0 32 0Moore, Jeff 7 117 16.7 46 0Ring, Bill 4 68 17.0 18 0Cooper, Earl 3 45 15.0 20 049ERS 52 958 18.4 46 0OPPONENTS 78 1,675 21.5 50 0PUNT RETURNS No FC Yds Avg LG TDMcLemore, Dana 31 6 331 10.7 56t 1Solomon, Freddie 5 3 34 6.8 11 049ERS 36 9 365 10.1 56t 1OPPONENTS 38 7 278 7.3 19 0PUNTING No Yds Avg TB I-20 LG BlkOrosz, Tom 65 2,552 39.3 6 16 61 149ERS 65 2,552 38.7 6 17 61 1OPPONENTS 73 2,993 40.5 9 15 60 1PASSING Att Comp Pct Yds LG TD Int QBMontana, Joe 515 332 64.5 3,910 77t 26 12 94.5Benjamin, Guy 12 7 58.3 111 73t 1 0 117.0Clark, Dwight 1 0 0.0 0 0 0 0 39.649ERS 528 339 64.2 4,021 77t 27 12 94.9OPPONENTS 526 322 61.2 3,701 76t 23 24 78.0
TEAM STATISTICS 49ers OppTOTAL FIRST DOWNS 344 302 By Rushing 129 98 By Passing 199 181 By Penalties 16 23TOTAL YARDS GAINED 6,054 5,189 By Rushing 2,257 1,936 By Passing 3,797 3,253TOTAL PLAYS FROM SCRIMMAGE 1,072 1,032 Rushes 511 449 Average Gain Per Rush 4.4 4.3NET YARDS PASSING 3,797 3,253 Passes Attempted 528 526 Passes Completed 339 322 Percent Completed 64.2 61.2 Had Intercepted 12 24 Times Sacked 33 57 Lost Attempting to Pass 224 448PUNTS 65 73 Total Yardage of Punts 2,552 2,993 Average Length 39.3 41.0KICKOFF RETURNS 52 78 Total Yards Returned 958 1,675 Average Length of Return 18.4 21.5PENALTIES 89 91 Yards Penalized 695 793FUMBLES 27 39 Own Fumbles Recovered 8 21 Opponents’ Fumbles Recovered 18 19FIELD GOALS 25 17 Field Goals Attempted 30 27TOTAL POINTS SCORED 432 293 Touchdowns Scored 51 35 Touchdowns Rushing 17 10 Touchdowns Passing 27 23 Touchdown Returns 7 2 Extra Points 51 32 Safeties 0 0AVG. TIME OF POSSESSION 30:12 29:48
SCORING TDs Ru Pa Int Fu KO Pu PAT FG S PtsWersching, Ray 0 0 0 0 0 0 0 51/51 25/30 0 126Craig, Roger 12 8 4 0 0 0 0 0/0 0/0 0 72Clark, Dwight 8 0 8 0 0 0 0 0/0 0/0 0 48Tyler, Wendell 6 4 2 0 0 0 0 0/0 0/0 0 36Francis, Russ 4 0 4 0 0 0 0 0/0 0/0 0 24Solomon, Freddie 4 0 4 0 0 0 0 0/0 0/0 0 24Cooper, Earl 3 0 3 0 0 0 0 0/0 0/0 0 18
(continued)
Rookie Names in Italics

SAN FRANCISCO 49ERS
M E D I A G U I D E2 0 1 7 S E A S O N 465
1984 (15-1/18-1)NFC West Champions – World Champions
Bill Walsh, CoachW 30 at Detroit (56,782), S-2 27W 37 Washington (59,707), MON/S-10 31W 30 New Orleans (57,611), S-16 20W 21 at Philadelphia (62,771), S-23 9W 14 Atlanta (57,990), S-30 5W 31 at New York Giants (76,112), MON/O-8 10L 17 Pittsburgh (59,110), O-14 20W 34 at Houston (39,900), O-21 21W 33 at Los Angeles Rams (65,481), O-28 0W 23 Cincinnati (58,234), N-4 17W 41 at Cleveland (60,092), N-11 7W 24 Tampa Bay (57,704), N-18 17W 35 at New Orleans (65,177), N-25 3W 35 at Atlanta (29,644), D-2 17W 51 Minnesota (56,670), SAT/D-8 7W 19 Los Angeles Rams (59,743), FRI/D-14 16 475 227
NFC PLAYOFF - DEC. 29(at San Francisco - Candlestick Park)
W 21 New York Giants (60,303)-SAT 10NFC CHAMPIONSHIP - JAN. 6
(at San Francisco - Candlestick Park)W 23 Chicago (61,040) 0
SUPER BOWL XIX - JAN. 20(at Palo Alto, California - Stanford Stadium)
W 38 Miami (84,059) 16
SCORING TDs Ru Pa Int Fu KO Pu PAT FG S Pts+Montana, Joe 2 2 0 0 0 0 0 0/1 0/0 0 12Nehemiah, Renaldo 2 0 2 0 0 0 0 0/0 0/0 0 12Johnson, Gary 1 0 0 0 1 0 0 0/0 0/0 1 8Frank, John 1 0 1 0 0 0 0 0/0 0/0 0 6Harmon, Derrick 1 1 0 0 0 0 0 0/0 0/0 0 6Monroe, Carl 1 0 1 0 0 0 0 0/0 0/0 0 6Shell, Todd 1 0 0 1 0 0 0 0/0 0/0 0 6Wilson, Mike 1 0 1 0 0 0 0 0/0 0/0 0 649ERS 57 21 32 2 1 0 1 56/57 25/35 1 475OPPONENTS 24 10 14 0 0 0 0 24/24 19/25 1 227+ incomplete pass on PAT attemptRUSHING Att Yds Avg LG TDTyler, Wendell 246 1,262 5.1 40 7Craig, Roger 155 649 4.2 28 7Harmon, Derrick 39 192 4.9 19 1Ring, Bill 38 162 4.3 34 3Montana, Joe 39 118 3.0 15 2Solomon, Freddie 6 72 12.0 47 1Cooper, Earl 3 13 4.3 7 0Monroe, Carl 3 13 4.3 7 0Runager, Max 1 -5 -5.0 -5 0Cavanaugh, Matt 4 -11 -2.8 -1 049ERS 534 2,465 4.6 47 21OPPONENTS 432 1,795 4.2 25 10RECEIVING No Yds Avg LG TDCraig, Roger 71 675 9.5 64t 3Clark, Dwight 52 880 16.9 80t 6Cooper, Earl 41 459 11.2 26 4Solomon, Freddie 40 737 18.4 64t 10Tyler, Wendell 28 230 8.2 26t 2Francis, Russ 23 285 12.4 32 2Nehemiah, Renaldo 18 357 19.8 59t 2Wilson, Mike 17 245 14.4 44 1Monroe, Carl 11 139 12.6 47 1Frank, John 7 60 8.6 21 1Ring, Bill 3 10 3.3 15 0Harmon, Derrick 1 2 2.0 2 049ERS 312 4,079 13.1 80t 32OPPONENTS 298 3,744 12.6 61 14INTERCEPTIONS No Yds Avg LG TDTurner, Keena 4 51 12.8 21 0Lott, Ronnie 4 26 6.5 15 0Shell, Todd 3 81 27.0 53t 1Hicks, Dwight 3 42 14.0 29 0McLemore, Dana 2 54 27.0 54t 1Williamson, Carlton 2 42 21.0 26 0Fahnhorst, Jim 2 9 4.5 9 0Wright, Eric 2 0 0.0 0 0Fuller, Jeff 1 38 38.0 38 0Bunz, Dan 1 2 2.0 2 0Clark, Mario 1 0 0.0 0 049ERS 25 345 13.8 54t 2OPPONENTS 10 155 15.5 43 0KICKOFF RETURNS No Yds Avg LG TDMonroe, Carl 27 561 20.8 44 0Harmon, Derrick 13 357 27.5 51 0McLemore, Dana 3 80 26.7 50 0Ring, Bill 1 27 27.0 27 0Wilson, Mike 1 14 14.0 14 0Cooper, Earl 1 0 0.0 0 0McIntyre, Guy 1 0 0.0 0 049ERS 47 1,039 22.1 51 0OPPONENTS 78 1,499 19.2 38 0PUNT RETURNS No FC Yds Avg LG TDMcLemore, Dana 45 11 521 11.6 79t 149ERS 45 11 521 11.6 79t 1OPPONENTS 30 4 190 6.3 25 0PUNTING No Yds Avg TB I-20 LG BlkRunager, Max 56 2,341 41.8 12 18 59 1Orosz, Tom 5 195 39.0 0 1 55 049ERS 61 2,536 40.9 12 19 59 1OPPONENTS 80 3,239 40.5 4 13 58 1PASSING Att Comp Pct Yds LG TD Int QBMontana, Joe 432 279 64.6 3,630 80t 28 10 102.9Cavanaugh, Matt 61 33 54.1 449 51t 4 0 99.7Harmon, Derrick 2 0 0.0 0 0 0 0 39.6Clark, Dwight 1 0 0.0 0 0 0 0 39.649ERS 496 312 62.9 4,079 80t 32 10 101.9OPPONENTS 546 298 54.6 3,744 61 14 25 65.6
TEAM STATISTICS 49ers OppTOTAL FIRST DOWNS 356 302 By Rushing 138 101 By Passing 204 173 By Penalties 14 28TOTAL YARDS GAINED 6,366 5,176 By Rushing 2,465 1,795 By Passing 3,901 3,381TOTAL PLAYS FROM SCRIMMAGE 1,057 1,029 Rushes 534 432 Average Gain Per Rush 4.6 4.2NET YARDS PASSING 3,901 3,381 Passes Attempted 496 546 Passes Completed 312 298 Percent Completed 62.9 54.6 Had Intercepted 10 25 Times Sacked 27 51 Lost Attempting to Pass 178 363PUNTS 61 80 Total Yardage of Punts 2,536 3,239 Average Length 41.6 40.5KICKOFF RETURNS 47 78 Total Yards Returned 1,039 1,499 Average Length of Return 22.1 19.2PENALTIES 100 91 Yards Penalized 884 723FUMBLES 26 28 Own Fumbles Recovered 14 15 Opponents’ Fumbles Recovered 13 12FIELD GOALS 25 19 Field Goals Attempted 35 25TOTAL POINTS SCORED 475 227 Touchdowns Scored 57 24 Touchdowns Rushing 21 10 Touchdowns Passing 32 14 Touchdown Returns 4 0 Extra Points 56 19 Safeties 1 1AVG. TIME OF POSSESSION 30:26 29:34SCORING TDs Ru Pa Int Fu KO Pu PAT FG S PtsWersching, Ray 0 0 0 0 0 0 0 56/56 25/35 0 131Solomon, Freddie 11 1 10 0 0 0 0 0/0 0/0 0 66Craig, Roger 10 7 3 0 0 0 0 0/0 0/0 0 60Tyler, Wendell 9 7 2 0 0 0 0 0/0 0/0 0 54Clark, Dwight 6 0 6 0 0 0 0 0/0 0/0 0 36Cooper, Earl 4 0 4 0 0 0 0 0/0 0/0 0 24Ring, Bill 3 3 0 0 0 0 0 0/0 0/0 0 18Francis, Russ 2 0 2 0 0 0 0 0/0 0/0 0 12McLemore, Dana 2 0 0 1 0 0 0 0/0 0/0 0 12
(continued)
Rookie Names in Italics
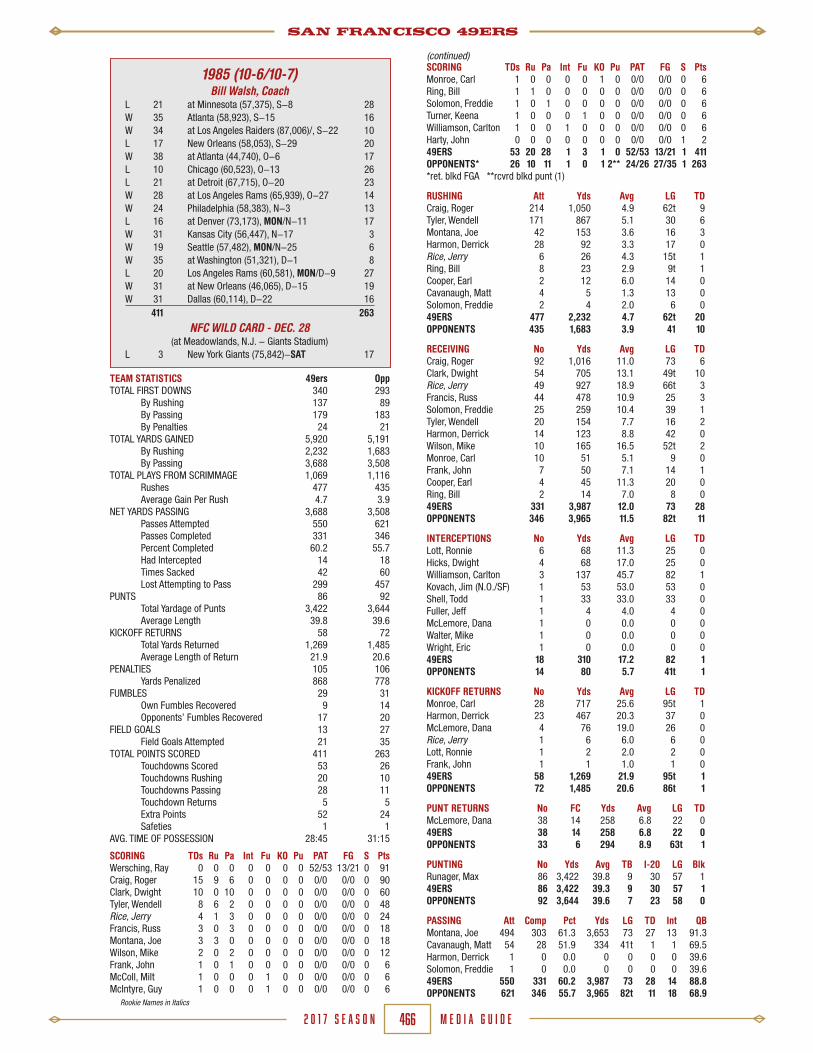
SAN FRANCISCO 49ERS
M E D I A G U I D E2 0 1 7 S E A S O N 466
1985 (10-6/10-7)Bill Walsh, Coach
L 21 at Minnesota (57,375), S-8 28W 35 Atlanta (58,923), S-15 16W 34 at Los Angeles Raiders (87,006)/, S-22 10L 17 New Orleans (58,053), S-29 20W 38 at Atlanta (44,740), O-6 17L 10 Chicago (60,523), O-13 26L 21 at Detroit (67,715), O-20 23W 28 at Los Angeles Rams (65,939), O-27 14W 24 Philadelphia (58,383), N-3 13L 16 at Denver (73,173), MON/N-11 17W 31 Kansas City (56,447), N-17 3W 19 Seattle (57,482), MON/N-25 6W 35 at Washington (51,321), D-1 8L 20 Los Angeles Rams (60,581), MON/D-9 27W 31 at New Orleans (46,065), D-15 19W 31 Dallas (60,114), D-22 16 411 263
NFC WILD CARD - DEC. 28(at Meadowlands, N.J. - Giants Stadium)
L 3 New York Giants (75,842)-SAT 17
SCORING TDs Ru Pa Int Fu KO Pu PAT FG S PtsMonroe, Carl 1 0 0 0 0 1 0 0/0 0/0 0 6Ring, Bill 1 1 0 0 0 0 0 0/0 0/0 0 6Solomon, Freddie 1 0 1 0 0 0 0 0/0 0/0 0 6Turner, Keena 1 0 0 0 1 0 0 0/0 0/0 0 6Williamson, Carlton 1 0 0 1 0 0 0 0/0 0/0 0 6Harty, John 0 0 0 0 0 0 0 0/0 0/0 1 249ERS 53 20 28 1 3 1 0 52/53 13/21 1 411OPPONENTS* 26 10 11 1 0 1 2** 24/26 27/35 1 263*ret. blkd FGA **rcvrd blkd punt (1)
RUSHING Att Yds Avg LG TDCraig, Roger 214 1,050 4.9 62t 9Tyler, Wendell 171 867 5.1 30 6Montana, Joe 42 153 3.6 16 3Harmon, Derrick 28 92 3.3 17 0Rice, Jerry 6 26 4.3 15t 1Ring, Bill 8 23 2.9 9t 1Cooper, Earl 2 12 6.0 14 0Cavanaugh, Matt 4 5 1.3 13 0Solomon, Freddie 2 4 2.0 6 049ERS 477 2,232 4.7 62t 20OPPONENTS 435 1,683 3.9 41 10
RECEIVING No Yds Avg LG TDCraig, Roger 92 1,016 11.0 73 6Clark, Dwight 54 705 13.1 49t 10Rice, Jerry 49 927 18.9 66t 3Francis, Russ 44 478 10.9 25 3Solomon, Freddie 25 259 10.4 39 1Tyler, Wendell 20 154 7.7 16 2Harmon, Derrick 14 123 8.8 42 0Wilson, Mike 10 165 16.5 52t 2Monroe, Carl 10 51 5.1 9 0Frank, John 7 50 7.1 14 1Cooper, Earl 4 45 11.3 20 0Ring, Bill 2 14 7.0 8 049ERS 331 3,987 12.0 73 28OPPONENTS 346 3,965 11.5 82t 11
INTERCEPTIONS No Yds Avg LG TDLott, Ronnie 6 68 11.3 25 0Hicks, Dwight 4 68 17.0 25 0Williamson, Carlton 3 137 45.7 82 1Kovach, Jim (N.O./SF) 1 53 53.0 53 0Shell, Todd 1 33 33.0 33 0Fuller, Jeff 1 4 4.0 4 0McLemore, Dana 1 0 0.0 0 0Walter, Mike 1 0 0.0 0 0Wright, Eric 1 0 0.0 0 049ERS 18 310 17.2 82 1OPPONENTS 14 80 5.7 41t 1
KICKOFF RETURNS No Yds Avg LG TDMonroe, Carl 28 717 25.6 95t 1Harmon, Derrick 23 467 20.3 37 0McLemore, Dana 4 76 19.0 26 0Rice, Jerry 1 6 6.0 6 0Lott, Ronnie 1 2 2.0 2 0Frank, John 1 1 1.0 1 049ERS 58 1,269 21.9 95t 1OPPONENTS 72 1,485 20.6 86t 1
PUNT RETURNS No FC Yds Avg LG TDMcLemore, Dana 38 14 258 6.8 22 049ERS 38 14 258 6.8 22 0OPPONENTS 33 6 294 8.9 63t 1
PUNTING No Yds Avg TB I-20 LG BlkRunager, Max 86 3,422 39.8 9 30 57 149ERS 86 3,422 39.3 9 30 57 1OPPONENTS 92 3,644 39.6 7 23 58 0
PASSING Att Comp Pct Yds LG TD Int QBMontana, Joe 494 303 61.3 3,653 73 27 13 91.3Cavanaugh, Matt 54 28 51.9 334 41t 1 1 69.5Harmon, Derrick 1 0 0.0 0 0 0 0 39.6Solomon, Freddie 1 0 0.0 0 0 0 0 39.649ERS 550 331 60.2 3,987 73 28 14 88.8OPPONENTS 621 346 55.7 3,965 82t 11 18 68.9
TEAM STATISTICS 49ers OppTOTAL FIRST DOWNS 340 293 By Rushing 137 89 By Passing 179 183 By Penalties 24 21TOTAL YARDS GAINED 5,920 5,191 By Rushing 2,232 1,683 By Passing 3,688 3,508TOTAL PLAYS FROM SCRIMMAGE 1,069 1,116 Rushes 477 435 Average Gain Per Rush 4.7 3.9NET YARDS PASSING 3,688 3,508 Passes Attempted 550 621 Passes Completed 331 346 Percent Completed 60.2 55.7 Had Intercepted 14 18 Times Sacked 42 60 Lost Attempting to Pass 299 457PUNTS 86 92 Total Yardage of Punts 3,422 3,644 Average Length 39.8 39.6KICKOFF RETURNS 58 72 Total Yards Returned 1,269 1,485 Average Length of Return 21.9 20.6PENALTIES 105 106 Yards Penalized 868 778FUMBLES 29 31 Own Fumbles Recovered 9 14 Opponents’ Fumbles Recovered 17 20FIELD GOALS 13 27 Field Goals Attempted 21 35TOTAL POINTS SCORED 411 263 Touchdowns Scored 53 26 Touchdowns Rushing 20 10 Touchdowns Passing 28 11 Touchdown Returns 5 5 Extra Points 52 24 Safeties 1 1AVG. TIME OF POSSESSION 28:45 31:15
SCORING TDs Ru Pa Int Fu KO Pu PAT FG S PtsWersching, Ray 0 0 0 0 0 0 0 52/53 13/21 0 91Craig, Roger 15 9 6 0 0 0 0 0/0 0/0 0 90Clark, Dwight 10 0 10 0 0 0 0 0/0 0/0 0 60Tyler, Wendell 8 6 2 0 0 0 0 0/0 0/0 0 48Rice, Jerry 4 1 3 0 0 0 0 0/0 0/0 0 24Francis, Russ 3 0 3 0 0 0 0 0/0 0/0 0 18Montana, Joe 3 3 0 0 0 0 0 0/0 0/0 0 18Wilson, Mike 2 0 2 0 0 0 0 0/0 0/0 0 12Frank, John 1 0 1 0 0 0 0 0/0 0/0 0 6McColl, Milt 1 0 0 0 1 0 0 0/0 0/0 0 6McIntyre, Guy 1 0 0 0 1 0 0 0/0 0/0 0 6
(continued)
Rookie Names in Italics

SAN FRANCISCO 49ERS
M E D I A G U I D E2 0 1 7 S E A S O N 467
1986 (10-5-1/10-6-1)NFC West Champions
Bill Walsh, CoachW 31 at Tampa Bay (50,780), S-7 7L 13 at Los Angeles Rams (65,195), S-14 16W 26 New Orleans (58,297), S-21 17W 31 at Miami (70,264), S-28 17W 35 Indianapolis (57,252), O-5 14L 24 Minnesota (58,637), O-12 (OT) 27T 10 at Atlanta (55,306), O-19 (OT) 10W 31 at G.B. in Milwaukee (50,557), O-26 17L 10 at New Orleans (52,234), N-2 23W 43 St. Louis (59,172), N-9 17L 6 at Washington (54,774), MON/N-17 14W 20 Atlanta (58,747), N-23 0L 17 New York Giants (59,777), MON/D-1 21W 24 New York Jets (58,091), D-7 10W 29 at New England (60,787), D-14 24W 24 Los Angeles Rams (60,266), FRI/D-19 14 374 247
NFC PLAYOFF - JAN. 4(at Meadowlands, N.J. - Giants Stadium)
L 3 New York Giants (76,034) 49
SCORING TDs Ru Pa Int Fu KO Pu PAT FG S PtsRathman, Tom 1 1 0 0 0 0 0 0/0 0/0 0 6Wilson, Mike 1 0 1 0 0 0 0 0/0 0/0 0 649ERS 43 16 21 5 0 0 1 41/42 25/35 0 374OPPONENTS* 27 8 18 0 0 1 1** 28/29 15/25 0 235*ret. blkd FGA **rcvrd blkd puntRUSHING Att Yds Avg LG TDCraig, Roger 204 830 4.1 25 7Cribbs, Joe 152 590 3.9 19 5Rathman, Tom 33 138 4.2 29t 1Tyler, Wendell 31 127 4.1 14 0Harmon, Derrick 27 77 2.9 15 1Rice, Jerry 10 72 7.2 18 1Kemp, Jeff 15 49 3.3 12 0Cherry, Tony 11 42 3.8 10 0Montana, Joe 17 38 2.2 17 0Moroski, Mike 6 22 3.7 12 1Ring, Bill 3 4 1.3 4 0Frank, John 1 -3 -3.0 -3 049ERS 510 1,986 3.9 29t 16OPPONENTS 406 1,555 3.8 36 8RECEIVING No Yds Avg LG TDRice, Jerry 86 1,570 18.3 66t 15Craig, Roger 81 624 7.7 48 0Clark, Dwight 61 794 13.0 45t 2Francis, Russ 41 505 12.3 52 1Cribbs, Joe 35 346 9.9 33 0Rathman, Tom 13 121 9.3 14 0Wilson, Mike 9 104 11.6 18 1Frank, John 9 61 6.8 17 2Harmon, Derrick 8 78 9.8 15 0Crawford, Derrick 5 70 14.0 42 0Margerum, Ken 2 12 6.0 6 0Monroe, Carl 2 6 3.0 5 0Ring, Bill 1 8 8.0 8 049ERS 353 4,299 12.2 66t 21OPPONENTS 324 3,773 11.7 84t 18INTERCEPTIONS No Yds Avg LG TDLott, Ronnie 10 134 13.4 57t 1McKyer, Tim 6 33 5.5 21t 1Fahnhorst, Jim 4 52 13.0 46 0Fuller, Jeff 4 44 11.0 26 0Holmoe, Tom 3 149 49.7 78t 2Williamson, Carlton 3 3 1.0 2 0Griffin, Don 3 0 0.0 0 0Nixon, Tory 2 106 53.0 88t 1Tuiasosopo, Manu 1 22 22.0 22 0Cousineau, Tom 1 18 18.0 18 0Turner, Keena 1 9 9.0 9 0Haley, Charles 1 8 8.0 8 049ERS 39 578 14.8 88t 5OPPONENTS 20 205 10.3 57 0KICKOFF RETURNS No Yds Avg LG TDCrawford, Derrick 15 280 18.7 34 0Monroe, Carl 8 139 17.4 25 0Griffin, Don 5 97 19.4 28 0Harmon, Derrick 4 82 20.5 28 0Rathman, Tom 3 66 22.0 22 0Cherry, Tony 2 29 14.5 17 0Frank, John 2 24 12.0 16 0McKyer, Tim 1 15 15.0 15 0Ring, Bill 1 15 15.0 15 0Wilson, Mike 1 10 10.0 10 049ERS 42 757 18.0 34 0OPPONENTS 71 1,598 22.5 101t 1PUNT RETURNS No FC Yds Avg LG TDGriffin, Don 38 18 377 9.9 76t 1Crawford, Derrick 4 0 15 3.8 9 0McKyer, Tim 1 1 5 5.0 5 049ERS 43 19 397 9.2 76t 1OPPONENTS 49 12 373 7.6 39 1PUNTING No Yds Avg TB I-20 LG BlkRunager, Max 83 3,450 41.6 8 23 62 249ERS 85 3,450 40.6 8 23 62 2OPPONENTS 91 3,765 41.4 9 20 73 0PASSING Att Comp Pct Yds LG TD Int QBMontana, Joe 307 191 62.2 2,236 48 8 9 80.7Kemp, Jeff 200 119 59.5 1,554 66t 11 8 85.7Moroski, Mike 73 42 57.5 493 52t 2 3 70.2Rice, Jerry 2 1 50.0 16 16t 0 0 77.149ERS 582 353 60.7 4,299 66t 21 20 81.1OPPONENTS 604 324 53.6 3,773 84t 18 39 55.8
TEAM STATISTICS 49ers OppTOTAL FIRST DOWNS 346 285 By Rushing 114 97 By Passing 213 169 By Penalties 19 19TOTAL YARDS GAINED 6,082 4,880 By Rushing 1,986 1,555 By Passing 4,096 3,325TOTAL PLAYS FROM SCRIMMAGE 1,118 1,061 Rushes 510 406 Average Gain Per Rush 3.9 3.8NET YARDS PASSING 4,096 3,325 Passes Attempted 582 604 Passes Completed 353 324 Percent Completed 60.7 53.6 Had Intercepted 20 39 Times Sacked 26 51 Lost Attempting to Pass 203 448PUNTS 85 91 Total Yardage of Punts 3,450 3,765 Average Length 40.6 41.4KICKOFF RETURNS 42 71 Total Yards Returned 757 1,598 Average Length of Return 18.0 22.5PENALTIES 95 89 Yards Penalized 691 653FUMBLES 32 31 Own Fumbles Recovered 23 21 Opponents’ Fumbles Recovered 10 9FIELD GOALS 25 15 Field Goals Attempted 35 25TOTAL POINTS SCORED 374 235 Touchdowns Scored 43 29 Touchdowns Rushing 16 8 Touchdowns Passing 21 18 Touchdown Returns 6 1 Extra Points 41 28 Safeties 0 0AVG. TIME OF POSSESSION 30:28 29:32SCORING TDs Ru Pa Int Fu KO Pu PAT FG S PtsWersching, Ray 0 0 0 0 0 0 0 41/42 25/35 0 116Rice, Jerry 16 1 15 0 0 0 0 0/0 0/0 0 96Craig, Roger 7 7 0 0 0 0 0 0/0 0/0 0 42Cribbs, Joe 5 5 0 0 0 0 0 0/0 0/0 0 30Clark, Dwight 2 0 2 0 0 0 0 0/0 0/0 0 12Frank, John 2 0 2 0 0 0 0 0/0 0/0 0 12Holmoe, Tom 2 0 0 2 0 0 0 0/0 0/0 0 12Francis, Russ 1 0 1 0 0 0 0 0/0 0/0 0 6Griffin, Don 1 0 0 0 0 0 1 0/0 0/0 0 6Harmon, Derrick 1 1 0 0 0 0 0 0/0 0/0 0 6Lott, Ronnie 1 0 0 1 0 0 0 0/0 0/0 0 6McKyer, Tim 1 0 0 1 0 0 0 0/0 0/0 0 6Moroski, Mike 1 1 0 0 0 0 0 0/0 0/0 0 6Nixon, Tory 1 0 0 1 0 0 0 0/0 0/0 0 6
(continued)
Rookie Names in Italics

SAN FRANCISCO 49ERS
M E D I A G U I D E2 0 1 7 S E A S O N 468
1987 (13-2/13-3)NFC West Champions
Bill Walsh, CoachL 17 at Pittsburgh (55,735), S-13 30W 27 at Cincinnati (53,498), S-20 26 *Philadelphia, S-27W 41 at New York Giants (16,471), MON/O-5 21W 25 at Atlanta (8,684), O-11 17W 34 St. Louis (38,094), O-18 28W 24 at New Orleans (60,497), O-25 22W 31 at Los Angeles Rams (55,328), N-1 10W 27 Houston (59,740), N-8 20L 24 New Orleans (60,436), N-15 26W 24 at Tampa Bay (63,211), N-22 10W 38 Cleveland (60,243), SUN/N-29 24W 23 at Green Bay (51,118), D-6 12W 41 Chicago (63,509), MON/D-14 0W 35 Atlanta (54,698), D-20 7W 48 Los Angeles Rams (57,953), SUN/D-27 0 459 253
NFC PLAYOFF -JAN. 9(at San Francisco - Candlestick Park)
L 24 Minnesota (62,547)-SAT 36* Game canceled due to NFL players’ strike.
RUSHING Att Yds Avg LG TDCraig, Roger 215 815 3.8 25 3Cribbs, Joe 70 300 4.3 20 1Rathman, Tom 62 257 4.2 35 1Young, Steve 26 190 7.3 29t 1Montana, Joe 35 141 4.0 20 1Sydney, Harry 29 125 4.3 15 0Varajon, Mike 18 82 4.6 11 0Cherry, Tony 13 65 5.0 16 1Rice, Jerry 8 51 6.4 17 1Hardy, Andre 7 48 6.9 14 0Rodgers, Del 11 46 4.2 15 1Stevens, Mark 10 45 4.5 16 1DuBose, Doug 10 33 3.3 11 0Monroe, Carl 2 26 13.0 17 0Flagler, Terrence 6 11 1.8 5 0Frank, John 1 2 2.0 2 0Blount, Ed 1 0 0.0 0 049ERS 524 2,237 4.3 35 11OPPONENTS 429 1,611 3.8 57 8RECEIVING No Yds Avg LG TDCraig, Roger 66 492 7.5 35t 1Rice, Jerry 65 1,078 16.6 57t 22Rathman, Tom 30 329 11.0 29 3Wilson, Mike 29 450 15.5 46t 5Frank, John 26 296 11.4 27 3Clark, Dwight 24 290 12.1 40t 5Francis, Russ 22 202 9.2 19 0Heller, Ron 12 165 13.8 39t 3Taylor, John 9 151 16.8 34 0Cribbs, Joe 9 70 7.8 16 0Greer, Terry 6 111 18.5 50 1Gladney, Tony 4 60 15.0 19 0DuBose, Doug 4 37 9.3 14 0Monroe, Carl 3 66 22.0 39t 1Varajon, Mike 3 25 8.3 12 0Rodgers, Del 2 45 22.5 24 0Jones, Brent 2 35 17.5 22 0Flagler, Terrence 2 28 14.0 24 0Dressel, Chris 1 8 8.0 8 0Hardy, Andre 1 7 7.0 7 0Margerum, Ken 1 7 7.0 7 0Sydney, Harry 1 3 3.0 3 049ERS 322 3,955 12.3 57t 44OPPONENTS 224 2,771 12.4 63t 13INTERCEPTIONS No Yds Avg LG TDLott, Ronnie 5 62 12.4 34 0Griffin, Don 5 1 0.2 1 0McLemore, Dana 2 35 17.5 25 0McKyer, Tim 2 0 0.0 0 0Courtney, Matt 1 30 30.0 30 0Williamson, Carlton 1 17 17.0 17 0Walter, Mike 1 16 16.0 16 0Turner, Keena 1 15 15.0 15 0Martin, Derrick 1 12 12.0 12 0Cousineau, Tom 1 11 11.0 11 0Nixon, Tory 1 5 5.0 5 0Shell, Todd 1 1 1.0 1 0Fahnhorst, Jim 1 0 0.0 0 0Holmoe, Tom 1 0 0.0 0 0McColl, Milt 1 0 0.0 0 049ERS 25 205 8.2 34 0OPPONENTS 14 258 18.4 38 0KICKOFF RETURNS No Yds Avg LG TDRodgers, Del 17 358 21.1 50 0Cribbs, Joe 13 327 25.2 92t 1Sydney, Harry 12 243 20.3 30 0Monroe, Carl 5 91 18.2 24 0Flagler, Terrence 3 31 10.3 16 0Rathman, Tom 2 37 18.5 21 0McLemore,Dana 1 23 23.0 23 0Henley, Thomas 1 21 21.0 21 0Varajon, Mike 1 13 13.0 13 049ERS 55 1,144 20.8 92t 1OPPONENTS 76 1,598 21.0 97t 1PUNT RETURNS No FC Yds Avg LG TDMcLemore, Dana 21 7 265 12.6 83t 1Griffin, Don 9 2 79 8.8 29 0Martin, Derrick 2 0 12 6.0 9 0Pollard, Darryl 1 0 0 0.0 0 0Taylor, John 1 0 9 9.0 9 049ERS 34 9 365 10.7 83t 1OPPONENTS 29 10 195 6.7 26 1PUNTING No Yds Avg TB I-20 LG BlkRunager, Max 55 2,157 39.2 7 13 56 1Asmus, Jim 12 384 32.0 1 3 51 049ERS 67 2,541 37.4 8 16 56 1OPPONENTS 72 2,850 39.6 6 13 68 1PASSING Att Comp Pct Yds LG TD Int QBMontana, Joe 398 266 66.8 3,054 57t 31 13 102.1Young, Steve 69 37 53.6 570 50t 10 0 120.8Gagliano, Bob 29 16 55.2 229 50 1 1 78.1Stevens, Mark 4 2 50.0 52 39t 1 0 135.4Sydney, Harry 1 1 100.0 50 50t 1 0 158.349ERS 501 322 64.3 3,955 57t 44 14 106.2OPPONENTS 467 224 48.0 2,771 63t 13 25 53.8
TEAM STATISTICS 49ers OppTOTAL FIRST DOWNS 357 250 By Rushing 134 95 By Passing 202 132 By Penalties 21 23TOTAL YARDS GAINED 5,987 4,095 By Rushing 2,237 1,611 By Passing 3,750 2,484TOTAL PLAYS FROM SCRIMMAGE 1,054 933 Rushes 524 429 Average Gain Per Rush 4.3 3.8NET YARDS PASSING 3,750 2,484 Passes Attempted 501 467 Passes Completed 322 224 Percent Completed 64.3 48.0 Had Intercepted 14 25 Times Sacked 29 37 Lost Attempting to Pass 205 287PUNTS 68 72 Total Yardage of Punts 2,541 2,850 Average Length 37.4 39.6KICKOFF RETURNS 55 76 Total Yards Returned 1,144 1,598 Average Length of Return 20.8 21.0PENALTIES 88 80 Yards Penalized 792 660FUMBLES 25 30 Own Fumbles Recovered 13 17 Opponents’ Fumbles Recovered 13 12FIELD GOALS 16 24 Field Goals Attempted 23 35TOTAL POINTS SCORED 459 253 Touchdowns Scored 59 26 Touchdowns Rushing 11 8 Touchdowns Passing 44 13 Touchdown Returns 4 5 Extra Points 55 25 Safeties 1 0AVG. TIME OF POSSESSION 31:43 28:17SCORING TDs Ru Pa Int Fu KO Pu PAT FG S PtsRice, Jerry 23 1 22 0 0 0 0 0/0 0/0 0 138Wersching, Ray 0 0 0 0 0 0 0 44/46 13/17 0 83Clark, Dwight 5 0 5 0 0 0 0 0/0 0/0 0 30Wilson, Mike 5 0 5 0 0 0 0 0/0 0/0 0 30Craig, Roger 4 3 1 0 0 0 0 0/0 0/0 0 24Rathman, Tom 4 1 3 0 0 0 0 0/0 0/0 0 24Brockhaus, Jeff 0 0 0 0 0 0 0 11/13 3/6 0 20Frank, John 3 0 3 0 0 0 0 0/0 0/0 0 18Heller, Ron 3 0 3 0 0 0 0 0/0 0/0 0 18Cribbs, Joe 2 1 0 0 0 1 0 0/0 0/0 0 12Cherry, Tony 1 1 0 0 0 0 0 0/0 0/0 0 6Greer, Terry 1 0 1 0 0 0 0 0/0 0/0 0 6McLemore, Dana 1 0 0 0 0 0 1 0/0 0/0 0 6Monroe, Carl 1 0 1 0 0 0 0 0/0 0/0 0 6Montana, Joe 1 1 0 0 0 0 0 0/0 0/0 0 6Rodgers, Del 1 1 0 0 0 0 0 0/0 0/0 0 6Stevens, Mark 1 1 0 0 0 0 0 0/0 0/0 0 6Taylor, John 1 0 0 0 1 0 0 0/0 0/0 0 6Wells, Mike 1 0 0 0 0 0 1* 0/0 0/0 0 6Young, Steve 1 1 0 0 0 0 0 0/0 0/0 0 6Fuller, Jeff 0 0 0 0 0 0 0 0/0 0/0 1 249ERS 59 11 44 0 1 1 2 55/59 16/23 1 459OPPONENTS** 26 8 13 0 3 0 1* 25/26 24/35 0 253*returned blocked punt **recovered blocked punt
Rookie Names in Italics
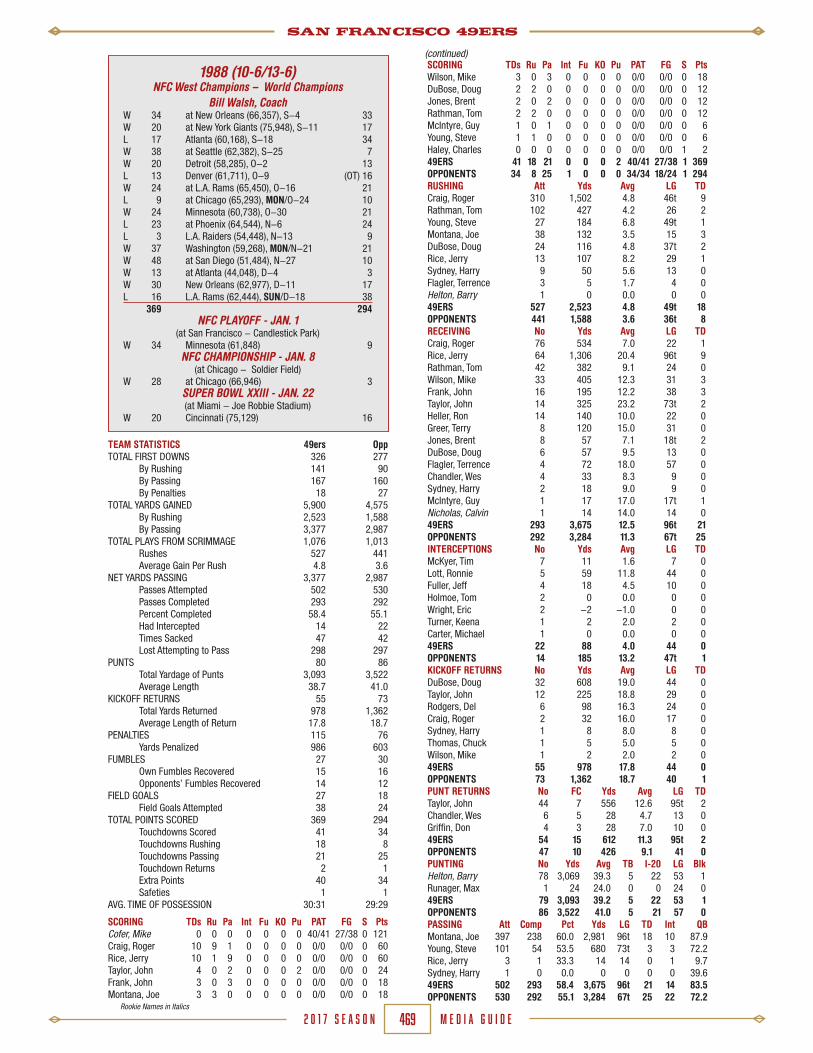
SAN FRANCISCO 49ERS
M E D I A G U I D E2 0 1 7 S E A S O N 469
1988 (10-6/13-6)NFC West Champions – World Champions
Bill Walsh, CoachW 34 at New Orleans (66,357), S-4 33W 20 at New York Giants (75,948), S-11 17L 17 Atlanta (60,168), S-18 34W 38 at Seattle (62,382), S-25 7W 20 Detroit (58,285), O-2 13L 13 Denver (61,711), O-9 (OT) 16W 24 at L.A. Rams (65,450), O-16 21L 9 at Chicago (65,293), MON/O-24 10W 24 Minnesota (60,738), O-30 21L 23 at Phoenix (64,544), N-6 24L 3 L.A. Raiders (54,448), N-13 9W 37 Washington (59,268), M0N/N-21 21W 48 at San Diego (51,484), N-27 10W 13 at Atlanta (44,048), D-4 3W 30 New Orleans (62,977), D-11 17L 16 L.A. Rams (62,444), SUN/D-18 38 369 294
NFC PLAYOFF - JAN. 1(at San Francisco - Candlestick Park)
W 34 Minnesota (61,848) 9NFC CHAMPIONSHIP - JAN. 8
(at Chicago - Soldier Field)W 28 at Chicago (66,946) 3
SUPER BOWL XXIII - JAN. 22(at Miami - Joe Robbie Stadium)
W 20 Cincinnati (75,129) 16
SCORING TDs Ru Pa Int Fu KO Pu PAT FG S PtsWilson, Mike 3 0 3 0 0 0 0 0/0 0/0 0 18DuBose, Doug 2 2 0 0 0 0 0 0/0 0/0 0 12Jones, Brent 2 0 2 0 0 0 0 0/0 0/0 0 12Rathman, Tom 2 2 0 0 0 0 0 0/0 0/0 0 12McIntyre, Guy 1 0 1 0 0 0 0 0/0 0/0 0 6Young, Steve 1 1 0 0 0 0 0 0/0 0/0 0 6Haley, Charles 0 0 0 0 0 0 0 0/0 0/0 1 249ERS 41 18 21 0 0 0 2 40/41 27/38 1 369OPPONENTS 34 8 25 1 0 0 0 34/34 18/24 1 294RUSHING Att Yds Avg LG TDCraig, Roger 310 1,502 4.8 46t 9Rathman, Tom 102 427 4.2 26 2Young, Steve 27 184 6.8 49t 1Montana, Joe 38 132 3.5 15 3DuBose, Doug 24 116 4.8 37t 2Rice, Jerry 13 107 8.2 29 1Sydney, Harry 9 50 5.6 13 0Flagler, Terrence 3 5 1.7 4 0Helton, Barry 1 0 0.0 0 049ERS 527 2,523 4.8 49t 18OPPONENTS 441 1,588 3.6 36t 8RECEIVING No Yds Avg LG TDCraig, Roger 76 534 7.0 22 1Rice, Jerry 64 1,306 20.4 96t 9Rathman, Tom 42 382 9.1 24 0Wilson, Mike 33 405 12.3 31 3Frank, John 16 195 12.2 38 3Taylor, John 14 325 23.2 73t 2Heller, Ron 14 140 10.0 22 0Greer, Terry 8 120 15.0 31 0Jones, Brent 8 57 7.1 18t 2DuBose, Doug 6 57 9.5 13 0Flagler, Terrence 4 72 18.0 57 0Chandler, Wes 4 33 8.3 9 0Sydney, Harry 2 18 9.0 9 0McIntyre, Guy 1 17 17.0 17t 1Nicholas, Calvin 1 14 14.0 14 049ERS 293 3,675 12.5 96t 21OPPONENTS 292 3,284 11.3 67t 25INTERCEPTIONS No Yds Avg LG TDMcKyer, Tim 7 11 1.6 7 0Lott, Ronnie 5 59 11.8 44 0Fuller, Jeff 4 18 4.5 10 0Holmoe, Tom 2 0 0.0 0 0Wright, Eric 2 -2 -1.0 0 0Turner, Keena 1 2 2.0 2 0Carter, Michael 1 0 0.0 0 049ERS 22 88 4.0 44 0OPPONENTS 14 185 13.2 47t 1KICKOFF RETURNS No Yds Avg LG TDDuBose, Doug 32 608 19.0 44 0Taylor, John 12 225 18.8 29 0Rodgers, Del 6 98 16.3 24 0Craig, Roger 2 32 16.0 17 0Sydney, Harry 1 8 8.0 8 0Thomas, Chuck 1 5 5.0 5 0Wilson, Mike 1 2 2.0 2 049ERS 55 978 17.8 44 0OPPONENTS 73 1,362 18.7 40 1PUNT RETURNS No FC Yds Avg LG TDTaylor, John 44 7 556 12.6 95t 2Chandler, Wes 6 5 28 4.7 13 0Griffin, Don 4 3 28 7.0 10 049ERS 54 15 612 11.3 95t 2OPPONENTS 47 10 426 9.1 41 0PUNTING No Yds Avg TB I-20 LG BlkHelton, Barry 78 3,069 39.3 5 22 53 1Runager, Max 1 24 24.0 0 0 24 049ERS 79 3,093 39.2 5 22 53 1OPPONENTS 86 3,522 41.0 5 21 57 0PASSING Att Comp Pct Yds LG TD Int QBMontana, Joe 397 238 60.0 2,981 96t 18 10 87.9Young, Steve 101 54 53.5 680 73t 3 3 72.2Rice, Jerry 3 1 33.3 14 14 0 1 9.7Sydney, Harry 1 0 0.0 0 0 0 0 39.649ERS 502 293 58.4 3,675 96t 21 14 83.5OPPONENTS 530 292 55.1 3,284 67t 25 22 72.2
TEAM STATISTICS 49ers OppTOTAL FIRST DOWNS 326 277 By Rushing 141 90 By Passing 167 160 By Penalties 18 27TOTAL YARDS GAINED 5,900 4,575 By Rushing 2,523 1,588 By Passing 3,377 2,987TOTAL PLAYS FROM SCRIMMAGE 1,076 1,013 Rushes 527 441 Average Gain Per Rush 4.8 3.6NET YARDS PASSING 3,377 2,987 Passes Attempted 502 530 Passes Completed 293 292 Percent Completed 58.4 55.1 Had Intercepted 14 22 Times Sacked 47 42 Lost Attempting to Pass 298 297PUNTS 80 86 Total Yardage of Punts 3,093 3,522 Average Length 38.7 41.0KICKOFF RETURNS 55 73 Total Yards Returned 978 1,362 Average Length of Return 17.8 18.7PENALTIES 115 76 Yards Penalized 986 603FUMBLES 27 30 Own Fumbles Recovered 15 16 Opponents’ Fumbles Recovered 14 12FIELD GOALS 27 18 Field Goals Attempted 38 24TOTAL POINTS SCORED 369 294 Touchdowns Scored 41 34 Touchdowns Rushing 18 8 Touchdowns Passing 21 25 Touchdown Returns 2 1 Extra Points 40 34 Safeties 1 1AVG. TIME OF POSSESSION 30:31 29:29
SCORING TDs Ru Pa Int Fu KO Pu PAT FG S PtsCofer, Mike 0 0 0 0 0 0 0 40/41 27/38 0 121Craig, Roger 10 9 1 0 0 0 0 0/0 0/0 0 60Rice, Jerry 10 1 9 0 0 0 0 0/0 0/0 0 60Taylor, John 4 0 2 0 0 0 2 0/0 0/0 0 24Frank, John 3 0 3 0 0 0 0 0/0 0/0 0 18Montana, Joe 3 3 0 0 0 0 0 0/0 0/0 0 18
(continued)
Rookie Names in Italics

SAN FRANCISCO 49ERS
M E D I A G U I D E2 0 1 7 S E A S O N 470
1989 (14-2/17-2)NFC West Champions – World Champions
George Seifert, CoachW 30 at Indianapolis (60,111), S-10 24W 20 at Tampa Bay (64,087), S-17 16W 38 at Philadelphia (66,042), S-24 28L 12 Los Angeles Rams (64,250), O-1 13W 24 at New Orleans (60,488), O-8 20W 31 at Dallas (61,077), O-15 14W 37 New England (70,000), O-22+ 20W 23 at New York Jets (62,805), O-29 10W 31 New Orleans (60,667), MON/N-6 13W 45 Atlanta (59,914), N-12 3L 17 Green Bay (62,219), N-19 21W 34 New York Giants (63,461), MON/N-27 24W 23 at Atlanta (43,128), D-3 10W 30 at Los Angeles Rams (67,959), MON/D-11 27W 21 Buffalo (60,927), D-17 10W 26 Chicago (60,207), D-24 0 442 253
NFC PLAYOFF - JAN. 6(at San Francisco - Candlestick Park)
W 41 Minnesota (64,585)-SAT 13NFC CHAMPIONSHIP - JAN. 14
(at San Francisco - Candlestick Park)W 30 Los Angeles Rams (64,769) 3
SUPER BOWL XXIV - JAN. 28(at New Orleans - Louisiana Superdome)
W 55 Denver (72,919) 10+ Game played at Stanford Stadium due to Bay Area earthquake - October 17, 1989
SCORING TDs Ru Pa Int Fu KO Pu PAT FG S PtsYoung, Steve 2 2 0 0 0 0 0 0/0 0/0 0 12Flagler, Terrence 1 1 0 0 0 0 0 0/0 0/0 0 6Haley, Charles 1 0 0 0 1 0 0 0/0 0/0 0 6Henderson, Keith 1 1 0 0 0 0 0 0/0 0/0 0 6Jackson, Johnny* 1 0 0 0 0 0 0 0/0 0/0 0 6Walls, Wesley 1 0 1 0 0 0 0 0/0 0/0 0 6Wilson, Mike 1 0 1 0 0 0 0 0/0 0/0 0 649ERS 51 14 35 0 1 0 0 49/51 29/36 0 442OPPONENTS 26 9 15 0 1 0 1** 26/26 23/31 1 253*ret blkd FGA **rcvrd blkd punt
RUSHING Att Yds Avg LG TDCraig, Roger 271 1,054 3.9 27 6Rathman, Tom 79 305 3.9 13 1Montana, Joe 49 227 4.6 19 3Flagler, Terrence 33 129 3.9 29t 1Young, Steve 38 126 3.3 22 2Sydney, Harry 9 56 6.2 18 0Rice, Jerry 5 33 6.6 17 0Henderson, Keith 7 30 4.3 11t 1Taylor, John 1 6 6.0 6 0Helton, Barry 1 0 0.0 0 049ERS 493 1,966 4.0 29t 14OPPONENTS 372 1,383 3.7 23 9
RECEIVING No Yds Avg LG TDRice, Jerry 82 1,483 18.1 68t 17Rathman, Tom 73 616 8.4 36 1Taylor, John 60 1,077 18.0 95t 10Craig, Roger 49 473 9.7 44 1Jones, Brent 40 500 12.5 36t 4Wilson, Mike 9 103 11.4 19 1Sydney, Harry 9 71 7.9 13 0Flagler, Terrence 6 51 8.5 30 0Walls, Wesley 4 16 4.0 9 1Henderson, Keith 3 130 43.3 78 0Williams, Jamie 3 38 12.7 17 0Greer, Terry 1 26 26.0 26 049ERS 339 4,584 13.5 95t 35OPPONENTS 316 3,568 11.3 65t 15
INTERCEPTIONS No Yds Avg LG TDLott, Ronnie 5 34 6.8 28 0Brooks, Chet 3 31 10.3 19 0Wright, Eric 2 37 18.5 23 0Jackson, Johnny 2 35 17.5 19 0Griffn, Don 2 6 3.0 3 0Turner, Keena 1 42 42.0 42 0Holmoe, Tom 1 23 23.0 23 0McKyer, Tim 1 18 18.0 18 0Romanowski, Bill 1 13 13.0 13 0Pollard, Darryl 1 12 12.0 12 0Millen, Matt 1 10 10.0 10 0DeLong, Keith 1 1 1.0 1 049ERS 21 262 12.5 42 0OPPONENTS 11 140 12.7 35 0
KICKOFF RETURNS No Yds Avg LG TDFlagler, Terrence 32 643 20.1 41 0Tillman, Spencer 10 206 20.6 60 0Sydney, Harry 3 16 5.3 16 0Taylor, John 2 51 25.5 27 0Henderson, Keith 2 21 10.5 13 0Greer, Terry 1 17 17.0 17 0Jackson, Johnny 1 0 0.0 0 049ERS 51 954 18.7 60 0OPPONENTS 76 1,435 18.9 37 0PUNT RETURNS No FC Yds Avg LG TDTaylor, John 36 20 417 11.6 37 0Greer, Terry 1 0 3 3.0 3 0Griffin, Don 1 0 9 9.0 9 0Romanowski, Bill 1 0 0 0.0 0 049ERS 39 20 429 11.0 37 0OPPONENTS 35 4 361 10.3 22 0PUNTING No Yds Avg TB I-20 LG BlkHelton, Barry 55 2,226 40.5 6 13 56 149ERS 55 2,226 39.8 6 13 56 1OPPONENTS 74 2,875 38.9 4 18 57 0
PASSING Att Comp Pct Yds LG TD Int QBMontana, Joe 386 271 70.2 3,521 95t 26 8 112.4Young, Steve 92 64 69.6 1,001 50t 8 3 120.8Bono, Steve 5 4 80.0 62 45t 1 0 157.949ERS 483 339 70.2 4,584 95t 35 11 114.8OPPONENTS 564 316 56.0 3,568 65t 15 21 68.5
TEAM STATISTICS 49ers OppTOTAL FIRST DOWNS 350 283 By Rushing 124 76 By Passing 209 178 By Penalties 17 29TOTAL YARDS GAINED 6,268 4,618 By Rushing 1,966 1,383 By Passing 4,302 3,235TOTAL PLAYS FROM SCRIMMAGE 1,021 979 Rushes 493 372 Average Gain Per Rush 4.0 3.7NET YARDS PASSING 4,302 3,235 Passes Attempted 483 564 Passes Completed 339 316 Percent Completed 70.2 56.0 Had Intercepted 11 21 Times Sacked 45 43 Lost Attempting to Pass 282 333PUNTS 55 74 Total Yardage of Punts 2,226 2,875 Average Length 40.5 38.9KICKOFF RETURNS 51 76 Total Yards Returned 954 1,435 Average Length of Return 18.7 18.9PENALTIES 109 75 Yards Penalized 922 581FUMBLES 32 34 Own Fumbles Recovered 18 18 Opponents’ Fumbles Recovered 16 14FIELD GOALS 29 23 Field Goals Attempted 36 31TOTAL POINTS SCORED 442 253 Touchdowns Scored 51 26 Touchdowns Rushing 14 9 Touchdowns Passing 35 15 Touchdown Returns 2 2 Extra Points 49 26 Safeties 0 1AVG. TIME OF POSSESSION 31:45 28:15SCORING TDs Ru Pa Int Fu KO Pu PAT FG S PtsCofer, Mike 0 0 0 0 0 0 0 49/51 29/36 0 136Rice, Jerry 17 0 17 0 0 0 0 0/0 0/0 0 102Taylor, John 10 0 10 0 0 0 0 0/0 0/0 0 60Craig, Roger 7 6 1 0 0 0 0 0/0 0/0 0 42Jones, Brent 4 0 4 0 0 0 0 0/0 0/0 0 24Montana, Joe 3 3 0 0 0 0 0 0/0 0/0 0 18Rathman, Tom 2 1 1 0 0 0 0 0/0 0/0 0 12
(continued)
Rookie Names in Italics

SAN FRANCISCO 49ERS
M E D I A G U I D E2 0 1 7 S E A S O N 471
1990 (14-2/15-3)NFC West ChampionsGeorge Seifert, Coach
W 13 at New Orleans (68,629), MON/S-10 12W 26 Washington (64,287), S-16 13W 19 Atlanta (62,858), S-23 13- - BYE, S-30 -W 24 at Houston (59,931), O-7 21W 45 at Atlanta (57,921), O-14 35W 27 Pittsburgh (64,301), O-21 7W 20 Cleveland (63,672), O-28 17W 24 at Green Bay (58,835), N-4 20W 24 at Dallas (62,966), SUN/N-11 6W 31 Tampa Bay (62,221), N-18 7L 17 Los Angeles Rams (62,633), N-25 28W 7 New York Giants (66,092), MON/D-3 3W 20 at Cincinnati (60,084), D-9 (OT) 17W 26 at Los Angeles Rams (65,619), MON/D-17 10L 10 New Orleans (60,112), D-23 13W 20 at Minnesota (51,590), D-30 17 353 239
NFC PLAYOFF - JAN. 12(at San Francisco - Candlestick Park)
W 28 Washington (65,292)-SAT 10
NFC CHAMPIONSHIP - JAN. 20(at San Francisco - Candlestick Park)
L 13 New York Giants (66,334) 15
SCORING TDs Ru Pa Int Fu KO Pu PAT FG S PtsSydney, Harry 3 2 1 0 0 0 0 0/0 0/0 0 18Sherrard, Mike 2 0 2 0 0 0 0 0/0 0/0 0 12Craig, Roger 1 1 0 0 0 0 0 0/0 0/0 0 6Carter, Dexter 1 1 0 0 0 0 0 0/0 0/0 0 6Montana, Joe 1 1 0 0 0 0 0 0/0 0/0 0 6Turner, Keena 0 0 0 0 0 0 0 0/0 0/0 1 249ERS 40 12 28 0 0 0 0 39/39 24/36 1 353OPPONENTS 26 7 17 1 0 0 1* 26/26 19/23 0 239*ret. blkd punt
RUSHING Att Yds Avg LG TDCarter, Dexter 114 460 4.0 74t 1Craig, Roger 141 439 3.1 26 1Rathman, Tom 101 318 3.2 22 7Sydney, Harry 35 166 4.7 19 2Montana, Joe 40 162 4.1 20 1Young, Steve 15 159 10.6 31 0Henderson, Keith 6 14 2.3 9 0Rice, Jerry 2 0 0.0 2 049ERS 454 1,718 3.8 74t 12OPPONENTS 353 1,258 3.6 27 7
RECEIVING No Yds Avg LG TDRice, Jerry 100 1,502 15.0 64t 13Jones, Brent 56 747 13.3 67t 5Taylor, John 49 748 15.3 78t 7Rathman, Tom 48 327 6.8 28 0Carter, Dexter 25 217 8.7 26 0Craig, Roger 25 201 8.0 31 0Sherrard, Mike 17 264 15.5 43t 2Sydney, Harry 10 116 11.6 23t 1Williams, Jamie 9 54 6.0 9 0Wilson, Mike 7 89 12.7 34 0Lewis, Ron 5 44 8.8 14 0Walls, Wesley 5 27 5.4 11 0Henderson, Keith 4 35 8.7 9 049ERS 360 4,371 12.1 78t 28OPPONENTS 265 3,278 12.4 75t 17
INTERCEPTIONS No Yds Avg LG TDWaymer, Dave 7 64 9.1 24 0Griffin, Don 3 32 10.7 23 0Lott, Ronnie 3 26 8.7 15 0Lewis, Kevin 1 28 28.0 28 0Plummer, Bruce (Den/SF) 1 16 16.0 16 0Davis, Eric 1 13 13.0 13 0Millen, Matt 1 8 8.0 8 0Pollard, Darryl 1 0 0.0 0 049ERS 17 171 10.1 28 0OPPONENTS 16 176 11.0 65t 1
KICKOFF RETURNS No Yds Avg LG TDCarter, Dexter 41 783 19.1 35 0Tillman, Spencer 6 111 18.5 30 0Sydney, Harry 2 33 16.5 19 0Williams, Jamie 2 7 3.5 7 0Walls, Wesley 1 16 16.0 16 0Griffin, Don 1 15 15.0 15 049ERS 53 965 18.2 35 0OPPONENTS 66 1,284 19.5 50 0
PUNT RETURNS No FC Yds Avg LG TDTaylor, John 26 5 212 8.2 30 0Griffin, Don 16 8 105 6.6 20 0Davis, Eric 5 3 38 7.6 24 0Wilson, Mike 1 0 1 1.0 1 049ERS 48 16 356 7.4 30 0OPPONENTS 30 13 215 7.2 20 0
PUNTING No Yds Avg TB I-20 LG BlkHelton, Barry 69 2,537 36.8 8 15 56 149ERS 70 2,537 36.2 8 15 56 1OPPONENTS 82 3,280 40.0 6 15 59 0
PASSING Att Comp Pct Yds LG TD Int QBMontana, Joe 520 321 61.7 3,944 78t 26 16 89.0Young, Steve 62 38 61.3 427 34t 2 0 92.6Helton, Barry 1 1 100.0 0 0 0 0 79.249ERS 583 360 61.8 4,371 78t 28 16 89.4OPPONENTS 522 265 50.8 3,278 75t 17 17 67.8
TEAM STATISTICS 49ers OppTOTAL FIRST DOWNS 324 250 By Rushing 107 77 By Passing 201 157 By Penalties 16 16TOTAL YARDS GAINED 5,895 4,273 By Rushing 1,718 1,258 By Passing 4,177 3,015TOTAL PLAYS FROM SCRIMMAGE 1,074 919 Rushes 454 353 Average Gain Per Rush 3.8 3.6NET YARDS PASSING 4,177 3,015 Passes Attempted 583 522 Passes Completed 360 265 Percent Completed 61.8 50.8 Had Intercepted 16 17 Times Sacked 37 44 Lost Attempting to Pass 194 263PUNTS 70 82 Total Yardage of Punts 2,537 3,280 Average Length 36.2 40.0KICKOFF RETURNS 53 66 Total Yards Returned 965 1,284 Average Length of Return 18.2 19.5PENALTIES 104 85 Yards Penalized 828 641FUMBLES 24 21 Own Fumbles Recovered 10 7 Opponents’ Fumbles Recovered 14 14FIELD GOALS 24 19 Field Goals Attempted 36 23TOTAL POINTS SCORED 353 239 Touchdowns Scored 40 26 Touchdowns Rushing 12 7 Touchdowns Passing 28 17 Touchdown Returns 0 2 Extra Points 39 26 Safeties 1 0AVG. TIME OF POSSESSION 32:49 27:11
SCORING TDs Ru Pa Int Fu KO Pu PAT FG S PtsCofer, Mike 0 0 0 0 0 0 0 39/39 24/36 0 111Rice, Jerry 13 0 13 0 0 0 0 0/0 0/0 0 78Rathman, Tom 7 7 0 0 0 0 0 0/0 0/0 0 42Taylor, John 7 0 7 0 0 0 0 0/0 0/0 0 42Jones, Brent 5 0 5 0 0 0 0 0/0 0/0 0 30
(continued)
Rookie Names in Italics

SAN FRANCISCO 49ERS
M E D I A G U I D E2 0 1 7 S E A S O N 472
1991 (10-6)George Seifert, Coach
L 14 at New York Giants (76,319), MON/S-2 16W 34 San Diego (60,753), S-8 14L 14 at Minnesota (59,148), S-15 17W 27 Los Angeles Rams (63,871), S-22 10L 6 at Los Angeles Raiders (91,494), S-29 12- - BYE, O-6 -L 34 Atlanta (57,343), O-13 39W 35 Detroit (61,240), O-20 3W 23 at Philadelphia (65,796), 0-27 7L 14 at Atlanta (51,259), N-3 17L 3 at New Orleans (68,591), N-10 10W 14 Phoenix (50,180), N-17 10W 33 at Los Angeles Rams (61,881), MON/N-25 10W 38 New Orleans (62,092), D-1 24W 24 at Seattle (56,711), D-8 22W 28 Kansas City (62,672), SAT/D-14 14W 52 Chicago (60,419), MON/D-23 14 393 239
RUSHING Att Yds Avg LG TDHenderson, Keith 137 561 4.1 25 2Young, Steve 66 415 6.3 21 4Carter, Dexter 85 379 4.5 53t 2Sydney, Harry 57 245 4.3 32 5Rathman, Tom 63 183 2.9 16 6Bono, Steve 17 46 2.7 18 0Tillman, Spencer 13 40 3.1 8 0Rice, Jerry 1 2 2.0 2 0Prokop, Joe 1 -10 -10.0 -10 049ERS 440 1,861 4.2 53t 19OPPONENTS 399 1,512 3.8 37 8
RECEIVING No Yds Avg LG TDRice, Jerry 80 1,206 15.1 73t 14Taylor, John 64 1,011 15.8 97t 9Rathman, Tom 34 286 8.4 32 0Henderson, Keith 30 303 10.1 23 0Jones, Brent 27 417 15.4 41 0Sherrard, Mike 24 296 12.3 31 2Carter, Dexter 23 253 11.0 26 1Williams, Jamie 22 235 10.7 21 1Sydney, Harry 13 90 6.9 19 2Beach, Sanjay 4 43 10.8 20 0Walls, Wesley 2 24 12.0 21 0Tillman, Spencer 2 3 1.5 3 049ERS 325 4,167 12.8 97t 29OPPONENTS 267 3,254 12.2 51 16
INTERCEPTIONS No Yds Avg LG TDWaymer, Dave 4 77 19.3 42 0Lewis, Kevin 2 20 10.0 20 0Jackson, Johnny 1 11 11.0 11 0Romanowski, Bill 1 7 7.0 7 0Lee, Mark 1 5 5.0 5 0Whitmore, David 1 5 5.0 5 0Bowles, Todd 1 0 0.0 0 0Griffin, Don 1 0 0.0 0 049ERS 12 125 10.4 42 0OPPONENTS 12 82 6.8 37 0
KICKOFF RETURNS No Yds Avg LG TDCarter, Dexter 37 839 22.7 98t 1Tillman, Spencer 9 132 14.7 27 0Beach, Sanjay 2 37 18.5 23 0Sydney, Harry 1 13 13.0 13 0Whitmore, David 1 7 7.0 7 049ERS 50 1,028 20.6 98t 1OPPONENTS 66 1,288 19.5 100t 0
PUNT RETURNS No FC Yds Avg LG TDTaylor, John 31 14 267 8.6 24 0Bach, Sanjay 10 0 53 5.3 15 0Lewis, Kevin 1 0 0 0.0 0 0Griffin, Don 0 1 0 0.0 0 049ERS 42 15 320 7.6 24 0OPPONENTS 30 6 239 8.0 23 0
PUNTING No Yds Avg TB I-20 LG BlkProkop, Joe 40 1,541 38.5 1 8 58 0Mojsiejenko, Ralf 16 656 41.0 4 0 55 049ERS 56 2,197 39.2 5 8 58 0OPPONENTS 82 3,365 41.0 10 17 58 0
PASSING Att Comp Pct Yds LG TD Int QBYoung, Steve 279 180 64.5 2,517 97t 17 8 101.8Bono, Steve 237 141 59.5 1,617 78 11 4 88.5 Musgrave, Bill 5 4 80.0 33 15t 1 0 133.8Sydney, Harry 1 0 0.0 0 0 0 0 39.649ERS 522 325 62.3 4,167 97t 29 12 96.2OPPONENTS 499 267 53.5 3,254 51 16 12 74.5
TEAM STATISTICS 49ers OppTOTAL FIRST DOWNS 336 260 By Rushing 112 86 By Passing 197 155 By Penalties 27 19TOTAL YARDS GAINED 5,858 4,554 By Rushing 1,861 1,512 By Passing 3,997 3,042TOTAL PLAYS FROM SCRIMMAGE 986 929 Rushes 440 399 Average Gain Per Rush 4.2 3.8NET YARDS PASSING 3,997 3,042 Passes Attempted 522 499 Passes Completed 325 267 Percent Completed 62.3 53.5 Had Intercepted 12 12 Times Sacked 24 31 Lost Attempting to Pass 170 212PUNTS 56 82 Total Yardage of Punts 2,197 3,365 Average Length 39.2 41.0KICKOFF RETURNS 50 66 Total Yards Returned 1,028 1,288 Average Length of Return 20.6 19.5PENALTIES 114 84 Yards Penalized 902 782FUMBLES 33 32 Own Fumbles Recovered 14 16 Opponents’ Fumbles Recovered 16 19FIELD GOALS 14 22 Field Goals Attempted 28 25TOTAL POINTS SCORED 393 239 Touchdowns Scored 50 25 Touchdowns Rushing 19 8 Touchdowns Passing 29 16 Touchdown Returns 2 1 Extra Points 49 23 Safeties 1 0AVG. TIME OF POSSESSION 31:34 28:26
SCORING TDs Ru Pa Int Fu KO Pu PAT FG S PtsCofer, Mike 0 0 0 0 0 0 0 49/50 14/28 0 91Rice, Jerry 14 0 14 0 0 0 0 0/0 0/0 0 84Taylor, John 9 0 9 0 0 0 0 0/0 0/0 0 54Sydney, Harry 7 5 2 0 0 0 0 0/0 0/0 0 42Rathman, Tom 6 6 0 0 0 0 0 0/0 0/0 0 36Carter, Dexter 4 2 1 0 0 1 0 0/0 0/0 0 24Young, Steve 4 4 0 0 0 0 0 0/0 0/0 0 24Henderson, Keith 2 2 0 0 0 0 0 0/0 0/0 0 12Sherrard, Mike 2 0 2 0 0 0 0 0/0 0/0 0 12Griffin, Don 1 0 0 0 1 0 0 0/0 0/0 0 6Williams, Jamie 1 0 1 0 0 0 0 0/0 0/0 0 6Jordan, Darin 0 0 0 0 0 0 0 0/0 0/0 1 249ERS 50 19 29 0 1 1 0 49/50 14/28 1 393OPPONENTS 25 8 16 0 0 1 0 23/25 22/25 0 239
Rookie Names in Italics

SAN FRANCISCO 49ERS
M E D I A G U I D E2 0 1 7 S E A S O N 473
1992 (14-2/15-3)NFC West ChampionsGeorge Seifert, Coach
W 31 at New York Giants (74,519), S-6 14L 31 Buffalo (64,053), S-13 34W 31 at New York Jets (71,020), S-20 14W 16 at New Orleans (68,591), SUN/S-27 10W 27 Los Angeles Rams (63,071), O-4 24W 24 at New England (54,126), O-11 12W 56 Atlanta (63,302), O-18 17- - BYE, O-25 -L 14 at Phoenix (47,642), N-1 24W 41 at Atlanta (67,404), MON/N-9 3W 21 New Orleans (64,895), N-15 20W 27 at Los Angeles Rams (65,858), N-22 10W 20 Philadelphia (63,374), N-29 14W 27 Miami (58,474), D-6 3W 20 at Minnesota (60,685), D-13 17W 21 Tampa Bay (60,519), D-19 14W 24 Detroit (55,907), MON/D-28 6 431 236
NFC PLAYOFF - JAN. 9(at San Francisco - Candlestick Park)
W 20 Washington (64,991)-SAT 13NFC CHAMPIONSHIP - JAN. 17
(at San Francisco - Candlestick Park)L 20 Dallas (64,920) 30
SCORING TDs Ru Pa Int Fu KO Pu PAT FG S PtsTurner, Odessa 2 0 2 0 0 0 0 0/0 0/0 0 12Carter, Dexter 1 0 1 0 0 0 0 0/0 0/0 0 6Hanks, Merton 1 0 0 0 0 0 1 0/0 0/0 0 6Johnson, John 1 0 0 1 0 0 0 0/0 0/0 0 6Logan, Marc 1 1 0 0 0 0 0 0/0 0/0 0 6Sherrard, Mike 1 0 0 0 1 0 0 0/0 0/0 0 6Williams, Jamie 1 0 1 0 0 0 0 0/0 0/0 0 649ERS 54 22 29 1 1 0 1 53/54 18/27 0 431OPPONENTS 27 5 20 2 0 0 0 26/27 16/20 0 236RUSHING Att Yds Avg LG TDWatters, Ricky 206 1,013 4.9 43 9Young, Steve 76 537 7.1 39t 4Lee, Amp 91 362 4.0 43 2Rathman, Tom 57 194 3.4 17 5Rice, Jerry 9 58 6.4 26t 1Logan, Marc 8 44 5.5 26 1Henderson, Keith 10 37 3.7 9 0Montana, Joe 3 28 9.3 16 0Bono, Steve 15 23 1.5 19 0Taylor, John 1 10 10.0 10 0Carter, Dexter 4 9 2.3 6 0Wilmsmeyer, Klaus 2 0 0.0 10 049ERS 482 2,315 4.8 43 22OPPONENTS 351 1,418 4.0 35 5RECEIVING No Yds Avg LG TDRice, Jerry 84 1,201 14.3 80t 10Jones, Brent 45 628 14.0 43 4Rathman, Tom 44 343 7.8 27t 4Watters, Ricky 43 405 9.4 35 2Sherrard, Mike 38 607 16.0 56 0Taylor, John 25 428 17.1 54t 3Lee, Amp 20 102 5.1 17 2Turner, Odessa 9 200 22.2 57 2Williams, Jamie 7 76 10.9 21 1Logan, Marc 2 17 8.5 13 0Carter, Dexter 1 43 43.0 43t 1Henderson, Keith 1 4 4.0 4 049ERS 319 4,054 12.7 80t 29OPPONENTS 320 3,642 11.4 55t 20INTERCEPTIONS No Yds Avg LG TDGriffin, Don 5 4 0.8 2 0Davis, Eric 3 52 17.3 37 0Hall, Dana 2 34 17.0 34 0Hanks, Merton 2 5 2.5 4 0Johnson, John 1 56 56.0 56t 1Roberts, Larry 1 19 19.0 19 0DeLong, Keith 1 2 2.0 2 0Brown, Dennis 1 0 0.0 0 0Whitmore, David 1 0 0.0 0 049ERS 17 172 10.1 56t 1OPPONENTS 9 126 14.0 51t 2KICKOFF RETURNS No Yds Avg LG TDLogan, Marc 22 478 21.7 82 0Lee, Amp 14 276 19.7 33 0Grant, Alan 3 70 23.3 47 0Carter, Dexter 2 55 27.5 32 0Turner, Odessa 1 0 0.0 0 049ERS 42 879 20.9 82 0OPPONENTS 66 1,273 19.3 45 0PUNT RETURNS No FC Yds Avg LG TDGrant, Alan 29 10 249 8.6 46 0Griffin, Don 6 2 69 11.5 29 0Lewis, Ronald 4 0 23 5.8 9 0Hanks, Merton 1 0 48 48.0 48t 149ERS 40 12 389 9.7 48t 1OPPONENTS 23 9 177 7.7 27 0PUNTING No Yds Avg TB I-20 LG BlkWilmsmeyer, Klaus 49 1,918 39.1 2 19 58 049ERS 49 1,918 39.1 2 19 58 0OPPONENTS 76 3,134 41.2 7 23 71 0PASSING Att Comp Pct Yds LG TD Int QBYoung, Steve 402 268 66.7 3,465 80t 25 7 107.0Bono, Steve 56 36 64.3 463 36 2 2 87.1Montana, Joe 21 15 71.4 126 17 2 0 118.4Watters, Ricky 1 0 0.0 0 0 0 0 39.649ERS 480 319 66.5 4,054 80t 29 9 105.0OPPONENTS 551 320 58.1 3,642 55t 20 17 77.3
TEAM STATISTICS 49ers OppTOTAL FIRST DOWNS 344 277 By Rushing 135 90 By Passing 192 174 By Penalties 17 13TOTAL YARDS GAINED 6,195 4,787 By Rushing 2,315 1,418 By Passing 3,880 3,369TOTAL PLAYS FROM SCRIMMAGE 994 943 Rushes 482 351 Average Gain Per Rush 4.8 4.0NET YARDS PASSING 3,880 3,369 Passes Attempted 480 551 Passes Completed 319 320 Percent Completed 66.5 58.1 Had Intercepted 9 17 Times Sacked 32 41 Lost Attempting to Pass 174 273PUNTS 49 76 Total Yardage of Punts 1,918 3,134 Average Length 39.1 41.2KICKOFF RETURNS 42 66 Total Yards Returned 879 1,273 Average Length of Return 20.9 19.3PENALTIES 80 79 Yards Penalized 636 651FUMBLES 29 23 Own Fumbles Recovered 16 11 Opponents’ Fumbles Recovered 12 13FIELD GOALS 18 16 Field Goals Attempted 27 20TOTAL POINTS SCORED 431 236 Touchdowns Scored 54 27 Touchdowns Rushing 22 5 Touchdowns Passing 29 20 Touchdown Returns 3 2 Extra Points 53 26 Safeties 0 0AVG. TIME OF POSSESSION 32:19 27:41SCORING TDs Ru Pa Int Fu KO Pu PAT FG S PtsCofer, Mike 0 0 0 0 0 0 0 53/54 18/27 0 107Rice, Jerry 11 1 10 0 0 0 0 0/0 0/0 0 66Watters, Ricky 11 9 2 0 0 0 0 0/0 0/0 0 66Rathman, Tom 9 5 4 0 0 0 0 0/0 0/0 0 54Jones, Brent 4 0 4 0 0 0 0 0/0 0/0 0 24Lee, Amp 4 2 2 0 0 0 0 0/0 0/0 0 24Young, Steve 4 4 0 0 0 0 0 0/0 0/0 0 24Taylor, John 3 0 3 0 0 0 0 0/0 0/0 0 18
(continued)
Rookie Names in Italics
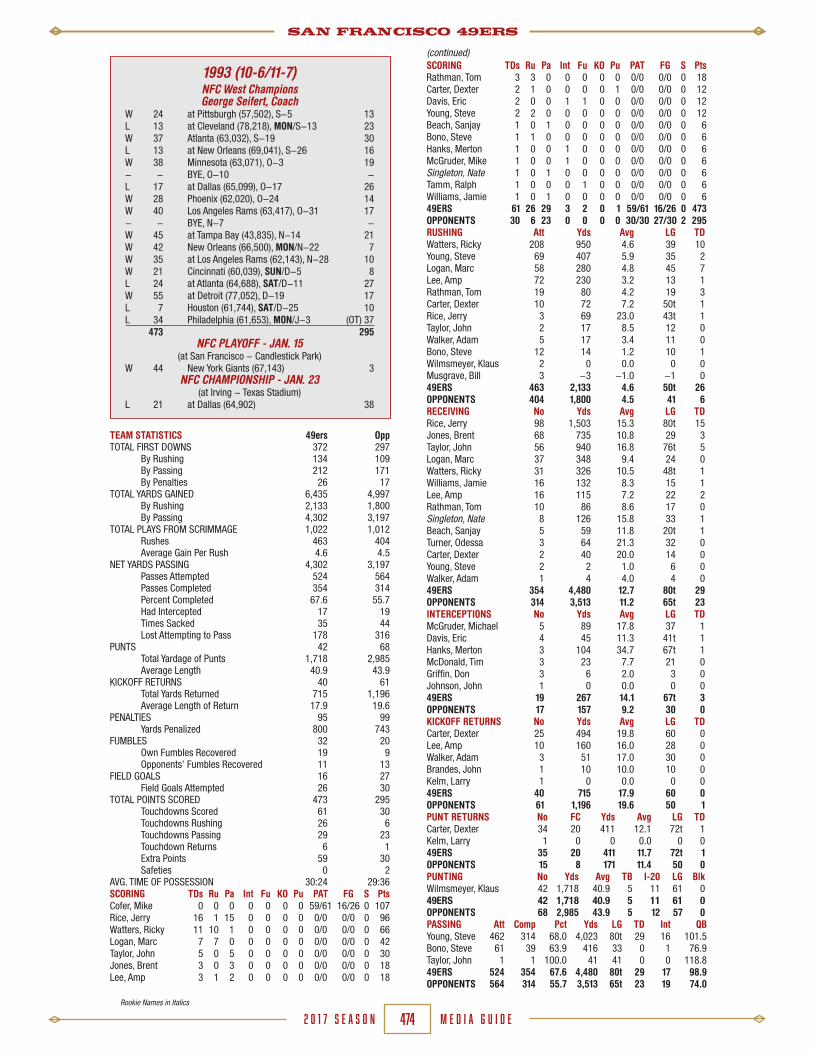
SAN FRANCISCO 49ERS
M E D I A G U I D E2 0 1 7 S E A S O N 474
1993 (10-6/11-7)NFC West ChampionsGeorge Seifert, Coach
W 24 at Pittsburgh (57,502), S-5 13L 13 at Cleveland (78,218), MON/S-13 23W 37 Atlanta (63,032), S-19 30L 13 at New Orleans (69,041), S-26 16W 38 Minnesota (63,071), O-3 19- - BYE, O-10 -L 17 at Dallas (65,099), O-17 26W 28 Phoenix (62,020), O-24 14W 40 Los Angeles Rams (63,417), O-31 17- - BYE, N-7 -W 45 at Tampa Bay (43,835), N-14 21W 42 New Orleans (66,500), MON/N-22 7W 35 at Los Angeles Rams (62,143), N-28 10W 21 Cincinnati (60,039), SUN/D-5 8L 24 at Atlanta (64,688), SAT/D-11 27W 55 at Detroit (77,052), D-19 17L 7 Houston (61,744), SAT/D-25 10L 34 Philadelphia (61,653), MON/J-3 (OT) 37 473 295
NFC PLAYOFF - JAN. 15(at San Francisco - Candlestick Park)
W 44 New York Giants (67,143) 3NFC CHAMPIONSHIP - JAN. 23
(at Irving - Texas Stadium)L 21 at Dallas (64,902) 38
SCORING TDs Ru Pa Int Fu KO Pu PAT FG S PtsRathman, Tom 3 3 0 0 0 0 0 0/0 0/0 0 18Carter, Dexter 2 1 0 0 0 0 1 0/0 0/0 0 12Davis, Eric 2 0 0 1 1 0 0 0/0 0/0 0 12Young, Steve 2 2 0 0 0 0 0 0/0 0/0 0 12Beach, Sanjay 1 0 1 0 0 0 0 0/0 0/0 0 6Bono, Steve 1 1 0 0 0 0 0 0/0 0/0 0 6Hanks, Merton 1 0 0 1 0 0 0 0/0 0/0 0 6McGruder, Mike 1 0 0 1 0 0 0 0/0 0/0 0 6Singleton, Nate 1 0 1 0 0 0 0 0/0 0/0 0 6Tamm, Ralph 1 0 0 0 1 0 0 0/0 0/0 0 6Williams, Jamie 1 0 1 0 0 0 0 0/0 0/0 0 649ERS 61 26 29 3 2 0 1 59/61 16/26 0 473OPPONENTS 30 6 23 0 0 0 0 30/30 27/30 2 295RUSHING Att Yds Avg LG TDWatters, Ricky 208 950 4.6 39 10Young, Steve 69 407 5.9 35 2Logan, Marc 58 280 4.8 45 7Lee, Amp 72 230 3.2 13 1Rathman, Tom 19 80 4.2 19 3Carter, Dexter 10 72 7.2 50t 1Rice, Jerry 3 69 23.0 43t 1Taylor, John 2 17 8.5 12 0Walker, Adam 5 17 3.4 11 0Bono, Steve 12 14 1.2 10 1Wilmsmeyer, Klaus 2 0 0.0 0 0Musgrave, Bill 3 -3 -1.0 -1 049ERS 463 2,133 4.6 50t 26OPPONENTS 404 1,800 4.5 41 6RECEIVING No Yds Avg LG TDRice, Jerry 98 1,503 15.3 80t 15Jones, Brent 68 735 10.8 29 3Taylor, John 56 940 16.8 76t 5Logan, Marc 37 348 9.4 24 0Watters, Ricky 31 326 10.5 48t 1Williams, Jamie 16 132 8.3 15 1Lee, Amp 16 115 7.2 22 2Rathman, Tom 10 86 8.6 17 0Singleton, Nate 8 126 15.8 33 1Beach, Sanjay 5 59 11.8 20t 1Turner, Odessa 3 64 21.3 32 0Carter, Dexter 2 40 20.0 14 0Young, Steve 2 2 1.0 6 0Walker, Adam 1 4 4.0 4 049ERS 354 4,480 12.7 80t 29OPPONENTS 314 3,513 11.2 65t 23INTERCEPTIONS No Yds Avg LG TDMcGruder, Michael 5 89 17.8 37 1Davis, Eric 4 45 11.3 41t 1Hanks, Merton 3 104 34.7 67t 1McDonald, Tim 3 23 7.7 21 0Griffin, Don 3 6 2.0 3 0Johnson, John 1 0 0.0 0 049ERS 19 267 14.1 67t 3OPPONENTS 17 157 9.2 30 0KICKOFF RETURNS No Yds Avg LG TDCarter, Dexter 25 494 19.8 60 0Lee, Amp 10 160 16.0 28 0Walker, Adam 3 51 17.0 30 0Brandes, John 1 10 10.0 10 0Kelm, Larry 1 0 0.0 0 049ERS 40 715 17.9 60 0OPPONENTS 61 1,196 19.6 50 1PUNT RETURNS No FC Yds Avg LG TDCarter, Dexter 34 20 411 12.1 72t 1Kelm, Larry 1 0 0 0.0 0 049ERS 35 20 411 11.7 72t 1OPPONENTS 15 8 171 11.4 50 0PUNTING No Yds Avg TB I-20 LG BlkWilmsmeyer, Klaus 42 1,718 40.9 5 11 61 049ERS 42 1,718 40.9 5 11 61 0OPPONENTS 68 2,985 43.9 5 12 57 0PASSING Att Comp Pct Yds LG TD Int QBYoung, Steve 462 314 68.0 4,023 80t 29 16 101.5Bono, Steve 61 39 63.9 416 33 0 1 76.9Taylor, John 1 1 100.0 41 41 0 0 118.849ERS 524 354 67.6 4,480 80t 29 17 98.9OPPONENTS 564 314 55.7 3,513 65t 23 19 74.0
TEAM STATISTICS 49ers OppTOTAL FIRST DOWNS 372 297 By Rushing 134 109 By Passing 212 171 By Penalties 26 17TOTAL YARDS GAINED 6,435 4,997 By Rushing 2,133 1,800 By Passing 4,302 3,197TOTAL PLAYS FROM SCRIMMAGE 1,022 1,012 Rushes 463 404 Average Gain Per Rush 4.6 4.5NET YARDS PASSING 4,302 3,197 Passes Attempted 524 564 Passes Completed 354 314 Percent Completed 67.6 55.7 Had Intercepted 17 19 Times Sacked 35 44 Lost Attempting to Pass 178 316PUNTS 42 68 Total Yardage of Punts 1,718 2,985 Average Length 40.9 43.9KICKOFF RETURNS 40 61 Total Yards Returned 715 1,196 Average Length of Return 17.9 19.6PENALTIES 95 99 Yards Penalized 800 743FUMBLES 32 20 Own Fumbles Recovered 19 9 Opponents’ Fumbles Recovered 11 13FIELD GOALS 16 27 Field Goals Attempted 26 30TOTAL POINTS SCORED 473 295 Touchdowns Scored 61 30 Touchdowns Rushing 26 6 Touchdowns Passing 29 23 Touchdown Returns 6 1 Extra Points 59 30 Safeties 0 2AVG. TIME OF POSSESSION 30:24 29:36SCORING TDs Ru Pa Int Fu KO Pu PAT FG S PtsCofer, Mike 0 0 0 0 0 0 0 59/61 16/26 0 107Rice, Jerry 16 1 15 0 0 0 0 0/0 0/0 0 96Watters, Ricky 11 10 1 0 0 0 0 0/0 0/0 0 66Logan, Marc 7 7 0 0 0 0 0 0/0 0/0 0 42Taylor, John 5 0 5 0 0 0 0 0/0 0/0 0 30Jones, Brent 3 0 3 0 0 0 0 0/0 0/0 0 18Lee, Amp 3 1 2 0 0 0 0 0/0 0/0 0 18
(continued)
Rookie Names in Italics

SAN FRANCISCO 49ERS
M E D I A G U I D E2 0 1 7 S E A S O N 475
1994 (13-3/16-3)NFC West Champions – World Champions
George Seifert, CoachW 44 Los Angeles Raiders (68,032), MON/S-5 14L 17 at Kansas City (79,907), S-11 24W 34 at Los Angeles Rams (56,479), S-18 19W 24 New Orleans (63,971), S-25 13L 8 Philadelphia (64,843), O-2 40W 27 at Detroit (77,340), O-9 21W 42 at Atlanta (67,298), O-16 3W 41 Tampa Bay (62,741), O-23 16- - BYE, O-30W 37 at Washington (54,335), N-6 22W 21 Dallas (69,014), N-13 14W 31 Los Angeles Rams (62,774), SUN/N-20 27W 35 at New Orleans (61,304), MON/N-28 14W 50 Atlanta (60,549), D-4 14W 38 at San Diego (62,105), SAT/D-11 15W 42 Denver (64,884), SAT/D-17 19L 14 at Minnesota (63,326), MON/D-26 21 505 296
NFC PLAYOFF - JAN. 7(at San Francisco - Candlestick Park)
W 44 Chicago (64,644)-SAT 15NFC CHAMPIONSHIP - JAN. 15
(at San Francisco - Candlestick Park)W 38 Dallas (69,125) 28
SUPER BOWL XXIX - JAN. 29(at Miami - Joe Robbie Stadium)
W 49 San Diego (74,107) 26
SCORING TDs Ru Pa Int Fu KO Pu PAT FG S PtsTaylor, John 5 0 5 0 0 0 0 0/0 0/0 0 30Sanders, Deion 3 0 0 3 0 0 0 0/0 0/0 0 18Logan, Marc 2 1 1 0 0 0 0 0/0 0/0 0 12McCaffrey, Ed 2 0 2 0 0 0 0 0/0 0/0 0 12McDonald, Tim 2 0 0 1 1 0 0 0/0 0/0 0 12Singleton, Nate 2 0 2 0 0 0 0 0/0 0/0 0 12Carter, Dexter 1 0 0 0 0 1 0 0/0 0/0 0 6Walker, Adam 1 1 0 0 0 0 0 0/0 0/0 0 649ERS 66 23 37 4 1 1 0 60/62 15/20 0 505OPPONENTS 35 16 15 1 3 0 0 23/23 15/21 2 296
RUSHING Att Yds Avg LG TDWatters, Ricky 239 877 3.7 23 6Floyd, William 87 305 3.5 26 6Young, Steve 58 293 5.1 27 7Logan, Marc 33 143 4.3 22 1Loville, Derek 31 99 3.2 13 0Rice, Jerry 7 93 13.3 28t 2Walker, Adam 13 54 4.2 14 1Carter, Dexter 8 34 4.3 18 0Grbac, Elvis 13 1 0.1 6 0Taylor, John 2 -2 -1.0 1 049ERS 491 1,897 3.9 28t 23OPPONENTS 375 1,338 3.6 44t 16
RECEIVING No Yds Avg LG TDRice, Jerry 112 1,499 13.4 69t 13Watters, Ricky 66 719 10.9 65t 5Jones, Brent 49 670 13.7 69t 9Taylor, John 41 531 13.0 35 5Singleton, Nate 21 294 14.0 43t 2Floyd, William 19 145 7.6 15 0Logan, Marc 16 97 6.1 15 1Popson, Ted 13 141 10.9 24 0McCaffrey, Ed 11 131 11.9 32 2Carter, Dexter 7 99 14.1 44 0Loville, Derek 2 26 13.0 19 0Carolan, Brett 2 10 5.0 6 049ERS 359 4,362 12.2 69t 37OPPONENTS 329 3,756 11.4 90 15
INTERCEPTIONS No Yds Avg LG TDHanks, Merton 7 93 13.3 38 0Sanders, Deion 6 303 50.5 93t 3McDonald, Tim 2 79 39.5 73t 1Hall, Dana 2 0 0.0 0 0Cook, Toi 1 18 18.0 18 0Davis, Eric 1 8 8.0 8 0Drakeford, Tyronne 1 6 6.0 6 0Plummer, Gary 1 1 1.0 1 0Brown, Dennis 1 0 0.0 0 0Norton, Ken, Jr. 1 0 0.0 0 049ERS 23 508 22.1 93t 4OPPONENTS 11 107 9.7 36t 1
KICKOFF RETURNS No Yds Avg LG TDCarter, Dexter 48 1,105 23.0 96t 1Walker, Adam 6 82 13.7 19 0Loville, Derek 2 34 17.0 19 0Singleton, Nate 2 23 11.5 17 049ERS 58 1,244 21.5 96t 1OPPONENTS 89 1,912 21.5 51 0
PUNT RETURNS No FC Yds Avg LG TDCarter, Dexter 38 12 321 8.5 26 0Singleton, Nate 2 1 13 6.5 8 049ERS 40 13 334 8.4 26 0OPPONENTS 28 10 242 8.6 43 0
PUNTING No Yds Avg TB I-20 LG BlkWilmsmeyer, Klaus 54 2,235 41.4 3 18 60 049ERS 54 2,235 41.4 3 18 60 0OPPONENTS 77 3,274 42.5 9 19 65 0
PASSING Att Comp Pct Yds LG TD Int QBYoung, Steve 461 324 70.3 3,969 69t 35 10 112.8Grbac, Elvis 50 35 70.0 393 42 2 1 98.249ERS 511 359 70.3 4,362 69t 37 11 111.4OPPONENTS 583 329 56.4 3,756 90 15 23 68.1
TEAM STATISTICS 49ers OppTOTAL FIRST DOWNS 362 285 By Rushing 122 82 By Passing 210 182 By Penalties 30 21TOTAL YARDS GAINED 6,060 4,839 By Rushing 1,897 1,338 By Passing 4,163 3,501TOTAL PLAYS FROM SCRIMMAGE 1,037 996 Rushes 491 375 Average Gain Per Rush 3.9 3.6NET YARDS PASSING 4,163 3,501 Passes Attempted 511 583 Passes Completed 359 329 Percent Completed 70.3 56.4 Had Intercepted 11 23 Times Sacked 35 38 Lost Attempting to Pass 199 255PUNTS 54 77 Total Yardage of Punts 2,235 3,274 Average Length 41.4 42.5KICKOFF RETURNS 58 89 Total Yards Returned 1,244 1,912 Average Length of Return 21.4 21.5PENALTIES 109 108 Yards Penalized 890 912FUMBLES 25 25 Own Fumbles Recovered 12 13 Opponents’ Fumbles Recovered 12 13FIELD GOALS 15 15 Field Goals Attempted 20 21TOTAL POINTS SCORED 505 296 Touchdowns Scored 66 35 Touchdowns Rushing 23 16 Touchdowns Passing 37 15 Touchdown Returns 6 4 Extra Points 60 23 Safeties 0 2AVG. TIME OF POSSESSION 31:38 28:22SCORING TDs Ru Pa Int Fu KO Pu PAT FG S PtsBrien, Doug 0 0 0 0 0 0 0 60/62 15/20 0 105Rice, Jerry 15 2 13 0 0 0 0 0/0 0/0 0 92Watters, Ricky 11 6 5 0 0 0 0 0/0 0/0 0 66Jones, Brent 9 0 9 0 0 0 0 0/0 0/0 0 56Young, Steve 7 7 0 0 0 0 0 0/0 0/0 0 42Floyd, William 6 6 0 0 0 0 0 0/0 0/0 0 36
(continued)
Rookie Names in Italics

SAN FRANCISCO 49ERS
M E D I A G U I D E2 0 1 7 S E A S O N 476
1995 (11-5/11-6)NFC West ChampionsGeorge Seifert, Coach
W 24 at New Orleans (66,627), S-3 22W 41 Atlanta (63,627), S-10 10W 28 New England (66,179), S-17 3L 24 at Detroit (76,236), MON/S-25 27W 20 New York Giants (65,536), O-1 6- - BYE, O-8 -L 17 at Indianapolis (60,273), O-15 18W 44 at St. Louis Rams (59,915), O-22 10L 7 New Orleans (65,272), O-29 11L 7 Carolina (61,722), N-5 13W 38 at Dallas (65,180), N-12 20W 44 at Miami (73,080), MON/N-20 20W 41 St. Louis Rams (66,049), N-26 13W 27 Buffalo (65,568), SUN/D-3 17W 31 at Carolina (76,136), D-10 10W 37 Minnesota (64,975), MON/D-18 30L 27 at Atlanta (51,785), D-24 28 457 258
NFC PLAYOFF - JAN. 6(at San Francisco - 3Com Park)
L 17 Green Bay (69,311)-SAT 27
SCORING TDs Ru Pa Int Fu KO Pu PAT FG S PtsHanks, Merton 1 0 0 0 1 0 0 0/0 0/0 0 6Singleton, Nate 1 0 1 0 0 0 0 0/0 0/0 0 6Walker, Adam 1 1 0 0 0 0 0 0/0 0/0 0 6Woodall, Lee 1 0 0 0 1 0 0 0/0 0/0 0 649ERS 57 19 29 5 3 0 1 51/54 20/28 0 457OPPONENTS 26 5 19 2 0 0 0 17/18 27/32 0 2582-pt conversions: D. Loville, J. Rice, Team: 2-3RUSHING Att Yds Avg LG TDLoville, Derek 218 723 3.3 27 10Young, Steve 50 250 5.0 29 3Floyd, William 64 237 3.7 23 2Ervins, Ricky 23 88 3.8 13 0Walker, Adam 14 44 3.1 16 1Rice, Jerry 5 36 7.2 20t 1Willis, Jamal 12 35 2.9 15 0Grbac, Elvis 20 33 1.7 11 2Carter, Dexter 7 22 3.1 15 0Lynn, Anthony 2 11 5.5 6 049ERS 415 1,479 3.6 29 19OPPONENTS 348 1,061 3.1 33 5RECEIVING No Yds Avg LG TDRice, Jerry 122 1,848 15.1 81t 15Loville, Derek 87 662 7.6 31 3Jones, Brent 60 595 9.9 39 3Floyd, William 47 348 7.4 23 1Stokes, J.J. 38 517 13.6 41t 4Taylor, John 29 387 13.3 40 2Popson, Ted 16 128 8.0 16 0Walker, Adam 11 78 7.1 15 0Singleton, Nate 8 108 13.5 23 1Thomas, Chris 6 73 12.2 23 0Willis, Jamal 3 8 2.7 5 0Ervins, Ricky 2 21 10.5 11 0Carter, Dexter 1 4 4.0 4 0Carolan, Brett 1 3 3.0 3 0Dalman, Chris 1 -1 -1.0 -1 049ERS 432 4,779 11.1 81t 29OPPONENTS 330 3,577 10.8 53 19INTERCEPTIONS No Yds Avg LG TDDrakeford, Tyronne 5 54 10.8 37 0Hanks, Merton 5 31 6.2 23 0McDonald, Tim 4 135 33.8 52t 2Norton, Ken, Jr. 3 102 34.0 46 2Davis, Eric 3 84 28.0 86t 1Woodall, Lee 2 0 0.0 0 0Dodge, Dedrick 1 13 13.0 13 0Stubblefield, Dana 1 12 12.0 12 0Jackson, Rickey 1 1 1.0 1 0Pope, Marquez 1 -7 -7.0 -7 049ERS 26 425 16.4 86t 5OPPONENTS 16 247 15.4 96t 2KICKOFF RETURNS No Yds Avg LG TDCarter, Dexter 23 522 22.7 46 0Willis, Jamal 17 427 25.1 39 0Ervins, Ricky 5 32 6.4 14 0Warren, Terrence 4 67 16.8 21 0Thomas, Mark 3 49 16.3 20 0Dalman, Chris 3 29 9.7 12 0Caldwell, Mike 2 40 20.0 20 0Walker, Adam 1 17 17.0 17 049ERS 58 1,183 20.4 46 0OPPONENTS 82 1,857 22.7 71 1PUNT RETURNS No FC Yds Avg LG TDCarter, Dexter 9 7 164 18.2 78t 1Taylor, John 11 9 56 5.1 11 0Singleton, Nate 5 1 27 5.4 19 0Hanks, Merton 1 0 0 0.0 0 0Thomas, Chris 1 0 25 25.0 25 049ERS 27 17 272 10.1 78t 1OPPONENTS 26 20 292 11.2 74 0PUNTING No Yds Avg TB I-20 LG BlkThompson, Tommy 57 2,312 40.6 5 13 65 049ERS 57 2,312 40.6 5 13 65 0OPPONENTS 70 2,918 41.7 11 19 55 0PASSING Att Comp Pct Yds LG TD Int QBYoung, Steve 447 299 66.9 3,200 57 20 11 92.3Grbac, Elvis 183 127 69.4 1,469 81t 8 5 80.8Conklin, Cary 12 4 33.3 48 28 0 0 46.5Rice, Jerry 1 1 100.0 41 41t 1 0 158.3Taylor, John 1 1 100.0 21 21 0 0 118.849ERS 644 432 67.1 4,779 81t 29 16 93.6OPPONENTS 611 330 54.0 3,577 53 19 26 64.1
TEAM STATISTICS 49ers OppTOTAL FIRST DOWNS 355 264 By Rushing 109 57 By Passing 231 192 By Penalties 15 15TOTAL YARDS GAINED 6,087 4,398 By Rushing 1,479 1,061 By Passing 4,608 3,337TOTAL PLAYS FROM SCRIMMAGE 1,092 999 Rushes 415 348 Average Gain Per Rush 3.6 3.1NET YARDS PASSING 4,608 3,337 Passes Attempted 644 611 Passes Completed 432 330 Percent Completed 67.1 54.0 Had Intercepted 16 26 Times Sacked 33 40 Lost Attempting to Pass 171 240PUNTS 57 70 Total Yardage of Punts 2,312 2,918 Average Length 40.6 41.7KICKOFF RETURNS 58 82 Total Yards Returned 1,183 1,857 Average Length of Return 20.4 22.6PENALTIES 88 74 Yards Penalized 711 556FUMBLES 21 23 Own Fumbles Recovered 9 15 Opponents’ Fumbles Recovered 8 12FIELD GOALS 20 27 Field Goals Attempted 28 32TOTAL POINTS SCORED 457 258 Touchdowns Scored 57 26 Touchdowns Rushing 19 5 Touchdowns Passing 29 19 Touchdown Returns 9 2 Extra Points 51 17 Safeties 0 0AVG. TIME OF POSSESSION 31:56 28:04SCORING TDs Ru Pa Int Fu KO Pu PAT FG S PtsRice, Jerry 17 1 15 0 1 0 0 0/0 0/0 0 104Loville, Derek 13 10 3 0 0 0 0 0/0 0/0 0 80Wilkins, Jeff 0 0 0 0 0 0 0 27/29 12/13 0 63Brien, Doug 0 0 0 0 0 0 0 19/19 7/12 0 40Stokes, J.J. 4 0 4 0 0 0 0 0/0 0/0 0 24Floyd, William 3 2 1 0 0 0 0 0/0 0/0 0 18Jones, Brent 3 0 3 0 0 0 0 0/0 0/0 0 18Young, Steve 3 3 0 0 0 0 0 0/0 0/0 0 18Grbac, Elvis 2 2 0 0 0 0 0 0/0 0/0 0 12McDonald, Tim 2 0 0 2 0 0 0 0/0 0/0 0 12Norton, Ken 2 0 0 2 0 0 0 0/0 0/0 0 12Taylor, John 2 0 2 0 0 0 0 0/0 0/0 0 12Zendejas, Tony 0 0 0 0 0 0 0 5/6 1/3 0 8Carter, Dexter 1 0 0 0 0 0 1 0/0 0/0 0 6Davis, Eric 1 0 0 1 0 0 0 0/0 0/0 0 6
(continued)
Rookie Names in Italics

SAN FRANCISCO 49ERS
M E D I A G U I D E2 0 1 7 S E A S O N 477
1996 (12-4/13-5)George Seifert, Coach
W 27 New Orleans (63,970), S-1 11W 34 St. Louis (63,624), S-8 0- - BYE, S-15 -L 7 at Carolina (72,224), S-22 23W 39 Atlanta (62,995), S-29 17W 28 at St. Louis (61,260), O-6 11L 20 at Green Bay (60,716), MON/O-14 (OT) 23W 28 Cincinnati (63,218), O-20 21W 10 at Houston (53,664), O-27 9W 24 at New Orleans (53,297), SUN/N-3 17L 17 Dallas (68,919), N-10 (OT) 20W 38 Baltimore (51,597), N-17 20W 19 at Washington (54,235), N-24 (OT) 16W 34 at Atlanta (46,318), MON/D-2 10L 24 Carolina (66,291), D-8 30W 25 at Pittsburgh (59,823), D-15 15W 24 Detroit (61,921), MON/D-23 14 398 257
NFC WILD CARD - DEC. 29(at San Francisco - 3Com Park)
W 14 Philadelphia (56,460) 0NFC PLAYOFF - JAN. 4
(at Green Bay - Lambeau Field)L 14 Green Bay (60,787) 35
SCORING TDs Ru Pa Int Fu KO Pu PAT FG S PtsDoleman, Chris 1 0 0 0 1 0 0 0/0 0/0 0 6Jones, Brent 1 0 1 0 0 0 0 0/0 0/0 0 6Pope, Marquez 1 0 0 1 0 0 0 0/0 0/0 0 6Uwaezuoke, Iheanyi 1 0 1 0 0 0 0 0/0 0/0 0 6Young, Bryant 0 0 0 0 0 0 0 0/0 0/0 2 449ERS 43 17 24 1 1 0 0 40/40 30/34 4* 394OPPONENTS 25 4 21 0 0 0 0 21/21 26/29 0 2572-pt conversions: S. Young, Team: 1-3, Opponents: 4-4*49ers credited with 2 team safetiesRUSHING Att Yds Avg LG TDKirby, Terry 134 559 4.2 31 3Young, Steve 52 310 6.0 33 4Loville, Derek 70 229 3.3 16 2Vardell, Tommy 58 192 3.3 17 2Floyd, William 47 186 4.0 12 2Lynn, Anthony 24 164 6.8 67 0Rice, Jerry 11 77 7.0 38 1Carter, Dexter 19 66 3.5 18 1Brohm, Jeff 16 43 2.7 22 0Grbac, Elvis 23 21 0.9 12 249ERS 454 1,847 4.1 67 17OPPONENTS 418 1,497 3.6 54t 4RECEIVING No Yds Avg LG TDRice, Jerry 108 1,254 11.6 39 8Kirby, Terry 52 439 8.4 52 1Owens, Terrell 35 520 14.9 46t 4Jones, Brent 33 428 13.0 39 1Vardell, Tommy 28 179 6.4 22 0Popson, Ted 26 301 11.6 39t 6Floyd, William 26 197 7.6 24 1Stokes, J.J. 18 249 13.8 40 0Loville, Derek 16 138 8.6 44t 2Uwaezuoke, Iheanyi 7 91 13.0 29t 1Manuel, Sean 3 18 6.0 7 0Lynn, Anthony 2 14 7.0 8 0Caldwell, Mike 2 9 4.5 8 0Cooper, Adrian 1 11 11.0 11 0Singleton, Nate 1 11 11.0 11 049ERS 358 3,859 10.8 52 24OPPONENTS 287 3,461 12.1 65t 21INTERCEPTIONS No Yds Avg LG TDPope, Marquez 6 98 16.3 55t 1Hanks, Merton 4 7 1.8 8 0Dodge, Dedrick 3 27 9.0 26 0McDonald, Tim 2 14 7.0 14 0Doleman, Chris 2 1 0.5 1 0Stubblefield, Dana 1 15 15.0 15 0Drakeford, Tyronne 1 11 11.0 11 0Israel, Steve 1 3 3.0 3 049ERS 20 176 8.8 55t 1OPPONENTS 16 107 6.7 35 0KICKOFF RETURNS No Yds Avg LG TDCarter, Dexter 41 909 22.2 71 0Loville, Derek 10 229 22.9 35 0Owens, Terrell 3 47 15.7 18 0Deese, Derrick 2 20 10.0 12 0Kirby, Terry 1 22 22.0 22 0Uwaezuoke, Iheanyi 1 21 21.0 21 0Singleton, Nate 1 10 10.0 10 049ERS 59 1,258 21.3 71 0OPPONENTS 77 1,414 18.4 58 0PUNT RETURNS No FC Yds Avg LG TDCarter, Dexter 36 17 317 8.8 52 0Singleton, Nate 2 0 32 16.0 21 0Kirby, Terry 1 4 3 3.0 3 049ERS 39 21 352 9.0 52 0OPPONENTS 36 11 235 6.5 22 0PUNTING No Yds Avg TB I-20 LG BlkThompson, Tommy 73 3,217 44.1 6 20 65 249ERS 73 3,217 42.9 6 20 65 2OPPONENTS 88 3,695 42.0 11 23 62 0PASSING Att Comp Pct Yds LG TD Int QBYoung, Steve 316 214 67.7 2,410 52 14 6 97.2Grbac, Elvis 197 122 61.9 1,236 40 8 10 72.2Brohm, Jeff 34 21 61.8 189 49 1 0 86.5Kirby, Terry 2 1 50.0 24 24t 1 0 133.3Rice, Jerry 1 0 0.0 0 0 0 0 39.649ERS 550 358 65.1 3,859 52 24 16 88.0OPPONENTS 558 287 51.4 3,461 65t 21 20 68.4
TEAM STATISTICS 49ers OppTOTAL FIRST DOWNS 315 269 By Rushing 108 76 By Passing 188 164 By Penalties 19 29TOTAL YARDS GAINED 5,506 4,661 By Rushing 1,847 1,497 By Passing 3,659 3,164TOTAL PLAYS FROM SCRIMMAGE 1,046 1,021 Rushes 454 418 Average Gain Per Rush 4.1 3.6NET YARDS PASSING 3,659 3,164 Passes Attempted 550 558 Passes Completed 358 287 Percent Completed 65.1 51.4 Had Intercepted 16 20 Times Sacked 42 45 Lost Attempting to Pass 200 297PUNTS 73 88 Total Yardage of Punts 3,217 3,695 Average Length 44.1 42.0KICKOFF RETURNS 59 77 Total Yards Returned 1,258 1,414 Average Length of Return 21.3 18.4PENALTIES 119 97 Yards Penalized 925 819FUMBLES 16 29 Own Fumbles Recovered 8 15 Opponents’ Fumbles Recovered 14 8FIELD GOALS 30 26 Field Goals Attempted 34 29TOTAL POINTS SCORED 398 257 Touchdowns Scored 43 25 Touchdowns Rushing 17 4 Touchdowns Passing 24 21 Touchdown Returns 2 0 Extra Points 40 21 Safeties 4 0AVG. TIME OF POSSESSION 31:28 28:32SCORING TDs Ru Pa Int Fu KO Pu PAT FG S PtsWilkins, Jeff 0 0 0 0 0 0 0 40/40 30/34 0 130Rice, Jerry 9 1 8 0 0 0 0 0/0 0/0 0 54Popson, Ted 6 0 6 0 0 0 0 0/0 0/0 0 36Young, Steve 4 4 0 0 0 0 0 0/0 0/0 0 26Kirby, Terry 4 3 1 0 0 0 0 0/0 0/0 0 24Loville, Derek 4 2 2 0 0 0 0 0/0 0/0 0 24Owens, Terrell 4 0 4 0 0 0 0 0/0 0/0 0 24Floyd, William 3 2 1 0 0 0 0 0/0 0/0 0 18Grbac, Elvis 2 2 0 0 0 0 0 0/0 0/0 0 12Vardell, Tommy 2 2 0 0 0 0 0 0/0 0/0 0 12Carter, Dexter 1 1 0 0 0 0 0 0/0 0/0 0 6
(continued)
Rookie Names in Italics

SAN FRANCISCO 49ERS
M E D I A G U I D E2 0 1 7 S E A S O N 478
1997 (13-3/14-4)NFC West ChampionsSteve Mariucci, Coach
L 6 at Tampa Bay (62,554), A-31 13W 15 at St. Louis (64,630), S-7 12W 33 New Orleans (61,838), S-14 7W 34 Atlanta (60,404), S-21 7W 34 at Carolina (70,972), MON/S-29 21- - BYE, O-5 -W 30 St. Louis (63,825), O-12 10W 35 at Atlanta (53,378), O-19 28W 23 at New Orleans (60,443), O-26 0W 17 Dallas (68,657), N-2 10W 24 at Philadelphia (67,133), MON/N-10 12W 27 Carolina (61,500), N-16 19W 17 San Diego (61,195), N-23 10L 9 at Kansas City (77,535), N-30 44W 28 Minnesota (55,761), D-7 17W 34 Denver (68,461), MON/D-15 17L 9 at Seattle (66,253), SUN/D-21 38 375 265
NFC PLAYOFF - JAN. 3(at San Francisco - 3Com Park)
W 38 Minnesota (65,018)-SAT 22NFC CHAMPIONSHIP - JAN. 11
(at San Francisco - 3Com Park)L 10 Green Bay (68,987) 23
SCORING TDs Ru Pa Int Fu KO Pu PAT FG S PtsJones, Brent 2 0 2 0 0 0 0 0/0 0/0 0 12Clark, Greg 1 0 1 0 0 0 0 0/0 0/0 0 6Greene, Kevin 1 0 0 0 1 0 0 0/0 0/0 0 6Levy, Chuck 1 0 0 0 0 0 1 0/0 0/0 0 6Rice, Jerry 1 0 1 0 0 0 0 0/0 0/0 0 649ERS 41 16 20 1 2 1 1 38/38 29/36 0 375OPPONENTS 31 5 23 2 1 0 0 29/29 16/20 1 2652-pt conversions: T. Kirby 2, Team: 2-3, Opponents: 0-2
RUSHING Att Yds Avg LG TDHearst, Garrison 234 1,019 4.4 51 4Kirby, Terry 125 418 3.3 38 6Floyd, William 78 231 3.0 22 3Young, Steve 50 199 4.0 13 3Levy, Chuck 16 90 5.6 24 0Edwards, Marc 5 17 3.4 6 0Brohm, Jeff 4 11 2.8 10 0Druckenmiller, Jim 10 -6 -0.6 2 0Rice, Jerry 1 -10 -10.0 -10 049ERS 523 1,969 3.8 51 16OPPONENTS 386 1,366 3.5 46 5
RECEIVING No Yds Avg LG TDOwens, Terrell 60 936 15.6 56t 8Stokes, J.J. 58 733 12.6 36 4Floyd, William 37 321 8.7 44t 1Jones, Brent 29 383 13.2 33 2Kirby, Terry 23 279 12.1 82 1Hearst, Garrison 21 194 9.2 69 2Uwaezuoke, Iheanyi 14 165 11.8 25 0Clark, Greg 8 96 12.0 23 1Rice, Jerry 7 78 11.1 16 1Edwards, Marc 6 48 8.0 19 0Fann, Chad 5 78 15.6 21 0Levy, Chuck 5 68 13.6 30 0Harris, Mark 5 53 10.6 16 049ERS 278 3,432 12.4 82 20OPPONENTS 258 3,011 11.7 69 23
INTERCEPTIONS No Yds Avg LG TDHanks, Merton 6 103 17.2 55t 1Drakeford, Tyronne 5 15 3.0 15 0Woodson, Rod 3 81 27.0 41 0Walker, Darnell 3 49 16.3 28 0McDonald, Tim 3 34 11.3 17 0Woodall, Lee 2 55 27.5 55 0Bronson, Zack 1 22 22.0 22 0Pope, Marquez 1 7 7.0 7 0Maxie, Brett 1 0 0.0 0 049ERS 25 366 14.6 55t 1OPPONENTS 11 169 15.4 75t 2
KICKOFF RETURNS No Yds Avg LG TDLevy, Chuck 36 793 22.0 59 0Uwaezuoke, Iheanyi 6 131 21.8 25 0Kirby, Terry 3 124 41.3 101t 1Owens, Terrell 2 31 15.5 23 0Edwards, Marc 1 30 30.0 30 0Drakeford, Tyronne 1 24 24.0 24 0Fann, Chad 1 0 0.0 0 049ERS 50 1,133 22.7 101t 1OPPONENTS 82 1,746 21.3 61 0
PUNT RETURNS No FC Yds Avg LG TDUwaezuoke, Iheanyi 34 14 373 11.0 36 0Levy, Chuck 6 2 109 18.2 73t 1Woodson, Rod 1 0 0 0.0 0 049ERS 41 16 482 11.8 73t 1OPPONENTS 41 9 307 7.5 37 0
PUNTING No Yds Avg TB I-20 LG BlkThompson, Tommy 78 3,182 40.8 7 22 55 149ERS 78 3,182 40.3 7 22 55 1OPPONENTS 83 3,473 41.9 11 25 59 1
PASSING Att Comp Pct Yds LG TD Int QBYoung, Steve 356 241 67.7 3,029 82 19 6 104.7Druckenmiller, Jim 52 21 40.4 239 33 1 4 29.2Brohm, Jeff 24 16 66.7 164 21 0 1 68.749ERS 432 278 64.4 3,432 82 20 11 93.6OPPONENTS 509 258 50.7 3,011 69 23 25 63.6
TEAM STATISTICS 49ers OppTOTAL FIRST DOWNS 294 242 By Rushing 106 67 By Passing 167 145 By Penalties 21 30TOTAL YARDS GAINED 5,112 4,013 By Rushing 1,969 1,366 By Passing 3,143 2,647TOTAL PLAYS FROM SCRIMMAGE 999 949 Rushes 523 386 Average Gain Per Rush 3.8 3.5NET YARDS PASSING 3,143 3,164 Passes Attempted 432 558 Passes Completed 278 287 Percent Completed 64.4 50.7 Had Intercepted 11 25 Times Sacked 44 54 Lost Attempting to Pass 289 364PUNTS 78 82 Total Yardage of Punts 3,182 3,473 Average Length 40.8 42.4KICKOFF RETURNS 50 82 Total Yards Returned 1,133 1,746 Average Length of Return 22.7 21.3PENALTIES 115 91 Yards Penalized 979 742FUMBLES 22 24 Own Fumbles Recovered 13 8 Opponents’ Fumbles Recovered 16 9FIELD GOALS 29 16 Field Goals Attempted 36 20TOTAL POINTS SCORED 375 265 Touchdowns Scored 41 31 Touchdowns Rushing 16 5 Touchdowns Passing 20 23 Touchdown Returns 5 3 Extra Points 38 29 Safeties 0 1AVG. TIME OF POSSESSION 32:28 27:32SCORING TDs Ru Pa Int Fu KO Pu PAT FG S PtsAnderson, Gary 0 0 0 0 0 0 0 38/38 29/36 0 125Kirby, Terry 8 6 1 0 0 1 0 0/0 0/0 0 52Owens, Terrell 8 0 8 0 0 0 0 0/0 0/0 0 48Hearst, Garrison 6 4 2 0 0 0 0 0/0 0/0 0 36Floyd, William 4 3 1 0 0 0 0 0/0 0/0 0 24Stokes, J.J. 4 0 4 0 0 0 0 0/0 0/0 0 24Young, Steve 3 3 0 0 0 0 0 0/0 0/0 0 18Hanks, Merton 2 0 0 1 1 0 0 0/0 0/0 0 12
(continued)
Rookie Names in Italics
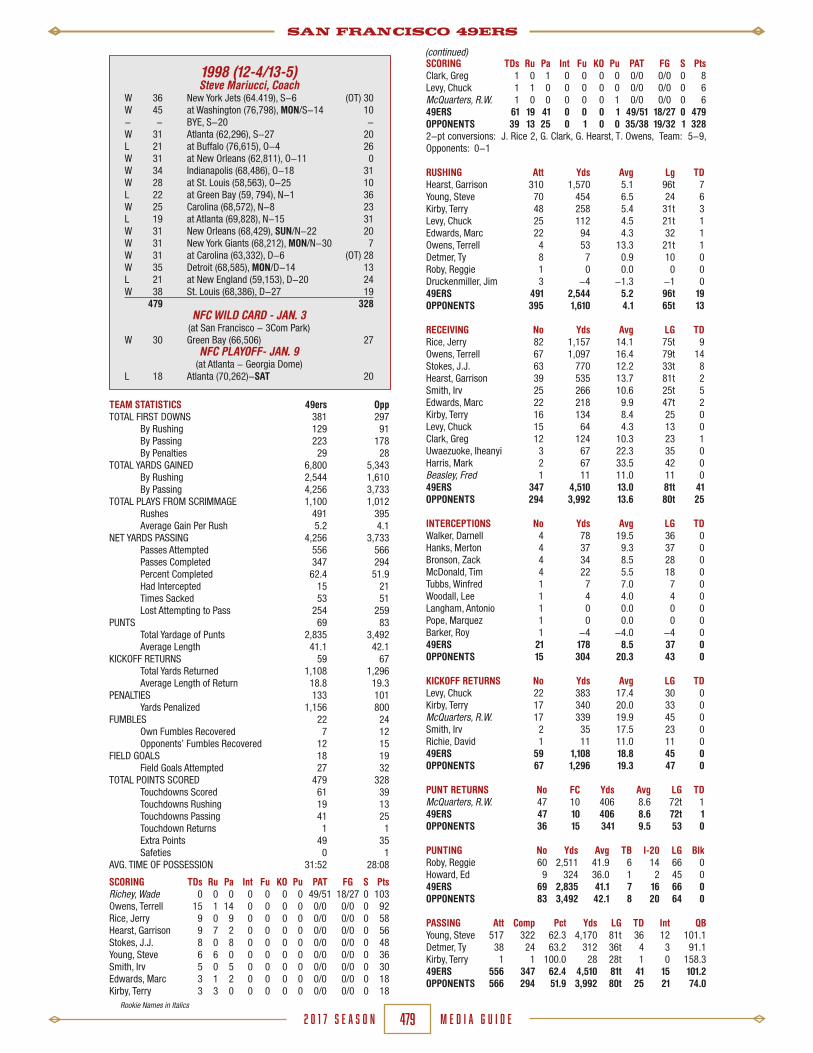
SAN FRANCISCO 49ERS
M E D I A G U I D E2 0 1 7 S E A S O N 479
1998 (12-4/13-5)Steve Mariucci, Coach
W 36 New York Jets (64.419), S-6 (OT) 30W 45 at Washington (76,798), MON/S-14 10- - BYE, S-20 -W 31 Atlanta (62,296), S-27 20L 21 at Buffalo (76,615), O-4 26W 31 at New Orleans (62,811), O-11 0W 34 Indianapolis (68,486), O-18 31W 28 at St. Louis (58,563), O-25 10L 22 at Green Bay (59, 794), N-1 36W 25 Carolina (68,572), N-8 23L 19 at Atlanta (69,828), N-15 31W 31 New Orleans (68,429), SUN/N-22 20W 31 New York Giants (68,212), MON/N-30 7W 31 at Carolina (63,332), D-6 (OT) 28W 35 Detroit (68,585), MON/D-14 13L 21 at New England (59,153), D-20 24W 38 St. Louis (68,386), D-27 19 479 328
NFC WILD CARD - JAN. 3(at San Francisco - 3Com Park)
W 30 Green Bay (66,506) 27NFC PLAYOFF- JAN. 9
(at Atlanta - Georgia Dome)L 18 Atlanta (70,262)-SAT 20
SCORING TDs Ru Pa Int Fu KO Pu PAT FG S PtsClark, Greg 1 0 1 0 0 0 0 0/0 0/0 0 8Levy, Chuck 1 1 0 0 0 0 0 0/0 0/0 0 6McQuarters, R.W. 1 0 0 0 0 0 1 0/0 0/0 0 649ERS 61 19 41 0 0 0 1 49/51 18/27 0 479OPPONENTS 39 13 25 0 1 0 0 35/38 19/32 1 3282-pt conversions: J. Rice 2, G. Clark, G. Hearst, T. Owens, Team: 5-9, Opponents: 0-1
RUSHING Att Yds Avg Lg TDHearst, Garrison 310 1,570 5.1 96t 7Young, Steve 70 454 6.5 24 6Kirby, Terry 48 258 5.4 31t 3Levy, Chuck 25 112 4.5 21t 1Edwards, Marc 22 94 4.3 32 1Owens, Terrell 4 53 13.3 21t 1Detmer, Ty 8 7 0.9 10 0Roby, Reggie 1 0 0.0 0 0Druckenmiller, Jim 3 -4 -1.3 -1 049ERS 491 2,544 5.2 96t 19OPPONENTS 395 1,610 4.1 65t 13
RECEIVING No Yds Avg LG TDRice, Jerry 82 1,157 14.1 75t 9Owens, Terrell 67 1,097 16.4 79t 14Stokes, J.J. 63 770 12.2 33t 8Hearst, Garrison 39 535 13.7 81t 2Smith, Irv 25 266 10.6 25t 5Edwards, Marc 22 218 9.9 47t 2Kirby, Terry 16 134 8.4 25 0Levy, Chuck 15 64 4.3 13 0Clark, Greg 12 124 10.3 23 1Uwaezuoke, Iheanyi 3 67 22.3 35 0Harris, Mark 2 67 33.5 42 0Beasley, Fred 1 11 11.0 11 049ERS 347 4,510 13.0 81t 41OPPONENTS 294 3,992 13.6 80t 25
INTERCEPTIONS No Yds Avg LG TDWalker, Darnell 4 78 19.5 36 0Hanks, Merton 4 37 9.3 37 0Bronson, Zack 4 34 8.5 28 0McDonald, Tim 4 22 5.5 18 0Tubbs, Winfred 1 7 7.0 7 0Woodall, Lee 1 4 4.0 4 0Langham, Antonio 1 0 0.0 0 0Pope, Marquez 1 0 0.0 0 0Barker, Roy 1 -4 -4.0 -4 049ERS 21 178 8.5 37 0OPPONENTS 15 304 20.3 43 0
KICKOFF RETURNS No Yds Avg LG TDLevy, Chuck 22 383 17.4 30 0Kirby, Terry 17 340 20.0 33 0McQuarters, R.W. 17 339 19.9 45 0Smith, Irv 2 35 17.5 23 0Richie, David 1 11 11.0 11 049ERS 59 1,108 18.8 45 0OPPONENTS 67 1,296 19.3 47 0
PUNT RETURNS No FC Yds Avg LG TDMcQuarters, R.W. 47 10 406 8.6 72t 149ERS 47 10 406 8.6 72t 1OPPONENTS 36 15 341 9.5 53 0
PUNTING No Yds Avg TB I-20 LG BlkRoby, Reggie 60 2,511 41.9 6 14 66 0Howard, Ed 9 324 36.0 1 2 45 049ERS 69 2,835 41.1 7 16 66 0OPPONENTS 83 3,492 42.1 8 20 64 0
PASSING Att Comp Pct Yds LG TD Int QBYoung, Steve 517 322 62.3 4,170 81t 36 12 101.1Detmer, Ty 38 24 63.2 312 36t 4 3 91.1Kirby, Terry 1 1 100.0 28 28t 1 0 158.349ERS 556 347 62.4 4,510 81t 41 15 101.2OPPONENTS 566 294 51.9 3,992 80t 25 21 74.0
TEAM STATISTICS 49ers OppTOTAL FIRST DOWNS 381 297 By Rushing 129 91 By Passing 223 178 By Penalties 29 28TOTAL YARDS GAINED 6,800 5,343 By Rushing 2,544 1,610 By Passing 4,256 3,733TOTAL PLAYS FROM SCRIMMAGE 1,100 1,012 Rushes 491 395 Average Gain Per Rush 5.2 4.1NET YARDS PASSING 4,256 3,733 Passes Attempted 556 566 Passes Completed 347 294 Percent Completed 62.4 51.9 Had Intercepted 15 21 Times Sacked 53 51 Lost Attempting to Pass 254 259PUNTS 69 83 Total Yardage of Punts 2,835 3,492 Average Length 41.1 42.1KICKOFF RETURNS 59 67 Total Yards Returned 1,108 1,296 Average Length of Return 18.8 19.3PENALTIES 133 101 Yards Penalized 1,156 800FUMBLES 22 24 Own Fumbles Recovered 7 12 Opponents’ Fumbles Recovered 12 15FIELD GOALS 18 19 Field Goals Attempted 27 32TOTAL POINTS SCORED 479 328 Touchdowns Scored 61 39 Touchdowns Rushing 19 13 Touchdowns Passing 41 25 Touchdown Returns 1 1 Extra Points 49 35 Safeties 0 1AVG. TIME OF POSSESSION 31:52 28:08
SCORING TDs Ru Pa Int Fu KO Pu PAT FG S PtsRichey, Wade 0 0 0 0 0 0 0 49/51 18/27 0 103Owens, Terrell 15 1 14 0 0 0 0 0/0 0/0 0 92Rice, Jerry 9 0 9 0 0 0 0 0/0 0/0 0 58Hearst, Garrison 9 7 2 0 0 0 0 0/0 0/0 0 56Stokes, J.J. 8 0 8 0 0 0 0 0/0 0/0 0 48Young, Steve 6 6 0 0 0 0 0 0/0 0/0 0 36Smith, Irv 5 0 5 0 0 0 0 0/0 0/0 0 30Edwards, Marc 3 1 2 0 0 0 0 0/0 0/0 0 18Kirby, Terry 3 3 0 0 0 0 0 0/0 0/0 0 18
(continued)
Rookie Names in Italics
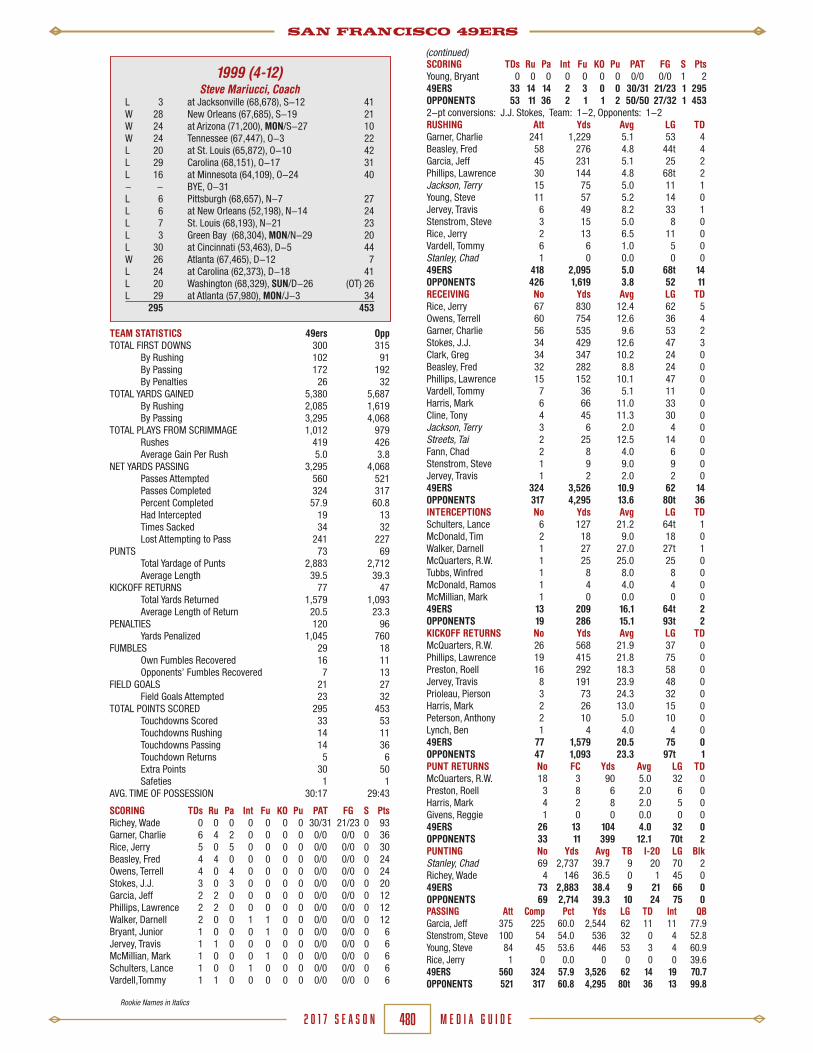
SAN FRANCISCO 49ERS
M E D I A G U I D E2 0 1 7 S E A S O N 480
1999 (4-12)Steve Mariucci, Coach
L 3 at Jacksonville (68,678), S-12 41W 28 New Orleans (67,685), S-19 21W 24 at Arizona (71,200), MON/S-27 10W 24 Tennessee (67,447), O-3 22L 20 at St. Louis (65,872), O-10 42L 29 Carolina (68,151), O-17 31L 16 at Minnesota (64,109), O-24 40- - BYE, O-31L 6 Pittsburgh (68,657), N-7 27L 6 at New Orleans (52,198), N-14 24L 7 St. Louis (68,193), N-21 23L 3 Green Bay (68,304), MON/N-29 20L 30 at Cincinnati (53,463), D-5 44W 26 Atlanta (67,465), D-12 7L 24 at Carolina (62,373), D-18 41L 20 Washington (68,329), SUN/D-26 (OT) 26L 29 at Atlanta (57,980), MON/J-3 34 295 453
SCORING TDs Ru Pa Int Fu KO Pu PAT FG S PtsYoung, Bryant 0 0 0 0 0 0 0 0/0 0/0 1 249ERS 33 14 14 2 3 0 0 30/31 21/23 1 295OPPONENTS 53 11 36 2 1 1 2 50/50 27/32 1 4532-pt conversions: J.J. Stokes, Team: 1-2, Opponents: 1-2RUSHING Att Yds Avg LG TDGarner, Charlie 241 1,229 5.1 53 4Beasley, Fred 58 276 4.8 44t 4Garcia, Jeff 45 231 5.1 25 2Phillips, Lawrence 30 144 4.8 68t 2Jackson, Terry 15 75 5.0 11 1Young, Steve 11 57 5.2 14 0Jervey, Travis 6 49 8.2 33 1Stenstrom, Steve 3 15 5.0 8 0Rice, Jerry 2 13 6.5 11 0Vardell, Tommy 6 6 1.0 5 0Stanley, Chad 1 0 0.0 0 049ERS 418 2,095 5.0 68t 14OPPONENTS 426 1,619 3.8 52 11RECEIVING No Yds Avg LG TDRice, Jerry 67 830 12.4 62 5Owens, Terrell 60 754 12.6 36 4Garner, Charlie 56 535 9.6 53 2Stokes, J.J. 34 429 12.6 47 3Clark, Greg 34 347 10.2 24 0Beasley, Fred 32 282 8.8 24 0Phillips, Lawrence 15 152 10.1 47 0Vardell, Tommy 7 36 5.1 11 0Harris, Mark 6 66 11.0 33 0Cline, Tony 4 45 11.3 30 0Jackson, Terry 3 6 2.0 4 0Streets, Tai 2 25 12.5 14 0Fann, Chad 2 8 4.0 6 0Stenstrom, Steve 1 9 9.0 9 0Jervey, Travis 1 2 2.0 2 049ERS 324 3,526 10.9 62 14OPPONENTS 317 4,295 13.6 80t 36INTERCEPTIONS No Yds Avg LG TDSchulters, Lance 6 127 21.2 64t 1McDonald, Tim 2 18 9.0 18 0Walker, Darnell 1 27 27.0 27t 1McQuarters, R.W. 1 25 25.0 25 0Tubbs, Winfred 1 8 8.0 8 0McDonald, Ramos 1 4 4.0 4 0McMillian, Mark 1 0 0.0 0 049ERS 13 209 16.1 64t 2OPPONENTS 19 286 15.1 93t 2KICKOFF RETURNS No Yds Avg LG TDMcQuarters, R.W. 26 568 21.9 37 0Phillips, Lawrence 19 415 21.8 75 0Preston, Roell 16 292 18.3 58 0Jervey, Travis 8 191 23.9 48 0Prioleau, Pierson 3 73 24.3 32 0Harris, Mark 2 26 13.0 15 0Peterson, Anthony 2 10 5.0 10 0Lynch, Ben 1 4 4.0 4 049ERS 77 1,579 20.5 75 0OPPONENTS 47 1,093 23.3 97t 1PUNT RETURNS No FC Yds Avg LG TDMcQuarters, R.W. 18 3 90 5.0 32 0Preston, Roell 3 8 6 2.0 6 0Harris, Mark 4 2 8 2.0 5 0Givens, Reggie 1 0 0 0.0 0 049ERS 26 13 104 4.0 32 0OPPONENTS 33 11 399 12.1 70t 2PUNTING No Yds Avg TB I-20 LG BlkStanley, Chad 69 2,737 39.7 9 20 70 2Richey, Wade 4 146 36.5 0 1 45 049ERS 73 2,883 38.4 9 21 66 0OPPONENTS 69 2,714 39.3 10 24 75 0PASSING Att Comp Pct Yds LG TD Int QBGarcia, Jeff 375 225 60.0 2,544 62 11 11 77.9Stenstrom, Steve 100 54 54.0 536 32 0 4 52.8Young, Steve 84 45 53.6 446 53 3 4 60.9Rice, Jerry 1 0 0.0 0 0 0 0 39.649ERS 560 324 57.9 3,526 62 14 19 70.7OPPONENTS 521 317 60.8 4,295 80t 36 13 99.8
TEAM STATISTICS 49ers OppTOTAL FIRST DOWNS 300 315 By Rushing 102 91 By Passing 172 192 By Penalties 26 32TOTAL YARDS GAINED 5,380 5,687 By Rushing 2,085 1,619 By Passing 3,295 4,068TOTAL PLAYS FROM SCRIMMAGE 1,012 979 Rushes 419 426 Average Gain Per Rush 5.0 3.8NET YARDS PASSING 3,295 4,068 Passes Attempted 560 521 Passes Completed 324 317 Percent Completed 57.9 60.8 Had Intercepted 19 13 Times Sacked 34 32 Lost Attempting to Pass 241 227PUNTS 73 69 Total Yardage of Punts 2,883 2,712 Average Length 39.5 39.3KICKOFF RETURNS 77 47 Total Yards Returned 1,579 1,093 Average Length of Return 20.5 23.3PENALTIES 120 96 Yards Penalized 1,045 760FUMBLES 29 18 Own Fumbles Recovered 16 11 Opponents’ Fumbles Recovered 7 13FIELD GOALS 21 27 Field Goals Attempted 23 32TOTAL POINTS SCORED 295 453 Touchdowns Scored 33 53 Touchdowns Rushing 14 11 Touchdowns Passing 14 36 Touchdown Returns 5 6 Extra Points 30 50 Safeties 1 1AVG. TIME OF POSSESSION 30:17 29:43
SCORING TDs Ru Pa Int Fu KO Pu PAT FG S PtsRichey, Wade 0 0 0 0 0 0 0 30/31 21/23 0 93Garner, Charlie 6 4 2 0 0 0 0 0/0 0/0 0 36Rice, Jerry 5 0 5 0 0 0 0 0/0 0/0 0 30Beasley, Fred 4 4 0 0 0 0 0 0/0 0/0 0 24Owens, Terrell 4 0 4 0 0 0 0 0/0 0/0 0 24Stokes, J.J. 3 0 3 0 0 0 0 0/0 0/0 0 20Garcia, Jeff 2 2 0 0 0 0 0 0/0 0/0 0 12Phillips, Lawrence 2 2 0 0 0 0 0 0/0 0/0 0 12Walker, Darnell 2 0 0 1 1 0 0 0/0 0/0 0 12Bryant, Junior 1 0 0 0 1 0 0 0/0 0/0 0 6Jervey, Travis 1 1 0 0 0 0 0 0/0 0/0 0 6McMillian, Mark 1 0 0 0 1 0 0 0/0 0/0 0 6Schulters, Lance 1 0 0 1 0 0 0 0/0 0/0 0 6Vardell,Tommy 1 1 0 0 0 0 0 0/0 0/0 0 6
(continued)
Rookie Names in Italics

SAN FRANCISCO 49ERS
M E D I A G U I D E2 0 1 7 S E A S O N 481
2000 (6-10)Steve Mariucci, Coach
L 28 at Atlanta (54,626), S-3 36L 22 Carolina (66,879), S-10 38L 24 at St. Louis (65,945), S-17 41W 41 at Dallas (64,127), S-24 24W 27 Arizona (66,985), O-1 20L 28 Oakland (68,344), O-8 (OT) 34L 28 at Green Bay (59,870), O-15 31L 16 at Carolina (73,169), O-22 34L 24 St. Louis (68,109), O-29 34L 15 at New Orleans (64,900), N-5 31W 21 Kansas City (68,002), N-12 7W 16 Atlanta (67,447), N-19 6- - BYE, N-26 -W 45 at San Diego (57,255), D-3 17L 27 New Orleans (67,892), D-10 31W 17 Chicago (68,306), D-17 0L 9 at Denver (76,098), D-23 38 388 422
RUSHING Att Yds Avg LG TDGarner, Charlie 258 1,142 4.4 42 7Garcia, Jeff 72 414 5.8 33 4Beasley, Fred 50 147 2.9 9 3Smith, Paul 18 72 4.0 14 0Owens, Terrell 3 11 3.7 5 0Jackson, Terry 5 6 1.2 3 1Lewis, Jonas 1 6 6.0 6 0Stokes, J.J. 1 6 6.0 6 0Jervey, Travis 1 0 0.0 0 0Mirer, Rick 3 0 0.0 3 0Streets, Tai 1 0 0.0 0 0Rattay, Tim 2 -1 -0.5 0 0Rice, Jerry 1 -2 -2.0 -2 049ERS 416 1,801 4.3 42 15OPPONENTS 435 1,794 4.1 31 22
RECEIVING No Yds Avg LG TDOwens, Terrell 97 1,451 15.0 69t 13Rice, Jerry 75 805 10.7 68t 7Garner, Charlie 68 647 9.5 62 3Clark, Greg 38 342 9.0 34 2Beasley, Fred 31 233 7.5 34 3Stokes, J.J. 30 524 17.5 53 3Streets, Tai 19 287 15.1 39 0Jackson, Terry 5 48 9.6 16 1Smith, Paul 2 55 27.5 47 0Swift, Justin 1 8 8.0 8 049ERS 366 4,400 12.0 69t 32OPPONENTS 320 4,185 13.1 78t 25
INTERCEPTIONS No Yds Avg LG TDBronson, Zack 3 75 25.0 43 0Montgomery, Monty 3 68 22.7 46t 1Webster, Jason 2 78 39.0 70t 1Peterson, Julian 2 33 16.5 31 0Prioleau, Pierson 1 13 13.0 13 0Tubbs, Winfred 1 11 11.0 11 0Keith, John 1 0 0.0 0 049ERS 13 278 21.4 70t 2OPPONENTS 10 94 9.4 36t 2
KICKOFF RETURNS No Yds Avg LG TDWilliams, Kevin 30 536 17.9 33 0Lewis, Jonas 9 168 18.7 26 0Smith, Paul 9 167 18.6 28 0Jervey, Travis 8 209 26.1 68 0Streets, Tai 8 180 22.5 37 0Jackson, Terry 1 9 9.0 19 0Milem, John 1 13 13.0 13 0Okeafor, Chike 1 17 17.0 17 0Plummer, Ahmed 1 0 0.0 0 049ERS 68 1,299 19.1 68 0OPPONENTS 63 1,358 21.6 57 0
PUNT RETURNS No FC Yds Avg LG TDWilliams, Kevin 26 13 220 8.5 25 049ERS 26 13 220 8.5 25 0OPPONENTS 32 20 332 10.4 47 0
PUNTING No Yds Avg TB I-20 LG BlkStanley, Chad 69 2,727 39.5 7 15 56 149ERS 70 2,727 39.0 7 15 56 1OPPONENTS 65 2,773 42.7 10 16 66 0
PASSING Att Comp Pct Yds LG TD Int QBGarcia, Jeff 561 355 63.3 4,278 69t 31 10 97.6Mirer, Rick 20 10 50.0 126 26 1 0 86.7Rattay, Tim 1 1 100.0 -4 -4 0 0 79.2Rice, Jerry 1 0 0.0 0 0 0 0 39.649ERS 583 366 62.8 4,400 69t 32 10 97.0OPPONENTS 558 320 57.4 4,185 78t 25 13 86.4
TEAM STATISTICS 49ers OppTOTAL FIRST DOWNS 334 347 By Rushing 98 110 By Passing 211 194 By Penalties 25 43TOTAL YARDS GAINED 6,040 5,709 By Rushing 1,801 1,794 By Passing 4,239 3,915TOTAL PLAYS FROM SCRIMMAGE 1,024 1,031 Rushes 416 435 Average Gain Per Rush 4.3 4.1NET YARDS PASSING 4,239 3,915 Passes Attempted 583 558 Passes Completed 366 320 Percent Completed 62.8 57.4 Had Intercepted 10 13 Times Sacked 25 38 Lost Attempting to Pass 161 270PUNTS 70 65 Total Yardage of Punts 2,727 2,773 Average Length 39.0 42.7KICKOFF RETURNS 68 63 Total Yards Returned 1,299 1,358 Average Length of Return 19.1 21.6PENALTIES 134 102 Yards Penalized 1,135 857FUMBLES 22 19 Own Fumbles Recovered 13 8 Opponents’ Fumbles Recovered 11 9FIELD GOALS 15 26 Field Goals Attempted 22 31TOTAL POINTS SCORED 388 422 Touchdowns Scored 49 49 Touchdowns Rushing 15 22 Touchdowns Passing 32 25 Touchdown Returns 2 2 Extra Points 43 46 Safeties 0 0AVG. TIME OF POSSESSION 29:38 30:22
SCORING TDs Ru Pa Int Fu KO Pu PAT FG S PtsRichey, Wade 0 0 0 0 0 0 0 43/45 15/22 0 88Owens, Terrell 13 0 13 0 0 0 0 0/0 0/0 0 80Garner, Charlie 10 7 3 0 0 0 0 0/0 0/0 0 60Rice, Jerry 7 0 7 0 0 0 0 0/0 0/0 0 42Beasley, Fred 6 3 3 0 0 0 0 0/0 0/0 0 36Garcia, Jeff 4 4 0 0 0 0 0 0/0 0/0 0 24Stokes, J.J. 3 0 3 0 0 0 0 0/0 0/0 0 20Jackson, Terry 2 1 1 0 0 0 0 0/0 0/0 0 14Clark, Greg 2 0 2 0 0 0 0 0/0 0/0 0 12Montgomery, M. 1 0 0 1 0 0 0 0/0 0/0 0 6Webster, Jason 1 0 0 1 0 0 0 0/0 0/0 0 649ERS 49 15 32 2 0 0 0 43/45 15/22 0 388OPPONENTS 49 22 25 2 0 0 0 46/46 26/31 0 4222-pt. conversions: T. Jackson, T. Owens, J.J. Stokes Team: 3-4, Opponents: 2-2
Rookie Names in Italics

SAN FRANCISCO 49ERS
M E D I A G U I D E2 0 1 7 S E A S O N 482
2001 (12-4/12-5)Steve Mariucci, Coach
W 16 Atlanta (65,989), S-9 (OT) 13L 26 St. Louis (67,536), S-23 30W 19 at New York Jets (78,722), MON/O-1 17W 24 Carolina (66,944), SUN/O-7 14W 37 at Atlanta (48,100), O-14 (OT) 31- - BYE, O-21 -L 31 at Chicago (66,944), O-28 (OT) 37W 21 Detroit (67,605), N-4 13W 28 New Orleans (68,083), N-11 27W 25 at Carolina (72,665), N-18 (OT) 22W 40 at Indianapolis (56,393), N-25 21W 35 Buffalo (67,252), SUN/D-2 0L 14 at St. Louis (66,218),D-9 27W 21 Miami (68,223), D-16 0W 13 Philadelphia (68,124), D-22 3L 21 at Dallas (64,366), D-30 27W 38 at New Orleans (70,020), J-6 0 409 282
NFC WILD CARD - JAN. 13(at Green Bay - Lambeau Field)
L 15 at Green Bay (59,825) 25
SCORING TDs Ru Pa Int Fu KO Pu PAT FG S PtsBeasley, Fred 1 1 0 0 0 0 0 0/0 0/0 0 6Peterson, Julian 1 0 0 0 1 0 0 0/0 0/0 0 6Smith, Paul 1 1 0 0 0 0 0 0/0 0/0 0 6Streets, Tai 1 0 1 0 0 0 0 0/0 0/0 0 6Swift, Justin 1 0 1 0 0 0 0 0/0 0/0 0 649ERS 51 16 32 2 1 0 0 47/47 18/25 0 409 OPPONENTS 30 9 18 3 0 0 0 23/23 23/27 1 282 2-pt conversions: E. Johnson Team: 1-3, Opponents: 4-6
RUSHING Att Yds Avg LG TDHearst, Garrison 252 1,206 4.8 43t 4Barlow, Kevan 125 512 4.1 25 4Garcia, Jeff 72 254 3.5 25 5Jackson, Terry 22 138 6.3 15 1Beasley, Fred 23 73 3.2 16 1Smith, Paul 4 27 6.8 13t 1Owens, Terrell 4 21 5.3 12 0Sutherland, Vinny 1 16 16.0 16 0Baker, Jason 1 0 0.0 0 0Rattay, Tim 5 -3 -0.6 1 049ERS 509 2,244 4.4 43t 16 OPPONENTS 389 1,571 4.0 39 9
RECEIVING No Yds Avg Long TDOwens, Terrell 93 1,412 15.2 60t 16Stokes, J.J. 54 585 10.8 47 7Hearst, Garrison 41 347 8.5 60t 1Johnson, Eric 40 362 9.1 24 3Streets, Tai 28 345 12.3 52 1Barlow, Kevan 22 247 11.2 61t 1Beasley, Fred 16 99 6.2 15 0Jackson, Terry 12 91 7.6 14 2Swift, Justin 11 66 6.0 13 1Sutherland, Vinny 1 5 5.0 5 049ERS 318 3,559 11.2 61t 32 OPPONENTS 332 3,603 10.9 63 18
INTERCEPTIONS No Yds Avg Long TDBronson, Zack 7 165 23.6 97t 2Plummer Ahmed 7 45 6.4 24 0Webster, Jason 3 61 20.3 31 0Schulters, Lance 3 0 0.0 0 0Winborn, Jamie 2 40 20.0 29 0Holman, Rashad 1 19 19.0 19 0Smith, Derek 1 0 0.0 0 049ERS 24 330 13.8 97t 2 OPPONENTS 12 232 19.3 74t 3
KICKOFF RETURNS No Yds Avg Long TDSutherland, Vinny 50 1,140 22.8 65 0Wilson, Cedrick 6 127 21.2 34 0Smith, Paul 3 37 12.3 16 0Lewis, Jonas 2 32 16.0 19 049ERS 61 1,336 21.9 65 0OPPONENTS 68 1,408 20.7 46 0
PUNT RETURNS No FC Yds Avg LG TDSutherland, Vinny 21 19 147 7.0 19 0Wilson, Cedrick 2 0 4 2.0 3 049ERS 23 19 151 6.6 19 0 OPPONENTS 34 14 290 8.5 34 0
PUNTING No Yds Avg TB I-20 LG BlkBaker, Jason 69 2,813 40.8 4 21 64 0 49ERS 69 2,813 40.8 4 21 64 0OPPONENTS 72 2,981 41.4 12 25 68 1
PASSING Att Comp Pct Yds LG TD Int QBGarcia, Jeff 504 316 62.7 3,538 61t 32 12 94.8Rattay, Tim 2 2 100.0 21 20 0 0 110.449ERS 506 318 62.8 3,559 61t 32 12 95.0OPPONENTS 567 332 58.6 3,603 63 18 24 70.3
TEAM STATISTICS 49ers OppTOTAL FIRST DOWNS 328 289 By Rushing 121 89 By Passing 184 179 By Penalties 23 21TOTAL YARDS GAINED 5,689 4,954 By Rushing 2,244 1,571 By Passing 3,445 3,383TOTAL PLAYS FROM SCRIMMAGE 1,041 988 Rushes 509 389 Average Gain Per Rush 4.3 4.1NET YARDS PASSING 3,445 3,383 Passes Attempted 506 567 Passes Completed 318 332 Percent Completed 62.8 58.6 Had Intercepted 12 24 Times Sacked 26 32 Lost Attempting to Pass 114 220PUNTS 69 72 Total Yardage of Punts 2,813 2,981 Average Length 40.8 41.4KICKOFF RETURNS 61 68 Total Yards Returned 1,336 1,408 Average Length of Return 21.9 20.7PENALTIES 82 95 Yards Penalized 669 812FUMBLES 19 24 Own Fumbles Recovered 12 14 Opponents’ Fumbles Recovered 10 7FIELD GOALS 18 23 Field Goals Attempted 25 27TOTAL POINTS SCORED 409 282 Touchdowns Scored 51 30 Touchdowns Rushing 16 9 Touchdowns Passing 32 18 Touchdown Returns 3 3 Extra Points 47 23 Safeties 0 1AVG. TIME OF POSSESSION 31:49 28:11
SCORING TDs Ru Pa Int Fu KO Pu PAT FG S PtsCortez, Jose 0 0 0 0 0 0 0 47/47 18/25 0 101Owens, Terrell 16 0 16 0 0 0 0 0/0 0/0 0 96Stokes, J.J. 7 0 7 0 0 0 0 0/0 0/0 0 42Barlow, Kevan 5 4 1 0 0 0 0 0/0 0/0 0 30Garcia, Jeff 5 5 0 0 0 0 0 0/0 0/0 0 30Hearst, Garrison 5 4 1 0 0 0 0 0/0 0/0 0 30Johnson, Eric 3 0 3 0 0 0 0 0/0 0/0 0 20Jackson, Terry 3 1 2 0 0 0 0 0/0 0/0 0 18Bronson, Zack 2 0 0 2 0 0 0 0/0 0/0 0 12
(continued)
Rookie Names in Italics
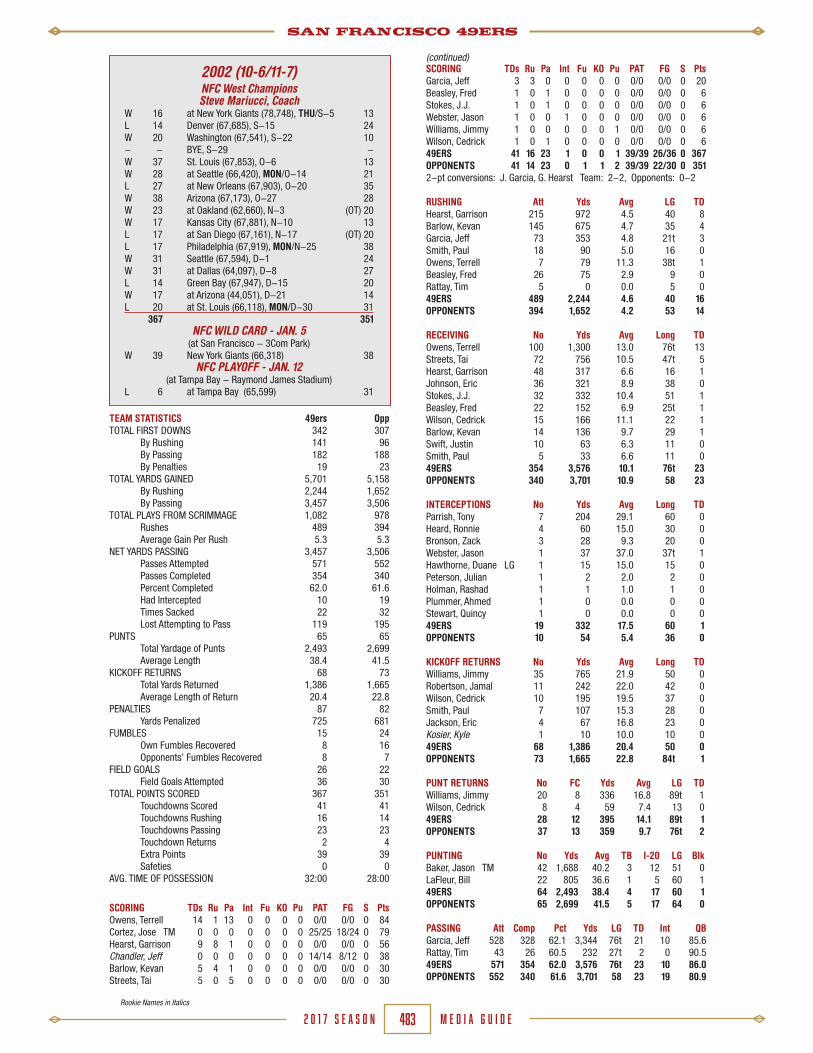
SAN FRANCISCO 49ERS
M E D I A G U I D E2 0 1 7 S E A S O N 483
2002 (10-6/11-7)NFC West ChampionsSteve Mariucci, Coach
W 16 at New York Giants (78,748), THU/S-5 13L 14 Denver (67,685), S-15 24W 20 Washington (67,541), S-22 10- - BYE, S-29 -W 37 St. Louis (67,853), O-6 13W 28 at Seattle (66,420), MON/O-14 21L 27 at New Orleans (67,903), O-20 35W 38 Arizona (67,173), O-27 28W 23 at Oakland (62,660), N-3 (OT) 20W 17 Kansas City (67,881), N-10 13L 17 at San Diego (67,161), N-17 (OT) 20L 17 Philadelphia (67,919), MON/N-25 38W 31 Seattle (67,594), D-1 24W 31 at Dallas (64,097), D-8 27L 14 Green Bay (67,947), D-15 20W 17 at Arizona (44,051), D-21 14L 20 at St. Louis (66,118), MON/D-30 31 367 351
NFC WILD CARD - JAN. 5(at San Francisco - 3Com Park)
W 39 New York Giants (66,318) 38NFC PLAYOFF - JAN. 12
(at Tampa Bay - Raymond James Stadium)L 6 at Tampa Bay (65,599) 31
SCORING TDs Ru Pa Int Fu KO Pu PAT FG S PtsGarcia, Jeff 3 3 0 0 0 0 0 0/0 0/0 0 20Beasley, Fred 1 0 1 0 0 0 0 0/0 0/0 0 6Stokes, J.J. 1 0 1 0 0 0 0 0/0 0/0 0 6Webster, Jason 1 0 0 1 0 0 0 0/0 0/0 0 6Williams, Jimmy 1 0 0 0 0 0 1 0/0 0/0 0 6Wilson, Cedrick 1 0 1 0 0 0 0 0/0 0/0 0 649ERS 41 16 23 1 0 0 1 39/39 26/36 0 367 OPPONENTS 41 14 23 0 1 1 2 39/39 22/30 0 3512-pt conversions: J. Garcia, G. Hearst Team: 2-2, Opponents: 0-2
RUSHING Att Yds Avg LG TDHearst, Garrison 215 972 4.5 40 8Barlow, Kevan 145 675 4.7 35 4Garcia, Jeff 73 353 4.8 21t 3Smith, Paul 18 90 5.0 16 0Owens, Terrell 7 79 11.3 38t 1Beasley, Fred 26 75 2.9 9 0Rattay, Tim 5 0 0.0 5 049ERS 489 2,244 4.6 40 16 OPPONENTS 394 1,652 4.2 53 14
RECEIVING No Yds Avg Long TDOwens, Terrell 100 1,300 13.0 76t 13Streets, Tai 72 756 10.5 47t 5Hearst, Garrison 48 317 6.6 16 1Johnson, Eric 36 321 8.9 38 0Stokes, J.J. 32 332 10.4 51 1Beasley, Fred 22 152 6.9 25t 1Wilson, Cedrick 15 166 11.1 22 1Barlow, Kevan 14 136 9.7 29 1Swift, Justin 10 63 6.3 11 0Smith, Paul 5 33 6.6 11 049ERS 354 3,576 10.1 76t 23 OPPONENTS 340 3,701 10.9 58 23
INTERCEPTIONS No Yds Avg Long TDParrish, Tony 7 204 29.1 60 0Heard, Ronnie 4 60 15.0 30 0Bronson, Zack 3 28 9.3 20 0Webster, Jason 1 37 37.0 37t 1Hawthorne, Duane LG 1 15 15.0 15 0Peterson, Julian 1 2 2.0 2 0Holman, Rashad 1 1 1.0 1 0Plummer, Ahmed 1 0 0.0 0 0Stewart, Quincy 1 0 0.0 0 049ERS 19 332 17.5 60 1 OPPONENTS 10 54 5.4 36 0
KICKOFF RETURNS No Yds Avg Long TDWilliams, Jimmy 35 765 21.9 50 0Robertson, Jamal 11 242 22.0 42 0Wilson, Cedrick 10 195 19.5 37 0Smith, Paul 7 107 15.3 28 0Jackson, Eric 4 67 16.8 23 0Kosier, Kyle 1 10 10.0 10 049ERS 68 1,386 20.4 50 0OPPONENTS 73 1,665 22.8 84t 1
PUNT RETURNS No FC Yds Avg LG TDWilliams, Jimmy 20 8 336 16.8 89t 1Wilson, Cedrick 8 4 59 7.4 13 049ERS 28 12 395 14.1 89t 1 OPPONENTS 37 13 359 9.7 76t 2
PUNTING No Yds Avg TB I-20 LG BlkBaker, Jason TM 42 1,688 40.2 3 12 51 0LaFleur, Bill 22 805 36.6 1 5 60 149ERS 64 2,493 38.4 4 17 60 1OPPONENTS 65 2,699 41.5 5 17 64 0
PASSING Att Comp Pct Yds LG TD Int QBGarcia, Jeff 528 328 62.1 3,344 76t 21 10 85.6Rattay, Tim 43 26 60.5 232 27t 2 0 90.549ERS 571 354 62.0 3,576 76t 23 10 86.0OPPONENTS 552 340 61.6 3,701 58 23 19 80.9
TEAM STATISTICS 49ers OppTOTAL FIRST DOWNS 342 307 By Rushing 141 96 By Passing 182 188 By Penalties 19 23TOTAL YARDS GAINED 5,701 5,158 By Rushing 2,244 1,652 By Passing 3,457 3,506TOTAL PLAYS FROM SCRIMMAGE 1,082 978 Rushes 489 394 Average Gain Per Rush 5.3 5.3NET YARDS PASSING 3,457 3,506 Passes Attempted 571 552 Passes Completed 354 340 Percent Completed 62.0 61.6 Had Intercepted 10 19 Times Sacked 22 32 Lost Attempting to Pass 119 195PUNTS 65 65 Total Yardage of Punts 2,493 2,699 Average Length 38.4 41.5KICKOFF RETURNS 68 73 Total Yards Returned 1,386 1,665 Average Length of Return 20.4 22.8PENALTIES 87 82 Yards Penalized 725 681FUMBLES 15 24 Own Fumbles Recovered 8 16 Opponents’ Fumbles Recovered 8 7 FIELD GOALS 26 22 Field Goals Attempted 36 30TOTAL POINTS SCORED 367 351 Touchdowns Scored 41 41 Touchdowns Rushing 16 14 Touchdowns Passing 23 23 Touchdown Returns 2 4 Extra Points 39 39 Safeties 0 0AVG. TIME OF POSSESSION 32:00 28:00
SCORING TDs Ru Pa Int Fu KO Pu PAT FG S PtsOwens, Terrell 14 1 13 0 0 0 0 0/0 0/0 0 84Cortez, Jose TM 0 0 0 0 0 0 0 25/25 18/24 0 79Hearst, Garrison 9 8 1 0 0 0 0 0/0 0/0 0 56Chandler, Jeff 0 0 0 0 0 0 0 14/14 8/12 0 38Barlow, Kevan 5 4 1 0 0 0 0 0/0 0/0 0 30Streets, Tai 5 0 5 0 0 0 0 0/0 0/0 0 30
(continued)
Rookie Names in Italics

SAN FRANCISCO 49ERS
M E D I A G U I D E2 0 1 7 S E A S O N 484
2003 (7-9)Dennis Erickson, Coach
W 49 Chicago (67,554), S-7 7L 24 at St. Louis (65,990), S-14 (OT) 27L 12 Cleveland (67,412), S-21 13L 7 at Minnesota (64,111), S-28 35W 24 Detroit (67,365), O-5 17L 19 at Seattle (66,437), SUN/O-12 20W 24 Tampa Bay (67,809), O-19 7L 13 at Arizona (40,824), O-26 (OT) 16W 30 St. Louis (67,812), N-2 10- - BYE, N-9 -W 30 Pittsburgh (67,877), MON/N-17 14L 10 at Green Bay (70,250), N-23 20L 6 at Baltimore (69,549), N-30 44W 50 Arizona (66,975), D-7 14L 38 at Cincinnati (64,666), D-14 41W 31 at Philadelphia (67,866), D-21 (OT) 28L 17 Seattle (67,840), D-27 24 384 337
SCORING TDs Ru Pa Int Fu KO Pu PAT FG S PtsWalker, Aaron 1 0 1 0 0 0 0 0/0 0/0 0 6Weaver, Jed 1 0 1 0 0 0 0 0/0 0/0 0 6Ulbrich, Jeff 0 0 0 0 0 0 0 0/0 0/0 1 249ERS 44 16 25 2 0 1 0 38/41 26/37 1 384 OPPONENTS 41 13 25 3 0 0 0 40/40 17/26 0 3372-pt conversions: B. Lloyd Team: 1-3, Opponents: 0-1
RUSHING Att Yds Avg LG TDBarlow, Kevan 201 1,024 5.1 78t 6Hearst, Garrison 178 768 4.3 36 3Garcia, Jeff 56 319 5.7 21t 7Robertson, Jamal 32 136 4.3 23 0Beasley, Fred 17 24 1.4 5 0Battle, Arnaz 2 14 7.0 9 0LaFleur, Bill 1 0 0.0 0 0Rattay, Tim 8 0 0.0 6 0Owens, Terrell 3 -2 -.7 3 0Wilson, Cedrick 1 -4 -4.0 -4 049ERS 499 2,279 4.6 78t 16 OPPONENTS 420 1,690 4.0 49t 13
RECEIVING No Yds Avg Long TDOwens, Terrell 80 1,102 13.8 75t 9Streets, Tai 47 595 12.7 41t 7Weaver, Jed 35 437 12.5 30 1Wilson, Cedrick 35 396 11.3 29 2Barlow, Kevan 35 307 8.8 48 1Hearst, Garrison 25 211 8.4 26 1Beasley, Fred 19 184 9.7 32 1Lloyd, Brandon 14 212 15.1 44 2Walker, Aaron 8 116 14.5 26 1Garcia, Jeff 1 6 6.0 6 049ERS 299 3,566 11.9 75t 25 OPPONENTS 310 3,544 11.4 75t 25
INTERCEPTIONS No Yds Avg Long TDParrish, Tony 9 202 22.4 49 0Plummer, Ahmed 4 85 21.3 68t 1Rumph, Mike 3 19 6.3 12 0Peterson, Julian 2 31 15.5 31 0Bronson, Zack 1 22 22.0 22 0Webster, Jason 1 17 17.0 17 0Ulbrich, Jeff 1 7 7.0 7 0Williams, Jimmy 1 6 6.0 6 0Heard, Ronnie 1 0 0.0 0 049ERS 23 389 16.9 68t 1 OPPONENTS 15 291 19.4 65 1
KICKOFF RETURNS No Yds Avg Long TDWilson, Cedrick 37 836 22.6 95t 1Williams, Jimmy 11 207 18.8 41 0Bruce, Arland 6 125 20.8 29 0Battle, Arnaz 5 88 17.6 21 0Lloyd, Brandon 2 32 16.0 21 0Moran, Sean 2 35 17.5 19 0Gutierrez, Brock 1 4 4.0 4 049ERS 64 1,327 20.7 95t 1OPPONENTS 77 1,641 21.3 75 0
PUNT RETURNS No FC Yds Avg LG TDWilliams, Jimmy 35 10 240 6.9 20 0Bruce, Arland 4 2 24 6.0 18 0Wilson, Cedrick 1 3 12 12.0 12 049ERS 40 15 276 6.9 20 0 OPPONENTS 28 15 258 9.2 81t 1
PUNTING No Yds Avg TB I-20 LG BlkLaFleur, Bill 68 2,629 38.7 3 17 56 149ERS 68 2,629 38.1 3 17 56 1OPPONENTS 76 2,975 39.1 3 16 58 1
PASSING Att Comp Pct Yds LG TD Int QBGarcia, Jeff 392 225 57.4 2,704 75t 18 13 80.1Rattay, Tim 118 73 61.9 856 61t 7 2 96.6Wilson, Cedrick 1 1 100.0 6 6 0 0 91.749ERS 511 299 58.5 3,566 75t 25 15 84.0OPPONENTS 514 310 60.3 3,544 75t 25 23 78.6
TEAM STATISTICS 49ers OppTOTAL FIRST DOWNS 313 292 By Rushing 118 99 By Passing 172 165 By Penalties 23 28TOTAL YARDS GAINED 5,687 4,928 By Rushing 2,279 1,690 By Passing 3,408 3,238TOTAL PLAYS FROM SCRIMMAGE 1,038 976 Rushes 499 420 Average Gain Per Rush 5.5 5.0NET YARDS PASSING 3,408 3,238 Passes Attempted 511 514 Passes Completed 299 310 Percent Completed 58.5 60.3 Had Intercepted 15 23 Times Sacked 28 32 Lost Attempting to Pass 158 195PUNTS 69 76 Total Yardage of Punts 2,629 2,975 Average Length 38.1 39.1KICKOFF RETURNS 64 77 Total Yards Returned 1,327 1,641 Average Length of Return 20.7 21.3PENALTIES 104 78 Yards Penalized 807 720FUMBLES 24 23 Own Fumbles Recovered 14 9 Opponents’ Fumbles Recovered 14 10FIELD GOALS 26 17 Field Goals Attempted 37 26TOTAL POINTS SCORED 384 337 Touchdowns Scored 44 41 Touchdowns Rushing 16 13 Touchdowns Passing 25 25 Touchdown Returns 3 3 Extra Points 38 40 Safeties 1 0AVG. TIME OF POSSESSION 30:54 29:06
SCORING TDs Ru Pa Int Fu KO Pu PAT FG S PtsPeterson, Todd 0 0 0 0 0 0 0 22/23 12/15 0 58Owens, Terrell 9 0 9 0 0 0 0 0/0 0/0 0 54Barlow, Kevan 7 6 1 0 0 0 0 0/0 0/0 0 42Garcia, Jeff 7 7 0 0 0 0 0 0/0 0/0 0 42Streets, Tai 7 0 7 0 0 0 0 0/0 0/0 0 42Pochman, Owen 0 0 0 0 0 0 0 9/10 8/15 0 33Chandler, Jeff 0 0 0 0 0 0 0 7/8 6/7 0 25Hearst, Garrison 4 3 1 0 0 0 0 0/0 0/0 0 24Wilson, Cedrick 3 0 2 0 0 1 0 0/0 0/0 0 18Lloyd, Brandon 2 0 2 0 0 0 0 0/0 0/0 0 14Beasley, Fred 1 0 1 0 0 0 0 0/0 0/0 0 6Harris, Kwame 1 0 0 1 0 0 0 0/0 0/0 0 6Plummer, Ahmed 1 0 0 1 0 0 0 0/0 0/0 0 6
(continued)
Rookie Names in Italics

SAN FRANCISCO 49ERS
M E D I A G U I D E2 0 1 7 S E A S O N 485
2004 (2-14)Dennis Erickson, Coach
L 19 Atlanta (65,584), S-12 21L 27 at New Orleans (64,900), S-19 30L 0 at Seattle (66,709), S-26 34L 14 St. Louis (66,696), SUN/O-3 24W 31 Arizona (62,836), O-10 (OT) 28L 14 at New York Jets (78,189), O-17 22- - BYE, O-24 -L 13 at Chicago (62,054), SUN/O-31 23L 27 Seattle (64,423), N-7 42L 27 Carolina (63,618), N-14 37L 3 at Tampa Bay (65,234), N-21 35L 17 Miami (66,156), N-28 24L 6 at St. Louis (65,793), D-5 16W 31 at Arizona (35,069), D-12 (OT) 28L 16 Washington (65,710), SAT/D-19 26L 7 Buffalo (63,248), D-26 41L 7 at New England (68,756), J-2 21 259 452
RUSHING No Yds Avg Long TDBarlow, Kevan 244 822 3.4 60 7Hicks, Maurice 96 362 3.8 35 2Jackson, Terry 26 101 3.9 13 0Robertson, Jamal TM 16 71 4.4 16 1Rattay, Tim 12 55 4.6 15 0Beasley, Fred 9 15 1.7 4 0Dorsey, Ken 5 7 1.4 3 0Wilson, Cedrick 1 6 6.0 6 0Battle, Arnaz 2 5 2.5 7 0Pickett, Cody 1 5 5.0 5 0Isom, Jasen 1 0 0.0 0 049ERS 413 1,449 3.5 60 10OPPONENTS 495 1,995 4.0 29 22
RECEIVING No Yds Avg Long TDJohnson, Eric 82 825 10.1 25 2Wilson, Cedrick 47 641 13.6 39 3Lloyd, Brandon 43 565 13.1 52 6Conway, Curtis 38 403 10.6 37 3Barlow, Kevan 35 212 6.1 15 0Jackson, Terry 21 139 6.6 22 0Hicks, Maurice 16 154 9.6 19 0Walker, Aaron 10 115 11.5 30 0Beasley, Fred 10 44 4.4 9 0Battle, Arnaz 8 143 17.9 65 0Woods, Rashaun 7 160 22.9 59 1Robertson, Jamal TM 4 34 8.5 14 0Bush, Steve LG 2 10 5.0 6 1Bush, Steve TM 2 10 5.0 6 1Ware, Kevin 1 9 9.0 9 0Isom, Jasen 1 1 1.0 1 049ERS 325 3,455 10.6 65 16OPPONENTS 308 3,680 11.9 60 27
INTERCEPTIONS No Yds Avg Long TDParrish, Tony 4 64 16.0 26 0Carpenter, Dwaine 1 31 31.0 31 0Ulbrich, Jeff 1 19 19.0 19 0Heard, Ronnie 1 14 14.0 14 0Winborn, Jamie 1 1 1.0 1 0Adams, Mike 1 0 0.0 0 049ERS 9 129 14.3 31 0OPPONENTS 21 479 22.8 85 4
KICKOFF RETURNS No Yds Avg Long TDHicks, Maurice 31 623 20.1 35 0Robertson, Jamal TM 25 560 22.4 37 0Battle, Arnaz 13 257 19.8 40 0Wilson, Cedrick 10 196 19.6 36 0Williams, Jimmy 3 58 19.3 23 0Jackson, Terry 2 22 11.0 14 049ERS 84 1,716 20.4 40 0OPPONENTS 56 1,119 20.0 73 0
PUNT RETURNS Ret FC Yds Avg Long TDBattle, Arnaz 31 20 266 8.6 71t 1Wilson, Cedrick 2 1 21 10.5 13 0Fleck, P.J. 1 0 10 10.0 10 0Peterson, Julian 1 0 6 6.0 6 049ERS 35 21 303 8.7 71t 1OPPONENTS 51 17 445 8.7 35 0
PUNTING No Yds Avg Net TB I-20 Lg BLee, Andy 96 3,990 41.6 35.3 8 25 81 049ERS 96 3,990 41.6 35.3 8 25 81 0OPPONENTS 79 3,268 40.9 35.8 5 28 61 1
PASSING Att Comp Pct Yds LG TD Int QBRattay, Tim 325 198 60.9 2,169 65 10 10 78.1Dorsey, Ken 226 123 54.4 1,231 59 6 9 62.4Pickett, Cody 10 4 40.0 55 18 0 2 18.849ERS 561 325 57.9 3,455 65 16 21 69.9OPPONENTS 490 308 62.9 3,680 60 27 9 96.5
TEAM STATISTICS 49ers OppTOTAL FIRST DOWNS 280 322 By Rushing 83 121 By Passing 172 179 By Penalties 25 22TOTAL YARDS GAINED 4,585 5,481 By Rushing 1,449 1,995 By Passing 3,136 3,486TOTAL PLAYS FROM SCRIMMAGE 1,026 1,014 Rushes 413 495 Average Gain Per Rush 4.5 5.4NET YARDS PASSING 3,136 3,486 Passes Attempted 561 490 Passes Completed 325 308 Percent Completed 57.9 62.9 Had Intercepted 21 9 Times Sacked 52 29 Lost Attempting to Pass 319 194PUNTS 96 80 Total Yardage of Punts 3,990 3,268 Average Length 41.6 40.9KICKOFF RETURNS 84 56 Total Yards Returned 1,716 1,119 Average Length of Return 20.4 20.0PENALTIES 103 107 Yards Penalized 859 867FUMBLES 33 24 Own Fumbles Recovered 14 12 Opponents’ Fumbles Recovered 12 19FIELD GOALS 18 25 Field Goals Attempted 22 29TOTAL POINTS SCORED 259 452 Touchdowns Scored 30 54 Touchdowns Rushing 10 22 Touchdowns Passing 17 27 Touchdown Returns 3 5 Extra Points 23 51 Safeties 1 0AVG. TIME OF POSSESSION 29:00 31:00SCORING TDs Ru Pa Int Fu KO Pu PAT FG S PtsPeterson, Todd 0 0 0 0 0 0 0 23/23 18/22 0 77Barlow, Kevan 7 7 0 0 0 0 0 0/0 0/0 0 42Lloyd, Brandon 6 0 6 0 0 0 0 0/0 0/0 0 38Conway, Curtis 3 0 3 0 0 0 0 0/0 0/0 0 20Wilson, Cedrick 3 0 3 0 0 0 0 0/0 0/0 0 18Hicks, Maurice 2 2 0 0 0 0 0 0/0 0/0 0 12Johnson, Eric 2 0 2 0 0 0 0 0/0 0/0 0 12Battle, Arnaz 1 0 0 0 0 1 0 0/0 0/0 0 6Bush, Steve LG 1 0 1 0 0 0 0 0/0 0/0 0 6Carpenter, Dwaine 1 0 0 0 0 1 0 0/0 0/0 0 6Robertson, Jamal TM 1 1 0 0 0 0 0 0/0 0/0 0 6Smith, Derek 1 0 0 0 0 1 0 0/0 0/0 0 6Woods, Rashaun 1 0 1 0 0 0 0 0/0 0/0 0 6Rattay, Tim 0 0 0 0 0 0 0 0/0 0/0 0 249ERS 30 10 17 0 0 3 0 23/23 18/22 1 259 OPPONENTS 54 22 27 0 0 5 0 51/51 25/29 0 4522-pt. conversions: C. Conway, B. Lloyd, T. RattayTeam: 3-6, Opponents: 1-3
Rookie Names in Italics

SAN FRANCISCO 49ERS
M E D I A G U I D E2 0 1 7 S E A S O N 486
2005 (4-12)Mike Nolan, Coach
W 28 St. Louis (67,918), S-11 25L 3 at Philadelphia (67,727), S-18 42L 31 Dallas (68,247), S-25 34L 14 at Arizona in MC (103,467), SUN/O-2 31L 3 Indianapolis (68,084), O-9 28- - BYE, O-16 -L 17 at Washington (90,224), O-23 52W 15 Tampa Bay (63,358), O-30 10L 6 New York Giants (63,820), N-6 24L 9 at Chicago (62,153), N-13 17L 25 Seattle (63,590), N-20 27L 22 at Tennessee (69,149), N-27 33L 10 Arizona (60,439), D-4 17L 3 at Seattle (66,690), D-11 41L 9 at Jacksonville (64,764), D-18 10W 24 at St. Louis (65,473), D-24 20W 20 Houston (67,970), J-1 (OT) 17 239 428
SCORING TDs Ru Pa Int Fu KO Pu PAT FG S PtsCortez, Jose TM 0 0 0 0 0 0 0 2/2 0/1 0 2Jackson, Terry 0 0 0 0 0 0 0 0/0 0/0 0 249ERS 23 9 8 3 2 0 1 21/21 26/29 0 239 OPPONENTS* 49 19 28 1 0 0 0 43/44 29/36 0 4282-pt conversions: Jackson, Team: 1-2, Opponents: 2-5*ret blkd FGA
RUSHING No Yds Avg Long TDGore, Frank 127 608 4.8 72t 3Barlow, Kevan 176 581 3.3 29 3Hicks, Maurice 59 308 5.2 73t 3Smith, Alex 30 103 3.4 19 0Pickett, Cody 13 42 3.2 12 0Rattay, Tim TM 7 18 2.6 13 0Battle, Arnaz 8 11 1.4 9 0Dorsey, Ken 4 11 2.8 6 0Jackson, Terry 2 11 5.5 11 0Hetherington, Chris 1 3 3.0 3 0Marshall, Rasheed 1 -7 -7.0 -7 049ERS 428 1,689 3.9 73t 9OPPONENTS 486 1,832 3.8 40 19
RECEIVING No Yds Avg Long TDLloyd, Brandon 48 733 15.3 89t 5Battle, Arnaz 32 363 11.3 39 3Barlow, Kevan 31 241 7.8 24 0Morton, Johnnie 21 288 13.7 30 0Gore, Frank 15 131 8.7 47 0Hicks, Maurice 12 47 3.9 11 0Jackson, Terry 10 67 6.7 12 0Jones, Terry LG 9 76 8.4 21 0Jones, Terry TM 9 76 8.4 21 0McAddley, Jason 7 125 17.9 38 0Bajema, Billy 5 54 10.8 24 0Hetherington, Chris 5 26 5.2 11 0Bush, Steve 3 21 7.0 10 0Smith, Trent 3 7 2.3 6 0Beasley, Fred 2 12 6.0 6 0Marshall, Rasheed 1 -1 -1.0 -1 049ERS 204 2,190 10.7 89t 8OPPONENTS 374 4,620 12.4 78t 28
INTERCEPTIONS No Yds Avg Long TDSpencer, Shawntae 4 85 21.3 61t 1Adams, Mike 4 36 9.0 40t 1Parrish, Tony 2 34 17.0 34t 1Thornton, Bruce 2 0 0.0 0 0Emanuel, Ben 1 38 38.0 35 0Smith, Derek 1 13 13.0 13 0Moore, Brandon 1 12 12.0 12 0Lewis, Keith 1 2 2.0 2 049ERS 16 220 13.8 61t 3OPPONENTS 21 265 12.6 34 1
KICKOFF RETURNS No Yds Avg Long TDHicks, Maurice 34 689 20.3 40 0Marshall, Rasheed 26 488 18.8 29 0Amey, Fred 14 241 17.2 25 0McAddley, Jason 7 122 17.4 22 049ERS 81 1,540 19.0 40 0OPPONENTS 48 960 20.0 35 0
PUNT RETURNS Ret FC Yds Avg Long TDMarshall, Rasheed 17 10 87 5.1 13 0Amey, Fred 11 2 125 11.4 75t 149ERS 28 12 212 7.6 75t 1OPPONENTS 62 20 471 7.6 25 0
PUNTING No Yds Avg Net TB I-20 Lg BLee, Andy 107 4,447 41.6 36.3 3 15 58 149ERS 107 4,447 41.6 36.3 3 15 58 1OPPONENTS 71 2,846 40.1 33.7 12 22 56 1
PASSING Att Comp Pct Yds LG TD Int QBSmith, Alex 165 84 50.9 875 47 1 11 40.8Rattay, Tim TM 97 56 57.7 667 89t 5 6 70.3Dorsey, Ken 90 48 53.3 481 44 2 2 66.9Pickett, Cody 35 14 40.0 140 28 0 2 28.3Battle, Arnaz 2 2 100.0 27 24 0 0 118.849ERS 389 204 52.4 2,190 21 8 89t 53.6OPPONENTS 576 374 64.9 4,620 16 28 78t 94.2
TEAM STATISTICS 49ers OppTOTAL FIRST DOWNS 191 335 By Rushing 70 115 By Passing 96 205 By Penalties 25 15TOTAL YARDS GAINED 3,587 6,259 By Rushing 1,689 1,832 By Passing 1,898 4,427TOTAL PLAYS FROM SCRIMMAGE 865 1,090 Rushes 428 486 Average Gain Per Rush 4.1 5.7NET YARDS PASSING 1,898 4,427 Passes Attempted 389 576 Passes Completed 204 374 Percent Completed 52.4 64.9 Had Intercepted 21 16 Times Sacked 48 28 Lost Attempting to Pass 292 193PUNTS 108 71 Total Yardage of Punts 4,447 2,846 Average Length 41.2 40.1KICKOFF RETURNS 81 48 Total Yards Returned 1,540 960 Average Length of Return 19.0 20.0PENALTIES 106 120 Yards Penalized 780 961FUMBLES 31 18 Own Fumbles Recovered 17 8 Opponents’ Fumbles Recovered 10 14FIELD GOALS 26 29 Field Goals Attempted 29 36TOTAL POINTS SCORED 239 428 Touchdowns Scored 23 49 Touchdowns Rushing 9 19 Touchdowns Passing 8 28 Touchdown Returns 6 2 Extra Points 21 43 Field Goals 26 29 Safeties 0 0AVG. TIME OF POSSESSION 27:18 32:42
SCORING TDs Ru Pa Int Fu KO Pu PAT FG S PtsNedney, Joe 0 0 0 0 0 0 0 19/19 26/28 0 97Lloyd, Brandon 5 0 5 0 0 0 0 0/0 0/0 0 30Barlow, Kevan 3 3 0 0 0 0 0 0/0 0/0 0 18Battle, Arnaz 3 0 3 0 0 0 0 0/0 0/0 0 18Gore, Frank 3 3 0 0 0 0 0 0/0 0/0 0 18Hicks, Maurice 3 3 0 0 0 0 0 0/0 0/0 0 18Adams, Mike 1 0 0 1 0 0 0 0/0 0/0 0 6Amey, Fred 1 0 0 0 0 0 1 0/0 0/0 0 6Johnson, Derrick 1 0 0 0 1 0 0 0/0 0/0 0 6Parrish, Tony 1 0 0 1 0 0 0 0/0 0/0 0 6Smith, Derek 1 0 0 0 1 0 0 0/0 0/0 0 6Spencer, Shawntae 1 0 0 1 0 0 0 0/0 0/0 0 6
(continued)
Rookie Names in Italics

SAN FRANCISCO 49ERS
M E D I A G U I D E2 0 1 7 S E A S O N 487
2006 (7-9)Mike Nolan, Coach
L 27 at Arizona (63,407), S-10 34W 20 St. Louis (67,791), S-17 13L 24 Philadelphia (68,166), S-24 38L 0 at Kansas City (77,609), O-1 41W 34 Oakland (68,368), O-8 20L 19 San Diego (68,137), O-15 48- - BYE, O-22 -L 10 at Chicago (62,200), O-29 41W 9 Minnesota (68,088), N-5 3W 19 at Detroit (60,707), N-12 13W 20 Seattle (68,367), N-19 14L 17 at St. Louis (65,517), N-26 20L 10 at New Orleans (68,241), D-3 34L 19 Green Bay (68,539), D-10 30W 24 at Seattle (67,650), THU/D-14 14L 20 Arizona (67,751), D-24 26W 26 at Denver (75,555), D-31 (OT) 23 298 412
SCORING TDs Ru Pa Int Fu KO Pu PAT FG S PtsHarris, Walt 1 0 0 1 0 0 0 0/0 0/0 0 6Hicks, Maurice 1 0 1 0 0 0 0 0/0 0/0 0 6Oliver, Melvin 1 0 0 0 1 0 0 0/0 0/0 0 649ERS 30 12 16 1 1 0 0 29/29 29/35 1 298OPPONENTS 46 18 25 1 1 0 1 46/46 30/32 0 4122-pt conversions: Team: 0-1, Opponents: 0-0
RUSHING No Yds Avg Long TDGore, Frank 312 1,695 5.4 72 8Smith, Alex 44 147 3.3 22 2Robinson, Michael 38 116 3.1 33 2Gilmore, Bryan 7 94 13.4 22 0Hicks, Maurice 29 82 2.8 9 0Battle, Arnaz 5 25 5.0 18 0Norris, Moran 2 8 4.0 4 0Davis, Vernon 2 5 2.5 9 049ERS 439 2,172 4.9 72 12OPPONENTS 473 1,936 4.1 71t 18
RECEIVING No Yds Avg Long TDGore, Frank 61 485 8.0 39 1Battle, Arnaz 59 686 11.6 56 3Bryant, Antonio 40 733 18.3 72t 3Johnson, Eric 34 292 8.6 26 2Davis, Vernon 20 265 13.3 52t 3Hicks, Maurice 13 137 10.5 33t 1Robinson, Michael 9 47 5.2 12 0Gilmore, Bryan 8 150 18.8 75 1Norris, Moran 5 36 7.2 32t 2Jacobs, Taylor 4 29 7.3 10 0Walker, Delanie 2 30 15.0 29 0Hetherington, Chris 2 0 0.0 0 049ERS 257 2,890 11.2 75 16OPPONENTS 331 3,817 11.5 74 25
INTERCEPTIONS No Yds Avg Long TDHarris, Walt 8 84 10.5 42 1Lewis, Keith 2 24 12.0 24 0Williams, Chad 1 43 43.0 43 0Roman, Mark 1 27 27.0 27 0Lawson, Manny 1 0 0.0 0 0Spencer, Shawntae 1 0 0.0 0 049ERS 14 178 12.7 43 1OPPONENTS 16 213 13.3 70t 1
KICKOFF RETURNS No Yds Avg Long TDHicks, Maurice 57 1,428 25.1 64 0Williams, Brandon 16 380 23.8 44 0Robinson, Michael 4 73 18.3 19 0Norris, Moran 1 1 1.0 1 0Walker, Delanie 1 25 25.0 25 049ERS 79 1,907 24.1 64 0OPPONENTS 65 1,373 21.1 47 0
PUNT RETURNS Ret FC Yds Avg Long TDWilliams, Brandon 22 12 147 6.7 25 0Battle, Arnaz 6 7 90 15.0 60 049ERS 28 19 237 8.5 60 0OPPONENTS 35 19 462 13.2 60t 1
PUNTING No Yds Avg Net TB I-20 Lg BLee, Andy 81 3,625 44.8 36.8 9 22 66 049ERS 81 3,625 44.8 36.8 9 22 66 0OPPONENTS 66 2,794 42.3 36.6 7 23 65 1
PASSING Att Comp Pct Yds LG TD Int QBSmith, Alex 442 257 58.1 2,890 75 16 16 74.8Battle, Arnaz 1 0 0.0 0 0 0 0 39.6Robinson, Michael 1 0 0.0 0 0 0 0 39.649ERS 444 257 57.9 2,890 75 16 16 74.4OPPONENTS 518 331 63.9 3,817 74 25 14 90.9
TEAM STATISTICS 49ers OppTOTAL FIRST DOWNS 243 326 By Rushing 97 107 By Passing 132 189 By Penalties 14 30TOTAL YARDS GAINED 4,860 5,507 By Rushing 2,172 1,936 By Passing 2,688 3,571TOTAL PLAYS FROM SCRIMMAGE 918 1,025 Rushes 439 473 Average Gain Per Rush 5.3 5.4NET YARDS PASSING 2,688 3,571 Passes Attempted 444 518 Passes Completed 257 331 Percent Completed 57.9 63.9 Had Intercepted 16 14 Times Sacked 35 34 Lost Attempting to Pass 202 246PUNTS 81 66 Total Yardage of Punts 3,625 2,794 Average Length 44.8 42.3KICKOFF RETURNS 79 65 Total Yards Returned 1,907 1,373 Average Length of Return 24.1 21.1PENALTIES 93 87 Yards Penalized 818 703FUMBLES 24 23 Own Fumbles Recovered 8 10 Opponents’ Fumbles Recovered 13 16FIELD GOALS 29 30 Field Goals Attempted 35 32TOTAL POINTS SCORED 298 412 Touchdowns Scored 30 46 Touchdowns Rushing 12 18 Touchdowns Passing 16 25 Touchdown Returns 2 3 Extra Points 29 46 Field Goals 29 30 Safeties 1 0AVG. TIME OF POSSESSION 28:37 31:23
SCORING TDs Ru Pa Int Fu KO Pu PAT FG S PtsNedney, Joe 0 0 0 0 0 0 0 29/29 29/35 0 116Gore, Frank 9 8 1 0 0 0 0 0/0 0/0 0 54Battle, Arnaz 3 0 3 0 0 0 0 0/0 0/0 0 18Bryant, Antonio 3 0 3 0 0 0 0 0/0 0/0 0 18Davis, Vernon 3 0 3 0 0 0 0 0/0 0/0 0 18Johnson, Eric 2 0 2 0 0 0 0 0/0 0/0 0 12Norris, Moran 2 0 2 0 0 0 0 0/0 0/0 0 12Robinson, Michael 2 2 0 0 0 0 0 0/0 0/0 0 12Smith, Alex 2 2 0 0 0 0 0 0/0 0/0 0 12Gilmore, Bryan 1 0 1 0 0 0 0 0/0 0/0 0 6
(continued)
Rookie Names in Italics
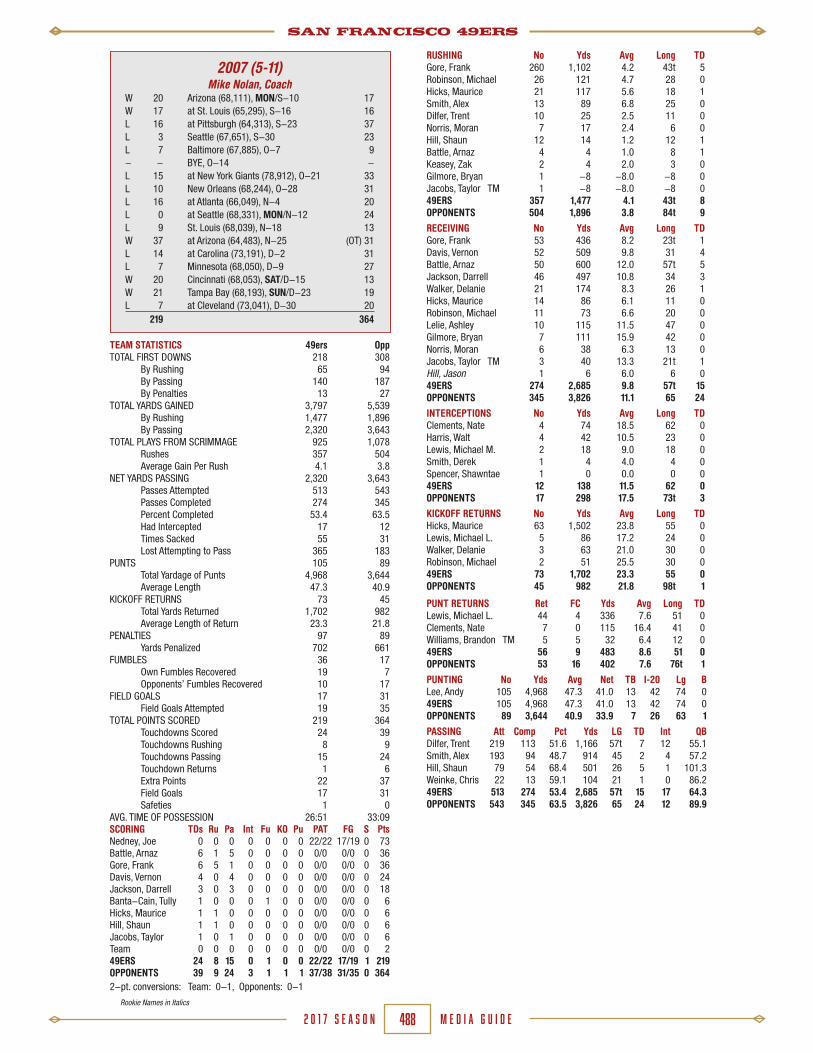
SAN FRANCISCO 49ERS
M E D I A G U I D E2 0 1 7 S E A S O N 488
2007 (5-11)Mike Nolan, Coach
W 20 Arizona (68,111), MON/S-10 17W 17 at St. Louis (65,295), S-16 16L 16 at Pittsburgh (64,313), S-23 37L 3 Seattle (67,651), S-30 23L 7 Baltimore (67,885), O-7 9- - BYE, O-14 -L 15 at New York Giants (78,912), O-21 33L 10 New Orleans (68,244), O-28 31L 16 at Atlanta (66,049), N-4 20L 0 at Seattle (68,331), MON/N-12 24L 9 St. Louis (68,039), N-18 13W 37 at Arizona (64,483), N-25 (OT) 31L 14 at Carolina (73,191), D-2 31L 7 Minnesota (68,050), D-9 27W 20 Cincinnati (68,053), SAT/D-15 13W 21 Tampa Bay (68,193), SUN/D-23 19L 7 at Cleveland (73,041), D-30 20 219 364
RUSHING No Yds Avg Long TDGore, Frank 260 1,102 4.2 43t 5Robinson, Michael 26 121 4.7 28 0Hicks, Maurice 21 117 5.6 18 1Smith, Alex 13 89 6.8 25 0Dilfer, Trent 10 25 2.5 11 0Norris, Moran 7 17 2.4 6 0Hill, Shaun 12 14 1.2 12 1Battle, Arnaz 4 4 1.0 8 1Keasey, Zak 2 4 2.0 3 0Gilmore, Bryan 1 -8 -8.0 -8 0Jacobs, Taylor TM 1 -8 -8.0 -8 049ERS 357 1,477 4.1 43t 8OPPONENTS 504 1,896 3.8 84t 9
RECEIVING No Yds Avg Long TDGore, Frank 53 436 8.2 23t 1Davis, Vernon 52 509 9.8 31 4Battle, Arnaz 50 600 12.0 57t 5Jackson, Darrell 46 497 10.8 34 3Walker, Delanie 21 174 8.3 26 1Hicks, Maurice 14 86 6.1 11 0Robinson, Michael 11 73 6.6 20 0Lelie, Ashley 10 115 11.5 47 0Gilmore, Bryan 7 111 15.9 42 0Norris, Moran 6 38 6.3 13 0Jacobs, Taylor TM 3 40 13.3 21t 1Hill, Jason 1 6 6.0 6 049ERS 274 2,685 9.8 57t 15OPPONENTS 345 3,826 11.1 65 24
INTERCEPTIONS No Yds Avg Long TDClements, Nate 4 74 18.5 62 0Harris, Walt 4 42 10.5 23 0Lewis, Michael M. 2 18 9.0 18 0Smith, Derek 1 4 4.0 4 0Spencer, Shawntae 1 0 0.0 0 049ERS 12 138 11.5 62 0OPPONENTS 17 298 17.5 73t 3
KICKOFF RETURNS No Yds Avg Long TDHicks, Maurice 63 1,502 23.8 55 0Lewis, Michael L. 5 86 17.2 24 0Walker, Delanie 3 63 21.0 30 0Robinson, Michael 2 51 25.5 30 049ERS 73 1,702 23.3 55 0OPPONENTS 45 982 21.8 98t 1
PUNT RETURNS Ret FC Yds Avg Long TDLewis, Michael L. 44 4 336 7.6 51 0Clements, Nate 7 0 115 16.4 41 0Williams, Brandon TM 5 5 32 6.4 12 049ERS 56 9 483 8.6 51 0OPPONENTS 53 16 402 7.6 76t 1
PUNTING No Yds Avg Net TB I-20 Lg BLee, Andy 105 4,968 47.3 41.0 13 42 74 049ERS 105 4,968 47.3 41.0 13 42 74 0OPPONENTS 89 3,644 40.9 33.9 7 26 63 1
PASSING Att Comp Pct Yds LG TD Int QBDilfer, Trent 219 113 51.6 1,166 57t 7 12 55.1Smith, Alex 193 94 48.7 914 45 2 4 57.2Hill, Shaun 79 54 68.4 501 26 5 1 101.3Weinke, Chris 22 13 59.1 104 21 1 0 86.249ERS 513 274 53.4 2,685 57t 15 17 64.3OPPONENTS 543 345 63.5 3,826 65 24 12 89.9
TEAM STATISTICS 49ers OppTOTAL FIRST DOWNS 218 308 By Rushing 65 94 By Passing 140 187 By Penalties 13 27TOTAL YARDS GAINED 3,797 5,539 By Rushing 1,477 1,896 By Passing 2,320 3,643TOTAL PLAYS FROM SCRIMMAGE 925 1,078 Rushes 357 504 Average Gain Per Rush 4.1 3.8NET YARDS PASSING 2,320 3,643 Passes Attempted 513 543 Passes Completed 274 345 Percent Completed 53.4 63.5 Had Intercepted 17 12 Times Sacked 55 31 Lost Attempting to Pass 365 183PUNTS 105 89 Total Yardage of Punts 4,968 3,644 Average Length 47.3 40.9KICKOFF RETURNS 73 45 Total Yards Returned 1,702 982 Average Length of Return 23.3 21.8PENALTIES 97 89 Yards Penalized 702 661FUMBLES 36 17 Own Fumbles Recovered 19 7 Opponents’ Fumbles Recovered 10 17FIELD GOALS 17 31 Field Goals Attempted 19 35TOTAL POINTS SCORED 219 364 Touchdowns Scored 24 39 Touchdowns Rushing 8 9 Touchdowns Passing 15 24 Touchdown Returns 1 6 Extra Points 22 37 Field Goals 17 31 Safeties 1 0AVG. TIME OF POSSESSION 26:51 33:09SCORING TDs Ru Pa Int Fu KO Pu PAT FG S PtsNedney, Joe 0 0 0 0 0 0 0 22/22 17/19 0 73Battle, Arnaz 6 1 5 0 0 0 0 0/0 0/0 0 36Gore, Frank 6 5 1 0 0 0 0 0/0 0/0 0 36Davis, Vernon 4 0 4 0 0 0 0 0/0 0/0 0 24Jackson, Darrell 3 0 3 0 0 0 0 0/0 0/0 0 18Banta-Cain, Tully 1 0 0 0 1 0 0 0/0 0/0 0 6Hicks, Maurice 1 1 0 0 0 0 0 0/0 0/0 0 6Hill, Shaun 1 1 0 0 0 0 0 0/0 0/0 0 6Jacobs, Taylor 1 0 1 0 0 0 0 0/0 0/0 0 6Team 0 0 0 0 0 0 0 0/0 0/0 0 249ERS 24 8 15 0 1 0 0 22/22 17/19 1 219 OPPONENTS 39 9 24 3 1 1 1 37/38 31/35 0 3642-pt. conversions: Team: 0-1, Opponents: 0-1
Rookie Names in Italics

SAN FRANCISCO 49ERS
M E D I A G U I D E2 0 1 7 S E A S O N 489
2008 (7-9)Coach*
L 13 Arizona (67,186), S-7 23W 33 at Seattle (67,951), S-14 (OT) 30W 31 Detroit (67,249), S-21 13L 17 at New Orleans (70,008), S-28 31L 21 New England (67,650), O-5 30L 26 Philadelphia (67,640), O-12 40L 17 at New York Giants (78,676), O-19 29L 13 Seattle (67,504), O-26 34- - BYE, N-2 -L 24 at Arizona (64,519), MON/N-10 29W 35 St. Louis (67,573), N-16 16L 22 at Dallas (63,272), N-23 35W 10 at Buffalo (70,988), N-30 3W 24 New York Jets (67,782), D-7 14L 9 at Miami (65,893), D-14 14W 17 at St. Louis (54,948), D-21 16W 27 Washington (67,519), D-28 24 339 381* Mike Nolan was fired after 7 games and Mike Singletary was appointed his successor.
SCORING TDs Ru Pa Int Fu KO Pu PAT FG S Pts Walker, Delanie 1 0 1 0 0 0 0 0/0 0/0 0 6Willis, Patrick 1 0 0 1 0 0 0 0/0 0/0 0 649ERS 36 10 21 1 1 1 0 34/34 29/33 0 339OPPONENTS 39 14 22 2 1 0 0 38/38 35/42 2 381# ret blckd punt, * ret blckd FG
RUSHING No Yds Avg Long TDGore, Frank 240 1,036 4.3 41t 6Foster, DeShaun 76 234 3.1 18 1O’Sullivan, J.T. 30 145 4.8 18 0Hill, Shaun 24 115 4.8 24 2Robinson, Michael 19 50 2.6 10 0Battle, Arnaz 1 18 18.0 18 0Davis, Vernon 1 11 11.0 11 0Hill, Jason 2 5 2.5 9 0Rossum, Allen 1 1 1.0 1t 1Bruce, Isaac 1 -3 -3.0 -3 0Walker, Delanie 2 -13 -6.5 -3 049ERS 397 1,599 4.0 41t 10OPPONENTS 452 1,709 3.8 50 14
RECEIVING No Yds Avg Long TDBruce, Isaac 61 835 13.7 63 7Johnson, Bryant 45 546 12.1 42 3Gore, Frank 43 373 8.7 26 2Davis, Vernon 31 358 11.5 57 2Hill, Jason 30 317 10.6 33 2Battle, Arnaz 24 318 13.3 36 0Morgan, Josh 20 319 16.0 48t 3Robinson, Michael 17 202 11.9 36 0Foster, DeShaun 16 133 8.3 31 1Walker, Delanie 10 155 15.5 53 1Zeigler, Dominique 5 97 19.4 31 0Keasey, Zak 3 25 8.3 12 0Ryan, Sean 1 8 8.0 8 0Bajema, Billy 2 34 17.0 29 0Rossum, Allen 1 4 4.0 4 049ERS 309 3,724 12.1 63 21OPPONENTS 331 3,668 11.1 81 22
INTERCEPTIONS No Yds Avg Long TDHarris, Walt 3 25 8.3 24 0Spikes, Takeo 3 14 4.7 13 0Clements, Nate 2 13 6.5 13 0Brown, Tarell 2 1 0.5 1 0Willis, Patrick 1 86 86.0 86t 1Smith, Justin 1 0 0.0 0 049ERS 12 139 11.6 86t 1OPPONENTS 19 358 18.8 75t 2
KICKOFF RETURNS No Yds Avg Long TDRossum, Allen 47 1,259 26.8 104t 1Walker, Delanie 13 257 19.8 35 0Robinson, Michael 6 135 22.5 34 0Balmer, Kentwan 5 47 9.4 14 0Bajema, Billy 2 27 13.5 14 0Ryan, Sean 1 14 14.0 14 0Battle, Arnaz 1 28 28.0 28 0Spikes, Takeo 1 0 0.0 0 049ERS 76 1,767 23.3 104t 1OPPONENTS 65 1,515 23.3 63 0
PUNT RETURNS Ret FC Yds Avg Long TDRossum, Allen 15 7 223 14.9 45 0Battle, Arnaz 6 2 29 4.8 19 0Clements, Nate 6 0 46 7.7 16 0Zeigler, Dominique 2 3 0 0.0 0 049ERS 29 12 298 10.3 45 0OPPONENTS 39 11 364 9.3 30 0
PUNTING No Yds Avg Net TB I-20 Lg BLee, Andy 66 3,155 47.8 39.0 9 13 82 149ERS 66 3,155 47.1 39.0 9 13 82 1OPPONENTS 72 3,054 42.4 35.8 9 23 70 1
PASSING Att Comp Pct Yds LG TD Int QBHill, Shaun 288 181 62.8 2,046 48t 13 8 87.5O’Sullivan, J.T. 220 128 58.2 1,678 63 8 11 73.6Bruce, Isaac 1 0 0.0 0 0 0 0 0.049ERS 509 309 60.7 3,724 63 21 19 81.3OPPONENTS 545 331 60.7 3,668 81 22 12 85.0
TEAM STATISTICS 49ers OppTOTAL FIRST DOWNS 287 293 Rushing 83 104 Passing 176 170 Penalty 28 19TOTAL YARDS GAINED 4,978 5,216 By Rushing 1,599 1,709 By Passing 3,379 3,507TOTAL PLAYS FROM SCRIMMAGE 961 1,027 Rushes 397 452 Average Gain Per Rush 4.0 3.8NET YARDS PASSING 3,379 3,507 Passes Attempted 509 545 Passes Completed 309 331 Percent Completed 60.7 60.7 Had Intercepted 19 22 Times Sacked 55 30 Lost Attempting to Pass 345 161PUNTS 67 72 Total Yardage of Punts 3,155 3,054 Average Length 47.1 42.4KICKOFF RETURNS 76 65 Total Yards Returned 1,767 1,515 Average Length of Return 23.3 23.3PENALTIES 98 111 Yards Penalized 732 869FUMBLES 36 16 Own Fumbles Recovered 20 10 Opponents’ Fumbles Recovered 6 16FIELD GOALS 29 35 Field Goals Attempted 33 42TOTAL POINTS SCORED 339 381 Touchdowns Scored 36 39 Touchdowns Rushing 10 14 Touchdowns Passing 21 22 Touchdown Returns 5 3 Extra Points 34 38 Field Goals 29 35 Safeties 0 2AVG. TIME OF POSSESSION 29:22 30:38
SCORING TDs Ru Pa Int Fu KO Pu PAT FG S PtsNedney, Joe 0 0 0 0 0 0 0 34/34 29/33 0 121Gore, Frank 8 6 2 0 0 0 0 0/0 0/0 0 50Bruce, Isaac 7 0 7 0 0 0 0 0/0 0/0 0 42Johnson, Bryant 3 0 3 0 0 0 0 0/0 0/0 0 18Morgan, Josh 3 0 3 0 0 0 0 0/0 0/0 0 18Davis, Vernon 2 0 2 0 0 0 0 0/0 0/0 0 12Foster, DeShaun 2 1 1 0 0 0 0 0/0 0/0 0 12Hill, Jason 2 0 2 0 0 0 0 0/0 0/0 0 12Hill, Shaun 2 2 0 0 0 0 0 0/0 0/0 0 12Rossum, Allen 2 1 0 0 0 1 0 0/0 0/0 0 12Clements, Nate# 1 0 0 0 1 0 0 0/0 0/0 0 6Staley, Joe 1 0 0 0 1 0 0 0/0 0/0 0 6Strickland, Donald* 1 0 0 0 1 0 0 0/0 0/0 0 6
(continued)
Rookie Names in Italics

SAN FRANCISCO 49ERS
M E D I A G U I D E2 0 1 7 S E A S O N 490
2009 (8-8)Mike Singletary, Coach
W 20 at Arizona (61,981), S-13 16W 23 Seattle (69,732), S-20 10L 24 at Minnesota (63,398), S-27 27W 35 St. Louis (69,732), O-4 0L 10 Atlanta (70,820), O-11 45- - BYE, O-18 -L 21 at Houston (66,229), O-25 24L 14 at Indianapolis (69,732), N-1 18L 27 Tennessee (69,732), N-8 34W 10 Chicago (70,445), THU/N-12 6L 24 at Green Bay (69,732), N-22 30W 20 Jacksonville (67,761), N-29 3L 17 at Seattle (69,732), D-6 20W 24 Arizona (67,782), MON/D-14 9L 13 at Philadelphia (69,144), D-20 27W 20 Detroit (69,732), D-27 6W 28 at St. Louis (47,965), J-3 6 330 281
RUSHING No Yds Avg Long TDGore, Frank 229 1,120 4.9 80t 10Coffee, Glen 83 226 2.7 17 1Hill, Shaun 8 70 8.8 22 0Morgan, Josh 5 61 12.2 20 0Smith, Alex 24 51 2.1 11 0Norris, Moran 14 41 2.9 15 1Walker, Delanie 3 34 11.3 16 0Spurlock, Micheal 1 3 3.0 3 0Robinson, Michael 3 2 0.7 4 0Bruce, Isaac 1 -8 -8.0 -8 049ERS 371 1,600 4.3 80t 12OPPONENTS 426 1,552 3.6 41 12
RECEIVING No Yds Avg Long TDDavis, Vernon 78 965 12.4 73t 13Morgan, Josh 52 527 10.1 61 3Gore, Frank 52 406 7.8 48 3Crabtree, Michael 48 625 13.0 50 2Bruce, Isaac 21 264 12.6 50 0Walker, Delanie 21 233 11.1 39 0Coffee, Glen 11 76 6.9 12 0Hill, Jason 9 90 10.0 30 2Norris, Moran 7 31 4.4 11 0Robinson, Michael 6 24 4.0 8 0Battle, Arnaz 5 40 8.0 12 0Jones, Brandon 1 18 18.0 18 0Smith, Alex 1 -6 -6.0 -6 049ERS 312 3,293 10.6 73t 23OPPONENTS 352 3,963 11.3 90t 14
INTERCEPTIONS No Yds Avg Long TDGoldson, Dashon 4 39 9.8 34 0Bly, Dre’ 3 66 22.0 31 0Willis, Patrick 3 33 11.0 23t 1Brown, Tarell 2 52 26.0 51 0Spencer, Shawntae 2 2 1.0 2 0Roman, Mark 1 27 27.0 27 0Franklin, Aubrayo 1 10 10.0 10 0Clements, Nate 1 8 8.0 8 0Lewis, Michael 1 0 0.0 0 049ERS 18 237 13.2 51 1OPPONENTS 14 168 12.0 43 1
KICKOFF RETURNS No Yds Avg Long TDRobinson, Michael 18 414 23.0 40 0Morgan, Josh 13 367 28.2 76 0Rossum, Allen 7 152 21.7 40 0Walker, Delanie 5 85 17.0 25 0Battle, Arnaz 3 68 22.7 26 0Coffee, Glen 3 42 14.0 16 0Balmer, Kentwan 2 7 3.5 4 0Norris, Moran 1 0 0.0 0 049ERS 52 1,135 21.8 76 0OPPONENTS 65 1,415 21.8 101t 1
PUNT RETURNS Ret FC Yds Avg Long TDBattle, Arnaz 21 10 61 2.9 18 0Rossum, Allen 12 1 84 7.0 14 0Jones, Brandon 9 1 26 2.9 13 0Clements, Nate 4 1 38 9.5 12 0Smith, Reggie 3 0 7 2.3 9 049ERS 49 13 216 4.4 18 0OPPONENTS 57 14 495 8.7 56 0
PUNTING No Yds Avg Net TB I-20 Lg BLee, Andy 99 4,711 47.6 41.0 8 30 64 049ERS 99 4,711 47.6 41.0 8 30 64 0OPPONENTS 95 4,295 45.2 41.5 7 31 67 0
PASSING Att Comp Pct Yds LG TD Int QBSmith, Alex 372 225 60.5 2,350 73t 18 12 81.5Hill, Shaun 155 87 56.1 943 61 5 2 79.6Spurlock, Micheal 1 0 0.0 0 0 0 0 39.649ERS 528 312 59.1 3,293 73t 23 14 80.8OPPONENTS 580 352 60.7 3,963 90t 14 18 76.2
TEAM STATISTICS 49ers OppTOTAL FIRST DOWNS 238 278 Rushing 77 77 Passing 137 176 Penalty 24 25TOTAL YARDS GAINED 4,652 5,222 By Rushing 1,600 1,552 By Passing 3,052 3,670TOTAL PLAYS FROM SCRIMMAGE 939 1,050 Rushes 371 426 Average Gain Per Rush 4.3 3.6NET YARDS PASSING 3,052 3,670 Passes Attempted 528 580 Passes Completed 312 352 Percent Completed 59.1 60.7 Had Intercepted 14 18 Times Sacked 40 44 Lost Attempting to Pass 241 293PUNTS 99 95 Total Yardage of Punts 4,711 4,295 Average Length 47.6 45.2KICKOFF RETURNS 52 65 Total Yards Returned 1,135 1,415 Average Length of Return 21.8 21.8PENALTIES 98 114 Yards Penalized 758 969FUMBLES 24 29 Own Fumbles Recovered 14 14 Opponents’ Fumbles Recovered 15 10FIELD GOALS 19 29 Field Goals Attempted 24 34TOTAL POINTS SCORED 330 281 Touchdowns Scored 39 28 Touchdowns Rushing 12 12 Touchdowns Passing 23 14 Touchdown Returns 4 2 Extra Points 39 26 Field Goals 19 29 Safeties 0 0AVG. TIME OF POSSESSION 29:47 30:14SCORING TDs Ru Pa Int Fu KO Pu PAT FG S PtsNedney, Joe 0 0 0 0 0 0 0 33/33 17/21 0 84Gore, Frank 13 10 3 0 0 0 0 0/0 0/0 0 78Davis, Vernon 13 0 13 0 0 0 0 0/0 0/0 0 78Morgan, Josh 3 0 3 0 0 0 0 0/0 0/0 0 18Crabtree, Michael 2 0 2 0 0 0 0 0/0 0/0 0 12Hill, Jason 2 0 2 0 0 0 0 0/0 0/0 0 12Schmitt, Ricky 0 0 0 0 0 0 0 2/2 2/3 0 8Coffee, Glen 1 1 0 0 0 0 0 0/0 0/0 0 6McKillop, Scott 0 0 0 0 1* 0 0 0/0 0/0 0 6McDonald, Ray 1 0 0 0 1& 0 0 0/0 0/0 0 6Willis, Patrick 1 0 0 1 0 0 0 0/0 0/0 0 6Clements, Nate 1 0 0 0 1# 0 0 0/0 0/0 0 6Norris, Moran 1 1 0 0 0 0 0 0/0 0/0 0 6Andrus, Shane 0 0 0 0 0 0 0 4/4 0/0 0 449ERS 39 12 23 1 3 0 0 39/39 19/24 0 330OPPONENTS 28 12 14 1 0 1 0 26/27 29/34 0 281*returned special teams FR #returned blocked FG &returned on FR
Rookie Names in Italics

SAN FRANCISCO 49ERS
M E D I A G U I D E2 0 1 7 S E A S O N 491
TEAM STATISTICS 49ers OppTOTAL FIRST DOWNS 251 299 Rushing 85 86 Passing 149 188 Penalty 17 25TOTAL YARDS GAINED 5,013 5,244 By Rushing 1,657 1,547 By Passing 3,356 3,697TOTAL PLAYS FROM SCRIMMAGE 945 1,033 Rushes 401 447 Average Gain Per Rush 4.1 3.5NET YARDS PASSING 3,356 3,697 Passes Attempted 500 550 Passes Completed 282 358 Percent Completed 56.4 65.1 Had Intercepted 15 15 Times Sacked 44 36 Lost Attempting to Pass 257 244PUNTS 91 84 Total Yardage of Punts 4,203 3,571 Average Length 46.2 42.5KICKOFF RETURNS 61 67 Total Yards Returned 1,187 1,485 Average Length of Return 19.5 22.2PENALTIES 112 97 Yards Penalized 933 839FUMBLES 22 18 Own Fumbles Recovered 14 11 Opponents’ Fumbles Recovered 7 8FIELD GOALS 22 28 Field Goals Attempted 27 33TOTAL POINTS SCORED 305 346 Touchdowns Scored 34 37 Touchdowns Rushing 10 9 Touchdowns Passing 19 25 Touchdown Returns 5 3 Extra Points 33 36 Field Goals 22 28 Safeties 0 0AVG. TIME OF POSSESSION 28:37 31:23SCORING TDs Ru Pa Int Fu KO Pu PAT FG S PtsNedney, Joe 0 0 0 0 0 0 0 17/17 11/13 0 50Davis, Vernon 7 0 7 0 0 0 0 0/0 0/0 0 44Reed, Jeff 0 0 0 0 0 0 0 13/13 9/10 0 40Crabtree, Michael 6 0 6 0 0 0 0 0/0 0/0 0 36Westbrook, Brian 5 4 1 0 0 0 0 0/0 0/0 0 30Gore, Frank 5 3 2 0 0 0 0 0/0 0/0 0 30Ginn, Ted 2 0 1 0 0 0 1 0/0 0/0 0 12Dixon, Anthony 2 2 0 0 0 0 0 0/0 0/0 0 12Morgan, Joshua 2 0 2 0 0 0 0 0/0 0/0 0 12Andrus, Shane 0 0 0 0 0 0 0 3/3 2/4 0 9McDonald, Ray 1 0 0 1 0 0 0 0/0 0/0 0 6Goldson, Dashon 1 0 0 1 0 0 0 0/0 0/0 0 6Brown, Tarell 1 0 0 1 0 0 0 0/0 0/0 0 6Smith, Troy 1 1 0 0 0 0 0 0/0 0/0 0 6Mays, Taylor 1 0 0 0 1* 0 0 0/0 0/0 0 649ERS 34 10 19 3 1 0 1 33/33 22/27 0 305OPPONENTS 37 9 25 1 1 1 0 36/37 28/33 0 346*returned blcked punt | 2-pt. conversions: Team: 1-1, Opponents: 0-0
2010 (6-10)Mike Singletary/Jim Tomsula, Coach*
L 6 at Seattle (67,044), S-12 31L 22 New Orleans (69,732), MON/S-20 25L 10 at Kansas City (68,188), S-26 31L 14 at Atlanta (66,874), 0-3 16L 24 Philadelphia (69,732), SUN/O-10 27W 17 Oakland (69,732), O-17 9L 20 at Carolina (72,741), O-24 23W 24 Denver in London (83,841), O-31 16- - BYE, N-7 -W 23 St. Louis (69,732), N-14 (OT) 20L 0 Tampa Bay (69,732), N-21 21W 27 at Arizona (62,308), MON/N-29 6L 16 at Green Bay (70,575), D-5 34W 40 Seattle (69,732), D-12 21L 7 at San Diego (67,820), THU/D-16 34L 17 at St. Louis (52,820), D-26 25W 38 Arizona (69,732), J-2 7 305 346* Mike Singletary was fired after 15 games and Jim Tomsula was appointed his successor.
RUSHING No Yds Avg Long TDGore, Frank 203 853 4.2 64 3Westbrook, Brian 77 340 4.4 30 4Dixon, Anthony 70 237 3.4 34 2Smith, Troy 23 121 5.3 16 1Smith, Alex 18 60 3.3 12 0Walker, Delanie 3 18 6.0 10 0Morgan, Joshua 2 17 8.5 13 0Ginn, Ted 2 11 5.5 9 0Norris, Moran 3 0 0.0 1 049ERS 401 1,657 4.1 64 10OPPONENTS 447 1,547 3.5 43 9
RECEIVING No Yds Avg Long TDDavis, Vernon 56 914 16.3 66t 7Crabtree, Michael 55 741 13.5 60t 6Gore, Frank 46 452 9.8 41 2Morgan, Joshua 44 698 15.9 65 2Walker, Delanie 29 331 11.4 38 0Westbrook, Brian 16 150 9.4 62t 1Ginn, Ted 12 163 13.6 37t 1Zeigler, Dominique 9 98 10.9 20 0Byham, Nate 5 27 5.4 9 0Dixon, Anthony 5 11 2.2 8 0Norris, Moran 4 20 5.0 8 0Williams, Kyle 1 8 8.0 8 049ERS 282 3,613 12.8 66t 19OPPONENTS 358 3,941 11.0 71 25
INTERCEPTIONS No Yds Avg Long TDClements, Nate 3 46 15.3 39 0Spikes, Takeo 3 9 3.0 6 0Spencer, Shawntae 3 0 0.0 0 0Brown, Tarell 1 62 62.0 62t 1Goldson, Dashon 1 39 39.0 39t 1Brooks, Ahmad 1 32 32.0 32 0McDonald, Ray 1 31 31.0 31t 1Smith, Reggie 1 20 20.0 20 0Lawson, Manny 1 0 0.0 0 049ERS 15 239 15.9 62t 3OPPONENTS 15 182 12.1 41 1
KICKOFF RETURNS No Yds Avg Long TDGinn, Ted 47 992 21.1 61 0Walker, Delanie 5 70 14.0 20 0Williams, Kyle 4 82 20.5 30 0Morgan, Joshua 2 19 9.5 13 0Norris, Moran 1 12 12.0 12 0Wragge, Tony 1 12 12.0 12 0Crabtree, Michael 1 0 0.0 0 049ERS 61 1,187 19.5 61 0OPPONENTS 67 1,485 22.2 92t 1
PUNT RETURNS Ret FC Yds Avg Long TDGinn, Ted 24 18 321 13.4 78t 1Adams, Phillip 4 0 29 7.3 16 0Williams, Kyle 3 6 16 5.3 9 0Smith, Reggie 0 1 0 0.0 0 049ERS 31 25 366 11.8 78t 1OPPONENTS 54 12 483 8.9 43 0
PUNTING No Yds Avg Net TB I-20 Lg BLee, Andy 91 4,203 46.2 38.2 12 34 64 049ERS 91 4,203 46.2 38.2 12 34 64 0OPPONENTS 83 3,571 42.5 37.4 3 29 65 1
PASSING Att Comp Pct Yds LG TD Int QBSmith, Alex 342 204 59.6 2,370 62t 14 10 82.1Smith, Troy 145 73 50.3 1,176 66t 5 4 77.8Carr, David 13 5 38.5 67 22 0 1 23.649ERS 500 282 56.4 3,613 66t 19 15 79.3OPPONENTS 550 358 65.1 3,941 71 25 15 90.0
Rookie Names in Italics

SAN FRANCISCO 49ERS
M E D I A G U I D E2 0 1 7 S E A S O N 492
TEAM STATISTICS 49ers OppTOTAL FIRST DOWNS 282 267 Rushing 101 53 Passing 150 190 Penalty 31 24TOTAL YARDS GAINED 4,974 4,931 By Rushing 2,044 1,236 By Passing 2,930 3,695TOTAL PLAYS FROM SCRIMMAGE 993 974 Rushes 498 353 Average Gain Per Rush 4.1 3.5NET YARDS PASSING 2,044 3,695 Passes Attempted 451 579 Passes Completed 277 333 Percent Completed 61.4 57.5 Had Intercepted 5 23 Times Sacked 44 42 Lost Attempting to Pass 263 283PUNTS 79 87 Total Yardage of Punts 3,970 3,911 Average Length 50.3 45.0KICKOFF RETURNS 39 46 Total Yards Returned 1,060 1,061 Average Length of Return 27.2 23.1PENALTIES 113 98 Yards Penalized 1,014 867FUMBLES 14 31 Own Fumbles Recovered 9 16 Opponents’ Fumbles Recovered 15 5FIELD GOALS 44 22 Field Goals Attempted 52 27TOTAL POINTS SCORED 380 229 Touchdowns Scored 35 23 Touchdowns Rushing 14 3 Touchdowns Passing 18 20 Touchdown Returns 3 0 Extra Points 34 21 Field Goals 44 22 Safeties 1 1AVG. TIME OF POSSESSION 32:02 27:58SCORING TDs Ru Pa Int Fu KO Pu PAT FG S PtsAkers, Davis 0 0 0 0 0 0 0 34/34 44/52 0 166Gore, Frank 8 8 0 0 0 0 0 0/0 0/0 0 48Davis, Vernon 6 0 6 0 0 0 0 0/0 0/0 0 36Crabtree, Michael 4 0 4 0 0 0 0 0/0 0/0 0 26Williams, Kyle 3 0 3 0 0 0 0 0/0 0/0 0 18Walker, Delanie 3 0 3 0 0 0 0 0/0 0/0 0 18Ginn Jr., Ted 2 0 0 0 0 1 1 0/0 0/0 0 12Dixon, Anthony 2 2 0 0 0 0 0 0/0 0/0 0 12Hunter, Kendall 2 2 0 0 0 0 0 0/0 0/0 0 12Smith, Alex 2 2 0 0 0 0 0 0/0 0/0 0 12Miller, Bruce 1 0 1 0 0 0 0 0/0 0/0 0 6
2011 (13-3/14-4)NFC West ChampionsJim Harbaugh, Coach
W 33 Seattle (69,732), S-11 17L 24 Dallas (69,732), S-18 (OT) 27W 13 at Cincinnati (43,363), S-25 8W 24 at Philadelphia (69,144), 0-2 23W 48 Tampa Bay (69,732), O-9 3W 25 at Detroit (62,061), O-16 19- - BYE, O-23 -W 20 Cleveland (69,732), O-30 10W 19 at Washington (78,032), N-6 11W 27 New York Giants (69,732), N-13 20W 23 Arizona (69,732), N-20 7L 6 at Baltimore (71,345), THU/N-24 16W 26 St. Louis (69,732), D-4 0L 19 at Arizona (60,808), D-11 21W 20 Pittsburgh (69,732), MON/D-19 3W 19 at Seattle (66,697), D-24 17W 34 at St. Louis (55,990), J-1 27 380 229
NFC DIVISIONAL ROUND - JAN. 14(at San Francisco - Candlestick Park)
W 36 New Orleans (69,732)-SAT 32NFC CHAMPIONSHIP - JAN. 22(at San Francisco - Candlestick Park)
L 17 New York Giants (69,732) (OT) 20
(continued)SCORING TDs Ru Pa Int Fu KO Pu PAT FG S PtsRogers, Carlos 1 0 0 1 0 0 0 0/0 0/0 0 6Morgan, Joshua 1 0 1 0 0 0 0 0/0 0/0 0 6Smith, Aldon 0 0 0 0 0 0 0 0/0 0/0 1 249ERS 35 14 18 1 0 1 1 34/34 44/52 1 380OPPONENTS 23 3 20 0 0 0 0 21/21 22/27 1 2292-pt conversions: Team: 1-1, Opponents: 1-2
RUSHING No Yds Avg Long TDGore, Frank 282 1,211 4.3 55 8Hunter, Kendall 112 473 4.2 44 2Smith, Alex 52 179 3.4 14 2Dixon, Anthony 29 87 3.0 9 2Ginn Jr., Ted 8 68 8.5 24 0Williams, Kyle 2 32 16.0 25 0Miller, Bruce 4 8 2.0 3 0Crabtree, Michael 1 6 6.0 6 0Walker, Delanie 3 5 1.7 14 0Kaepernick, Colin 2 -2 -1.0 -1 0Davis, Venon 2 -5 -2.5 -2 0Lee, Andy 1 -18 -18.0 -18 049ERS 498 2,044 4.1 55 14OPPONENTS 353 1,236 3.5 34 3
RECEIVING No Yds Avg Long TDCrabtree, Michael 72 874 12.1 52t 4Davis, Vernon 67 792 11.8 44 6Williams, Kyle 20 241 12.1 56t 3Ginn Jr., Ted 19 220 11.6 26 0Walker, Delanie 19 198 10.4 29t 3Gore, Frank 17 114 6.7 13 0Hunter, Kendall 16 195 12.2 44 0Morgan, Joshua 15 220 14.7 30t 1Edwards, Braylon 15 181 12.1 24 0Miller, Bruce 11 83 7.5 30t 1Swain, Brett 2 15 7.5 9 0Peelle, Justin 1 19 19.0 19 0Sopoaga, Isaac 1 18 18.0 18 0Staley, Joe 1 17 17.0 17 0Dixon, Anthony 1 6 6.0 6 049ERS 277 3,193 11.5 56t 18OPPONENTS 333 3,978 11.9 77 20
INTERCEPTIONS No Yds Avg Long TDRogers, Carlos 6 106 17.7 31t 1Goldson, Dashon 6 53 8.8 21 0Brown, Tarell 4 15 3.8 11 0Whitner, Donte 2 48 24.0 48 0Brock, Tramaine 2 18 9.0 18 0Culliver, Chris 1 23 23.0 23 0Smith, Reggie 1 11 11.0 11 0Willis, Patrick 1 10 10.0 10 049ERS 23 284 12.3 48 1OPPONENTS 5 51 10.2 30 0
KICKOFF RETURNS No Yds Avg Long TDGinn Jr., Ted 29 800 27.6 102t 1Hunter, Kendall 6 156 26.0 43 0Williams, Kyle 4 104 26.0 33 049ERS 39 1,060 27.2 102t 1OPPONENTS 46 1,061 23.1 39 0
PUNT RETURNS Ret FC Yds Avg Long TDGinn Jr., Ted 38 18 466 12.3 55t 1Smith, Reggie 4 1 37 9.3 14 0Williams, Kyle 2 4 41 20.5 36 049ERS 44 23 544 12.4 55t 1OPPONENTS 39 17 315 8.1 24 0
PUNTING No Yds Avg Net TB I-20 Lg BLee, Andy 78 3,970 50.9 44.0 9 28 68 149ERS 78 3,970 50.3 44.0 9 28 68 1OPPONENTS 87 3,911 45.0 37.1 7 21 77 0
PASSING Att Comp Pct Yds LG TD Int QBSmith, Alex 445 273 61.3 3,144 56t 17 5 90.7Kaepernick, Colin 5 3 60.0 35 19 0 0 81.3Akers, David 1 1 100.0 14 14t 1 0 158.349ERS 451 277 61.4 3,193 56t 18 5 91.5OPPONENTS 579 333 57.5 3,978 77 20 20 73.6
Rookie Names in Italics

SAN FRANCISCO 49ERS
M E D I A G U I D E2 0 1 7 S E A S O N 493
TEAM STATISTICS 49ers OppTOTAL FIRST DOWNS 322 284 Rushing 128 72 Passing 172 178 Penalty 22 34TOTAL YARDS GAINED 5,789 4,710 By Rushing 2,491 1,507 By Passing 3,298 3,203TOTAL PLAYS FROM SCRIMMAGE 969 1,012 Rushes 492 407 Average Gain Per Rush 5.1 3.7NET YARDS PASSING 3,298 3,203 Passes Attempted 436 567 Passes Completed 289 337 Percent Completed 66.3 59.4 Had Intercepted 8 14 Times Sacked 41 38 Lost Attempting to Pass 253 270PUNTS 67 79 Total Yardage of Punts 3,226 3,609 Average Length 48.1 45.7KICKOFF RETURNS 49 48 Total Yards Returned 1,216 1,289 Average Length of Return 24.8 26.9PENALTIES 109 93 Yards Penalized 960 758FUMBLES 26 21 Own Fumbles Recovered 18 10 Opponents’ Fumbles Recovered 11 8FIELD GOALS 29 22 Field Goals Attempted 42 27TOTAL POINTS SCORED 397 273 Touchdowns Scored 44 29 Touchdowns Rushing 17 7 Touchdowns Passing 23 19 Touchdown Returns 4 3 Extra Points 44 27 Field Goals 29 22 Safeties 1 1AVG. TIME OF POSSESSION 30:49 29:11SCORING TDs Ru Pa Int Fu KO Pu PAT FG S PtsAkers, David 0 0 0 0 0 0 0 44/44 29/42 0 131Gore, Frank 10 8 1 0 1 0 0 0 0 0 60Crabtree, Michael 9 0 9 0 0 0 0 0 0 0 54Davis, Vernon 5 0 5 0 0 0 0 0 0 0 30Kaepernick, Colin 5 5 0 0 0 0 0 0 0 0 30Moss, Randy 3 0 3 0 0 0 0 0 0 0 18Walker, Delanie 3 0 3 0 0 0 0 0 0 0 18Hunter, Kendall 2 2 0 0 0 0 0 0 0 0 12
2012 (13-5-1)NFC West Champions – NFC Champions
Jim Harbaugh, CoachW 30 at Green Bay (70,523), S-9 22W 27 Detroit (69,732), SUN/S-16 19L 13 at Minnesota (57,288), S-23 24W 34 at New York Jets (79,088), S-30 0W 45 Buffalo (69,732), O-7 3L 3 New York Giants (69,732), O-14 26W 13 Seattle (69,732), THU/O-18 6W 24 at Arizona (62,810), MON/O-29 3- - BYE, N-4 -T 24 St. Louis (69,732), N-11 (OT) 24W 32 Chicago (69,732), MON/N-19 7W 31 at New Orleans (73,147), N-25 21L 13 at St. Louis (57,279), D-2 (OT) 16W 27 Miami (69,732), D-9 13W 41 at New England (68,756), SUN/D-16 34L 13 at Seattle (68,161), SUN/D-23 42W 27 Arizona (69,732), D-30 13 397 273
NFC DIVISIONAL ROUND - JAN. 12(at San Francisco - Candlestick Park)
W 45 Green Bay (68,732)-SAT 31NFC CHAMPIONSHIP - JAN. 20
(at Atlanta - Georgia Dome)W 28 Atlanta (60,863) 24
SUPER BOWL XLVII - FEB. 3(at New Orleans - Mercedes-Benz Superdome)
L 31 Baltimore (71,024) 34
(continued)SCORING TDs Ru Pa Int Fu KO Pu PAT FG S PtsDixon, Anthony 2 2 0 0 0 0 0 0 0 0 12Manningham, Mario 1 0 1 0 0 0 0 0 0 0 6Williams, Kyle 1 0 1 0 0 0 0 0 0 0 6Brooks, Ahmad 1 0 0 1 0 0 0 0 0 0 6Rogers, Carlos 1 0 0 0 1 0 0 0 0 0 6Whitner, Donte 1 0 0 1 0 0 0 0 0 0 6McDonald, Ray 0 0 0 0 0 0 0 0 0 1 249ERS 44 17 23 2 2 0 0 44/44 29/42 1 397OPPONENTS 29 7 19 0 2* 0 1 22/27 27/27 1 273*ret blcked FG | 2-pt conversions: Team: 0-0, Opponents: 2-2RUSHING No Yds Avg Long TDGore, Frank 258 1,214 4.7 37 8Kaepernick, Colin 63 415 6.6 50t 5Hunter, Kendall 72 371 5.2 26 2Smith, Alex 31 132 4.3 24 0James, LaMichael 27 125 4.6 26 0Dixon, Anthony 21 78 3.7 9 2Manningham, Mario 3 64 21.3 29 0Goldson, Dashon 1 31 31 31 0Williams, Kyle 4 21 5.3 9 0Miller, Bruce 5 18 3.6 9 0Crabtree, Michael 1 8 8 8 0Jacobs, Brandon 5 7 1.4 3 0Ginn Jr., Ted 1 7 7 7 049ERS 492 2,491 5.1 50t 17OPPONENTS 407 1,507 3.7 35 7
RECEIVING No Yds Avg Long TDCrabtree, Michael 85 1,105 13 49t 9Manningham, Mario 42 449 10.7 40 1Davis, Vernon 41 548 13.4 53 5Moss, Randy 28 434 15.5 55 3Gore, Frank 28 234 8.4 26 1Walker, Delanie 21 344 16.4 45 3Williams, Kyle 14 212 15.1 57 1Miller, Bruce 12 84 7 26 0Hunter, Kendall 9 60 6.7 12 0Celek, Garrett 4 51 12.8 35 0James, LaMichael 3 29 9.7 15 0Ginn Jr., Ted 2 1 0.5 1 049ERS 289 3,551 12.3 57 23OPPONENTS 337 3,473 10.3 53 19
INTERCEPTIONS No Yds Avg Long TDGoldson, Dashon 3 21 7 20 0Brown, Tarell 2 17 8.5 12 0Culliver, Chris 2 4 2 4 0Willis, Patrick 2 2 1 2 0Rogers, Carlos 1 63 63 63 0Brooks, Ahmad 1 50 50 50t 1Whitner, Donte 1 42 42 42t 1Bowman, NaVorro 1 11 11 11 0Smith, Aldon 1 6 6 6 049ERS 14 216 15.4 63 2OPPONENTS 8 70 8.8 24 0
KICKOFF RETURNS No Yds Avg Long TDJames, LaMichael 14 417 29.8 62 0Williams, Kyle 13 353 27.2 94 0Ginn Jr., Ted 11 253 23.0 31 0Hunter, Kendall 7 165 23.6 31 0Walker, Delanie 4 28 7.0 18 049ERS 49 1,216 24.8 94 0OPPONENTS 48 1,289 26.9 66 0
PUNT RETURNS Ret FC Yds Avg Long TDGinn Jr., Ted 32 12 326 10.2 38 0Williams, Kyle 4 6 52 13.0 20 049ERS 36 18 378 10.5 38 0OPPONENTS 36 18 249 6.9 75t 1
PUNTING No Yds Avg Net TB I-20 Lg BLee, Andy 67 3,226 48.1 43.2 4 36 66 049ERS 67 3,226 48.1 43.2 4 36 66 0OPPONENTS 78 3,609 45.7 39.1 7 24 70 1
PASSING Att Comp Pct Yds LG TD Int QBKaepernick, Colin 218 136 62.4 1,814 57 10 3 98.3Smith, Alex 218 153 70.2 1,737 55 13 5 104.1Hunter, Kendall 0 0 0.0 0 0 0 0 0.049ERS 436 289 66.3 3,551 57 23 8 101.2OPPONENTS 567 337 59.4 3,473 53 19 14 78.0
Rookie Names in Italics

SAN FRANCISCO 49ERS
M E D I A G U I D E2 0 1 7 S E A S O N 494
TEAM STATISTICS 49ers OppTOTAL FIRST DOWNS 286 284 Rushing 115 77 Passing 148 181 Penalty 23 26TOTAL YARDS GAINED 5,180 5,071 By Rushing 2,201 1,535 By Passing 2,979 3,536TOTAL PLAYS FROM SCRIMMAGE 961 1,020 Rushes 505 397 Average Gain Per Rush 4.4 3.9NET YARDS PASSING 2,979 3,536 Passes Attempted 417 585 Passes Completed 244 345 Percent Completed 58.5 59.0 Had Intercepted 8 18 Times Sacked 39 38 Lost Attempting to Pass 231 283PUNTS 79 87 Total Yardage of Punts 3,804 3,884 Average Length 48.2 44.6KICKOFF RETURNS 32 54 Total Yards Returned 726 1,104 Average Length of Return 22.7 20.4PENALTIES 103 96 Yards Penalized 845 878FUMBLES 20 21 Own Fumbles Recovered 10 9 Opponents’ Fumbles Recovered 12 10FIELD GOALS 32 20 Field Goals Attempted 36 25TOTAL POINTS SCORED 406 272 Touchdowns Scored 44 30 Touchdowns Rushing 18 11 Touchdowns Passing 21 19 Touchdown Returns 5 0 Extra Points 44 28 Field Goals 32 20 Safeties 1 1AVG. TIME OF POSSESSION 30:35 29:26SCORING TDs Ru Pa Int Fu KO Pu PAT FG S PtsDawson, Phil 0 0 0 0 0 0 0 44/44 32/36 0 140Davis, Vernon 13 0 13 0 0 0 0 0/0 0/0 0 78Gore, Frank 9 9 0 0 0 0 0 0/0 0/0 0 54Boldin, Anquan 7 0 7 0 0 0 0 0/0 0/0 0 42Kaepernick, Colin 4 4 0 0 0 0 0 0/0 0/0 0 24Hunter, Kendall 4 3 0 0 1 0 0 0/0 0/0 0 24Dixon, Anthony 2 2 0 0 0 0 0 0/0 0/0 0 12Bowman, NaVorro 1 0 0 1 0 0 0 0/0 0/0 0 6Osgood, Kassim 1 0 0 0 1 0 0 0/0 0/0 0 6Skuta, Dan 1 0 0 0 1 0 0 0/0 0/0 0 6
2013 (12-4/14-5)Jim Harbaugh, Coach
W 34 Green Bay (69,732), S-8 28L 3 at Seattle (68,338), SUN/S-15 29L 7 Indianapolis (69,732), S-22 27W 35 at St. Louis (56,640), THU/S-26 11W 34 Houston (69,732), SUN/O-6 3W 32 Arizona (69,732), O-13 20W 31 at Tennessee (69,143), O-20 17W 42 at Jacksonville in London (83,559), O-27 10- - BYE, N-3 -L 9 Carolina (69,732), N-10 10L 20 at New Orleans (73,025), N-17 23W 27 at Washington (79,773), MON/N-25 6W 23 St. Louis (69,732), D-1 13W 19 Seattle (69,732), D-8 17W 33 at Tampa Bay (64,142), D-15 14W 34 Atlanta (69,732), MON/D-23 24W 23 at Arizona (63,570), D-29 20 406 272
NFC WILDCARD - JAN. 5(at Green Bay - Lambeau Field)
W 23 at Green Bay (77,525) 20NFC DIVISIONAL ROUND - JAN. 12(at Carolina - Bank of America Stadium)
W 23 at Carolina (73,784) 10NFC CHAMPIONSHIP GAME - JAN. 19
(at Seattle - CenturyLink Field)L 17 at Seattle (68,454) 23
(continued)SCORING TDs Ru Pa Int Fu KO Pu PAT FG S PtsCrabtree, Michael 1 0 1 0 0 0 0 0/0 0/0 0 6Brock, Tramaine 1 0 0 1 0 0 0 0/0 0/0 0 6Lemonier, Corey 0 0 0 0 0 0 0 0/0 0/0 1 249ERS 44 18 21 2 3 0 0 44/44 32/36 1 406OPPONENTS 30 11 19 0 0 0 0 28/28 20/25 1 2722-pt conversions: Team: 0-0, Opponents: 1-2
RUSHING No Yds Avg Long TDGore, Frank 276 1,128 4.1 51 9Kaepernick, Colin 92 524 5.7 28 4Hunter, Kendall 78 358 4.6 45 3James, LaMichael 12 59 4.9 21 0Dixon, Anthony 28 56 2.0 9 2Patton, Quinton 1 26 26.0 26 0Williams, Kyle 2 23 11.5 13 0Miller, Bruce 7 13 1.9 4 0Boldin, Anquan 2 11 5.5 11 0Moore, Marlon 1 9 9.0 9 0McCoy, Colt 6 -6 -1.0 -1 049ERS 505 2,201 4.4 51 18OPPONENTS 397 1,535 3.9 30 11
RECEIVING No Yds Avg Long TDBoldin, Anquan 85 1,179 13.9 63 7Davis, Vernon 52 850 16.3 64t 13Miller, Bruce 25 243 9.7 43 0Crabtree, Michael 19 284 14.9 60 1Gore, Frank 16 141 8.8 29 0Williams, Kyle 12 113 9.4 16 0Manningham, Mario 9 85 9.4 14 0McDonald, Vance 8 119 14.9 25 0Patton, Quinton 3 34 11.3 29 0Dixon, Anthony 3 30 10.0 19 0Baldwin, Jonathan 3 28 9.3 15 0Celek, Garrett 2 38 19.0 30 0James, LaMichael 2 16 8.0 12 0Hunter, Kendall 2 13 6.5 9 0Osgood, Kassim 1 17 17.0 17 0Staley, Joe 1 14 14.0 14 0Moore, Marlon 1 6 6.0 6 049ERS 244 3,210 13.2 64t 21OPPONENTS 345 3,819 11.1 75t 19
INTERCEPTIONS No Yds Avg Long TDBrock, Tramaine 5 82 16.4 41 1Reid, Eric 4 54 13.5 53 0Bowman, NaVorro 2 93 46.5 89t 1Rogers, Carlos 2 14 7.0 11 0Whitner, Donte 2 7 3.5 7 0Brooks, Ahmad 1 22 22.0 22 0Jerod-Eddie, Tony 1 6 6.0 6 0Wright, Eric 1 0 0.0 0 049ERS 18 278 15.4 89t 2OPPONENTS 8 117 14.6 43 0
KICKOFF RETURNS No Yds Avg Long TDJames, LaMichael 12 321 26.8 41 0Williams, Kyle 7 134 19.1 35 0Dixon, Anthony 5 101 20.2 47 0Hunter, Kendall 4 81 20.3 30 0Cox, Perrish 3 82 27.3 30 0Patton, Quinton 1 7 7.0 7 049ERS 32 726 22.7 47 0Opponents 54 1,104 20.4 82 0
PUNT RETURNS Ret FC Yds Avg Long TDJames, LaMichael 23 12 251 10.9 40 0Williams, Kyle 12 20 61 5.1 22 049ERS 35 32 312 8.9 40 0OPPONENTS 38 21 330 8.7 38 0
PUNTING No Yds Avg Net TB I-20 Lg BLee, Andy 79 3,804 48.2 41.7 9 27 62 049ERS 79 3,804 48.2 41.7 9 27 62 0Opponents 85 3,884 44.6 40.1 4 27 65 2
PASSING Att Comp Pct Yds LG TD Int QBKaepernick, Colin 416 243 58.4 3,197 64t 21 8 91.6McCoy, Colt 1 1 100.0 13 13 0 0 118.849ERS 417 244 58.5 3,210 64t 21 8 91.7OPPONENTS 585 345 59.0 3,819 75t 19 18 76.4
Rookie Names in Italics
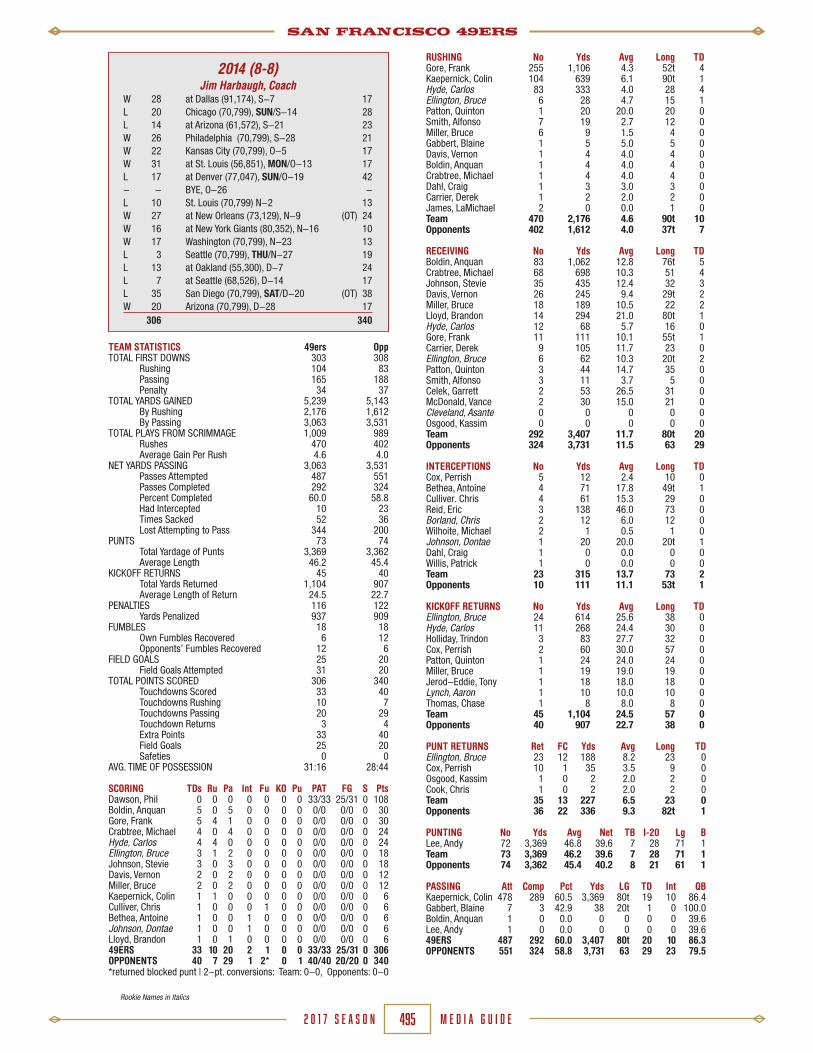
SAN FRANCISCO 49ERS
M E D I A G U I D E2 0 1 7 S E A S O N 495
TEAM STATISTICS 49ers OppTOTAL FIRST DOWNS 303 308 Rushing 104 83 Passing 165 188 Penalty 34 37TOTAL YARDS GAINED 5,239 5,143 By Rushing 2,176 1,612 By Passing 3,063 3,531TOTAL PLAYS FROM SCRIMMAGE 1,009 989 Rushes 470 402 Average Gain Per Rush 4.6 4.0NET YARDS PASSING 3,063 3,531 Passes Attempted 487 551 Passes Completed 292 324 Percent Completed 60.0 58.8 Had Intercepted 10 23 Times Sacked 52 36 Lost Attempting to Pass 344 200PUNTS 73 74 Total Yardage of Punts 3,369 3,362 Average Length 46.2 45.4KICKOFF RETURNS 45 40 Total Yards Returned 1,104 907 Average Length of Return 24.5 22.7PENALTIES 116 122 Yards Penalized 937 909FUMBLES 18 18 Own Fumbles Recovered 6 12 Opponents’ Fumbles Recovered 12 6FIELD GOALS 25 20 Field Goals Attempted 31 20TOTAL POINTS SCORED 306 340 Touchdowns Scored 33 40 Touchdowns Rushing 10 7 Touchdowns Passing 20 29 Touchdown Returns 3 4 Extra Points 33 40 Field Goals 25 20 Safeties 0 0AVG. TIME OF POSSESSION 31:16 28:44
SCORING TDs Ru Pa Int Fu KO Pu PAT FG S PtsDawson, Phil 0 0 0 0 0 0 0 33/33 25/31 0 108Boldin, Anquan 5 0 5 0 0 0 0 0/0 0/0 0 30Gore, Frank 5 4 1 0 0 0 0 0/0 0/0 0 30Crabtree, Michael 4 0 4 0 0 0 0 0/0 0/0 0 24Hyde, Carlos 4 4 0 0 0 0 0 0/0 0/0 0 24Ellington, Bruce 3 1 2 0 0 0 0 0/0 0/0 0 18Johnson, Stevie 3 0 3 0 0 0 0 0/0 0/0 0 18Davis, Vernon 2 0 2 0 0 0 0 0/0 0/0 0 12Miller, Bruce 2 0 2 0 0 0 0 0/0 0/0 0 12Kaepernick, Colin 1 1 0 0 0 0 0 0/0 0/0 0 6Culliver, Chris 1 0 0 0 1 0 0 0/0 0/0 0 6Bethea, Antoine 1 0 0 1 0 0 0 0/0 0/0 0 6Johnson, Dontae 1 0 0 1 0 0 0 0/0 0/0 0 6Lloyd, Brandon 1 0 1 0 0 0 0 0/0 0/0 0 649ERS 33 10 20 2 1 0 0 33/33 25/31 0 306OPPONENTS 40 7 29 1 2* 0 1 40/40 20/20 0 340*returned blocked punt | 2-pt. conversions: Team: 0-0, Opponents: 0-0
2014 (8-8)Jim Harbaugh, Coach
W 28 at Dallas (91,174), S-7 17L 20 Chicago (70,799), SUN/S-14 28L 14 at Arizona (61,572), S-21 23W 26 Philadelphia (70,799), S-28 21W 22 Kansas City (70,799), O-5 17W 31 at St. Louis (56,851), MON/O-13 17L 17 at Denver (77,047), SUN/O-19 42- - BYE, O-26 -L 10 St. Louis (70,799) N-2 13W 27 at New Orleans (73,129), N-9 (OT) 24W 16 at New York Giants (80,352), N-16 10W 17 Washington (70,799), N-23 13L 3 Seattle (70,799), THU/N-27 19L 13 at Oakland (55,300), D-7 24L 7 at Seattle (68,526), D-14 17L 35 San Diego (70,799), SAT/D-20 (OT) 38W 20 Arizona (70,799), D-28 17 306 340
RUSHING No Yds Avg Long TDGore, Frank 255 1,106 4.3 52t 4Kaepernick, Colin 104 639 6.1 90t 1Hyde, Carlos 83 333 4.0 28 4Ellington, Bruce 6 28 4.7 15 1Patton, Quinton 1 20 20.0 20 0Smith, Alfonso 7 19 2.7 12 0Miller, Bruce 6 9 1.5 4 0Gabbert, Blaine 1 5 5.0 5 0Davis, Vernon 1 4 4.0 4 0Boldin, Anquan 1 4 4.0 4 0Crabtree, Michael 1 4 4.0 4 0Dahl, Craig 1 3 3.0 3 0Carrier, Derek 1 2 2.0 2 0James, LaMichael 2 0 0.0 1 0Team 470 2,176 4.6 90t 10Opponents 402 1,612 4.0 37t 7
RECEIVING No Yds Avg Long TDBoldin, Anquan 83 1,062 12.8 76t 5Crabtree, Michael 68 698 10.3 51 4Johnson, Stevie 35 435 12.4 32 3Davis, Vernon 26 245 9.4 29t 2Miller, Bruce 18 189 10.5 22 2Lloyd, Brandon 14 294 21.0 80t 1Hyde, Carlos 12 68 5.7 16 0Gore, Frank 11 111 10.1 55t 1Carrier, Derek 9 105 11.7 23 0Ellington, Bruce 6 62 10.3 20t 2Patton, Quinton 3 44 14.7 35 0Smith, Alfonso 3 11 3.7 5 0Celek, Garrett 2 53 26.5 31 0McDonald, Vance 2 30 15.0 21 0Cleveland, Asante 0 0 0 0 0Osgood, Kassim 0 0 0 0 0Team 292 3,407 11.7 80t 20Opponents 324 3,731 11.5 63 29
INTERCEPTIONS No Yds Avg Long TDCox, Perrish 5 12 2.4 10 0Bethea, Antoine 4 71 17.8 49t 1Culliver. Chris 4 61 15.3 29 0Reid, Eric 3 138 46.0 73 0Borland, Chris 2 12 6.0 12 0Wilhoite, Michael 2 1 0.5 1 0Johnson, Dontae 1 20 20.0 20t 1Dahl, Craig 1 0 0.0 0 0Willis, Patrick 1 0 0.0 0 0Team 23 315 13.7 73 2Opponents 10 111 11.1 53t 1
KICKOFF RETURNS No Yds Avg Long TDEllington, Bruce 24 614 25.6 38 0Hyde, Carlos 11 268 24.4 30 0Holliday, Trindon 3 83 27.7 32 0Cox, Perrish 2 60 30.0 57 0Patton, Quinton 1 24 24.0 24 0Miller, Bruce 1 19 19.0 19 0Jerod-Eddie, Tony 1 18 18.0 18 0Lynch, Aaron 1 10 10.0 10 0Thomas, Chase 1 8 8.0 8 0Team 45 1,104 24.5 57 0Opponents 40 907 22.7 38 0
PUNT RETURNS Ret FC Yds Avg Long TDEllington, Bruce 23 12 188 8.2 23 0Cox, Perrish 10 1 35 3.5 9 0Osgood, Kassim 1 0 2 2.0 2 0Cook, Chris 1 0 2 2.0 2 0Team 35 13 227 6.5 23 0Opponents 36 22 336 9.3 82t 1
PUNTING No Yds Avg Net TB I-20 Lg BLee, Andy 72 3,369 46.8 39.6 7 28 71 1Team 73 3,369 46.2 39.6 7 28 71 1Opponents 74 3,362 45.4 40.2 8 21 61 1
PASSING Att Comp Pct Yds LG TD Int QBKaepernick, Colin 478 289 60.5 3,369 80t 19 10 86.4Gabbert, Blaine 7 3 42.9 38 20t 1 0 100.0Boldin, Anquan 1 0 0.0 0 0 0 0 39.6Lee, Andy 1 0 0.0 0 0 0 0 39.649ERS 487 292 60.0 3,407 80t 20 10 86.3OPPONENTS 551 324 58.8 3,731 63 29 23 79.5
Rookie Names in Italics

SAN FRANCISCO 49ERS
M E D I A G U I D E2 0 1 7 S E A S O N 496
TEAM STATISTICS 49ers OppTOTAL FIRST DOWNS 261 356 Rushing 83 128 Passing 154 199 Penalty 24 29TOTAL YARDS GAINED 4,860 6,199 By Rushing 1,544 2,020 By Passing 3,316 4,179TOTAL PLAYS FROM SCRIMMAGE 969 1,081 Rushes 390 504 Average Gain Per Rush 4.0 4.0NET YARDS PASSING 3,316 4,179 Passes Attempted 526 549 Passes Completed 322 375 Percent Completed 61.2 68.3 Had Intercepted 12 9 Times Sacked 53 28 Lost Attempting to Pass 330 196PUNTS 92 74 Total Yardage of Punts 4,017 3,363 Average Length 43.7 45.4KICKOFF RETURNS 42 23 Total Yards Returned 993 591 Average Length of Return 23.6 25.7PENALTIES 113 112 Yards Penalized 823 920FUMBLES 21 10 Own Fumbles Recovered 16 7 Opponents’ Fumbles Recovered 3 5FIELD GOALS 24 28 Field Goals Attempted 27 37TOTAL POINTS SCORED 238 387 Touchdowns Scored 24 43 Touchdowns Rushing 7 20 Touchdowns Passing 16 21 Touchdown Returns 1 2 Extra Points 20 35 Field Goals 24 28 Safeties 0 2AVG. TIME OF POSSESSION 26:20 33:40
SCORING TDs Ru Pa Int Fu KO Pu PAT FG S PtsDawson, Phil 0 0 0 0 0 0 0 20/21 24/27 0 92Smith, Torrey 4 0 4 0 0 0 0 0/0 0/0 0 26Boldin, Anquan 4 0 4 0 0 0 0 0/0 0/0 0 24Celek, Garrett 3 0 3 0 0 0 0 0/0 0/0 0 18McDonald, Vance 3 0 3 0 0 0 0 0/0 0/0 0 18Hyde, Carlos 3 3 0 0 0 0 0 0/0 0/0 0 18Ward, Jimmie 1 0 0 1 0 0 0 0/0 0/0 0 6Patton, Quinton 1 0 1 0 0 0 0 0/0 0/0 0 6Miller, Bruce 1 1 0 0 0 0 0 0/0 0/0 0 6Draughn, Shaun 1 1 0 0 0 0 0 0/0 0/0 0 6Simpson, Jerome 1 0 1 0 0 0 0 0/0 0/0 0 6Gabbert, Blaine 1 1 0 0 0 0 0 0/0 0/0 0 6Kaepernick, Colin 1 1 0 0 0 0 0 0/0 0/0 0 649ERS 24 7 16 1 0 0 0 20/21 24/27 0 238OPPONENTS 43 20 21 2 0 0 0 35/39 28/37 2 3872-pt. conversions: Team: 1-2, Opponents: 3-4
2015 (5-11)Jim Tomsula, Coach
W 20 Minnesota (70,799), MON/S-14 3L 18 at Pittsburgh (66,472), S-20 43L 7 at Arizona (63,663), S-27 47L 3 Green Bay (70,799), O-4 17L 27 at New York Giants (78,515), SUN/O-11 30W 25 Baltimore (70,799), O-18 20L 3 Seattle (70,799), THU/O-22 20L 6 at St. Louis (51,207), N-1 27W 17 Atlanta (70,799), N-8 16- - BYE, N-15 -L 13 at Seattle (68,993), N-22 29L 13 Arizona (70,799), N-29 19W 26 at Chicago (62,088), D-6 (OT) 20L 10 at Cleveland (63,916), D-13 24L 14 Cincinnati (70,799), D-20 24L 17 at Detroit (61,313), D-27 32W 19 St. Louis (70,799), J-3 (OT) 16 238 387
RUSHING No Yds Avg Long TDHyde, Carlos 115 470 4.1 22 3Draughn, Shaun 76 263 3.5 30 1Kaepernick, Colin 45 256 5.7 15 1Gabbert, Blaine 32 185 5.8 44t 1Harris, DuJuan 27 140 5.2 47 0Davis, Mike 35 58 1.7 13 0Hayne, Jarryd 17 52 3.1 11 0Gaskins, Kendall 16 38 2.4 14 0Bush, Reggie 8 28 3.5 9 0Cadet, Travaris 7 16 2.3 4 0Miller, Bruce 6 14 2.3 4 1Thomas, Pierre 4 12 3.0 4 0Ellington, Bruce 1 7 7.0 7 0Patton, Quinton 1 5 5.0 5 0Team 390 1,544 4.0 47 7Opponents 504 2,020 4.0 71t 20
RECEIVING No Yds Avg Long TDBoldin, Anquan 69 789 11.4 51 4Smith, Torrey 33 663 20.1 76t 4Patton, Quinton 30 394 13.1 41 1McDonald, Vance 30 326 10.9 36 3Draughn, Shaun 25 175 7.0 26 0Celek, Garrett 19 186 9.8 33 3Davis, Vernon 18 194 10.8 43 0Bell, Blake 15 186 12.4 48 0Ellington, Bruce 13 153 11.8 44 0Hyde, Carlos 11 53 4.8 11 0Miller, Bruce 10 135 13.5 52 0Harris, DuJuan 9 97 10.8 31 0Gaskins, Kendall 8 69 8.6 16 0Cadet, Travaris 7 66 9.4 16 0Davis, Mike 7 38 5.4 11 0Hayne, Jarryd 6 27 4.5 7 0Simpson, Jerome 5 54 10.8 16 1Bush, Reggie 4 19 4.8 8 0White, DeAndrew 2 18 9.0 10 0Leonhardt, Brian 1 4 4.0 4 0Team 322 3646 11.3 76t 16Opponents 375 4375 11.7 66t 21
INTERCEPTIONS No Yds Avg Long TDAcker, Kenneth 3 45 15.0 45 0Brock, Tramaine 3 26 8.7 26 0Ward, Jimmie 1 29 29.0 29t 1Tartt, Jaquiski 1 25 25.0 25 0Wilhoite, Michael 1 0 0.0 0 0Team 9 125 13.9 45 1Opponents 12 174 14.5 42 2
KICKOFF RETURNS No Yds Avg Long TDEllington, Bruce 26 665 25.6 40 0Patton, Quinton 7 157 22.4 35 0White, DeAndrew 6 142 23.7 30 0Thomas, Pierre 1 15 15.0 15 0Jerod-Eddie, Tony 1 11 11.0 11 0Miller, Bruce 1 3 3.0 3 0Team 42 993 23.6 40 0Opponents 23 591 25.7 74 0
PUNT RETURNS Ret FC Yds Avg Long TDEllington, Bruce 19 17 137 7.2 36 0Hayne, Jarryd 8 5 76 9.5 37 0Bush, Reggie 2 1 9 4.5 9 0White, DeAndrew 1 0 4 4.0 4 0Team 30 23 226 7.5 37 0Opponents 44 22 283 6.4 41 0
PUNTING No Yds Avg Net TB I-20 Lg BPinion, Bradley 91 3969 43.6 39.4 5 31 62 0Dawson, Phil 1 48 48.0 47.0 0 0 48 0Team 92 4017 43.7 39.5 5 31 62 0Opponents 74 3363 45.4 40.5 7 31 68 0
PASSING Att Comp Pct Yds LG TD Int QBGabbert, Blaine 282 178 63.1 2,031 71t 10 7 86.2Kaepernick, Colin 244 144 59.0 1,615 76t 6 5 78.549ERS 526 322 61.2 3,646 76t 16 12 82.6OPPONENTS 549 375 68.3 4,375 66t 21 9 98.1
Rookie Names in Italics
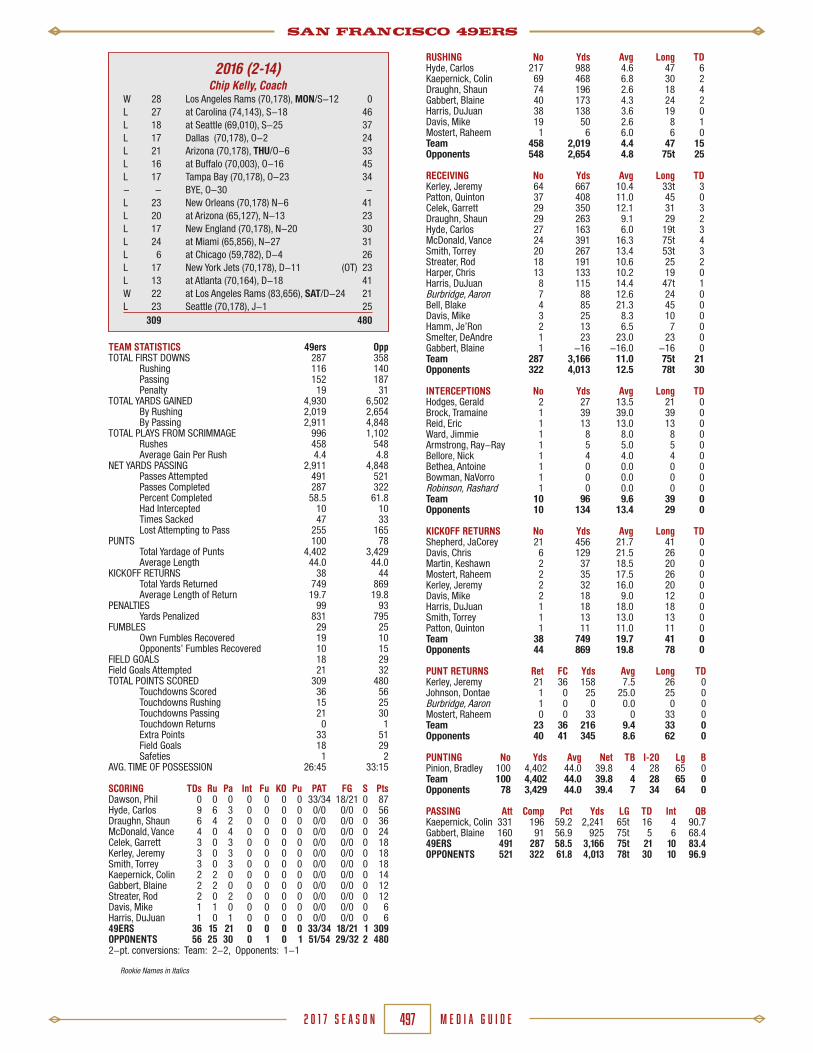
SAN FRANCISCO 49ERS
M E D I A G U I D E2 0 1 7 S E A S O N 497
TEAM STATISTICS 49ers OppTOTAL FIRST DOWNS 287 358 Rushing 116 140 Passing 152 187 Penalty 19 31TOTAL YARDS GAINED 4,930 6,502 By Rushing 2,019 2,654 By Passing 2,911 4,848TOTAL PLAYS FROM SCRIMMAGE 996 1,102 Rushes 458 548 Average Gain Per Rush 4.4 4.8NET YARDS PASSING 2,911 4,848 Passes Attempted 491 521 Passes Completed 287 322 Percent Completed 58.5 61.8 Had Intercepted 10 10 Times Sacked 47 33 Lost Attempting to Pass 255 165PUNTS 100 78 Total Yardage of Punts 4,402 3,429 Average Length 44.0 44.0KICKOFF RETURNS 38 44 Total Yards Returned 749 869 Average Length of Return 19.7 19.8PENALTIES 99 93 Yards Penalized 831 795FUMBLES 29 25 Own Fumbles Recovered 19 10 Opponents’ Fumbles Recovered 10 15FIELD GOALS 18 29 Field Goals Attempted 21 32TOTAL POINTS SCORED 309 480 Touchdowns Scored 36 56 Touchdowns Rushing 15 25 Touchdowns Passing 21 30 Touchdown Returns 0 1 Extra Points 33 51 Field Goals 18 29 Safeties 1 2AVG. TIME OF POSSESSION 26:45 33:15
SCORING TDs Ru Pa Int Fu KO Pu PAT FG S PtsDawson, Phil 0 0 0 0 0 0 0 33/34 18/21 0 87Hyde, Carlos 9 6 3 0 0 0 0 0/0 0/0 0 56Draughn, Shaun 6 4 2 0 0 0 0 0/0 0/0 0 36McDonald, Vance 4 0 4 0 0 0 0 0/0 0/0 0 24Celek, Garrett 3 0 3 0 0 0 0 0/0 0/0 0 18Kerley, Jeremy 3 0 3 0 0 0 0 0/0 0/0 0 18Smith, Torrey 3 0 3 0 0 0 0 0/0 0/0 0 18Kaepernick, Colin 2 2 0 0 0 0 0 0/0 0/0 0 14Gabbert, Blaine 2 2 0 0 0 0 0 0/0 0/0 0 12Streater, Rod 2 0 2 0 0 0 0 0/0 0/0 0 12Davis, Mike 1 1 0 0 0 0 0 0/0 0/0 0 6Harris, DuJuan 1 0 1 0 0 0 0 0/0 0/0 0 649ERS 36 15 21 0 0 0 0 33/34 18/21 1 309OPPONENTS 56 25 30 0 1 0 1 51/54 29/32 2 4802-pt. conversions: Team: 2-2, Opponents: 1-1
2016 (2-14)Chip Kelly, Coach
W 28 Los Angeles Rams (70,178), MON/S-12 0L 27 at Carolina (74,143), S-18 46L 18 at Seattle (69,010), S-25 37L 17 Dallas (70,178), O-2 24L 21 Arizona (70,178), THU/O-6 33L 16 at Buffalo (70,003), O-16 45L 17 Tampa Bay (70,178), O-23 34- - BYE, O-30 -L 23 New Orleans (70,178) N-6 41L 20 at Arizona (65,127), N-13 23L 17 New England (70,178), N-20 30L 24 at Miami (65,856), N-27 31L 6 at Chicago (59,782), D-4 26L 17 New York Jets (70,178), D-11 (OT) 23L 13 at Atlanta (70,164), D-18 41W 22 at Los Angeles Rams (83,656), SAT/D-24 21L 23 Seattle (70,178), J-1 25 309 480
RUSHING No Yds Avg Long TDHyde, Carlos 217 988 4.6 47 6Kaepernick, Colin 69 468 6.8 30 2Draughn, Shaun 74 196 2.6 18 4Gabbert, Blaine 40 173 4.3 24 2Harris, DuJuan 38 138 3.6 19 0Davis, Mike 19 50 2.6 8 1Mostert, Raheem 1 6 6.0 6 0 Team 458 2,019 4.4 47 15Opponents 548 2,654 4.8 75t 25
RECEIVING No Yds Avg Long TDKerley, Jeremy 64 667 10.4 33t 3Patton, Quinton 37 408 11.0 45 0Celek, Garrett 29 350 12.1 31 3Draughn, Shaun 29 263 9.1 29 2Hyde, Carlos 27 163 6.0 19t 3McDonald, Vance 24 391 16.3 75t 4Smith, Torrey 20 267 13.4 53t 3Streater, Rod 18 191 10.6 25 2Harper, Chris 13 133 10.2 19 0Harris, DuJuan 8 115 14.4 47t 1Burbridge, Aaron 7 88 12.6 24 0Bell, Blake 4 85 21.3 45 0Davis, Mike 3 25 8.3 10 0Hamm, Je’Ron 2 13 6.5 7 0Smelter, DeAndre 1 23 23.0 23 0Gabbert, Blaine 1 -16 -16.0 -16 0 Team 287 3,166 11.0 75t 21Opponents 322 4,013 12.5 78t 30
INTERCEPTIONS No Yds Avg Long TDHodges, Gerald 2 27 13.5 21 0Brock, Tramaine 1 39 39.0 39 0Reid, Eric 1 13 13.0 13 0Ward, Jimmie 1 8 8.0 8 0Armstrong, Ray-Ray 1 5 5.0 5 0Bellore, Nick 1 4 4.0 4 0Bethea, Antoine 1 0 0.0 0 0Bowman, NaVorro 1 0 0.0 0 0Robinson, Rashard 1 0 0.0 0 0Team 10 96 9.6 39 0Opponents 10 134 13.4 29 0
KICKOFF RETURNS No Yds Avg Long TDShepherd, JaCorey 21 456 21.7 41 0Davis, Chris 6 129 21.5 26 0Martin, Keshawn 2 37 18.5 20 0Mostert, Raheem 2 35 17.5 26 0Kerley, Jeremy 2 32 16.0 20 0Davis, Mike 2 18 9.0 12 0Harris, DuJuan 1 18 18.0 18 0Smith, Torrey 1 13 13.0 13 0Patton, Quinton 1 11 11.0 11 0Team 38 749 19.7 41 0Opponents 44 869 19.8 78 0
PUNT RETURNS Ret FC Yds Avg Long TDKerley, Jeremy 21 36 158 7.5 26 0Johnson, Dontae 1 0 25 25.0 25 0Burbridge, Aaron 1 0 0 0.0 0 0Mostert, Raheem 0 0 33 0 33 0Team 23 36 216 9.4 33 0Opponents 40 41 345 8.6 62 0
PUNTING No Yds Avg Net TB I-20 Lg BPinion, Bradley 100 4,402 44.0 39.8 4 28 65 0 Team 100 4,402 44.0 39.8 4 28 65 0Opponents 78 3,429 44.0 39.4 7 34 64 0
PASSING Att Comp Pct Yds LG TD Int QBKaepernick, Colin 331 196 59.2 2,241 65t 16 4 90.7Gabbert, Blaine 160 91 56.9 925 75t 5 6 68.449ERS 491 287 58.5 3,166 75t 21 10 83.4OPPONENTS 521 322 61.8 4,013 78t 30 10 96.9
Rookie Names in Italics

SAN FRANCISCO 49ERS
M E D I A G U I D E2 0 1 7 S E A S O N 498
49ERS RECORD VS. OPPONENTS(National Football League - 1950-Present)
ARIZONA CARDINALS Overall: 29-22 Home: 17-10 Away: 12-12
Date Win Score Location11/18/51 Cardinals 27-21 SF*9/29/57 Cardinals 20-10 SF*11/25/62 49ers 24-17 SL9/27/64 Cardinals 23-13 SF9/22/68 49ers 35-17 SF10/24/71 49ers 26-14 SL10/6/74 Cardinals 34-9 SF10/31/76 Cardinals 23-20 (OT) SL11/12/78 Cardinals 16-10 SF12/2/79 Cardinals 13-10 SL9/14/80 49ers 24-21 (OT) SF11/21/82 49ers 31-20 SL9/18/83 49ers 42-27 SL11/9/86 49ers 43-17 SF10/18/87 49ers 34-28 SF11/6/88 Cardinals 24-23 P11/17/91 49ers 14-10 SF
Date Win Score Location11/1/92 Cardinals 24-14 P10/24/93 49ers 28-14 SF9/27/99 49ers 24-10 AZ10/1/00 49ers 27-20 SF10/27/02 49ers 38-28 SF12/21/02 49ers 17-14 AZ10/26/03 Cardinals 16-13 (OT) AZ12/7/03 49ers 50-14 SF10/10/04 49ers 31-28 (OT) SF12/12/04 49ers 31-28 (OT) AZ10/2/05 Cardinals 31-14 MC12/4/05 Cardinals 17-10 SF9/10/06 Cardinals 34-27 AZ12/24/06 Cardinals 26-20 SF9/10/07 49ers 20-17 SF11/25/07 49ers 37-31 (OT) AZ9/7/08 Cardinals 23-13 SF
Date Win Score Location11/10/08 Cardinals 29-24 AZ9/13/09 49ers 20-16 AZ12/14/09 49ers 24-9 SF11/29/10 49ers 27-6 AZ1/2/11 49ers 38-7 SF11/20/11 49ers 23-7 SF12/11/11 Cardinals 21-19 AZ10/29/12 49ers 24-3 AZ12/30/12 49ers 27-13 SF10/13/13 49ers 32-20 SF12/29/13 49ers 23-20 AZ9/21/14 Cardinals 23-14 AZ12/28/14 49ers 20-17 SF9/27/15 Cardinals 47-7 AZ11/29/15 Cardinals 19-13 SF10/6/16 Cardinals 33-21 SF11/13/16 Cardinals 23-20 AZ
Record: At Levi’s Stadium: (1-2) University of Phoenix: (5-6) Points: At Levi’s Stadium: (74-92) University of Phoenix: (231-221)
* Chicago Cards (SL) - St. Louis (P) - Phoenix (AZ) - Arizona (MC) - Mexico City
ATLANTA FALCONS Overall: 47-31-1 Home: 28-11 Away: 19-20-1
Date Win Score Location10/16/66 49ers 44-7 A9/24/67 49ers 38-7 SF12/10/67 49ers 34-28 A9/29/68 49ers 28-13 SF12/15/68 49ers 14-12 A9/21/69 Falcons 24-12 A10/19/69 Falcons 21-7 SF10/4/70 Falcons 21-0 A12/06/70 49ers 24-20 SF9/19/71 Falcons 20-17 A12/12/71 49ers 24-3 SF10/29/72 49ers 49-14 A12/10/72 49ers 20-0 SF10/7/73 49ers 13-9 A10/28/73 Falcons 17-3 SF9/22/74 49ers 16-10 A11/24/74 49ers 27-0 SF10/12/75 Falcons 17-3 SF12/14/75 Falcons 31-9 A10/23/76 49ers 15-0 SF11/14/76 Falcons 21-16 A10/9/77 Falcons 7-0 SF11/6/77 49ers 10-3 A10/22/78 Falcons 20-17 SF11/5/78 Falcons 21-10 A10/21/79 49ers 20-15 SF12/16/79 Falcons 31-21 A
Date Win Score Location9/28/80 Falcons 20-17 SF12/14/80 Falcons 35-10 A9/20/81 Falcons 34-17 A11/8/81 49ers 17-14 SF12/19/82 Falcons 17-7 SF9/25/83 49ers 24-20 SF11/20/83 Falcons 28-24 A9/30/84 49ers 14-5 SF12/2/84 49ers 35-17 A9/15/85 49ers 35-16 SF10/6/85 49ers 38-17 A10/19/86 Tie 10-10 (OT) A11/23/86 49ers 20-0 SF10/11/87 49ers 25-17 A12/20/87 49ers 35-7 SF9/18/88 Falcons 34-17 SF12/4/88 49ers 13-3 A11/12/89 49ers 45-3 SF12/3/89 49ers 23-10 A9/23/90 49ers 19-13 SF10/14/90 49ers 45-35 A10/13/91 Falcons 39-34 SF11/3/91 Falcons 17-14 A10/18/92 49ers 56-17 SF11/9/92 49ers 41-3 A9/19/93 49ers 37-30 SF12/11/93 Falcons 27-24 A
Date Win Score Location10/16/94 49ers 42-3 A12/4/94 49ers 50-14 SF9/10/95 49ers 41-10 SF12/24/95 Falcons 28-27 A9/29/96 49ers 39-17 SF12/2/96 49ers 34-10 A9/21/97 49ers 34-7 SF10/19/97 49ers 35-28 A9/27/98 49ers 31-20 SF11/15/98 Falcons 31-19 A1/9/99 (d) Falcons 20-18 A12/12/99 49ers 26-7 SF1/3/00 Falcons 34-29 A9/3/00 Falcons 36-28 A11/19/00 49ers 16-6 SF9/9/01 49ers 16-13 (OT) SF10/14/01 49ers 37-31 (OT) A9/12/04 Falcons 21-19 SF11/4/07 Falcons 20-16 A10/11/09 Falcons 45-10 SF10/3/10 Falcons 16-14 A1/20/13 (c) 49ers 28-24 A12/23/13 49ers 34-24 SF11/8/15 49ers 17-16 SF12/18/16 Falcons 41-13 A
Record: At Levi’s Stadium: (1-0) Mercedes-Benz Stadium: (0-0) Points: At Levi’s Stadium: (17-16) Mercedes-Benz Stadium: (0-0)
(d) - NFC Divisional Playoff (c) - NFC Championship Game
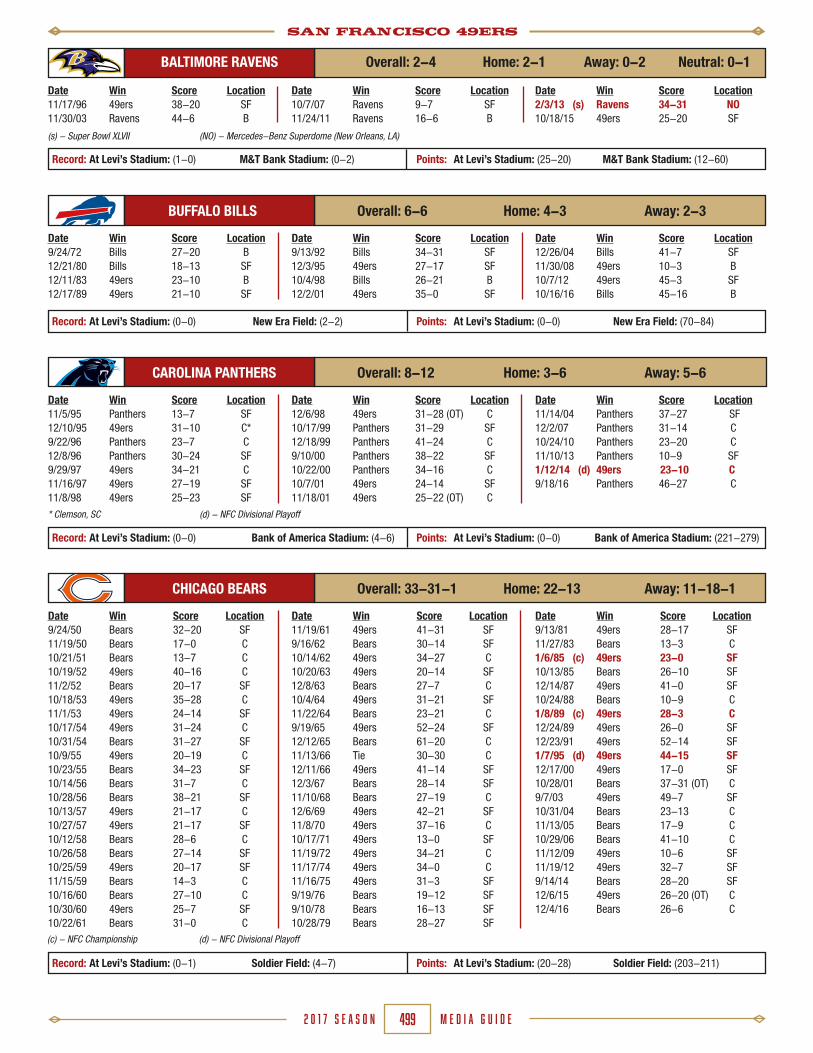
SAN FRANCISCO 49ERS
M E D I A G U I D E2 0 1 7 S E A S O N 499
BUFFALO BILLS Overall: 6-6 Home: 4-3 Away: 2-3
Date Win Score Location9/24/72 Bills 27-20 B12/21/80 Bills 18-13 SF12/11/83 49ers 23-10 B12/17/89 49ers 21-10 SF
Date Win Score Location9/13/92 Bills 34-31 SF12/3/95 49ers 27-17 SF10/4/98 Bills 26-21 B12/2/01 49ers 35-0 SF
Date Win Score Location12/26/04 Bills 41-7 SF11/30/08 49ers 10-3 B10/7/12 49ers 45-3 SF10/16/16 Bills 45-16 B
Record: At Levi’s Stadium: (0-0) New Era Field: (2-2) Points: At Levi’s Stadium: (0-0) New Era Field: (70-84)
CAROLINA PANTHERS Overall: 8-12 Home: 3-6 Away: 5-6
Date Win Score Location11/5/95 Panthers 13-7 SF12/10/95 49ers 31-10 C*9/22/96 Panthers 23-7 C12/8/96 Panthers 30-24 SF9/29/97 49ers 34-21 C11/16/97 49ers 27-19 SF11/8/98 49ers 25-23 SF
Date Win Score Location12/6/98 49ers 31-28 (OT) C10/17/99 Panthers 31-29 SF12/18/99 Panthers 41-24 C9/10/00 Panthers 38-22 SF10/22/00 Panthers 34-16 C10/7/01 49ers 24-14 SF11/18/01 49ers 25-22 (OT) C
Date Win Score Location11/14/04 Panthers 37-27 SF12/2/07 Panthers 31-14 C10/24/10 Panthers 23-20 C11/10/13 Panthers 10-9 SF1/12/14 (d) 49ers 23-10 C9/18/16 Panthers 46-27 C
Record: At Levi’s Stadium: (0-0) Bank of America Stadium: (4-6) Points: At Levi’s Stadium: (0-0) Bank of America Stadium: (221-279)
* Clemson, SC (d) - NFC Divisional Playoff
CHICAGO BEARS Overall: 33-31-1 Home: 22-13 Away: 11-18-1
Date Win Score Location9/24/50 Bears 32-20 SF11/19/50 Bears 17-0 C10/21/51 Bears 13-7 C10/19/52 49ers 40-16 C11/2/52 Bears 20-17 SF10/18/53 49ers 35-28 C11/1/53 49ers 24-14 SF10/17/54 49ers 31-24 C10/31/54 Bears 31-27 SF10/9/55 49ers 20-19 C10/23/55 Bears 34-23 SF10/14/56 Bears 31-7 C10/28/56 Bears 38-21 SF10/13/57 49ers 21-17 C10/27/57 49ers 21-17 SF10/12/58 Bears 28-6 C10/26/58 Bears 27-14 SF10/25/59 49ers 20-17 SF11/15/59 Bears 14-3 C10/16/60 Bears 27-10 C10/30/60 49ers 25-7 SF10/22/61 Bears 31-0 C
Date Win Score Location11/19/61 49ers 41-31 SF9/16/62 Bears 30-14 SF10/14/62 49ers 34-27 C10/20/63 49ers 20-14 SF12/8/63 Bears 27-7 C10/4/64 49ers 31-21 SF11/22/64 Bears 23-21 C9/19/65 49ers 52-24 SF12/12/65 Bears 61-20 C11/13/66 Tie 30-30 C12/11/66 49ers 41-14 SF12/3/67 Bears 28-14 SF11/10/68 Bears 27-19 C12/6/69 49ers 42-21 SF11/8/70 49ers 37-16 C10/17/71 49ers 13-0 SF11/19/72 49ers 34-21 C11/17/74 49ers 34-0 C11/16/75 49ers 31-3 SF9/19/76 Bears 19-12 SF9/10/78 Bears 16-13 SF10/28/79 Bears 28-27 SF
Date Win Score Location9/13/81 49ers 28-17 SF11/27/83 Bears 13-3 C1/6/85 (c) 49ers 23-0 SF10/13/85 Bears 26-10 SF12/14/87 49ers 41-0 SF10/24/88 Bears 10-9 C1/8/89 (c) 49ers 28-3 C12/24/89 49ers 26-0 SF12/23/91 49ers 52-14 SF1/7/95 (d) 49ers 44-15 SF12/17/00 49ers 17-0 SF10/28/01 Bears 37-31 (OT) C9/7/03 49ers 49-7 SF10/31/04 Bears 23-13 C11/13/05 Bears 17-9 C10/29/06 Bears 41-10 C11/12/09 49ers 10-6 SF11/19/12 49ers 32-7 SF9/14/14 Bears 28-20 SF12/6/15 49ers 26-20 (OT) C12/4/16 Bears 26-6 C
Record: At Levi’s Stadium: (0-1) Soldier Field: (4-7) Points: At Levi’s Stadium: (20-28) Soldier Field: (203-211)
(c) - NFC Championship (d) - NFC Divisional Playoff
Date Win Score Location11/17/96 49ers 38-20 SF11/30/03 Ravens 44-6 B
Date Win Score Location10/7/07 Ravens 9-7 SF11/24/11 Ravens 16-6 B
Date Win Score Location2/3/13 (s) Ravens 34-31 NO10/18/15 49ers 25-20 SF
Record: At Levi’s Stadium: (1-0) M&T Bank Stadium: (0-2) Points: At Levi’s Stadium: (25-20) M&T Bank Stadium: (12-60)
(s) - Super Bowl XLVII (NO) - Mercedes-Benz Superdome (New Orleans, LA)
BALTIMORE RAVENS Overall: 2-4 Home: 2-1 Away: 0-2 Neutral: 0-1

SAN FRANCISCO 49ERS
M E D I A G U I D E2 0 1 7 S E A S O N 500
CINCINNATI BENGALS Overall: 11-4 Home: 5-2 Away: 4-2 Neutral: 2-0
Date Win Score Location9/29/74 Bengals 21-3 SF10/1/78 49ers 28-12 SF12/6/81 49ers 21-3 C1/24/82 49ers (s) 26-21 D11/4/84 49ers 23-17 SF
Date Win Score Location9/20/87 49ers 27-26 C1/22/89 49ers (s) 20-16 M12/9/90 49ers 20-17 (OT) C12/5/93 49ers 21-8 SF10/20/96 49ers 28-21 SF
Date Win Score Location12/5/99 Bengals 44-30 C12/14/03 Bengals 41-38 C12/15/07 49ers 20-13 SF9/25/11 49ers 13-8 C12/20/15 Bengals 24-14 SF
Record: At Levi’s Stadium: (0-1) Paul Brown Stadium: (1-1) Points: At Levi’s Stadium: (14-24) Paul Brown Stadium: (51-49)
(s) - Super Bowl XVI & XXIII (D) - Pontiac Silverdome (Pontiac, MI) (M) - Joe Robbie Stadium (Miami, FL)
CLEVELAND BROWNS Overall: 7-12 Home: 5-5 Away: 2-7
Date Win Score Location11/12/50 Browns 34-14 C9/30/51 49ers 24-10 SF11/15/53 Browns 23-21 C10/2/55 Browns 38-3 SF11/29/59 49ers 21-20 C12/15/62 Browns 13-10 SF11/3/68 Browns 33-21 SF
Date Win Score Location9/27/70 49ers 34-31 SF12/1/74 Browns 7-0 C9/3/78 Browns 24-7 C11/15/81 Browns 15-12 SF11/11/84 49ers 41-7 C11/29/87 49ers 38-24 SF10/28/90 49ers 20-17 SF
Date Win Score Location9/13/93 Browns 23-13 C9/21/03 Browns 13-12 SF12/30/07 Browns 20-7 C10/30/11 49ers 20-10 SF12/13/15 Browns 24-10 C
Record: At Levi’s Stadium: (0-0) FirstEnergy Stadium: (0-2) Points: At Levi’s Stadium: (0-0) FirstEnergy Stadium: (17-44)
DALLAS COWBOYS Overall: 17-17-1 Home: 9-9 Away: 8-8-1
Date Win Score Location11/20/60 49ers 26-14 D11/10/63 49ers 31-24 SF11/7/65 Cowboys 39-31 D12/16/67 49ers 24-16 SF11/27/69 Tie 24-24 D1/3/71 (c) Cowboys 17-10 SF1/2/72 (c) Cowboys 14-3 D11/23/72 49ers 31-10 D12/23/72 (d) Cowboys 30-28 SF11/10/74 Cowboys 20-14 D12/12/77 Cowboys 42-35 SF9/9/79 Cowboys 21-13 SF
Date Win Score Location10/12/80 Cowboys 59-14 D10/11/81 49ers 45-14 SF1/10/82 (c) 49ers 28-27 SF12/19/83 49ers 42-17 SF12/22/85 49ers 31-16 SF10/15/89 49ers 31-14 D11/11/90 49ers 24-6 D1/17/93 (c) Cowboys 30-20 SF10/17/93 Cowboys 26-17 D1/23/94 (c) Cowboys 38-21 D11/13/94 49ers 21-14 SF1/15/95 (c) 49ers 38-28 SF
Date Win Score Location11/12/95 49ers 38-20 D11/10/96 Cowboys 20-17 (OT) SF11/2/97 49ers 17-10 SF9/24/00 49ers 41-24 D12/30/01 Cowboys 27-21 D12/8/02 49ers 31-27 D9/25/05 Cowboys 34-31 SF11/23/08 Cowboys 35-22 D9/18/11 Cowboys 27-24 (OT) SF9/7/14 49ers 28-17 D10/2/16 Cowboys 24-17 SF
Record: At Levi’s Stadium: (0-1) AT&T Stadium: (1-0) Points: At Levi’s Stadium: (17-24) AT&T Stadium: (28-17)
(c) - NFC Championship (d) - NFC Divisional Playoff
DENVER BRONCOS Overall: 7-7 Home: 4-3 Away: 2-4 Neutral: 1-0
Date Win Score Location10/25/70 49ers 19-14 SF9/23/73 49ers 36-34 D11/18/79 Broncos 38-28 SF9/19/82 Broncos 24-21 D11/11/85 Broncos 17-16 D
Date Win Score Location10/9/88 Broncos 16-13 (OT) SF1/28/90 (s) 49ers 55-10 NO12/17/94 49ers 42-19 SF12/15/97 49ers 34-17 SF12/23/00 Broncos 38-9 D
Date Win Score Location9/15/02 Broncos 24-14 SF12/31/06 49ers 26-23 (OT) D10/31/10 49ers 24-16 London10/19/14 Broncos 42-17 D
Record: At Levi’s Stadium: (0-0) Sports Authority Field at Mile High: (1-1) Points: At Levi’s Stadium: (0-0) Sports Authority Field at Mile High: (43-65)
(s) - Super Bowl XXIV (NO) - Superdome (New Orleans, LA)
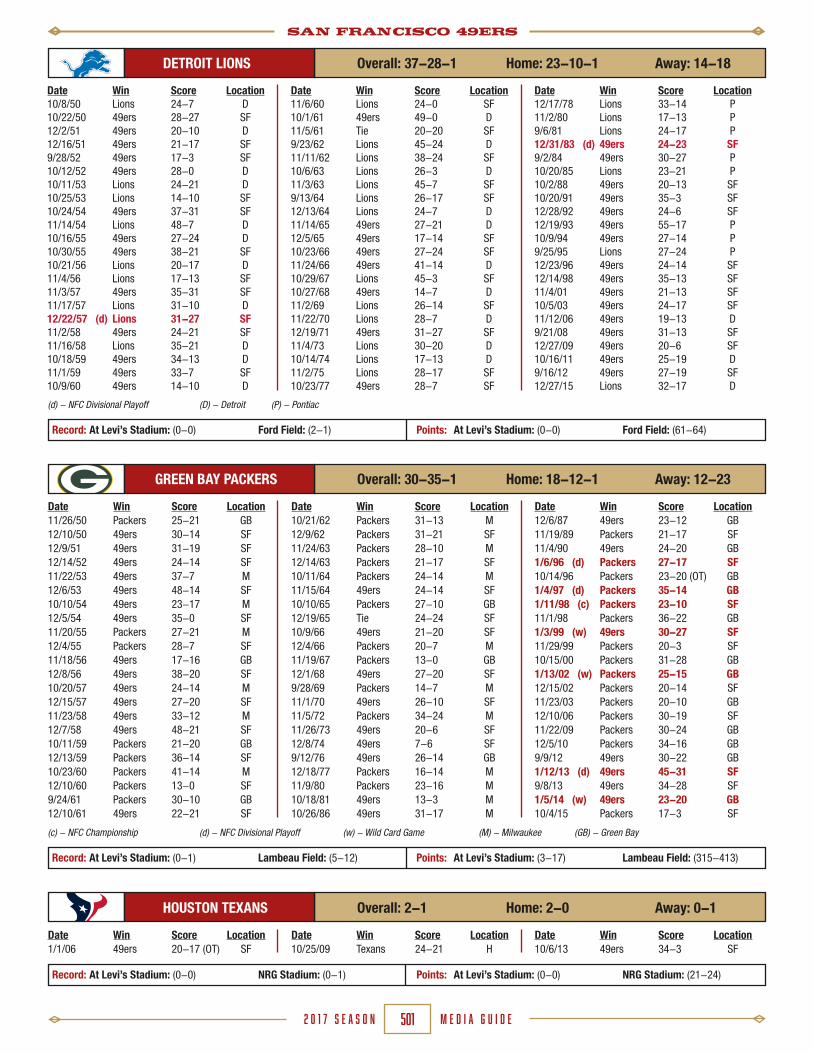
SAN FRANCISCO 49ERS
M E D I A G U I D E2 0 1 7 S E A S O N 501
DETROIT LIONS Overall: 37-28-1 Home: 23-10-1 Away: 14-18
Date Win Score Location10/8/50 Lions 24-7 D10/22/50 49ers 28-27 SF12/2/51 49ers 20-10 D12/16/51 49ers 21-17 SF9/28/52 49ers 17-3 SF10/12/52 49ers 28-0 D10/11/53 Lions 24-21 D 10/25/53 Lions 14-10 SF10/24/54 49ers 37-31 SF11/14/54 Lions 48-7 D10/16/55 49ers 27-24 D10/30/55 49ers 38-21 SF10/21/56 Lions 20-17 D11/4/56 Lions 17-13 SF11/3/57 49ers 35-31 SF11/17/57 Lions 31-10 D12/22/57 (d) Lions 31-27 SF11/2/58 49ers 24-21 SF11/16/58 Lions 35-21 D10/18/59 49ers 34-13 D11/1/59 49ers 33-7 SF10/9/60 49ers 14-10 D
Date Win Score Location11/6/60 Lions 24-0 SF10/1/61 49ers 49-0 D11/5/61 Tie 20-20 SF9/23/62 Lions 45-24 D11/11/62 Lions 38-24 SF10/6/63 Lions 26-3 D11/3/63 Lions 45-7 SF9/13/64 Lions 26-17 SF12/13/64 Lions 24-7 D11/14/65 49ers 27-21 D12/5/65 49ers 17-14 SF10/23/66 49ers 27-24 SF11/24/66 49ers 41-14 D10/29/67 Lions 45-3 SF10/27/68 49ers 14-7 D11/2/69 Lions 26-14 SF11/22/70 Lions 28-7 D12/19/71 49ers 31-27 SF11/4/73 Lions 30-20 D10/14/74 Lions 17-13 D11/2/75 Lions 28-17 SF10/23/77 49ers 28-7 SF
Date Win Score Location12/17/78 Lions 33-14 P11/2/80 Lions 17-13 P9/6/81 Lions 24-17 P12/31/83 (d) 49ers 24-23 SF9/2/84 49ers 30-27 P10/20/85 Lions 23-21 P10/2/88 49ers 20-13 SF10/20/91 49ers 35-3 SF12/28/92 49ers 24-6 SF12/19/93 49ers 55-17 P10/9/94 49ers 27-14 P9/25/95 Lions 27-24 P12/23/96 49ers 24-14 SF12/14/98 49ers 35-13 SF11/4/01 49ers 21-13 SF10/5/03 49ers 24-17 SF11/12/06 49ers 19-13 D9/21/08 49ers 31-13 SF12/27/09 49ers 20-6 SF10/16/11 49ers 25-19 D9/16/12 49ers 27-19 SF12/27/15 Lions 32-17 D
Record: At Levi’s Stadium: (0-0) Ford Field: (2-1) Points: At Levi’s Stadium: (0-0) Ford Field: (61-64)
(d) - NFC Divisional Playoff (D) - Detroit (P) - Pontiac
GREEN BAY PACKERS Overall: 30-35-1 Home: 18-12-1 Away: 12-23
Date Win Score Location11/26/50 Packers 25-21 GB12/10/50 49ers 30-14 SF12/9/51 49ers 31-19 SF12/14/52 49ers 24-14 SF11/22/53 49ers 37-7 M12/6/53 49ers 48-14 SF10/10/54 49ers 23-17 M12/5/54 49ers 35-0 SF11/20/55 Packers 27-21 M12/4/55 Packers 28-7 SF11/18/56 49ers 17-16 GB12/8/56 49ers 38-20 SF10/20/57 49ers 24-14 M12/15/57 49ers 27-20 SF11/23/58 49ers 33-12 M12/7/58 49ers 48-21 SF10/11/59 Packers 21-20 GB12/13/59 Packers 36-14 SF10/23/60 Packers 41-14 M12/10/60 Packers 13-0 SF9/24/61 Packers 30-10 GB12/10/61 49ers 22-21 SF
Date Win Score Location10/21/62 Packers 31-13 M12/9/62 Packers 31-21 SF11/24/63 Packers 28-10 M12/14/63 Packers 21-17 SF10/11/64 Packers 24-14 M11/15/64 49ers 24-14 SF10/10/65 Packers 27-10 GB12/19/65 Tie 24-24 SF10/9/66 49ers 21-20 SF12/4/66 Packers 20-7 M11/19/67 Packers 13-0 GB12/1/68 49ers 27-20 SF9/28/69 Packers 14-7 M11/1/70 49ers 26-10 SF11/5/72 Packers 34-24 M11/26/73 49ers 20-6 SF12/8/74 49ers 7-6 SF9/12/76 49ers 26-14 GB12/18/77 Packers 16-14 M11/9/80 Packers 23-16 M10/18/81 49ers 13-3 M10/26/86 49ers 31-17 M
Date Win Score Location12/6/87 49ers 23-12 GB11/19/89 Packers 21-17 SF11/4/90 49ers 24-20 GB1/6/96 (d) Packers 27-17 SF10/14/96 Packers 23-20 (OT) GB1/4/97 (d) Packers 35-14 GB1/11/98 (c) Packers 23-10 SF11/1/98 Packers 36-22 GB1/3/99 (w) 49ers 30-27 SF11/29/99 Packers 20-3 SF10/15/00 Packers 31-28 GB1/13/02 (w) Packers 25-15 GB12/15/02 Packers 20-14 SF11/23/03 Packers 20-10 GB12/10/06 Packers 30-19 SF11/22/09 Packers 30-24 GB12/5/10 Packers 34-16 GB9/9/12 49ers 30-22 GB1/12/13 (d) 49ers 45-31 SF9/8/13 49ers 34-28 SF1/5/14 (w) 49ers 23-20 GB10/4/15 Packers 17-3 SF
Record: At Levi’s Stadium: (0-1) Lambeau Field: (5-12) Points: At Levi’s Stadium: (3-17) Lambeau Field: (315-413)
(c) - NFC Championship (d) - NFC Divisional Playoff (w) - Wild Card Game (M) - Milwaukee (GB) - Green Bay
HOUSTON TEXANS Overall: 2-1 Home: 2-0 Away: 0-1
Date Win Score Location1/1/06 49ers 20-17 (OT) SF
Date Win Score Location10/25/09 Texans 24-21 H
Date Win Score Location10/6/13 49ers 34-3 SF
Record: At Levi’s Stadium: (0-0) NRG Stadium: (0-1) Points: At Levi’s Stadium: (0-0) NRG Stadium: (21-24)

SAN FRANCISCO 49ERS
M E D I A G U I D E2 0 1 7 S E A S O N 502
INDIANAPOLIS COLTS Overall: 18-25 Home: 11-11 Away: 7-14
Date Win Score Location11/29/53 49ers 38-21 B12/13/53 49ers 45-14 SF11/28/54 Colts 17-13 B12/11/54 49ers 10-7 SF11/27/55 Colts 26-14 B12/11/55 49ers 35-24 SF12/2/56 49ers 20-17 B12/16/56 49ers 30-17 SF11/24/57 Colts 27-21 B12/8/57 49ers 17-13 SF11/30/58 Colts 35-27 B12/14/58 49ers 21-12 SF11/22/59 Colts 45-14 B12/5/59 Colts 34-14 SF11/27/60 49ers 30-22 B
Date Win Score Location12/18/60 49ers 34-10 SF12/3/61 Colts 20-17 B12/16/61 Colts 27-24 SF10/7/62 49ers 21-13 B11/4/62 Colts 22-3 SF9/22/63 Colts 20-14 SF10/13/63 Colts 20-3 B11/1/64 Colts 37-7 B11/29/64 Colts 14-3 SF10/3/65 Colts 27-24 B10/31/65 Colts 34-28 SF9/25/66 Colts 36-14 B12/18/66 Colts 30-14 SF10/1/67 Colts 41-7 B11/26/67 Colts 26-9 SF
Date Win Score Location 9/15/68 Colts 27-10 B10/13/68 Colts 42-14 SF10/26/69 49ers 24-21 B11/16/69 49ers 20-17 SF11/12/72 49ers 24-21 SF10/5/86 49ers 35-14 SF9/10/89 49ers 30-24 I10/15/95 Colts 18-17 I10/18/98 49ers 34-31 SF11/25/01 49ers 40-21 I10/9/05 Colts 28-3 SF11/1/09 Colts 18-14 I9/22/13 Colts 27-7 SF
Record: At Levi’s Stadium: (0-0) Lucas Oil Stadium: (0-1) Points: At Levi’s Stadium: (0-0) Lucas Oil Stadium: (14-18)
(B) - Baltimore (I) - Indianapolis
JACKSONVILLE JAGUARS Overall: 2-2 Home: 1-0 Away: 1-2
Date Win Score Location9/12/99 Jaguars 41-3 J12/18/05 Jaguars 10-9 J
Date Win Score Location11/29/09 49ers 20-3 SF
Date Win Score Location10/27/13 49ers 42-10 London
Record: At Levi’s Stadium: (0-0) EverBank Field: (0-2) Points: At Levi’s Stadium: (0-0) EverBank Field: (12-51)
KANSAS CITY CHIEFS Overall: 7-5 Home: 5-1 Away: 2-4
Date Win Score Location12/6/71 Chiefs 26-17 SF10/5/75 49ers 20-3 KC12/26/82 49ers 26-13 KC11/17/85 49ers 31-3 SF
Date Win Score Location12/14/91 49ers 28-14 SF9/11/94 Chiefs 24-17 KC11/30/97 Chiefs 44-9 KC11/12/00 49ers 21-7 SF
Date Win Score Location11/10/02 49ers 17-13 SF10/1/06 Chiefs 41-0 KC9/26/10 Chiefs 31-10 KC10/5/14 49ers 22-17 SF
Record: At Levi’s Stadium: (1-0) Arrowhead Stadium: (2-4) Points: At Levi’s Stadium: (22-17) Arrowhead Stadium: (82-156)
(s) - Super Bowl XXIX (M) - Joe Robbie Stadium (Miami, FL) (SD) = San Diego
LOS ANGELES CHARGERS Overall: 7-7 Home: 3-3 Away: 3-4 Neutral: 1-0
Date Win Score Location9/17/72 49ers 34-3 SF12/5/76 Chargers 13-7 (OT) SD9/30/79 Chargers 31-9 SD12/11/82 Chargers 41-37 SF11/27/88 49ers 48-10 SD
Date Win Score Location 9/8/91 49ers 34-14 SF12/11/94 49ers 38-15 SD1/29/95 (s) 49ers 49-26 M11/23/97 49ers 17-10 SF12/3/00 49ers 45-17 SD
Date Win Score Location11/17/02 Chargers 20-17 (OT) SD10/15/06 Chargers 48-19 SF12/16/10 Chargers 34-7 SD12/20/14 Chargers 38-35 (OT) SF
Record: At Levi’s Stadium: (0-1) StubHub Center: (0-0) Points: At Levi’s Stadium: (35-38) StubHub Center: (0-0)
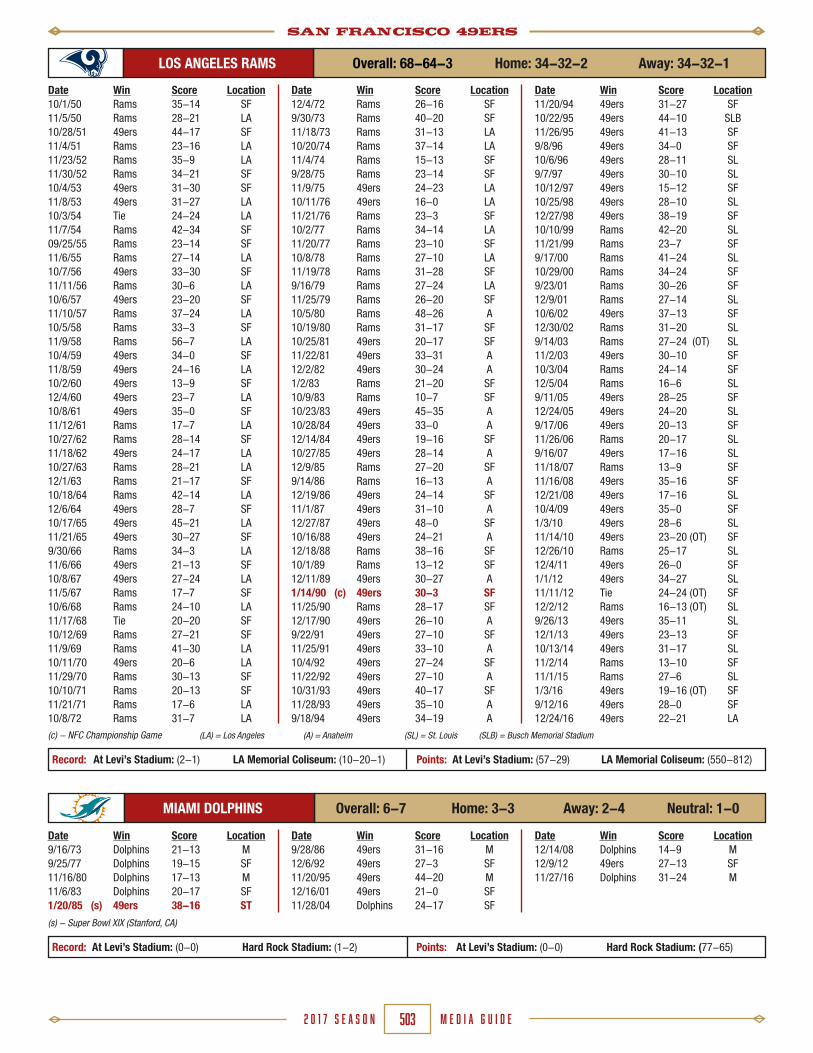
SAN FRANCISCO 49ERS
M E D I A G U I D E2 0 1 7 S E A S O N 503
LOS ANGELES RAMS Overall: 68-64-3 Home: 34-32-2 Away: 34-32-1
Date Win Score Location10/1/50 Rams 35-14 SF11/5/50 Rams 28-21 LA10/28/51 49ers 44-17 SF11/4/51 Rams 23-16 LA11/23/52 Rams 35-9 LA11/30/52 Rams 34-21 SF10/4/53 49ers 31-30 SF11/8/53 49ers 31-27 LA10/3/54 Tie 24-24 LA11/7/54 Rams 42-34 SF09/25/55 Rams 23-14 SF11/6/55 Rams 27-14 LA10/7/56 49ers 33-30 SF11/11/56 Rams 30-6 LA10/6/57 49ers 23-20 SF11/10/57 Rams 37-24 LA10/5/58 Rams 33-3 SF11/9/58 Rams 56-7 LA10/4/59 49ers 34-0 SF11/8/59 49ers 24-16 LA10/2/60 49ers 13-9 SF12/4/60 49ers 23-7 LA10/8/61 49ers 35-0 SF11/12/61 Rams 17-7 LA10/27/62 Rams 28-14 SF11/18/62 49ers 24-17 LA10/27/63 Rams 28-21 LA12/1/63 Rams 21-17 SF10/18/64 Rams 42-14 LA12/6/64 49ers 28-7 SF10/17/65 49ers 45-21 LA11/21/65 49ers 30-27 SF9/30/66 Rams 34-3 LA11/6/66 49ers 21-13 SF10/8/67 49ers 27-24 LA11/5/67 Rams 17-7 SF10/6/68 Rams 24-10 LA11/17/68 Tie 20-20 SF10/12/69 Rams 27-21 SF11/9/69 Rams 41-30 LA10/11/70 49ers 20-6 LA11/29/70 Rams 30-13 SF10/10/71 Rams 20-13 SF11/21/71 Rams 17-6 LA10/8/72 Rams 31-7 LA
Date Win Score Location12/4/72 Rams 26-16 SF9/30/73 Rams 40-20 SF11/18/73 Rams 31-13 LA10/20/74 Rams 37-14 LA11/4/74 Rams 15-13 SF9/28/75 Rams 23-14 SF11/9/75 49ers 24-23 LA10/11/76 49ers 16-0 LA11/21/76 Rams 23-3 SF10/2/77 Rams 34-14 LA11/20/77 Rams 23-10 SF10/8/78 Rams 27-10 LA11/19/78 Rams 31-28 SF9/16/79 Rams 27-24 LA11/25/79 Rams 26-20 SF10/5/80 Rams 48-26 A10/19/80 Rams 31-17 SF10/25/81 49ers 20-17 SF11/22/81 49ers 33-31 A12/2/82 49ers 30-24 A1/2/83 Rams 21-20 SF10/9/83 Rams 10-7 SF10/23/83 49ers 45-35 A10/28/84 49ers 33-0 A12/14/84 49ers 19-16 SF10/27/85 49ers 28-14 A12/9/85 Rams 27-20 SF9/14/86 Rams 16-13 A12/19/86 49ers 24-14 SF11/1/87 49ers 31-10 A12/27/87 49ers 48-0 SF10/16/88 49ers 24-21 A12/18/88 Rams 38-16 SF10/1/89 Rams 13-12 SF12/11/89 49ers 30-27 A1/14/90 (c) 49ers 30-3 SF11/25/90 Rams 28-17 SF12/17/90 49ers 26-10 A9/22/91 49ers 27-10 SF11/25/91 49ers 33-10 A10/4/92 49ers 27-24 SF11/22/92 49ers 27-10 A10/31/93 49ers 40-17 SF11/28/93 49ers 35-10 A9/18/94 49ers 34-19 A
Date Win Score Location11/20/94 49ers 31-27 SF10/22/95 49ers 44-10 SLB11/26/95 49ers 41-13 SF9/8/96 49ers 34-0 SF10/6/96 49ers 28-11 SL9/7/97 49ers 30-10 SL10/12/97 49ers 15-12 SF10/25/98 49ers 28-10 SL12/27/98 49ers 38-19 SF10/10/99 Rams 42-20 SL11/21/99 Rams 23-7 SF9/17/00 Rams 41-24 SL10/29/00 Rams 34-24 SF9/23/01 Rams 30-26 SF12/9/01 Rams 27-14 SL10/6/02 49ers 37-13 SF12/30/02 Rams 31-20 SL9/14/03 Rams 27-24 (OT) SL11/2/03 49ers 30-10 SF10/3/04 Rams 24-14 SF12/5/04 Rams 16-6 SL9/11/05 49ers 28-25 SF12/24/05 49ers 24-20 SL9/17/06 49ers 20-13 SF11/26/06 Rams 20-17 SL9/16/07 49ers 17-16 SL11/18/07 Rams 13-9 SF11/16/08 49ers 35-16 SF12/21/08 49ers 17-16 SL10/4/09 49ers 35-0 SF1/3/10 49ers 28-6 SL11/14/10 49ers 23-20 (OT) SF12/26/10 Rams 25-17 SL12/4/11 49ers 26-0 SF1/1/12 49ers 34-27 SL11/11/12 Tie 24-24 (OT) SF12/2/12 Rams 16-13 (OT) SL9/26/13 49ers 35-11 SL12/1/13 49ers 23-13 SF10/13/14 49ers 31-17 SL11/2/14 Rams 13-10 SF11/1/15 Rams 27-6 SL1/3/16 49ers 19-16 (OT) SF9/12/16 49ers 28-0 SF12/24/16 49ers 22-21 LA
Record: At Levi’s Stadium: (2-1) LA Memorial Coliseum: (10-20-1) Points: At Levi’s Stadium: (57-29) LA Memorial Coliseum: (550-812)
(c) - NFC Championship Game (LA) = Los Angeles (A) = Anaheim (SL) = St. Louis (SLB) = Busch Memorial Stadium
MIAMI DOLPHINS Overall: 6-7 Home: 3-3 Away: 2-4 Neutral: 1-0
Date Win Score Location9/16/73 Dolphins 21-13 M9/25/77 Dolphins 19-15 SF11/16/80 Dolphins 17-13 M11/6/83 Dolphins 20-17 SF1/20/85 (s) 49ers 38-16 ST
Date Win Score Location9/28/86 49ers 31-16 M12/6/92 49ers 27-3 SF11/20/95 49ers 44-20 M12/16/01 49ers 21-0 SF11/28/04 Dolphins 24-17 SF
Date Win Score Location12/14/08 Dolphins 14-9 M12/9/12 49ers 27-13 SF11/27/16 Dolphins 31-24 M
Record: At Levi’s Stadium: (0-0) Hard Rock Stadium: (1-2) Points: At Levi’s Stadium: (0-0) Hard Rock Stadium: (77-65)
(s) - Super Bowl XIX (Stanford, CA)

SAN FRANCISCO 49ERS
M E D I A G U I D E2 0 1 7 S E A S O N 504
MINNESOTA VIKINGS Overall: 23-22-1 Home: 14-8-1 Away: 9-14
Date Win Score Location10/15/61 49ers 38-24 M11/26/61 49ers 38-28 SF9/30/62 49ers 21-7 SF12/2/62 49ers 35-12 M9/15/63 Vikings 24-20 SF9/29/63 Vikings 45-14 M10/25/64 Vikings 27-22 SF11/8/64 Vikings 24-7 M10/24/65 Vikings 42-41 SF11/28/65 49ers 45-24 M9/11/66 Tie 20-20 SF10/30/66 Vikings 28-3 M9/17/67 49ers 27-21 M12/8/68 Vikings 30-20 SF12/14/69 Vikings 10-7 M12/27/70 (d) 49ers 17-14 M
Date Win Score Location11/7/71 49ers 13-9 M12/16/72 49ers 20-17 SF10/14/73 Vikings 17-13 SF9/21/75 Vikings 27-17 M11/29/76 49ers 20-16 SF12/4/77 Vikings 28-27 M9/2/79 Vikings 28-22 M9/8/83 49ers 48-17 M12/8/84 49ers 51-7 SF9/8/85 Vikings 28-21 M10/12/86 Vikings 27-24 (OT) SF1/9/88 (d) Vikings 36-24 SF10/30/88 49ers 24-21 SF1/1/89 (d) 49ers 34-9 SF1/6/90 (d) 49ers 41-13 SF12/30/90 49ers 20-17 M
Date Win Score Location9/15/91 Vikings 17-14 M12/13/92 49ers 20-17 M10/3/93 49ers 38-19 SF12/26/94 Vikings 21-14 M12/18/95 49ers 37-30 SF12/7/97 49ers 28-17 SF1/3/98 (d) 49ers 38-22 SF10/24/99 Vikings 40-16 M9/28/03 Vikings 35-7 M11/5/06 49ers 9-3 SF12/9/07 Vikings 27-7 SF9/27/09 Vikings 27-24 M9/23/12 Vikings 24-13 M9/14/15 49ers 20-3 SF
Record: At Levi’s Stadium: (1-0) U.S. Bank Stadium: (0-0) Points: At Levi’s Stadium: (20-3) U.S. Bank Stadium: (0-0)
(d) - NFC Divisional Playoff
NEW ENGLAND PATRIOTS Overall: 8-5 Home: 4-2 Away: 4-3
Date Win Score Location10/31/71 49ers 27-10 SF10/26/75 Patriots 24-16 NE11/30/80 49ers 21-17 SF10/2/83 49ers 33-13 NE12/14/86 49ers 29-24 NE
Date Win Score Location10/22/89 49ers 37-20 S10/11/92 49ers 24-12 NE9/17/95 49ers 28-3 SF12/20/98 Patriots 24-21 NE1/2/05 Patriots 21-7 NE
Date Win Score Location10/5/08 Patriots 30-21 SF12/16/12 49ers 41-34 NE11/20/16 Patriots 30-17 SF
Record: At Levi’s Stadium: (0-1) Gillette Stadium: (1-1) Points: At Levi’s Stadium: (17-30) Gillette Stadium: (48-55)
(S) - Stanford, CA
NEW ORLEANS SAINTS Overall: 48-26-2 Home: 23-12-2 Away: 25-14
Date Win Score Location10/22/67 49ers 27-13 SF11/23/69 Saints 43-38 NO10/18/70 Tie 20-20 SF12/13/70 49ers 38-27 NO9/26/71 49ers 38-20 NO11/14/71 Saints 26-20 SF10/1/72 49ers 37-2 NO10/22/72 Tie 20-20 SF10/21/73 49ers 40-0 SF12/9/73 Saints 16-10 NO9/15/73 49ers 17-13 NO12/15/74 49ers 35-21 SF10/19/75 49ers 35-21 SF11/23/75 49ers 16-6 NO10/17/76 49ers 33-3 SF12/12/76 49ers 27-7 NO11/13/77 49ers 10-7 (OT) NO11/27/77 49ers 20-17 SF10/15/78 Saints 14-7 SF12/3/78 Saints 24-13 NO9/23/79 Saints 30-21 SF11/11/79 Saints 31-20 NO9/7/80 49ers 26-23 NO12/7/80 49ers 38-35 (OT) SF9/27/81 49ers 21-14 SF12/20/81 49ers 21-17 NO
Date Win Score Location11/28/82 Saints 23-20 SF10/16/83 49ers 32-13 NO11/13/83 49ers 27-0 SF09/16/84 49ers 30-20 SF11/25/84 49ers 35-3 NO9/29/85 Saints 20-17 SF12/15/85 49ers 31-19 NO9/21/86 49ers 26-17 SF11/2/86 Saints 23-10 NO10/25/87 49ers 24-22 NO11/15/87 Saints 26-24 SF9/4/88 49ers 34-33 NO12/11/88 49ers 30-17 SF10/8/89 49ers 24-20 NO11/6/89 49ers 31-13 SF9/10/90 49ers 13-12 NO12/23/90 Saints 13-10 SF11/10/91 Saints 10-3 NO12/1/91 49ers 38-24 SF9/27/92 49ers 16-10 NO11/15/92 49ers 21-20 SF9/26/93 Saints 16-13 NO11/22/93 49ers 42-7 SF9/25/94 49ers 24-13 SF11/28/94 49ers 35-14 NO9/3/95 49ers 24-22 NO
Date Win Score Location10/29/95 Saints 11-7 SF9/1/96 49ers 27-11 SF11/3/96 49ers 24-17 NO9/14/97 49ers 33-7 SF10/26/97 49ers 23-0 NO10/11/98 49ers 31-0 NO11/22/98 49ers 31-20 SF09/19/99 49ers 28-21 SF11/14/99 Saints 24-6 NO11/5/00 Saints 31-15 NO12/10/00 Saints 31-27 SF11/11/01 49ers 28-27 SF1/6/02 49ers 38-0 NO10/20/02 Saints 35-27 NO9/19/04 Saints 30-27 NO12/3/06 Saints 34-10 NO10/28/07 Saints 31-10 SF9/28/08 Saints 31-17 NO9/20/10 Saints 25-22 SF1/14/12 (d) 49ers 36-32 SF11/25/12 49ers 31-21 NO11/17/13 Saints 23-20 NO11/9/14 49ers 27-24 (OT) NO11/6/16 Saints 41-23 SF
Record: At Levi’s Stadium: (0-1) Mercedes-Benz Superdome: (21-12) Points: At Levi’s Stadium: (23-41) Mercedes-Benz Superdome: (723-602)
(d) - NFC Divisional Playoff

SAN FRANCISCO 49ERS
M E D I A G U I D E2 0 1 7 S E A S O N 505
NEW YORK GIANTS Overall: 19-20 Home: 11-9 Away: 8-11
Date Win Score Location11/9/52 Giants 23-14 NY9/30/56 Giants 38-21 SF12/1/57 49ers 27-17 NY9/25/60 Giants 21-19 SF11/17/63 Giants 48-14 NY10/20/68 49ers 26-10 NY10/15/72 Giants 23-17 SF12/21/75 Giants 26-23 SF10/16/77 Giants 20-17 NY9/24/78 Giants 27-10 NY10/14/79 Giants 32-16 NY11/23/80 49ers 12-0 SF11/29/81 49ers 17-10 SF
Date Win Score Location1/3/82 (d) 49ers 38-24 SF10/8/84 49ers 31-10 NY12/29/84 (d) 49ers 21-10 SF12/29/85 (w) Giants 17-3 NY12/1/86 Giants 21-17 SF1/4/87 (d) Giants 49-3 NY10/5/87 49ers 41-21 NY9/11/88 49ers 20-17 NY11/27/89 49ers 34-24 SF12/3/90 49ers 7-3 SF1/20/91 (c) Giants 15-13 SF9/2/91 Giants 16-14 NY9/6/92 49ers 31-14 NY
Date Win Score Location1/15/94 (d) 49ers 44-3 SF10/1/95 49ers 20-6 SF11/30/98 49ers 31-7 SF9/5/02 49ers 16-13 NY1/5/03 (w) 49ers 39-38 SF11/6/05 Giants 24-6 SF10/21/07 Giants 33-15 NY10/19/08 Giants 29-17 NY11/13/11 49ers 27-20 SF1/22/12 (c) Giants 20-17 (OT) SF10/14/12 Giants 26-3 SF11/16/14 49ers 16-10 NY10/11/15 Giants 30-27 NY
Record: At Levi’s Stadium: (0-0) MetLife Stadium: (1-1) Points: At Levi’s Stadium: (0-0) MetLife Stadium: (43-40)
(d) - NFC Divisional Playoff (c) - NFC Championship Game (w) - Wild Card Game
NEW YORK JETS Overall: 10-3 Home: 4-2 Away: 6-1
Date Win Score Location11/28/71 49ers 24-21 NY10/3/76 49ers 17-6 SF9/21/80 49ers 32-27 NY10/30/83 Jets 27-13 SF12/7/86 49ers 24-10 SF
Date Win Score Location10/29/89 49ers 23-10 NY9/20/92 49ers 31-14 NY9/6/98 49ers 36-30 (OT) SF10/1/01 49ers 19-17 NY10/17/04 Jets 22-14 NY
Date Win Score Location12/7/08 49ers 24-14 SF9/30/12 49ers 34-0 NY12/11/16 Jets 23-17 (OT) SF
Record: At Levi’s Stadium: (0-1) MetLife Stadium: (1-0) Points: At Levi’s Stadium: (17-23) MetLife Stadium: (34-0)
(LA) = Los Angeles (O) = Oakland
OAKLAND RAIDERS Overall: 6-7 Home: 3-4 Away: 3-3
Date Win Score Location12/20/70 49ers 38-7 O10/27/74 Raiders 35-24 SF11/4/79 Raiders 23-10 O9/12/82 Raiders 23-17 SF9/22/85 49ers 34-10 LA
Date Win Score Location11/13/88 Raiders 9-3 SF9/29/91 Raiders 12-6 LA9/5/94 49ers 44-14 SF10/8/00 Raiders 34-28 (OT) SF11/3/02 49ers 23-20 (OT) O
Date Win Score Location10/8/06 49ers 34-20 SF10/17/10 49ers 17-9 SF12/7/14 Raiders 24-13 O
Record: At Levi’s Stadium: (0-0) O.co Coliseum: (2-2) Points: At Levi’s Stadium: (0-0) O.co Coliseum: (84-74)
PHILADELPHIA EAGLES Overall: 19-12-1 Home: 9-8 Away: 10-4-1
Date Win Score Location10/6/51 Eagles 21-14 P9/27/51 49ers 31-21 SF11/25/56 Tie 10-10 P10/19/58 49ers 30-24 P9/27/59 49ers 24-14 SF9/20/64 49ers 28-24 P11/20/66 Eagles 35-34 SF10/15/67 49ers 28-27 P12/21/69 49ers 14-13 SF10/3/71 49ers 31-3 P12/2/73 49ers 38-28 SF
Date Win Score Location11/30/75 Eagles 27-17 P9/3/83 Eagles 22-17 SF9/23/84 49ers 21-9 P11/3/85 49ers 24-13 SF9/24/89 49ers 38-28 P10/27/91 49ers 23-7 P11/29/92 49ers 20-14 SF1/3/94 Eagles 37-34 (OT) SF10/2/94 Eagles 40-8 SF12/29/96 (w) 49ers 14-0 SF11/10/97 49ers 24-12 P
Date Win Score Location12/22/01 49ers 13-3 SF11/25/02 Eagles 38-17 SF12/21/03 49ers 31-28 (OT) P9/18/05 Eagles 42-3 P9/24/06 Eagles 38-24 SF10/12/08 Eagles 40-26 SF12/20/09 Eagles 27-13 P10/10/10 Eagles 27-24 SF10/2/11 49ers 24-23 P9/28/14 49ers 26-21 SF
Record: At Levi’s Stadium: (1-0) Lincoln Financial Field: (2-2) Points: At Levi’s Stadium: (26-21) Lincoln Financial Field: (71-120)
(w) - Wild Card Game

SAN FRANCISCO 49ERS
M E D I A G U I D E2 0 1 7 S E A S O N 506
PITTSBURGH STEELERS Overall: 11-10 Home: 5-5 Away: 6-5
Date Win Score Location10/14/51 49ers 28-24 P12/7/52 Steelers 24-7 SF11/20/54 49ers 31-3 P9/28/58 49ers 23-20 SF10/29/61 Steelers 20-10 P9/26/65 49ers 27-17 SF11/24/68 49ers 45-28 P
Date Win Score Location12/15/73 Steelers 37-14 SF9/19/77 Steelers 27-0 P11/27/78 Steelers 24-7 SF11/1/81 49ers 17-14 P10/14/84 Steelers 20-17 SF9/13/87 Steelers 30-17 P10/21/90 49ers 27-7 SF
Date Win Score Location9/5/93 49ers 24-13 P12/15/96 49ers 25-15 P11/7/99 Steelers 27-6 SF11/17/03 49ers 30-14 SF9/23/07 Steelers 37-16 P12/19/11 49ers 20-3 SF9/20/15 Steelers 43-18 P
Record: At Levi’s Stadium: (0-0) Heinz Field: (0-2) Points: At Levi’s Stadium: (0-0) Heinz Field: (34-80)
SEATTLE SEAHAWKS Overall: 15-22 Home: 8-9 Away: 7-13
Date Win Score Location9/26/76 49ers 37-21 S10/7/79 Seahawks 35-24 SF11/25/85 49ers 19-6 SF9/25/88 49ers 38-7 S12/8/91 49ers 24-22 S12/21/97 Seahawks 38-9 S10/14/02 49ers 28-21 S12/1/02 49ers 31-24 SF10/12/03 Seahawks 20-19 S12/27/03 Seahawks 24-17 SF9/26/04 Seahawks 34-0 S11/7/04 Seahawks 42-27 SF11/20/05 Seahawks 27-25 SF
Date Win Score Location12/11/05 Seahawks 41-3 S11/19/06 49ers 20-14 SF12/14/06 49ers 24-14 S9/30/07 Seahawks 23-3 SF11/12/07 Seahawks 24-0 S9/14/08 49ers 33-30 (OT) S10/26/08 Seahawks 34-13 SF9/20/09 49ers 23-10 SF12/6/09 Seahawks 20-17 S9/12/10 Seahawks 31-6 S12/12/10 49ers 40-21 SF9/11/11 49ers 33-17 SF12/24/11 49ers 19-17 S
Date Win Score Location10/18/12 49ers 13-6 SF12/23/12 Seahawks 42-13 S9/15/13 Seahawks 29-3 S12/8/13 49ers 19-17 SF1/19/14 (c) Seahawks 23-17 S11/27/14 Seahawks 19-3 SF12/14/14 Seahawks 17-7 S10/22/15 Seahawks 20-3 SF11/22/15 Seahawks 29-13 S9/25/16 Seahawks 37-18 S1/1/17 Seahawks 25-23 SF
Record: At Levi’s Stadium: (0-3) CenturyLink Field: (4-12) Points: At Levi’s Stadium: (29-64) CenturyLink Field: (236-413)
(c) - NFC Championship Game
TAMPA BAY BUCCANEERS Overall: 17-6 Home: 12-3 Away: 5-3
Date Win Score Location10/30/77 49ers 20-10 SF12/10/78 49ers 6-3 SF12/9/79 49ers 23-7 SF10/26/80 Bucs 24-23 SF12/4/83 49ers 35-21 SF11/18/84 49ers 24-17 SF9/7/86 49ers 31-7 TB11/22/87 49ers 24-10 TB
Date Win Score Location9/17/89 49ers 20-16 TB11/18/90 49ers 31-7 SF12/19/92 49ers 21-14 SF11/14/93 49ers 45-21 TB10/23/94 49ers 41-16 SF8/31/97 Bucs 13-6 TB1/12/03 (d) Bucs 31-6 TB10/19/03 49ers 24-7 SF
Date Win Score Location11/21/04 Bucs 35-3 TB10/30/05 49ers 15-10 SF12/23/07 49ers 21-19 SF11/21/10 Bucs 21-0 SF10/9/11 49ers 48-3 SF12/15/13 49ers 33-14 TB10/23/16 Bucs 34-17 SF
Record: At Levi’s Stadium: (0-1) Raymond James Stadium: (1-2) Points: At Levi’s Stadium: (17-34) Raymond James Stadium: (42-80)
TENNESSEE TITANS Overall: 8-5 Home: 3-3 Away: 5-2
Date Win Score Location11/15/70 49ers 30-20 H12/7/75 Oilers 27-13 SF9/17/78 Oilers 20-19 H12/13/81 49ers 28-6 SF10/21/84 49ers 34-21 H
Date Win Score Location11/8/87 49ers 27-20 SF10/7/90 49ers 24-21 H12/25/93 Oilers 10-7 SF10/27/96 49ers 10-9 H10/3/99 49ers 24-22 SF
Date Win Score Location11/27/05 Titans 33-22 T11/08/09 Titans 34-27 SF10/20/13 49ers 31-17 T
Record: At Levi’s Stadium: (0-0) Nissan Stadium: (1-1) Points: At Levi’s Stadium: (0-0) Nissan Stadium: (53-50)
(H) - Houston
(d) - NFC Divisional Playoff

SAN FRANCISCO 49ERS
M E D I A G U I D E2 0 1 7 S E A S O N 507
WASHINGTON REDSKINS Overall: 20-10-1 Home: 12-3-1 Away: 8-7
Date Win Score Location11/16/52 49ers 23-17 W9/26/54 49ers 41-7 SF11/13/55 Redskins 7-0 W9/17/61 49ers 35-3 SF11/12/67 Redskins 31-28 W10/5/69 Tie 17-17 SF9/20/70 49ers 26-17 SF12/26/71 (d) 49ers 24-20 SF11/11/73 Redskins 33-9 W11/7/76 Redskins 24-21 SF10/29/78 Redskins 38-20 W
Date Win Score Location10/4/81 49ers 30-17 W1/8/84 (c) Redskins 24-21 W9/10/84 49ers 37-31 SF12/1/85 49ers 35-8 W11/17/86 Redskins 14-6 W11/21/88 49ers 37-21 SF9/16/90 49ers 26-13 SF1/12/91 (d) 49ers 28-10 SF1/9/93 (d) 49ers 20-13 SF11/6/94 49ers 37-22 W11/24/96 49ers 19-16 (OT) W
Date Win Score Location9/14/98 49ers 45-10 W12/26/99 Redskins 26-20 (OT) SF9/22/02 49ers 20-10 SF12/18/04 Redskins 26-16 SF10/23/05 Redskins 52-17 W12/28/08 49ers 27-24 SF11/6/11 49ers 19-11 W11/25/13 49ers 27-6 W11/23/14 49ers 17-13 SF
Record: At Levi’s Stadium: (1-0) FedExField: (3-1) Points: At Levi’s Stadium: (17-13) FedExField: (108-79)
(c) - NFC Championship Game (d) - NFC Divisional Playoff

SAN FRANCISCO 49ERS
M E D I A G U I D E2 0 1 7 S E A S O N 508
49ERS PRIMETIME GAMES(National Football League - 1970-Present)
Prime Time 70-37 (home - 42-18, road - 28-19) Monday Nights 48-25 (home - 27-11, road - 21-14) Sunday Nights 14-14 (home - 10-6, road - 4-8) Thursday Nights 7-5 (home - 3-3, road - 4-2) Thanksgiving Day 2-2-1 (road - 2-2-1)
Friday Nights 2-0 (home - 2-0) Saturday Nights 1-3 (home - 1-1, road - 0-2) Games After Monday 39-23 (home - 29-5, road - 10-18) Games After Monday Win 26-15 (home - 17-3, road - 9-12) Games After Monday Loss 13-8 (home - 12-2, road - 1-6)
49ERS ON MONDAY NIGHTSYEAR DATE OPPONENT SCORE W/L ATTEND.2016 Sept. 12 LA Rams 28-0 W 70,1782015 Sept. 14 Min. 20-3 W 70,7992014 Oct. 13 at StL 31-17 W 56,8512013 Nov. 25 at Was. 27-6 W 79,773 Dec. 23 Atl. 34-24 W 69,7322012 Oct. 29 at Arz. 24-3 W 62,810 Nov. 19 Chi. 32-7 W 69,7322011 Dec. 19 Pit. 20-3 W 69,7322010 Sept. 20 NO 25-22 L 69,732 Nov. 29 at Arz. 27-6 W 62,3082009 Dec. 14 Arz. 24-9 W 69,7322008 Nov. 10 at Arz. 24-29 L 64,5192007 Sept. 10 Arz. 20-17 W 68,111 Nov. 12 at Sea. 0-24 L 68,3312003 Nov. 17 Pit. 30-14 W 67,8772002 Oct. 14 at Sea. 28-21 W 66,420 Nov. 25 Phi. 17-38 L 67,919 Dec. 30 at StL 21-30 L 66,1182001 Oct. 1 at NYJ 19-17 W 78,7221999 Sept. 27 at Ari. 24-10 W 72,100 Nov. 29 GB 3-20 L 68,304 Jan. 3, at Atl. 29-34 L 57,9801998 Sept. 14 at Was. 45-10 W 76,798 Nov. 30 NYG 31-7 W 68,212 Dec. 14 Det. 35-13 W 68,5851997 Sept. 29 at Car. 34-21 W 70,972 Nov. 10 at Phi. 24-12 W 67,133 Dec. 15 Den. 34-17 W 68,4611996 Oct. 14 at GB 20-23 (OT) L 60,716 Dec. 2 at Atl. 34-10 W 46,318 Dec. 23 Det. 24-14 W 61,9211995 Sept. 25 at Det. 24-27 L 76,236 Nov. 20 at Mia. 44-20 W 73,080 Dec. 18 Min. 37-30 W 64,9751994 Sept. 5 LA Raiders 44-14 W 68,032 Nov. 28 at NO 35-14 W 61,304 Dec. 26 at Min. 14-21 L 63,3261993 Sept. 13 at Cle. 13-23 L 78,218 Nov. 22 NO 42-7 W 66,500 Jan. 3 Phi. 34-37 (OT) L 61,6531992 Nov. 9 at Atl. 41-3 W 67,404 Dec. 28 Det. 24-6 W 55,9071991 Sept. 2 at NYG 14-16 L 76,319 Nov. 25 at LA Rams 33-10 W 61,881 Dec. 23 Chi. 52-14 W 60,4191990 Sept. 10 at NO 13-12 W 68,629 Dec. 3 NYG 7-3 W 66,092 Dec. 17 at LA Rams 26-10 W 65,6191989 Nov. 6 NO 31-13 W 63,461 Nov. 27 NYG 34-24 W 63,461 Dec. 11 at LA Rams 30-27 W 67,9591988 Oct. 24 at Chi. 9-10 L 65,293 Nov. 21 Was. 37-21 W 59,2681987 Oct. 5 at NYG 41-21 W 16,471 Dec. 14 Chi. 41-0 W 63,5091986 Nov. 17 at Was. 6-14 L 54,774 Dec. 1 NYG 17-21 L 59,7771985 Nov. 11 at Den. 16-17 L 73,173 Nov. 25 Sea. 19-6 W 57,482 Dec. 9 LA Rams 20-27 L 60,5811984 Sept. 10 Was. 37-31 W 59,707 Oct. 8 at NYG 31-10 W 76,1121983 Dec. 19 Dal. 42-17 W 59,9571978 Nov. 27 Pit. 7-24 L 51,6571977 Sept. 19 at Pit. 0-27 L 48,046 Dec. 12 Dal. 35-42 L 55,8481976 Oct. 11 at LA Rams 16-0 W 84,483 Nov. 29 Min. 20-16 W 56,775
49ERS ON MONDAY NIGHTS (Cont.)1974 Oct. 14 at Det. 13-17 L 45,199 Nov. 4 LA Rams 13-15 L 57,5261973 Nov. 26 GB 20-6 W 49,2441972 Dec. 4 LA Rams 16-26 L 60,1751971 Dec. 6 KC 17-26 L 45,306
49ERS ON SUNDAY NIGHTSYEAR DATE OPPONENT SCORE W/L ATTEND.2015 Oct. 11 at NYG 27-30 L 78,5152014 Oct. 19 at Den. 17-42 L 77,047 Sept. 14 Chi. 20-28 L 70,7992013 Oct. 6 Hou. 34-3 W 69,732 Sept. 15 at Sea. 3-29 L 68,3382012 Dec. 23 at Sea. 13-42 L 68,161 Dec. 16 at NE 41-34 W 68,756 Sept. 16 Det. 27-19 W 69,7322010 Oct. 10 Phi. 27-24 L 69,7322005 Oct. 2 at Arz. (M.C.) 14-31 L 103,4672004 Oct. 3 StL 14-24 L 66,696 Oct. 31 at Chi. 13-23 L 62,0542003 Oct. 12 at Sea. 19-20 L 66,4372001 Oct. 7 Car. 24-14 W 66,944 Dec. 2 Buf. 35-0 W 67,2521999 Dec. 26 Was. 20-26 (OT) L 68,3291998 Nov. 22 NO 31-20 W 68,4291997 Dec. 21 at Sea. 9-38 L 66,2531996 Nov. 3 at NO 24-17 W 53,2971995 Dec. 3 Buf. 27-17 W 65,5681994 Nov. 20 LA Rams 31-27 W 62,7741993 Dec. 5 Cin. 21-8 W 60,0391992 Sep. 27 at NO 16-10 W 68,5911990 Nov. 11 at Dal. 24-6 W 62,9661988 Dec. 18 LA Rams 16-38 L 62,4441987 Nov. 29 Cle. 38-24 W 60,243 Dec. 27 LA Rams 48-0 W 57,9531982 Dec. 19 Atl. 7-17 L 53,234
49ERS ON THURSDAY NIGHTSYEAR DATE OPPONENT SCORE W/L ATTEND.2016 Oct. 6 Arz. 33-21 L 70,1782015 Oct. 22 Sea. 20-3 L 70,7992014 Nov. 27 Sea. 19-3 L 70,7992013 Sep. 26 at StL 35-11 W 56,6402012 Oct. 18 Sea. 13-6 W 69,7322011 Nov. 24 at Bal. 16-6 L 71,3452010 Dec. 16 at SD 34-7 L 67,8202009 Nov. 12 Chi. 10-6 W 69,7322006 Dec. 14 at Sea. 24-14 W 67,6502002 Sep. 5 at NYG 16-13 W 78,7481983 Sep. 8 at Min. 48-17 W 58,1671982 Dec. 2 LA Rams 30-24 W 58,574
49ERS ON THURSDAY THANKSGIVING DAY GAMESYEAR DATE OPPONENT SCORE W/L ATTEND.2014 Nov. 27 Sea. 19-3 L 70,7992011 Nov. 24 at Bal. 16-6 L 71,3451972 Nov. 23 at Dal. 31-10 W 65,214
49ERS ON FRIDAY NIGHTSYEAR DATE OPPONENT SCORE W/L ATTEND.1986 Dec. 19 LA Rams 24-14 W 60,2661984 Dec. 14 LA Rams 19-16 W 59,743
49ERS ON SATURDAY NIGHTSYEAR DATE OPPONENT SCORE W/L ATTEND.2014 Dec. 20 vs. SD 38-35 L 70,6992007 Dec. 13 vs. Cin. 20-13 W 68,0531999 Dec. 18 at Car. 24-41 L 62,3731993 Dec. 11 at Atl. 24-27 L 64,688
49ERS PRIMETIME RESULTS

SAN FRANCISCO 49ERS
M E D I A G U I D E2 0 1 7 S E A S O N 509
RUSHING YARDSNAME ATT YDS OPPONENT DATEHearst, Garrison 24 198 Det. 12/14/98Hyde, Carlos 26 168 Min. 9/14/15Gore, Frank 25 167 Arz. 12/14/09Hearst, Garrison 20 166 NYG 11/30/98Jackson, Wilbur 30 156 Min. 11/29/76Williams, Delvin 20 153 Min. 11/29/76Hearst, Garrison 28 141 at Car. 9/29/77Hearst, Garrison 22 138 at Was. 9/14/98Westbrook, Brian 23 136 at Arz. 11/29/10Carter, Dexter 13 124 at LA Rams 12/17/90
RECEIVING YARDSNAME NO YDS OPPONENT DATERice, Jerry 14 289 Min. 12/18/95Taylor, John 11 286 at LA Rams 12/11/89Rice, Jerry 10 241 LA Rams 12/9/85Rice, Jerry 12 204 at Was. 11/17/86Rice, Jerry 11 181 at Det. 9/25/95Rice, Jerry 7 169 LA Rams 9/5/94Owens, Terrell 13 166 Phi. 11/25/02Owens, Terrell 8 155 Pit. 11/17/03Rice, Jerry 8 149 at Mia. 11/20/95Rice, Jerry 6 143 at Atl. 1/3/00Owens Terrell 5 140 NYG 11/30/98
TOTAL YARDS FROM SCRIMMAGE - RUSH/RECEIVINGNAME RUSH REC TOTAL OPPONENT DATERice, Jerry 10 289 299 Min. 12/18/95Taylor, John 0 286 286 at LA Rams 12/11/89Rice, Jerry 14 241 255 LA Rams 12/9/85Rice, Jerry 9 204 213 at Was. 11/17/86Hearst, Garrison 198 0 198 Det. 12/14/98Rice, Jerry 23 169 192 LA Raiders 9/5/94Hyde, Carlos 168 14 182 Min. 9/14/15Rice, Jerry 0 181 181 at Det. 9/25/95
LONG PUNTSNAME YDS OPPONENT DATELee, Andy 63 at Arz. 11/10/08Lee, Andy 62 Pit. 12/19/11Wilmsmeyer, Klaus 61 at Cle. 9/13/93Lee, Andy 60 at Sea. 11/12/07Lee, Andy 58 at Was. 11/25/13
LONG PUNT RETURNSNAME YDS OPPONENT DATETaylor, John 95t Was. 11/21/88McLemore, Dana 83t Chi. 12/14/87McLemore, Dana 79t at NYG 10/8/84Carter, Dexter 78t Min. 12/18/95Levy, Chuck 73t at Phi. 11/10/97McLemore, Dana 56t Dal. 12/19/83
LONG KICKOFF RETURNSNAME LG OPPONENT DATERossum, Allen 104t at Arz. 11/10/08Sutherland, Vinny 65 at NYJ 10/1/01Tillman, Spencer 60 NYG 11/27/89Carter, Dexter 60 Phi. 1/3/93Washington, Vic 57 LA Rams 12/4/72
LONG INTERCEPTION RETURNS NAME LG OPPONENT DATE Bowman, NaVorro 89t Atl. 12/23/13 Hanks, Merton 67t NO 11/22/93 Parrish, Tony 60 at StL 12/30/02 Hanks, Merton 55t Den. 12/15/97 Woodall, Lee 55 Den. 12/15/97
LONG FIELD GOALS NAME LG OPPONENT DATE Dawson, Phil 54 at StL 10/13/14 Cofer, Mike 52 at NO 9/10/90 Cofer, Mike 52 Was. 11/21/88 Dawson, Phil 49 Atl. 12/23/13 Dawson, Phil 49 at Was. 11/25/13 Cortez, Jose 49 at NYJ 10/1/01 Wilkins, Jeff 49 Det. 12/23/96
LONG FUMBLE RETURNS NAME YDS OPPONENT DATE Griffin, Don 99t Chi. 12/22/91 Young, Bryant 43 at Atl. 12/2/96 Greene, Kevin 40t Den. 12/15/97 Hanks, Merton 38t at Phi. 11/10/97
LONG RUNS FROM SCRIMMAGE NAME LG OPPONENT DATE Barlow, Kevan 78t Pit. 11/17/03 Carter, Dexter 74t at LA Rams 12/17/90 Hearst, Garrison 70t NYG 11/30/98 Phillips, Lawrence 68t at Arz. 9/27/99 Jackson, Wilbur 64 at Det. 10/14/74
LONG PASS COMPLETIONS NAME LG OPPONENT DATE J. Montana to J. Taylor 95t at LA Rams 12/17/89 J. Montana to J. Taylor 92t at LA Rams 12/17/89 C. Kaepernick to B. Lloyd 80t at StL 10/13/14 J. Montana to J. Rice 80t Was. 11/21/88 S. Young to T. Owens 79t NYG 11/30/98 S. Bono to J. Taylor 78 at LA Rams 11/25/91 J. Montana to F. Solomon 77t Dal. 12/19/83 S. Young to J. Rice 73t at NYG 9/2/91
MOST PASSING YARDS NAME ATT CMP YDS OPPONENT DATE Montana, Joe 42 30 458 at LA Rams 12/11/89 Montana, Joe 60 33 441 at Was. 11/17/86 Young, Steve 49 30 425 Min. 12/18/95 Grbac, Elvis 41 31 382 at Mia. 11/20/95 Montana, Joe 40 24 381 Was. 9/10/84 Garcia, Jeff 34 26 373 at Atl. 1/3/00 Young, Steve 44 27 348 at Det. 9/25/95 Kaepernick, Colin 36 22 343 at StL 10/13/14 Young, Steve 32 21 338 Chi. 12/23/91 Montana, Joe 36 26 328 LA Rams 12/9/85 Young, Steve 32 19 308 LA Raiders 9/5/94 Bono, Steve 33 18 306 at LA Rams 11/25/91 Young, Steve 32 21 303 at Was. 9/14/98
49ERS MONDAY NIGHT SINGLE GAME RECORDS

SAN FRANCISCO 49ERS
M E D I A G U I D E2 0 1 7 S E A S O N 510
SCORINGNAME R P RT 2PT PAT FG TOTRice, Jerry 2 30 – 1 – – 194Cofer, Mike – – – – 52 18/32 106Wersching, Ray – – – – 32 13/17 71Owens, Terrell – 11 – – – – 66Jones, Brent – 10 – – – – 60Taylor, John – 9 1 – – – 60Young, Steve 9 – – – – – 54Wilkins, Jeff – – – – 14 11/11 47Gore, Frank 5 1 - - - - 36Kirby, Terry 5 1 - - - - 36
PASSING YARDSNAME G ATT CMP YDS PCT TD INT LGYoung, Steve 25 585 377 4,608 64.4 42 12 79tMontana, Joe 18 600 357 4,482 59.5 33 15 95tKaepernick, Colin 5 129 83 1,183 64.3 9 0 80tSmith, Alex 6 176 105 1,078 59.7 7 4 47tGarcia, Jeff 6 143 94 1,044 65.7 7 2 62Grbac, Elvis 5 118 79 829 66.9 7 4 47t
RUSHING YARDSNAME G ATT YDS AVG LG TDHearst, Garrison 10 199 1,055 5.3 70t 5Gore, Frank 12 205 921 4.5 36 5Craig, Roger 17 239 817 3.4 25 1Young, Steve 23 106 663 6.3 26t 9Watters, Ricky 8 99 498 5.0 43 2Tyler, Wendell 6 77 389 5.1 36 1Jackson, Wilbur 6 99 357 3.6 64 0Barlow, Kevan 5 42 333 7.9 78t 2Williams, Delvin 5 72 304 4.2 30 0
RECEPTIONSNAME G NO YDS AVG LG TDRice, Jerry 38 211 3,377 16.0 80t 30Craig, Roger 17 78 654 8.4 33 4Owens, Terrell 15 70 971 13.9 79t 11Jones, Brent 22 66 846 12.8 41 6Taylor, John 16 64 1,096 17.1 95t 8Stokes, J.J. 14 49 597 12.2 47 1Rathman, Tom 13 40 343 8.6 21 0
INTERCEPTIONSNAME G NO YDS AVG LG TDHanks, Merton 22 7 143 20.4 67t 1Lott, Ronnie 4 5 63 12.6 26 0McDonald, Tim 21 4 46 11.5 21 0Griffin, Don 8 4 25 6.3 23 0Brown, Tarell 9 3 6 2.0 5 0Goldson, Dashon 7 3 24 8.0 21 0Williamson, Carlton 3 3 109 36.3 82 0Wright, Eric 3 3 85 28.3 48t 1
PUNT RETURN YARDS NAME G NO YDS AVG LG FC TD Taylor, John 12 31 386 12.5 95t 12 1 McLemore, Dana 7 19 310 16.3 83t 10 3 Carter, Dexter 11 27 293 10.9 78t 15 1 Ginn Jr., Ted 4 11 132 12.0 42 3 0 Levy, Chuck 5 5 101 20.2 73t 1 1 McQuarters, R.W. 5 11 98 8.9 26 1 0
TOTAL YARDS FROM SCRIMMAGE NAME TOTAL YARDS RUSH REC Rice, Jerry 3,463 86 3,377 Craig, Roger 1,471 817 654 Hearst, Garrison 1,203 1,055 148 Taylor, John 1,153 5 1,148 Gore, Frank 1,041 921 120 Jones, Brent 1,011 0 1,011 Owens, Terrell 977 4 973 Watters, Ricky 689 498 191
PUNTING AVERAGE NAME G NO YDS AVG LG BLKD Lee, Andy 12 54 2,554 47.3 63 0 Stanley, Chad 3 17 694 40.8 52 0 Thompson, Tommy 9 33 1,339 40.6 54 1 Wittum, Tom 7 42 1,689 40.2 52 0 Wilmsmeyer, Klaus 8 22 882 40.1 61 0
KICKOFF RETURN YARDS NAME G NO YDS AVG LG TD Carter, Dexter 16 43 1,038 24.1 60 0 Washington, Vic 3 8 226 28.3 57 0 Hofer, Paul 4 10 223 22.3 48 0 Levy, Chuck 5 11 214 19.5 31 0 Hicks, Maurice 2 8 191 23.9 33 0 Rossum, Allen 1 4 186 46.5 104t 1 Monroe, Carl 5 10 174 17.4 45 0 Ginn Jr., Ted 4 7 168 24.0 41 0 Williams, Jimmy 2 8 162 20.3 33 0 Flagler, Terrence 3 8 161 20.1 40 0 Tillman, Spencer 3 7 157 22.4 60 0
49ERS MONDAY NIGHT CAREER RECORDS
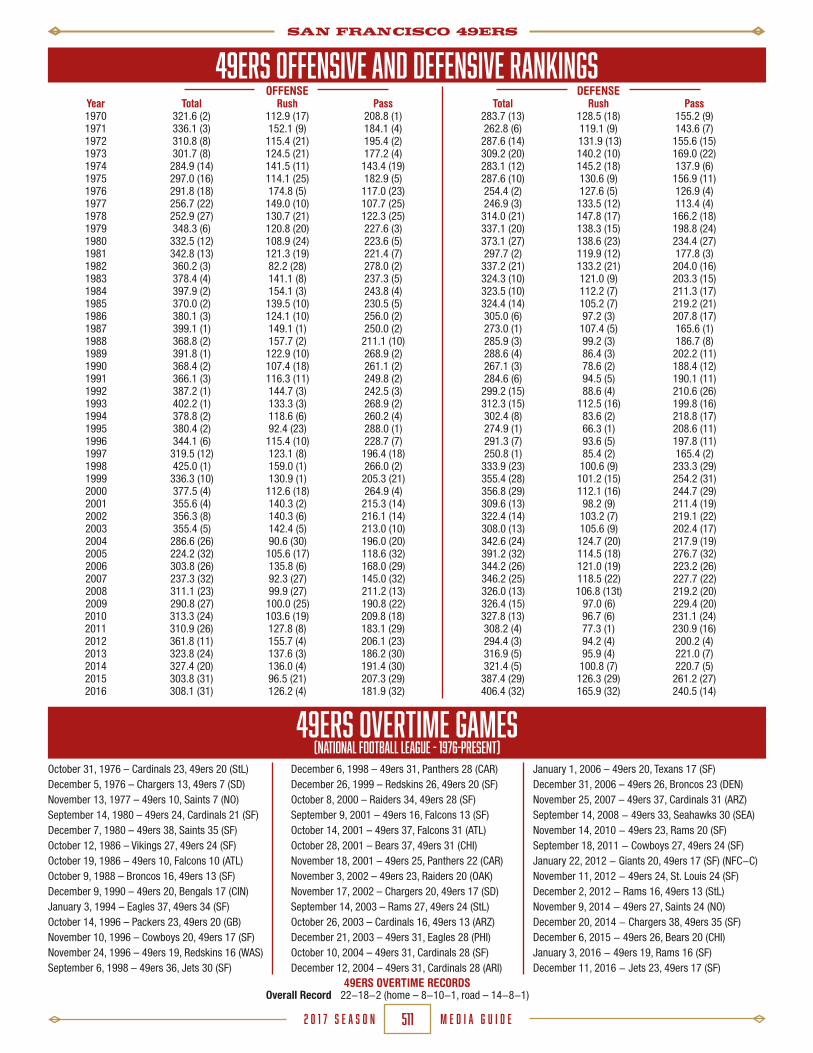
SAN FRANCISCO 49ERS
M E D I A G U I D E2 0 1 7 S E A S O N 511
49ERS OVERTIME GAMES(National Football League - 1976-Present)
October 31, 1976 – Cardinals 23, 49ers 20 (StL)December 5, 1976 – Chargers 13, 49ers 7 (SD)November 13, 1977 – 49ers 10, Saints 7 (NO)September 14, 1980 – 49ers 24, Cardinals 21 (SF)December 7, 1980 – 49ers 38, Saints 35 (SF)October 12, 1986 – Vikings 27, 49ers 24 (SF)October 19, 1986 – 49ers 10, Falcons 10 (ATL)October 9, 1988 – Broncos 16, 49ers 13 (SF)December 9, 1990 – 49ers 20, Bengals 17 (CIN)January 3, 1994 – Eagles 37, 49ers 34 (SF)October 14, 1996 – Packers 23, 49ers 20 (GB)November 10, 1996 – Cowboys 20, 49ers 17 (SF)November 24, 1996 – 49ers 19, Redskins 16 (WAS)September 6, 1998 – 49ers 36, Jets 30 (SF)
49ERS OVERTIME RECORDS Overall Record 22-18-2 (home – 8-10-1, road – 14-8-1)
December 6, 1998 – 49ers 31, Panthers 28 (CAR)December 26, 1999 – Redskins 26, 49ers 20 (SF)October 8, 2000 – Raiders 34, 49ers 28 (SF)September 9, 2001 – 49ers 16, Falcons 13 (SF)October 14, 2001 – 49ers 37, Falcons 31 (ATL)October 28, 2001 – Bears 37, 49ers 31 (CHI)November 18, 2001 – 49ers 25, Panthers 22 (CAR)November 3, 2002 – 49ers 23, Raiders 20 (OAK)November 17, 2002 – Chargers 20, 49ers 17 (SD)September 14, 2003 – Rams 27, 49ers 24 (StL)October 26, 2003 – Cardinals 16, 49ers 13 (ARZ)December 21, 2003 – 49ers 31, Eagles 28 (PHI)October 10, 2004 – 49ers 31, Cardinals 28 (SF)December 12, 2004 – 49ers 31, Cardinals 28 (ARI)
49ERS OFFENSIVE AND DEFENSIVE RANKINGS OFFENSE DEFENSE Year Total Rush Pass Total Rush Pass 1970 321.6 (2) 112.9 (17) 208.8 (1) 283.7 (13) 128.5 (18) 155.2 (9) 1971 336.1 (3) 152.1 (9) 184.1 (4) 262.8 (6) 119.1 (9) 143.6 (7) 1972 310.8 (8) 115.4 (21) 195.4 (2) 287.6 (14) 131.9 (13) 155.6 (15) 1973 301.7 (8) 124.5 (21) 177.2 (4) 309.2 (20) 140.2 (10) 169.0 (22) 1974 284.9 (14) 141.5 (11) 143.4 (19) 283.1 (12) 145.2 (18) 137.9 (6) 1975 297.0 (16) 114.1 (25) 182.9 (5) 287.6 (10) 130.6 (9) 156.9 (11) 1976 291.8 (18) 174.8 (5) 117.0 (23) 254.4 (2) 127.6 (5) 126.9 (4) 1977 256.7 (22) 149.0 (10) 107.7 (25) 246.9 (3) 133.5 (12) 113.4 (4) 1978 252.9 (27) 130.7 (21) 122.3 (25) 314.0 (21) 147.8 (17) 166.2 (18) 1979 348.3 (6) 120.8 (20) 227.6 (3) 337.1 (20) 138.3 (15) 198.8 (24) 1980 332.5 (12) 108.9 (24) 223.6 (5) 373.1 (27) 138.6 (23) 234.4 (27) 1981 342.8 (13) 121.3 (19) 221.4 (7) 297.7 (2) 119.9 (12) 177.8 (3) 1982 360.2 (3) 82.2 (28) 278.0 (2) 337.2 (21) 133.2 (21) 204.0 (16) 1983 378.4 (4) 141.1 (8) 237.3 (5) 324.3 (10) 121.0 (9) 203.3 (15) 1984 397.9 (2) 154.1 (3) 243.8 (4) 323.5 (10) 112.2 (7) 211.3 (17) 1985 370.0 (2) 139.5 (10) 230.5 (5) 324.4 (14) 105.2 (7) 219.2 (21) 1986 380.1 (3) 124.1 (10) 256.0 (2) 305.0 (6) 97.2 (3) 207.8 (17) 1987 399.1 (1) 149.1 (1) 250.0 (2) 273.0 (1) 107.4 (5) 165.6 (1) 1988 368.8 (2) 157.7 (2) 211.1 (10) 285.9 (3) 99.2 (3) 186.7 (8) 1989 391.8 (1) 122.9 (10) 268.9 (2) 288.6 (4) 86.4 (3) 202.2 (11) 1990 368.4 (2) 107.4 (18) 261.1 (2) 267.1 (3) 78.6 (2) 188.4 (12) 1991 366.1 (3) 116.3 (11) 249.8 (2) 284.6 (6) 94.5 (5) 190.1 (11) 1992 387.2 (1) 144.7 (3) 242.5 (3) 299.2 (15) 88.6 (4) 210.6 (26) 1993 402.2 (1) 133.3 (3) 268.9 (2) 312.3 (15) 112.5 (16) 199.8 (16) 1994 378.8 (2) 118.6 (6) 260.2 (4) 302.4 (8) 83.6 (2) 218.8 (17) 1995 380.4 (2) 92.4 (23) 288.0 (1) 274.9 (1) 66.3 (1) 208.6 (11) 1996 344.1 (6) 115.4 (10) 228.7 (7) 291.3 (7) 93.6 (5) 197.8 (11) 1997 319.5 (12) 123.1 (8) 196.4 (18) 250.8 (1) 85.4 (2) 165.4 (2) 1998 425.0 (1) 159.0 (1) 266.0 (2) 333.9 (23) 100.6 (9) 233.3 (29) 1999 336.3 (10) 130.9 (1) 205.3 (21) 355.4 (28) 101.2 (15) 254.2 (31) 2000 377.5 (4) 112.6 (18) 264.9 (4) 356.8 (29) 112.1 (16) 244.7 (29) 2001 355.6 (4) 140.3 (2) 215.3 (14) 309.6 (13) 98.2 (9) 211.4 (19) 2002 356.3 (8) 140.3 (6) 216.1 (14) 322.4 (14) 103.2 (7) 219.1 (22) 2003 355.4 (5) 142.4 (5) 213.0 (10) 308.0 (13) 105.6 (9) 202.4 (17) 2004 286.6 (26) 90.6 (30) 196.0 (20) 342.6 (24) 124.7 (20) 217.9 (19) 2005 224.2 (32) 105.6 (17) 118.6 (32) 391.2 (32) 114.5 (18) 276.7 (32) 2006 303.8 (26) 135.8 (6) 168.0 (29) 344.2 (26) 121.0 (19) 223.2 (26) 2007 237.3 (32) 92.3 (27) 145.0 (32) 346.2 (25) 118.5 (22) 227.7 (22) 2008 311.1 (23) 99.9 (27) 211.2 (13) 326.0 (13) 106.8 (13t) 219.2 (20) 2009 290.8 (27) 100.0 (25) 190.8 (22) 326.4 (15) 97.0 (6) 229.4 (20) 2010 313.3 (24) 103.6 (19) 209.8 (18) 327.8 (13) 96.7 (6) 231.1 (24) 2011 310.9 (26) 127.8 (8) 183.1 (29) 308.2 (4) 77.3 (1) 230.9 (16) 2012 361.8 (11) 155.7 (4) 206.1 (23) 294.4 (3) 94.2 (4) 200.2 (4) 2013 323.8 (24) 137.6 (3) 186.2 (30) 316.9 (5) 95.9 (4) 221.0 (7) 2014 327.4 (20) 136.0 (4) 191.4 (30) 321.4 (5) 100.8 (7) 220.7 (5) 2015 303.8 (31) 96.5 (21) 207.3 (29) 387.4 (29) 126.3 (29) 261.2 (27) 2016 308.1 (31) 126.2 (4) 181.9 (32) 406.4 (32) 165.9 (32) 240.5 (14)
January 1, 2006 – 49ers 20, Texans 17 (SF)December 31, 2006 – 49ers 26, Broncos 23 (DEN)November 25, 2007 – 49ers 37, Cardinals 31 (ARZ)September 14, 2008 - 49ers 33, Seahawks 30 (SEA)November 14, 2010 - 49ers 23, Rams 20 (SF)September 18, 2011 - Cowboys 27, 49ers 24 (SF)January 22, 2012 - Giants 20, 49ers 17 (SF) (NFC-C)November 11, 2012 - 49ers 24, St. Louis 24 (SF)December 2, 2012 - Rams 16, 49ers 13 (StL)November 9, 2014 - 49ers 27, Saints 24 (NO)December 20, 2014 - Chargers 38, 49ers 35 (SF)December 6, 2015 - 49ers 26, Bears 20 (CHI)January 3, 2016 - 49ers 19, Rams 16 (SF)December 11, 2016 - Jets 23, 49ers 17 (SF)

SAN FRANCISCO 49ERS
M E D I A G U I D E2 0 1 7 S E A S O N 512
49ERS OVERTIME GAME SUMMARIESOctober 31, 1976
St. Louis 23, San Francisco 20In the fourth quarter, St. Louis held a 14-13 lead af-ter San Francisco missed an extra point on its previ-ous scoring drive. San Francisco then took the lead 20-14 in the fourth when Delvin Williams scored his third touchdown of the day. With eight minutes left in the game, Cardinals quarterback Jim Hart connected with Mel Gray on a 77-yard touchdown pass for the 20-20 tie. The extra point was blocked and the two teams went into overtime. St. Louis won the overtime coin toss but was forced to punt. Tony Leonard fumbled the kick at the 43-yard line, which was recovered by the Cardinals. St. Louis then marched down field to set up Jim Bakken for the 21-yard field goal to lift the Car-dinals to a 23-20 victory.
1st 2nd 3rd 4th OT Final49ers 0 13 0 7 0 20Cardinals 7 0 7 6 3 23
December 5, 1976San Diego 13, San Francisco 7
The 49ers and Chargers played to a scoreless tie in the first half. The defensive struggle continued into the second half and the score remained 0-0 at the end of the third quarter. On San Diego’s first possession of the fourth quarter, Dan Fouts guided them on a 16-play, 80-yard scoring drive, capped by a Bo Matthews two-yard touchdown run. San Francisco answered on its next possession with a 64-yard scoring drive. Paul Hofer caught an eight-yard touchdown pass from Scott Bull to make the score 7-6. The extra point was blocked, but the Chargers Tom Graham was flagged for offsides. After the penalty was marked off, Steve Mike-Mayer connected to tie the game at seven with just over a minute left in regulation. San Diego won the overtime coin toss and elected to receive. The Chargers began their first possession on their own seven-yard line where Fouts guided them on a nine-play, 93-yard drive, which was capped by a Mercury Morris 13-yard touchdown run for the 13-7 win.
1st 2nd 3rd 4th OT Final49ers 0 0 0 7 0 7Chargers 0 0 0 7 6 13
November 13, 1977San Francisco 10, New Orleans 7
The 49ers got their first ever overtime victory at New Orleans. The Saints got on the board early in the first quarter on an eight-yard run by Tony Galbreath. The Saints appeared to grab a commanding lead at the end of the first half when Richard Mauti returned a Tom Wittum punt 65 yards for a touchdown 10 seconds be-fore halftime. But a New Orleans clipping penalty nul-lified the score. The 49ers tied it up in the third quarter with a five-yard romp by Delvin Williams. Neither team would score again in regulation and the game went to overtime knotted at seven. The Saints won the overtime coin toss, but were unable to move the ball, giving it back to the 49ers. San Francisco started from its own 41-yard line and moved the ball down to the Saints 16, where Ray Wersching connected on a 33-yard game-winning field goal.
1st 2nd 3rd 4th OT Final49ers 0 0 7 0 3 10Saints 7 0 0 0 0 7
September 14, 1980San Francisco 24, St. Louis 21
San Francisco struck first on a 19-yard touchdown pass from Steve DeBerg to Paul Hofer in the second quarter. Cardinals quarterback Jim Hart quickly an-swered back with a 13-yard touchdown strike to Theotis Brown. The Cardinals pushed the lead to 14-7 with a Doug Marsh five-yard touchdown reception. Af-ter the 49ers tied the game at 14, St. Louis drove 75 yards in eight plays to take a 21-14 lead. With 1:51 left in regulation, the 49ers drove 80 yards and scored on a 26-yard touchdown run by Hofer, his second of the day. San Francisco won the overtime coin toss and took the ball 52 yards to the 16-yard line, where Ray Wersching kicked a 33-yard field goal for the 24-21 win.
1st 2nd 3rd 4th OT Final49ers 0 7 0 14 3 24Cardinals 0 0 14 7 0 21
December 7, 1980San Francisco 38, New Orleans 35
New Orleans jumped out to a 35-7 halftime lead be-hind touchdown passes of 33, 21 and 41 yards from Archie Manning. Less than five minutes into the third quarter, the 49ers went on an 88-yard, nine-play drive that culminated with a one-yard touchdown run by Joe Montana. Minutes later, Montana hooked up with Dwight Clark for a 71-yard touchdown pass to bring the 49ers within 14 points. After the San Francisco defense shut out New Orleans for the second straight quarter, they tied the game with 1:50 left in the fourth quarter with Lenvil Elliott’s seven-yard touchdown jaunt, forcing overtime. New Orleans won the coin toss, but failed to pick up a first down on its first possession. San Francisco took the ball on its own 27 and marched 55 yards in 13 plays for the game-winning 36-yard field goal by Ray Wersching.
1st 2nd 3rd 4th OT Final49ers 0 7 14 14 3 38Saints 14 21 0 0 0 35
October 12, 1986Minnesota 27, San Francisco 24
With Joe Montana out, Jeff Kemp stepped in to lead San Francisco against a powerful Minnesota Vikings team. Minnesota struck first with a six-yard touch-down pass from Tommy Kramer to Anthony Carter. The 49ers answered back when Kemp hit Dwight Clark with a 45-yard strike to tie the game. With 1:14 left in the first quarter, the Vikings Issiac Holt recovered a blocked punt in the end zone for a 14-7 lead. San Francisco took a 17-14 lead into halftime after a 39-yard Ray Wersching field goal and a 34-yard touchdown pass from Kemp to Jerry Rice. After the Vikings stalled on their first drive of the third quarter, Kemp led the 49ers on a six-play, 53-yard drive that ended with a 17-yard touchdown reception by Rice. Minnesota answered back with a 26-yard field goal by Chuck Nelson to cut the 49ers lead to 24-17. With 6:37 remaining in the fourth quarter, Kramer hit Anthony Carter with a 35-yard touchdown pass to tie the game. In overtime, Minnesota won the toss and went on a 58-yard drive. Nelson hit a 28-yard field goal for the 27-24 win.
1st 2nd 3rd 4th OT Final49ers 7 10 7 0 0 24Vikings 14 0 3 7 3 27
October 19, 1986Atlanta 10, San Francisco 10
San Francisco visited Atlanta for a battle with the divi-sion rival Falcons and took an early 7-0 lead on a Rog-er Craig one-yard romp. The Falcons responded with a punishing 17-play, 44-yard drive that resulted in a 47-yard field goal by Mick Luckhurst. San Francisco maintained its lead in the second quarter with a 53-yard, 13-play drive, which led to a 24-yard Ray Wer-sching field goal and a 10-3 lead. The defenses domi-nated the second half, holding the offenses scoreless for all of the third quarter and most of the fourth. With just over a minute remaining in regulation, the Falcons took advantage of great field position and scored on a 39-yard touchdown pass from Dave Archer to Sylves-ter Stamps to tie the game at 10. The Falcons won the overtime coin toss and elected to receive. After gener-ating only one first down, the Falcons were forced to give up possession. The 49ers mirrored the Falcons on their first possession of overtime and punted with 6:42 remaining. Both teams had possession two more times in overtime, but could not produce a score as the game ended in a 10-10 tie.
1st 2nd 3rd 4th OT Final49ers 7 3 0 0 0 10 Falcons 3 0 0 7 0 10
October 9, 1988Denver 16, San Francisco 13
Two of the best teams in the NFL faced off in an in-ter conference battle as the Denver Broncos visited Candlestick Park. The 49ers started the scoring with a 37-yard Mike Cofer field goal with 4:52 remaining in the first quarter. The Broncos answered early in the second with a 27-yard field goal by Rich Karlis to knot the game at three. With San Francisco’s second pos-session of the second quarter, Joe Montana opened up the offense and led the 49ers 95 yards and capped it off with a six-yard quarterback sneak for a 10-3 lead at halftime. The only scoring in the third quarter came on Karlis’ 27-yard field goal with five minutes remain-ing, cutting the 49ers lead to 10-6. Cofer quickly an-swered with a 27-yard field goal with one minute on the clock in the third quarter for the 13-6 lead. After an injury, John Elway returned to hit Vance Johnson with an eight-yard touchdown pass. Neither team could score in the final minutes of regulation and headed into overtime. On San Francisco’s first possession, Andre Townsend sacked Montana, injuring his ribs. Steve Young took over, and on his first play threw an inter-ception to Mark Haynes ending the threat. After a five-and-out drive by the Broncos, the 49ers took over on their own five-yard line. A second Young interception, deep in Broncos territory, helped set the stage for Karlis to connect on a 22-yard game-winning field goal.
1st 2nd 3rd 4th OT Final49ers 3 7 3 0 0 13Broncos 0 3 3 7 3 16

SAN FRANCISCO 49ERS
M E D I A G U I D E2 0 1 7 S E A S O N 513
December 9, 1990San Francisco 20, Cincinnati 17
A capacity crowd filled Riverfront Stadium as the San Francisco 49ers invaded Cincinnati for a late-season battle. On the Bengals first possession, Boomer Esia-son drove his team 70 yards for the game’s opening score, a two-yard touchdown pass to Craig Taylor. San Francisco answered back on its next possession when Tom Rathman capped off a 73-yard drive with a one-yard plunge into the end zone for the 7-7 tie. Cincin-nati came out strong in the second half. The Bengals scored on a Jim Breech field goal to open the third and break the tie. San Francisco enjoyed its first lead of the game after Harry Sydney scored on a three-yard run. With just over two minutes elapsed in the fourth quarter, Ickey Woods dove in from one yard out to regain the lead for Cincinnati, 17-14. The 49ers next drive stalled and they would not regain possession until only 4:11 remained in regulation. On the first play, Joe Montana hit Jerry Rice for a 29-yard strike and guided the team down to the Cincinnati six-yard line. Mike Cofer hit a 23-yard field goal with just over a minute remaining to send the game into overtime. San Francisco won its first coin toss in five overtime games and wasted no time driving 75 yards in 11 plays to set up Cofer’s 23-yard game-winning field goal and the 20-17 victory.
1st 2nd 3rd 4th OT Final49ers 7 0 7 3 3 20Bengals 7 0 3 7 0 17
January 3, 1994Philadelphia 37, San Francisco 34
Turnovers and an ill-timed penalty marred the 49ers first overtime game in four years. The Philadelphia Eagles struck early and often, first on a 34-yard Roger Ruzek field goal five minutes into the game. On San Francisco’s first possession, Steve Young was hit and fumbled the ball, which was recovered by Byron Ev-ans who returned it 30 yards for a touchdown and a 10-0 lead. With Bubby Brister at the helm, the Eagles drove 76 yards in the opening minutes of the second quarter and connected with Calvin Williams for a 13-yard touchdown to push the lead to 17-3. Brister again guided Philadelphia to an eight-play, 64-yard touch-down scoring drive to take a commanding 21-point lead. The 49ers end zone drought ended with just less than two minutes remaining in the half when Young hit Jerry Rice for a three-yard touchdown that brought the score to 24-10 at halftime. San Francisco started the second half with a 60-yard kickoff return by Dexter Carter to give the 49ers the ball on Philadelphia’s 38-yard line. Capping off a punishing 38-yard, nine-play drive, Ricky Watters ran 11 yards for the score. After a Philadelphia punt, John Taylor caught a 38-yard touchdown pass to tie the game at 24. Philadelphia took advantage of a Young injury by intercepting a Steve Bono pass. The Eagles worked quickly, moving 69 yards in just two plays to take a 31-24 lead. San Francisco gave Philadelphia good field position again with a fum-ble on its own 40, allowing the Eagles to increase their lead to 10 with a Ruzek 32-yard field goal in the third quarter. Set up by a Don Griffin interception, Bono drove the 49ers 42 yards and scored on a one-yard keeper that closed the gap to 34-31. After a Philadelphia punt, the Niners drove down and tied the game on a Cofer 29-yard field goal with 15 seconds left in regulation. San Francisco won the overtime coin toss and elected to receive, but failed to score on two overtime posses-sions. On Philadelphia’s second possession of overtime, they drove to San Francisco’s 20-yard line. With four seconds showing on the clock, the Eagles set up for a 38-yard field goal. Ruzek missed the field goal wide
right, but Merton Hanks was flagged for roughing the kicker. After a 10-yard penalty, Ruzek hit a 28-yarder with no time left on the clock for the 37-34 win.
1st 2nd 3rd 4th OT Final49ers 3 7 14 10 0 34Eagles 10 14 10 0 3 37
October 14, 1996Green Bay 23, San Francisco 20
With Steve Young out with a groin injury, Elvis Grbac led San Francisco against Brett Favre and the Green Bay Packers. After an unsuccessful first possession, the Packers scored on a 30-yard field goal by Chris Jacke with just over five minutes remaining in the first quar-ter for the 3-0 lead. They took a 6-0 lead on another Jacke 25-yard field goal. On San Francisco’s second possession of the second quarter, Grbac led a six-play, 36-yard drive that resulted in a Jeff Wilkins 48-yard field goal. After a three-and-out series by the Pack-ers, Jerry Rice caught a seven-yard touchdown from Grbac for a 10-6 lead. Aided by a Dana Stubblefield interception, Rice and Grbac put the 49ers up 17-6 at the half with a 13-yard touchdown pass. Green Bay trimmed the lead to 17-14 when Favre hit Don Beebe for a 59-yard touchdown and followed it with a two-point conversion toss to Edger Bennett. Chris Jacke hit a 35-yard field goal to tie the game at 17 with 3:24 left in regulation. San Francisco won the overtime coin toss but was forced to punt after going three-and-out. Green Bay received the ball on its own 44 and drove 21 yards to set up Jacke for a 53-yard field goal for the 23-20 victory.
1st 2nd 3rd 4th OT Final49ers 0 17 0 3 0 20Packers 6 0 8 6 3 23
November 10, 1996Dallas 20, San Francisco 17
The two most dominating teams in the NFL met in a mid-season battle for NFC supremacy as the Dallas Cowboys traveled to 3Com Park. The 49ers jumped out to a quick lead after a Jeff Wilkins 28-yard field goal. They extended their lead to 10-0 on a 29-yard touch-down strike from Steve Young to Iheanyi Uwaezuoke. Quiet for most of the first half, the Cowboys finally got on the board with a 72-yard scoring drive that ended on a Troy Aikman three-yard touchdown run, which cut the deficit to 10-7 at halftime. Defenses dominated in the third quarter with neither team allowing a score. Dallas ended the scoring drought with a Chris Boniol 26-yard field goal four seconds into the fourth quarter to tie the game at 10. With Young out in the second half after sustaining a concussion, Elvis Grbac led San Francisco on a nine-play, 68-yard scoring drive on its next possession. Terry Kirby capped it off with a 27-yard touchdown run. After Fred Strickland intercepted a Grbac pass at the 49ers 15-yard line, Troy Aikman hit Eric Bjornson for a six-yard touchdown pass, knot-ting the game at 17 and forcing overtime. The Cow-boys won the overtime coin toss and wasted no time marching down the field. After 12 plays, Chris Boniol hit the game-winning 29-yard field goal for the 20-17 victory.
1st 2nd 3rd 4th OT Final49ers 10 0 0 7 0 17Cowboys 0 7 0 10 3 20
November 24, 1996San Francisco 19, Washington 16
In the 49ers second overtime game in November, and third of the season, the Washington Redskins hosted San Francisco for the first time in two years. In what would prove to be a game dominated by special teams, San Francisco struck first with a 20-yard field goal from Jeff Wilkins. Washington’s Scott Blanton hit field goals from 19 and 48 yards out and Wilkins added another to knot the score at six going into halftime. The only score in the third quarter came on a Blanton field goal from 41 yards out to give Washington a 9-6 lead. San Francisco got on the board first in the fourth quarter with a Wilkins 44-yard field goal three minutes into the period. On the ensuing possession, Gus Ferotte drove the Redskins 78 yards, which culminated with a Jamie Asher 20-yard touchdown reception. The 49ers tied the game with 1:57 remaining in regulation on a one-yard run by William Floyd, forcing overtime. San Francisco won the coin toss and promptly went on a 48-yard scoring drive that was capped by a 38-yard field goal by Wilkins for the 19-16 win.
1st 2nd 3rd 4th OT Final49ers 3 3 0 10 3 19Redskins 0 6 3 7 0 16
September 6, 1998San Francisco 36, New York Jets 30
In the opening weekend of the 1998 season, fans were treated to one of the most exciting games and one of the most exciting plays in NFL history. After a fast-paced first half, the 49ers found themselves trailing 17-14 at halftime after Glen Foley hit Wayne Chrebet from six-yards out for the score with 32 seconds re-maining in the second quarter. On its first possession in the second half, San Francisco evened the score at 17 with a 22-yard field goal by Wade Richey. On the following possession, Foley found Keyshawn Johnson for a 21-yard touchdown and a 24-17 lead. With just over three minutes remaining in the third quarter, Jerry Rice caught a 14-yard touchdown from Steve Young to bring the 49ers within one. The extra point was blocked and the score remained 24-23 heading into the fourth quarter. New York extended its lead to 27-23 after a John Hall 32-yard field goal. San Francisco took pos-session with 3:38 left in regulation and went on a 76-yard, five-play drive that was capped by a 38-yard touchdown pass from Young to J.J. Stokes, giving the 49ers the lead 30-27 with just over one minute re-maining in regulation. New York then drove the ball to the 49ers 13-yard line, where John Hall tied the game at 30 with just three seconds on the clock. Both New York and San Francisco went three-and-out on their first possessions of overtime. The Jets moved to mid-field on their second possession before being forced to punt, pinning the 49ers on their own four-yard line. With 11:09 remaining in overtime, on San Francisco’s first play of its second possession, Young gave the ball to Garrison Hearst, who ran right and broke six tackles on his way to a 96-yard, game-winning touchdown run and the 36-30 victory.
1st 2nd 3rd 4th OT Final49ers 7 7 9 7 6 36Jets 3 14 7 6 0 30

SAN FRANCISCO 49ERS
M E D I A G U I D E2 0 1 7 S E A S O N 514
December 6, 1998San Francisco 31, Carolina 28
San Francisco extended its winning streak to four games with an exciting, high-scoring match-up with the Carolina Panthers. After an explosive first half, the 49ers took a 21-7 lead going into halftime. San Fran-cisco started the second half with a five-play drive, which covered 90 yards, including a Garrison Hearst 71-yard touchdown run. The drive gave the 49ers a commanding 28-7 lead. With just 52 seconds left in the third quarter, Steve Beuerlein connected with An-thony Johnson on a 38-yard touchdown pass to cut the deficit to 28-14. On their first possession of the fourth quarter, the Panthers drove 76 yards in five plays and scored on a Beuerlein-to-Raghib Ismail 40-yard touchdown pass. Minutes later, Carolina tied the game at 28 with a 10-yard run by Tshimanga Biakabu-tuka. Carolina won the overtime coin toss and elected to receive. The Panthers ran two unsuccessful plays, and Beuerlein fumbled on the third, giving San Fran-cisco possession on Carolina’s 30-yard line. The 49ers picked up 25 yards driving to the Panthers five, where Wade Richey hit a 23-yard field goal for the 31-28 win.
1st 2nd 3rd 4th OT Final49ers 7 14 7 0 3 31Carolina 7 0 7 14 0 28
December 26, 1999Washington 26, San Francisco 20
The Washington Redskins visited 3Com Park and bat-tled the San Francisco 49ers to their second overtime game in the last three meetings. San Francisco struck first with an 80-yard drive in 13 plays, capped off with a Charlie Garner four-yard touchdown run and a 7-0 lead. Early in the second quarter, Washington answered back with an 80-yard drive of its own, ending with a Brad Johnson-to-Michael Westbrook 65-yard touch-down strike. With a pair of Wade Richey field goals, San Francisco went into halftime with a 13-7 lead. Wash-ington cut the deficit to three after Brett Conway nailed a 47-yard field goal in the third quarter. The 49ers extended their lead to 20-10 with a 78-yard scor-ing drive that ended on a five-yard touchdown pass from Jeff Garcia to J.J. Stokes. At the beginning of the fourth quarter, Conway connected on a 34-yard field goal to bring the Redskins within seven. Washington then struck again with 3:30 left in the game when Brad Johnson plunged in from one-yard to tie the game at 20. San Francisco threatened with just over one minute to go, driving to the Redskins 22-yard line before fum-bling, which Washington recovered to force overtime. Washington won the overtime coin toss and promptly moved the ball to the San Francisco 33-yard line in three plays. On first down, Johnson hit Larry Centers for a 33-yard touchdown pass and the 26-20 win.
1st 2nd 3rd 4th OT Final49ers 7 6 7 0 0 20Redskins 0 7 3 10 6 26
October 8, 2000Oakland 34, San Francisco 28
In a game for the ages, the 49ers fell in overtime to the visitors from across the Bay, the Oakland Raid-ers. The Raiders jumped out to the early 6-0 lead on two Sebastian Janikowski field goals. The 49ers an-swered back, scoring 14 unanswered points to close out the first half. The Raiders dominated the third quarter, holding onto the ball for more than 11 minutes and scoring two touchdowns. After another score by the Raiders to start the fourth, the 49ers started their comeback. After a Jeff Garcia-to-Terrell Owens scor-
ing toss and another score on a nine-yard touchdown run by Charlie Garner, San Francisco tied the game at 28. On their next possession, the Raiders drove down to San Francisco’s 23-yard line, but on fourth-and-10, Janikowski missed a 41-yard field goal wide left. The 49ers, with a chance to win the game, took possession and moved the ball down to the Oakland 29-yard line. On fourth-and-one, the Raiders defense stiffened and stopped a leaping Charlie Garner for no gain. The Raid-ers took over on downs, but couldn’t get their offense going and were forced to punt back to the 49ers, who ran out the clock and forced the game into overtime. The Raiders won the toss and marched down to the 49ers 25-yard line. Janikowski came on to attempt the game-winning field goal, but missed wide right, his second missed field goal of the day. The 49ers took over and drove all the way to the Raiders 11-yard line. On first down, Wade Richey attempted the game-winning field goal, but was blocked and possession went back to the Raiders. Following two pass completions and a pass interference call on the 49ers, the Raiders finally put the game away with a 31-yard scoring toss from Rich Gannon to Tim Brown for the win.
1st 2nd 3rd 4th OT Final49ers 0 14 0 14 0 28Raiders 3 3 15 7 6 34
September 9, 2001San Francisco 16, Atlanta 13
The 49ers began the 2001 regular season in an exciting fashion, defeating the visiting Atlanta Falcons 16-13 in overtime. The 49ers trailed by seven points at halftime and began the fourth quarter with a 10-point deficit. A J.J. Stokes touchdown reception narrowed the gap before Jose Cortez’s field goal attempt tied the game at 13 with 11 seconds remaining in regulation. The 49ers won the coin toss in overtime and elected to receive. On the drive the 49ers faced a third-and-five when Jeff Garcia rifled a pass to Tai Streets, who raced 53 yards to the Falcons 23-yard line. Three plays later, Cortez nailed a 24-yard field goal to lift the 49ers to victory. 1st 2nd 3rd 4th OT Final49ers 0 3 0 10 3 16Falcons 7 3 3 0 0 13
October 14, 2001San Francisco 37, Atlanta 31
The 49ers had their second overtime game of the 2001 season against the Falcons, sweeping Atlanta in the season series by winning 37-31. The 49ers rallied back from deficits of 20-7 at the half and 31-17 in the fourth quarter. The Falcons went up 14-0 early in the game. The 49ers put their first points of the game on the board in the second quarter when Jeff Garcia scored on a seven-yard run. The Falcons answered back with two field goals and went up 20-7 at halftime. Terrell Owens, who did not catch a pass in the first half, roared back to catch nine passes for 183 yards and a career-high three touchdowns. After a 49ers touch-down, at the hands of Kevan Barlow, and a touchdown by the Falcons, the 49ers were down 31-24 with just 2:22 remaining in the game. Garcia led the team on a 10-play, 72-yard drive when he hooked up with Ow-ens from 17 yards out to tie the game at 31 with just 21 seconds remaining. The 49ers won the toss in overtime and drove to the Falcons 14-yard line. A mishandled snap between Garcia and Dave Fiore, who was fill-ing in at center for an injured Jeremy Newberry, was recovered by the Falcons and their offense took over. The 49ers defense rose to the challenge, forcing Atlanta into a three-and-out possession. After the punt, San
Francisco began at its own 33-yard line. After picking up one first down, Garcia faced third-and-five when he connected with Owens, who raced 52 yards for his third touchdown and the 37-31 overtime victory.
1st 2nd 3rd 4th OT Final49ers 0 7 10 14 6 37Falcons 14 6 0 11 0 31
October 28, 2001Chicago 37, San Francisco 31
The 49ers had their second consecutive overtime game and their third of the 2001 season as they dropped a 37-31 decision to the Chicago Bears. San Francisco went up early in the first quarter after Bryant Young forced a fumble, which Julian Peterson scooped up and returned 26 yards for the touchdown. The 49ers struck again when Jeff Garcia hooked up with Justin Swift for a one-yard touchdown and the 14-0 lead. The Bears answered back with a safety and a touch-down, making the score 14-9 at the half. In the third quarter, the 49ers struck first when Garrison Hearst scored his first touchdown since 12-14-98 on a 60-yard bomb from Garcia. The Bears offense then took over and drove down to the 49ers 10-yard line where Zack Bronson intercepted a Shane Mathews pass and returned it a team-record 97 yards for the touchdown. After a Chicago touchdown and a 49ers field goal, the score was 31-16 early in the fourth quarter. The Bears then racked up 15 unanswered points on two touchdown drives to tie the game at 31 and send it into overtime. The 49ers won the coin toss and the offense took over. On the first play from scrimmage, Garcia was intercepted by Mike Brown, who raced 33 yards for the touchdown and the 37-31 victory for Chicago.
1st 2nd 3rd 4th OT Final49ers 14 0 14 3 0 31Bears 0 9 7 15 6 37
November 18, 2001San Francisco 25, Carolina 22
In their fourth overtime game of the season, setting a new team record, the 49ers pulled out an exciting 25-22 victory over the Carolina Panthers. The game was a see-saw battle with each team going back and forth until the fourth quarter. The Panthers went ahead late in the fourth quarter after a Jeff Garcia interception. Wesley Walls scored on a 24-yard pass, but the two-point conversion failed, leaving the Panthers with a slim 19-14 lead. On the next 49ers drive, Garcia was inter-cepted again, this time deep in 49ers territory. The San Francisco defense held Carolina to only a field goal and the 49ers were down 22-14 with just 1:52 remaining in the game. Garcia started the offense on its own 34-yard line and began the two-minute drill. The 49ers moved down the field to the Panthers seven-yard line, where Garcia threw a fade route to Terrell Owens, who snatched it out of the air with one second remaining on the clock to cut the score to 22-20. Garcia then found Eric Johnson in the end zone for the two-point conversion to send the game into overtime. San Fran-cisco won the coin toss and started its drive at its own 26-yard line. Garcia completed three-of-four passes for 27 yards, while Garrison Hearst rushed twice for 34 yards to bring the 49ers down to Carolina’s nine-yard line. Jose Cortez came on for the game-winning field goal from 26 yards out, splitting the uprights to give the 49ers the 25-22 overtime victory.
1st 2nd 3rd 4th OT Final49ers 0 7 7 8 3 25Panthers 7 3 3 9 0 22
SAN FRANCISCO 49ERS
M E D I A G U I D E2 0 1 7 S E A S O N 515
November 3, 2002San Francisco 23, Oakland 20
The 49ers visited the Oakland Raiders and turned in an exciting performance. Tied at 13 entering the fourth quarter, the game see-sawed back and forth before heading into overtime. San Francisco scored first in the fourth quarter when Jeff Garcia connected with Tai Streets for a three-yard touchdown to take the lead at 20-13. Oakland answered after the ensuing kickoff went out of bounds and the Raiders got the ball at their own 40-yard line. Oakland converted a crucial fourth-and-three play to maintain possession and ended the drive with a 10-yard touchdown run by Charlie Garner with just over six minutes remaining. The 49ers then ate up the clock with an impressive 13-play drive into scoring position, where Jose Cortez missed a 27-yard field goal at the end of regulation to send the game into overtime. The 49ers won the toss and launched a 17-yard drive. It was there that Cortez lined up for the game-winning 23-yard field goal that sailed through the uprights.
1st 2nd 3rd 4th OT Final49ers 10 0 3 7 3 23Raiders 7 6 0 7 0 20
November 17, 2002San Diego 20, San Francisco 17
In their second overtime game in three weeks, the 49ers dropped a close one to the San Diego Chargers. San Francisco took the early lead, leading 17-7 at the start of the fourth quarter. However the Chargers reeled off 10 unanswered points in the final period to tie the game at 17 to send it into overtime. In overtime, the Chargers won the toss and returned the opening kick-off 39 yards. But the drive stalled there and San Diego was forced to punt. On the ensuing 49ers possession, the offense drove down the field to the San Diego 23-yard line where Jose Cortez’s game-winning field goal sailed wide right. The Chargers took over and promptly drive down the field in nine plays where Steve Christie nailed the 40-yard game-winning field goal.
1st 2nd 3rd 4th OT Final49ers 0 7 10 0 0 17Chargers 7 0 0 10 3 20
September 14, 2003St. Louis 27, San Francisco 24
In an early-season division battle, the St. Louis Rams prevailed over the 49ers in overtime in a back and forth battle. The Rams went ahead late in the fourth quarter, 24-17, with 3:20 remaining. Undaunted, Jeff Garcia calmly led his team down the field for the game-tying 13-yard touchdown pass to Terrell Owens with 19 seconds remaining in regulation. The 49ers recovered a fumble on the ensuing kickoff and had the ball at midfield. After an incomplete pass, Garcia connected with Cedrick Wilson on a 29-yard pass on second down with nine seconds remaining. Instead of falling to the ground and taking a timeout, Wilson kept running and was tackled as time ran out and the game headed into overtime. The Rams won the toss and received the kickoff, which they returned to their 48-yard line. After a one-yard run by Marshall Faulk, the 49ers were pe-nalized 15 yards for a face mask penalty. Marc Bulger then completed two straight passes which brought St. Louis to the 49ers 10-yard line. Jeff Wilkins then came on and hit the winning 28-yard field goal.
1st 2nd 3rd 4th OT Final49ers 7 3 7 7 0 24Rams 7 0 7 10 3 27
October 26, 2003Arizona 16, San Francisco 13
In another division battle, the 49ers had their second overtime game of the season, this time at Arizona. The field goal kicking was the story of this game as the 49ers missed both field goal attempts and made only 1-of-2 PATs and the Cardinals made only 3-of-6 field goal attempts. The Cardinals had the lead 13-6 in the fourth quarter when the 49ers tied the game on one of the most improbable touchdowns in team history. Jeff Garcia fumbled at the one-yard line and the ball was recovered by offensive lineman Kwame Harris, who scored his first career touchdown. The game was tied at 13 with 2:25 left to play. The Cardinals had another shot to get into scoring position, but were forced to punt and gave the 49ers one more shot for the victory with almost six minutes remaining in regulation. San Fran-cisco then launched a drive that put the offense at the Arizona 16-yard line. But Owen Pochman missed the potential game-winning field goal, his second missed field goal of the day, this time from 35 yards out. This breathed new life into Arizona, who drove down to the San Francisco 32-yard line. With five seconds remain-ing in regulation, Tim Duncan attempted the game-winning 50-yard field goal, which was short, and the game headed to overtime. In overtime, the Cardinals won the toss and drove down to the 49ers 22-yard line in eight plays. Duncan set up for another chance at a game-winning field goal, this one from 39 yards out. The kick sailed through the uprights and the Cardinals notched the 16-13 victory.
1st 2nd 3rd 4th OT Final49ers 6 0 0 7 0 13Cardinals 7 3 3 3 3 16
December 21, 2003San Francisco 31, Philadelphia 28
The 49ers recorded their first overtime win of the sea-son and also their first road win of 2003 with a 31-28 victory over Philadelphia. The two teams traded points back and forth heading into the final quarter. The 49ers kicked a 25-yard field goal on the first play of the fourth quarter to cut Philadelphia’s lead to 21-20. On San Francisco’s next possession, Kevan Barlow ran for 26 of his career-high 154 total yards and scored from one-yard out to give the 49ers a 26-21 lead. The two-point conversion attempt was successful and the 49ers had a seven-point lead with five minutes remaining in the game. The Eagles answered with a 10-play drive, adding seven points to tie the game on a Todd Pinkston touchdown grab with a little over a minute remaining in regulation. Philadelphia won the overtime coin toss and started its drive at its own 21-yard line. On the first play in the extra period, Tony Parrish, who notched an interception on the game’s first drive, intercepted an-other pass and ran it back to the Eagles four-yard line. Todd Peterson then came out and nailed the 22-yard game-winning field goal.
1st 2nd 3rd 4th OT Final49ers 7 7 3 11 3 31Eagles 0 14 7 7 0 28
October 10, 2004San Francisco 31, Arizona 28
QB Tim Rattay joined an elite group of quarterbacks who have led the 49ers to come from behind victo-ries in a 31-28 overtime victory against the visiting Arizona Cardinals at Monster Park. Rattay coolly di-rected two late fourth-quarter scoring drives that sent the game into overtime after trailing by 16 points with 8:19 remaining. In overtime, Rattay again led the team
downfield and buoyed by a roughing the passer penalty, put them into scoring position where K Todd Peterson banged home the game-winning 32-yard field goal. Rattay finished the game with a career-high 417 yards passing and a quarterback rating of 99.8. He was an impressive 14 of 20 for 115 yards and two touchdowns in the fourth quarter. He also broke QB Joe Montana’s team record by completing 38 passes. Montana held the previous mark of 37. Rattay’s favorite target on the day was TE Eric Johnson who hauled in a career-high 13 receptions for 162 yards and one touchdown. Johnson caught a six-yard touchdown from Rattay with 4:35 remaining in the game that pulled the 49ers within 10 points. Rattay ran in the two-point conver-sion and suddenly the 49ers were within eight points. Now they needed a stop and the defense was up to the task, forcing a Cardinals punt. Taking over at the 49ers 28-yard line, Rattay started off with a nine-yard pass to WR Curtis Conway, then scampered 15 more yards before hitting Conway on a 14-yard pass to get the 49ers to the Cardinals 23. From there Rattay found WR Brandon Lloyd in the corner of the end zone and the 49ers were within two points. Lloyd then slipped in front of the defender and caught Rattay’s two-point offering sending the game into overtime. The 49ers won the overtime coin toss and never relinquished the ball. A roughing the passer penalty on Arizona’s DT Darnell Dockett helped the 49ers cause and Rat-tay took advantage as he quickly moved the team into scoring position where Peterson knocked home the game-winner.
1st 2nd 3rd 4th OT Final49ers 0 6 6 16 3 31Cardinals 0 14 0 14 0 28
December 12, 2004San Francisco 31, Arizona 28
First-year RB Maurice Hicks earned the game ball after an inspiring 139-yard performance on 34 attempts. He and QB Ken Dorsey carried the 49ers to their sec-ond victory of the season, a 31-28 overtime victory in Arizona. San Francisco did have to work for the win, despite taking a 28-3 lead in the third quarter. The Cardinals staged a furious rally and almost answered the 49ers overtime win earlier in the season at Mon-ster Park. But some key plays from the defense and the legs of Hicks proved the difference of the day. Hicks, making his first career NFL start, had four carries for 42 yards in overtime including a significant 17-yard gain that set-up K Todd Peterson’s game-winning field goal. Facing 2nd and 3 from the Cardinals 30-yard line, Hicks took the handoff from Dorsey, cut off the tackle to his right and raced downfield before he was knocked out of bounds at the 13. Dorsey finished the game completing 18 of 34 passes for 191 yards and three scores for a passer rating of 99.0. Starting for the injured QB Tim Rattay, Dorsey threw his first career touchdown to WR Brandon Lloyd for the first score of the day. He then connected twice with WR Cedrick Wil-son for scores as Wilson led the receiving efforts with five receptions for 83 yards and two scores, including a 19-yard catch to keep the 49ers game-winning drive alive. Dorsey was sacked just once in his 34 passing attempts behind an offensive line that played its best game of the year.
1st 2nd 3rd 4th OT Final49ers 7 14 7 0 3 31 Cardinals 0 3 7 18 0 28

SAN FRANCISCO 49ERS
M E D I A G U I D E2 0 1 7 S E A S O N 516
January 1, 2006San Francisco 20, Houston 17
The San Francisco 49ers rallied from a 10-0 first quarter deficit for a 20-17 overtime victory over the Houston Texans to close out the 2005 campaign with two consecutive wins for a 4-12 record. The 49ers dominated the line of scrimmage, gaining 182 yards on the ground and controlling the clock for 44:03. The 49ers used a combination of RB Frank Gore (108 yards) and RB Maurice Hicks (64 yards) to take control on the ground. S Mike Adams was the star of the game on defense after finishing with two interceptions, one that was returned for a touchdown and the other that led to the game-winning field goal in overtime. QB Alex Smith helped lead the 49ers to a touchdown at the end of the first half by converting a key third-and-13 situation with a 14-yard strike to WR Brandon Lloyd and then three plays later threw his first NFL touchdown pass when he rolled to his right and found Lloyd in the back of the end zone for a 14-yard score. The 49ers took the second half kick and went on a 14-play, 56-yard drive that ended with a 42-yard field goal by Nedney to tie the game at 10-10. Houston responded when Banks fired a 31-yard pass to WR Corey Bradford to get into San Francisco territory followed by a 25-yard touchdown pass to Bradford to retake the lead at 17-10. Adams, who made his first NFL start at cornerback, intercepted QB Tony Banks at the end of the third quar-ter and returned it 40 yards for a touchdown to tie the game at 17-17. Then in overtime, Banks went deep but Adams intercepted the pass and alertly lateraled to S Ben Emanuel, who ran 35 yards to the Houston 21-yard line. After two short runs, PK Joe Nedney nailed a 33-yard field goal to give the 49ers the 20-17 victory.
1st 2nd 3rd 4th OT Final49ers 0 7 10 0 3 20Texans 10 0 7 0 0 17
December 31, 2006San Francisco 26, Denver 23
The San Francisco 49ers overcame a 13-0 deficit to pull out a 26-23 win over the Denver Broncos at In-vesco Field at Mile High. The 49ers played the role of spoilers when the victory knocked the Broncos out of the playoffs. The 49ers come-from-behind win was led by three outstanding individual efforts: RB Frank Gore gained 153 rushing yards, PK Joe Nedney kicked four field goals along with the game winner in overtime, and CB Walt Harris snagged two interceptions, includ-ing a 28-yard touchdown return in the third quarter. WR Bryan Gilmore had two key plays in overtime to advance the 49ers into field goal range for the game winning kick. During the first half, strong 49ers goal-line defense helped limit Denver to a pair of field goals on drives that were stopped when the Broncos were in first-and-goal situations. The 49ers defense again held Denver to a field goal in the third quarter when the Broncos had a first-and-goal inside the five-yard line. Denver went ahead 13-0 in the second quarter when CB Champ Bailey took a deflected theft 70 yards into the end zone. Nedney booted a 46-yard field goal to put the score at 13-3 in Denver’s favor at the end of the half. San Francisco rallied in the second half, con-verting its first series into a 12-play, 76-yard touch-down drive. FB Moran Norris caught a short pass from Smith and weaved in and out of traffic for a 32-yard touchdown. The 49ers took the lead on the ensuing drive when Harris picked off QB Jay Cutler and went 28 yards untouched for a touchdown that gave the 49ers a 17-13 lead. Denver responded with a field goal on the next series, but the 49ers added two field goals in the
fourth quarter for a 23-16 advantage with 6:14 to play in regulation. Cutler completed a nine-yard touchdown pass to TE Tony Scheffler to tie the game at 23-23 and send it into overtime. Denver won the coin toss, but was forced to punt on two drives before a 12-yard return by PR Brandon Williams allowed the 49ers to start their game-winning drive at their own 39-yard line. Gilm-ore gained 20 yards on an end route and then caught a 14-yard pass from QB Alex Smith for a first down at the Denver 25-yard line. Two plays later, Nedney kicked a 36-yard field goal to give San Francisco the win.
1st 2nd 3rd 4th OT Final49ers 0 3 14 6 3 26Broncos 3 10 3 7 0 23
November 25, 2007San Francisco 37, Arizona 31
The San Francisco 49ers completed a series sweep of the Arizona Cardinals with a 37-31 overtime victory to snap an eight-game losing streak at the University of Phoenix Stadium. DE Ron Fields forced QB Kurt Warner to fumble on a sack in the end zone, and LB Tully Banta-Cain recovered the ball for a touchdown in overtime to seal the win. The play was set up after PK Neil Rackers missed a 32-yard field goal in overtime. Rackers was successful on a field goal from the San Francisco nine-yard line, but the Cardinals were penalized for a delay of game penalty, moving the ball back to the 14-yard line where Rackers was wide to the left. A 59-yard punt by P Andy Lee followed by an Arizona penalty forced the Cardinals to begin their next drive at the three-yard line, setting up the 49ers defensive touchdown to get the win. RB Frank Gore went over the 100-yard mark for the first time in 2007, finishing with 116 yards and two touchdowns, including a 35-yard touchdown run with 1:25 to play to give the 49ers a 31-28 lead. War-ner completed five passes on the ensuing drive to get Arizona to the one-yard line with six seconds to play. CB Donald Strickland broke up a pass in the end zone to force Arizona to settle for a 19-yard field goal as time expired in regulation. In overtime, Warner com-pleted a short pass to WR Sean Morey, who raced down the sidelines for a 62-yard gain before LP Patrick Willis caught up with him to make a game-saving tackle at the 14-yard line. That set up Rackers game-winning field goal attempt. The 49ers had three first half turn-overs with two CB Walt Harris interceptions and a strip by CB Nate Clements to lead to 14 points. San Francisco had a 17-7 lead and appeared to be in position to take a 17-14 halftime lead after Harris’ second interception gave the 49ers a first down at their own 41-yard line. QB Trent Dilfer moved the team inside Arizona territory to the 37-yard line with 11 seconds to go to set up a field goal attempt. PK Joe Nedney attempted a 55-yard field goal that went wide, leaving six seconds on the board for the Cardinals. Warner completed a short pass to the sideline and then with two seconds left com-pleted a 48-yard Hail Mary pass to WR Larry Fitzgerald for a touchdown and a 21-17 halftime lead. A 57-yard touchdown pass from Dilfer to WR Arnaz Battle in the third quarter pushed the 49ers back in front, 24-21, heading into the final quarter. Cardinals backup QB Tim Rattay completed a two-yard touchdown on a fourth-down play midway in the fourth quarter to take a 28-24 lead. Gore’s 35-yard touchdown with 1:25 recaptured the lead for San Francisco, but Rackers last second field goal sent the game to overtime.
1st 2nd 3rd 4th OT Final49ers 7 10 7 7 6 37Cardinals 7 14 0 10 0 31
September 14, 2008San Francisco 33, Seattle 30
The San Francisco 49ers overcame a 14-point first quarter deficit to win 33-30 in overtime after PK Joe Nedney nailed a 40-yard game-winning field goal. After closing the gap to 20-13 at halftime, the 49ers intercepted Seattle on the first two drives of the second quarter, including one that was returned for a touch-down. On the first series of the second half, CB Walt Harris tipped a QB Matt Hasselbeck pass that was picked off and returned 86 yards for a touchdown by LB Patrick Willis to tie the game at 20-20. On the next series, DE Ray McDonald tipped a pass that was in-tercepted by Harris at the Seattle 41-yard line to help set up the go-ahead touchdown. QB J.T. O’Sullivan completed back-to-back passes to WR Bryant John-son to move the 49ers to the 22-yard line to help get into position for a two-yard touchdown run by RB Frank Gore to lift the 49ers in front, 27-20. Seattle responded with a 15-play, 74-yard drive that ended in a touchdown to tie the game at 27-27. After both teams exchanged field goals to get the score tied at 30-30, the 49ers forced Seattle to punt from its own 12-yard line and the 49ers began a drive at the Seattle 49-yard line with 1:09 to play in regulation. The team moved to the 23-yard line with three seconds to play to set up a game-winning field goal attempt. Nedney’s 41-yard attempt sailed wide to the right to send the game to overtime. The 49ers won the toss and elected to receive. O’Sullivan completed a 33-yard pass to WR Isaac Bruce on third-and-seven and a five-yard pass to WR Arnaz Battle on a third-and-two situation to push the 49ers to the 23-yard line where Nedney con-nected on a 40-yard field goal to give San Francisco the win. O’Sullivan registered his first 300-yard game, finishing 20-of-32 for 321 yards with one touchdown. Bruce had his first 100-yard game as a member of the 49ers with 153 yards on four catches, including a 63-yard catch in the second quarter to help get the 49ers in position for O’Sullivan’s three-yard touch-down pass to Johnson. Seattle jumped to a 14-0 first quarter after taking advantage of two miscues by the 49ers. LB Manny Lawson blocked a Seattle punt early in the game, however Seattle recovered the loose ball and converted it into a first down inside San Francisco territory on a drive that ended with a Seattle touch-down. On the next series, Seattle forced Gore to fumble deep in Seahawks territory on a play that resulted in a 10-yard touchdown return by DT Craig Terrill.
1st 2nd 3rd 4th OT Final49ers 3 10 14 3 3 33Seahawks 14 6 0 10 0 30
November 14, 2010San Francisco 23, St. Louis 20
The San Francisco 49ers Week 10 matchup would be a battle between NFC West foes as they hosted the divi-sion leading St. Louis Rams at Candlestick Park. With the chance to get back into the hunt for the NFC West and compile back-to-back wins for the first time this season, the 49ers would take a big step and put the game in the hands of former Heisman Trophy win-ner QB Troy Smith. Along with late game heroics that came down to the first overtime contest for the 49ers this season, the game proved to be a classic NFC West shootout. The Rams would also rely on a former Heis-man Trophy winner in QB Sam Bradford to come in and test the 49ers at home. With two quarterbacks of storied pasts, the game turned out to be an offensive showcase as both teams would throw for a com-bined 607 yds., as well as 753 yds. of total offense.

SAN FRANCISCO 49ERS
M E D I A G U I D E2 0 1 7 S E A S O N 517
All would come down to an overtime FG off the foot of K Joe Nedney, who connected on a 29-yd. game win-ning kick that gave the 49ers the 23-20 win. With St. Louis winning the toss and electing to receive, Bradford started things off, marching his team down the field. The drive ultimately would be halted, but not before a K Josh Brown’s 42-yd. FG put the Rams on the board 3-0 to start the game. Coming off a bye and an ex-tra week to prepare, the 49ers picked up right where they left off in London, as they were able to effectively spread the ball down the field, putting up 421 yds. of total offense. Smith proved to be a major part of the offensive onslaught as he completed 17 of 28 pass atts. for a career-high 356 yds. and 1 TD through the air. Smith’s 356 yds. were the most by a 49ers QB since QB Tim Rattay threw for 417 yds. on 38 of 57 pass atts. vs. Arz. (10/10/04). From start to finish, the 49ers found ways to get the ball to multiple players throughout the offense as Smith connected with 5 different receivers who registered 60 yds. rec. or more. It marked the first time in franchise history that at least 5 receivers to-taled 60 yds. rec. or more. Smith started the carousel of offensive production with a 32-yd. pass to TE Vernon Davis. On the very next offensive drive, Smith hooked up with WR Josh Morgan for a 65-yd. pass deep down the right side that brought him to the 1-yd. line, set-ting up a 1-yd. TD run by RB Frank Gore and giving the 49ers a 7-3 lead. The 49ers offense would continue to pour on the yards as they successfully moved the ball down field and allowed Nedney to connect on a 26-yd. FG to put the home team up 10-3 with 12:04 left to go in the half. The Rams eventually would find their way into the end zone as QB Sam Bradford connected with WR Danny Amendola for a 5-yd. TD pass to tie the game at 10 a piece heading into halftime. The 49ers found themselves down heading into the 4th qtr. after Rams RB Steven Jackson scampered for a 13-yd. TD to bring the score to 10-17. With the home team down 13-17 late in the 4th qtr. the 49ers would once again turn to their quarterback. With 2:30 remaining on the clock, the 49ers faced a 3rd and 32 situation at the SF 47-yd. line. Smith then connected on back-to-back passes to Gore of 14 and 23 yds. to move the chains, before firing a 16-yd. TD strike to WR Michael Crabtree to give the 49ers the lead. Rams marched right back down the field and scored off of a 33-yd. FG by Brown, forcing overtime. After St. Louis won the toss, the 49ers defense made a crucial 3 and out stop, which included a 3rd down sack by DT Justin Smith that allowed the 49ers to get the ball back and set up the game win-ning FG.
1st 2nd 3rd 4th OT FinalRams 3 7 7 3 0 2049ers 7 3 0 10 3 23
September 18, 2011Dallas 27, San Francisco 24
San Francisco’s regime led by Jim Harbaugh and his new but experienced staff, entered the historic rivalry match against the Dallas Cowboys with something to prove at Candlestick Park. The 49ers started off as they had hoped, scoring 2 first-half TDs and blanking America’s Team, but big pass plays late in the game would ultimately cause the Niners to fall short as they were edged 27-24 in overtime. Dallas opened the 1st
qtr. marching down the field, but came up short after a failed 21-yd. FG attempt by K Dan Bailey. After ex-changing the next couple of possessions, QB Alex Smith led the Niners on a 68-yd. drive, capped off by a 1-yd. TD by RB Frank Gore in the 2nd qtr. The 49ers front seven played strong, swarming and stopping the run, allowing Smith and the Niners to regain possession to take a 14-0 lead. The 12-yd. throw from Smith marked the first TD of WR Kyle Williams’ career and the team’s first passing TD of 2011. QB Tony Romo and the Cowboys answered before the half on a 71-yd. drive, capped off by a 53-yd. TD slant to WR Miles Austin, making it a one score game heading into the half. Dallas lost its starting QB for a brief stretch in the 3rd qtr., when it appeared Romo’s rib injury – occurring on the 3rd play of the game – had become too much of a hindrance. Backup QB Jon Kitna started the 3rd qtr. and threw a tying TD pass and 2 INTs in relief. Displaying good ball skills and awareness, CB Tramaine Brock came up with his 2nd INT of the season in as many weeks, reacting to a Kitna tipped pass and coming up with the turnover. Smith and the 49ers took advantage of the Cowboys turnover with a deep pass down the right sideline to TE Delanie Walker for 29 yds. and the go-ahead TD enter-ing the 4th qtr. K David Akers connected on a 55-yd. FG, marking the longest FG in Candlestick Park history, and the Niners built up a 10-pt. cushion. The Cow-boys charged back from the 24-14 deficit when Romo hit Austin for a leaping 25-yd. TD, and then directed a 10-play, 44-yd. drive in the final 4 minutes that ended with an overtime-forcing, 48-yd. field goal. After the Cowboys’ defense forced a punt on the 49ers first OT drive, Romo found backup WR Jesse Holley in stride for a 77-yd. gain that set up 19-yd. game-winning FG.
1st 2nd 3rd 4th OT FinalCowboys 0 7 7 10 3 2749ers 0 14 7 3 0 24
January 22, 2012New York Giants 20, San Francisco 17
NFC Championship GameWhen asked what his message was to his players after falling short to the New York Giants in the NFC Cham-pionship game, Harbaugh stated, “As Sir Andrew Bar-ton said, `Fight on my men, we’re hurt but not slain. We’ll lay down and bleed a while. Then we’ll rise and fight again.’’’ Harbaugh, of course was referring to his team’s blue-collar mentality after the Giants escaped rain-soaked Candlestick Park with a 20-17 overtime victory. “They stand toe-to-toe and fight every time they go out onto the field,” added Harbaugh. “Be for-ever proud of our players and coaches the way they compete.” Harbaugh got the Niners to the brink of the Super Bowl in his rookie year, taking over a 6-10 team and going 13-3 to win the NFC West. The extra minutes at Candlestick Park went in favor of the opponent in a year where most didn’t expect a storybook season. The 49ers defense played stoically, recording six sacks on Giants QB Eli Manning, which ranked t-2nd for the most sacks in a postseason game in franchise history (6 – four times, last vs. Den. – 1/29/90). TE Vernon Davis gave the 49ers a 7-0 lead with 7:11 remaining in the 1st qtr. after running a pattern down the right sideline and outracing the secondary for a 73-yd. TD recept. from QB Alex Smith. On their ensuing drive, the Giants
drove from their own 31 to the San Francisco 34-yd. line. On 3rd-and-1, Manning and the Giants failed to get a first down despite two opportunities. The Giants eventually evened the score on a 10-play, 69-yd. drive when TE Bear Pascoe caught Manning’s short pass at the 6-yd. line and stepped into the end zone for the TD. The Giants added a FG with two seconds remaining in the 2nd qtr. to give them a 10-7 edge going into the locker room. Davis’ second TD of the game, gave the lead back to the Niners at 14-10 with 5:18 remain-ing in the 3rd qtr. San Francisco’s 3-play, 54-yd. TD drive was set up by a short pass to RB Frank Gore, who turned it into a 24-yd. gain. On the next play, Davis went in motion from right to left and caught a lofted pass to the end zone by Smith. The Giants took the lead back after the ball inadvertently glanced off WR Kyle Williams on a punt, giving the ball back to the Giants on the 49ers 29 yard line. Manning connected on a 17-yard pass to WR Mario Manningham to give the Giants a 17-14 lead with 8:41 remaining. Williams’ 40-yd. return on the ensuing kickoff enabled the 49ers to start their next possession at their own 45. On consecu-tive plays, Smith scrambled for 17 yds. and RB Kendall Hunter ran for 18 more, resulting in a K David Akers game-tying FG with 5:39 to go, 17-17. After both teams went 3-and-out on their first overtime posses-sion, a Giants takeaway on a Williams fumble, forced by LB Jacquian Williams on a punt return, gave the Giants possession at their own 36 with 9:32 remaining. After converting one first down, K Lawrence Tynes sent the season-ending 31-yd. FG through the uprights.
1st 2nd 3rd 4th OT FinalGiants 0 10 0 7 3 2049ers 7 0 7 3 0 17
November 11, 2012St. Louis 24, San Francisco 24
The 24-24 stalemate marked the 14th tie for the 49ers since joining the NFL in 1950 and first since 1986 [10-10 at Atl. (10/19)]. It also marked the 49ers first tie at Candlestick Park since 1972 [20-20 vs. NO (10/22)]. St. Louis got off to a fast start, scoring on a 36-yd. TD pass from QB Sam Bradford to WR Brian Quick. The Rams next possession went 7-plays, for 93-yds., ending with a 7-yd. TD run by RB Steven Jackson to make the score 14-0 at the end of the 1st qtr. The 49ers answered on their next possession, driving 78-yds. on 12-plays, capped off by QB Alex Smith’s 14-yd. TD pass to WR Michael Crabtree. Crabtree’s TD recept. came on 3rd-and-7, marking his 3rd TD on 3rd down this season, ranking t-3rd in the NFL. Crabtree has tallied a TD in each of his last 5 games against St. Louis. Following the TD drive, Smith left the game due to injury. The San Francisco defense stiffened follow-ing the offense’s TD, forcing two consecutive three-and-outs and what would have been a third if not for P Johnny Hekker’s 1st down completion on a Rams fake punt. Three plays after the fake punt, LB Aldon Smith ended the Rams drive and the 1st half with his first of 2.0 sacks in the game. Smith has recorded 9.5 sacks for the season and 23.5 for his career. Smith’s 9.5 sacks ranks 3rd in the NFL and 1st in the NFC. The first possession for each team to start the 3rd qtr. resulted in no change on the scoreboard. With 8:43 remaining in the 3rd qtr., St. Louis began a 16-play drive that milked 8:25 off the clock and resulted in a 27-yd. FG by K Greg Zuerlein, stretching the lead to 17-7. On the
SAN FRANCISCO 49ERS
M E D I A G U I D E2 0 1 7 S E A S O N 518
49ers next possession, Alex Smith’s backup, QB Colin Kaepernick, led the Niners down the field, completing 5 of 5 pass attempts for 67-yds. Kaepernick finished the drive with a 7-yd. TD run, as he successfully dove inside the pylon with 8:48 remaining in the 4th qtr. On the ensuing kickoff, RB Isaiah Pead fumbled the ball at the St. Louis 28-yd. line. CB Tramaine Brock (1st ca-reer FF) forced the fumble, it was recovered by S Dar-cel McBath (1st career FR) and returned 8-yds. to the Rams 20-yd. line. The 49ers first play following the fumble resulted in a 20-yd. TD run by RB Frank Gore. Gore rushed for 97-yds. on 21 carries. The 20-yd. TD run marked his 5th TD of the season and 48th of his career. He finished the game trailing just RB Joe Perry (50) and RB Roger Craig (50) for the most rushing TDs in franchise history. The TD made the score 21-17 in San Francisco’s favor with 8:29 left in the 4th qtr. The Rams answered the 49ers score with a score of their own, going 14-plays, for 81-yds. capped off by a 2-yd TD pass from Bradford to WR Austin Pettis. The long St. Louis drive left only 1:13 on the clock, as the 49ers trailed 24-21. Kaepernick engineered an 8-play, 63-yd. drive under pressure, accounting for 54 yds. to set K David Akers up for a 33-yd. game-tying FG to force overtime. In the extra period, St. Louis won the toss and elected to receive. On the Rams first play, Amendola recorded an 80-yd. recept. down to the 49ers 2-yd. line, but an illegal formation penalty against the Rams erased the long catch and brought the ball back to the St. Louis 13-yd. line. A few plays later, San Francisco forced a Rams punt, setting up good field position for the 49ers offense. The 49ers drove down to the St. Louis 23-yd. line, to set Akers up for a 41-yd. FG attempt that was wide left. The Rams took the ball, drove to the San Francisco 40-yd. line and Zuerlein also missed the potential game-winning FG as neither team was able to score before the clock ran out, resulting in a tie.
1st 2nd 3rd 4th OT FinalRams 14 0 3 7 0 2449ers 0 7 0 17 0 24
December 2, 2012St. Louis 16, San Francisco 13
The 49ers and Rams had to play deep into overtime for the second time this season, as St. Louis outlasted San Francisco in a tough divisional matchup. Both defenses played well, resulting in only one scoring play during the 1st half. After forcing a Rams 3-and-out, the 49ers took over on their own 40-yd. line. On the first play of the drive, RB Frank Gore gained 23-yds. on the ground, putting the ball at the St. Louis 37-yd. line. The of-fensive line continued to open up holes for Gore, as he ran for 18 more yds. on 3 carries and capped off the drive with a 1-yd. TD run, making the score 7-0 with 3:01 remaining in the 1st qtr. After the San Francisco TD, the Rams offense was held to its second consecu-tive 3-and-out. With 2:31 remaining in the 2nd qtr., the 49ers defense recorded its third 3-and-out in four defensive series, with LB Aldon Smith forcing a long 3rd down after registering his 17.5 sack of the season. His 17.5 sacks ties the 49ers single-season franchise re-cord (Fred Dean - 1983). Smith now has 31.5 career sacks, surpassing Hall of Fame DE Reggie White (31.0) for the most sacks by a player in their first two years in NFL history. On the 49ers second possession of the 3rd qtr., Kaepernick was flagged for intentional grounding in the end zone, which resulted in a safety making the score 7-2 with 4:36 left in the 3rd qtr. San Francisco
answered with its next offensive possession, marching 94-yds. on 13 plays to setup K David Akers for a 23-yd. FG. WR Michael Crabtree caught 4 passes for 69 during the drive. For the game, Crabtree tallied 7 recepts. for 101 yds., marking his 2nd 100-yd. game of the sea-son and 5th of his career. The Rams were unable to get on the scoreboard with their next offensive possession, but they did after recovering a fumble by Kaepernick on 3rd-and-3 and CB Janoris Jenkins returned the loose ball 2 yds. for a TD. QB Sam Bradford completed the 2-point conversion attempt to TE Lance Kendricks to knot the score at 10 apiece with 3:04 remaining in the 4th qtr. Kaepernick showed poise on the next pos-session, following the fumble, as he rushed for 50 yds. down to the St. Louis 14-yd. line. Kaepernick rushed for 84 yds. on 9 carries. His 84 yds. on the ground are the most by a 49ers quarterback since Steve Young rushed for 102-yds. vs. NO (12/23/90). Akers was able to put the 49ers up by 3 with a 33-yd. FG with 1:38 re-maining. The Rams managed to drive 45 yds. on 7 plays to set Zuerlein up for a 53-yd. FG that sailed through the uprights as the clock expired to send the game into overtime. In overtime, it took 14:30 of 15 minutes to decide the outcome of the game, as Zuerlein made a 54-yd. FG to end the game with a final score of 16-13.
1st 2nd 3rd 4th OT Final49ers 7 0 0 6 0 13Rams 0 0 2 11 3 16
November 9, 2014San Francisco 27, New Orleans 24
A late-game sack and forced fumble by LB Ahmad Brooks setup a game-winning FG in overtime by K Phil Dawson, as the 49ers defeated the Saints, 27-24, at the Mercedes-Benz Superdome. On the open-ing drive of the game, QB Drew Brees’ pass intended for WR Marques Colston was picked off by S Antoine Bethea and returned to the Saints’ 19-yd. line. Three plays later, RB Frank Gore scored from four yards out to give the 49ers an early 7-0 lead. On the drive, Gore moved past RBs Eddie George and Tiki Barber for the 24th most rushing yds. in NFL history. A three-and-out by the Saints gave San Francisco the ball at its own 21-yd. line. The 49ers offense pieced together a 13-play, 79-yd. drive that was capped off by a 9-yd. TD run by RB Carlos Hyde. With the 49ers leading 14-0, the Saints responded with a scoring drive of their own, as K Shayne Graham connected on a 40-yd. FG to make the score 14-3. Early in the 2nd qtr., Brees found WR Brandin Cooks for a 31-yd. TD pass to bring the score to 14-10. San Francisco’s offense countered with a 15-yd. TD pass from QB Colin Kaepernick to WR An-quan Boldin to extend his streak of at least one TD pass to 16 consecutive games, the 2nd longest streak by a QB in franchise history. Boldin recorded 6 recepts. for 95 rec. yds. and 1 TD, and now has 635 recept. yds. this season, becoming one of 12 players in NFL his-tory to register 12 seasons with 600-or-more rec. yds. Both teams exchanged punts before the Saints drove down to the 49ers 22-yd. line, where CB Chris Cul-liver picked of Brees’ pass in the end zone to close the first half. On New Orleans’ second drive of the 3rd qtr., Brees led the Saints offense on a 10-play, 64-yd. drive and found TE Jimmy Graham for an 11-yd. TD. With the 49ers leading 21-17 late in the game, Brees connected with Graham for the duo’s 2nd TD of the game to give the Saints a 24-21 lead with 1:55 remaining. Unable to gain ground on its first three plays, San Francisco’s
offense faced a critical 4th-and-10 on its own 22-yd. line. Kaepernick scrambled to his right and found WR Michael Crabtree on a 51-yd. reception. Three plays later, K Phil Dawson kicked the game-tying FG from 45 yds. out to send the game into overtime. After both teams failed to score points on their first drives, the Saints regained possession with 7:43 left in OT. On 2nd-and-15, Brooks sacked and stripped Brees and the fumble was recovered by LB Chris Borland. On the ensuing play, Dawson kicked a game-winning, 35-yd. FG to give the 49ers the victory on the road.
1st 2nd 3rd 4th OT Final49ers 14 7 0 3 3 27Saints 3 7 7 7 0 24
December 20, 2014San Diego 38, San Francisco 35
San Francisco fell to San Diego, 38-35, in overtime in a game that saw the 49ers rush for a franchise-record 355 yds. On the opening drive of the game, RB Frank Gore ripped off a 52-yd. TD to give the 49ers an early 7-0 lead. Two possessions later, CB Perrish Cox in-tercepted QB Philip Rivers’ pass intended for WR Seyi Ajirotutu, which marked his team-leading fifth INT of the season. Soon after, QB Colin Kaepernick drove the offense 67 yds. on 10 plays before finding WR Bruce Ellington on an 8-yd. TD pass. On San Diego’s very next drive, S Antoine Bethea intercepted Rivers’ pass and returned it 49 yds. for a TD to extend San Francisco’s lead to 21-0. It marked the longest INT return and the first TD of Bethea’s career. The Chargers responded on their next drive, as Rivers led an 8-play, 73-yd. drive that was capped off by a 15-yd. TD pass to WR Eddie Royal. Up 21-7, the 49ers held the ball for the final possession of the first half. San Francisco converted a 3-and-1 from San Diego’s 1-yd. line on a reverse to Ellington, who scored on a 1-yd. TD run. With the score, Ellington became the first 49er to record both a rushing TD and receiving TD in the same game since Gore vs. NO (9/20/10), and the first 49ers rookie to accomplish the feat since RB Amp Lee at Min. (12/13/92). On San Diego’s third drive of the 3rd qtr., Rivers found TE An-tonio Gates on a 1-yd. TD pass. Following a nullified 70-yd. TD pass to TE Vernon Davis on San Francisco’s next drive, Kaepernick was sacked and stripped and the fumble was recovered by Corey Liuget in the end zone to cut the 49ers’ lead to 28-21. Following the turnover, Kaepernick ran 90-yds. for a touchdown to give San Francisco a 35-21 lead. His run marked the second-longest TD run by a QB in NFL history. In the 4th qtr., Rivers connected with Gates for a 21-yd. TD pass to cut the lead to 35-28. One drive later, Rivers orches-trated a late, 14-play, 80-yd. drive that was capped off by an 11-yd. TD pass to WR Malcolm Floyd to tie the game with 0:32 remaining in the game. The 49ers held the final possession of the game, but K Phil Dawson was unable to connect on a 60-yd. field goal to win the game. In overtime, the Chargers capitalized on a 49ers turnover and K Nick Novak kicked a game-winning 40-yd. FG to lead San Diego past San Francisco, 38-35.
1st 2nd 3rd 4th OT FinalChargers 0 7 14 14 3 3849ers 7 21 7 0 0 35

SAN FRANCISCO 49ERS
M E D I A G U I D E2 0 1 7 S E A S O N 519
December 6, 2015San Francisco 26, Chicago 20
In Week 13, San Francisco traveled to the Windy City where they defeated the Chicago Bears at Soldier Field in overtime, 26-20. QB Blaine Gabbert completed 18-of-32 atts. for 196 yds. and 1 TD, while adding a career-high 75 (12.5 avg.) rushing yds. and his first career rushing TD. WR Anquan Boldin recorded 5 re-cepts. for 37 yds. on the day, becoming the 18th player in NFL history to record 13,000-or-more rec. yds. in their career. The Bears jumped out to an early 6-0 lead in the first quarter, as K Robbie Gould connected on 40-yd. and 51-yd. FGs on Chicago’s first two posses-sions. On the third Bears possession, 49ers DB Jimmie Ward stepped in front of a QB Jay Cutler pass and re-turned it 29-yds. for his first career INT and first career TD. It marked the first INT for a TD by the 49ers defense since 12/20/14 vs. SD (S Antoine Bethea – 49-yd. INT return). However, a blocked point after attempt kept the score at 6-6. Chicago would take a 13-6 lead on their next possession, as RB Matt Forte found the end zone on a 5-yd rush early in the second quarter. The 49ers were quick to respond, as Gabbert engineered a 16-play, 81-yd. drive that took over eight minutes off the clock, and ended with a 1-yd. TD run from RB Shaun Draughn, his first TD as a member of the 49ers. It marked Draughn’s 3rd career rushing TD and first since 11/1/12 at SD as a member of the Kansas City Chiefs. The game remained tied at 13 until midway through the fourth quarter, when Bears RB Ka’Deem Carey gave the home team the 20-13 advantage with a 4-yd. TD run. On the ensuing possession, Gabbert took over at his own 36-yd. line with 3:27 remaining in the game. On the 6-play drive, Gabbert rushed for 60 yds., includ-ing a career-long 44-yd. TD, the first of his career, to tie the game at 20-20. On the following kickoff, Chi-cago WR Deonte Thompson recorded a 74-yd. return, setting the Bears up with prime field position for the win. However, after running the game clock down to two seconds, Gould missed the 36-yd. FG wide left to send the game to overtime. After winning the coin toss and choosing to receive, the 49ers were forced to punt only to force the Bears to punt three plays later. On the first play of the second possession of overtime, Gabbert connected with WR Torrey Smith on a 71-yd. TD pass, his 3rd TD recept. of 70-or-more yds. this season, to give San Francisco the 26-20 road victory. According to Elias, Smith became the first 49ers player to regis-ter 3 rec. TDs of 70-or-more yds. in the same season since WR John Taylor accomplished the feat in 1989.
1st 2nd 3rd 4th OT Final49ers 6 7 0 7 6 26Bears 6 7 0 7 0 20
January 3, 2016San Francisco 19, St. Louis 16
The San Francisco 49ers finished the 2015 season with a 19-16, overtime win over the St. Louis Rams at Levi’s® Stadium. San Francisco registered their second overtime win of the season [26-20 at Chi. (12/6/15)], marking the first time the team has won two overtime games in the same season since 2004 [31-28 vs. Arz. (10/10/04); 31-28 at Arz. (12/12/04)]. The win marked the ninth-consecutive regular season home finale win by the 49ers, the longest winning streak in home fina-les in the NFL. The San Francisco offense amassed 458 net yds. of total offense (108 rushing, 350 passing), the most by the 49ers since 9/8/13 vs. GB (494 net yds. – 90 rushing, 404 passing). QB Blaine Gabbert completed 28 of 44 atts., for a career-high 354 yds. and 1 TD. RB DuJuan Harris rushed for a team-high 67 yds. on 16 carries and also set career highs in recepts. (8) and rec. yds. (86). He became the first player to lead the team in both rushing and receiving yds. in the same game since RB Frank Gore vs. Sea. [16-131 rushing & 5-51 receiving (10/18/12)]. After the teams traded punts to open the game, Rams K Greg Zuerlein gave the road team a 3-0 lead midway through the first quarter with a 33-yd. FG. On the first play of the second quarter, Gabbert finished off a 7-play, 70-yd. drive with a 33-yd. TD pass to WR Anquan Boldin, his 4th TD recept. of the season and 74th of his career. Boldin finished the game with 5 recepts. for 71 yds. and 1 TD. On the ensu-ing possession, the San Francisco defense held strong, forcing a Rams punt. However, St. Louis attempted a fake, but WR Bruce Ellington, deep for the punt return, ranged to his left and broke up the pass from Rams P Johnny Hekker in the end zone. Three plays later, Harris broke off a career-long 47-yd. run, setting up a 26-yd. FG by K Phil Dawson. St. Louis would respond on their next possession, as Zuerlein connected on a 32-yd. FG to make the score 10-6. After a 49ers turnover, Rams RB Tre Mason gave St. Louis a 13-10 lead with a 4-yd. TD run. Closing out the first half, Zuerlein con-verted from 44-yd. to give the Rams a 16-10 halftime advantage. Opening up the third quarter, Gabbert con-nected on a 44-yd. pass to Ellington to set up Dawson’s second FG of the day, this time a 28-yd. conversion. On the following possession, Zuerlein would miss a 52-yd. FG to keep the score at 16-13. With less than five min-utes remaining, Dawson finished off a 12-play, 60-yd. drive with a 38-yd. FG to tie the game at 16 heading into overtime. Receiving the ball first, the 49ers were forced to punt on their opening possession. Taking over with the game on the line, St. Louis drove into 49ers territory to attempt a game-winning FG, but Zuerlein’s 48-yd. FG att was blocked by CB Dontae Johnson. Looking to finish the season on a high note, Gabbert connected with WR Quinton Patton for 33-yds. to set up the game-winning 23-yd. FG by Dawson to give San Francisco the 19-16 overtime win. Dawson connected on all 4 FGAs on the day, giving him 386 career made FGs, ranking t-9th in NFL history. In tying his season-high of 13 points scored, Dawson became the 16th player in NFL history to reach 1,600 career pts. [1,611].
1st 2nd 3rd 4th OT FinalRams 3 13 0 0 0 1649ers 0 10 3 3 3 19
December 11, 2016New York Jets 23, San Francisco 17
On a cloudy afternoon in Santa Clara, the 49ers fell to the New York Jets in overtime, 23-16. The 49ers of-fense rushed for a season-high 248 yds. on 27 atts. (9.2 avg.), with the 9.2 yds./carry avg. ranking as the 2nd-highest single-game avg. by the team in fran-chise history [24 atts. for 263 yds. (11.0 avg.) vs. Dal-las Texans (10/26/52)]. RB Carlos Hyde registered a career-high 193 yds. on 17 atts. (11.4 avg.), his 2nd 100-yd. rushing game of the season and 3rd of his career. Hyde’s 193 rushing yds. are the 6th-most in a single game in franchise history and his 11.4 yds./carry avg. are the 5th-highest in a single game in franchise history (min. 10 atts.). On the day, the 49ers defense recorded a season-high 6.0 sacks, the most since 11/25/13 at Was. (6.0 sacks) with DL DeForest Buckner sacking Jets QB Bryce Petty twice, mark-ing his second career multi-sack game [2.0 sacks at Buf. (10/16/16)]. On the opening possession of the game, DB Jimmie Ward intercepted Petty and re-turned it 8-yds. deep in Jets territory, marking his 1st INT of the year and 2nd of his career. Capitalizing on the Ward takeaway, Hyde hauled in a 7-yd. TD pass from QB Colin Kaepernick on the 49ers first offensive play from scrimmage, his the 2nd receiving TD of the season and of his career. After forcing a Jets punt, RB Shaun Draughn finished off the 4-play, 81-yd. drive that was set up by a career-long 47-yd. run by Hyde with a 4-yd. TD run, his 2nd rushing TD of the year and 5th of his career to put the 49ers up 14-0. In the 1st Qtr., the 49ers offense amassed 193 total net yds. (98 rushing; 95 passing), the 4th-most by any team in the 1st Qtr. this season. In the opening frame, Kaepe-rnick completed 7 of 7 atts. for 95 yds. and 1 TD with a perfect passer rating of 158.3, marking the 8th time in his career he has had a perfect passer rating in any quarter. In the second quarter, the teams traded field goals as San Francisco entered halftime with the 17-3 lead. In the 3rd Qtr., the Jets closed the gap to 17-6 with a 30-yd. FG from K Nick Folk. Midway through the 4th Qtr., Jets RB Bilal Powell found the end zone from 5-yds. out and QB Bryce Petty added the two-point conversion to make the score 17-14. With :43 seconds remaining, Folk converted a 50-yd. FG to send the game to overtime. After the 49ers couldn’t convert on fourth down at the Jets 37-yd. line, Powell rushed left for a 19-yd. TD to give New York a 23-17 victory.
1st 2nd 3rd 4th OT FinalJets 0 3 3 11 6 2349ers 14 3 0 0 0 17

SAN FRANCISCO 49ERS
M E D I A G U I D E2 0 1 7 S E A S O N 520
1946 (2-0)
17 L.A. Dons (San Diego/10,000)-A-24 7 34 Chicago Rockets (Kezar/34,000)-S-1 14
1947 (0-1)
7 L.A. Dons (Kezar/19,000)-A-24 14
1948 (2-0)
42 L.A. Dons (Pasadena/58,207)-A-18 24 42 Baltimore (Kezar/35,139)-A-22 14
1949 (2-0-1)
28 L.A. Dons (Los Angeles/81,272)-A-10 7 21 Buffalo (Kezar/28,084)-A-14 0 21 Cleveland (Cleveland/31,157)-A-19 21
1950 (1-4)
12 Washington (Kezar/51,201)-A-20 31 10 Philadelphia (Kezar/17,000)-A-27 28 27 Baltimore (Baltimore/6,000)-A-30 14 21 Chicago Cards (Chicago/29,207)-S-1 28 10 Pittsburgh (Pittsburgh/19,733)-S-10 13
1951 (4-1)
45 Washington (Kezar/27,280)-A-19 14 7 Chicago Bears (Kezar/38,836)-A-26 24 24 Pittsburgh (Syracuse/18,000)-S-8 7 20 Green Bay (Minneapolis/19,021)-S-12 0 37 Chicago Cards (Omaha/10,000)-S-23 17
1952 (7-0)
79 SF Broncos+ (Kezar/87,000)-A-10 0 35 Washington (Kezar/35,234)-A-17 0 38 Chicago Cards (Kezar/34,109)-A-24 14 17 L.A. Rams (Los Angeles/67,799)-S-3 7 29 Pittsburgh (Pittsburgh/21,759)-S-7 14 35 Cleveland (Akron/30,199)-S13 31 76 San Jose Packers+ (SJ/6,839)-S-19 0
1953 (3-3-1)
42 Fort Ord# (Sacramento/17,000)-A-15 7 7 New York (Kezar/36,273)-A-23 20 7 Washington (Kezar/25,784)-A-30 0 10 L.A. Rams (Los Angeles/39,816)-S-3 35 31 Philadelphia (San Antonio/15,378)-S-7 28 14 Chicago Cards (Kezar/22,736)-S-13 14 21 New York (New York/22,551)-S-17 28
1954 (7-0)
42 Fort Ord# (Kezar/19,779)-A-8 14 43 New York (Kezar/29,296)-A-15 35 30 Washington (Sacramento/23,389)-A-21 7 42 Chicago Cards (Kezar/24,559)-A-29 7 38 Cleveland (Kezar/46,877)-S-5 21 28 L.A. Rams (Los Angeles/84,572)-S-10 27 37 Pittsburgh (Tucson/16,000)-S-15 14
1955 (5-1)
7 Washington (Kezar/27,237)-A-7 6 60 Pittsburgh (Sacramento/23,496)-A-13 14 17 New York (Seattle/49,000)-A-20 28 17 Cleveland (Kezar/41,604)-A-28 14 43 Chicago Cards (Kezar/33,579)-S-4 7 31 L.A. Rams (Los Angeles/65,633)-S-9 10
1956 (3-3)
28 Cleveland (Kezar/38,741)-A-19 17 20 Washington (Kezar/27,812)-A-26 0 14 Chicago Cards (Kezar/28,758)-S-2 13 14 New York (Portland/28,448)-S-8 21 24 L.A. Rams (Los Angeles/57,688)-S-14 33 14 Philadelphia (Sacramento/20,989)-S-23 21
1957 (5-1)
24 New York (Kezar/33,673)-A-18 15 27 Washington (Kezar/24,781)-A-25 21 21 Cleveland (Kezar/32,840)-S-1 17 27 Chicago Cards (Kezar/28,000)-S-7 21 27 L.A. Rams (Los Angeles/75,172)-S-13 58 17 Philadelphia (Kezar/21,817)-S-22 14
1958 (3-3)
10 New York (Kezar/25,657)-A-17 19 20 Washington (Portland/25,442)-A-23 19 55 Chicago Cards (Kezar/23,997)-A-31 31 21 Cleveland (Kezar/31,339)-S-7 16 38 L.A. Rams (Los Angeles/62,546)-S-12 40 28 Philadelphia (Kezar/33,398)-S-21 31
1959 (2-4)
27 Washington (Kezar/21,201)-A-16 24 17 Green Bay (Kezar/18,916)-A-23 24 17 Cleveland (Kezar/24,737)-A-30 14 24 Chicago Cards (Seattle/23,000)-S-5 27 14 L.A. Rams (Los Angeles/59,552)-S-12 48 13 New York (Salt Lake City/18,496)-S-19 17
1960 (3-3)
16 Dallas (Seattle/22,000)-A-6 10 31 Washington (Kezar/13,163)-A-14 7 45 Philadelphia (Kezar/17,667)-A-21 28 24 Cleveland (Portland/25,898)-S-3 26 17 L.A. Rams (Los Angeles/51,398)-S-9 28 17 St. Louis (Kezar/13,021)-S-18 24
1961 (3-2)
20 New York (Portland/24,084)-A-12 21 24 Cleveland (Kezar/38,759)-A-20 27 14 Minnesota (Portland/27,044)-A-26 10 38 L.A. Rams (Los Angeles/42,558)-S-1 20 24 Dallas (Sacramento/22,130)-S-9 7
# Service Team + Semi Pro Team
1962 (4-1)
30 Minnesota (Seattle/22,500)-A-11 24 42 New York (Kezar/38,392)-A-19 10 27 Cleveland (Portland/27,161)-A-25 34 26 Dallas (Sacramento/20,000)-S-1 7 19 L.A. Rams (Los Angeles/39,569)-S-8 3
1963 (0-5)
28 Minnesota (Portland/20,837)-A-10 43 22 St. Louis (Salt Lake City/19,038)-A-16 24 7 Cleveland (Kezar/28,335)-A-25 24 24 Dallas (Bakersfield/9,927)-A-30 37 0 L.A. Rams (Los Angeles/34,405)-S-7 17
1964 (1-4)
26 Cleveland (Kezar/34,405)-A-9 7 23 Dallas (Portland/24,679)-A-15 34 21 Minnesota (Salt Lake City/20,207)-A-22 24 14 Pittsburgh (Omaha/15,666)-A-29 16 17 L.A. Rams (Los Angeles/39,569)-S-5 21
1965 (2-2-1)
21 Cleveland (Kezar/22,000)-A-15 37 27 Dallas (Portland/24,837)-A-21 7 17 St. Louis (St. Louis/29,831)-A-27 17 23 Pittsburgh (Providence/12,020)-S-4 9 14 L.A. Rams (Los Angeles/29,510)-S-11 34
1966 (0-5)
13 Dallas (Kezar/28,899)-A-7 24 17 Cleveland (Kezar/27,867)-A-14 28 17 Pittsburgh (Portland/18,090)-A-20 34 17 Atlanta (Columbia, S.C./21,780)-A-27 24 9 L.A. Rams (Los Angeles/39,879)-S-3 29
1967 (2-3)
42 Cleveland (Kezar/27,482)-A-13 14 24 Dallas (Kezar/31,212)-A-20 30 10 New Orleans (Portland/23,348)-A-26 24 13 Oakland (Oakland/53,254)-S-3 10 7 L.A. Rams (Los Angeles/53,822)-S-9 34
1968 (1-5)
18 San Diego (San Diego/39,553)-A-3 30 14 Dallas (Kezar/27,530)-A-11 16 17 Cleveland (Kezar/26,801)-A-18 31 22 Denver (Denver/22,254)-A-23 6 19 Oakland (Kezar/57,593)-S-1 26 20 L.A. Rams (Los Angeles/48,143)-S-6 21
1969 (0-6)
19 Cleveland (Seattle/32,219)-A-10 24 17 Dallas (Kezar/33,894)-A-17 20 15 Denver (Denver/33,161)-A-23 19 28 Oakland (Oakland/52,122)-A-31 42 10 St. Louis (Kezar/32,506)-S-7 21 28 L.A. Rams (Anaheim/39,179)-S-13 31
PRESEASON RESULTS (SINCE 1946)

SAN FRANCISCO 49ERS
M E D I A G U I D E2 0 1 7 S E A S O N 521
1970 (1-4)
14 Cleveland (Tampa/41,851)-A-15 17 7 Miami (Miami/52,812)-A-22 17 23 Denver (Eugene/26,238)-A-29 7 17 Oakland (Kezar/55,521)-S-6 31 14 L.A. Rams (Los Angeles/55,430)-S-12 17
1971 (3-2-1)
38 Cleveland (Candlestick/40,000) X-A-8 24 17 Miami (Miami/57,008)-A-13 17 28 San Diego (Candlestick/40,000)-A-22 17 33 Denver (Spokane/33,184)-A-28 17 28 Oakland (Oakland/53,696)-S-4 34 20 L.A. Rams (Los Angeles/55,607)-S-9 23
1972 (3-3)
10 New York Jets (Jacksonville/41,920)-A-5 17 20 Cleveland (Candlestick/49,767)-A-13 13 16 San Diego (San Diego/47,308)-A-19 17 24 Denver (Candlestick/52,738)-A-27 27 34 Oakland (Candlestick/59,265)-S-3 21 17 L.A. Rams (Los Angeles/60,807)-S-8 14
1973 (4-3)
20 New England (Canton/19,685)-J-28 7 27 Cleveland (Cleveland/65,707)-A-6 16 14 New York Jets (Tampa/46,477)-A-11 34 19 San Diego (Candlestick/54,977)-A-19 7 43 Denver (Candlestick/54,271)-A-26 7 17 Oakland (Oakland/53,612)-S-1 23 10 L.A. Rams (Los Angeles/57,687)-S-7 38
1974 (0-6)
6 San Diego (San Diego/18,870)-A-3 20 20 Cleveland (Cleveland/24,008)-A-12 21 3 Denver (Candlestick/30,001)-A-18 10 7 Kansas City (Kansas City/46,548)-A-24 26 19 Oakland Raiders (Candlestick/52,538)-S-2 20 7 L.A. Rams (Candlestick/49,603)-S-8 17
1975 (3-3)
17 Cleveland (Candlestick/45,560)-A-10 13 6 L.A. Rams (Los Angeles/58,230)-A-16 10 7 San Diego (San Diego/18,764)-A-21 20 21 Oakland (Oakland/52,866)-A-30 40 44 Denver (Candlestick/45,686)-S-7 10 24 Green Bay (Green Bay/56,267)-S-13 3
1976 (4-2)
27 Seattle (Seattle/60,825)-A-1 20 17 Denver (Candlestick/40,052)-A-8 7 21 Kansas City (Candlestick/39,745)-A-15 13 17 San Diego (Honolulu/36,364)-A-21 16 9 Oakland (Candlestick/52,704)-A-29 14 3 L.A. Rams (Los Angeles/55,256)-S-4 10
1977 (1-5)
24 Seattle (Candlestick/38,024)-A-7 34 13 San Diego (San Diego/26,620)-A-13 32 23 L.A. Rams (Candlestick/44,898)-A-21 14 3 Houston (Houston/36,538)-A-29 17 0 Oakland (Oakland/53,442)-S-3 33 0 Denver (Candlestick/36,441)-S-10 20
1978 (1-3)
24 Dallas (Dallas/63,736)-A-5 41 6 Seattle (Candlestick/36,069)-A-12 20 14 Oakland (Candlestick/58,658)-A-20 31 24 Denver (Denver/73,559)-A-25 13
1979 (1-3)
13 San Diego (Candlestick/32,275)-A-4 10 10 Oakland (Oakland/53,503)-A-11 41 0 Denver (Candlestick/34,133)-A-18 21 20 Seattle (Seattle/59,941)-A-24 55
1980 (3-1)
33 Oakland (Candlestick/55,585)-A-9 14 17 San Diego (San Diego/48,836)-A-16 14 7 Seattle (Candlestick/41,841)-A-23 10 31 Kansas City (Tucson/27,000)-A-30 21
1981 (2-2)
27 Seattle (Seattle/56,958)-A-5 (OT)-24 28 San Diego (Candlestick/41,667)-A-15 31 24 Seattle (Candlestick/37,563)-A-22 17 7 Oakland (Oakland/51,192)-A-29 21
1982 (2-2)
14 L.A. Raiders (Candlestick/61,065)-A-14 17 16 St. Louis (Candlestick/51,931)-A-21 13 9 San Diego (San Diego/48,697)-A-28 23 17 Seattle (Seattle/57,839)-S-3 13
1983 (1-3)
23 L.A. Raiders (LA/41,337)-A-6 (OT)-26 17 New England (Candlestick/50,043)-A-14 15 7 San Diego (San Diego/43,939)-A-20 24 6 Seattle (Candlestick/47,074)-A-27 20
1984 (2-2)
13 L.A. Raiders (Candlestick/61,361)-A-4 10 20 Denver (Denver/70,211)-A-11 21 15 San Diego (San Diego/58,356)-A-18 35 17 Seattle (Candlestick/49,219)-A-24 7
1985 (3-1)
28 L.A. Raiders (Los Angeles/54,990)-A-10 21 13 Denver (Candlestick/55,425)-A-19 20 25 San Diego (Candlestick/50,569)-A-24 10 23 Seattle (Seattle/60,403)-A-30 21
1986 (2-2)
32 L.A. Raiders (Candlestick/61,834)-A-10 0 17 L.A. Rams (Anaheim/49,146)-A-18 31 9 Denver (Denver/73,592)-A-23 14 21 Seattle (Candlestick/52,419)-A29 10
1987 (3-2)
20 Kansas City (Canton/23,826)-A-8 7 42 L.A. Raiders (Los Angeles/53,838)-A-15 16 3 Dallas (Candlestick/57,598)-A-22 13 17 San Diego (Candlestick/52,733)-A-27 3 10 Seattle (Seattle/59,653)-S-4 34
1988 (3-2)
21 Miami (London, England/70,535)-J-31 27 24 L.A. Raiders (Candlestick/64,457)-A-6 10 24 Denver (Denver/75,067)-A-13 34 34 San Diego (San Diego/39,044)-A-20 27 27 Seattle (Candlestick/53,357)-A-26 21
1989 (3-2)
13 L.A. Rams (Tokyo/43,896)-A-6 (OT)-16 37 L.A. Raiders (Los Angeles/36,739)-A-12 7 35 Denver (Candlestick/58,641)-A-19 17 17 San Diego (Candlestick/54,471)-A-23 14 17 Seattle (Seattle/58,641)-S-1 28
1990 (1-3)
13 L.A. Raiders (Candlestick/59,677)-A-11 23 27 Denver (Denver/74,164)-A-20 24 28 San Diego (San Diego/49,289)-A-25 29 10 Seattle (Candlestick/54,269)-A-31 30
1991 (5-0)
24 L.A. Raiders (Los Angeles/45,365)-J-27 17 21 Chicago (Berlin, Germany/66,876)-A-3 7 24 Denver (Candlestick/54,170)-A-7 6 24 San Diego (Candlestick/53,453)-A-19 13 28 Seattle (Seattle/54,111)-A-23 16
1992 (5-0)
13 Denver (Candlestick/50,435)-A-3 7 24 L.A. Raiders (Candlestick/49,068)-A-8 10 17 Washington (London/61,722)-A-16 15 20 San Diego (San Diego/40,921)-A-21 14 24 Seattle (Candlestick/52,822)-A-28 17
1993 (4-1)
21 Pittsburgh (Barcelona/45,330)-A-1 14 27 L.A. Raiders (Stanford/68,011)-A-8 0 16 Denver (Denver/71,921)-A-16 13 0 Seattle (Seattle/51,086)-A-21 30 30 San Diego (Candlestick/53,649)-A-28 14
X First 49ers pro football game in Candlestick Park: August 8, 1971

SAN FRANCISCO 49ERS
M E D I A G U I D E2 0 1 7 S E A S O N 522
1994 (3-1)
7 Arizona (Arizona/68,288)-A-5 17 20 Denver (Candlestick/52,429)-A-12 3 30 San Diego (San Diego/45,674)-A-18 24 13 Seattle (Candlestick/54,004)-A-26 9
1995 (3-2)
7 Denver (Denver/71,182)-J-29 9 10 Denver (Tokyo, Japan/45,000)-A-6 24 17 San Diego (San Diego/58,233)-A-13 6 17 Carolina (3Com/51,185)-A-19 10 17 Seattle (3Com/53,280)-A-26 7
1996 (1-3)
17 Denver (3Com/48,577)-A-3 20 16 San Diego (3Com/49,846)-A-10 (OT)-13 10 Jacksonville (Jacksonville/67,858)-A-18 38 3 Seattle (Seattle/38,144)-A-23 20
1997 (1-3)
13 San Diego (San Diego/62,542)-A-2 20 21 Seattle (3Com/50,153)-A-9 17 20 Jacksonville (3Com/50,346)-A-18 28 17 Denver (Denver/69,874)-A-23 31
1998 (2-3)
14 New England (3Com/46,374)-A-2 13 21 San Diego (San Diego/55,723)-A-8 27 24 Seattle (Vancouver, BC/45,202)-A-15* 21 20 Miami (3Com/53,214)-A-23 21 20 Seattle (Seattle/57,014)-A-28 21 *American Bowl at Vancouver, B.C.
1999 (3-1)
31 San Diego (3Com/65,898)-A-12 24 24 Seattle (3Com/66,193)-A-19 23 16 Oakland (Oakland/61,901)-A-30 8 3 Denver (Denver/68,421)-S-3 34
2000 (1-4)
0 New England (Canton/22,840)-J-31* 20 20 San Diego (3Com/64,243)-A-5 23 33 Kansas City (Kansas City/76,682)-A-13 10 21 Seattle (Seattle/68,579)-A-19 25 24 Denver (3Com/65,016)-A-25 28 *Hall of Fame Game at Canton, OH
2001 (1-3)
24 San Diego (San Diego/45,155)-A-11 25 20 Oakland (3Com/67,817)-A-19 17 18 Seattle (3Com/63,887)-A-25 28 7 Denver (Denver/73,855)-A-31 35
2002 (2-3)
7 Washington (Osaka/26,119)-A-3* 38 14 Kansas City (3Com/63,111)-A-10 (OT)-17 12 Denver (Denver/73,071)-A-19 7 10 Oakland (Oakland/40,120)-A-24 17 27 San Diego (3Com/62,980)-A-28 3 *American Bowl in Osaka, Japan
2003 (3-1)
24 at Kansas City (Kansas City/73,830)-A-9 6 14 Oakland (3Com/65,856)-A-14 10 27 New Orleans (3Com/63,153)-A-23 12 3 at San Diego (San Diego/49,676)-A-29 24
2004 (0-4)
30 Oakland (Monster Park/63,854)-A-14 33 13 at Chicago (Chicago/61,760)-A-21 20 10 at Minnesota (Minnesota/63,960)-A-27 23 15 San Diego (Monster Park/60,034)-S-2 31
2005 (2-2)
21 Oakland (Monster Park/61,446)-A-13 13 21 at Denver (Denver/70,794)-A-20 26 16 Tennessee (Monster Park/56,856)-A-26 13 24 at San Diego (San Diego/49,817)-S-1 2 8
2006 (2-2)
28 Chicago (Monster Park/67,572)-A-11 14 7 at Oakland (Oakland/47,849)-A-20 23 7 at Dallas (Dallas/61,295)-A-26 17 23 San Diego (Monster Park/66,946)-S-1 14
2007 (1-3)
13 Denver (Monster Park/66,764)-A-13 17 26 Oakland (Monster Park/68,107)-A-18 21 28 at Chicago (Chicago/61,807)-A-25 31 13 at San Diego (San Diego/56,172)-A-30 16
2008 (2-2)
6 at Oakland (Oakland/52,609)-A-8 18 34 Green Bay (Candlestick/67,230)-A-16 6 37 at Chicago (Chicago/61,051)-A-21 30 17 San Diego (Candlestick/67,133)-A-29 20
2009 (3-1)
17 Denver (Candlestick/61,533)-A-14 16 21 Oakland (Candlestick/61,907)-A-22 20 20 at Dallas (Arlington/72,171)-A-29 13 7 at San Diego (San Diego/59,049)-S-4 26
2010 (4-0)
37 at Indianapolis (Indianapolis/65,644)-A-15 17 15 Minnesota (Candlestick/69,732)-A-22 10 28 at Oakland (Oakland/42,248)-A-28 24 17 San Diego (Candlestick/69,732)-S-2 14
2011 (2-2)
3 at New Orleans (New Orleans/72,578)-A-12 24 17 Oakland (Candlestick/69,732)-A-20 3 7 Houston (Candlestick/69,732)-A-27 30 20 at San Diego (San Diego/54,082)-S-1 17
2012 (3-1)
17 Minnesota (Candlestick/69,732)-A-10 6 9 at Houston (Houston/71,196)-A-18 20 29 at Denver (Denver/75,122)-A-26 24 35 San Diego (Candlestick/69,732)-A-30 3
2013 (3-1)
6 Denver (Candlestick/69,732)-A-8 10 15 at Kansas City (Kansas City/64,434)-A-16 13 34 Minnesota (Candlestick/69,732)-A-25 14 41 at San Diego (San Diego/55,386)-A-29 6
2014 (2-2)
3 at Baltimore (Baltimore/70,529)-A-7 23 0 Denver (Levi’s Stadium/68,426)-A-17 34 21 San Diego (Levi’s Stadium/68,011)-A-24 7 40 at Houston (Houston/71,408)-A-28 13
2015 (2-2)
10 at Houston (Houston/71,403)-A-15 23 23 Dallas (Levi’s Stadium/70,178)-A-23 6 12 at Denver (Denver/76,149)-A-29 19 14 San Diego (Levi’s Stadium/70,178)-S-3 12
2016 (2-2)
13 Houston (Levi’s Stadium/70,178)-A-14 24 31 at Denver (Denver/75,422)-A-20 24 10 Green Bay (Levi’s Stadium/70,178)-A-26 21 31 at San Diego (San Diego/47,407)-S-1 21

SAN FRANCISCO 49ERS
M E D I A G U I D E2 0 1 7 S E A S O N 523
HOME RECORD ROAD RECORD YEAR W L T PCT YEAR W L T PCT 1946 5 2 0 .714 1946 4 3 0 .571 1947 4 2 1 .642 1947 4 2 1 .642 1948 6 1 0 .857 1948 6 1 0 .857 1949 6 0 0 1.000 1949 3 3 0 .500 1950 3 3 0 .500 1950 0 6 0 .000 1951 5 1 0 .833 1951 2 3 1 .416 1952 3 3 0 .500 1952 4 2 0 .666 1953 5 1 0 .833 1953 4 2 0 .666 1954 4 2 0 .666 1954 3 2 1 .583 1955 2 4 0 .333 1955 2 4 0 .333 1956 3 3 0 .500 1956 2 3 1 .416 1957 5 1 0 .833 1957 3 3 0 .500 1958 4 2 0 .666 1958 2 4 0 .333 1959 4 2 0 .666 1959 3 3 0 .500 1960 3 3 0 .500 1960 4 2 0 .666 1961 5 1 1 .785 1961 2 5 0 .285 1962 1 6 0 .142 1962 5 2 0 .714 1963 2 5 0 .285 1963 0 7 0 .000 1964 3 4 0 .428 1964 1 6 0 .142 1965 4 2 1 .642 1965 3 4 0 .428 1966 4 2 1 .642 1966 2 4 1 .357 1967 3 4 0 .428 1967 4 3 0 .571 1968 3 3 1 .500 1968 4 3 0 .571 1969 3 3 1 .500 1969 1 5 1 .214 1970 5 1 1 .785 1970 5 2 0 .714 1971 4 3 0 .571 1971 5 2 0 .714 1972 4 2 1 .642 1972 4 3 0 .571 1973 3 4 0 .428 1973 2 5 0 .285 1974 3 4 0 .428 1974 3 4 0 .428 1975 2 5 0 .285 1975 3 4 0 .428 1976 4 3 0 .571 1976 4 3 0 .571 1977 3 4 0 .428 1977 2 5 0 .285 1978 2 6 0 .125 1978 0 8 0 .000 1979 2 6 0 .125 1979 0 8 0 .000 1980 4 4 0 .500 1980 2 6 0 .250 1981 7 1 0 .875 1981 6 2 0 .750 1982 0 5 0 .000 1982 3 1 0 .750 1983 4 4 0 .500 1983 6 2 0 .750 1984 7 1 0 .875 1984 8 0 0 1.000 1985 5 3 0 .625 1985 5 3 0 .625 1986 6 2 0 .750 1986 4 3 1 .562 1987 6 1 0 .857 1987 7 1 0 .875 1988 4 4 0 .500 1988 6 2 0 .750 1989 6 2 0 .750 1989 8 0 0 1.000 1990 6 2 0 .750 1990 8 0 0 1.000 1991 7 1 0 .875 1991 3 5 0 .375 1992 7 1 0 .875 1992 7 1 0 .875 1993 6 2 0 .750 1993 4 4 0 .500 1994 7 1 0 .875 1994 6 2 0 .750 1995 6 2 0 .750 1995 5 3 0 .625 1996 6 2 0 .750 1996 6 2 0 .750 1997 8 0 0 1.000 1997 5 3 0 .625 1998 8 0 0 1.000 1998 4 4 0 .500 1999 3 5 0 .375 1999 1 7 0 .125 2000 4 4 0 .500 2000 2 6 0 .250 2001 7 1 0 .875 2001 5 3 0 .625 2002 5 3 0 .625 2002 5 3 0 .625 2003 6 2 0 .750 2003 1 7 0 .125 2004 1 7 0 .125 2004 1 7 0 .125 2005 3 5 0 .375 2005 1 7 0 .125 2006 4 4 0 .500 2006 3 5 0 .375 2007 3 5 0 .375 2007 2 6 0 .250 2008 4 4 0 .500 2008 3 5 0 .375 2009 6 2 0 .750 2009 2 6 0 .250 2010 5 3 0 .625 2010 1 7 0 .125 2011 7 1 0 .875 2011 6 2 0 .750 2012 6 1 1 .813 2012 5 3 0 .625 2013 6 2 0 .750 2013 6 2 0 .750 2014 4 4 0 .500 2014 4 4 0 .500 2015 4 4 0 .500 2015 1 7 0 .125 2016 1 7 0 .125 2016 1 7 0 .125 TOTALS 311 200 9 .607 249 264 7 .486
HOME/AWAY RECORDS

SAN FRANCISCO 49ERS
M E D I A G U I D E2 0 1 7 S E A S O N 524
1970 * San Francisco 10-3-1 Los Angeles Rams 9-4-1 Atlanta 4-8-2 New Orleans 2-11-1
1971 * San Francisco 9-5 Los Angeles Rams 8-5-1 Atlanta 7-6-1 New Orleans 4-8-2
1972 * San Francisco 8-5-1 Atlanta 7-7 Los Angeles Rams 6-7-1 New Orleans 2-11-1
1973 * Los Angeles Rams 12-2 Atlanta 9-5 New Orleans 5-9 San Francisco 5-9
1974 * Los Angeles Rams 10-4 San Francisco 6-8 New Orleans 5-9 Atlanta 3-11
1975 * Los Angeles Rams 12-2 San Francisco 5-9 Atlanta 4-10 New Orleans 2-12
1976 * Los Angeles Rams 10-3-1 San Francisco 8-6 New Orleans 4-10 Atlanta 4-10 Seattle 2-12
1977 * Los Angeles Rams 10-4 Atlanta 7-7 San Francisco 5-9 New Orleans 3-11
1978 * Los Angeles Rams 12-4 * Atlanta 9-7 New Orleans 7-9 San Francisco 2-14
1979 * Los Angeles Rams 9-7 New Orleans 8-8 Atlanta 6-10 San Francisco 2-14
1980 * Atlanta 12-4 * Los Angeles Rams 11-5 San Francisco 6-10 New Orleans 1-15
1981 * San Francisco 13-3 Atlanta 7-9 Los Angeles Rams 6-10 New Orleans 4-12
1982 * Atlanta 5-4 New Orleans 4-5 San Francisco 3-6 Los Angeles Rams 2-7
1983 * San Francisco 10-6 * Los Angeles Rams 9-7 New Orleans 8-8 Atlanta 7-9
1984 * San Francisco 15-1 * Los Angeles Rams 10-6 New Orleans 7-9 Atlanta 4-12
1985 * Los Angeles Rams 11-5 * San Francisco 10-6 New Orleans 5-11 Atlanta 4-12
1986 * San Francisco 10-5-1 * Los Angeles Rams 10-6 Atlanta 7-8-1 New Orleans 7-9
1987 * San Francisco 13-2 * New Orleans 12-3 Los Angeles 6-9 Atlanta 3-12
1988 * San Francisco 10-6 * Los Angeles Rams 10-6 New Orleans 10-6 Atlanta 5-11
1989 * San Francisco 14-2 * Los Angeles Rams 11-5 New Orleans 9-7 Atlanta 3-13
1990 * San Francisco 14-2 * New Orleans 8-8 Los Angeles Rams 5-11 Atlanta 5-11
1991 * New Orleans 11-5 * Atlanta 10-6 San Francisco 10-6 Los Angeles Rams 3-13
1992 * San Francisco 14-2 * New Orleans 12-4 Atlanta 6-10 Los Angeles Rams 6-10
1993 * San Francisco 10-6 New Orleans 8-8 Atlanta 6-10 Los Angeles Rams 5-11
1994 * San Francisco 13-3 New Orleans 7-9 Atlanta 7-9 Los Angeles Rams 4-12
1995 * San Francisco 11-5 * Atlanta 9-7 St. Louis 7-9 Carolina 7-9 New Orleans 7-9
1996 * Carolina 12-4 * San Francisco 12-4 St. Louis 6-10 Atlanta 3-13 New Orleans 3-13
1997 * San Francisco 13-3 Atlanta 7-9 Carolina 7-9 New Orleans 6-10 St. Louis 5-11
1998 * Atlanta 14-2 * San Francisco 12-4 New Orleans 6-10 Carolina 4-12 St. Louis 4-12
1999 * St. Louis 13-3 Carolina 8-8 Atlanta 5-11 San Francisco 4-12 New Orleans 3-13
2000 * St. Louis 10-6 * New Orleans 10-6 Carolina 7-9 San Francisco 6-10 Atlanta 4-12
2001 * St. Louis 14-2 * San Francisco 12-4 New Orleans 7-9 Atlanta 7-9 Carolina 1-15
2002 * San Francisco 10-6 St. Louis 7-9 Seattle 7-9 Arizona 5-11
2003 * St. Louis 12-4 * Seattle 10-6 San Francisco 7-9 Arizona 4-12
2004 * Seattle 9-7 * St. Louis 8-8 Arizona 6-10 San Francisco 2-14
2005 * Seattle 13-3 St. Louis 6-10 Arizona 5-11 San Francisco 4-12
2006 * Seattle 9-7 St. Louis 8-8 San Francisco 7-9 Arizona 5-11
2007 * Seattle 10-6 Arizona 8-8 San Francisco 5-11 St. Louis 3-13
2008 * Arizona 9-7 San Francisco 7-9 Seattle 4-12 St. Louis 2-14
2009 * Arizona 10-6 San Francisco 8-8 Seattle 5-11 St. Louis 1-15
2010 * Seattle 7-9 St. Louis 7-9 San Francisco 6-10 Arizona 5-11
2011 * San Francisco 13-3 Arizona 8-8 Seattle 7-9 St. Louis 2-14
2012 * San Francisco 11-4-1 * Seattle 11-5 St. Louis 7-8-1 Arizona 5-11
2013 * Seattle 13-3 * San Francisco 12-4 Arizona 10-6 St. Louis 7-9
2014 * Seattle 12-4 * Arizona 11-5 San Francisco 8-8 St. Louis 6-10
2015 * Arizona 13-3 * Seattle 10-6 St. Louis 7-9 San Francisco 5-11
2016 * Seattle 10-5-1 Arizona 7-8-1 Los Angeles Rams 4-12 San Francisco 2-14
NFC WEST STANDINGS - 1970-2016
* Playoff Team