San Angelo ISD - Lee Middle School - 2009 Texas School Survey of Drug and Alcohol Use
Upload
texas-school-survey-of-drug-and-alcohol-useCategory
view
219download
0
8/6/2019 San Angelo ISD - Glenn Middle School - 2009 Texas School Survey of Drug and Alcohol Use
http://slidepdf.com/reader/full/san-angelo-isd-glenn-middle-school-2009-texas-school-survey-of-drug-and 1/61
San Angelo ISD - Glenn Middle School
SPRING 2009
Texas School Survey
of Drug and Alcohol Use
2009
San Angelo ISD
Campus-Level Analysis
042 Glenn Middle School
©Copyright 2009, Texas A&M University
All rights reserved.
Secondary Report-Page 1 of 61

8/6/2019 San Angelo ISD - Glenn Middle School - 2009 Texas School Survey of Drug and Alcohol Use
http://slidepdf.com/reader/full/san-angelo-isd-glenn-middle-school-2009-texas-school-survey-of-drug-and 2/61
San Angelo ISD - Glenn Middle School
SPRING 2009
©Copyright 2009, Texas A&M University
All rights reserved.
Secondary Report-Page 2 of 61

8/6/2019 San Angelo ISD - Glenn Middle School - 2009 Texas School Survey of Drug and Alcohol Use
http://slidepdf.com/reader/full/san-angelo-isd-glenn-middle-school-2009-texas-school-survey-of-drug-and 3/61
San Angelo ISD - Glenn Middle School
SPRING 2009
Campus-Level AnalysisSecondary (Grades 7-8)
Table of Contents
General Substance Tables 5-26
TobaccoAlcoholDrugsInhalantsMiscellaneous
Prevalence Tables 27-42
Selected Substances:
Table B1: All StudentsTable B2: Male StudentsTable B3: Female StudentsTable B4: White StudentsTable B5: African/American StudentsTable B6: Mexican/American StudentsTable B7: Students Reporting A GradesTable B8: Students Reporting Grades Lower Than an ATable B9: Students Living With 2 ParentsTable B10: Students Not Living With 2 Parents
Table B11: Students who would seek help from adultsTable B12: Students who wouldn’t seek help from adultsTable B13 Students Living in Town More Than 3 YearsTable B14: Students Living in Town 3 Years or Less
Margin Tables 43-60
©Copyright 2009, Texas A&M University
All rights reserved.
Secondary Report-Page 3 of 61

8/6/2019 San Angelo ISD - Glenn Middle School - 2009 Texas School Survey of Drug and Alcohol Use
http://slidepdf.com/reader/full/san-angelo-isd-glenn-middle-school-2009-texas-school-survey-of-drug-and 4/61
San Angelo ISD - Glenn Middle School
SPRING 2009
©Copyright 2009, Texas A&M University
All rights reserved.
Secondary Report-Page 4 of 61
8/6/2019 San Angelo ISD - Glenn Middle School - 2009 Texas School Survey of Drug and Alcohol Use
http://slidepdf.com/reader/full/san-angelo-isd-glenn-middle-school-2009-texas-school-survey-of-drug-and 5/61
San Angelo ISD - Glenn Middle School
SPRING 2009
1. General Substance Tables
©Copyright 2009, Texas A&M University
All rights reserved.
Secondary Report-Page 5 of 61

8/6/2019 San Angelo ISD - Glenn Middle School - 2009 Texas School Survey of Drug and Alcohol Use
http://slidepdf.com/reader/full/san-angelo-isd-glenn-middle-school-2009-texas-school-survey-of-drug-and 6/61

8/6/2019 San Angelo ISD - Glenn Middle School - 2009 Texas School Survey of Drug and Alcohol Use
http://slidepdf.com/reader/full/san-angelo-isd-glenn-middle-school-2009-texas-school-survey-of-drug-and 7/61
San Angelo ISD - Glenn Middle School
SPRING 2009
Table T-1: How recently, if ever, have you used ..
Past
Month
School
Year
Ever
Used
Never
Used
Any tobacco product
All 7.0% 11.6% 23.0% 77.0%
Cigarettes
All 7.0% 11.6% 22.3% 77.7%
Smokeless tobacco
All 1.3% 2.1% 5.8% 94.2%
Table T-2: How often do you normally use ..
Never
Used
Every
Day
Several
Times a
Week
Several
Times a
Month
About
Once a
Month
About
Once a
Year
Less than
Once a
YearAny tobacco product?
All 78.8% 0.8% 1.3% 1.2% 5.4% 5.1% 7.4%
Cigarettes?
All 79.0% 0.8% 0.8% 1.5% 5.4% 4.9% 7.5%
Smokeless tobacco?
All 95.8% 0.0% 0.8% 0.3% 0.0% 0.8% 2.3%
Table T-3: Average age of first use of:
All
Cigarettes
11.4
Smokeless
tobacco
12.1
Any Tobacco
11.4
©Copyright 2009, Texas A&M University
All rights reserved.
Secondary Report-Page 7 of 61
8/6/2019 San Angelo ISD - Glenn Middle School - 2009 Texas School Survey of Drug and Alcohol Use
http://slidepdf.com/reader/full/san-angelo-isd-glenn-middle-school-2009-texas-school-survey-of-drug-and 8/61
San Angelo ISD - Glenn Middle School
SPRING 2009
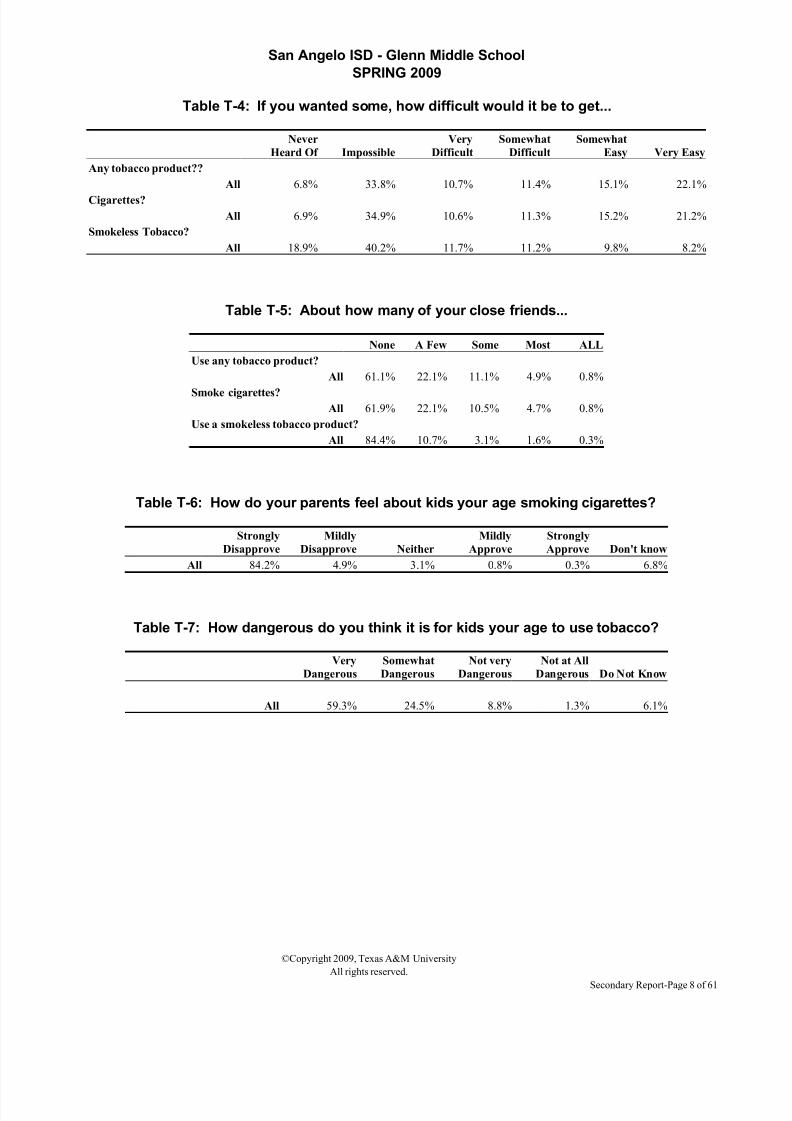
Table T-4: If you wanted some, how difficult would it be to get...
Never
Heard Of Impossible
Very
Difficult
Somewhat
Difficult
Somewhat
Easy Very Easy
Any tobacco product??
All 6.8% 33.8% 10.7% 11.4% 15.1% 22.1%
Cigarettes?
All 6.9% 34.9% 10.6% 11.3% 15.2% 21.2%
Smokeless Tobacco?
All 18.9% 40.2% 11.7% 11.2% 9.8% 8.2%
Table T-5: About how many of your close friends...
None A Few Some Most ALL
Use any tobacco product?
All 61.1% 22.1% 11.1% 4.9% 0.8%
Smoke cigarettes?All 61.9% 22.1% 10.5% 4.7% 0.8%
Use a smokeless tobacco product?
All 84.4% 10.7% 3.1% 1.6% 0.3%
Table T-6: How do your parents feel about kids your age smoking cigarettes?
Strongly
Disapprove
Mildly
Disapprove Neither
Mildly
Approve
Strongly
Approve Don't know
All 84.2% 4.9% 3.1% 0.8% 0.3% 6.8%
Table T-7: How dangerous do you think it is for kids your age to use tobacco?
Very
Dangerous
Somewhat
Dangerous
Not very
Dangerous
Not at All
Dangerous Do Not Know
All 59.3% 24.5% 8.8% 1.3% 6.1%
©Copyright 2009, Texas A&M University
All rights reserved.
Secondary Report-Page 8 of 61
8/6/2019 San Angelo ISD - Glenn Middle School - 2009 Texas School Survey of Drug and Alcohol Use
http://slidepdf.com/reader/full/san-angelo-isd-glenn-middle-school-2009-texas-school-survey-of-drug-and 9/61
San Angelo ISD - Glenn Middle School
SPRING 2009
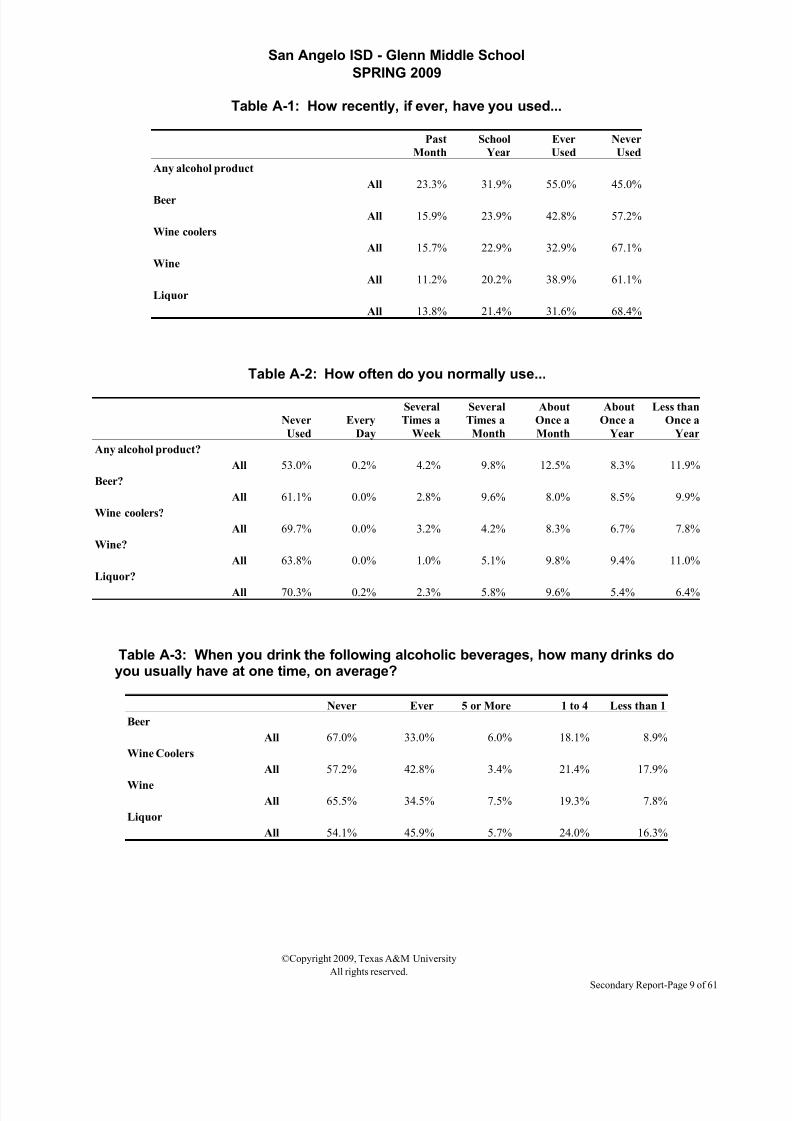
Table A-1: How recently, if ever, have you used...
Past
Month
School
Year
Ever
Used
Never
Used
Any alcohol product
All 23.3% 31.9% 55.0% 45.0%
Beer
All 15.9% 23.9% 42.8% 57.2%
Wine coolers
All 15.7% 22.9% 32.9% 67.1%
Wine
All 11.2% 20.2% 38.9% 61.1%
Liquor
All 13.8% 21.4% 31.6% 68.4%
Table A-2: How often do you normally use...
Never
Used
Every
Day
Several
Times a
Week
Several
Times a
Month
About
Once a
Month
About
Once a
Year
Less than
Once a
Year
Any alcohol product?
All 53.0% 0.2% 4.2% 9.8% 12.5% 8.3% 11.9%
Beer?
All 61.1% 0.0% 2.8% 9.6% 8.0% 8.5% 9.9%
Wine coolers?
All 69.7% 0.0% 3.2% 4.2% 8.3% 6.7% 7.8%
Wine?
All 63.8% 0.0% 1.0% 5.1% 9.8% 9.4% 11.0%
Liquor?
All 70.3% 0.2% 2.3% 5.8% 9.6% 5.4% 6.4%
Table A-3: When you drink the following alcoholic beverages, how many drinks doyou usually have at one time, on average?
Never Ever 5 or More 1 to 4 Less than 1
Beer
All 67.0% 33.0% 6.0% 18.1% 8.9%
Wine Coolers
All 57.2% 42.8% 3.4% 21.4% 17.9%
WineAll 65.5% 34.5% 7.5% 19.3% 7.8%
Liquor
All 54.1% 45.9% 5.7% 24.0% 16.3%
©Copyright 2009, Texas A&M University
All rights reserved.
Secondary Report-Page 9 of 61
8/6/2019 San Angelo ISD - Glenn Middle School - 2009 Texas School Survey of Drug and Alcohol Use
http://slidepdf.com/reader/full/san-angelo-isd-glenn-middle-school-2009-texas-school-survey-of-drug-and 10/61
San Angelo ISD - Glenn Middle School
SPRING 2009
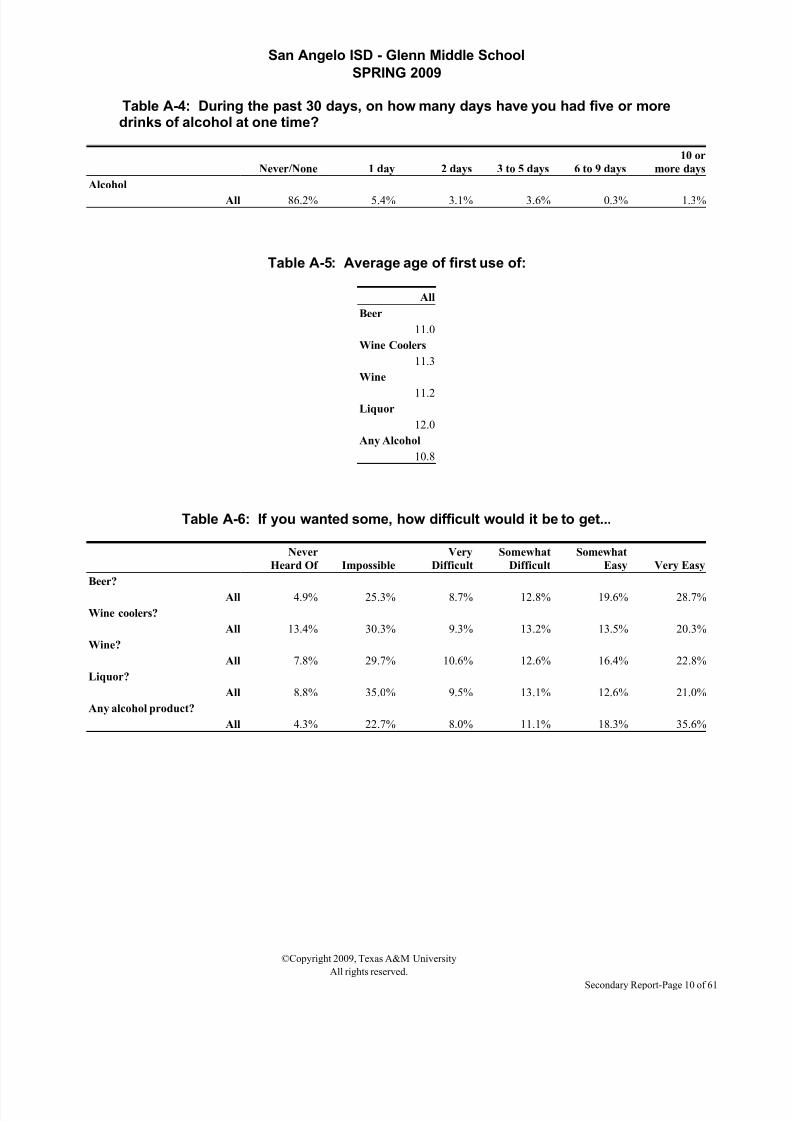
Table A-4: During the past 30 days, on how many days have you had five or moredrinks of alcohol at one time?
Never/None 1 day 2 days 3 to 5 days 6 to 9 days
10 or
more days
Alcohol
All 86.2% 5.4% 3.1% 3.6% 0.3% 1.3%
Table A-5: Average age of first use of:
All
Beer
11.0
Wine Coolers
11.3
Wine
11.2Liquor
12.0
Any Alcohol
10.8
Table A-6: If you wanted some, how difficult would it be to get...
Never
Heard Of Impossible
Very
Difficult
Somewhat
Difficult
Somewhat
Easy Very Easy
Beer?
All 4.9% 25.3% 8.7% 12.8% 19.6% 28.7%
Wine coolers?
All 13.4% 30.3% 9.3% 13.2% 13.5% 20.3%
Wine?
All 7.8% 29.7% 10.6% 12.6% 16.4% 22.8%
Liquor?
All 8.8% 35.0% 9.5% 13.1% 12.6% 21.0%
Any alcohol product?
All 4.3% 22.7% 8.0% 11.1% 18.3% 35.6%
©Copyright 2009, Texas A&M University
All rights reserved.
Secondary Report-Page 10 of 61
8/6/2019 San Angelo ISD - Glenn Middle School - 2009 Texas School Survey of Drug and Alcohol Use
http://slidepdf.com/reader/full/san-angelo-isd-glenn-middle-school-2009-texas-school-survey-of-drug-and 11/61
San Angelo ISD - Glenn Middle School
SPRING 2009
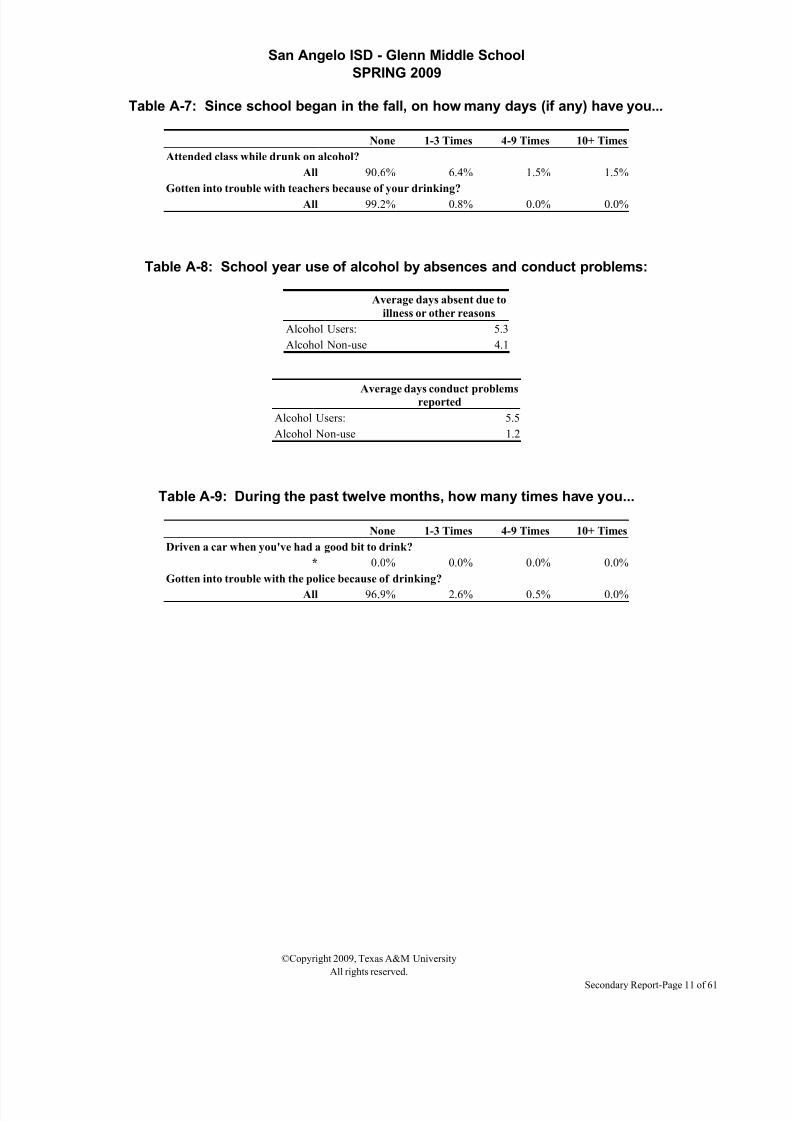
Table A-7: Since school began in the fall, on how many days (if any) have you...
None 1-3 Times 4-9 Times 10+ Times
Attended class while drunk on alcohol?
All 90.6% 6.4% 1.5% 1.5%
Gotten into trouble with teachers because of your drinking?
All 99.2% 0.8% 0.0% 0.0%
Table A-8: School year use of alcohol by absences and conduct problems:
Average days absent due to
illness or other reasons
Alcohol Users: 5.3
Alcohol Non-use 4.1
Average days conduct problemsreported
Alcohol Users: 5.5
Alcohol Non-use 1.2
Table A-9: During the past twelve months, how many times have you...
None 1-3 Times 4-9 Times 10+ Times
Driven a car when you've had a good bit to drink?
* 0.0% 0.0% 0.0% 0.0%
Gotten into trouble with the police because of drinking?
All 96.9% 2.6% 0.5% 0.0%
©Copyright 2009, Texas A&M University
All rights reserved.
Secondary Report-Page 11 of 61
8/6/2019 San Angelo ISD - Glenn Middle School - 2009 Texas School Survey of Drug and Alcohol Use
http://slidepdf.com/reader/full/san-angelo-isd-glenn-middle-school-2009-texas-school-survey-of-drug-and 12/61
San Angelo ISD - Glenn Middle School
SPRING 2009
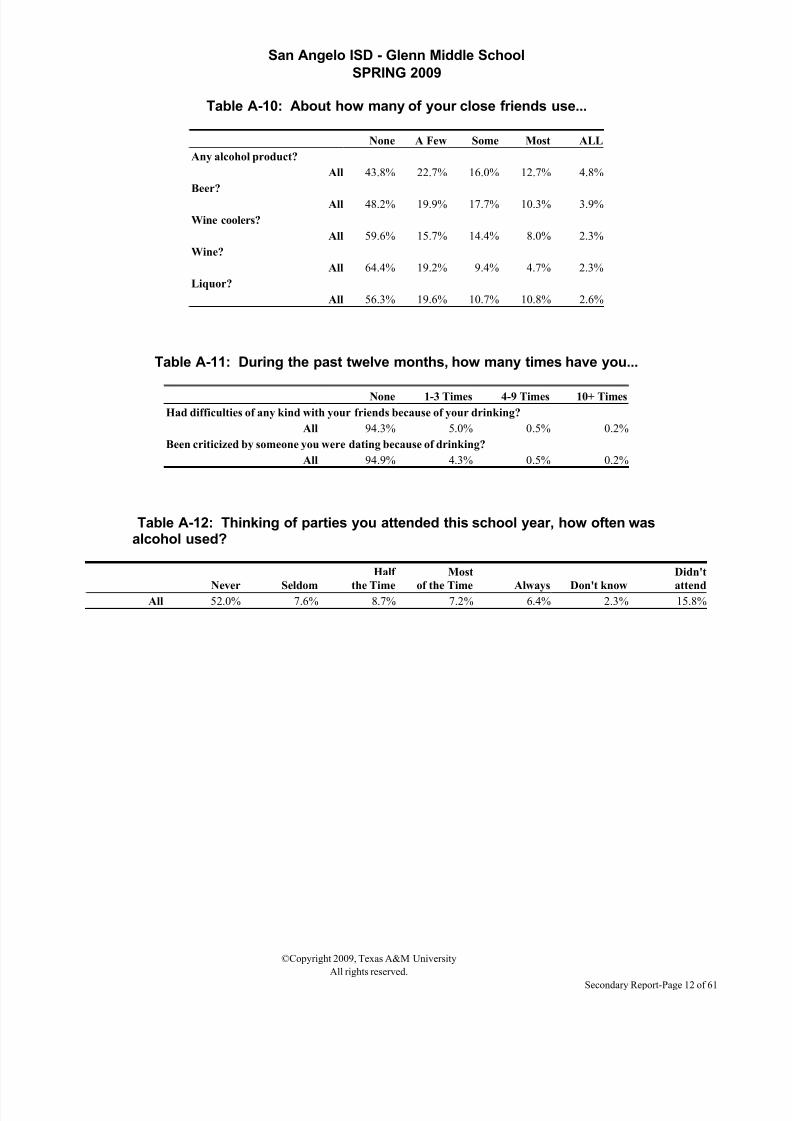
Table A-10: About how many of your close friends use...
None A Few Some Most ALL
Any alcohol product?
All 43.8% 22.7% 16.0% 12.7% 4.8%
Beer?
All 48.2% 19.9% 17.7% 10.3% 3.9%
Wine coolers?
All 59.6% 15.7% 14.4% 8.0% 2.3%
Wine?
All 64.4% 19.2% 9.4% 4.7% 2.3%
Liquor?
All 56.3% 19.6% 10.7% 10.8% 2.6%
Table A-11: During the past twelve months, how many times have you...
None 1-3 Times 4-9 Times 10+ Times
Had difficulties of any kind with your friends because of your drinking?
All 94.3% 5.0% 0.5% 0.2%
Been criticized by someone you were dating because of drinking?
All 94.9% 4.3% 0.5% 0.2%
Table A-12: Thinking of parties you attended this school year, how often wasalcohol used?
Never Seldom
Half
the Time
Most
of the Time Always Don't know
Didn't
attendAll 52.0% 7.6% 8.7% 7.2% 6.4% 2.3% 15.8%
©Copyright 2009, Texas A&M University
All rights reserved.
Secondary Report-Page 12 of 61

8/6/2019 San Angelo ISD - Glenn Middle School - 2009 Texas School Survey of Drug and Alcohol Use
http://slidepdf.com/reader/full/san-angelo-isd-glenn-middle-school-2009-texas-school-survey-of-drug-and 13/61
San Angelo ISD - Glenn Middle School
SPRING 2009
Table A-13: How often, if ever, do you get alcoholic beverages from..
Do Not Drink Never Seldom
Most of
the Time Always
At home
All 49.9% 19.3% 23.1% 5.4% 2.3%
From friends
All 51.6% 21.2% 13.5% 12.1% 1.6%
From a store
All 53.7% 37.9% 4.9% 2.5% 1.0%
At parties
All 51.1% 19.1% 11.0% 10.6% 8.3%
Other source
All 52.7% 23.9% 9.8% 7.8% 5.8%
Table A-14: How do your parents feel about kids your age drinking beer?
Strongly
Disapprove
Mildly
Disapprove Neither
Mildly
Approve
Strongly
Approve Don't know
All 71.1% 11.7% 7.0% 3.6% 0.5% 6.1%
Table A-15: How dangerous do you think it is for kids your age to use alcohol?
Very
Dangerous
Somewhat
Dangerous
Not very
Dangerous
Not at All
Dangerous Do Not Know
All 48.8% 29.4% 14.3% 3.9% 3.6%
©Copyright 2009, Texas A&M University
All rights reserved.
Secondary Report-Page 13 of 61

8/6/2019 San Angelo ISD - Glenn Middle School - 2009 Texas School Survey of Drug and Alcohol Use
http://slidepdf.com/reader/full/san-angelo-isd-glenn-middle-school-2009-texas-school-survey-of-drug-and 14/61
San Angelo ISD - Glenn Middle School
SPRING 2009
Table D-1: How recently, if ever, have you used...
Past
Month
School
Year
Ever
Used
Never
Used
Marijuana?
All 6.7% 9.8% 17.1% 82.9%
Cocaine?
All 1.0% 1.5% 2.7% 97.3%
Crack?
All 0.5% 0.5% 2.2% 97.8%
Hallucinogens?
All 0.2% 0.5% 1.5% 98.5%
Uppers?
All 0.8% 1.6% 2.9% 97.1%
Downers?
All 1.6% 2.4% 2.6% 97.4%
Rohypnol?
All 0.5% 0.8% 1.9% 98.1%
Steroids?All 0.2% 0.7% 1.0% 99.0%
Ecstasy?
All 0.8% 0.8% 1.6% 98.4%
Heroin?
All 1.3% 1.3% 2.0% 98.0%
©Copyright 2009, Texas A&M University
All rights reserved.
Secondary Report-Page 14 of 61

8/6/2019 San Angelo ISD - Glenn Middle School - 2009 Texas School Survey of Drug and Alcohol Use
http://slidepdf.com/reader/full/san-angelo-isd-glenn-middle-school-2009-texas-school-survey-of-drug-and 15/61
San Angelo ISD - Glenn Middle School
SPRING 2009
Table D-2: How often do you normally use...
Never
Used
Every
Day
Several
Times a
Week
Several
Times a
Month
About
Once a
Month
About
Once a
Year
Less than
Once a
Year
Marijuana?
All 83.1% 1.6% 2.2% 2.6% 4.7% 2.7% 3.1%Cocaine?
All 97.7% 0.0% 0.5% 0.2% 0.5% 0.2% 0.8%
Crack?
All 99.0% 0.3% 0.0% 0.0% 0.5% 0.0% 0.2%
Hallucinogens?
All 99.0% 0.0% 0.0% 0.3% 0.2% 0.5% 0.0%
Uppers?
All 97.3% 0.0% 0.0% 0.0% 0.8% 0.8% 1.1%
Downers?
All 97.3% 0.2% 0.0% 0.6% 0.6% 0.8% 0.5%
Rohypnol?
All 98.6% 0.0% 0.3% 0.0% 0.3% 0.3% 0.6%Steroids?
All 98.4% 0.3% 0.0% 0.3% 0.0% 0.5% 0.5%
Ecstasy?
All 98.1% 0.0% 0.0% 0.0% 0.8% 0.2% 0.8%
Heroin?
All 98.5% 0.3% 0.3% 0.0% 0.2% 0.2% 0.5%
Table D-3: Average age of first use of:
All
Marijuana
12.0
Cocaine
11.9
Crack
11.6
Hallucinogens
*
Uppers
12.1
Downers
11.7
Rohypnol
12.0
Steroids
11.3
Ecstasy
12.5
Heroin
11.4
©Copyright 2009, Texas A&M University
All rights reserved.
Secondary Report-Page 15 of 61

8/6/2019 San Angelo ISD - Glenn Middle School - 2009 Texas School Survey of Drug and Alcohol Use
http://slidepdf.com/reader/full/san-angelo-isd-glenn-middle-school-2009-texas-school-survey-of-drug-and 16/61
San Angelo ISD - Glenn Middle School
SPRING 2009
Table D-4: Age of first use of marijuana by family situation:
Never 9/Under 10 to 11 12 to 13 14 to 15 16 to 17 Over 17
Two parent family
All 89.1% 1.3% 3.1% 5.3% 1.3% 0.0% 0.0%
Other family situation
All 71.8% 1.3% 9.8% 11.3% 5.8% 0.0% 0.0%
Table D-5: If you wanted some, how difficult would it be to get..
Never
Heard Of Impossible
Very
Difficult
Somewhat
Difficult
Somewhat
Easy Very Easy
Marijuana?
All 9.7% 48.6% 11.8% 8.0% 7.8% 14.1%
Cocaine?
All 13.9% 52.3% 14.8% 7.2% 7.0% 4.8%
Crack?All 14.7% 51.6% 14.7% 9.0% 4.3% 5.7%
Hallucinogens?
All 45.0% 33.7% 9.3% 5.1% 4.3% 2.7%
Uppers?
All 49.0% 30.0% 8.8% 4.1% 4.6% 3.5%
Downers?
All 49.2% 31.4% 7.7% 4.5% 3.3% 3.9%
Rohypnol?
All 44.9% 36.2% 7.2% 3.7% 3.3% 4.6%
Steroids?
All 16.7% 53.5% 15.5% 5.8% 4.9% 3.6%
Ecstasy?All 42.1% 37.1% 9.6% 2.4% 3.9% 4.9%
Heroin?
All 25.1% 51.2% 12.6% 4.9% 2.7% 3.6%
©Copyright 2009, Texas A&M University
All rights reserved.
Secondary Report-Page 16 of 61

8/6/2019 San Angelo ISD - Glenn Middle School - 2009 Texas School Survey of Drug and Alcohol Use
http://slidepdf.com/reader/full/san-angelo-isd-glenn-middle-school-2009-texas-school-survey-of-drug-and 17/61
San Angelo ISD - Glenn Middle School
SPRING 2009
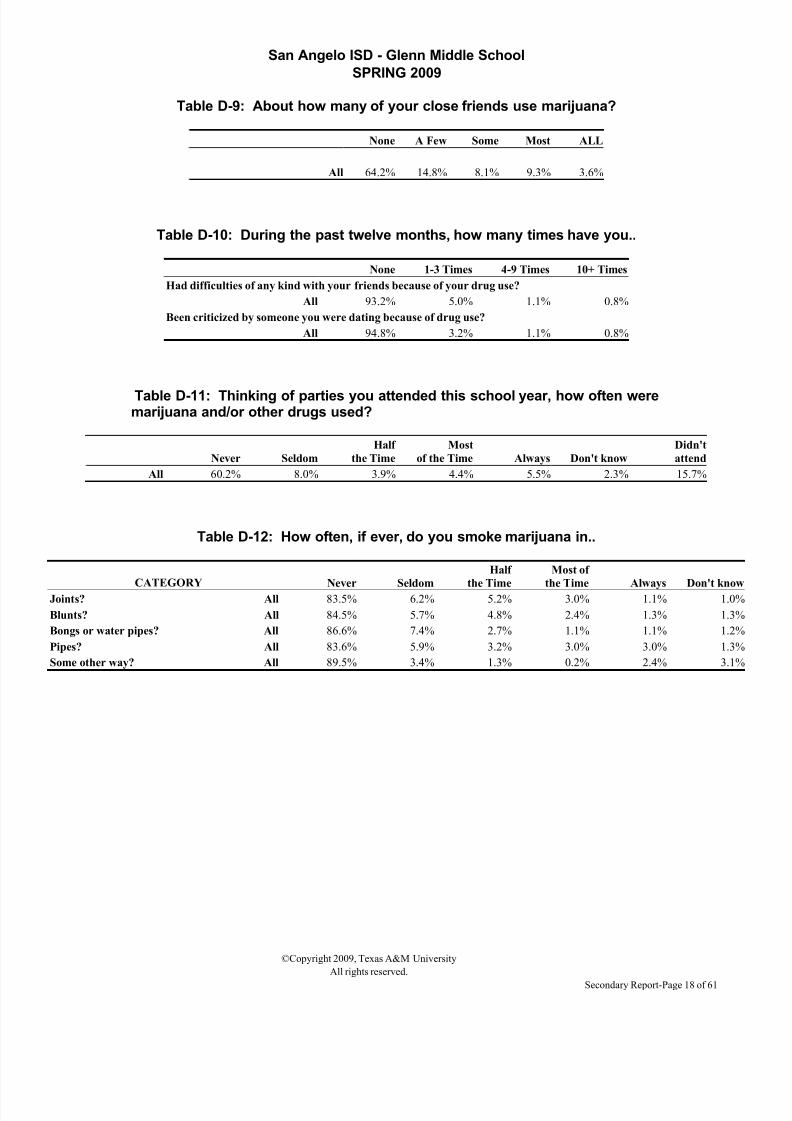
Table D-6: Since school began in the fall, on how many days (if any) have you..
None 1-3 Times 4-9 Times 10+ Times
Attended class while high from marijuana use?
All 90.9% 6.5% 1.3% 1.3%
Attended class while high from use of some other drug?
All 93.7% 5.1% 0.7% 0.5%
Gotten into trouble with teachers because of your drug use?
All 98.7% 1.1% 0.0% 0.3%
Table D-7: School year use of marijuana by absences and conduct problems:
Average days absent due to
illness or other reasons
Marijuana Users: 5.7
Marijuana Non-use 4.3
Average days conduct problems
reported
Marijuana Users: 9.1
Marijuana Non-use 1.9
Table D-8: During the past twelve months, how many times have you..
None 1-3 Times 4-9 Times 10+ Times
Driven a car when you've felt high from drugs?
* 0.0% 0.0% 0.0% 0.0%
Gotten into trouble with the police because of drug use?
All 96.2% 3.2% 0.0% 0.6%
©Copyright 2009, Texas A&M University
All rights reserved.
Secondary Report-Page 17 of 61
8/6/2019 San Angelo ISD - Glenn Middle School - 2009 Texas School Survey of Drug and Alcohol Use
http://slidepdf.com/reader/full/san-angelo-isd-glenn-middle-school-2009-texas-school-survey-of-drug-and 18/61
8/6/2019 San Angelo ISD - Glenn Middle School - 2009 Texas School Survey of Drug and Alcohol Use
http://slidepdf.com/reader/full/san-angelo-isd-glenn-middle-school-2009-texas-school-survey-of-drug-and 19/61
San Angelo ISD - Glenn Middle School
SPRING 2009
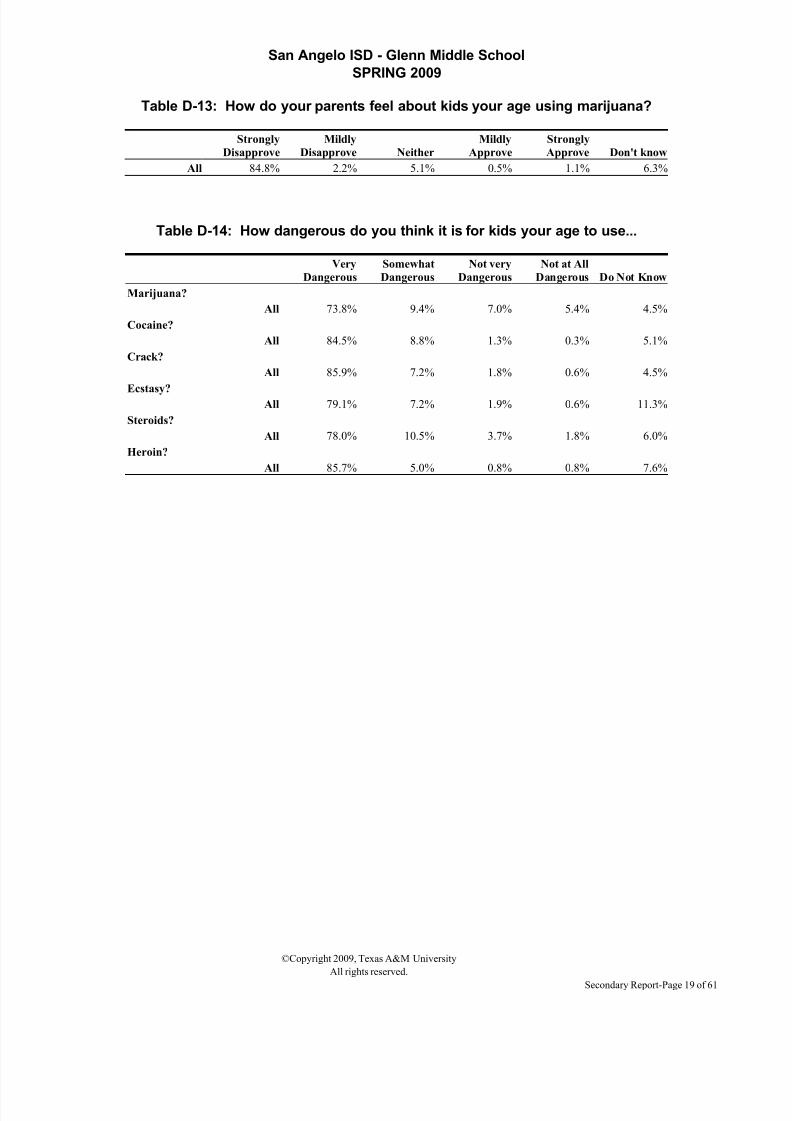
Table D-13: How do your parents feel about kids your age using marijuana?
Strongly
Disapprove
Mildly
Disapprove Neither
Mildly
Approve
Strongly
Approve Don't know
All 84.8% 2.2% 5.1% 0.5% 1.1% 6.3%
Table D-14: How dangerous do you think it is for kids your age to use...
Very
Dangerous
Somewhat
Dangerous
Not very
Dangerous
Not at All
Dangerous Do Not Know
Marijuana?
All 73.8% 9.4% 7.0% 5.4% 4.5%
Cocaine?
All 84.5% 8.8% 1.3% 0.3% 5.1%
Crack?
All 85.9% 7.2% 1.8% 0.6% 4.5%
Ecstasy?All 79.1% 7.2% 1.9% 0.6% 11.3%
Steroids?
All 78.0% 10.5% 3.7% 1.8% 6.0%
Heroin?
All 85.7% 5.0% 0.8% 0.8% 7.6%
©Copyright 2009, Texas A&M University
All rights reserved.
Secondary Report-Page 19 of 61
8/6/2019 San Angelo ISD - Glenn Middle School - 2009 Texas School Survey of Drug and Alcohol Use
http://slidepdf.com/reader/full/san-angelo-isd-glenn-middle-school-2009-texas-school-survey-of-drug-and 20/61
San Angelo ISD - Glenn Middle School
SPRING 2009
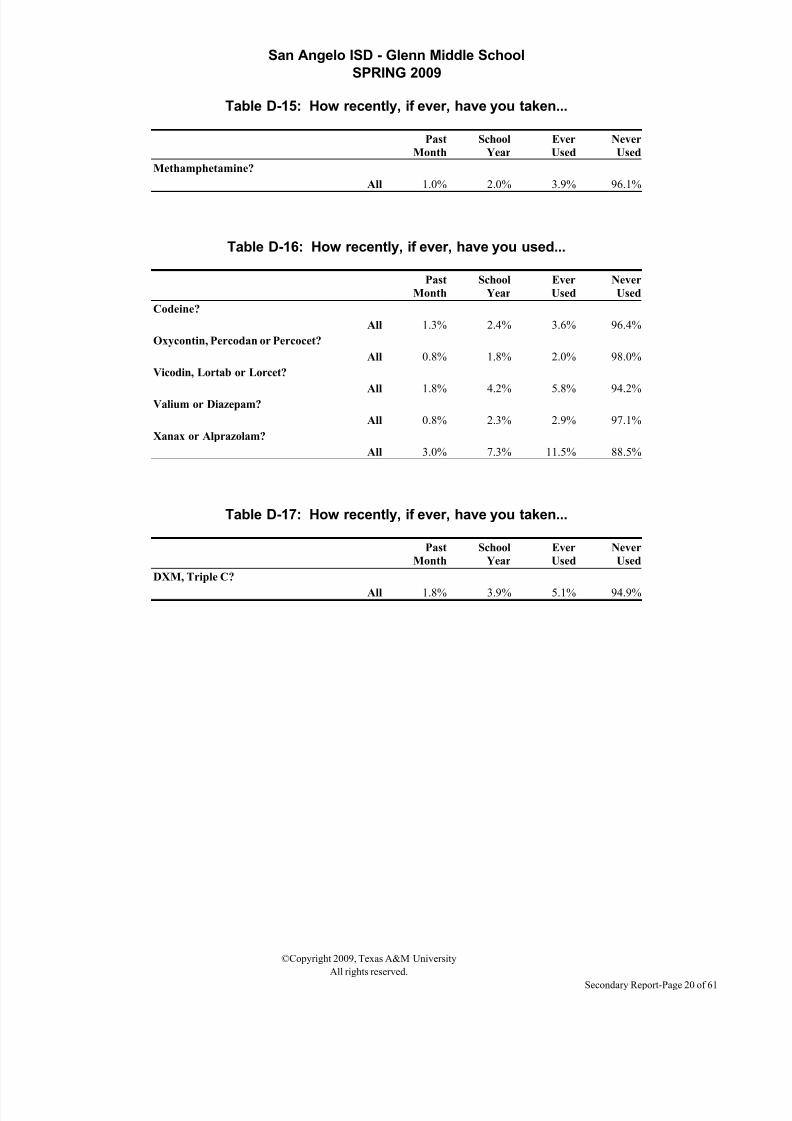
Table D-15: How recently, if ever, have you taken...
Past
Month
School
Year
Ever
Used
Never
Used
Methamphetamine?
All 1.0% 2.0% 3.9% 96.1%
Table D-16: How recently, if ever, have you used...
Past
Month
School
Year
Ever
Used
Never
Used
Codeine?
All 1.3% 2.4% 3.6% 96.4%
Oxycontin, Percodan or Percocet?
All 0.8% 1.8% 2.0% 98.0%
Vicodin, Lortab or Lorcet?
All 1.8% 4.2% 5.8% 94.2%Valium or Diazepam?
All 0.8% 2.3% 2.9% 97.1%
Xanax or Alprazolam?
All 3.0% 7.3% 11.5% 88.5%
Table D-17: How recently, if ever, have you taken...
Past
Month
School
Year
Ever
Used
Never
Used
DXM, Triple C?
All 1.8% 3.9% 5.1% 94.9%
©Copyright 2009, Texas A&M University
All rights reserved.
Secondary Report-Page 20 of 61
8/6/2019 San Angelo ISD - Glenn Middle School - 2009 Texas School Survey of Drug and Alcohol Use
http://slidepdf.com/reader/full/san-angelo-isd-glenn-middle-school-2009-texas-school-survey-of-drug-and 21/61
San Angelo ISD - Glenn Middle School
SPRING 2009
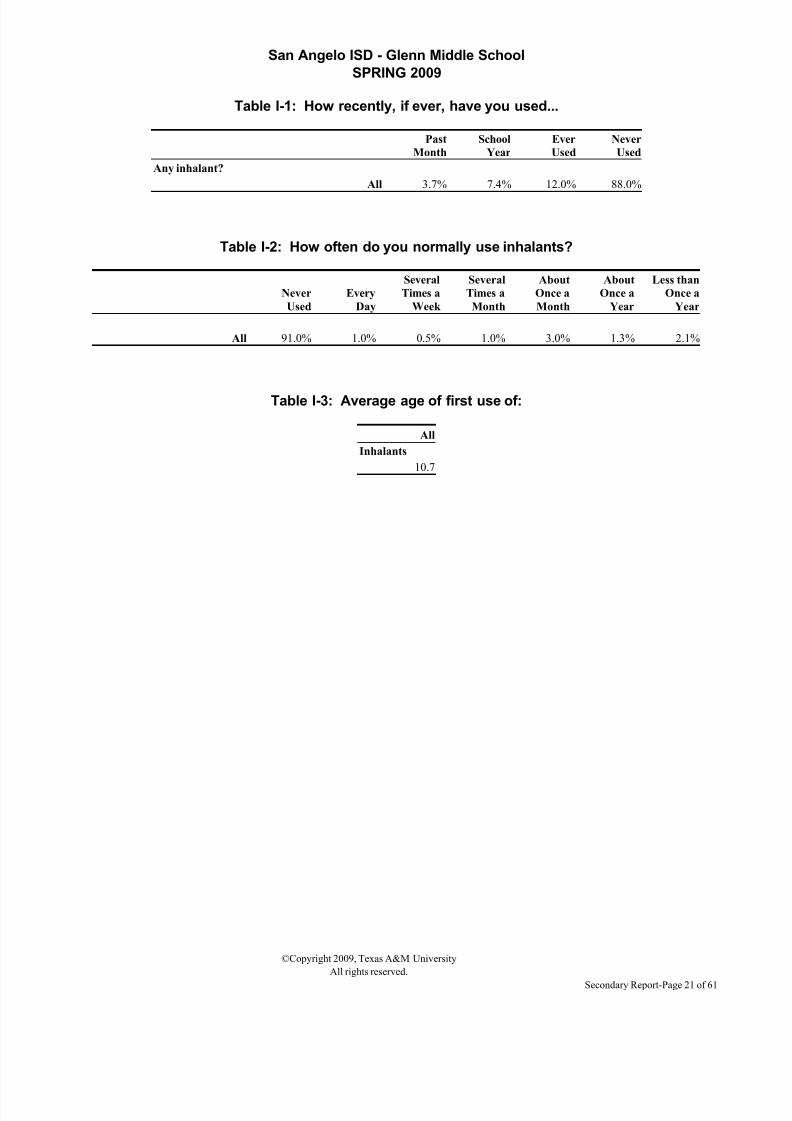
Table I-1: How recently, if ever, have you used...
Past
Month
School
Year
Ever
Used
Never
Used
Any inhalant?
All 3.7% 7.4% 12.0% 88.0%
Table I-2: How often do you normally use inhalants?
Never
Used
Every
Day
Several
Times a
Week
Several
Times a
Month
About
Once a
Month
About
Once a
Year
Less than
Once a
Year
All 91.0% 1.0% 0.5% 1.0% 3.0% 1.3% 2.1%
Table I-3: Average age of first use of:
All
Inhalants
10.7
©Copyright 2009, Texas A&M University
All rights reserved.
Secondary Report-Page 21 of 61

8/6/2019 San Angelo ISD - Glenn Middle School - 2009 Texas School Survey of Drug and Alcohol Use
http://slidepdf.com/reader/full/san-angelo-isd-glenn-middle-school-2009-texas-school-survey-of-drug-and 22/61
San Angelo ISD - Glenn Middle School
SPRING 2009
Table I-5: Since school began in the fall, on how many days (if any) have youattended class while high from inhalant use?
None 1-3 Times 4-9 Times 10+ Times
All 95.0% 3.3% 0.7% 1.0%
Table I-5: School year use of inhalants by absences and conduct problems:
Average days absent due to
illness or other reasons
Inhalants Users: 6.7
Inhalants Non-use 4.3
Average days conduct problems
reported
Inhalants Users: 8.8
Inhalants Non-use 2.1
Table I-6: About how many of your close friends use inhalants?
None A Few Some Most ALL
All 76.6% 12.0% 7.8% 2.9% 0.7%
©Copyright 2009, Texas A&M University
All rights reserved.
Secondary Report-Page 22 of 61

8/6/2019 San Angelo ISD - Glenn Middle School - 2009 Texas School Survey of Drug and Alcohol Use
http://slidepdf.com/reader/full/san-angelo-isd-glenn-middle-school-2009-texas-school-survey-of-drug-and 23/61
San Angelo ISD - Glenn Middle School
SPRING 200
Table I-7: How dangerous do you think it is for kids your age to use inhalants?
Very
Dangerous
Somewhat
Dangerous
Not very
Dangerous
Not at All
Dangerous Do Not Know
All 68.6% 20.5% 3.6% 2.1% 5.2%
Table I-8: If you wanted some, how difficult would it be to get..
Never
Heard Of Impossible
Very
Difficult
Somewhat
Difficult
Somewhat
Easy Very Easy
Inhalants?
All 13.0% 29.6% 6.0% 7.9% 13.9% 29.5%
©Copyright 2009, Texas A&M University
All rights reserved.
Secondary Report-Page 23 of 61
8/6/2019 San Angelo ISD - Glenn Middle School - 2009 Texas School Survey of Drug and Alcohol Use
http://slidepdf.com/reader/full/san-angelo-isd-glenn-middle-school-2009-texas-school-survey-of-drug-and 24/61
San Angelo ISD - Glenn Middle School
SPRING 2009
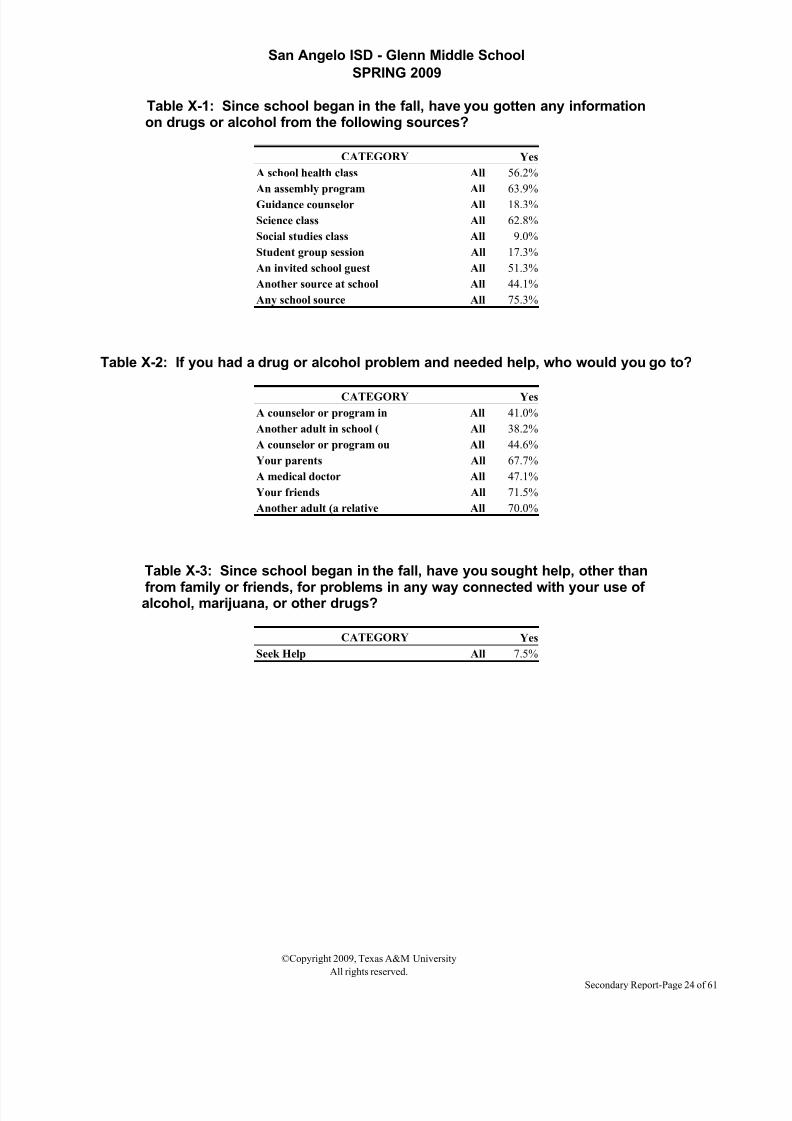
Table X-1: Since school began in the fall, have you gotten any informationon drugs or alcohol from the following sources?
CATEGORY Yes
A school health class All 56.2%
An assembly program All 63.9%
Guidance counselor All 18.3%
Science class All 62.8%
Social studies class All 9.0%
Student group session All 17.3%
An invited school guest All 51.3%
Another source at school All 44.1%
Any school source All 75.3%
Table X-2: If you had a drug or alcohol problem and needed help, who would you go to?
CATEGORY Yes
A counselor or program in All 41.0%
Another adult in school ( All 38.2%
A counselor or program ou All 44.6%
Your parents All 67.7%
A medical doctor All 47.1%
Your friends All 71.5%
Another adult (a relative All 70.0%
Table X-3: Since school began in the fall, have you sought help, other than
from family or friends, for problems in any way connected with your use of alcohol, marijuana, or other drugs?
CATEGORY Yes
Seek Help All 7.5%
©Copyright 2009, Texas A&M University
All rights reserved.
Secondary Report-Page 24 of 61
8/6/2019 San Angelo ISD - Glenn Middle School - 2009 Texas School Survey of Drug and Alcohol Use
http://slidepdf.com/reader/full/san-angelo-isd-glenn-middle-school-2009-texas-school-survey-of-drug-and 25/61
San Angelo ISD - Glenn Middle School
SPRING 2009
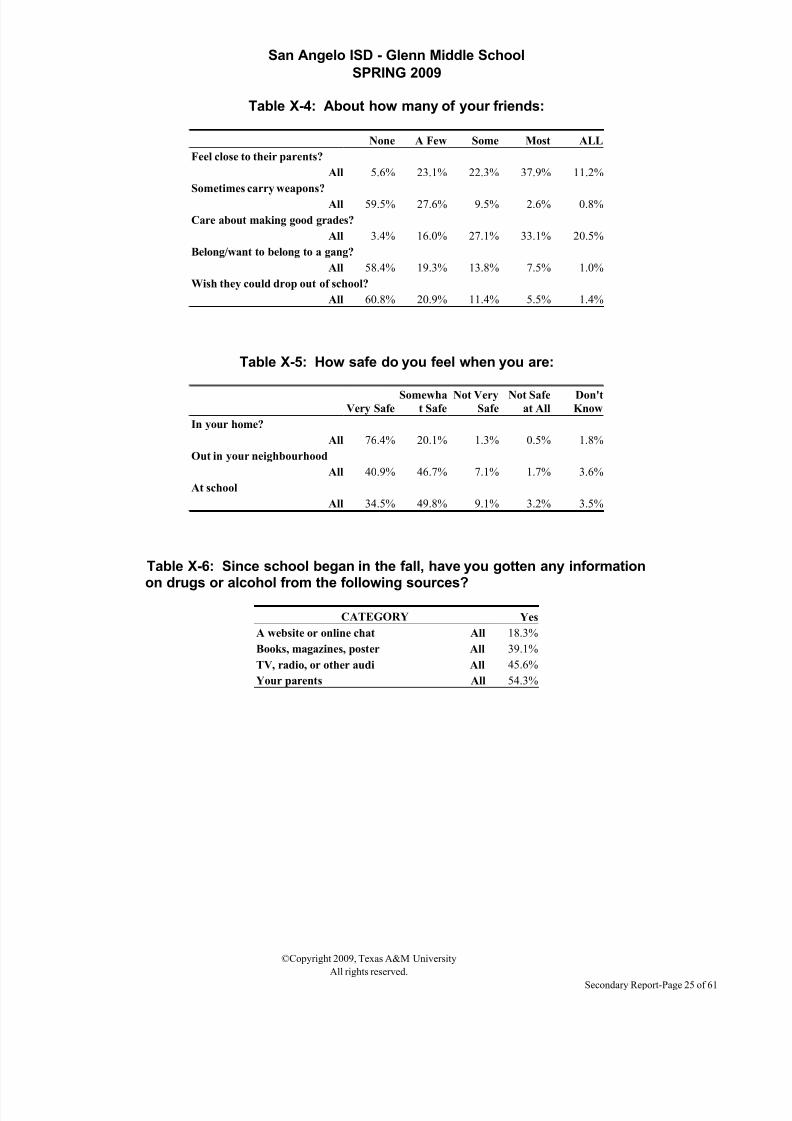
Table X-4: About how many of your friends:
None A Few Some Most ALL
Feel close to their parents?
All 5.6% 23.1% 22.3% 37.9% 11.2%
Sometimes carry weapons?
All 59.5% 27.6% 9.5% 2.6% 0.8%
Care about making good grades?
All 3.4% 16.0% 27.1% 33.1% 20.5%
Belong/want to belong to a gang?
All 58.4% 19.3% 13.8% 7.5% 1.0%
Wish they could drop out of school?
All 60.8% 20.9% 11.4% 5.5% 1.4%
Table X-5: How safe do you feel when you are:
Very SafeSomewha
t SafeNot Very
SafeNot Safe
at AllDon'tKnow
In your home?
All 76.4% 20.1% 1.3% 0.5% 1.8%
Out in your neighbourhood
All 40.9% 46.7% 7.1% 1.7% 3.6%
At school
All 34.5% 49.8% 9.1% 3.2% 3.5%
Table X-6: Since school began in the fall, have you gotten any information
on drugs or alcohol from the following sources?
CATEGORY Yes
A website or online chat All 18.3%
Books, magazines, poster All 39.1%
TV, radio, or other audi All 45.6%
Your parents All 54.3%
©Copyright 2009, Texas A&M University
All rights reserved.
Secondary Report-Page 25 of 61

8/6/2019 San Angelo ISD - Glenn Middle School - 2009 Texas School Survey of Drug and Alcohol Use
http://slidepdf.com/reader/full/san-angelo-isd-glenn-middle-school-2009-texas-school-survey-of-drug-and 26/61
San Angelo ISD - Glenn Middle School
SPRING 2009
©Copyright 2009, Texas A&M University
All rights reserved.
Secondary Report-Page 26 of 61
8/6/2019 San Angelo ISD - Glenn Middle School - 2009 Texas School Survey of Drug and Alcohol Use
http://slidepdf.com/reader/full/san-angelo-isd-glenn-middle-school-2009-texas-school-survey-of-drug-and 27/61
San Angelo ISD - Glenn Middle School
SPRING 2009
2. Prevalence Tables
©Copyright 2009, Texas A&M University
All rights reserved.
Secondary Report-Page 27 of 61
8/6/2019 San Angelo ISD - Glenn Middle School - 2009 Texas School Survey of Drug and Alcohol Use
http://slidepdf.com/reader/full/san-angelo-isd-glenn-middle-school-2009-texas-school-survey-of-drug-and 28/61
San Angelo ISD - Glenn Middle School
SPRING 2009
©Copyright 2009, Texas A&M University
All rights reserved.
Secondary Report-Page 28 of 61

8/6/2019 San Angelo ISD - Glenn Middle School - 2009 Texas School Survey of Drug and Alcohol Use
http://slidepdf.com/reader/full/san-angelo-isd-glenn-middle-school-2009-texas-school-survey-of-drug-and 29/61
San Angelo ISD - Glenn Middle School
SPRING 2009
Table B1: Prevalence and recency of use of selected substances by gradeAll students
Past
Month
School
Year
Ever
Used
Never
Used
Tobacco
All 7.0% 11.6% 23.0% 77.0%
Alcohol
All 23.3% 31.9% 55.0% 45.0%
Inhalants
All 3.7% 7.4% 12.0% 88.0%
Any Illicit Drug
All 7.9% 11.6% 19.5% 80.5%
Marijuana
All 6.7% 9.8% 17.1% 82.9%
Marijuana Only
All 2.6% 5.4% 10.8% 89.2%
Cocaine or Crack
All 1.5% 1.8% 3.9% 96.1%Cocaine
All 1.0% 1.5% 2.7% 97.3%
Crack
All 0.5% 0.5% 2.2% 97.8%
Hallucinogens
All 0.2% 0.5% 1.5% 98.5%
Uppers
All 0.8% 1.6% 2.9% 97.1%
Downers
All 1.6% 2.4% 2.6% 97.4%
Rohypnol
All 0.5% 0.8% 1.9% 98.1%
Steroids
All 0.2% 0.7% 1.0% 99.0%
Ecstasy
All 0.8% 0.8% 1.6% 98.4%
Heroin
All 1.3% 1.3% 2.0% 98.0%
©Copyright 2009, Texas A&M University
All rights reserved.
Secondary Report-Page 29 of 61
8/6/2019 San Angelo ISD - Glenn Middle School - 2009 Texas School Survey of Drug and Alcohol Use
http://slidepdf.com/reader/full/san-angelo-isd-glenn-middle-school-2009-texas-school-survey-of-drug-and 30/61
San Angelo ISD - Glenn Middle School
SPRING 2009
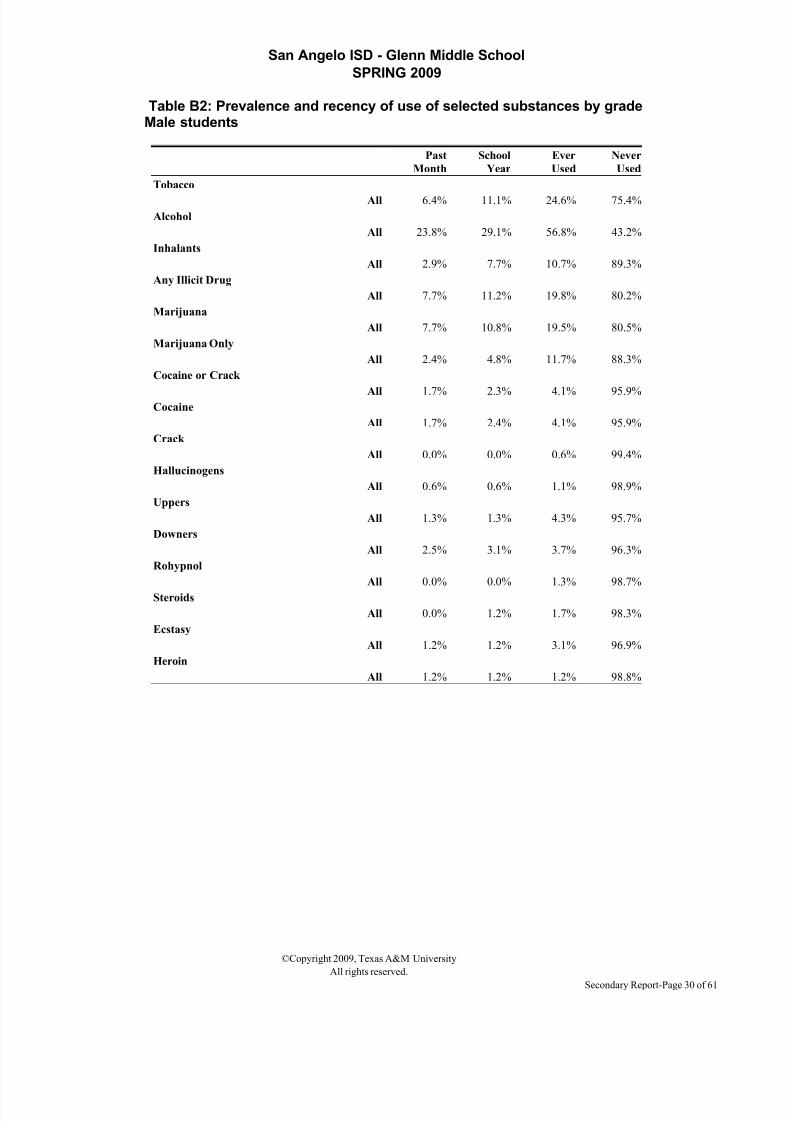
Table B2: Prevalence and recency of use of selected substances by gradeMale students
Past
Month
School
Year
Ever
Used
Never
Used
Tobacco
All 6.4% 11.1% 24.6% 75.4%
Alcohol
All 23.8% 29.1% 56.8% 43.2%
Inhalants
All 2.9% 7.7% 10.7% 89.3%
Any Illicit Drug
All 7.7% 11.2% 19.8% 80.2%
Marijuana
All 7.7% 10.8% 19.5% 80.5%
Marijuana Only
All 2.4% 4.8% 11.7% 88.3%
Cocaine or Crack
All 1.7% 2.3% 4.1% 95.9%Cocaine
All 1.7% 2.4% 4.1% 95.9%
Crack
All 0.0% 0.0% 0.6% 99.4%
Hallucinogens
All 0.6% 0.6% 1.1% 98.9%
Uppers
All 1.3% 1.3% 4.3% 95.7%
Downers
All 2.5% 3.1% 3.7% 96.3%
Rohypnol
All 0.0% 0.0% 1.3% 98.7%
Steroids
All 0.0% 1.2% 1.7% 98.3%
Ecstasy
All 1.2% 1.2% 3.1% 96.9%
Heroin
All 1.2% 1.2% 1.2% 98.8%
©Copyright 2009, Texas A&M University
All rights reserved.
Secondary Report-Page 30 of 61

8/6/2019 San Angelo ISD - Glenn Middle School - 2009 Texas School Survey of Drug and Alcohol Use
http://slidepdf.com/reader/full/san-angelo-isd-glenn-middle-school-2009-texas-school-survey-of-drug-and 31/61
San Angelo ISD - Glenn Middle School
SPRING 2009
Table B3: Prevalence and recency of use of selected substances by gradeFemale students
Past
Month
School
Year
Ever
Used
Never
Used
Tobacco
All 7.6% 12.0% 22.0% 78.0%
Alcohol
All 23.1% 34.3% 54.0% 46.0%
Inhalants
All 4.4% 7.2% 13.1% 86.9%
Any Illicit Drug
All 8.1% 12.1% 19.5% 80.5%
Marijuana
All 6.0% 9.2% 15.4% 84.6%
Marijuana Only
All 2.7% 5.9% 10.3% 89.7%
Cocaine or Crack
All 1.3% 1.3% 3.9% 96.1%Cocaine
All 0.4% 0.9% 1.7% 98.3%
Crack
All 0.9% 0.9% 3.5% 96.5%
Hallucinogens
All 0.0% 0.5% 1.8% 98.2%
Uppers
All 0.4% 1.8% 1.8% 98.2%
Downers
All 0.9% 1.8% 1.8% 98.2%
Rohypnol
All 0.9% 1.4% 2.3% 97.7%
Steroids
All 0.4% 0.4% 0.4% 99.6%
Ecstasy
All 0.5% 0.5% 0.5% 99.5%
Heroin
All 1.3% 1.3% 2.6% 97.4%
©Copyright 2009, Texas A&M University
All rights reserved.
Secondary Report-Page 31 of 61

8/6/2019 San Angelo ISD - Glenn Middle School - 2009 Texas School Survey of Drug and Alcohol Use
http://slidepdf.com/reader/full/san-angelo-isd-glenn-middle-school-2009-texas-school-survey-of-drug-and 32/61
San Angelo ISD - Glenn Middle School
SPRING 2009
Table B4: Prevalence and recency of use of selected substances by gradeWhite students
Past
Month
School
Year
Ever
Used
Never
Used
Tobacco
All 3.0% 4.6% 12.6% 87.4%
Alcohol
All 12.7% 20.5% 43.2% 56.8%
Inhalants
All 1.7% 1.7% 5.6% 94.4%
Any Illicit Drug
All 4.1% 4.7% 8.7% 91.3%
Marijuana
All 3.6% 3.6% 7.1% 92.9%
Marijuana Only
All 1.8% 1.8% 3.6% 96.4%
Cocaine or Crack
All 0.6% 0.6% 1.7% 98.3%Cocaine
All 0.0% 0.6% 1.1% 98.9%
Crack
All 0.6% 0.6% 1.7% 98.3%
Hallucinogens
All 0.0% 0.0% 1.8% 98.2%
Uppers
All 0.6% 1.8% 2.4% 97.6%
Downers
All 0.6% 1.2% 1.2% 98.8%
Rohypnol
All 0.6% 0.6% 0.6% 99.4%
Steroids
All 0.0% 0.0% 0.5% 99.5%
Ecstasy
All 0.0% 0.0% 0.5% 99.5%
Heroin
All 0.0% 0.0% 1.1% 98.9%
©Copyright 2009, Texas A&M University
All rights reserved.
Secondary Report-Page 32 of 61

8/6/2019 San Angelo ISD - Glenn Middle School - 2009 Texas School Survey of Drug and Alcohol Use
http://slidepdf.com/reader/full/san-angelo-isd-glenn-middle-school-2009-texas-school-survey-of-drug-and 33/61
San Angelo ISD - Glenn Middle School
SPRING 2009
Table B5: Prevalence and recency of use of selected substances by gradeBlack students
Past
Month
School
Year
Ever
Used
Never
Used
Tobacco
All 5.8% 11.6% 32.9% 67.1%
Alcohol
All 17.4% 33.5% 49.7% 50.3%
Inhalants
All 5.8% 11.6% 11.6% 88.4%
Any Illicit Drug
All 5.8% 11.6% 17.4% 82.6%
Marijuana
All 6.1% 12.2% 18.3% 81.7%
Marijuana Only
All 0.0% 5.8% 11.6% 88.4%
Cocaine or Crack
All 0.0% 0.0% 0.0% 100.0%Cocaine
All 0.0% 0.0% 0.0% 100.0%
Crack
All 0.0% 0.0% 0.0% 100.0%
Hallucinogens
All 0.0% 0.0% 0.0% 100.0%
Uppers
All 0.0% 0.0% 0.0% 100.0%
Downers
All 0.0% 6.2% 6.2% 93.8%
Rohypnol
All 0.0% 6.2% 6.2% 93.8%
Steroids
All 0.0% 0.0% 0.0% 100.0%
Ecstasy
All 0.0% 0.0% 0.0% 100.0%
Heroin
All 0.0% 0.0% 0.0% 100.0%
©Copyright 2009, Texas A&M University
All rights reserved.
Secondary Report-Page 33 of 61
8/6/2019 San Angelo ISD - Glenn Middle School - 2009 Texas School Survey of Drug and Alcohol Use
http://slidepdf.com/reader/full/san-angelo-isd-glenn-middle-school-2009-texas-school-survey-of-drug-and 34/61

8/6/2019 San Angelo ISD - Glenn Middle School - 2009 Texas School Survey of Drug and Alcohol Use
http://slidepdf.com/reader/full/san-angelo-isd-glenn-middle-school-2009-texas-school-survey-of-drug-and 35/61
San Angelo ISD - Glenn Middle School
SPRING 2009
Table B7: Prevalence and recency of use of selected substances by gradeStudents reporting A grades
Past
Month
School
Year
Ever
Used
Never
Used
Tobacco
All 0.7% 1.9% 6.9% 93.1%
Alcohol
All 11.8% 20.4% 41.1% 58.9%
Inhalants
All 0.7% 2.0% 5.0% 95.0%
Any Illicit Drug
All 2.0% 3.8% 6.3% 93.7%
Marijuana
All 2.0% 2.6% 4.6% 95.4%
Marijuana Only
All 0.7% 1.3% 2.6% 97.4%
Cocaine or Crack
All 0.7% 0.7% 1.2% 98.8%Cocaine
All 0.7% 0.7% 0.7% 99.3%
Crack
All 0.0% 0.0% 0.6% 99.4%
Hallucinogens
All 0.0% 0.0% 0.6% 99.4%
Uppers
All 0.7% 1.3% 2.6% 97.4%
Downers
All 0.7% 0.7% 1.4% 98.6%
Rohypnol
All 0.0% 0.0% 0.0% 100.0%
Steroids
All 0.0% 1.2% 1.8% 98.2%
Ecstasy
All 0.0% 0.0% 0.6% 99.4%
Heroin
All 0.0% 0.0% 0.0% 100.0%
©Copyright 2009, Texas A&M University
All rights reserved.
Secondary Report-Page 35 of 61

8/6/2019 San Angelo ISD - Glenn Middle School - 2009 Texas School Survey of Drug and Alcohol Use
http://slidepdf.com/reader/full/san-angelo-isd-glenn-middle-school-2009-texas-school-survey-of-drug-and 36/61

8/6/2019 San Angelo ISD - Glenn Middle School - 2009 Texas School Survey of Drug and Alcohol Use
http://slidepdf.com/reader/full/san-angelo-isd-glenn-middle-school-2009-texas-school-survey-of-drug-and 37/61
San Angelo ISD - Glenn Middle School
SPRING 2009
Table B9: Prevalence and recency of use of selected substances by gradeStudents living with two parents
Past
Month
School
Year
Ever
Used
Never
Used
Tobacco
All 3.3% 6.2% 13.2% 86.8%
Alcohol
All 17.0% 22.6% 44.7% 55.3%
Inhalants
All 2.0% 4.5% 9.4% 90.6%
Any Illicit Drug
All 6.7% 8.3% 11.5% 88.5%
Marijuana
All 6.3% 7.5% 10.4% 89.6%
Marijuana Only
All 1.7% 2.5% 4.6% 95.4%
Cocaine or Crack
All 1.6% 2.0% 3.2% 96.8%Cocaine
All 1.2% 1.6% 2.8% 97.2%
Crack
All 0.4% 0.4% 1.2% 98.8%
Hallucinogens
All 0.4% 0.8% 1.3% 98.7%
Uppers
All 0.9% 0.9% 2.1% 97.9%
Downers
All 1.7% 2.6% 3.0% 97.0%
Rohypnol
All 0.4% 0.9% 1.8% 98.2%
Steroids
All 0.0% 0.4% 0.4% 99.6%
Ecstasy
All 0.8% 0.8% 1.3% 98.7%
Heroin
All 0.8% 0.8% 1.2% 98.8%
©Copyright 2009, Texas A&M University
All rights reserved.
Secondary Report-Page 37 of 61

8/6/2019 San Angelo ISD - Glenn Middle School - 2009 Texas School Survey of Drug and Alcohol Use
http://slidepdf.com/reader/full/san-angelo-isd-glenn-middle-school-2009-texas-school-survey-of-drug-and 38/61
San Angelo ISD - Glenn Middle School
SPRING 2009
Table B10: Prevalence and recency of use of selected substances by gradeStudents not living with two parents
Past
Month
School
Year
Ever
Used
Never
Used
Tobacco
All 13.1% 19.7% 38.7% 61.3%
Alcohol
All 33.2% 46.1% 71.4% 28.6%
Inhalants
All 5.9% 11.5% 15.9% 84.1%
Any Illicit Drug
All 9.9% 17.3% 32.1% 67.9%
Marijuana
All 7.5% 13.7% 27.6% 72.4%
Marijuana Only
All 4.1% 10.2% 20.5% 79.5%
Cocaine or Crack
All 1.3% 1.3% 5.2% 94.8%Cocaine
All 0.6% 1.4% 2.7% 97.3%
Crack
All 0.7% 0.7% 4.0% 96.0%
Hallucinogens
All 0.0% 0.0% 2.0% 98.0%
Uppers
All 0.7% 2.8% 4.2% 95.8%
Downers
All 1.4% 2.1% 2.1% 97.9%
Rohypnol
All 0.7% 0.7% 2.1% 97.9%
Steroids
All 0.7% 1.3% 2.0% 98.0%
Ecstasy
All 0.7% 0.7% 2.1% 97.9%
Heroin
All 2.0% 2.0% 3.3% 96.7%
©Copyright 2009, Texas A&M University
All rights reserved.
Secondary Report-Page 38 of 61
8/6/2019 San Angelo ISD - Glenn Middle School - 2009 Texas School Survey of Drug and Alcohol Use
http://slidepdf.com/reader/full/san-angelo-isd-glenn-middle-school-2009-texas-school-survey-of-drug-and 39/61
San Angelo ISD - Glenn Middle School
SPRING 2009
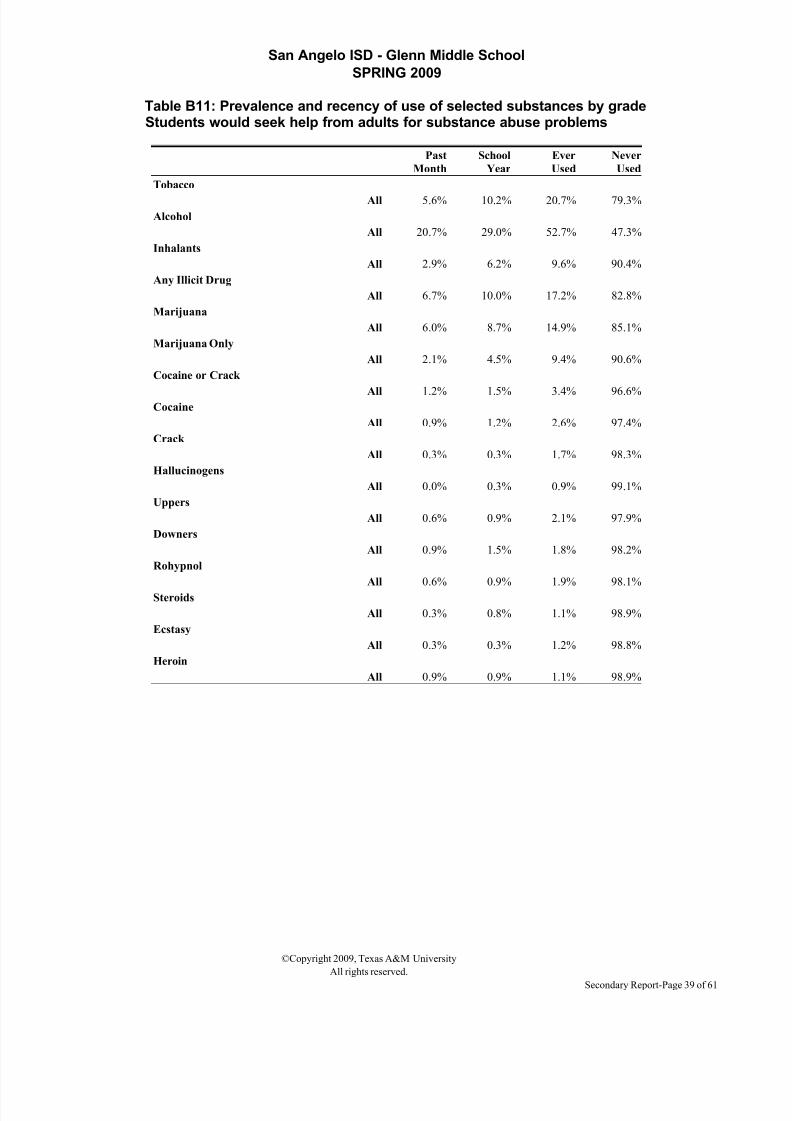
Table B11: Prevalence and recency of use of selected substances by gradeStudents would seek help from adults for substance abuse problems
Past
Month
School
Year
Ever
Used
Never
Used
Tobacco
All 5.6% 10.2% 20.7% 79.3%
Alcohol
All 20.7% 29.0% 52.7% 47.3%
Inhalants
All 2.9% 6.2% 9.6% 90.4%
Any Illicit Drug
All 6.7% 10.0% 17.2% 82.8%
Marijuana
All 6.0% 8.7% 14.9% 85.1%
Marijuana Only
All 2.1% 4.5% 9.4% 90.6%
Cocaine or Crack
All 1.2% 1.5% 3.4% 96.6%Cocaine
All 0.9% 1.2% 2.6% 97.4%
Crack
All 0.3% 0.3% 1.7% 98.3%
Hallucinogens
All 0.0% 0.3% 0.9% 99.1%
Uppers
All 0.6% 0.9% 2.1% 97.9%
Downers
All 0.9% 1.5% 1.8% 98.2%
Rohypnol
All 0.6% 0.9% 1.9% 98.1%
Steroids
All 0.3% 0.8% 1.1% 98.9%
Ecstasy
All 0.3% 0.3% 1.2% 98.8%
Heroin
All 0.9% 0.9% 1.1% 98.9%
©Copyright 2009, Texas A&M University
All rights reserved.
Secondary Report-Page 39 of 61

8/6/2019 San Angelo ISD - Glenn Middle School - 2009 Texas School Survey of Drug and Alcohol Use
http://slidepdf.com/reader/full/san-angelo-isd-glenn-middle-school-2009-texas-school-survey-of-drug-and 40/61
San Angelo ISD - Glenn Middle School
SPRING 2009
Table B12: Prevalence and recency of use of selected substances by gradeStudents wouldn''t seek help from adults for substance abuse problems
Past
Month
School
Year
Ever
Used
Never
Used
Tobacco
All 19.3% 23.8% 45.0% 55.0%
Alcohol
All 43.1% 53.2% 72.8% 27.2%
Inhalants
All 10.6% 17.4% 32.3% 67.7%
Any Illicit Drug
All 17.6% 26.2% 40.8% 59.2%
Marijuana
All 13.4% 20.2% 37.4% 62.6%
Marijuana Only
All 6.5% 13.1% 23.3% 76.7%
Cocaine or Crack
All 4.4% 4.4% 8.8% 91.2%Cocaine
All 2.2% 4.6% 4.6% 95.4%
Crack
All 2.4% 2.4% 6.9% 93.1%
Hallucinogens
All 2.2% 2.2% 6.8% 93.2%
Uppers
All 2.4% 7.3% 9.5% 90.5%
Downers
All 6.9% 9.3% 9.3% 90.7%
Rohypnol
All 0.0% 0.0% 2.1% 97.9%
Steroids
All 0.0% 0.0% 0.0% 100.0%
Ecstasy
All 4.6% 4.6% 4.6% 95.4%
Heroin
All 4.4% 4.4% 8.8% 91.2%
©Copyright 2009, Texas A&M University
All rights reserved.
Secondary Report-Page 40 of 61

8/6/2019 San Angelo ISD - Glenn Middle School - 2009 Texas School Survey of Drug and Alcohol Use
http://slidepdf.com/reader/full/san-angelo-isd-glenn-middle-school-2009-texas-school-survey-of-drug-and 41/61
San Angelo ISD - Glenn Middle School
SPRING 2009
Table B13: Prevalence and recency of use of selected substances by gradeStudents living in town three years or less
Past
Month
School
Year
Ever
Used
Never
Used
Tobacco
All 8.2% 11.8% 25.2% 74.8%
Alcohol
All 26.0% 33.4% 56.5% 43.5%
Inhalants
All 4.3% 5.5% 10.2% 89.8%
Any Illicit Drug
All 8.2% 10.1% 19.3% 80.7%
Marijuana
All 6.3% 8.3% 16.4% 83.6%
Marijuana Only
All 1.3% 3.2% 8.8% 91.2%
Cocaine or Crack
All 1.9% 2.5% 5.6% 94.4%Cocaine
All 0.6% 1.9% 3.8% 96.3%
Crack
All 1.3% 1.3% 3.1% 96.9%
Hallucinogens
All 0.0% 0.7% 2.6% 97.4%
Uppers
All 0.6% 1.3% 3.2% 96.8%
Downers
All 1.2% 1.9% 1.9% 98.1%
Rohypnol
All 1.3% 1.3% 3.3% 96.7%
Steroids
All 0.0% 0.6% 0.6% 99.4%
Ecstasy
All 0.7% 0.7% 2.6% 97.4%
Heroin
All 1.8% 1.8% 2.5% 97.5%
©Copyright 2009, Texas A&M University
All rights reserved.
Secondary Report-Page 41 of 61
8/6/2019 San Angelo ISD - Glenn Middle School - 2009 Texas School Survey of Drug and Alcohol Use
http://slidepdf.com/reader/full/san-angelo-isd-glenn-middle-school-2009-texas-school-survey-of-drug-and 42/61
San Angelo ISD - Glenn Middle School
SPRING 2009
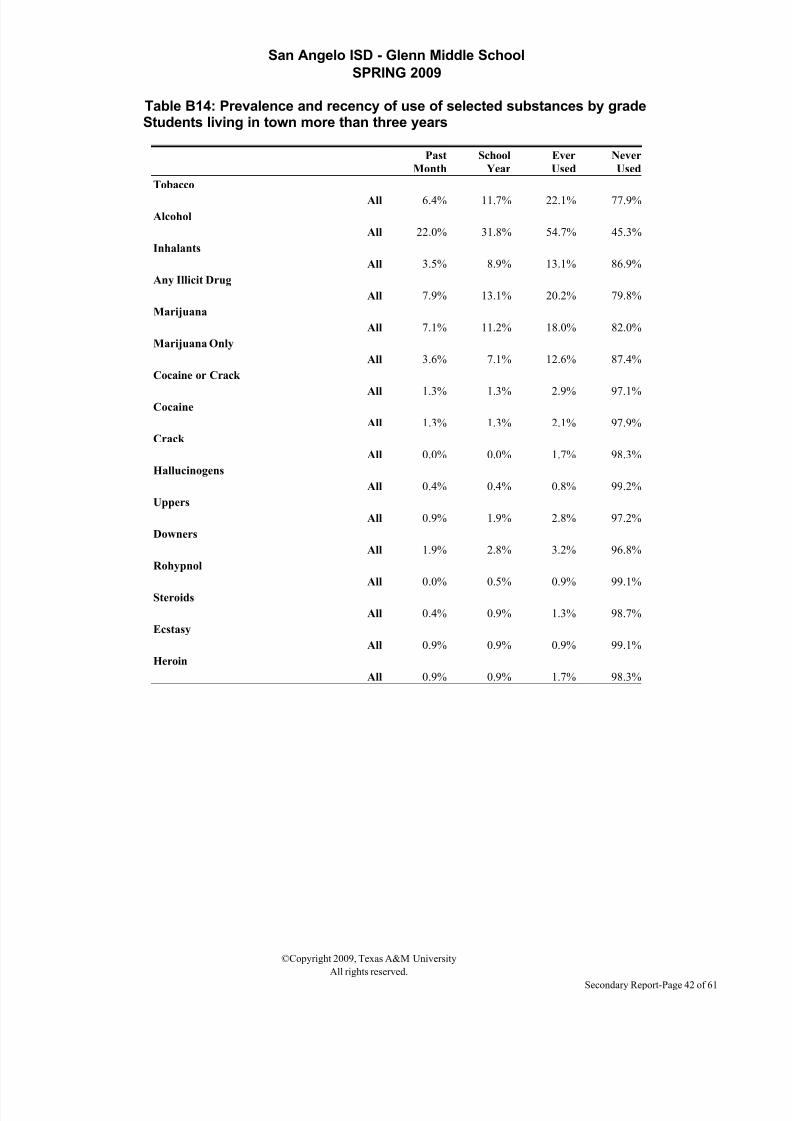
Table B14: Prevalence and recency of use of selected substances by gradeStudents living in town more than three years
Past
Month
School
Year
Ever
Used
Never
Used
Tobacco
All 6.4% 11.7% 22.1% 77.9%
Alcohol
All 22.0% 31.8% 54.7% 45.3%
Inhalants
All 3.5% 8.9% 13.1% 86.9%
Any Illicit Drug
All 7.9% 13.1% 20.2% 79.8%
Marijuana
All 7.1% 11.2% 18.0% 82.0%
Marijuana Only
All 3.6% 7.1% 12.6% 87.4%
Cocaine or Crack
All 1.3% 1.3% 2.9% 97.1%Cocaine
All 1.3% 1.3% 2.1% 97.9%
Crack
All 0.0% 0.0% 1.7% 98.3%
Hallucinogens
All 0.4% 0.4% 0.8% 99.2%
Uppers
All 0.9% 1.9% 2.8% 97.2%
Downers
All 1.9% 2.8% 3.2% 96.8%
Rohypnol
All 0.0% 0.5% 0.9% 99.1%
Steroids
All 0.4% 0.9% 1.3% 98.7%
Ecstasy
All 0.9% 0.9% 0.9% 99.1%
Heroin
All 0.9% 0.9% 1.7% 98.3%
©Copyright 2009, Texas A&M University
All rights reserved.
Secondary Report-Page 42 of 61

8/6/2019 San Angelo ISD - Glenn Middle School - 2009 Texas School Survey of Drug and Alcohol Use
http://slidepdf.com/reader/full/san-angelo-isd-glenn-middle-school-2009-texas-school-survey-of-drug-and 43/61
San Angelo ISD - Glenn Middle School
SPRING 2009
3. Margin Tables
©Copyright 2009, Texas A&M University
All rights reserved.
Secondary Report-Page 43 of 61

8/6/2019 San Angelo ISD - Glenn Middle School - 2009 Texas School Survey of Drug and Alcohol Use
http://slidepdf.com/reader/full/san-angelo-isd-glenn-middle-school-2009-texas-school-survey-of-drug-and 44/61
San Angelo ISD - Glenn Middle School
SPRING 2009
©Copyright 2009, Texas A&M University
All rights reserved.
Secondary Report-Page 44 of 61
8/6/2019 San Angelo ISD - Glenn Middle School - 2009 Texas School Survey of Drug and Alcohol Use
http://slidepdf.com/reader/full/san-angelo-isd-glenn-middle-school-2009-texas-school-survey-of-drug-and 45/61
San Angelo ISD - Glenn Middle School
Spring 2009
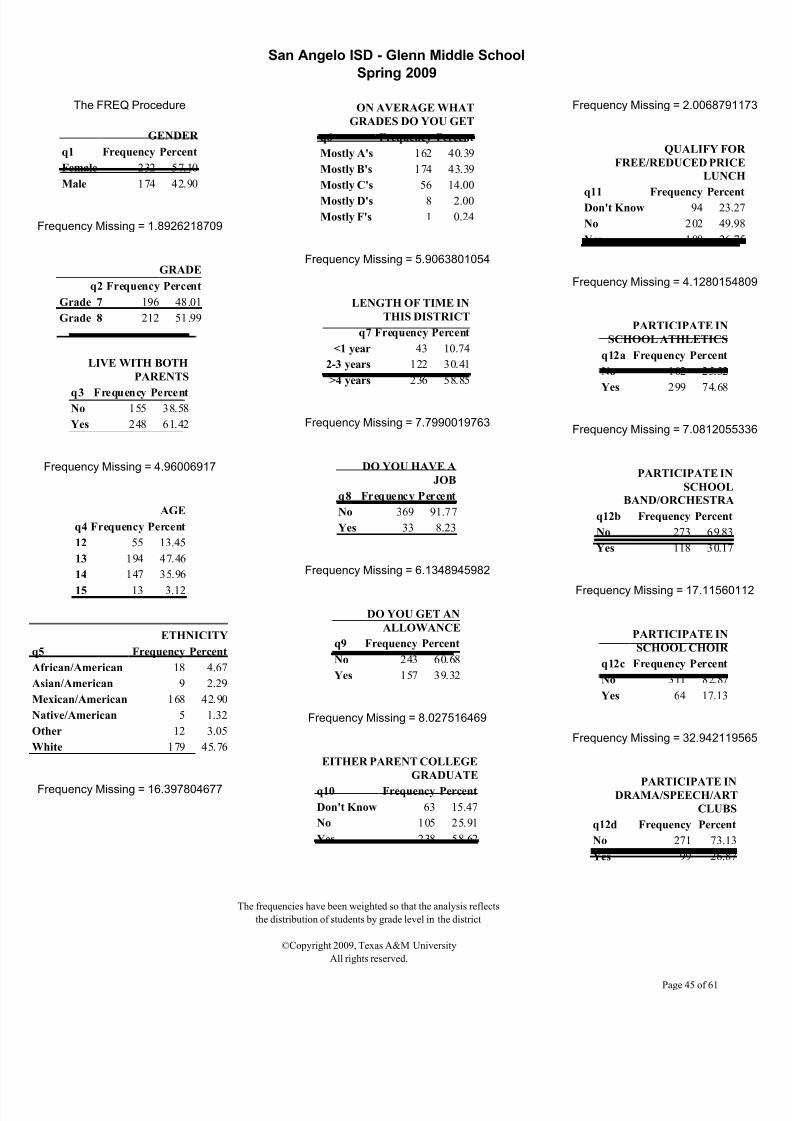
The FREQ Procedure
GENDER
q1 Frequency Percent
Female 232 57.10
Male 174 42.90
Frequency Missing = 1.8926218709
GRADE
q2 Frequency Percent
Grade 7 196 48.01
Grade 8 212 51.99
LIVE WITH BOTH
PARENTS
q3 Frequency PercentNo 155 38.58
Yes 248 61.42
Frequency Missing = 4.96006917
AGE
q4 Frequency Percent
12 55 13.45
13 194 47.46
14 147 35.96
15 13 3.12
ETHNICITY
q5 Frequency Percent
African/American 18 4.67
Asian/American 9 2.29
Mexican/American 168 42.90
Native/American 5 1.32
Other 12 3.05
White 179 45.76
Frequency Missing = 16.397804677
ON AVERAGE WHAT
GRADES DO YOU GET
q6 Frequency Percent
Mostly A's 162 40.39
Mostly B's 174 43.39
Mostly C's 56 14.00
Mostly D's 8 2.00
Mostly F's 1 0.24
Frequency Missing = 5.9063801054
LENGTH OF TIME IN
THIS DISTRICT
q7 Frequency Percent
<1 year 43 10.74
2-3 years 122 30.41
>4 years 236 58.85
Frequency Missing = 7.7990019763
DO YOU HAVE A
JOB
q8 Frequency Percent
No 369 91.77
Yes 33 8.23
Frequency Missing = 6.1348945982
DO YOU GET AN
ALLOWANCE
q9 Frequency Percent
No 243 60.68
Yes 157 39.32
Frequency Missing = 8.027516469
EITHER PARENT COLLEGE
GRADUATE
q10 Frequency Percent
Don't Know 63 15.47
No 105 25.91
Yes 238 58.62
Frequency Missing = 2.00687911
QUALIFY FOR
FREE/REDUCED PRICE
LUNCH
q11 Frequency PercenDon't Know 94 23.27
No 202 49.98
Yes 108 26.75
Frequency Missing = 4.12801548
PARTICIPATE IN
SCHOOL ATHLETICS
q12a Frequency Percent
No 102 25.32
Yes 299 74.68
Frequency Missing = 7.08120553
PARTICIPATE IN
SCHOOL
BAND/ORCHESTRA
q12b Frequency Percent
No 273 69.83
Yes 118 30.17
Frequency Missing = 17.115601
PARTICIPATE IN
SCHOOL CHOIR
q12c Frequency Percent
No 311 82.87
Yes 64 17.13
Frequency Missing = 32.9421195
PARTICIPATE INDRAMA/SPEECH/ART
CLUBS
q12d Frequency Percent
No 271 73.13
Yes 99 26.87
The frequencies have been weighted so that the analysis reflects
the distribution of students by grade level in the district
©Copyright 2009, Texas A&M University
All rights reserved.
Page 45 of 61

8/6/2019 San Angelo ISD - Glenn Middle School - 2009 Texas School Survey of Drug and Alcohol Use
http://slidepdf.com/reader/full/san-angelo-isd-glenn-middle-school-2009-texas-school-survey-of-drug-and 46/61
San Angelo ISD - Glenn Middle School
Spring 2009
Frequency Missing = 38.016445982
PARTICIPATE IN DRILL
TEAM/CHEERLEADING
q12e Frequency PercentNo 339 92.49
Yes 28 7.51
Frequency Missing = 41.312407773
PARTICIPATE IN
STUDENT
GOVERNMENT
q12f Frequency Percent
No 344 95.17
Yes 17 4.83
Frequency Missing = 46.043962451
PARTICIPATE IN SCHOOL
NEWSPAPER/YEARBOOK
q12g Frequency Percent
No 348 96.94
Yes 11 3.06
Frequency Missing = 49.11140975
PARTICIPATE IN
ACADEMIC
CLUBS/SOCIETIES
q12h Frequency Percent
No 265 71.20
Yes 107 28.80
Frequency Missing = 36.238081357
PARTICIPATE IN
ACADEMIC
COMPETITION
GROUPS
q12i Frequency Percent
No 298 80.26
Yes 73 19.74
Frequency Missing = 37.184392292
PARTICIPATE IN
SCHOOL SERVICE
CLUBS
q12j Frequency Percent
No 315 85.47
Yes 54 14.53
Frequency Missing = 39.305528656
PARTICIPATE IN
OTHER SCHOOL
CLUBS OR GROUPS
q12k Frequency Percent
No 299 80.17
Yes 74 19.83
Frequency Missing = 35.063255929
PARTICIPATE IN
ATHLETIC TEAMS
OUTSIDE OF SCHOOL
q12l Frequency Percent
No 205 53.27
Yes 180 46.73
Frequency Missing = 23.136238472
PARTICIPATE IN
OTHER CLUBS OR
GROUPS OUTSIDE OF
SCHOOL
q12m Frequency Percent
No 243 64.17
Yes 136 35.83
Frequency Missing = 29.0426185
DO YOU FEEL SAFE IN YOU
HOM
q13a Frequency PerceVery Safe 308 76.
Somewhat Safe 81 20.
Not Very Safe 5 1.
Not Safe At All 2 0.
Don't Know 7 1.
Frequency Missing = 4.84581192
DO YOU FEEL SAFE IN YOU
NEIGHBORHOO
q13b Frequency PerceVery Safe 165 40.
Somewhat Safe 189 46.
Not Very Safe 29 7.
Not Safe At All 7 1.
Don't Know 14 3.
Frequency Missing = 4.01375823
DO YOU FEEL SAFE A
SCHOO
q13c Frequency Perce
Very Safe 139 34.
Somewhat Safe 201 49.
Not Very Safe 37 9.
Not Safe At All 13 3.
Don't Know 14 3.
Frequency Missing = 4.9600691
The frequencies have been weighted so that the analysis reflects
the distribution of students by grade level in the district
©Copyright 2009, Texas A&M University
All rights reserved.
Page 46 of 61
8/6/2019 San Angelo ISD - Glenn Middle School - 2009 Texas School Survey of Drug and Alcohol Use
http://slidepdf.com/reader/full/san-angelo-isd-glenn-middle-school-2009-texas-school-survey-of-drug-and 47/61
San Angelo ISD - Glenn Middle School
Spring 2009
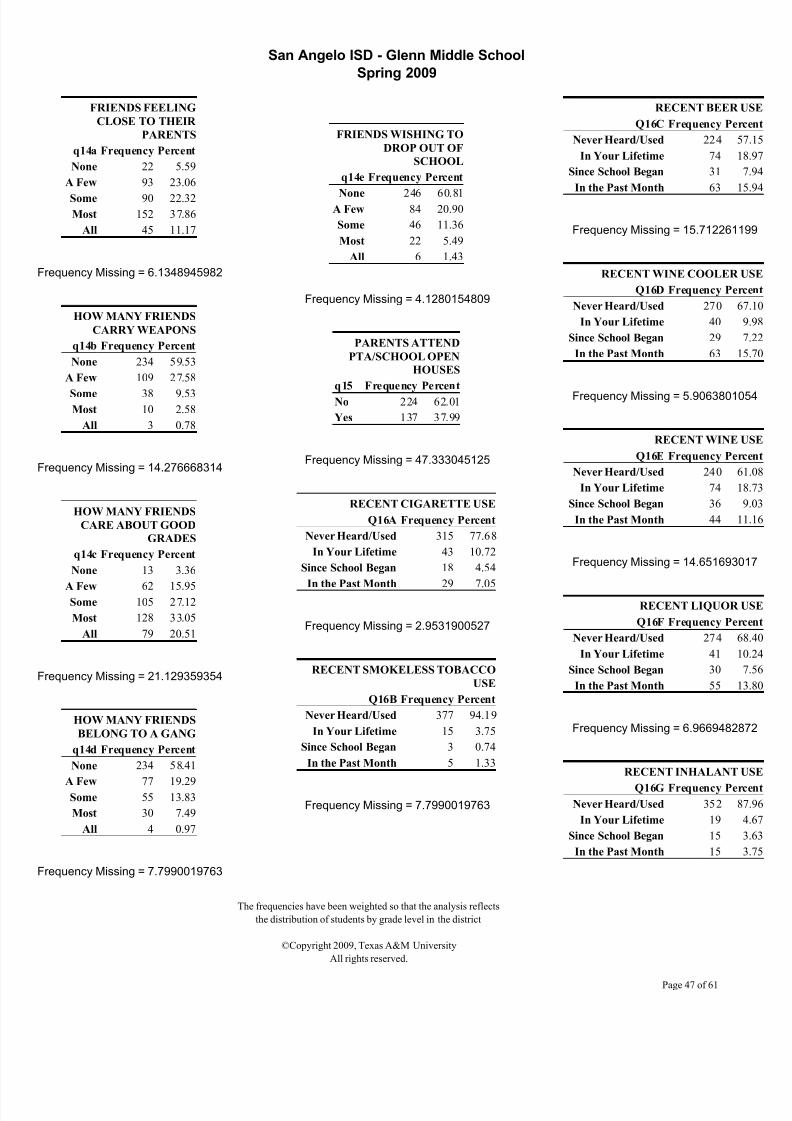
FRIENDS FEELING
CLOSE TO THEIR
PARENTS
q14a Frequency Percent
None 22 5.59
A Few 93 23.06
Some 90 22.32Most 152 37.86
All 45 11.17
Frequency Missing = 6.1348945982
HOW MANY FRIENDS
CARRY WEAPONS
q14b Frequency Percent
None 234 59.53
A Few 109 27.58
Some 38 9.53Most 10 2.58
All 3 0.78
Frequency Missing = 14.276668314
HOW MANY FRIENDS
CARE ABOUT GOOD
GRADES
q14c Frequency Percent
None 13 3.36
A Few 62 15.95Some 105 27.12
Most 128 33.05
All 79 20.51
Frequency Missing = 21.129359354
HOW MANY FRIENDS
BELONG TO A GANG
q14d Frequency Percent
None 234 58.41
A Few 77 19.29Some 55 13.83
Most 30 7.49
All 4 0.97
Frequency Missing = 7.7990019763
FRIENDS WISHING TO
DROP OUT OF
SCHOOL
q14e Frequency Percent
None 246 60.81A Few 84 20.90
Some 46 11.36
Most 22 5.49
All 6 1.43
Frequency Missing = 4.1280154809
PARENTS ATTEND
PTA/SCHOOL OPEN
HOUSES
q15 Frequency Percent
No 224 62.01
Yes 137 37.99
Frequency Missing = 47.333045125
RECENT CIGARETTE USE
Q16A Frequency Percent
Never Heard/Used 315 77.68
In Your Lifetime 43 10.72
Since School Began 18 4.54
In the Past Month 29 7.05
Frequency Missing = 2.9531900527
RECENT SMOKELESS TOBACCO
USE
Q16B Frequency Percent
Never Heard/Used 377 94.19
In Your Lifetime 15 3.75
Since School Began 3 0.74
In the Past Month 5 1.33
Frequency Missing = 7.7990019763
RECENT BEER
Q16C Frequency Per
Never Heard/Used 224 5
In Your Lifetime 74 1
Since School Began 31
In the Past Month 63 1
Frequency Missing = 15.7122611
RECENT WINE COOLER
Q16D Frequency Per
Never Heard/Used 270 6
In Your Lifetime 40
Since School Began 29
In the Past Month 63 1
Frequency Missing = 5.90638010
RECENT WINE
Q16E Frequency Per
Never Heard/Used 240 6
In Your Lifetime 74 1
Since School Began 36
In the Past Month 44 1
Frequency Missing = 14.6516930
RECENT LIQUOR
Q16F Frequency Per
Never Heard/Used 274 6
In Your Lifetime 41 1
Since School Began 30
In the Past Month 55 1
Frequency Missing = 6.96694828
RECENT INHALANT
Q16G Frequency Per
Never Heard/Used 352 8
In Your Lifetime 19
Since School Began 15
In the Past Month 15
The frequencies have been weighted so that the analysis reflects
the distribution of students by grade level in the district
©Copyright 2009, Texas A&M University
All rights reserved.
Page 47 of 61

8/6/2019 San Angelo ISD - Glenn Middle School - 2009 Texas School Survey of Drug and Alcohol Use
http://slidepdf.com/reader/full/san-angelo-isd-glenn-middle-school-2009-texas-school-survey-of-drug-and 48/61
San Angelo ISD - Glenn Middle School
Spring 2009
Frequency Missing = 7.9132592227
RECENT MARIJUANA USE
Q17A Frequency Percent
Never Heard/Used 332 82.88In Your Lifetime 29 7.30
Since School Began 12 3.12
In the Past Month 27 6.70
Frequency Missing = 6.9669482872
RECENT COCAINE USE
Q17B Frequency Percent
Never Heard/Used 386 97.26
In Your Lifetime 5 1.22
Since School Began 2 0.53In the Past Month 4 0.98
Frequency Missing = 11.209221014
RECENT CRACK USE
Q17C Frequency Percent
Never Heard/Used 388 97.77
In Your Lifetime 7 1.70
In the Past Month 2 0.53
Frequency Missing = 11.094963768
RECENT HALLUCINOGEN USE
Q17E Frequency Percent
Never Heard/Used 386 98.46
In Your Lifetime 4 1.02
Since School Began 1 0.27
In the Past Month 1 0.24
Frequency Missing = 15.940775692
RECENT UPPER USE
Q17F Frequency Percent
Never Heard/Used 380 97.10
In Your Lifetime 5 1.30
Since School Began 3 0.81
In the Past Month 3 0.78
Frequency Missing = 17.11560112
RECENT DOWNER USE
Q17G Frequency Percent
Never Heard/Used 380 97.37
In Your Lifetime 1 0.27
Since School Began 3 0.79
In the Past Month 6 1.57
Frequency Missing = 18.061912055
RECENT ROHYPNOL USE
Q17H Frequency Percent
Never Heard/Used 385 98.14
In Your Lifetime 4 1.05
Since School Began 1 0.27
In the Past Month 2 0.54
Frequency Missing = 16.055032938
RECENT STEROID USE
Q17I Frequency Percent
Never Heard/Used 385 99.03
In Your Lifetime 1 0.24
Since School Began 2 0.49
In the Past Month 1 0.24
Frequency Missing = 19.008222991
RECENT ECSTASY USE
Q17J Frequency Percent
Never Heard/Used 387 98.44
In Your Lifetime 3 0.78
In the Past Month 3 0.78
Frequency Missing = 14.880207
RECENT HEROIN U
Q17K Frequency Per
Never Heard/Used 387 9
In Your Lifetime 3 In the Past Month 5
Frequency Missing = 12.9875856
TOBACCO USE IN PAST MON
q18a Frequency Per
Never Heard/Used 379 9
1-2 times 13
3-10 times 5
11+ times 2
Frequency Missing = 8.25603096
ALCOHOL USE IN PAST MON
q18b Frequency Per
Never Heard/Used 299 7
1-2 times 56 1
3-10 times 36
11+ times 6
Frequency Missing = 11.3234782
INHALANT USE IN PAST MON
q18c Frequency Per
Never Heard/Used 365 9
1-2 times 17
3-10 times 5
11+ times 4
Frequency Missing = 17.3441156
The frequencies have been weighted so that the analysis reflects
the distribution of students by grade level in the district
©Copyright 2009, Texas A&M University
All rights reserved.
Page 48 of 61

8/6/2019 San Angelo ISD - Glenn Middle School - 2009 Texas School Survey of Drug and Alcohol Use
http://slidepdf.com/reader/full/san-angelo-isd-glenn-middle-school-2009-texas-school-survey-of-drug-and 49/61
San Angelo ISD - Glenn Middle School
Spring 2009
MARIJUANA USE IN PAST
MONTH
q18d Frequency Percent
Never Heard/Used 351 88.89
1-2 times 21 5.35
3-10 times 12 3.11
11+ times 10 2.66
Frequency Missing = 13.101842885
COCAINE USE IN PAST MONTH
q18e Frequency Percent
Never Heard/Used 391 98.25
1-2 times 5 1.25
3-10 times 2 0.50
Frequency Missing = 10.034395586
CRACK USE IN PAST MONTH
q18f Frequency Percent
Never Heard/Used 392 98.99
1-2 times 3 0.75
3-10 times 1 0.27
Frequency Missing = 12.269789196
CLOSE FRIENDS USECIGARETTES
q19a Frequency Percent
Never heard/None 246 61.93
A few 88 22.12
Some 42 10.47
Most 19 4.71
All 3 0.77
Frequency Missing = 10.034395586
CLOSE FRIENDS USE
SMOKELESS TOBACCO
q19b Frequency Percent
Never heard/None 336 84.36
A few 43 10.70
Some 12 3.11
Most 6 1.57
All 1 0.27
Frequency Missing = 9.8058810935
CLOSE FRIENDS USE BEER
q19c Frequency Percent
Never heard/None 189 48.25
A few 78 19.85
Some 69 17.65
Most 41 10.35
All 15 3.91
Frequency Missing = 15.598003953
CLOSE FRIENDS USE WINE
COOLERS
q19d Frequency Percent
Never heard/None 237 59.63
A few 62 15.73
Some 57 14.38
Most 32 7.96
All 9 2.29
Frequency Missing = 10.980706522
CLOSE FRIENDS USE WINE
q19e Frequency Percent
Never heard/None 253 64.42
A few 76 19.23
Some 37 9.39
Most 18 4.68
All 9 2.28
Frequency Missing = 14.651693017
CLOSE FRIENDS USE LIQU
q19f Frequency Perc
Never heard/None 222 56
A few 77 19
Some 42 10
Most 43 10
All 10 2
Frequency Missing = 13.9338965
CLOSE FRIENDS USE INHALAN
q19g Frequency Perc
Never heard/None 297 76
A few 47 1
Some 30 7
Most 11 2
All 3 0
Frequency Missing = 19.9545339
CLOSE FRIENDS U
MARIJUA
q19h Frequency Perc
Never heard/None 255 64
A few 59 14
Some 32
Most 37 9
All 14 3
Frequency Missing = 10.9807065
DIFFICULT TO GE
CIGARETTE
q20a Frequency Perce
Never heard of 27 6.
Impossible 135 34.
Very difficult 41 10.
Somewhat diff 44 11.
Somewhat easy 59 15.
Very easy 82 21.
Frequency Missing = 20.0687911
The frequencies have been weighted so that the analysis reflects
the distribution of students by grade level in the district
©Copyright 2009, Texas A&M University
All rights reserved.
Page 49 of 61

8/6/2019 San Angelo ISD - Glenn Middle School - 2009 Texas School Survey of Drug and Alcohol Use
http://slidepdf.com/reader/full/san-angelo-isd-glenn-middle-school-2009-texas-school-survey-of-drug-and 50/61
8/6/2019 San Angelo ISD - Glenn Middle School - 2009 Texas School Survey of Drug and Alcohol Use
http://slidepdf.com/reader/full/san-angelo-isd-glenn-middle-school-2009-texas-school-survey-of-drug-and 51/61
San Angelo ISD - Glenn Middle School
Spring 2009
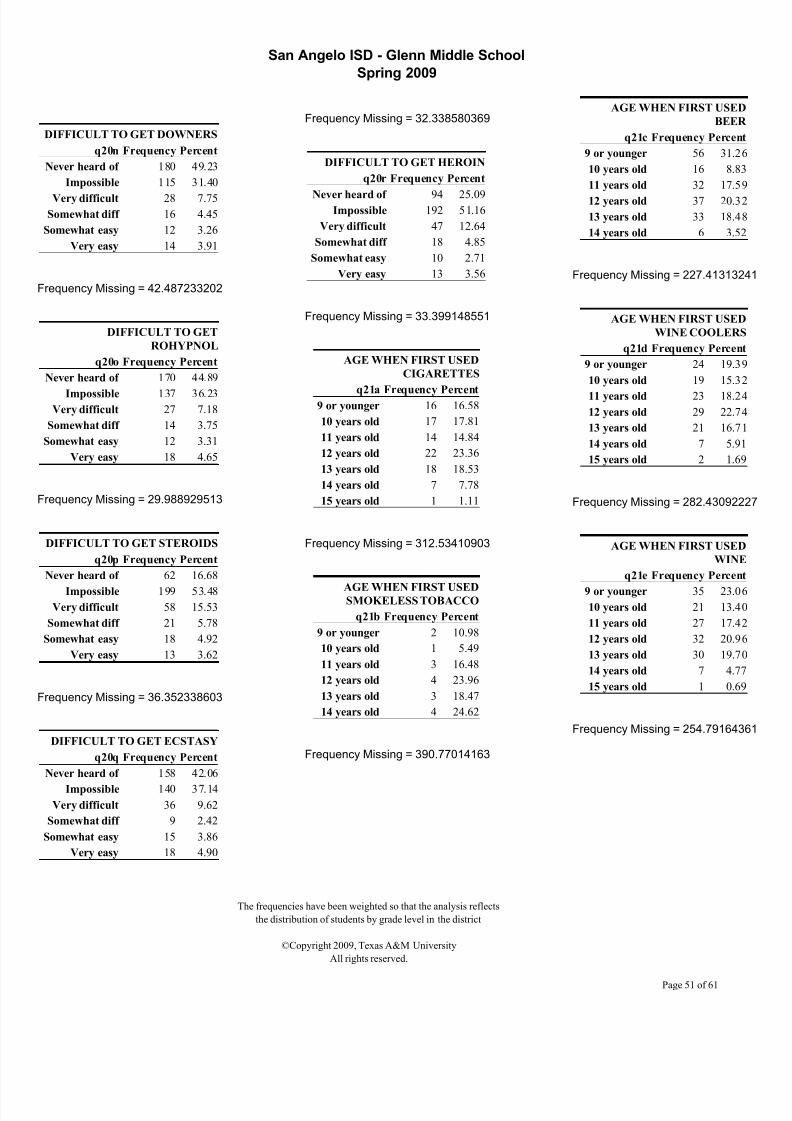
DIFFICULT TO GET DOWNERS
q20n Frequency Percent
Never heard of 180 49.23
Impossible 115 31.40
Very difficult 28 7.75Somewhat diff 16 4.45
Somewhat easy 12 3.26
Very easy 14 3.91
Frequency Missing = 42.487233202
DIFFICULT TO GET
ROHYPNOL
q20o Frequency Percent
Never heard of 170 44.89
Impossible 137 36.23Very difficult 27 7.18
Somewhat diff 14 3.75
Somewhat easy 12 3.31
Very easy 18 4.65
Frequency Missing = 29.988929513
DIFFICULT TO GET STEROIDS
q20p Frequency Percent
Never heard of 62 16.68
Impossible 199 53.48Very difficult 58 15.53
Somewhat diff 21 5.78
Somewhat easy 18 4.92
Very easy 13 3.62
Frequency Missing = 36.352338603
DIFFICULT TO GET ECSTASY
q20q Frequency Percent
Never heard of 158 42.06
Impossible 140 37.14
Very difficult 36 9.62
Somewhat diff 9 2.42
Somewhat easy 15 3.86
Very easy 18 4.90
Frequency Missing = 32.338580369
DIFFICULT TO GET HEROIN
q20r Frequency Percent
Never heard of 94 25.09Impossible 192 51.16
Very difficult 47 12.64
Somewhat diff 18 4.85
Somewhat easy 10 2.71
Very easy 13 3.56
Frequency Missing = 33.399148551
AGE WHEN FIRST USED
CIGARETTES
q21a Frequency Percent9 or younger 16 16.58
10 years old 17 17.81
11 years old 14 14.84
12 years old 22 23.36
13 years old 18 18.53
14 years old 7 7.78
15 years old 1 1.11
Frequency Missing = 312.53410903
AGE WHEN FIRST USEDSMOKELESS TOBACCO
q21b Frequency Percent
9 or younger 2 10.98
10 years old 1 5.49
11 years old 3 16.48
12 years old 4 23.96
13 years old 3 18.47
14 years old 4 24.62
Frequency Missing = 390.77014163
AGE WHEN FIRST USED
BEER
q21c Frequency Percen
9 or younger 56 31.2
10 years old 16 8.8
11 years old 32 17.5
12 years old 37 20.3
13 years old 33 18.4
14 years old 6 3.5
Frequency Missing = 227.413132
AGE WHEN FIRST USED
WINE COOLER
q21d Frequency Percen
9 or younger 24 19.3
10 years old 19 15.3
11 years old 23 18.2
12 years old 29 22.7
13 years old 21 16.7
14 years old 7 5.9
15 years old 2 1.6
Frequency Missing = 282.430922
AGE WHEN FIRST USED
WINE
q21e Frequency Percen
9 or younger 35 23.010 years old 21 13.4
11 years old 27 17.4
12 years old 32 20.9
13 years old 30 19.7
14 years old 7 4.7
15 years old 1 0.6
Frequency Missing = 254.791643
The frequencies have been weighted so that the analysis reflects
the distribution of students by grade level in the district
©Copyright 2009, Texas A&M University
All rights reserved.
Page 51 of 61

8/6/2019 San Angelo ISD - Glenn Middle School - 2009 Texas School Survey of Drug and Alcohol Use
http://slidepdf.com/reader/full/san-angelo-isd-glenn-middle-school-2009-texas-school-survey-of-drug-and 52/61
San Angelo ISD - Glenn Middle School
Spring 2009
AGE WHEN FIRST USED
LIQUOR
q21f Frequency Percent
9 or younger 13 10.12
10 years old 6 4.82
11 years old 22 17.57
12 years old 24 19.18
13 years old 46 36.43
14 years old 13 10.18
15 years old 2 1.70
Frequency Missing = 283.03446146
AGE WHEN FIRST USED
INHALANTS
q21g Frequency Percent
9 or younger 7 18.74
10 years old 11 29.06
11 years old 7 18.44
12 years old 11 28.45
13 years old 2 5.31
Frequency Missing = 370.21206851
AGE WHEN FIRST USED
MARIJUANA
q21h Frequency Percent
9 or younger 5 7.05
10 years old 10 14.7611 years old 11 16.47
12 years old 13 19.22
13 years old 18 25.88
14 years old 7 10.46
15 years old 4 6.17
Frequency Missing = 339.22707675
AGE WHEN FIRST USED
COCAINE
q21i Frequency Percent
9 or younger 1 10.68
11 years old 3 32.04
12 years old 2 22.65
13 years old 2 22.65
15 years old 1 11.97
Frequency Missing = 399.14042984
AGE WHEN FIRST USED
CRACK
q21j Frequency Percent
9 or younger 1 13.81
11 years old 2 27.62
12 years old 2 29.29
13 years old 2 29.29
Frequency Missing = 401.14730896
AGE WHEN FIRST USED
HALLUCINOGENS
q21l Frequency Percent
11 years old 1 26.42
12 years old 1 23.58
13 years old 1 23.58
14 years old 1 26.42
Frequency Missing = 403.98624177
AGE WHEN FIRST USED
UPPERS
q21m Frequency Percent
9 or younger 2 15.43
12 years old 4 32.71
13 years old 5 43.22
14 years old 1 8.64
Frequency Missing = 395.7302108
AGE WHEN FIRST USED
DOWNER
q21n Frequency Percen
9 or younger 2 18.4
10 years old 1 10.3
11 years old 1 9.2
12 years old 2 20.6
13 years old 3 31.0
14 years old 1 10.3
Frequency Missing = 397.737089
AGE WHEN FIRST USED
ROHYPNOL
q21o Frequency Percen
11 years old 2 34.57
12 years old 2 30.85
13 years old 2 34.57
Frequency Missing = 401.86510
AGE WHEN FIRST USED
STEROID
q21p Frequency Percen
9 or younger 1 17.9
11 years old 2 32.0
12 years old 2 32.0
13 years old 1 17.9
Frequency Missing = 402.093619
AGE WHEN FIRST USED
ECSTASY
q21q Frequency Percen
9 or younger 1 13.5
12 years old 3 40.7
13 years old 1 15.2
14 years old 1 15.2
15 years old 1 15.2
Frequency Missing = 401.033051
The frequencies have been weighted so that the analysis reflects
the distribution of students by grade level in the district
©Copyright 2009, Texas A&M University
All rights reserved.
Page 52 of 61
8/6/2019 San Angelo ISD - Glenn Middle School - 2009 Texas School Survey of Drug and Alcohol Use
http://slidepdf.com/reader/full/san-angelo-isd-glenn-middle-school-2009-texas-school-survey-of-drug-and 53/61
San Angelo ISD - Glenn Middle School
Spring 2009
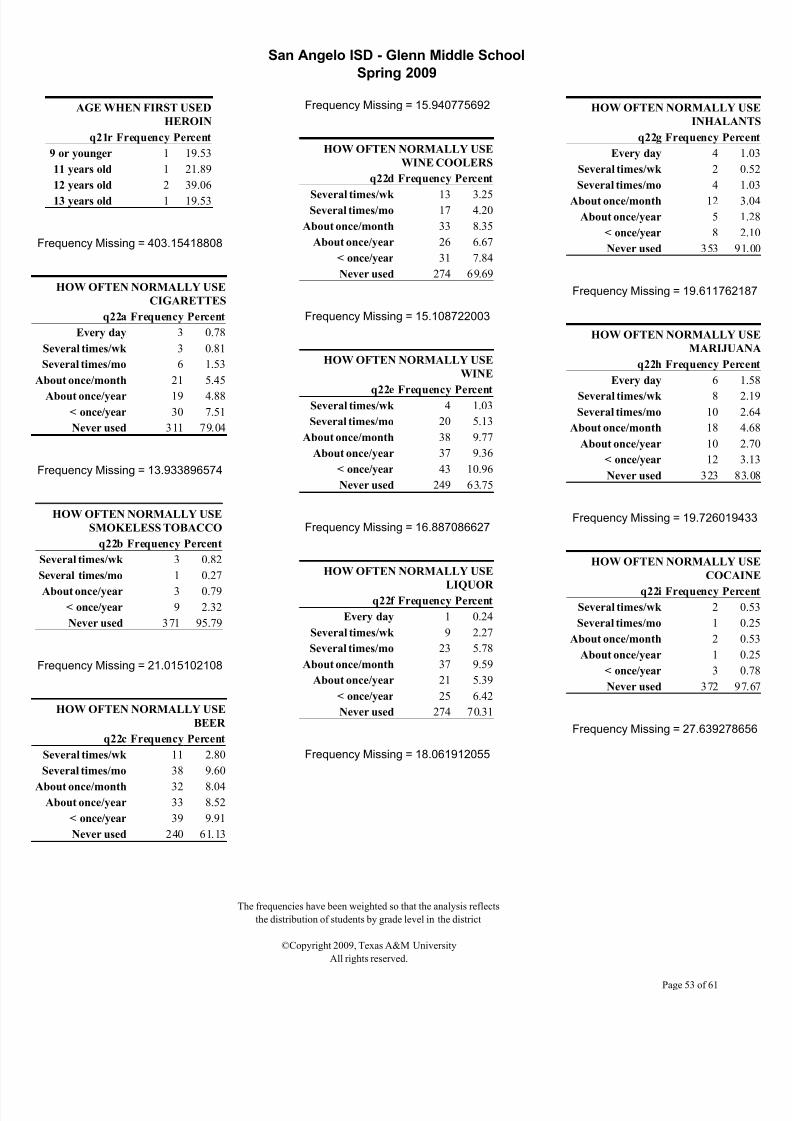
AGE WHEN FIRST USED
HEROIN
q21r Frequency Percent
9 or younger 1 19.53
11 years old 1 21.89
12 years old 2 39.06
13 years old 1 19.53
Frequency Missing = 403.15418808
HOW OFTEN NORMALLY USE
CIGARETTES
q22a Frequency Percent
Every day 3 0.78
Several times/wk 3 0.81
Several times/mo 6 1.53
About once/month 21 5.45
About once/year 19 4.88
< once/year 30 7.51
Never used 311 79.04
Frequency Missing = 13.933896574
HOW OFTEN NORMALLY USE
SMOKELESS TOBACCO
q22b Frequency Percent
Several times/wk 3 0.82
Several times/mo 1 0.27
About once/year 3 0.79< once/year 9 2.32
Never used 371 95.79
Frequency Missing = 21.015102108
HOW OFTEN NORMALLY USE
BEER
q22c Frequency Percent
Several times/wk 11 2.80
Several times/mo 38 9.60
About once/month 32 8.04About once/year 33 8.52
< once/year 39 9.91
Never used 240 61.13
Frequency Missing = 15.940775692
HOW OFTEN NORMALLY USE
WINE COOLERS
q22d Frequency Percent
Several times/wk 13 3.25Several times/mo 17 4.20
About once/month 33 8.35
About once/year 26 6.67
< once/year 31 7.84
Never used 274 69.69
Frequency Missing = 15.108722003
HOW OFTEN NORMALLY USE
WINE
q22e Frequency PercentSeveral times/wk 4 1.03
Several times/mo 20 5.13
About once/month 38 9.77
About once/year 37 9.36
< once/year 43 10.96
Never used 249 63.75
Frequency Missing = 16.887086627
HOW OFTEN NORMALLY USE
LIQUOR q22f Frequency Percent
Every day 1 0.24
Several times/wk 9 2.27
Several times/mo 23 5.78
About once/month 37 9.59
About once/year 21 5.39
< once/year 25 6.42
Never used 274 70.31
Frequency Missing = 18.061912055
HOW OFTEN NORMALLY U
INHALAN
q22g Frequency Per
Every day 4
Several times/wk 2
Several times/mo 4
About once/month 12
About once/year 5
< once/year 8
Never used 353 9
Frequency Missing = 19.6117621
HOW OFTEN NORMALLY U
MARIJUA
q22h Frequency Per
Every day 6
Several times/wk 8
Several times/mo 10
About once/month 18
About once/year 10
< once/year 12
Never used 323 8
Frequency Missing = 19.7260194
HOW OFTEN NORMALLY U
COCA
q22i Frequency Per
Several times/wk 2
Several times/mo 1
About once/month 2
About once/year 1
< once/year 3
Never used 372 9
Frequency Missing = 27.6392786
The frequencies have been weighted so that the analysis reflects
the distribution of students by grade level in the district
©Copyright 2009, Texas A&M University
All rights reserved.
Page 53 of 61
8/6/2019 San Angelo ISD - Glenn Middle School - 2009 Texas School Survey of Drug and Alcohol Use
http://slidepdf.com/reader/full/san-angelo-isd-glenn-middle-school-2009-texas-school-survey-of-drug-and 54/61
San Angelo ISD - Glenn Middle School
Spring 2009
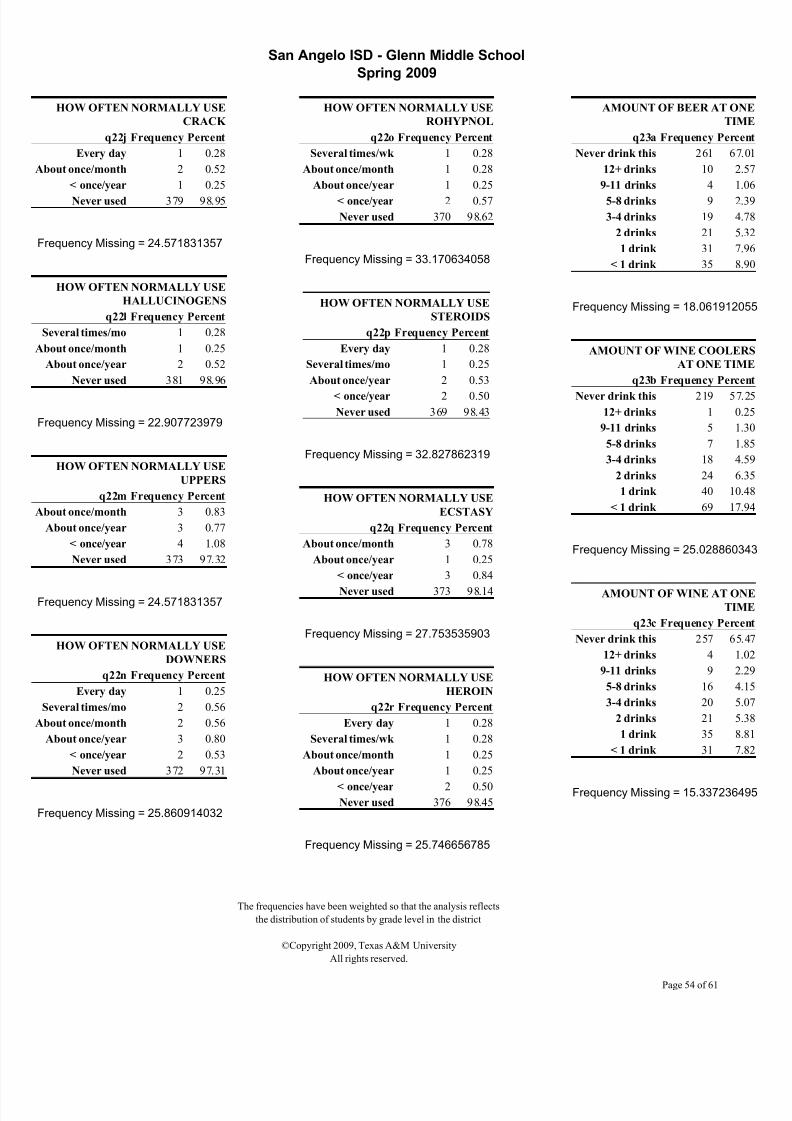
HOW OFTEN NORMALLY USE
CRACK
q22j Frequency Percent
Every day 1 0.28
About once/month 2 0.52
< once/year 1 0.25
Never used 379 98.95
Frequency Missing = 24.571831357
HOW OFTEN NORMALLY USE
HALLUCINOGENS
q22l Frequency Percent
Several times/mo 1 0.28
About once/month 1 0.25
About once/year 2 0.52
Never used 381 98.96
Frequency Missing = 22.907723979
HOW OFTEN NORMALLY USE
UPPERS
q22m Frequency Percent
About once/month 3 0.83
About once/year 3 0.77
< once/year 4 1.08
Never used 373 97.32
Frequency Missing = 24.571831357
HOW OFTEN NORMALLY USE
DOWNERS
q22n Frequency Percent
Every day 1 0.25
Several times/mo 2 0.56
About once/month 2 0.56
About once/year 3 0.80
< once/year 2 0.53
Never used 372 97.31
Frequency Missing = 25.860914032
HOW OFTEN NORMALLY USE
ROHYPNOL
q22o Frequency Percent
Several times/wk 1 0.28
About once/month 1 0.28
About once/year 1 0.25
< once/year 2 0.57
Never used 370 98.62
Frequency Missing = 33.170634058
HOW OFTEN NORMALLY USE
STEROIDS
q22p Frequency Percent
Every day 1 0.28
Several times/mo 1 0.25
About once/year 2 0.53
< once/year 2 0.50
Never used 369 98.43
Frequency Missing = 32.827862319
HOW OFTEN NORMALLY USE
ECSTASY
q22q Frequency Percent
About once/month 3 0.78
About once/year 1 0.25
< once/year 3 0.84
Never used 373 98.14
Frequency Missing = 27.753535903
HOW OFTEN NORMALLY USE
HEROIN
q22r Frequency Percent
Every day 1 0.28
Several times/wk 1 0.28
About once/month 1 0.25
About once/year 1 0.25
< once/year 2 0.50Never used 376 98.45
Frequency Missing = 25.746656785
AMOUNT OF BEER AT ON
TIM
q23a Frequency Perc
Never drink this 261 67
12+ drinks 10 2
9-11 drinks 4 1
5-8 drinks 9 2
3-4 drinks 19 4
2 drinks 21 5
1 drink 31 7
< 1 drink 35 8
Frequency Missing = 18.0619120
AMOUNT OF WINE COOLE
AT ONE TIM
q23b Frequency Perc
Never drink this 219 57
12+ drinks 1 0
9-11 drinks 5 1
5-8 drinks 7 1
3-4 drinks 18 4
2 drinks 24 6
1 drink 40 10
< 1 drink 69 17
Frequency Missing = 25.0288603
AMOUNT OF WINE AT ON
TIM
q23c Frequency Perc
Never drink this 257 65
12+ drinks 4 1
9-11 drinks 9 2
5-8 drinks 16 4
3-4 drinks 20 5
2 drinks 21 5
1 drink 35 8
< 1 drink 31 7
Frequency Missing = 15.3372364
The frequencies have been weighted so that the analysis reflects
the distribution of students by grade level in the district
©Copyright 2009, Texas A&M University
All rights reserved.
Page 54 of 61
8/6/2019 San Angelo ISD - Glenn Middle School - 2009 Texas School Survey of Drug and Alcohol Use
http://slidepdf.com/reader/full/san-angelo-isd-glenn-middle-school-2009-texas-school-survey-of-drug-and 55/61
San Angelo ISD - Glenn Middle School
Spring 2009
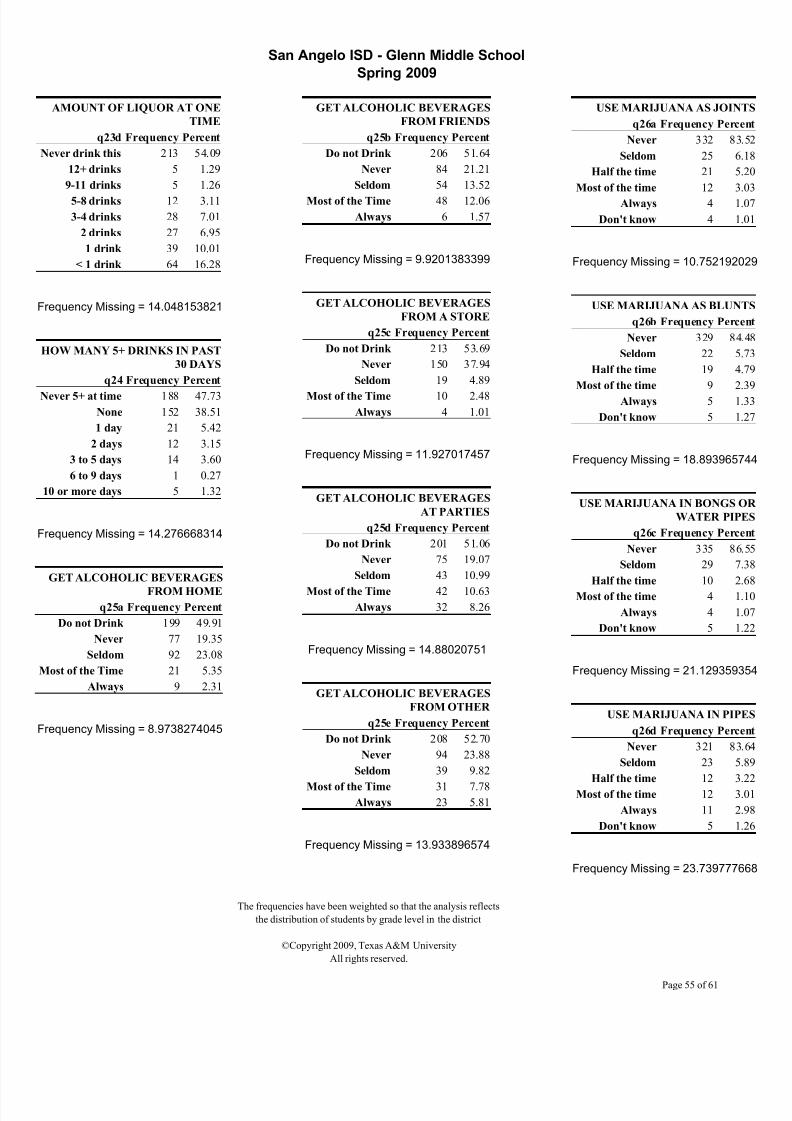
AMOUNT OF LIQUOR AT ONE
TIME
q23d Frequency Percent
Never drink this 213 54.09
12+ drinks 5 1.29
9-11 drinks 5 1.26
5-8 drinks 12 3.11
3-4 drinks 28 7.01
2 drinks 27 6.95
1 drink 39 10.01
< 1 drink 64 16.28
Frequency Missing = 14.048153821
HOW MANY 5+ DRINKS IN PAST
30 DAYS
q24 Frequency Percent
Never 5+ at time 188 47.73
None 152 38.51
1 day 21 5.42
2 days 12 3.15
3 to 5 days 14 3.60
6 to 9 days 1 0.27
10 or more days 5 1.32
Frequency Missing = 14.276668314
GET ALCOHOLIC BEVERAGES
FROM HOME
q25a Frequency Percent
Do not Drink 199 49.91
Never 77 19.35
Seldom 92 23.08
Most of the Time 21 5.35
Always 9 2.31
Frequency Missing = 8.9738274045
GET ALCOHOLIC BEVERAGES
FROM FRIENDS
q25b Frequency Percent
Do not Drink 206 51.64
Never 84 21.21
Seldom 54 13.52
Most of the Time 48 12.06
Always 6 1.57
Frequency Missing = 9.9201383399
GET ALCOHOLIC BEVERAGES
FROM A STORE
q25c Frequency Percent
Do not Drink 213 53.69
Never 150 37.94
Seldom 19 4.89
Most of the Time 10 2.48
Always 4 1.01
Frequency Missing = 11.927017457
GET ALCOHOLIC BEVERAGES
AT PARTIES
q25d Frequency Percent
Do not Drink 201 51.06
Never 75 19.07
Seldom 43 10.99
Most of the Time 42 10.63Always 32 8.26
Frequency Missing = 14.88020751
GET ALCOHOLIC BEVERAGES
FROM OTHER
q25e Frequency Percent
Do not Drink 208 52.70
Never 94 23.88
Seldom 39 9.82
Most of the Time 31 7.78Always 23 5.81
Frequency Missing = 13.933896574
USE MARIJUANA AS JOIN
q26a Frequency Perc
Never 332 83
Seldom 25 6
Half the time 21 5
Most of the time 12 3
Always 4 1
Don't know 4 1
Frequency Missing = 10.7521920
USE MARIJUANA AS BLUN
q26b Frequency Perc
Never 329 84
Seldom 22 5
Half the time 19 4
Most of the time 9 2
Always 5 1
Don't know 5 1
Frequency Missing = 18.8939657
USE MARIJUANA IN BONGS O
WATER PIP
q26c Frequency Perc
Never 335 86
Seldom 29 7
Half the time 10 2
Most of the time 4 1
Always 4 1
Don't know 5 1
Frequency Missing = 21.1293593
USE MARIJUANA IN PIP
q26d Frequency Perc
Never 321 83
Seldom 23 5
Half the time 12 3
Most of the time 12 3
Always 11 2
Don't know 5 1
Frequency Missing = 23.7397776
The frequencies have been weighted so that the analysis reflects
the distribution of students by grade level in the district
©Copyright 2009, Texas A&M University
All rights reserved.
Page 55 of 61
8/6/2019 San Angelo ISD - Glenn Middle School - 2009 Texas School Survey of Drug and Alcohol Use
http://slidepdf.com/reader/full/san-angelo-isd-glenn-middle-school-2009-texas-school-survey-of-drug-and 56/61
San Angelo ISD - Glenn Middle School
Spring 2009
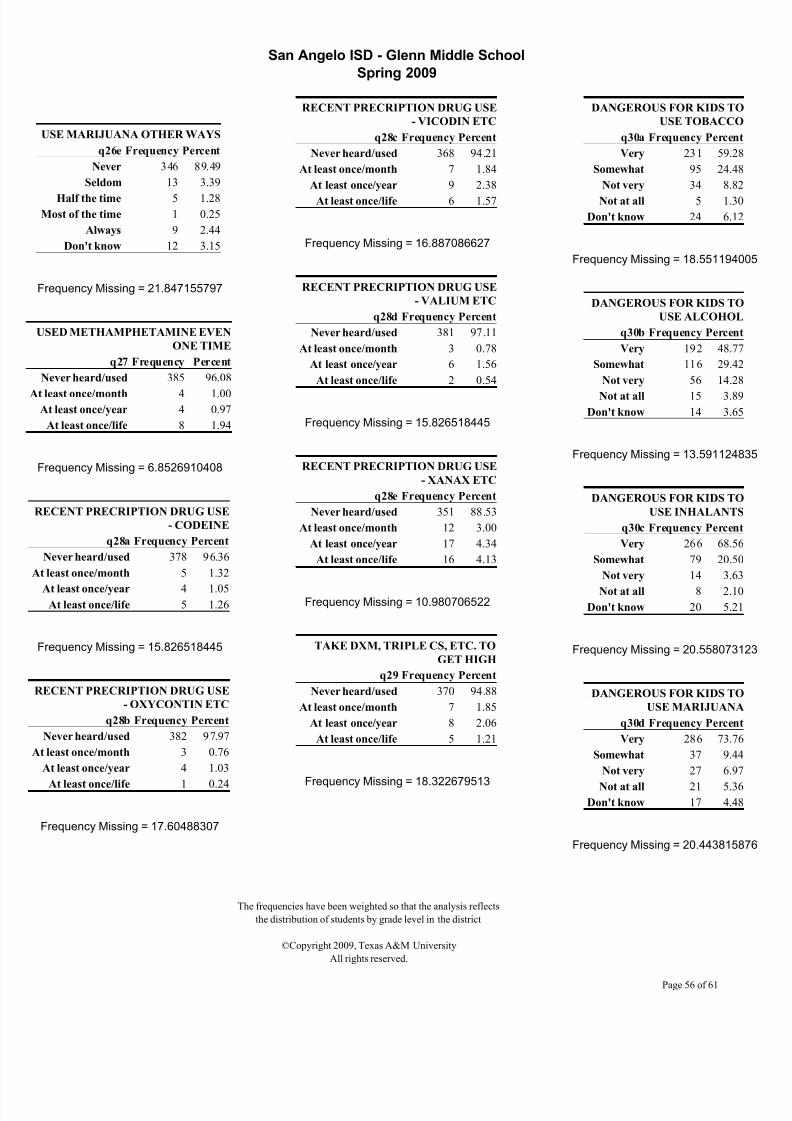
USE MARIJUANA OTHER WAYS
q26e Frequency Percent
Never 346 89.49
Seldom 13 3.39
Half the time 5 1.28Most of the time 1 0.25
Always 9 2.44
Don't know 12 3.15
Frequency Missing = 21.847155797
USED METHAMPHETAMINE EVEN
ONE TIME
q27 Frequency Percent
Never heard/used 385 96.08
At least once/month 4 1.00At least once/year 4 0.97
At least once/life 8 1.94
Frequency Missing = 6.8526910408
RECENT PRECRIPTION DRUG USE
- CODEINE
q28a Frequency Percent
Never heard/used 378 96.36
At least once/month 5 1.32
At least once/year 4 1.05At least once/life 5 1.26
Frequency Missing = 15.826518445
RECENT PRECRIPTION DRUG USE
- OXYCONTIN ETC
q28b Frequency Percent
Never heard/used 382 97.97
At least once/month 3 0.76
At least once/year 4 1.03
At least once/life 1 0.24
Frequency Missing = 17.60488307
RECENT PRECRIPTION DRUG USE
- VICODIN ETC
q28c Frequency Percent
Never heard/used 368 94.21
At least once/month 7 1.84
At least once/year 9 2.38
At least once/life 6 1.57
Frequency Missing = 16.887086627
RECENT PRECRIPTION DRUG USE
- VALIUM ETC
q28d Frequency Percent
Never heard/used 381 97.11
At least once/month 3 0.78
At least once/year 6 1.56
At least once/life 2 0.54
Frequency Missing = 15.826518445
RECENT PRECRIPTION DRUG USE
- XANAX ETC
q28e Frequency Percent
Never heard/used 351 88.53
At least once/month 12 3.00
At least once/year 17 4.34
At least once/life 16 4.13
Frequency Missing = 10.980706522
TAKE DXM, TRIPLE CS, ETC. TO
GET HIGH
q29 Frequency Percent
Never heard/used 370 94.88
At least once/month 7 1.85
At least once/year 8 2.06
At least once/life 5 1.21
Frequency Missing = 18.322679513
DANGEROUS FOR KIDS TO
USE TOBACCO
q30a Frequency Percen
Very 231 59.28
Somewhat 95 24.48
Not very 34 8.82
Not at all 5 1.30
Don't know 24 6.12
Frequency Missing = 18.5511940
DANGEROUS FOR KIDS TO
USE ALCOHOL
q30b Frequency Percen
Very 192 48.77
Somewhat 116 29.42
Not very 56 14.28
Not at all 15 3.89
Don't know 14 3.65
Frequency Missing = 13.5911248
DANGEROUS FOR KIDS TO
USE INHALANTS
q30c Frequency Percen
Very 266 68.56
Somewhat 79 20.50
Not very 14 3.63
Not at all 8 2.10Don't know 20 5.21
Frequency Missing = 20.5580731
DANGEROUS FOR KIDS TO
USE MARIJUANA
q30d Frequency Percen
Very 286 73.76
Somewhat 37 9.44
Not very 27 6.97
Not at all 21 5.36Don't know 17 4.48
Frequency Missing = 20.4438158
The frequencies have been weighted so that the analysis reflects
the distribution of students by grade level in the district
©Copyright 2009, Texas A&M University
All rights reserved.
Page 56 of 61
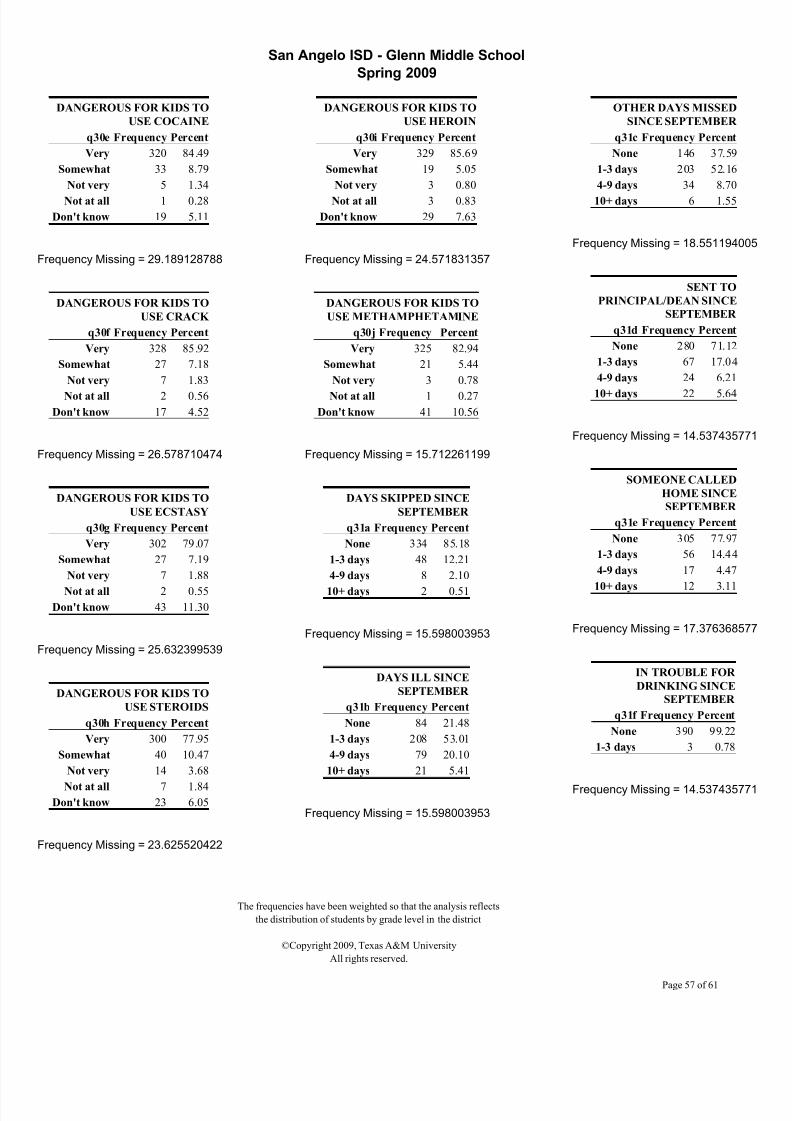
8/6/2019 San Angelo ISD - Glenn Middle School - 2009 Texas School Survey of Drug and Alcohol Use
http://slidepdf.com/reader/full/san-angelo-isd-glenn-middle-school-2009-texas-school-survey-of-drug-and 57/61
San Angelo ISD - Glenn Middle School
Spring 2009
DANGEROUS FOR KIDS TO
USE COCAINE
q30e Frequency Percent
Very 320 84.49
Somewhat 33 8.79
Not very 5 1.34
Not at all 1 0.28
Don't know 19 5.11
Frequency Missing = 29.189128788
DANGEROUS FOR KIDS TO
USE CRACK
q30f Frequency Percent
Very 328 85.92
Somewhat 27 7.18
Not very 7 1.83
Not at all 2 0.56
Don't know 17 4.52
Frequency Missing = 26.578710474
DANGEROUS FOR KIDS TO
USE ECSTASY
q30g Frequency Percent
Very 302 79.07
Somewhat 27 7.19
Not very 7 1.88
Not at all 2 0.55Don't know 43 11.30
Frequency Missing = 25.632399539
DANGEROUS FOR KIDS TO
USE STEROIDS
q30h Frequency Percent
Very 300 77.95
Somewhat 40 10.47
Not very 14 3.68
Not at all 7 1.84Don't know 23 6.05
Frequency Missing = 23.625520422
DANGEROUS FOR KIDS TO
USE HEROIN
q30i Frequency Percent
Very 329 85.69
Somewhat 19 5.05
Not very 3 0.80
Not at all 3 0.83
Don't know 29 7.63
Frequency Missing = 24.571831357
DANGEROUS FOR KIDS TO
USE METHAMPHETAMINE
q30j Frequency Percent
Very 325 82.94
Somewhat 21 5.44
Not very 3 0.78
Not at all 1 0.27
Don't know 41 10.56
Frequency Missing = 15.712261199
DAYS SKIPPED SINCE
SEPTEMBER
q31a Frequency Percent
None 334 85.18
1-3 days 48 12.21
4-9 days 8 2.10
10+ days 2 0.51
Frequency Missing = 15.598003953
DAYS ILL SINCE
SEPTEMBER
q31b Frequency Percent
None 84 21.48
1-3 days 208 53.01
4-9 days 79 20.10
10+ days 21 5.41
Frequency Missing = 15.598003953
OTHER DAYS MISSED
SINCE SEPTEMBER
q31c Frequency Percent
None 146 37.59
1-3 days 203 52.16
4-9 days 34 8.70
10+ days 6 1.55
Frequency Missing = 18.5511940
SENT TO
PRINCIPAL/DEAN SINCE
SEPTEMBER
q31d Frequency Percent
None 280 71.12
1-3 days 67 17.04
4-9 days 24 6.21
10+ days 22 5.64
Frequency Missing = 14.5374357
SOMEONE CALLED
HOME SINCE
SEPTEMBER
q31e Frequency Percent
None 305 77.97
1-3 days 56 14.44
4-9 days 17 4.47
10+ days 12 3.11
Frequency Missing = 17.3763685
IN TROUBLE FOR
DRINKING SINCE
SEPTEMBER
q31f Frequency Percent
None 390 99.22
1-3 days 3 0.78
Frequency Missing = 14.5374357
The frequencies have been weighted so that the analysis reflects
the distribution of students by grade level in the district
©Copyright 2009, Texas A&M University
All rights reserved.
Page 57 of 61
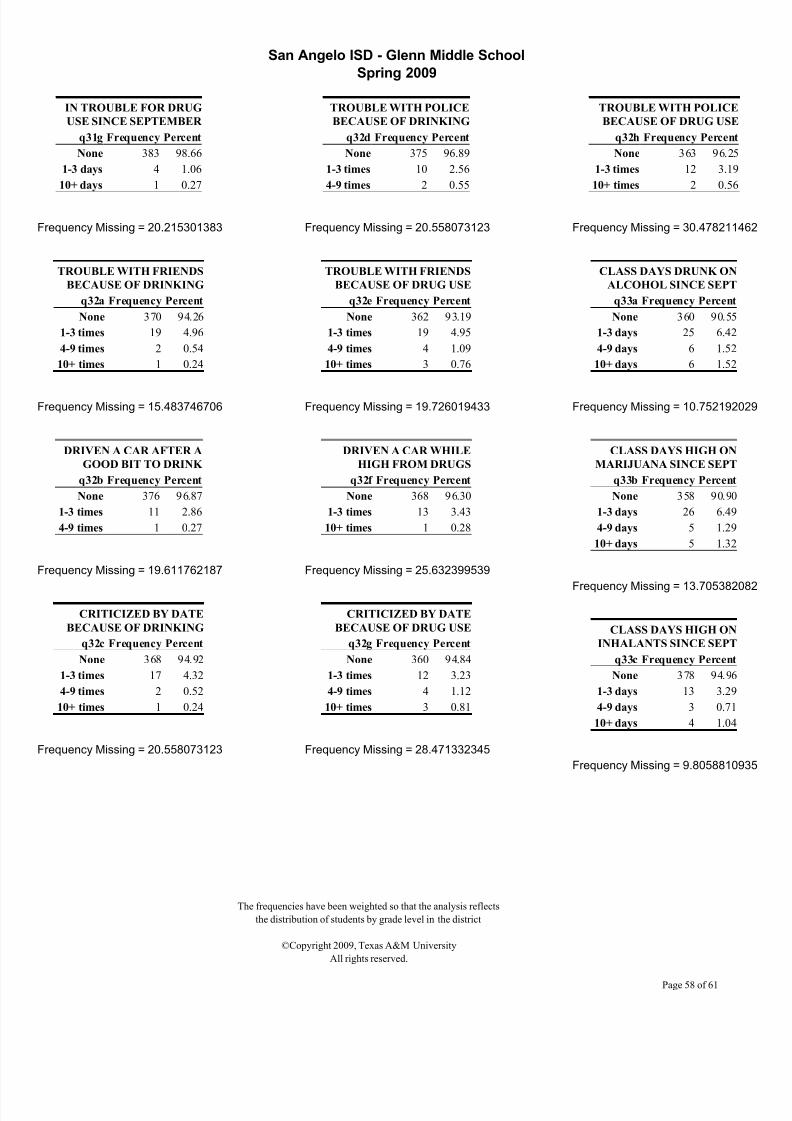
8/6/2019 San Angelo ISD - Glenn Middle School - 2009 Texas School Survey of Drug and Alcohol Use
http://slidepdf.com/reader/full/san-angelo-isd-glenn-middle-school-2009-texas-school-survey-of-drug-and 58/61
San Angelo ISD - Glenn Middle School
Spring 2009
IN TROUBLE FOR DRUG
USE SINCE SEPTEMBER
q31g Frequency Percent
None 383 98.66
1-3 days 4 1.06
10+ days 1 0.27
Frequency Missing = 20.215301383
TROUBLE WITH FRIENDS
BECAUSE OF DRINKING
q32a Frequency Percent
None 370 94.26
1-3 times 19 4.96
4-9 times 2 0.54
10+ times 1 0.24
Frequency Missing = 15.483746706
DRIVEN A CAR AFTER A
GOOD BIT TO DRINK
q32b Frequency Percent
None 376 96.87
1-3 times 11 2.86
4-9 times 1 0.27
Frequency Missing = 19.611762187
CRITICIZED BY DATE
BECAUSE OF DRINKING
q32c Frequency Percent
None 368 94.92
1-3 times 17 4.32
4-9 times 2 0.52
10+ times 1 0.24
Frequency Missing = 20.558073123
TROUBLE WITH POLICE
BECAUSE OF DRINKING
q32d Frequency Percent
None 375 96.89
1-3 times 10 2.56
4-9 times 2 0.55
Frequency Missing = 20.558073123
TROUBLE WITH FRIENDS
BECAUSE OF DRUG USE
q32e Frequency Percent
None 362 93.19
1-3 times 19 4.95
4-9 times 4 1.09
10+ times 3 0.76
Frequency Missing = 19.726019433
DRIVEN A CAR WHILE
HIGH FROM DRUGS
q32f Frequency Percent
None 368 96.30
1-3 times 13 3.43
10+ times 1 0.28
Frequency Missing = 25.632399539
CRITICIZED BY DATE
BECAUSE OF DRUG USE
q32g Frequency Percent
None 360 94.84
1-3 times 12 3.23
4-9 times 4 1.12
10+ times 3 0.81
Frequency Missing = 28.471332345
TROUBLE WITH POLICE
BECAUSE OF DRUG USE
q32h Frequency Percent
None 363 96.25
1-3 times 12 3.19
10+ times 2 0.56
Frequency Missing = 30.4782114
CLASS DAYS DRUNK ON
ALCOHOL SINCE SEPT
q33a Frequency Percent
None 360 90.55
1-3 days 25 6.42
4-9 days 6 1.52
10+ days 6 1.52
Frequency Missing = 10.7521920
CLASS DAYS HIGH ON
MARIJUANA SINCE SEPT
q33b Frequency Percent
None 358 90.90
1-3 days 26 6.49
4-9 days 5 1.29
10+ days 5 1.32
Frequency Missing = 13.7053820
CLASS DAYS HIGH ON
INHALANTS SINCE SEPT
q33c Frequency Percent
None 378 94.96
1-3 days 13 3.29
4-9 days 3 0.71
10+ days 4 1.04
Frequency Missing = 9.80588109
The frequencies have been weighted so that the analysis reflects
the distribution of students by grade level in the district
©Copyright 2009, Texas A&M University
All rights reserved.
Page 58 of 61

8/6/2019 San Angelo ISD - Glenn Middle School - 2009 Texas School Survey of Drug and Alcohol Use
http://slidepdf.com/reader/full/san-angelo-isd-glenn-middle-school-2009-texas-school-survey-of-drug-and 59/61
San Angelo ISD - Glenn Middle School
Spring 2009
CLASS DAYS HIGH ON
OTHER DRUG(S)
q33d Frequency Percent
None 371 93.65
1-3 days 20 5.09
4-9 days 3 0.75
10+ days 2 0.51
Frequency Missing = 11.812760211
ALCOHOL USE AT PARTIES
THIS SCHOOL YEAR
q34a Frequency Percent
Never 207 52.03
Seldom 30 7.56
Half the time 34 8.65
Most of the time 29 7.23
Always 26 6.43
Don't know 9 2.31
Didn't attend 63 15.80
Frequency Missing = 9.6916238472
DRUG USE AT PARTIES THIS
SCHOOL YEAR
q34b Frequency Percent
Never 237 60.20
Seldom 31 7.96
Half the time 15 3.86Most of the time 17 4.43
Always 22 5.53
Don't know 9 2.33
Didn't attend 62 15.69
Frequency Missing = 13.591124835
SOUGHT HELP FOR
DRUG/ALCOHOL
PROBLEM
q35 Frequency PercentNo 347 92.51
Yes 28 7.49
Frequency Missing = 32.827862319
WOULD SEEK HELP
FROM SCHOOL
COUNSELOR
q36a Frequency Percent
No 232 58.99
Yes 161 41.01
Frequency Missing = 14.651693017
WOULD SEEK HELP
OUTSIDE OF SCHOOL
q36b Frequency Percent
No 243 61.78
Yes 150 38.22
Frequency Missing = 14.651693017
WOULD SEEK HELP
FROM OTHER
COUNSELOR
q36c Frequency Percent
No 215 55.40
Yes 173 44.60
Frequency Missing = 20.215301383
WOULD SEEK HELPFROM PARENTS
q36d Frequency Percent
No 125 32.25
Yes 263 67.75
Frequency Missing = 19.726019433
WOULD SEEK HELP
FROM A MEDICAL
DOCTOR
q36e Frequency PercentNo 208 52.90
Yes 185 47.10
Frequency Missing = 15.598003953
WOULD SEEK HELP
FROM FRIENDS
q36f Frequency Percent
No 112 28.47
Yes 281 71.53
Frequency Missing = 15.5980039
WOULD SEEK HELP
FROM ANOTHER
ADULT
q36g Frequency Percent
No 117 29.98
Yes 273 70.02
Frequency Missing = 18.6654512
WOULD NOT SEEK
HELP
q36h Frequency Percent
No 342 88.72
Yes 44 11.28
Frequency Missing = 21.9614130
DRUG/ALCOHOL
INFO--SCHOOLHEALTH CLASS
q37a Frequency Percent
No 149 43.83
Yes 192 56.17
Frequency Missing = 66.9448073
DRUG/ALCOHOL
INFO--SCHOOL
ASSEMBLY PROGRAM
q37b Frequency PercentNo 121 36.06
Yes 214 63.94
Frequency Missing = 72.7369301
The frequencies have been weighted so that the analysis reflects
the distribution of students by grade level in the district
©Copyright 2009, Texas A&M University
All rights reserved.
Page 59 of 61

8/6/2019 San Angelo ISD - Glenn Middle School - 2009 Texas School Survey of Drug and Alcohol Use
http://slidepdf.com/reader/full/san-angelo-isd-glenn-middle-school-2009-texas-school-survey-of-drug-and 60/61
San Angelo ISD - Glenn Middle School
Spring 2009
DRUG/ALCOHOL
INFO--SCHOOL
GUIDANCE
COUNSELOR
q37c Frequency Percent
No 272 81.74Yes 61 18.26
Frequency Missing = 75.80437747
DRUG/ALCOHOL
INFO--SCIENCE CLASS
q37d Frequency Percent
No 124 37.21
Yes 210 62.79
Frequency Missing = 73.911755599
DRUG/ALCOHOL
INFO--SOCIAL
STUDIES CLASS
q37e Frequency Percent
No 306 91.01
Yes 30 8.99
Frequency Missing = 72.019133729
DRUG/ALCOHOL
INFO--SCHOOL
STUDENT GROUP OR
CLUB
q37f Frequency Percent
No 277 82.73
Yes 58 17.27
Frequency Missing = 72.965444664
DRUG/ALCOHOL
INFO--INVITED
SCHOOL GUEST
q37g Frequency Percent
No 144 48.67
Yes 152 51.33
Frequency Missing = 112.04245883
DRUG/ALCOHOL
INFO--ANOTHER
SCHOOL SOURCE
q37h Frequency Percent
No 189 55.86
Yes 150 44.14
Frequency Missing = 69.065943676
DRUG/ALCOHOL INFO--
WEBSITE/ONLINE CHAT
GROUP
q38a Frequency Percent
No 311 81.67
Yes 70 18.33
Frequency Missing = 27.410764163
DRUG/ALCOHOL INFO--
BOOKS/MAGAZINES/POSTERS/PA
MPHLETS
q38b Frequency
No 229
Yes 147
DRUG/ALCOHOL INFO--BOOKS/MAGAZINES/POSTERS/PA
MPHLETS
q38b Percent
No 60.87
Yes 39.13
Frequency Missing = 31.538779644
DRUG/ALCOHOL INFO--
TV/RADIO/OTHER
AUDIO/VIDEO
q38c Frequency Percent
No 205 54.39
Yes 172 45.61
Frequency Missing = 31.767294137
DRUG/ALCOHOL
INFO--PARENTS
q38d Frequency Percent
No 176 45.72
Yes 209 54.28
Frequency Missing = 23.5112631
PARENTS FEEL ABOUT K
SMOKING CIGAR
q39a Frequency Per
Strong disapprove 332 8
Mild disapprove 19
Neither 12
Mildly approve 3
Strongly approve 1 Don't know 27
Frequency Missing = 13.8196393
PARENTS FEEL ABOUT K
DRINKING BE
q39b Frequency Per
Strong disapprove 277 7
Mild disapprove 46 1
Neither 27
Mildly approve 14 Strongly approve 2
Don't know 24
Frequency Missing = 18.8939657
PARENTS FEEL ABOUT K
USING MARIJUA
q39c Frequency Per
Strong disapprove 329 8
Mild disapprove 8
Neither 20 Mildly approve 2
Strongly approve 4
Don't know 25
Frequency Missing = 19.840276
The frequencies have been weighted so that the analysis reflects
the distribution of students by grade level in the district
©Copyright 2009, Texas A&M University
All rights reserved.
Page 60 of 61

8/6/2019 San Angelo ISD - Glenn Middle School - 2009 Texas School Survey of Drug and Alcohol Use
http://slidepdf.com/reader/full/san-angelo-isd-glenn-middle-school-2009-texas-school-survey-of-drug-and 61/61
San Angelo ISD - Glenn Middle School
Spring 2009
TESTED FOR DRUG
USE AT SCHOOL
q40 Frequency Percent
No 370 95.41
Yes 18 4.59
Frequency Missing = 19.84027668
PURCHASED
LOTTERY TICKET IN
PAST YEAR
q41 Frequency Percent
No 339 87.41
Yes 49 12.59
Frequency Missing = 20.672330369