SAMS Acceleration Measurements on Mir from May 1997 … · SAMS ACCELERATION MEASUREMENTS ON MIR...
36
Richard DeLombard Glenn Research Center, Cleveland, Ohio SAMS Acceleration Measurements on Mir from May 1997 to June 1998 (NASA Increments 5, 6, and 7) NASA/TM—1999-209282 August 1999 https://ntrs.nasa.gov/search.jsp?R=20000037797 2018-09-30T05:05:45+00:00Z
Transcript of SAMS Acceleration Measurements on Mir from May 1997 … · SAMS ACCELERATION MEASUREMENTS ON MIR...

Richard DeLombardGlenn Research Center, Cleveland, Ohio
SAMS Acceleration Measurements on Mirfrom May 1997 to June 1998(NASA Increments 5, 6, and 7)
NASA/TM—1999-209282
August 1999
https://ntrs.nasa.gov/search.jsp?R=20000037797 2018-09-30T05:05:45+00:00Z
The NASA STI Program Office . . . in Profile
Since its founding, NASA has been dedicated tothe advancement of aeronautics and spacescience. The NASA Scientific and TechnicalInformation (STI) Program Office plays a key partin helping NASA maintain this important role.
The NASA STI Program Office is operated byLangley Research Center, the Lead Center forNASA’s scientific and technical information. TheNASA STI Program Office provides access to theNASA STI Database, the largest collection ofaeronautical and space science STI in the world.The Program Office is also NASA’s institutionalmechanism for disseminating the results of itsresearch and development activities. These resultsare published by NASA in the NASA STI ReportSeries, which includes the following report types:
• TECHNICAL PUBLICATION. Reports ofcompleted research or a major significantphase of research that present the results ofNASA programs and include extensive dataor theoretical analysis. Includes compilationsof significant scientific and technical data andinformation deemed to be of continuingreference value. NASA’s counterpart of peer-reviewed formal professional papers buthas less stringent limitations on manuscriptlength and extent of graphic presentations.
• TECHNICAL MEMORANDUM. Scientificand technical findings that are preliminary orof specialized interest, e.g., quick releasereports, working papers, and bibliographiesthat contain minimal annotation. Does notcontain extensive analysis.
• CONTRACTOR REPORT. Scientific andtechnical findings by NASA-sponsoredcontractors and grantees.
• CONFERENCE PUBLICATION. Collectedpapers from scientific and technicalconferences, symposia, seminars, or othermeetings sponsored or cosponsored byNASA.
• SPECIAL PUBLICATION. Scientific,technical, or historical information fromNASA programs, projects, and missions,often concerned with subjects havingsubstantial public interest.
• TECHNICAL TRANSLATION. English-language translations of foreign scientificand technical material pertinent to NASA’smission.
Specialized services that complement the STIProgram Office’s diverse offerings includecreating custom thesauri, building customizeddata bases, organizing and publishing researchresults . . . even providing videos.
For more information about the NASA STIProgram Office, see the following:
• Access the NASA STI Program Home Pageat http://www.sti.nasa.gov
• E-mail your question via the Internet [email protected]
• Fax your question to the NASA AccessHelp Desk at (301) 621-0134
• Telephone the NASA Access Help Desk at(301) 621-0390
• Write to: NASA Access Help Desk NASA Center for AeroSpace Information 7121 Standard Drive Hanover, MD 21076
NASA/TM—1999-209282
August 1999
National Aeronautics andSpace Administration
Glenn Research Center
Richard DeLombardGlenn Research Center, Cleveland, Ohio
SAMS Acceleration Measurements on Mirfrom May 1997 to June 1998(NASA Increments 5, 6, and 7)
Available from
NASA Center for Aerospace Information7121 Standard DriveHanover, MD 21076Price Code: A03
National Technical Information Service5285 Port Royal RoadSpringfield, VA 22100
Price Code: A03
This report contains preliminaryfindings, subject to revision as
analysis proceeds.
SAMS Acceleration Measurements on Mir from May 1997 toJune 1998 (NASA Increments 5, 6, and 7)
June 18, 1999
Richard DeLombardNASA Glenn Research Center
Cleveland, Ohio

SAMS ACCELERATION MEASUREMENTS ON MIR FROM MAY 1997 TO JUNE 1998
i
Abstract
During NASA Increments 5, 6, and 7 (May 1997 to June 1998), about eight gigabytes of accelerationdata were collected by the Space Acceleration Measurement System (SAMS) onboard the Russian SpaceStation Mir. The data were recorded on twenty-seven optical disks which were returned to Earth onOrbiter missions STS-86, STS-89, and STS-91. During these increments, SAMS data were collected inthe Priroda module to support various microgravity experiments. This report points out some of thesalient features of the microgravity acceleration environment to which the experiments were exposed.This report presents an overview of the SAMS acceleration measurements recorded by 10 Hz and 100Hz sensor heads. The analyses included herein complement those presented in previous Mir incrementsummary reports prepared by the Principal Investigator Microgravity Services project.

SAMS ACCELERATION MEASUREMENTS ON MIR FROM MAY 1997 TO JUNE 1998
ii
Acronyms and Abbreviations
DMT Decreed Moscow Time (year/day/hour:minute:second)f
ccutoff frequency (Hertz)
fs
sampling rate (samples per second)ftp file transfer protocolg acceleration level referenced to g
o
go
acceleration due to Earth's gravity (9.81 m/s2)GRC NASA John H. Glenn Research CenterHz Hertzµg microgravity (1/1,000,000 of g
o)
MIM Microgravity Isolation MountMiPS Mir Payload SupportMiSDE Mir Structural Dynamics ExperimentPDF portable document formatPIMS Principal Investigator Microgravity ServicesPSD power spectral densityQUELD Queen's University Experiments in Liquid DiffusionRMS root-mean-squareSAMS Space Acceleration Measurement SystemSTS Space Transportation SystemTSH triaxial sensor headURL uniform resource locatorWWW World Wide WebX
h, Y
h, Z
hX-, Y-, Z-Axis coordinate system for unspecified SAMS sensor head
Xh,A
, Yh,A
, Zh,A
X-, Y-, Z-Axis coordinate system for SAMS TSH AX
h,B, Y
h,B, Z
h,BX-, Y-, Z-Axis coordinate system for SAMS TSH B
XB, Y
B, Z
BX-, Y-, Z-Axis coordinate system for Mir Base Block
SAMS ACCELERATION MEASUREMENTS ON MIR FROM MAY 1997 TO JUNE 1998
iii
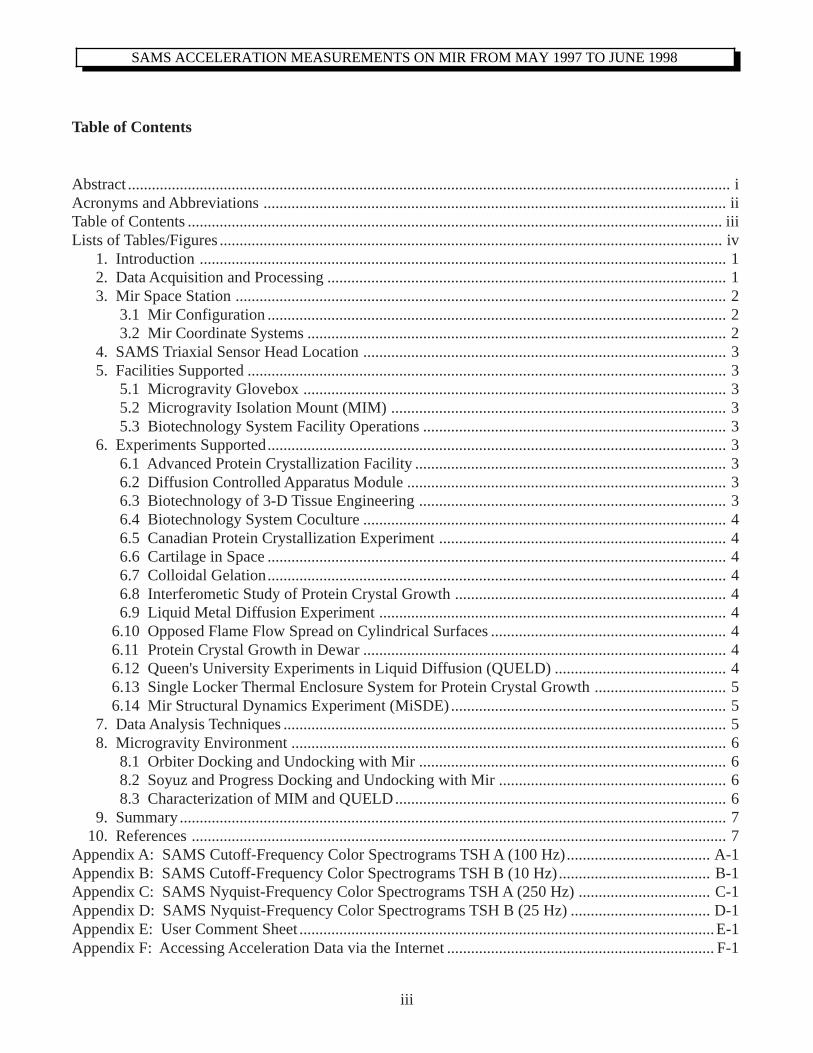
Table of Contents
Abstract ....................................................................................................................................................... iAcronyms and Abbreviations .................................................................................................................... iiTable of Contents ...................................................................................................................................... iiiLists of Tables/Figures .............................................................................................................................. iv
1. Introduction .................................................................................................................................... 12. Data Acquisition and Processing .................................................................................................... 13. Mir Space Station ........................................................................................................................... 2
3.1 Mir Configuration ................................................................................................................... 23.2 Mir Coordinate Systems ......................................................................................................... 2
4. SAMS Triaxial Sensor Head Location ........................................................................................... 35. Facilities Supported ........................................................................................................................ 3
5.1 Microgravity Glovebox .......................................................................................................... 35.2 Microgravity Isolation Mount (MIM) .................................................................................... 35.3 Biotechnology System Facility Operations ............................................................................ 3
6. Experiments Supported................................................................................................................... 36.1 Advanced Protein Crystallization Facility .............................................................................. 36.2 Diffusion Controlled Apparatus Module ................................................................................ 36.3 Biotechnology of 3-D Tissue Engineering ............................................................................. 36.4 Biotechnology System Coculture ........................................................................................... 46.5 Canadian Protein Crystallization Experiment ........................................................................ 46.6 Cartilage in Space ................................................................................................................... 46.7 Colloidal Gelation................................................................................................................... 46.8 Interferometic Study of Protein Crystal Growth .................................................................... 46.9 Liquid Metal Diffusion Experiment ....................................................................................... 4
6.10 Opposed Flame Flow Spread on Cylindrical Surfaces ........................................................... 4 6.11 Protein Crystal Growth in Dewar ........................................................................................... 4 6.12 Queen's University Experiments in Liquid Diffusion (QUELD) ........................................... 4 6.13 Single Locker Thermal Enclosure System for Protein Crystal Growth ................................. 5 6.14 Mir Structural Dynamics Experiment (MiSDE)..................................................................... 57. Data Analysis Techniques ............................................................................................................... 58. Microgravity Environment ............................................................................................................. 6
8.1 Orbiter Docking and Undocking with Mir ............................................................................. 68.2 Soyuz and Progress Docking and Undocking with Mir ......................................................... 68.3 Characterization of MIM and QUELD................................................................................... 6
9. Summary......................................................................................................................................... 7 10. References ...................................................................................................................................... 7Appendix A: SAMS Cutoff-Frequency Color Spectrograms TSH A (100 Hz).................................... A-1Appendix B: SAMS Cutoff-Frequency Color Spectrograms TSH B (10 Hz)...................................... B-1Appendix C: SAMS Nyquist-Frequency Color Spectrograms TSH A (250 Hz) ................................. C-1Appendix D: SAMS Nyquist-Frequency Color Spectrograms TSH B (25 Hz) ................................... D-1Appendix E: User Comment Sheet ........................................................................................................E-1Appendix F: Accessing Acceleration Data via the Internet ................................................................... F-1

SAMS ACCELERATION MEASUREMENTS ON MIR FROM MAY 1997 TO JUNE 1998
iv
List of Tables
Table 1. Comparison of Orbiter docking and undocking time sources ................................................. 9Table 2. Tabular representation of Mir module orientations .................................................................9Table 3. Active microgravity experiments during NASA Increments 5, 6, and 7 ............................... 10Table 4. MIM/QUELD Characterization Test Conducted on Mir ........................................................11
List of Figures
Figure 1. Mir activities and SAMS recording times during 1997 ........................................................ 12Figure 2. Mir activities and SAMS recording times during 1998 ........................................................ 13Figure 3. Typical Mir crew daily activities ........................................................................................... 13Figure 4. Mir core module coordinate system and module orientation ................................................ 14Figure 5. Mir coordinate systems ......................................................................................................... 15Figure 6. MIM characterization test (first hour) ................................................................................... 16Figure 7. MIM characterization test (second hour) .............................................................................. 17Figure 8. MIM characterization test (third hour) .................................................................................. 18Figure 9. MIM characterization test (fourth hour) ............................................................................... 19Figure 10. Power spectral density plot before MIM operations ............................................................. 20Figure 11. Power spectral density plot during MIM operations ............................................................. 21

SAMS ACCELERATION MEASUREMENTS ON MIR FROM MAY 1997 TO JUNE 1998
1
1. Introduction
The NASA Headquarters Microgravity Research Division sponsors microgravity science experiments onseveral carriers, which include the NASA Shuttle Orbiters and the Mir Space Station. The MicrogravityResearch Division sponsors the Space Acceleration Measurement System (SAMS) at the NASA GlennResearch Center (GRC) to support microgravity experiments with acceleration measurements. TheGRC Principal Investigator Microgravity Services (PIMS) project supplies principal investigators ofmicrogravity science experiments and other experiment personnel with analysis of acceleration data tosupport the evaluation of the effects of microgravity on their experiments. PIMS also providesinformation about on-orbit events such as equipment operation to assist in the scheduling ofmicrogravity science experiment operations.
In 1994, a SAMS unit [1] was installed on the Mir Space Station [2] to support U.S. and Russianmicrogravity experiments by measuring the microgravity environment during experiment operations.Previous reports [3-9] by PIMS have summarized and evaluated the SAMS data acquired during theperiod from September 1994 to May 1997. This report summarizes the SAMS data during NASAIncrement 5 (May to October 1997), Increment 6 (October 1997 to January 1998), and Increment 7(January to June 1998).
Data were recorded to support experiment and to characterize microgravity environment. The eventsdescribed in this report include the characterization of disturbances due to the MIM facility and theQUELD furnace.
Appendices A and B contain cutoff-frequency spectrograms of the data from the two SAMS sensorheads; appendices C and D contain Nyquist-frequency spectrograms of the data from the two SAMSsensor heads. The data plots in appendices A through D are viewable from the attached CD-ROM.Appendix E contains a user comment sheet, which users are encouraged to complete and return to PIMS.Appendix F describes the procedures that users should follow to access SAMS data over the internet viaanonymous file transfer protocol (ftp).
This entire report is also viewable from the attached CD-ROM and is available on the World Wide Web(WWW) in the portable document format (PDF). Adobe Acrobat Reader® version 3.0 or higher will benecessary to open and/or print these files. A current version of Adobe Acrobat Reader® is included onthe CD-ROM.
2. Data Acquisition and Processing
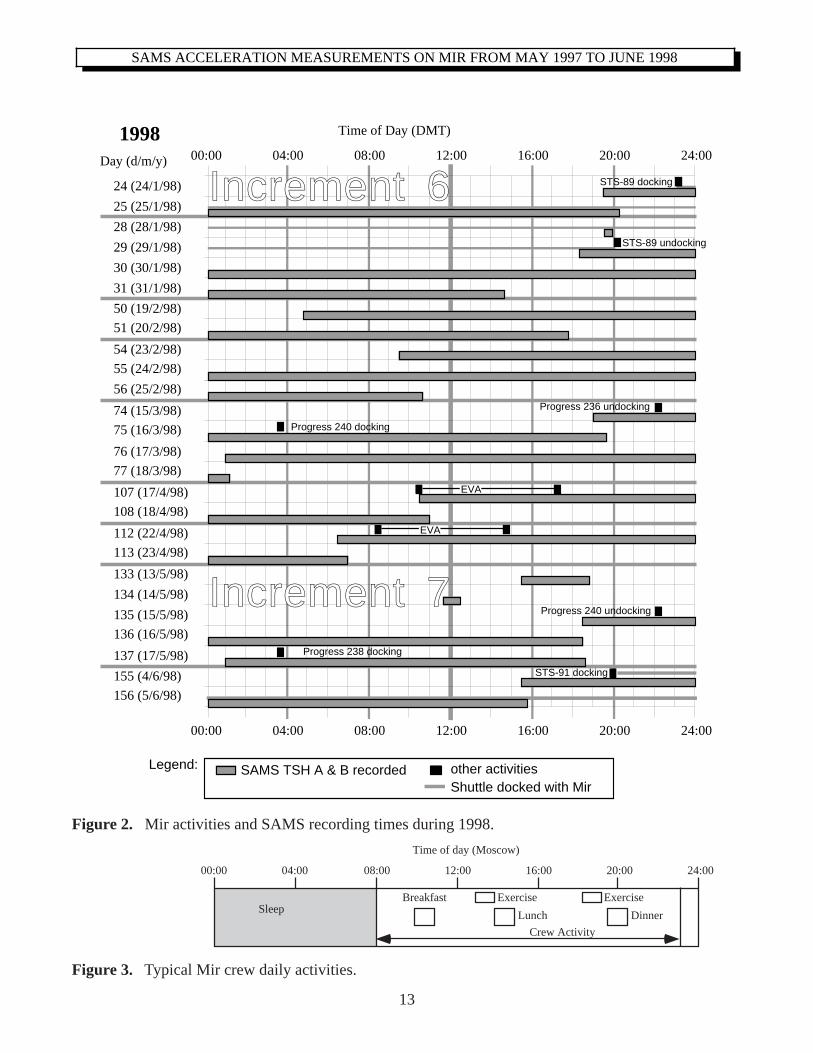
As noted in previous reports [3-9], the SAMS unit on Mir is connected to two triaxial sensor heads(TSHs). TSH A had a cutoff frequency of 100 Hz and a sampling rate of 500 samples per second. TSHB had a cutoff frequency of 10 Hz and a sampling rate of 50 samples per second. During increments 5,6, and 7, the SAMS unit was turned on periodically to record microgravity accelerations in support ofthe various experiments and other significant events. SAMS data coverage for this time period issummarized in Figures 1 and 2. Figure 3 shows the normal daily activities on the Mir. The time used onMir is Decreed Moscow Time (DMT).

SAMS ACCELERATION MEASUREMENTS ON MIR FROM MAY 1997 TO JUNE 1998
2
The time assigned to the post-mission SAMS data is derived from several possible sources. The primarysource is the time encoded in the data files by the SAMS unit when it had been properly synchronizedwith the Mir Payload Support (MiPS) equipment on-board Mir. Lacking proper synchronization, thetime in the post-mission SAMS data was assigned based on the crew member's notations. In some casesthe time is assigned after correlation with mission events such as vehicle docking. Differences in timehave been found in some of the SAMS data files, so caution should be used for specific correlation ofSAMS data to experiment operations and results. Table 1 summarizes the six Orbiter and sevenProgress docking and undocking events during this time period. There were two Orbiter events forwhich there are major differences between the time as reported by NASA Johnson Space Center and thatshown in the SAMS data. The reasons for these differences are not known at the present time.Problems with the synchronization with MiPS are suspected.
Five optical data disks were returned to Earth on STS-86 with six of the sides having valid data. Fourdisks were returned on STS-89 with five of the sides having valid data. Eighteen disks were returned onSTS-91 with twenty-nine of the sides having valid data. The SAMS unit was also returned to Earth onSTS-91 and is slated for transfer to the Smithsonian's National Air and Space Museum. These data wereprocessed by the SAMS project at GRC and placed on a NASA GRC file server (beech.grc.nasa.gov) tomake them available to users. Appendix F of this report provides instructions for accessing these datafiles.
3. Mir Space Station
3.1 Mir Configuration
The Mir has been in orbit since February 1986 and, in the years since, modules have been added untilthe Mir reached its present configuration of six modules. The Mir currently consists of the Base Block,Kvant, Kvant-2, Kristall, Spektr, and Priroda modules. It measures more than 32 meters in length withthe docked Progress-M and the Soyuz-TM spacecraft and is about 27 meters in width across themodules. Figure 4 shows a typical configuration of the Mir Space Station with a docked NASA Orbiterduring the time covered by this report.
3.2 Mir Coordinate Systems
The Mir Space Station's basic coordinate system is that of the Base Block module coordinate systemwhich is shown in Figure 4. Each of the modules of the Mir station has its own coordinate system,which is based upon its orientation with respect to the Mir Base Block module. Figure 5 shows agraphical representation of these coordinate systems for the nominal Mir configuration (consistent withthat shown in Figure 4). Table 2 is a tabular representation of Figure 4.

SAMS ACCELERATION MEASUREMENTS ON MIR FROM MAY 1997 TO JUNE 1998
3
The determination of the coordinate system is made by a simple procedure. If you "stand" in anymodule, such that your feet are on the floor, and you are facing towards the transitional node of the BaseBlock module, then the coordinate system of that module is defined by the right hand rule, such that thedirection you are facing is +X module, the direction from your feet to your head is +Y module, and thedirection from your left to right is +Z module.
4. SAMS Triaxial Sensor Head Locations
The TSHs were located in the Priroda module during NASA Increments 5, 6, and 7.
5. Facilities Supported
Additional information on these facilities may be obtained from [10].
5.1 Microgravity Glovebox
The glovebox facility was used to conduct experiments associated with combustion experiments andhazardous operations which need to be isolated from the Mir living environment.
5.2 Microgravity Isolation Mount (MIM)
The MIM was used to isolate some experiments from the vibrations and accelerations of the Mir spacestation.
5.3 Biotechnology System Facility Operations
This facility was designed to house biotechnology experiments such as tissue culture and protein crystalgrowth.
6. Experiments Supported
The SAMS unit supported experiments listed in Table 3. Additional information on these experimentsmay be obtained from [10].
6.1 Advanced Protein Crystallization Facility
Investigators grew large well-ordered protein crystals for later characterization in ground laboratories.
6.2 Diffusion Controlled Apparatus Module
Scientists grew protein crystals in space and evaluated the dialysis and liquid/liquid diffusion methods ofcrystal growth.

SAMS ACCELERATION MEASUREMENTS ON MIR FROM MAY 1997 TO JUNE 1998
4
6.3 Biochemistry of 3-D Tissue Engineering
Scientists characterized tissue biochemical properties as a result of three-dimensional tissue formation inmicrogravity.
6.4 Biotechnology System Coculture
This experiment studied the growth and maintenance of cell cultures and investigated the long-termeffect of on-orbit cell growth for the purpose of tissue engineering.
6.5 Canadian Protein Crystallization Experiment
This experiment analyzed the crystalline structure of approximately thirty-two clinically importantproteins in microgravity. Scientists will apply these analyses towards the enhancement of currentmethodologies used in the drug development and design process.
6.6 Cartilage in Space
Cartilage cells were grown in microgravity to facilitate the study of basic cell interactions devoid ofsedimentation.
6.7 Colloidal Gelation
This experiment studied the limitations of the amount of polymer-induced aggregation in microgravity.
6.8 Interferometic Study of Protein Crystal Growth
Protein crystals were grown in microgravity to enable the study of solute concentration gradients incrystal solutions.
6.9 Liquid Metal Diffusion Experiment
This experiment studied diffusion coefficients in liquid metals. Scientists also attempted to prevent anyvoid/bubble formation in liquid metal diffusion samples in microgravity. This experiment wasconducted with the Liquid Metal Diffusion apparatus in the MIM facility.
6.10 Opposed Flame Flow Spread on Cylindrical Surfaces
This experiment studied how the microgravity environment affected the spread of flames in the presenceof an opposing oxidizer.

SAMS ACCELERATION MEASUREMENTS ON MIR FROM MAY 1997 TO JUNE 1998
5
6.11 Protein Crystal Growth in Dewar
Investigators studied protein crystal growth in microgravity and evaluated flash-frozen and liquid/ liquiddiffusion methods.
6.12 Queen's University Experiments in Liquid Diffusion (QUELD)
This experiment collected data on diffusion coefficients in the melt of metal alloy systems devoid ofgravitational effects. This experiment was conducted with the QUELD apparatus in the MIM facility.
6.13 Single Locker Thermal Enclosure System for Protein Crystal Growth
The experiment was to produce large, high-quality crystals of selected proteins under controlledtemperature conditions in microgravity.
6.14 Mir Structural Dynamics Experiment (MiSDE)
Investigators used this experiment to obtain structural dynamic response data on the Mir and Mir/Orbiterin a mated configuration during normal operational events such as docking, Orbiter and Mir thruster jetfirings, crew exercise, and other crew activities. A final report [11] has been written for MiSDE.Although this is not a microgravity science experiment, it utilized the SAMS acceleration data tosupplement the MiSDE accelerometer data.
7. Data Analysis Techniques
SAMS data are generally presented and plotted in several forms for evaluation: acceleration versus time,interval average acceleration versus time, root-mean-square (RMS) average acceleration versus time,power spectral density (PSD) versus frequency, and spectrogram (PSD versus frequency versus time).The form used depends on what aspect of the data is of interest. These techniques are described in detailin [12].
Acceleration versus time plots are used to display the acceleration levels recorded by the SAMS sensorhead. These plots can then be used by experiment personnel to correlate experiment results with themeasured microgravity environment. This form of data display gives the most time-accuraterepresentation of the microgravity environment.
A plot of the interval average acceleration in units of acceleration versus time gives an indication of netaccelerations which last for a number of seconds equal to or greater than the interval parameter. Shorterduration, high amplitude accelerations can also be detected with this type of plot, however, the exacttiming and magnitude of specific acceleration events cannot be extracted. A plot of the interval root-mean-square acceleration in units of acceleration versus time gives an indication of the time-averagedpower in the signal due to oscillatory acceleration sources.

SAMS ACCELERATION MEASUREMENTS ON MIR FROM MAY 1997 TO JUNE 1998
6
PSD calculations and plots are used to examine and display the frequency content of SAMS data duringrelatively short periods of time (on the order of seconds to minutes). Analysis times may be chosenbased upon some specific event or experiment operation. For SAMS data, the PSD units are g2/Hz.Spectrograms are 3-dimensional plots, but, as presented here, the third dimension is color, so all the datacan be presented as a 2-dimensional image. Spectrograms can be used to evaluate how the microgravityenvironment varies in intensity with respect to both the time and frequency domains.
8. Microgravity Environment
Many features of the Mir microgravity environment have been described in previous reports [3-9] andwill not be described again here.
8.1 Orbiter Docking and Undocking with Mir
Four Orbiter missions conducted docked operations with Mir during increments 5, 6, and 7. The datesand times [13] [14] of Orbiter docking and undocking activities are listed in Table 1.
8.2 Soyuz and Progress Docking and Undocking with Mir
There were several Soyuz and Progress vehicles docking to and undocking from Mir during this timeinterval. The dates and times [13, 14] of these vehicle docking activities which coincided with SAMSdata acquisition periods are listed in Table 1.
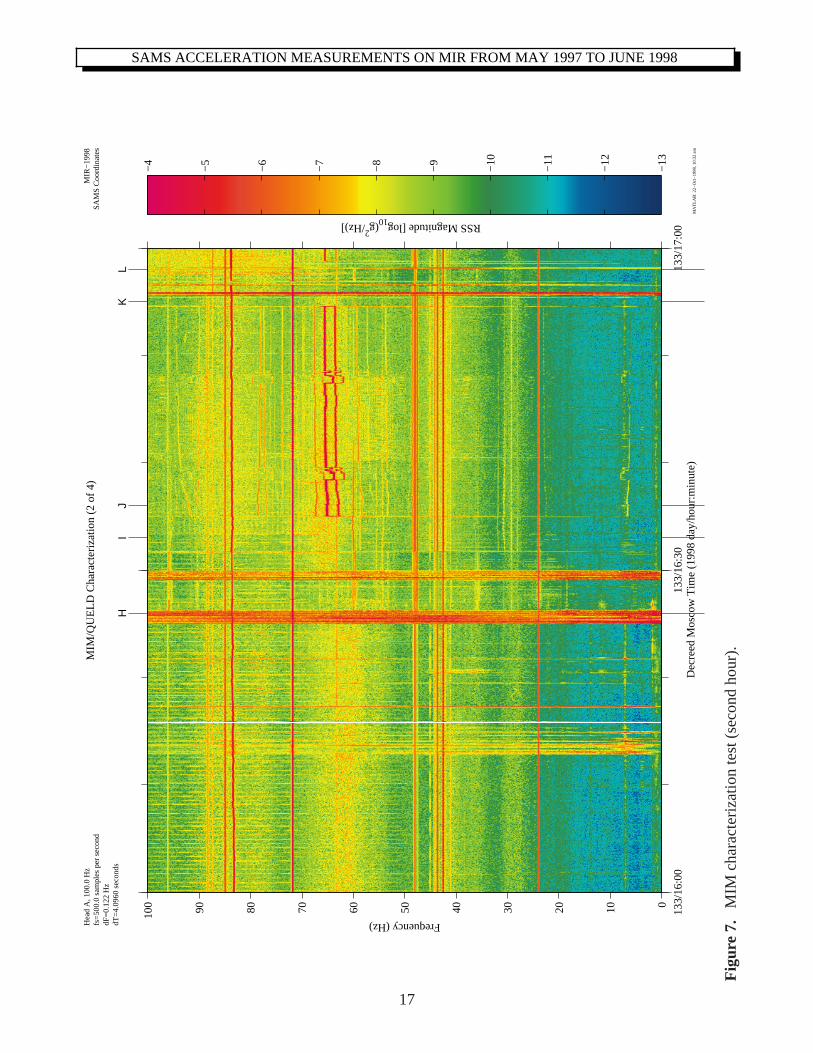
8.3 Characterization of MIM and QUELD
Analysis of SAMS data from earlier increments led PIMS to the conclusion that the MIM and/orQUELD were causing a noticeable disturbance to the microgravity environment. A test of MIM andQUELD operations was developed by PIMS to investigate possible disturbances to the environment andwas conducted on 13-14 May 1998. The sequence of steps taken on 13 May is summarized in Table 4.The tags listed in this table correspond to the tags in the data plots shown in Figures 6 - 9. The CanadianSpace Agency [15] provided information which describes the significant actions during MIM andQUELD operations.
A correlation may be seen between the operation of certain equipment and the features in the SAMSdata. In particular, the 84 Hz trace appears to be correlated with the MIM cooling fans; the 71 Hz traceappears to be correlated with the MIM hard disk rotation; and the multiple traces around 65 Hz appear tobe correlated with fans on the QUELD apparatus. The characteristic pattern involving multiplefrequencies from 60 to 100 Hz appears to be correlated with MIM data recording.
The effect of the general broad band noise from the MIM may be seen in the power spectral densityplots of Figure 10 before MIM was active and Figure 11 during MIM operations. When the MIM isactive, higher levels are seen above 55 Hz.
SAMS ACCELERATION MEASUREMENTS ON MIR FROM MAY 1997 TO JUNE 1998
7
It should be noted that the timing of these activities was derived from Andy Thomas' logbook and were(for the most part) given in terms of minutes not seconds. This makes the accuracy of these times to beplus or minus a minute or two which results in the tags not being precisely aligned with the features inthe data plots.
9. Summary
This report presents a summary of the SAMS data recorded on the Mir Space Station during NASAIncrements 5, 6, and 7 from May 1997 to June 1998. During that time, the SAMS supported variousmicrogravity science experiments. The general environment was similar to the environment of theprevious increments. Data during the operation of the MIM and the QUELD were also analyzed tocharacterize the effects of that equipment on the microgravity environment.
10. References
References indicated with an asterisk may be found on the World Wide Web from the PIMS page atuniform resource location (URL):
http://www.grc.nasa.gov/WWW/MMAP/PIMS/HTMLS/reportlist.html
[1] DeLombard, R. and Finley, B. D.: Space Acceleration Measurement System Description andOperation on the First Spacelab Life Sciences Mission. NASA TM-105301, 1991.
[2] WWW page at URL:http://www.hq.nasa.gov/osf/mir/mirguide.html
[3] * DeLombard, R. and M. J. B. Rogers: Quick Look Report of Acceleration Measurements on MirSpace Station during Mir-16. NASA TM-106835, 1995.
[4] DeLombard, R., S. B. Ryaboukha, M. Moskowitz, K. Hrovat: Further Analysis of theMicrogravity Environment on Mir Space Station during Mir-16. NASA TM-107239, June 1996.
[5] * DeLombard, R., K. Hrovat, M. Moskowitz, and K. McPherson: SAMS AccelerationMeasurements on Mir from June to November 1995. NASA TM-107312, September 1996.
[6] DeLombard, R.: SAMS Acceleration Measurements on Mir from November 1995 to March1996. NASA TM-107435, April 1997.
[7] Truong, D., M. Moskowitz, K. Hrovat, and T. Reckart: SAMS Acceleration Measurements onMir from March to September 1996. NASA TM-107524, August 1997.

SAMS ACCELERATION MEASUREMENTS ON MIR FROM MAY 1997 TO JUNE 1998
9
JSC-WWW POSA Reports SAMS Data DELTA
EVENT DMT
(year/day/hour:min )
DMT
(year/day/hour:min )
DMT
(year/day/hour:min)
WWW-S A M S
(hour:min)
STS-84 undocking 1997/142/04:04 1997/142/04:04 00:00
Progress M-34
Undocking
1997/175/13:20
STS-86 docking 1997/270/22:58 1997/271/18:30 20:32
STS-86 undocking 1997/276/20:28 1997/276/20:28 00:00
Progress 235
Docking
1997/280/15:03
Progress 237
Docking
1997/281/20:08
STS-89 docking 1998/024/23:14 1998/024/23:14 00:00
STS-89 undocking 1998/029/19:57 1998/029/18:42 01:15
Progress 236
Undocking
1998/74/22:15
Progress 240
Docking
1998/76/03:31
Progress 240
Undocking
1998/135/21:44
Progress 238
Docking
Not available 1998/137/02:55
STS-91 docking 1998/155/19:58 1998/155/20:00 -00:02
Base Kristall Kvant Kvant-2 Priroda Spektr
+XB +ZKristall -XKvant +YKvant-2 -ZPriroda -YSpektr
+YB -Y +Y -X -Y +X
+ZB +X -Z +Z -X +Z
Table 1: Comparison of Orbiter docking and undocking time sources.
Table 2: Tabular representation of Mir module orientations.

SAMS ACCELERATION MEASUREMENTS ON MIR FROM MAY 1997 TO JUNE 1998
10
EXPERIMENT TITLE INCREMENT
Advanced Protein Crystallization Facility 7
Ambient Diffusion Controlled Protein Crystal Growth 5, 6
Biochemistry of 3-D Tissue Engineering 5
Biotechnology System Coculture 7
Biotechnology System Facility Operations 5
Canadian Protein Crystallization Experiment 6
Cartilage in Space 7
Colloidal Gelation 5
Interferometic Study of Protein Crystal Growth 6
Liquid Metal Diffusion Experiment 6
Microgravity Glovebox Facility Operations 5
Microgravity Isolation Mount Facility Operations Experiment 5, 6, 7
Mir Structural Dynamics Experiment 5, 6, 7
Opposed Flame Flow Spread on Cylindrical Surfaces 5
Protein Crystal Growth in Dewar 5, 6, 7
Queen's University Experiment in Liquid Diffusion 5, 6, 7
Single Locker Thermal Enclosure System for Protein Crystal Growth 6, 7
Table 3: Active microgravity experiments during NASA Increments 5, 6, and 7.

SAMS ACCELERATION MEASUREMENTS ON MIR FROM MAY 1997 TO JUNE 1998
11
Figure Tag Hour:Min(DMT) Description
First one hour spectrogram (Figure 6)
A 15.23 MIM S3 & S4 ON
B 15:37 MIM S4 OFF
C 15:44 MIM S1 ON
D 15:49 MIM S2 ON
E 15:50 Data storing ON
F 15:53 MIM S3 ON, QUELD S1 ON
G 15:58 Data storing OFF
Second one hour spectrogram (Figure 7)
H 16:26 Flotor unlatched
I 16:33 Data storing ON
J 16:36 QUELD RUN pressed
K 16:55 MIM S3 OFF
L 16:58 MIM S3 & S4 ON
Third one hour spectrogram (Figure 8)
M 17:03 MIM S3 & S4 OFF
N 17:03 Data storing OFF
O 17:04 MIM S2 & S1 OFF
P 17:17 MIM S1 ON
Q 17:20 MIM S2 ON
R 17:28 Data storing ON
S 17:33 Data storing OFF
T 17:53 Data storing ON
Fourth one hour spectrogram (Figure 9)
U 18:03 Data storing OFF
V 18:03 MIM S2 & S1 OFF
W 18:05 MIM S1 ON
X 18:08 MIM S2 ON
Y 18:09 Data storing ON
Z 18:11 Data storing ON
AA 18:16 Data storing OFF
AB 18:22 Data storing ON
AC 18:33 Data storing OFF
Table 4: MIM/QUELD Characterization Test Conducted on Mir.

SAMS ACCELERATION MEASUREMENTS ON MIR FROM MAY 1997 TO JUNE 1998
12
156 (5/6/97)157 (6/6/97)
161 (10/6/97)
171 (20/6/97)
174 (23/6/97)
175 (24/6/97)
270 (27/9/97)
271 (28/9/97)
274 (1/10/97)
276 (3/10/97)
279 (6/10/97)
280 (7/10/97)
281 (8/10/97)
339 (5/12/97)
342 (8/12/97)
344 (10/12/97)
00:00 04:00 08:00 12:00 16:00 20:00 24:00
Time of Day (DMT)
00:00 04:00 08:00 12:00 16:00 20:00 24:00
Legend: SAMS TSH A & B recordedShuttle docked with Mirother activities
141 (21/5/97)
Day (d/m/y)
142 (22/5/97)
STS-86 undocking
1997
STS-84 undocking
Progress 235 undocking
Progress 237 docking
Progress M-34 undocking
STS-86 docking
Increment 5
Increment 6
Figure 1. Mir activities and SAMS recording times during 1997.
SAMS ACCELERATION MEASUREMENTS ON MIR FROM MAY 1997 TO JUNE 1998
13
Figure 3. Typical Mir crew daily activities.
Figure 2. Mir activities and SAMS recording times during 1998.
Day (d/m/y)
28 (28/1/98)
29 (29/1/98)
00:00 04:00 08:00 12:00 16:00 20:00 24:00
Time of Day (DMT)
00:00 04:00 08:00 12:00 16:00 20:00 24:00
Legend: SAMS TSH A & B recordedShuttle docked with Mirother activities
25 (25/1/98)
50 (19/2/98)
54 (23/2/98)
74 (15/3/98)
76 (17/3/98)
107 (17/4/98)
112 (22/4/98)
133 (13/5/98)
134 (14/5/98)
135 (15/5/98)
137 (17/5/98)
155 (4/6/98)
30 (30/1/98)
31 (31/1/98)
51 (20/2/98)
156 (5/6/98)
136 (16/5/98)
113 (23/4/98)
108 (18/4/98)
77 (18/3/98)
75 (16/3/98)
55 (24/2/98)
56 (25/2/98)
Increment 6
Increment 7
24 (24/1/98)
STS-91 docking
Progress 236 undocking
Progress 240 docking
EVA
STS-89 docking
STS-89 undocking
EVA
Progress 240 undocking
Progress 238 docking
1998
00:00 04:00 08:00 12:00 16:00 20:00 24:00
Breakfast Exercise Exercise
Lunch Dinner
Crew Activity
Sleep
Time of day (Moscow)

SAMS ACCELERATION MEASUREMENTS ON MIR FROM MAY 1997 TO JUNE 1998
14
+X
+Y
-Z
-X
+Z
-Y
1) U.S. Space Shuttle 2) Orbital Docking System 3) Kristall module: materials processing 4) Kvant II module: scientific 5) Soyuz transport vehicle 6) Spektr module: geophysical sciences 7) Priroda Module: Earth remote sensing 8) Core module: habitation, power, life support 9) Kvant module: astrophysics10) Progress vehicle
Figure 4. Mir core module coordinate system and module orientation.

SAMS ACCELERATION MEASUREMENTS ON MIR FROM MAY 1997 TO JUNE 1998
15
ZKristall
XKristall
YKristall
YSoyuz
ZSoyuz
ZSpektr
YSpektrXSpektr
ZPriroda
XPriroda
YPriroda
XB
ZB
YB
XKvant-2
ZKvant-2
YKvant-2
ZKvant
XKvant
YKvant
YProgress
ZProgress
Mir Core Module
Figure 5. Mir coordinate systems.

SAMS ACCELERATION MEASUREMENTS ON MIR FROM MAY 1997 TO JUNE 1998
16
−13
−12
−11
−10
−9
−8
−7
−6
−5
−4
RSS Magnitude [log10(g2/Hz)]
Hea
d A
, 100
.0 H
zfs
=50
0.0
sam
ples
per
sec
ond
dF=
0.12
2 H
zdT
=4.
0960
sec
onds
MIR
−19
98S
AM
S C
oord
inat
es
MA
TLA
B: 2
2−O
ct−
1998
, 09:
06 a
m
133/
15:0
0
13
3/15
:30
133/
16:0
0
0102030405060708090100
Dec
reed
Mos
cow
Tim
e (1
998
day/
hour
:min
ute)
Frequency (Hz)
MIM
/QU
ELD
Cha
ract
eriz
atio
n (1
of 4
)
AB
CD
EF
G
Fig
ure
6.
MIM
cha
ract
eriz
atio
n te
st (
first
hou
r).
SAMS ACCELERATION MEASUREMENTS ON MIR FROM MAY 1997 TO JUNE 1998
17
−13
−12
−11
−10
−9
−8
−7
−6
−5
−4
RSS Magnitude [log10(g2/Hz)]
Hea
d A
, 100
.0 H
zfs
=50
0.0
sam
ples
per
sec
ond
dF=
0.12
2 H
zdT
=4.
0960
sec
onds
MIR
−19
98S
AM
S C
oord
inat
es
MA
TLA
B: 2
2−O
ct−
1998
, 10:
32 a
m
133/
16:0
0
13
3/16
:30
133/
17:0
0
0102030405060708090100
Dec
reed
Mos
cow
Tim
e (1
998
day/
hour
:min
ute)
Frequency (Hz)
MIM
/QU
ELD
Cha
ract
eriz
atio
n (2
of 4
)
HI
JK
L
Fig
ure
7.
MIM
cha
ract
eriz
atio
n te
st (
seco
nd h
our)
.

SAMS ACCELERATION MEASUREMENTS ON MIR FROM MAY 1997 TO JUNE 1998
18
−13
−12
−11
−10
−9
−8
−7
−6
−5
−4
RSS Magnitude [log10(g2/Hz)]
Hea
d A
, 100
.0 H
zfs
=50
0.0
sam
ples
per
sec
ond
dF=
0.12
2 H
zdT
=4.
0960
sec
onds
MIR
−19
98S
AM
S C
oord
inat
es
MA
TLA
B: 2
2−O
ct−
1998
, 10:
50 a
m
133/
17:0
0
13
3/17
:30
133/
18:0
0
0102030405060708090100
Dec
reed
Mos
cow
Tim
e (1
998
day/
hour
:min
ute)
Frequency (Hz)
MIM
/QU
ELD
Cha
ract
eriz
atio
n (3
of 4
)
M,N
OP
QR
ST
Fig
ure
8.
MIM
cha
ract
eriz
atio
n te
st (
third
hou
r).

SAMS ACCELERATION MEASUREMENTS ON MIR FROM MAY 1997 TO JUNE 1998
19
−13
−12
−11
−10
−9
−8
−7
−6
−5
−4
RSS Magnitude [log10(g2/Hz)]
Hea
d A
, 100
.0 H
zfs
=50
0.0
sam
ples
per
sec
ond
dF=
0.12
2 H
zdT
=4.
0960
sec
onds
MIR
−19
98S
AM
S C
oord
inat
es
MA
TLA
B: 2
2−O
ct−
1998
, 10:
54 a
m
133/
18:0
0
13
3/18
:30
133/
19:0
0
0102030405060708090100
Dec
reed
Mos
cow
Tim
e (1
998
day/
hour
:min
ute)
Frequency (Hz)
MIM
/QU
ELD
Cha
ract
eriz
atio
n (4
of 4
)
U,V
WX
YZ
AA
AB
AC
Fig
ure
9.
MIM
cha
ract
eriz
atio
n te
st (
four
th h
our)
.

SAMS ACCELERATION MEASUREMENTS ON MIR FROM MAY 1997 TO JUNE 1998
20
"Bef
ore
MIM
"D
MT
Sta
rt a
t 133
/17:
45:3
7.85
4 (H
anni
ng, k
=8)
Hea
d A
, 100
.0 H
zfs
=50
0.0
sam
ples
per
sec
ond
df=
0.03
05 H
z
MIR
−19
98S
AM
S C
oord
inat
esT
=26
2.1
seco
nds
MA
TLA
B: 2
1−O
ct−
1998
, 11:
58 a
m
010
2030
4050
6070
8090
100
10−
12
10−
11
10−
10
10−
9
10−
8
10−
7
10−
6
10−
5
10−
4
10−
3
10−
2
Fre
quen
cy (
Hz)
RSS PSD (g2/Hz)
Fig
ure
10.
Pow
er s
pect
ral d
ensi
ty p
lot b
efor
e M
IM o
pera
tions
.

SAMS ACCELERATION MEASUREMENTS ON MIR FROM MAY 1997 TO JUNE 1998
21
"Dur
ing
MIM
"D
MT
Sta
rt a
t 133
/17:
55:2
9.99
9 (H
anni
ng, k
=8)
Hea
d A
, 100
.0 H
zfs
=50
0.0
sam
ples
per
sec
ond
df=
0.03
05 H
z
MIR
−19
98S
AM
S C
oord
inat
esT
=26
2.1
seco
nds
MA
TLA
B: 2
1−O
ct−
1998
, 11:
50 a
m
010
2030
4050
6070
8090
100
10−
12
10−
11
10−
10
10−
9
10−
8
10−
7
10−
6
10−
5
10−
4
10−
3
10−
2
Fre
quen
cy (
Hz)
RSS PSD (g2/Hz)
Fig
ure
11.
Pow
er s
pect
ral d
ensi
ty p
lot d
urin
g M
IM o
pera
tions
.

SAMS ACCELERATION MEASUREMENTS ON MIR FROM MAY 1997 TO JUNE 1998
A-1
Appendix A: SAMS Cutoff-Frequency Color Spectrograms TSH A (100 Hz)
The Principal Investigator Microgravity Services (PIMS) group has further processed SAMS data toproduce the plots shown here. This appendix presents power spectral density versus frequency versustime (spectrogram) plots of SAMS TSH A (f
c =100 Hz) data.
Color spectrograms are used to show how the microgravity environment varies in intensity with respectto time and frequency. These spectrograms are provided as an overview of the frequency characteristicsof the SAMS data. Each spectrogram is a composite of 6 hour's worth of data. The time resolution usedto compute the spectrograms seen here is 16.384 seconds. This corresponds to a frequency resolution of0.0610 Hz.
These data were collected at 500 samples per second, and a 100 Hz low-pass filter was applied to thedata by the SAMS unit prior to digitization. Prior to plot production, the raw SAMS data werecompensated for gain changes, and then de-meaned. De-meaning was accomplished by analyzingindividual sections with a nominal length of 30 minutes. Since this de-meaning operation operates ontime periods longer than the plot's time resolution, an artificial dc component may be seen in the extremelower frequency regime of these spectrograms. Since these are data processing artifacts, the lowfrequency regime (f<0.05 Hz) should be ignored. Users who are interested in further details for either ofthese operations are encouraged to contact the PIMS group.

SAMS ACCELERATION MEASUREMENTS ON MIR FROM MAY 1997 TO JUNE 1998
Appendix B: SAMS Cutoff-Frequency Color Spectrograms TSH B (10 Hz)
The Principal Investigator Microgravity Services (PIMS) group has further processed SAMS data toproduce the plots shown here. This appendix presents power spectral density versus frequency versustime (spectrogram) plots of SAMS TSH B (f
c =10 Hz) data.
Color spectrograms are used to show how the microgravity environment varies in intensity with respectto time and frequency. These spectrograms are provided as an overview of the frequency characteristicsof the SAMS data. Each spectrogram is a composite of 6 hour's worth of data. The time resolution usedto compute the spectrograms seen here is 40.960 seconds. This corresponds to a frequency resolution of0.0244 Hz.
These data were collected at 50 samples per second, and a 10 Hz low-pass filter was applied to the databy the SAMS unit prior to digitization. Prior to plot production, the raw SAMS data were compensatedfor gain changes, and then de-meaned. De-meaning was accomplished by analyzing individual sectionswith a nominal length of 30 minutes. Since this de-meaning operation operates on time periods longerthan the plot's time resolution, an artificial dc component may be seen in the extreme lower frequencyregime of these spectrograms. Since these are data processing artifacts, the low frequency regime(f<0.05 Hz) should be ignored. Users who are interested in further details for either of these operationsare encouraged to contact the PIMS group.
B-1

SAMS ACCELERATION MEASUREMENTS ON MIR FROM MAY 1997 TO JUNE 1998
Appendix C: SAMS Nyquist-Frequency Color Spectrograms TSH A (250 Hz)
The Principal Investigator Microgravity Services (PIMS) group has further processed SAMS data toproduce the plots shown here. This appendix presents power spectral density versus frequency versustime (spectrogram) plots of SAMS TSH A (f
N =250 Hz) data.
Color spectrograms are used to show how the microgravity environment varies in intensity with respectto time and frequency. These spectrograms are provided as an overview of the frequency characteristicsof the SAMS data. Each spectrogram is a composite of 6 hour's worth of data. The time resolution usedto compute the spectrograms seen here is 16.384 seconds. This corresponds to a frequency resolution of0.0610 Hz.
These data were collected at 500 samples per second, and a 100 Hz low-pass filter was applied to thedata by the SAMS unit prior to digitization. Prior to plot production, the raw SAMS data werecompensated for gain changes, and then de-meaned. De-meaning was accomplished by analyzingindividual sections with a nominal length of 30 minutes. Since this de-meaning operation operates ontime periods longer than the plot's time resolution, an artificial dc component may be seen in the extremelower frequency regime of these spectrograms. Since these are data processing artifacts, the lowfrequency regime (f<0.05 Hz) should be ignored. Users who are interested in further details for either ofthese operations are encouraged to contact the PIMS group.
C-1

SAMS ACCELERATION MEASUREMENTS ON MIR FROM MAY 1997 TO JUNE 1998
Appendix D: SAMS Nyquist-Frequency Color Spectrograms TSH B (25 Hz)
The Principal Investigator Microgravity Services (PIMS) group has further processed SAMS data toproduce the plots shown here. This appendix presents power spectral density versus frequency versustime (spectrogram) plots of SAMS TSH B (f
N =25 Hz) data.
Color spectrograms are used to show how the microgravity environment varies in intensity with respectto time and frequency. These spectrograms are provided as an overview of the frequency characteristicsof the SAMS data. Each spectrogram is a composite of 6 hour's worth of data. The time resolution usedto compute the spectrograms seen here is 40.960 seconds. This corresponds to a frequency resolution of0.0244 Hz.
These data were collected at 50 samples per second, and a 10 Hz low-pass filter was applied to the databy the SAMS unit prior to digitization. Prior to plot production, the raw SAMS data were compensatedfor gain changes, and then de-meaned. De-meaning was accomplished by analyzing individual sectionswith a nominal length of 30 minutes. Since this de-meaning operation operates on time periods longerthan the plot's time resolution, an artificial dc component may be seen in the extreme lower frequencyregime of these spectrograms. Since these are data processing artifacts, the low frequency regime(f<0.05 Hz) should be ignored. Users who are interested in further details for either of these operationsare encouraged to contact the PIMS group.
D-1

SAMS ACCELERATION MEASUREMENTS ON MIR FROM MAY 1997 TO JUNE 1998
Appendix E: User Comment Sheet
We would like you to give us some feedback so that we may improve the Mission Summary Reports.Please answer the following questions and give us your comments.
1. Do the Mission Summary Reports fulfill your requirements for acceleration and mission information?______Yes ______No
If not why not?
Comments: __________________________________________________________________________
________________________________________________________________________________________
2. Is there additional information which you feel should be included in the Mission Summary Reports?______Yes ______No
If so what is it?
Comments:__________________________________________________________________________
________________________________________________________________________________________
3. Is there information in these reports which you feel is not necessary or useful?
______Yes ______No
If so, what is it?
Comments: __________________________________________________________________________
________________________________________________________________________________________
4. Do you have internet access via: ( ____ )ftp ( ____ )WWW ( ____ )gopher ( ____ )other? Have youalready accessed SAMS data or information electronically?
______Yes ______No
Comments: __________________________________________________________________________
________________________________________________________________________________________
Completed by: Name:________________________ Telephone: ______________________________
Address:________________________ Facsimile: _______________________________
________________________ E-mail: _________________________________
Return this sheet to:Kevin McPherson orNASA Lewis Research Center FAX to PIMS Project: 216-433-866021000 Brookpark Road MS 500-216 e-mail to: [email protected], OH 44135
E-1
SAMS ACCELERATION MEASUREMENTS ON MIR FROM MAY 1997 TO JUNE 1998
F-1
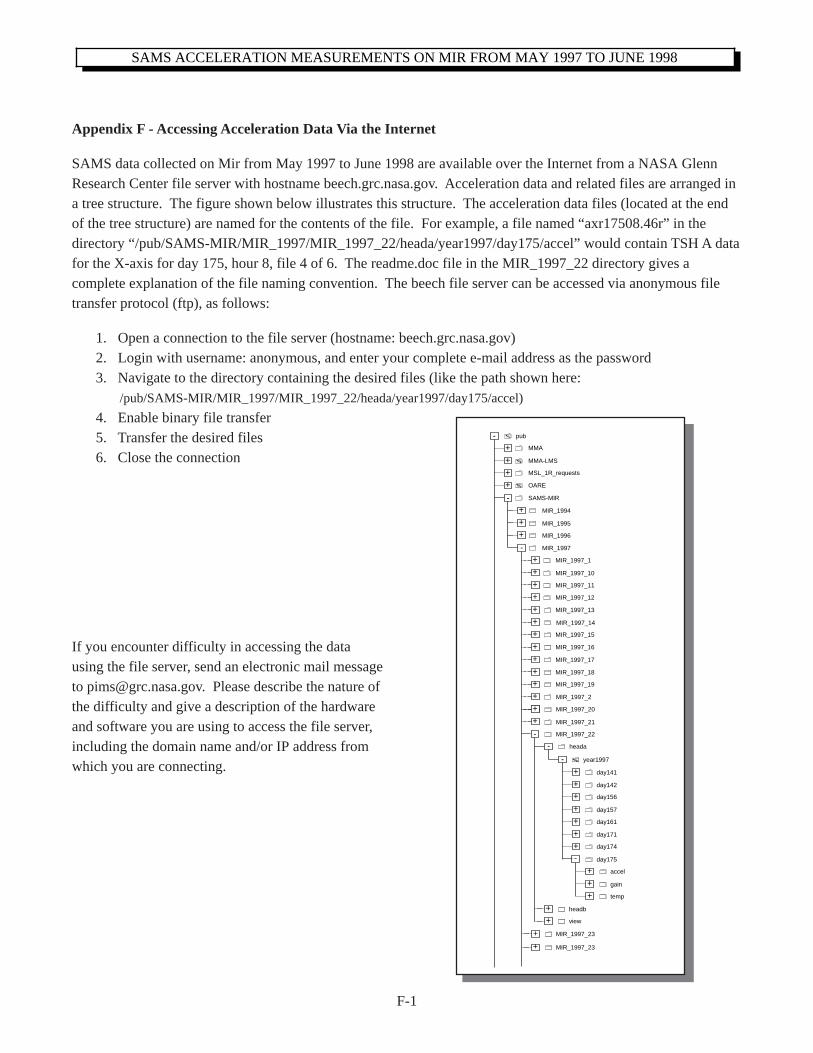
If you encounter difficulty in accessing the datausing the file server, send an electronic mail messageto [email protected]. Please describe the nature ofthe difficulty and give a description of the hardwareand software you are using to access the file server,including the domain name and/or IP address fromwhich you are connecting.
Appendix F - Accessing Acceleration Data Via the Internet
SAMS data collected on Mir from May 1997 to June 1998 are available over the Internet from a NASA GlennResearch Center file server with hostname beech.grc.nasa.gov. Acceleration data and related files are arranged ina tree structure. The figure shown below illustrates this structure. The acceleration data files (located at the endof the tree structure) are named for the contents of the file. For example, a file named “axr17508.46r” in thedirectory “/pub/SAMS-MIR/MIR_1997/MIR_1997_22/heada/year1997/day175/accel” would contain TSH A datafor the X-axis for day 175, hour 8, file 4 of 6. The readme.doc file in the MIR_1997_22 directory gives acomplete explanation of the file naming convention. The beech file server can be accessed via anonymous filetransfer protocol (ftp), as follows:
1. Open a connection to the file server (hostname: beech.grc.nasa.gov)2. Login with username: anonymous, and enter your complete e-mail address as the password3. Navigate to the directory containing the desired files (like the path shown here:
/pub/SAMS-MIR/MIR_1997/MIR_1997_22/heada/year1997/day175/accel)
4. Enable binary file transfer5. Transfer the desired files6. Close the connection
-+
+++
+
+
+
-+
+
+
+
++
+
-
pub
MMA
MMA-LMS
MSL_1R_requests
OARE
SAMS-MIR
MIR_1994
MIR_1995
MIR_1996
MIR_1997
++
++
+
+++
MIR_1997_1
MIR_1997_10
MIR_1997_11
MIR_1997_12
MIR_1997_13
MIR_1997_14
MIR_1997_15
MIR_1997_16
MIR_1997_17
MIR_1997_18
MIR_1997_19
MIR_1997_2
MIR_1997_20
MIR_1997_21
MIR_1997_22
heada
--
+
++
year1997-
day141
day142
day156
+
+day157
day161
+
+day171
day174
+day175
accel
+
+gain
temp
-
+ MIR_1997_23
++
headb
view
+ MIR_1997_23

This publication is available from the NASA Center for AeroSpace Information, (301) 621–0390.
REPORT DOCUMENTATION PAGE
2. REPORT DATE
19. SECURITY CLASSIFICATION OF ABSTRACT
18. SECURITY CLASSIFICATION OF THIS PAGE
Public reporting burden for this collection of information is estimated to average 1 hour per response, including the time for reviewing instructions, searching existing data sources,gathering and maintaining the data needed, and completing and reviewing the collection of information. Send comments regarding this burden estimate or any other aspect of thiscollection of information, including suggestions for reducing this burden, to Washington Headquarters Services, Directorate for Information Operations and Reports, 1215 JeffersonDavis Highway, Suite 1204, Arlington, VA 22202-4302, and to the Office of Management and Budget, Paperwork Reduction Project (0704-0188), Washington, DC 20503.
NSN 7540-01-280-5500 Standard Form 298 (Rev. 2-89)Prescribed by ANSI Std. Z39-18298-102
Form Approved
OMB No. 0704-0188
12b. DISTRIBUTION CODE
8. PERFORMING ORGANIZATION REPORT NUMBER
5. FUNDING NUMBERS
3. REPORT TYPE AND DATES COVERED
4. TITLE AND SUBTITLE
6. AUTHOR(S)
7. PERFORMING ORGANIZATION NAME(S) AND ADDRESS(ES)
11. SUPPLEMENTARY NOTES
12a. DISTRIBUTION/AVAILABILITY STATEMENT
13. ABSTRACT (Maximum 200 words)
14. SUBJECT TERMS
17. SECURITY CLASSIFICATION OF REPORT
16. PRICE CODE
15. NUMBER OF PAGES
20. LIMITATION OF ABSTRACT
Unclassified Unclassified
Technical Memorandum
Unclassified
National Aeronautics and Space AdministrationJohn H. Glenn Research Center at Lewis FieldCleveland, Ohio 44135–3191
1. AGENCY USE ONLY (Leave blank)
10. SPONSORING/MONITORING AGENCY REPORT NUMBER
9. SPONSORING/MONITORING AGENCY NAME(S) AND ADDRESS(ES)
National Aeronautics and Space AdministrationWashington, DC 20546–0001
August 1999
NASA TM—1999-209282
E–11750
WU–101–46–0A–00
38
A03
Unclassified -UnlimitedSubject Categories: 18, 20, and 35 Distribution: Nonstandard
SAMS Acceleration Measurements on Mir from May 1997 to June 1998(NASA Increments 5, 6, and 7)
Richard DeLombard
Responsible person, Richard DeLombard, organization code 6727, (216) 433–5285.
Acceleration measurement; Microgravity environment; SAMS, Shuttle, Orbiter, Mir,NASA increment
During NASA Increments 5, 6, and 7 (May 1997 to June 1998), about eight gigabytes of acceleration data were collectedby the Space Acceleration Measurement System (SAMS) onboard the Russian Space Station Mir. The data were recordedon twenty-seven optical disks which were returned to Earth on Orbiter missions STS-86, STS-89, and STS-91. Duringthese increments, SAMS data were collected in the Priroda module to support various microgravity experiments. Thisreport points out some of the salient features of the microgravity acceleration environment to which the experiments wereexposed. This report presents an overview of the SAMS acceleration measurements recorded by 10 Hz and 100 Hz sensorheads. The analyses included herein complement those presented in previous Mir increment summary reports prepared bythe Principal Investigator Microgravity Services project.