Sampling techniques for electric power measurement...OFSTANDARDS I-ihrary r8-JUL1975...
40
* 2 ^ 0F c 0j to Q IMBS TECHNICAL NOTE 870 U.S. DEPARTMENT OF COMMERCE / National Bureau of Standards Sampling Techniques for Electric Power Measurement
Transcript of Sampling techniques for electric power measurement...OFSTANDARDS I-ihrary r8-JUL1975...

*
2
^ 0F c0j
toQ IMBS TECHNICAL NOTE 870
U.S. DEPARTMENT OF COMMERCE / National Bureau of Standards
Sampling Techniques for Electric
Power Measurement

NATIONAL BUREAU OF STANDARDS
The National Bureau of Standards 1 was established by an act of Congress March 3, 1901.
The Bureau's overall goal is to strengthen and advance the Nation's science and technology
and facilitate their effective application for public benefit. To this end, the Bureau conducts
research and provides: (1) a basis for the Nation's physical measurement system, (2) scientific
and technological services for industry and government, (3) a technical basis for equity in trade,
and (4) technical services to promote public safety. The Bureau consists of the Institute for
Basic Standards, the Institute for Materials Research, the Institute for Applied Technology,
the Institute for Computer Sciences and Technology, and the Office for Information Programs.
THE INSTITUTE FOR BASIC STANDARDS provides the central basis within the United
States of a complete and consistent system of physical measurement; coordinates that system
with measurement systems of other nations; and furnishes essential services leading to accurate
and uniform physical measurements throughout the Nation's scientific community, industry,
and commerce. The Institute consists of a Center for Radiation Research, an Office of Meas-
urement Services and the following divisions:
Applied Mathematics — Electricity — Mechanics — Heat — Optical Physics — Nuclear
Sciences - — Applied Radiation 2 — Quantum Electronics 3 — Electromagnetics 3 — Time
and Frequency 3 — Laboratory Astrophysics 3 — Cryogenics \
THE INSTITUTE FOR MATERIALS RESEARCH conducts materials research leading to
improved methods of measurement, standards, and data on the properties of well-characterized
materials needed by industry, commerce, educational institutions, and Government; provides
advisory and research services to other Government agencies; and develops, produces, and
distributes standard reference materials. The Institute consists of the Office of Standard
Reference Materials and the following divisions:
Analytical Chemistry — Polymers — Metallurgy — Inorganic Materials — Reactor
Radiation — Physical Chemistry.
THE INSTITUTE FOR APPLIED TECHNOLOGY provides technical services to promote
the use of available technology and to facilitate technological innovation in industry and
Government; cooperates with public and private organizations leading to the development of
technological standards (including mandatory safety standards), codes and methods of test;
and provides technical advice and services to Government agencies upon request. The Institute
consists of a Center for Building Technology and the following divisions and offices:
Engineering and Product Standards — Weights and Measures — Invention and Innova-
tion — Product Evaluation Technology — Electronic Technology — Technical Analysis
— Measurement Engineering — Structures, Materials, and Life Safety * — Building
Environment * — Technical Evaluation and Application * — Fire Technology.
THE INSTITUTE FOR COMPUTER SCIENCES AND TECHNOLOGY conducts research
and provides technical services designed to aid Government agencies in improving cost effec-
tiveness in the conduct of their programs through the selection, acquisition, and effective
utilization of automatic data processing equipment; and serves as the principal focus within
the executive branch for the development of Federal standards for automatic data processing
Equipment, techniques, and computer languages. The Institute consists of the following
divisions:
Computer Services — Systems and Software — Computer Systems Engineering — Informa-
tion Technology.
THE OFFICE FOR INFORMATION PROGRAMS promotes optimum dissemination andaccessibility of scientific information generated within NBS and other agencies of the Federal
Government; promotes the development of the National Standard Reference Data System anda system of information analysis centers dealing with the broader aspects of the National
Measurement System; provides appropriate services to ensure that the NBS staff has optimumaccessibility to the scientific information of the world. The Office consists of the following
organizational units:
Office of Standard Reference Data — Office of Information Activities — Office of Technical
Publications — Library — Office of International Relations.
1 Headquarters and Laboratories at Gaithersburg, Maryland, unless otherwise noted: mailing addressWashington, D.C. 20234.
a Part of the Center for Radiation Research.3 Located at Boulder, Colorado 80302.4 Part of the Center for Building Technology.

OF STANDARDSI-ihrary
8 -JUL 1975
r Sampling Techniques for Electric
Power Measurement
Dr. R. S. Turgel
Institute for Basic Standards
National Bureau of Standards
Washington, D.C. 20234
*<
U.S. DEPARTMENT OF COMMERCE, Rogers C.B. Morton. Secretary
NATIONAL BUREAU OF STANDARDS, Richard W. Roberts, Director
Issued June 1975

Library of Congress Catalog Card Number: 75-600034
National Bureau of Standards Technical Note 870
Nat. Bur. Stand. (U.S.), Tech. Note 870, 35 pages (June 1975)
CODEN: NBTNAE
U.S. GOVERNMENT PRINTING OFFICEWASHINGTON: 1975
For sale by the Superintendent of Documents, U.S. Government Printing Office, Washington, D.C. 20402
(Order by SD Catalog No. 03.46:870). Price $1.05 (Add 25 percent additional for other than U.S. mailing.)

1. Introduction 1
2. Sampling Method 2
3. Description of Measuring System h
3.1 Analog Signal Conditioning k
3.2 Analog-to-Digital Converter k
3.3 Digital Computation k
3-h Timing and Control Circuits 5
k. Mathematical Model of A/D Converter 6
k.l Computer Program 6
5. Results of Simulation 8
5.1 Second Series of Tests 9
6. Conclusions 13
7. Appendix
Computer Printout "A" 18
Computer Printout "B" 23
Reprint from IEEE Transactions for Instrumentation and Measurement 27
in


SAMPLING TECHNIQUES FOR ELECTRIC POWER MEASUREMENT
R. S. Turgel
\
A system is described that determines average electricpower by periodically sampling current and voltage waveformsand calculating the result from digitized values of measuredinstantaneous currents and voltages. System performance is
modeled on a digital computer to investigate the effects ofnoise, harmonics and sampling time errors on the result of asimulated power measurement* With 15 bit analog-to-digitalconversion and 512 measured sample points an accuracy of0.01% can theoretically be obtained from dc up to 5 kHz.
Key Words: Analog-to-digital conversion; digital; electricpower; electricity; measurement; sampling; simulation; watt-meter .
1. Introduction
This report contains a study of the feasibility of a new method formaking precision measurements of audio frequency electric power. Thestudy examines the limitations imposed by the nature of the measurementprocess itself as distinct from the additional uncertainties introducedby the departure from ideal characteristics of the actual hardware.
None of the currently used methods to measure low frequency acpower is an absolute method. As in the measurement of ac voltage andcurrent some transfer device is used to relate the measurements to thecorresponding dc units. The use of transfer devices is based on someassumptions regarding the relative response of the device to ac and dc
quantities. Generally an upper limit of the ac/dc error can be deducedfrom theoretical considerations.
The definition of (average) ac power is given by
W = ~- fl eidt, (1)
where e = instantaneous voltage,
i = instantaneous current
,
t = time, and
T = some definite time interval, usually a period (or
multiple thereof) of the fundamental frequency
component.
1

Integration of equation (l) is performed within the measuring de-
vice, making use of mechanical or thermal inertia, by the first three of
the following well-known methods of measuring electric power:
(a) Electrodynamometer(b) Electrostatic(c) Electrothermic (thermoelement, calorimeter)(d) Hall effect
The Hall effect devices produce dc voltages proportional to the instan-taneous product of e and i which are then usually averaged (integrated)
by the readout system.
In all the above methods a physical transducer is used to obtain a
measure of the product of current and voltage. Their relative advan-tages and disadvantages derive mainly from the nature of that transducer.
The method to be described in this report follows directly from thefundamental definition of ac power, equation (l). Instead of carryingout the necessary integration with an analog system, instantaneous valuesof current and voltage are measured and the integration is performed bynumerical (digital) methods. The integration is therby replaced by a
summation:
N
''k'iV (2)
The problem is therefore twofold. The number of samples of instan-taneous voltage and current and the method of summation must be chosenso that the value of the integral can be approached within a given tol-erance. Further, the measurement of current and voltage must be madewith sufficient accuracy in a given time interval.
2. Sampling Method
To reconstruct the waveform from sampled data the minimum samplingrate must be at least twice the frequency of the highest sinusoidal fre-quency component contained in the signal according to the sampling the-orem . Since instantaneous power varies at twice the frequency of thecurrent and voltage, the sampling theorem would require a minimum sam-pling rate of four times the highest sinusoidal frequency component con-tained in the current and voltage waveforms. However, we are interestedin "average power", and as shown below the minimum sampling rate isthereby reduced. It should be remembered that conditions encountered inpractice differ from the ideal assumed for theoretical derivations, andtherefore the minimum sampling rate is seldom sufficient in actualcases
.
Raised figures indicate literature references on page IT.

In the present applica 1 ion the average integral
7?fT
f(x)dtT o
must he approximated by summing a sufficient number of samples during one
period T so that
1 Z f(x.) 1 - T(
v
In j- ? / f(x)dt
The trapezoidal rule has been shown to converge at least as fast as
7- The last term of the summation represents the error of the approxi-1 2
N
mat ion
l\ f(x)dx = h[^Si+ f(a+h) +....+ f(a+(N-l)h)+^] - ^^ f"U)
where
b-aa<£<b and h = —zr~
For sampling at random intervals the error term decreases at a rate
proportional to -. It appears therefore that random sampling is not
the right approach if high precision is desired.
For the special case of periodic functions, the trapezoidal ruleis exact for the 2N periodic functions: 3
1, sin (x), cos (x),..., sin (W-l)x, cos (N-l)x, sin (Nx)
Therefore, the integral representing the average power of sinusoidalcurrent and voltage with phase angle
-t— f sin (x) sin (x+0)dx = -— /v
[cos (0) - cos (2x+0)]dx£-" O ^TT o
can be evaluated exactly with only three terms, (N=3), of the summationformula. This can be verified by direct substitution. Theoretically,therefore, the number of samples per cycle need be only 2K+1, where Kis the order of the highest harmonic present in the input signal. Ifharmonics up to the fourth are included at least 9 samples must be takenin each period. If the input waveform is no longer a combination of har-

monically related pure sinusoids, but includes small random fluctuations
(noise), or if the sampling time is subject to small fluctuations (jit-
ters), then a higher sampling rate is necessary. In practice, therefore,
the minimum sampling rate is never sufficient. To ease implementation
of binary arithmetic, the number of samples, N, has always been chosen
as an integral power of 2 in this study.
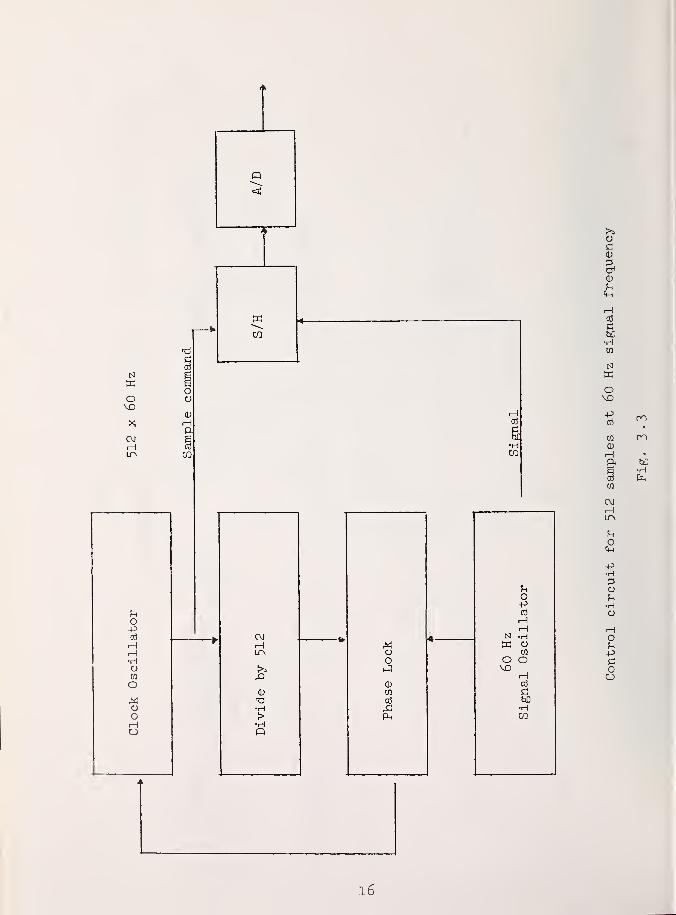
3. Description of Measuring System
The system is capable of measuring rms current, or voltage, andaverage power with either a real load or phantom load connection. Forpurposes of discussion it can be divided into four main functionalblocks as shown in fig. 3.1.
(
3.1 Analog Signal Conditioning
Signal conditioning preamplifiers translate the input voltages andcurrents to the required 10 volt level at the input to the A/D converter.Figure 3*2 shows one such possible arrangement.
To preserve the accuracy of the overall system the closed loopgain-frequency characteristic of the amplifiers has to be constant with-in 50 ppm from dc to the upper frequency limit. This requires a loopgain of at least 80 db. The preamplifiers can be built from commerciallyavailable operational amplifiers that satisfy these requirements.
3.2 Analog to Digital Converter (A/D)
The A/D subsystem samples the input signals at predetermined in-tervals and converts them to two 15 bit binary numbers.
Two configurations are possible. (l) The signals are captured intwo sample-and-hold amplifiers and then successively applied to theconverter through an analog multiplexer, or (2) the sample-and-holdamplifiers feed two parallel converters. The second scheme has the ad-vantage of eliminating additional errors due to the multiplexer; on theother hand, it requires equality of the A/D's or suitable corrections.Specifications of commercially available units indicate that an overallshort term accuracy of 0.01% can be maintained under favorable circum-stances .
3-3 Digital Computation
This subsystem has the following functions:
1. Temporarily stores pairs of successive numbers from theoutput of the A/D converters.
2. Forms the product of these numbers.
3. Adds the product to a total.
k

h. Divides the total by the number of products added to
obtain an average.
5. Displays the average on an output device.
6. Applies numerical corrections where necessary.
There are two general approaches to the problem of handling thedigital data from the A/D converter (s)
.
1. A general purpose minicomputer can be used to store sets ofdata during the measurement, and to perform the computationafter the measurement is completed.
2. Special arithmetic hardware can be built to perform thenecessary calculations in real time.
Method 1 is preferable during the development period, because it
provides flexibility of operation and permits the introduction of diag-nostic routines. On the other hand, when the immediacy of results is
of prime importance (e.g. certain control applications), method 2 is
more appropriate. Minicomputer data manipulation is generally too slowin this case, and hard-wired integrated circuits are required to performthe arithmetic operations in between sampling periods.
The final result can be displayed on electro-optical readouts ,• or
,
if a minicomputer is used, on a printer.
3.^- Timing and Control Circuits
The timing and control section is of vital importance to the cor-rect performance of the whole system. The two main functions of thecontrol circuit are:
1. to determine the proper sampling time,
2. to coordinate the various subsystems so that the signals anddigital information are processed in the correct sequence.
Of these two functions the first is the more critical. The degreeto which the result from the sampled data approximates the integraldesired is directly dependent on the timing of the sampling interval.Although a certain amount of random fluctuation (jitter) of the precisetime of the sampling command can be tolerated, any systematic error in
the periodicity of the samples will produce a proportional error in thefinal result. It is therefore very important to synchronize the timingpulses with the fundamental frequency to be measured. At low frequen-cies all the necessary samples for one reading can be obtained during a
single cycle of the fundamental of the singal frequency. For instance,with an input frequency of 60 Hz 512 samples can be taken per cycle(fig. 3-3). At higher frequencies, or when more samples are required,the measurement time has to be spread over several cycles.
5

The timing of the sampling period is related to the input signal
frequency by means of a frequency divider and phase-lock circuitry. The
sample command pulse enables the "hold" mode of sample-and-hold ampli-
fiers and thereby starts the conversion. Delays to allow for settling
time can be programmed independently or derived from the clock circuit
of the A/D converter.
The time required to complete the analog-to-digital conversion will
occupy the major portion of the period between samples. If calculations
are performed by a minicomputer, enough additional time must be providedto transfer the results of the conversion into memory. A direct memoryaccess (DMA) channel is useful for this purpose. If special hardwareis used, computations can be carried out simultaneously with the con-
version of the next set of sampled data. In fact, with a pipeline typearithmetic operation computation can be spread over several samplingperiods if necessary, provided a sufficient number of registers for
storage of intermediate results are available. The additional delay in
obtaining the final result will still be only a small fraction of thetotal measurement period.
h. Mathematical Model of A/D Converter
In outlining the proposed system for measuring low frequency ac
power a number of assumptions were made regarding accuracy and the num-ber of samples required. Most of these assumptions were based on purelytheoretical considerations. In an actual system disturbances due tonoise, sampling time fluctuation, round off due to finite number ofdigits, harmonics in the signal, etc., contribute to the overall error.Because some of these are interrelated, estimation of the overall un-certainty is difficult. It seemed appropriate, therefore-, to simulatethe system operation to determine its characteristics.
The design of a mathematical model of the A/D conversion process isfairly simple. Into such a model the various error sources can be intro-duced by defining or specifying their bounds and using normalized randomnumbers to simulate perturbations. Separate calculations have to beperformed for each set of conditions and at each sample point, but totalcomputation time is relatively short.
U.l Computer Program
The object of the simulation is the determination of the errorlimits of the measurement process. That is, the calculation of the dif-ference between the "exact" integral (eq. 1.), which represents theanalog input, and the response of the sampled data system (eq. 2.) undervarious conditions. For this purpose the voltage and current inputsare represented by
Yl = sin (x) + A 12 sin (2x + 12 ) + A\ 3 Sin ( 3x + 13 ) +
A 14 sin (kx + Q lh ) (3)

Y 2 = sin (x + 21 ) + A22 sin (2x + 22 ) + A23 sin ( 3x + 23 ) +
A 2i+ sin (hx + lt+ ) (1+)
The amplitudes, A, of the 2nd, 3rd, and Uth harmonic and the respectivephase angles, 0, are assigned during execution of the program from inputdata. The sampling time x is expressed as a fraction of 2ir depending on
the number of samples, N, to be taken per cycle.
x =2L( n _ I),
( n = 1....U). (5)
To each sampling time x, is added a "timing error" to simulate fluctua-tions occurring in a real system, and a term representing "noise" is
included in the calculation of the instantaneous amplitude Y. Beth ofthese values are obtained using normalized random numbers (range -1 to+l) multiplied by suitable parameters specified in' the computer programinput data. To obtain maximum resolution and to avoid cumulative round-ing errors for the desired number of significant figures, the values ofanalog quantities are computed with "double precision."
Each Y value then represents the analog voltage or current appliedto the input of the A/D converter. The converter, however, has a finiteresolution of lU bits (plus 1 sign bit). The remainder of the calcula-tions are therefore carried out in the integer mode by multiplying Y by2 14 with appropriate rounding off by 1/2 bit. The number of bits re-tained in each subsequent step of the calculation closely parallels thereal time calculations that would be performed by special hardware inan actual system following the A/D conversion. For convenience thefinal result was normalized and compared to the calculated "true value"of the integral.
The program has provisions for specifying the following parameters:
1. The amplitudes and phases of the harmonics (up to Uthorder)
2. The phase angle between the fundamentals
3. The percentage "noise"
h. The timing error (in nanoseconds)
5. The frequency of the fundamental component
6. The number of samples per cycle for the initial run andwhether the number of samples in the succeeding run is
twice or ten times as large
7. The limit on the number of runs and/or the limit of error
7

of the summation approximation
8. Whether the error is to be expressed as percent of readingor percent of full scale
9. The percentage difference between the fundamental fre-quency and the appropriate submultiple of the samplingfrequency (Sychronization error)
10. Ordered or random sample points.
5. Results of Simulation
The performance of the hypothetical system of power measurement is
shown in computer print-out "A" in the appendix.
For this calculation a basic set of parameters was chosen to cor-respond to a typical situation. There "Reference" Conditions are listedin Table 1. Each parameter, one at a time, is then varied to test howthe system behaves. The other parameters remain the same, except forthe determination of timing error where the fundamental frequency is
increased to 2000 Hz from 60 Hz in order to make the resulting changesmore apparent. The computation is terminated for each set of conditionswhen the summation agrees with the integral within the specified toler-ance (0.005$). The maximum number of sample points was also limitedwhen the tolerance could not be reached.
Table 1
Reference Conditions
Phase Angle between Fundamentals 60°
2nd, 3rd, ^th Harmonic content 1.0$
Superimposed Noise 0.01$
Timing Error 100 ns
Frequency 60 Hz
The first four sets of data show the variation with phase angle.In each case no more than 32 sample points are required to reach anaccuracy of 0.005 percent. For the 80 degree point and the 89-999 de-gree point the error was calculated as percent of full scale.
The next set demonstrates that when using random sample intervals8192 samples are not enough to assure even 1 percent accuracy.

The following three sets of data show that increasing the harmonicamplitudes from to 10 percent of the fundamental does not significantlyaffect the number of samples required.
In the next three sections the influence of noise in the input sig-
nals is demonstrated. For a noise amplitude of 0.01 percent or less notmore than 32 samples are necessary. If the noise\ is increased by anorder of magnitude 102U samples are required to obtain the desired ac-curacy. Although this is a considerable increase in the number ofsamples, it does indicate that the method can produce valid results evenwhen the noise level is high.
Similarly, the next nine sets of data show that the accuracy is
relatively insensitive to random timing errors (in the sampling time),but very sensitive to systematic timing errors.
The last five sets of tests show the effect of signal frequency onthe number of samples required. For a "clean" signal results can be ob-tained with 1021+ samples even at 10,000 Hz.
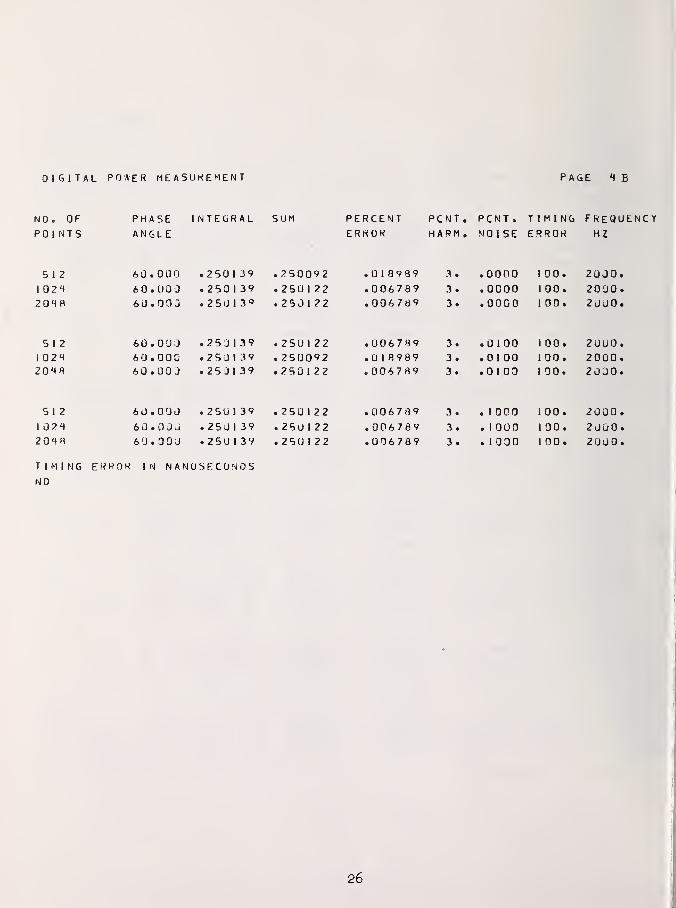
5.1 Second Series of Tests
The results of the first series of tests suggested that 512 samplepoints would be a reasonable number. With this in mind, and consideringthat in practice an A/D converter has a limited throughput rate, thesimulated mode of operation of the system was somewhat modified. Tomake efficient use of the A/D converter (s ) , it was decided to operateas close to the maximum throughput rate as practicable at all input fre-quencies. The number of sample points per cycle was therefore made de-pendent on the fundamental component of input frequency as shown inTable 2 which assumes a throughput rate of about 50 kHz.
Table 2
Input Frequency(Hz)
Numberpoints
of sampleper cycle
50 - 100 512
100 - 200 256
200 - Uoo 128
^00 - 800 6U
800 - 1600 32
1600 - 3200 16
3200 - 6U00 8
6U00 - 12800 k

The computer program was modified accordingly, and tests were runto determine the attainable accuracy under the specified conditions.
The total number of sample points for each run was varied from 512 to20U8.
The results are shown in the computer print-out "B" (Appendix),and are also summarized in Tables 3 and k. Some rounding errors areevident (e.g. Table U, column h) which represent 1 in 2 1
. Disregardingthese, there appear to be no trends in the calculated errors as functionof frequency, phase angle, noise content, or random timing fluctuations.
This indicates that 512 samples per measurement are sufficient andthat the system can tolerate reasonable amounts of noise and timingerrors and remain within the 0.01% accuracy limit. Because of occasion-al rounding errors it is advisable to make more than one measurement.
10

Table 3
Percentage error of the simulated power measurement as a function of
phase angle, frequency, and the number of samples with a timing error of
50 ns and 0.01% noise amplitude.
Frequency(Hz)
Phase angle60
(degrees)
89.999Total no. ofsample points
60 0.009 0.007
•)
0.005 512
0.009 0.007 0.005 102U
0.009 0.007 0.005 201+8
i+oo 0.003 0.007 0.005 512
0.003 0.007 0.005 102U
0.003 0.007 0.005 201+8
1000 0.009 0.007 0.005 512
0.003 0.007 0.005 102*+
0.003 0.007 0.005 201+8
2000 0.009 0.007 0.005 512
0.003 0.007 o.ooi 1021+
0.003 0.007 0.005 201+8
5000 0.012 0.005 o.oi 512
0.006 0.019 0-005 1021+
0.006 0.005 0.005 201+8
*) percent of full scale
11

Table k
Percentage error as a function of noise, timing error, and total
number of sample points for ^00 Hz and 2 kHz input with 60° phase angle
,
Timing error Maximum noise amplitude (%) Total number(ns) 0.0 0.01 0.03 0.1 of samples
1*00 Hz
50
100
0.007 0.007 0.019 0.005 512
0. 007 0.007 0.007 0.005 102U
0.007 0.007 0.007 0.019 20^8
0.007 0.007 0-007 0.019 512
0.007 0.007 0.007 0.019 102U
0.007 0.007 0.007 0.007 20U8
2000 Hz
50 0.007 0.007 - 0.007 512
0.007 0.007 0.019 102U
0.007 0.007 0.007 20U8
100 0.019 0.007 - 0.007 512
0.007 0.019 0.007 102U
0.007 0.007 0.007 20U8
12

6. Conclusions
A system has "been described tnat will measure audio frequency powerby computation from the numberical values of simultaneous samples of theinstantaneous current and voltage. A mathematical model of the systemhas been investigated and has shown that the method is capable of anaccuracy of 0.01 percent. If the maximum sampling rate is 50 kHz, 512sampling points for each determination are adequate in most cases. Inthe calculation quantizing errors arising from finite resolution of theA/D converters were taken into account, but non-linearities and offsetswere not considered. The results therefore correspond to the best thatcan be obtained by this sampling method with the assumption of a 15 bitconversion resolution under conditions where the hardware does not con-tribute additional errors.
A reprint of a paper (previously published)1* describing the experi-
mental verification of this method is included in the appendix. Measure-ment results show agreement with the NBS wattmeter generally within a
±0.02% error band for frequencies up to 5 kHz. Contributing to the ex-permintal uncertainty is the deviation from linearity of the A/D con-verters, the frequency response and voltage dependent offsets of thesample and hold circuitry. Improvements in the operating characteris-tics of the hardware could reduce the overall uncertainty by perhaps50 ppm.
13

4J
aa4J
3O t
r-l Htsj a> VU 4-1
•H 3oo a,i-< Ia 5
a
t-C
5)4-1
T-(
"^r00 J-i TJ 00i-i a) (3 OQ 4J cd «h
mo <u 00 i-l
u > c oC 1-1 l-l
00 oo o _j 6 *-»
•S (3.-1 ^ H O
sO
<!
I
en
00
r-
(
cd ooC C!
00 i-l
•H Cen o
i-i
00 4-1
O -Hr^ 73cd CC O<J o
ii
4J
3acH
lU

60
CO
00
oj
00(S
13cd
Oi-J
cd
C00
00cdJJI-l
o
$00
o
/-'
//
d
co
CL.
CL.
CO
J-l
QJ
Cm
t3cd
O
cd
3
AA/v
cd
o
4-1
Ccd
XI04
CN*
CO
•
ooi-i
V\*
QJOJ .uw mco i-i
** CO
ex
CO
S-i
OJ
gOi
a,
co
uOJ
Pk4
15
SI
oVD
X
CMH
HP-
CQ
03
b£•HCO
uEl
<L>
g-(D
<H
HCbCHw
N
o
-PCD
CO
CD
rHPh
ICD
C\J
o
-PHaU
o
-P
oo
CO
en
•H
16

References
Douglas T. Ross, Chapter II "Sampling and Quantizing" Notes onAnalog-Digital Conversion Techniques", A. K. Susskind, Editor,
pp 2-2 to 2-7, Technology Press, M.I.T., 1957-
Philip J. Davis, Philip Ratdnowitz, "Numerical Integration", p. 17,Blaisdel Publishing Company, Waltham, Mass., 19^7.
«
3 ibid, p. 57.
4 R. S. Turgel, "Digital Wattmeter Using a Sampling Method", IEEETrans. Instrum. and Meas., Vol. IM-23 . No. k, pp. 337-3^1, Dec. 197^
17

bibHAL PD¥ETT1CaSDR£MENiT FASE 1
A
Nu . OFpoints
4
"a
J.632
4
B~
16
4a
1632
4
a16
4
a1632b4128^d6Di2
lu*:4
2u484u9b8x92
4
a16
KANDRANDKANURANDKANUKANUKANUKANUKANUKANUKANUKANU
PnASE INTEGRAL SUM PERCENT PCNT, PCNT. TIMING FREQUAuGLE ERROR HARM. NOISE ERROR HZ
.000 .600041 .5U8362 -1.664087-.010169
1.
1.
.0100
.0100luu.100.
60..000 .600041 .600092 60..000 .600041 .500000
•.500031.008141.002037
1.1.
.0100
.biob100.100.
60..ubu .600041 60.
6U.U0O .250041 .254974 -1.973143 1. .0100 100. 60.6U.U0O .250041 .^60092 -.-020336 1. .0100 100. 60.60.000 .250041 .21)0031 .U04074 1. .0100 100. 60.
80.000 .086865 .090088 .644620* 1. .0100 100. 60.8U.O0O •U8b8b5 .066914 .009854* 1. .0100 100. 60.ao.oou .U868b5 .006823 -.006456* 1. .0100 100. 60.80.00U .U868b5 .U86855 -.UU2353* 1. .0100 loo. 60.
89.999 .U00049 .UU2472 .484497* 1. .0100 100. 60.89.999 .U00049 .00009^ .008423* 1. .0100 100. 60.89.999 .000049 .000031 -.003784* 1. .0100 100. 60.
.uuu .600041 .7^0125 -44.01*954 1. .0100 100. 60.
.000 .60u041 .bal794 -30.348276 1. .0100 100. 60.
.UUU .600041 .535919 -7.1/5113 1. .0100 100. 60.
.uuu .600041 .665162 -10.623318 1. .0100 100. 60.
.UOU .50U041 .440918 11.823586 1. .0100 100. 60.
.uou .600041 •4b84bb 8.514349 1. .0100 100. 60.
.UOU .60U041 .613672 -2.726012 1. .0100 100. 60.
.000 .b0l)041 .b0897l -7.7b5414 1. .0100 1U0. 60.
.uou .600041 .4*5331 .941902 lr .0100 100. 60.
.uou .50U041 .494537 1.1UU580 1. .0100 100. 60.
.uou .500041 .496918 .624545 1. .0100 luu. 60.
.000 .600041 .6u827u -l.b45778 1. .0100 100. 60.
60. UOU .<i5u0UU .260031 -.0122U7 0. .0100 100. 60.6U.U0U .250000 .2499b9 .U122U7 o. .0100 loo. 60.6U.UUU .^5U0U0 .260U00 -.U0U0U0 0. .0100 100. bO.
Timing tKROK an nanoseconds* = LKROK CALCULATE mS PtKOElJl OK KULL SCALE
COMPUTER PRINTOUT V
18

DIGITAL PuwEK IviEaSUREMENT page 2 a
NO. 0>- PHASg ilMTtGRAL SOi PekClnt PCNT. PCNT. TIMING ERequpOXNTb ANGLE EhROh HARM. NOISE ErkOr HZ
4 bU.uOu .<ib004l •2b5035 -1.997553 1. .0100 100. bO.8 60.000 .*bo04l .2t>0061 -.UU8132 1. .0100 100. 60.
16 60.000 .250041 .2b0031 •UU4074 1. .0100 100. 60.
4 bU.OUU .<i54071 .301117|
-16.516986 10. .0100 100. 60.8 6U.U0U .254071 .2b7935 -1.52U784 10. .0100 100. 60.
16 6U.U0U .254071 .<ib4059 .UU4670 10. ..0100 100. 60.
4 bU.UUU .<ib0041 .^34974 -1.973143 1. .0001 100. 60.8 60.UOU .2b0 041 .2b003l .004074 1. .UU01 100. 60.
4 6U.U0U .2b004l .iibbOOb -1.965349 1. .0010 100. 60.8 bU.UOO .2b0041 .2bU061 -.0U8132 1. .0010 loo. 60.
lb 60.000 .2b004l .230031 .UU4U74 1. .0010 loo. 60.
4 oU.UOO .^bUUHl .ab4974 -1.973143 1. .OlUO 100. bO.8 bU.000 .^bliOHl .2bOUbl -.UU6132 1. .0100 loo. bO.
16 bU.UOO .^bUOHl ,2dOU31 .004074 1. .0100 100. 60.
4 bU.UUU .<;bO04l .254791 -1.699913 1. .1000 100. bO.8 hU.UUil .^bUU41 .^jU«il4 -.0b91bb 1. .1000 loo. bO.
16 bU.UUU .«ibO04l .«d49939 .U4U669 1. .10U0 100. oO.32 bU . uUu .2bu04l .2dOUo1 -.UU6132 1. .10U0 luO. 60.64 bU.UUU .250041 .^b009<i -,U2U33b 1. .1000 100. 60.
A 26 bU.UUU .250041 .2b00bl -.008lo2 1. .1U00 10 0. 60.«:56 bU.UUU .c:bUU4l • eJ^OUOO ,0lb2t>0 1. .1000 100. 60.ol2 bU • uUO .«ibu04l .«ib0U0O .Ulb260 1. .1000 100. 60.
1024 bU.UUU ,c:bU041 .250031 .004074 1. .1000 100. bO.
4 hu.UOO .dbu041 • <i^)bu3b -1.997553 1. .0100 0. 2000.8 bU.UUU .^5u0h-1 ..ioOUbl -.UU61.22 1. .0100 0. 2000.
16 bU.UUU .251)041 .^oOUUU .Ulb2b0 1. .0100 0. 2000.52 bU . UUu .<=!b0041 .2 j0u31 •UU4U74 1. .oluu 0. 2000.
TiMlNb EKKOk IN NAwVbhCONu:>
19

uiGI'lAL PuaEk MEASUREMENT PAGE 3 A
No. OF PnAbE iNIEGRhL SUM PERCENT PCNT. PCNT. TIMING freomencPoINTb ANGLE ERROK HARM. NOISE ERKOR HZ
4 6u.u0tJ .2b004l .2o5005 -1.9tib349 1. .0100 50. 2000.8 bO.uOO '.2.50041 .2b0l)00 .01b2b0 1. .oioo 50. 2000*
16 feo.ouu .^bOOHl •2D0031 .004074 1. .0100 50. 2000.
4 6 U . .<;5o04i .,ib491j -1.9467J4 1. .0100 100. 2000.8 bu.000 .<i5004l .<;49847 .077304 1. .0100 100. 2000.
16 60.000 .^buom .249817 .089510 1. .0100 100. 2000.32 60.000 .^bU0<4l .^DOObl -.008132 1. .0100 100. 2000.o4 bU. 000 .^buom .^49939 .040889 1. .0100 100. 2000.
128 bU.OUO .<i5G04l .^bOUbi -.0U8132 1. .0100 100. 2000.tt>b bU.UGu .250041 .<±b003l .004074 1. .0100 100. 2000.
•4 60.000 .^50041 .2b54b3 -2.1o84«i4 1. .0100 200. 2000.8 60.000 .<db004l .^0456 -,lbt>79b 1. .0100 200. 2000.
it. 60 .oOO • *:5O04l .^b0^44 -.0rtl3b2 1. .0100 200. zooo.yd bu.uUU .<:bU04l .^_>U12^ -.032541 1. .0100 200. 2000.04 60.000 .^bOO'+l •2b0061 -.0081^2 1. .0100 200. 2000.
i^rt bU.UUU .^50041 .^4990rt .052895 1. .0100 2U0. 2000.t_atj 6u.O0U .tibOOHl .<iS0o31 .U04U 74 1. .0100 200. 2000.
4 flU.UUU .^50041 •2b5005 -1.985349 1. .0100 100. 60.8 60 .oOU .<d5u04l .^oOoCil .004074 1. .0100 100. 60.
4 bU.UUU .^50041 .C--.049 74 -1. 97^»143 1. .0100 100.$ 60.8 bO.000 .,ibo04l .^D0tJ31 .004074 1. .0100 loo.s 60.
S-TIMiNG Pui_St_S bMbt-0 ON HEKlOiJ .010 PEKCENl LONGERMAN PLKlUlJ OF t-uuUMiCNIAL. SloNAi- FkEUUENCY
.^5u04i
.*:bo04l
.^bu04l
.^bu04i
.<i5004l• <d5o04l.250041.^5U041.^bu04.l
S- TIMING i^JLSlS bAbt_L) ON Pt-KlUufHAN PLKlub Or FUNDAMENTAL. SioNAL FKEUUEl.'CY
4 6u • UOU8 bu.uUU
lb bU . oOU32 6 U .
o4 bO.oOU128 bO .OOU<cbo bU .000old bu • OOU
lu24 b U .
,^j4547 •-1.802273 1. .0100 100.* 60.^49847 .0 77304 1. .0100 100.* 60,,i'*978b .1U1714 1. .OluO loo.s 60,24978b .101714 1. .0100 loo.s 60.id49 78b .101714 1. .0100 100.
s
60.«^4978b .1U1714 1. .0100 loo.s 60.d-+978t> .101714 1. .0100 loo.s 60.^+9 78b .101714 1. .0100 loo.s 60.24978b .101714 1. .0100 loo.s 60Uu .100 PEKCENl LONGER
Ti. i'i I No ERKOk IN NANOSECONDS
20

uibllAL POWEk MEASUREMENT PAGt 4 A
NO. OpPOiNTs
4
8lb32t>4
x28Cd6bl2lu24$='( IMiNG
PhAbLAImGlE
INT^gHmL bUi-i
bU.UUUbU .UUUbU .UUUbU.UUUoU .UUUbU.UUUbu.UOObU.UOU6u .UUU
PULbLb ba;
.^5U0Hl
.^buU4i
.*boo4i
.c:bOOHi
.^buom
.^bUOM-1• idbuO^l.^bo04i
.^oli9u
.247742
.<i'+7b94
.2«+79bb
.^79bb
.^479bb,^n79bb.2>+79bb.247955
PERCENTEkr°h
PCnJ . PCNT. TIDING FREQUENCYHArM. NO 1st ErhOr HZ
•ED On HtrtlUu l.UUU
-,*b97x7 1. .0100 lo0.$ bO..9194b2 1. .U1U0 luO.$ 60..tibo428 1. .010U lUU.$ 60..804017 i. .UlUU 100.4 60..ri34017 1. .OlUO 100.$ oO..8.34017 1. .0100 luO.$ bO..8b4017 1. .OlUU luO.$ 60..bO4017 1. .0100 100.$ bO..634017 1. .0100 luO.$ bO.
PERCENT LONGERTHAN PEkIuu Oh FUiml)mMENI'AI_ bioNAL FkEuuEinCY
4 bU.UOU .dbuO'+i8 bu.UOO -.25u04l
16 bu.uOu .<ib004l32 bu.UOu .<ibuOHlb4 bU.UUU .^buOHi
Xci8 bu.U.UU . <dbU04l<ibb bU.UUU .<ib004lOld bU.UOU .<;bu04i
1U24 bU.UUU .cbOOll1-TIlvllNG PULbtb bAbLQ ON PEkIOu lU.OOu PEKCEN
I
THAN PErtlOL) Oh huiMiW'.ENTAi. biuN^L FkEUUENCY
•2oblbb.2b872b.^7172.2^6697•dobti5b• 2bbh3t>•2bb83o•^obBObobhUb• t_.
-^.H'+91H0-3.4743b4-^.8bl9ub-<^.7420bl-<i.7x7bbl-2.7l7bbl-2.7l7bbl-il.70b44b-2.70544b
1.
1.
1.
1.
1.1.1.1.
1.
LONGER
.OlUO
.0100
.0100
.0100
.0100
.0100
.OlUU
.0100
.0100
luU.$100.$luU.$100.$100.3>100.%100.$100.$100.$
bO.
bO.
bO.bO«60.60.bO.bO<bO<
4 bu . OOu .<ibU04i .<ibbUUb -1.9nb349 1. .0100 IGO. bO.8 bU .UOU .<ibu041 .^bOlibi -.008102 1. .0100 loo. 80.
lb bU.UUU .*:bOU4l .*iJ003i .UU4074 1. .0100 luu. bO.
4 bu . UUU .^bU041 .2bb00b -1.9ttb349 1. .0100 100. 400.8 bU.UOU .<ibo04l ,<1DUU5L .UU4074 1. .0100 100. 4U0.
4 bU . UOU .^bU041 .^bu3b -I.y97bb3 1. .0100 1U0. 10 0.
8 bU . UUU .tbO04I .^bU18b -.Oob9bl 1. .0100 100. 1000.lb bU.UUU .<ibUOHl .^oOUix .0U4U74 1. .0100 100. 1000.
4 bu.UOO .^bUOHI .2bblr>7 -2.046373 1. .oluu luu. 2000.8 bO • UUU .^buOnl .^UUbl -.006132 1. .oloo luu. <iOOO.ib bU.UOO .<cb004i .^H976o .101714 1. .0100 luu. 2000.52 bU .UUU .^bu041 ,*;h9S»39 .U40bt39 1. .OlUU lUO. 2000.b4 b\J .UOU .^bu04i .,c;'t99bS .0^8464 1. .UlOO luo. 2000.X28 bu.UOU .^bU04l .^^OUbi -.006132 1. .0100 loo. 20U0.£ibb bU .UUU .<;bU04l . .r.bOUUu , UXo2oU 1. .0100 luo. 2000.bl2 bU .UUU .^buUnl .2uUu3l .UU407^ 1. .0100 luo. 2000.
Tii'tlNb EKKOr< iN NAi-iObt-CONuS
21

uiGIIAL KywtK htAbuRtMENI PAGE 5 A
No. OH HrlMbE INTEGRAL bUi«l PERCENT PCNT. PCNT. TIMING FREQUPuiN'Tb ANbl_E EKROK HARM. NOISE ERkOR HZ
4 6u .uOu .«ibuO<+l .253937 -1.538171 1. .0100 100. 10000.rt bu.OOU .«ibuO t+l .2»+8fa8ti .341095 1. .0100 100. 10000.
in bit .ulli) .250041 .249847 .077304 1. .0100 loo. 10000.$Z bu.OOU .^btlOHi .2^0122 -.032541 1. .oloo 100. 10000.o4 h U . U U U .<;buUHi •24975b .113919 1. .0100 100. 10000.xd* hu . UOU .«ibG041 .230092 -.020336 1. .0100 100. loooo.t:.)o bU.UOU •250041 .250092 -.020356 1. .0100 100. 100O0.^l^ bo • OUu .^bUOHl .*:dUU92 -.020356 1. .0100 100. 10000.
lu24 bU.UUU .^buO'+l .200U31 .u 04074 1. .0100 100. 10000.
Ti.i iUNo tRKOK iN NMNOSEGONUb
22

DIGITAL POWER MEASUREMENT PAGE 1 B
MO. OF r>HAS£ INTEGRAL SUM PERCENT Pe^JT. PCNT. TIMING FREQOENCY3 OINTS ANGLE ERROR HARM. NOISE ERROR HZ
512 .000 .5001 39 .500092 .009*498 3. .0100 50. 60.102*4 .000 .5001 39 .500122 .003396 3. .0100 50. 60.20*48 .000 .5001 39 .500122 .003396 3. .0100 50. 60.
512 .000 .5001 39 .5001 22 .003396 3. .0100 50. *400.
102*4 .000 .5001 39 .5001 22 .003396 3. .0100 50. *400.
20*48 .000 .5001 39 .5001 22 .003396 3. .0100 50. *4U0.
51 2 .000 .5001 39 .500092 .009*498 3. .0100 50. 1000.102*4 .0 00 .5001 39 .5001 22 .003396 3. .0100 50. 1000.20*48 .000 .5001 39 .500122 .003396 3. .0100 50. 1000.
512 .000 .500139 .500 9 2 .009*498 3. .0100 50. 2000.1024 .0 00 .500139 .5001 22 .003396 3. .0100 50. 2000.20*48 . OGO .500139 .5001 22 .003396 3. .0100 50. 2000.
51 2 .000 .500000 ,.*499939 .01 2207 0. .0100 50. 5000.
1024 .0 30 •500000 .'499969 .00610*4 0. .0100 50. 5000.2o*4e .oou .50001)0 .*499969 .00610*4 0. .0100 50. 5000.
512 6 . J .2501 39 .2501 22 .006789 3. .0100 50. 60.102*4 6 . J .250139 .2501 22 .006789 3. .0100 50. 60.20*48 6 0.000 .250139 .250122 .006789 3. *01Q0 50. 60.
51 2 6 0.030 .250 1 39 .2501 22 .006789 3. .0100 50. *400.
102*4 6 U . .2501 39 .2501 22 .006789 3. .0100 50. *400.20*48 6 . D Li .2501 39 .250122 .006789 3. .0100 50. *400.
51 2 6 G . .250139 .2501 22 .006789 3. .0 100 50. 1000.1 02*4 6 . G .250139 .250122 .006769 3. .0100 50. 1000.20*4R 6 0.000 .2501 39 .2501 22 .006789 3. .0100 50. 1000.
TIMING ERROR IN NANOSECONDS
COMPUTER PRINTOUT "b"
23

DIGITAL POWER MEASUREMENT PACE 2 B
NO. OF
POI NTSPHASEANGLE
INTEGRAL SUM PERCENT PCNT. PCNT. TIMING FREQUENOERROR HARM. NOISE ERROR HZ
5121 0242048
60.000 .2S0139 .250122 .006789 3. .0100 SO. 2000.60.000 .250139 .250122 .006789 3. .0100 50. 20U0.60. ODD .25CI39 .250122 .006789 3. .0100 50. 2000.
51 2
10242048
60.000 .250049 .250061 -.004919 1. .0100 50. bUOO.60.000 .250049 .250000 .019491 1. .0100 50. 500.0.
60.000 .25U049 .250061 -.004919 1. .0100 50. 5000.
5121 0242048
89 .99989.99989.999
000 1 48
000148OOUl 48
.000 1 22
.000122
.000122
-.U05 I 42*-. 005142*-.005142*
.0100
.0100
.0100
50.
50.50.
60
60.
60.
5121 0242048
89.99989.99989.999
000 148
0001 48
.000 1 48
.0001 22
.000122
.000122
-.0 05142*-.0 05 1 42*-.005142*
3.
3.
3.
.0100
.0100
.0100
50.
50,
50,
4U0,
4U0,400.
51 2
1 0242048
89.999 .000148 .000122 -.005142* 3. .0100 50. 1000.89.999 .000148 .000122 -.005142* 3. .0100 50. 10U0.89.999 .000148 .000122 -.005142* 3. .0100 50. 1 U .
51 2
1 0242048
89.99989.99989. 999
OOUl 48
oojiteU U 1 4 8
.000122
.OOu 1 53
.000122
.0051 42*
.00096 1 *
.0051 42*
.0100
.0100
.0 100
50.50.50.
20J0.2JU0.2000.
5 1 2
1 024204 8
89.999 .000057 .000000 -.011492* 1. .0100 50. bOuO.89.999 .00U057 .000031 -.005388* 1. .0100 50. 5000.89.999 .000057 .000031 -.005388* 1. .0100 50. 5UU0.
51 2
1 0242048
60.00 .25J139 .250122 .0067 8 9 3 . .0000 50. 4u0.6 0.000 .250139 .25J122 .006789 3. .0000 50. 4d0.60.000 .250139 .25U122 .0 06789 3. .0000 50. 4U0.
TIMING ERROR IN NANOSECONDS• = ERROR CALCULATED AS PERCENT OF FULL SCALE
2U

DIGITAL PO'NER MEASUREMENT page 3 b
512102 4
2048
5 I 2
1 0242 04 8
5 I 2
I 02 4
20 M8
5! 2
102 4
2048
PHASE INTEGRAL SUM Pt^v-L... . PCNT. PCNT. T I M IN G FkEUUANGLE ERROR HARM. NOISE ERROR HZ
6 0.000 .250139 .250092 .01 8989 3. .0300 50. 4J0.6 0.000 .2501 39 . 2501 22 .006789 3. .0300 50. 400.6 0.030 .2501 39 . 25U1 22 .006789 3. .0300 50. 400.
60.000 .250 I 39 .2501 53 -.0054 1 1 3. . 1 000 50. 400.6 0.000 . 250 1 39 .250153 -.00541 1 3. . I 000 50. 400.6 0.0 .250139 .250092 . 18 9 8 9 3. . 1 000 50. 400.
6 0.0 . 25U 1 39 .2501 22 .006789 3. .0000 1 00. 400.6.0. 00 .25J1 39 . 2501 22 .006789 3. .0000 1 00. 400.6 0.000 .250 1 39 . 2501 22 .006789 3. .0000 100. 400.
6 0.000 . 25U1 39 .250122 .006789 3. .0100 1 00. 400.
6 0.0 J .2501 39 . 250 1 22 .006789 3. .0100 1 00. 400.6U.0UJ .250139 .25U 1 22 .006789 3* .0100 1 00. 400.
6 0.0 U .250139 .25U1 22 .006789 3. .0300 1 00. 400.6 0.000 .250139 .2501 22 .006709 3. .0300 100. 4dO.6 0.0 1.) U . 250 1 39 . 250 1 22 .006789 3. .0300 1 00. 4U0.
6 . J .250139 .250092 .018989 3. . 1 000 100. 400.6 0.000 .25u 1 39 .250092 .01 8989 3. .10 1 00. 400.6 0.000 .250 1 39 . 2501 22 .006789 3 . . 1 000 1 00. 400.
6 .000 . 25ul 39 .250 1 22 .006789 3. .oooc 50. 2000.6 u . .250139 .25U1 22 .006789 3. .0000 50. 2000.6 0.00 .250139 . 250 1 22 . 6 7 8 9 3. .0000 50. 2000.
6 . J .250139 .250122 .006789 3. . 1000 50. 2U00.6 . J .253139 .250092 . 1 8989 3. . 1000 50. 2UG0.6 . . 2501 39 .250122 .006789 3. . 1 000 50. 2000.
T I M I N G E R K fl R I M N A N S E C M 1) S
25
DIGITAL POWER MEASUKEMENT PAGE H B
NO. OF
POI NTSPHASEANGLE
INTEGRAL SUM PERCENT PCNT. PCNT. TIMING FREQUENCYERROR HARM. NOISE ERROR HZ
51 2
10242 0M8
60.0U0 .250139 .250092 .01898963.033 .250139 .250122 .0067896 3.303 .250139 .253122 .006789
3. .0000 100. 2 3 3 0.
3. .0000 100. 2030.3. .0000 100. 2030.
51 2
102420*48
60.003 .253139 .250122 .006789 3. .0100 100. 2000.60.000 .250139 .250092 .018989 3. .0100 100. 2000.60.003 .25 J 139 .250122 .006789 3. .0103 130. 2030.
51 2
132M20HH
6 0.000 .253139 .250122 .006789 3. .100063.03d .253139 .253122 .006789 3. .10006 3.303 .25U139 .25 3 122 .036789 3. .1030
TIMING ERROR IN NANOSECONDSNO
100. 2033.100. 2330.10 0. 2333.
26

Digital Wattmeter Using a Sampling Method
RAYMOND S. TURGEL, member, ieee
Abstract—Average electric power can be measured by a system
that samples voltages and currents at predetermined intervals. Thesampled signals are digitized and the result is computed by numerical
integration. The response of the system agrees with that of a stand-
ard electrodynamic wattmeter within 0.02 percent from dc to 1 kHz,
with the possible exception of zero power factor measurements.
Measurements up to 5 kHz can be made with somewhat greater
uncertainties.
I. INTRODUCTION
BECAUSE BASIC electrical standards are defined in
terms of dc quantities, the measurement of ac quan-
tities requires an ac-dc transfer process. Underlying all
such transfer processes are certain assumptions about the
limits of uncertainty associated with the measurement that
cannot be determined precisely. Corroborative evidence
from other independent methods of measurement is there-
fore the only means to increase the confidence in the method
used and in the assumptions made.
The digital wattmeter described here is based on a
method that differs from the electrodynamic, electro-
static, thermal, and Hall effect wattmeters, all of which
make use of analog multiplication of current and voltage
performed by a physical process in the device. In the
digital instrument the multiplication involves discrete
numbers and in itself introduces no experimental errors
(other than predictable rounding errors)
.
Additionally, the digital method opens up possibilities
of performing power measurements very rapidly, which
may be of value in power control applications, and also
of measuring nonsinusoidal waveforms with greater ac-
curacy. Both of these advantages, however, have so far
not been fully exploited.
II. EXPERIMENTAL METHODThe fundamental equation for calculating the average
electric power is
P = (l/T) f eidt. (1)
•'o
For sinusoidal quantities, T is chosen to be a multiple of
the period of e or i,
T = n/f (2)
where n is a positive integer and / is the frequency of the
sine wave. The present method is closely related to the
fundamental formula ( 1 ) . Instantaneous values of voltage
Manuscript received July 3, 1974; revised August 22, 1974. Thispaper is a contribution of the National Rureau of Standards and is
not subject to copyright.The author is with the Electricity Division, National Bureau of
Standards, Washington, D. C. 20234.
and current are measured simultaneously, and from sets
of these measurements the average power is computed
using digital methods. Because the number of measure-
ments is necessarily finite, the integral of (1) is replaced
by a summation and the time inteval T by the number of
measured points N,
P-U/JV) £«/»*, j = i,.- vv. (3)
For dc power, where e and i are constant, the summation
will obviously lead to the correct result. For sinusoidal
quantities, however, we i^ed to define conditions further.
In (2) the time over which the integration extends is
related to the period of the voltage or current waveforms.
Similarly, the time taken for N samples must be such that
the interval between samples is an integral fraction of the
period, and all such intervals must be equal to one another.
It can be shown that under these conditions, with at
least 3 samples per cycle, the summation will theoretically
be exact [1]. In practice, of course, more samples are
needed to reduce the effects of random noise and fluctua-
tions in sample timing. The important point is that samples
are taken at definite intervals and not at random. Randomsampling does not produce rapid convergence in the
numerical integration process and therefore is not suited
for high accuracy measurements.
To determine how many samples would be needed for a
power measurement, a computer simulation of the mea-
surement process was carried out. The study took into
account the effects of input noise, timing uncertainty,
presence of harmonics, and errors due to finite resolution.
The known value of the integral given by (1) and (2)
was compared with the computed summation of (3).
The acceptable tolerance limit was set at 100 ppm and
the presence of random noise with a peak value of 100
ppm was postulated. From this study, which is being
published as a separate National Bureau of Standards
(NBS) report, the following conclusions can be drawn.
1) Not more than 512 sample points are required.
2) A timing uncertainty of 50 ns is tolerable.
3) The percentage error due to systematic timing errors
is proportional to the percentage deviation of the timing
base period from the period of the input waveform.
4) A resolution corresponding to 15 bits for the measured
values of current and voltage is adequate.
5) The sampling rate must be at least 40 kHz to resolve
frequency components up to 10 kHz.
The measurement process can now be summarized as
follows. Simultaneous samples of the current and voltage
waveforms are taken at predetermined intervals. Thesampling interval is an integral fraction of the period
27

1 I
PLL • FREQ OIV
TIMING
PULSEGEN
fH1
AMPL S/H • ADC
j
$ f=AMPL S/H ADC
C
MPUMUXTE
R
Fig. 1. Functional block diagram of digital wattmeter.
of the waveform and the time at which sampling occurs is
defined with an uncertainty less than 50 ns. The sampling
process is implemented by sample-and-hold amplifiers
controlled by a special timing pulse generator. The values
of the instantaneous signal voltage "captured" by the
S/H circuits are digitized using analog-to-digital converters
(ADC), with a resolution of 1 in 16384. The resulting
digital output is then used in the numerical calculation
of the power.
III. HARDWARE
A . Signal Conditioning
The functional blocks of the system are shown in Fig. 1.
The voltage and current waveforms can be sampled either
in a circuit with a real load, or with phantom loading.
The "current" signal is obtained from a specially
constructed bifilar shunt with a time constant of 2 ns. 1
At 5 A, the voltage drop across the shunt is 0.5 V, thus
keeping the dissipation to 2.5 W. Forced air cooling is
used to minimize the temperature rise of the resistive
element.
The "voltage" signal is obtained from a two-stage
step-down transformer [2] with a 200-to-l ratio which
has negligible ratio and phase corrections. Two similar
transformers are used, one for the frequency range of 50
to 400 Hz, the other for the range of 400 to 2000 Hz.
The secondary voltage is 0.5 V. This value was chosen so
that the current and voltage signals are comparable in
magnitude and so that input channels can easily be inter-
changed.
For dc measurements a precision volt-box accurate to
within 2 ppm is used instead of a transformer.
B. Preamplifiers
The two input signals are fed into high-impedance
instrumentations amplifiers2 which permit the shunt outputand the transformer secondary to work essentially onopen circuit. The amplifier gain is fixed at a nominalvalue of 13.0 and is fiat within 50 ppm from dc to 5 kHz.The gain raises the 0.5-V inputs to the level required by the
sample-and-hold circuitry, that is, ±10-V peak. An im-
' Designed by T. M. Souders, Electricity Division, NationalBureau of Standards, Washington, D. C.
2 Designed by L. Marzetta, Measurement Engineering Division,National Bureau of Standards, Washington, D, C.
portant consideration in power measurement is that the
phase shift be the same in both channels. At 10 kHz the
difference is phase shift of the two amplifiers was less than
600 ^rad. Moreover, the effects of small remaining
differences in phase shift can be canceled by averaging
measurements with the two channels interchanged [3].
C. Timing Pulse Generator
A critical part of the measurement process is the timing
of the sampling and conversion command. The timing
pulse changes the S/H amplifiers from the "sample" to
the "hold" state in which they retain at their outputs the
values of the input voltages present at the time of the
transition. The timing pulse also initiates the analog-to-
digital conversion, which begins after a short delay to
allow for settling of the S/H amplifiers.
The timing of the command pulse is brought into a
definite relationship with the input signal by means of a
phase-lock circuit. 3 The phase-locked loop (PLL) operates
in a conventional manner with only minor modifications.
Part of the input voltage signal is fed to a high-im-
pedance instrumentation amplifier with good commonmode rejection which acts as a buffer to isolate the analog
measuring circuit from the digital circuitry. The amplifier
gain is chosen so that the phase lock will work reliably
over an input voltage range from 0.1 to 1.0 V.
The frequency of the voltage signal appearing at the
output of the amplifier is then compared to a subharmonic
of the pulse repetition frequency in a phase sensitive
detector which in turn controls the frequency of the pulse
oscillator.
The subharmonic is obtained by means of a binary fre-
quency divider which has 9 manually selectable ratios.
These range from a ratio of 4 to a ratio of 512. Therefore,
since the oscillator operates over a band from 20 kHz to
40 kHz the subharmonic generated by the highest ratio
setting (512) ranges from 40 to 80 Hz. Similarly, for the
lowest ratio setting (4) the subharmonic varies from 5
kHz to 10 kHz. Thus there is a definite ratio setting for
eVery analog input frequency. It follows that, for instance,
for an input of 60 Hz there are 512 sampling points per
cycle, while for an input of 6 kHz there are only 4 samples
per cycle. The ADC's however, always operate at the
3 Designed by O. Laug, Measurement Engineering Division,National Bureau of Standards, Washington, D. C.
28
mm msm "«™—™«

maximum possible rate consistent with the phase-lock
requirements from 20 000 to 40 000 conversions per second.
There is a tradeoff between capture range and stability
in phase-lock circuits. Since in this application stability
is of overriding importance, the loop filter circuits have
been selected to provide high stability. As a consequence
the capture range is fairly narrow and a manual frequency
adjustment of the oscillator is required to bring it into lock.
A 10-turn variable resistor serves as the tuning element.
To determine the correct adjustment point, an indicator
light signals the out-of-lock condition and a meter con-
nected to the output of the phase comparator provides a
reading for fine adjustment. An alternate method to deter-
mine proper adjustment uses the digitized data and a
special software routine in the computer which will be
described later.
D. Analog-to-Digital Converters (ADC)
The outputs of the preamplifiers are fed to two parallel
S/H circuits that are physically part of the converter unit.
The sampled "instantaneous" voltages are retained at the
outputs of the S/H amplifiers within the specified ac-
curacy limits long enough for the analog-to-digital con-
version to be completed. The two resulting digital num-bers are then multiplexed to a common 15-bit parallel
output.
The configuration described is preferable to the per-
haps more usual one where an analog multiplexer feeds
signals to a single channel ADC. It avoids the additional
errors introduced by analog multiplex switching circuits
and, at least in this case, at no additional cost. The output
digital multiplexer, which is not subject to disturbance
by noise and offset voltages, does not contribute to the
error of the measurement.
Each of the ADC's converts the analog input by the
method of successive approximations to a 15-bit (14
bits plus sign) two's complement binary number. Theactual conversion time is about 15 /xs. Taking into account,
various settling times and the time required to transfer
the output data, a minimum of 25 us is required betweenconversion cycles. The maximum throughput rate is
therefore 40 kHz. Binary signals control the output-
channel selection, output-inhibit function, and indicate
when the conversion is completed.
E. Computing Circuitry
At the time the project was planned, intergrated circuits
for high-speed digital arithmetic were not as easily avail-
able as they are now. Building of special circuits for real
time computation, therefore, did not appear advisable.
The selection of a minicomputer instead of special hard-
ware, in retrospect, certainly seems to have been the better
choice, even though calculations eannot be done in real
time. The flexibility afforded by a general purpose com-puter makes possible not only a relatively easy change of
experimental procedures, but also provides the opportunityfor using diagnostic routines to detect malfunction or
input errors.
The computer chosen had a 16-bit word and originally
had 4096 (4K) words of memory. The memory was later
expanded to 12K to permit the use of a "basic" (pro-
graming language) interpreter.
In order to link_the computer with the ADC's, a special
interface is required which must generate a signal to
interrogate the two ADC channels alternately. The time
between samples is insufficient for the normal input-
output (I/O) channels of the computer and the ADC,data are therefore transferred through a direct memoryaccess (DMA) channel. Since the ADC data occupy only
15 bits, the sixteenth bit of the computer word is used as a
channel indicator. Channel identification is helpful in
verifying the proper functioning of the interface and in
correlating corresponding ADC outputs.
With the 4K memory, 1024 data words (corresponding
to 512 sample points), as well as the machine language
program, could be accommodated, however, with little
room to spare. On the other hand, in the 12K environment,
the "basic" interpreter together with additional special
routines and data storage do not fill all of the available
memory.Printed output from the computer is obtained through
a conventional teleprinter.
F. Input Circuit Switching
Input connections to the two preamplifiers are madethrough a patchboard using British Post Office type
coaxial connectors. These provide very reliable low-
resistance connections and show little signs of wear. Thechoice of a patchboard type input was a matter of ex-
pediency. In the long run, however, a system of computer
controlled switches would be more useful. In the present
arrangement each of the two channels can be connected,
singly or together, to the following "sources":
1) "zero" ( 100-ft internal resistance)
;
2) calibration voltage;
3) shunt output voltage;
4) transformer output voltage; and
5) volt-box output (for dc voltage).
All of these are required for the measurement procedure.
IV. SOFTWARE
With the limited amount of memory available initially,
all routines were written in assembly language using
integer arithmetic. Because the ADC output has only
15 significant bits, a 16-bit computer word is adequate
for the calculation of the results. Later, after the memorywas expanded, some of the integer computations were
incorporated as special subroutines into the "basic"
system in the interest of speed. As an example, the com-putation time required for a typical power measurementusing unmodified "basic" is roughly 55 s. With integer
subroutines the time taken is reduced to less than 1 s.
It is usually desirable to provide at least some internal
checks to guard against malfunction or improper inputs.
29

TABLE I
Differencefrom Uncertainty
Comparison of
Standard StandardPower (percent of
full scale)
Comparison (percent of
full scale)Frequency Factor Standard
dc -0.004 dc potenti-ometerand shunt
0.002
50 1 0.014 wattmeter 0.010.007 DTVC° 0.005
-0.004 rms^ 0.0050.5 lead 0.018 wattmeter 0.020.5 lag 0.014 wattmeter 0.02
60 1 0.008 wattmeter 0.01-0.018 rmsd 0.005
0.5 lead 0.018 wattmeter 0.020.5 lag 0.010 wattmeter 0.02
400 1 0.026 wattmeter 0.020.016 DTVC 0.005
-0.018 rmsd 0.0050.5 lead 0.015 wattmeter 0.030.5 lag 0.008 wattmeter 0.03Olead 0.035 wattmeter 0.03
1000 1 -0.009 wattmeter 0.03-0.017 DTVC 0.005-0.019 rmsd 0.005
0.5 lead 0.012 wattmeter 0.060.5 lag 0.024 wattmeter 0.06Olead -0.046 wattmeter 0.06Olag -0.018 wattmeter 0.06
2000 1 -0.038' wattmeter 0.04-0.016 DTVC 0.005
0.5 lead 0.083 wattmeter 0.110.5 lag 0.013 wattmeter 0.11
5000 0.016b DTVC 0.005
a Amplifier response correction 0.141 ± 0.01 percent.b Amplifier response correction 1.14 ± 0.1 percent." DTVC indicates differential thermocouple voltage converter.d See text.
Diagnostic routines check the ADC channel number, the
sequence in which data is stored in memory, and also
whether the ADC output exceeded maximum positive
or negative values. One indication of faulty connections
in the analog signal path is the noise superimposed on dc
measurements. Such noise can be detected from the stand-
ard deviation of a set of measurements performed at the
40-kHz sampling rate.
Certain test instruments, such as oscilloscopes, whenattached at critical points modify the system response
because of loading, ground loops, or pickup. To prevent
such interference it is possible to use the computer itself
to test the system by means of special software routines.
For instance, offset adjustment of the data amplifiers
can be checked by displaying the ADC output on the
computer front panel indicator lights. Similarly, such a
display can be used to locate the transition points whencalibrating the ADC.Under some conditions the sensitivity of the phase-lock
null meter is insufficient for optimum adjustment of the
oscillator. Finer adjustment can be obtained with the help
of a routine that calculates the differences between
successive peak-to-valley amplitudes of the input wave-form as measured by the sampling circuit and the ADC.
The phase lock can then be optimized by adjusting the
oscillator so that the differences, which are displayed on
the panel, are minimized. This method of adjustment pre-
supposes that the ac source has sufficient cycle-to-cycle
stability.
V. EXPERIMENTAL PROCEDURE
Wherever possible, measurement procedures relied on
external standards in order to be independent of such
circuit parameters as drift, offset, gain, and internal
reference source stability. Each measurement sequence
starts with a "zero reading" which is then applied as a
correction to subsequent data. Next is the "calibration
voltage" obtained from a Zener reference source stable to
within a few parts per million per month. These measure-
ments are the average of 512 readings on each channel.
Both positive and negative calibration voltages are used
to compensate for a slight asymmetry in the response
of the S/H-ADC combination that varied slowly with time.
During the computation of the power, the appropriate
pair of calibration constants is used depending on the sign
of the measured value and the measurement channel.
Thus, if it can be assumed that in the brief interval between
calibration and measurement the circuit parameters
30

change only by negligible amounts, the computed value
will be independent of offsets and the value of the gain
in amplifiers and ADC's.
To investigate the performance of the system two types
of measurements were made: 1) comparison with an
electrodynamic wattmeter (Yokogawa APR-2) ; 2) com-
parison with a differential thermal voltage converter [4].
The results of these measurements are summarized in
Table I, which shows the percentage differences between
the readings from the digital system and those from the
comparison standard. The intercomparison with the
wattmeter was carried out at 5 frequencies at unity and
at half-power factors, and in two cases at zero power
factor. Power measurements were made at a nominal
input of 100 V and 5 A.
The results using the differential thermal voltage
converter with an input of 100 V to both channels were
calculated either as a simulated power measurement at
unity power factor, or by computing the rms value for
each channel (indicated by "rms" in the table). In the
first case the calculations were carried out exactly as in the
wattmeter comparison using (3) with N = 512. In the
second, the rms value was computed separately for each
channel before forming the product. At 2 kHz and 5
kHz a correction was applied for the drop in the response
of the S/H amplifier. This increased the uncertainty by0.01 percent and 0.1 percent, respectively. Short term
precision of 0.006 percent could be realized, and overall
repeatability was estimated by combining all 400-Hz
data, regardless of how they were obtained. This yielded
a standard deviation of 0.02 percent of reading and0.004 percent of the mean.
VI. CONCLUSIONS
A method was described of measuring average electric
power by sampling instantaneous voltages and currents
from which the result was computed by numerical inte-
gration. Intercomparisons with an electrodynamic watt-
meter and a differential thermal voltage converter agreed
within 0.02 percent from dc to 1 kHz, with the possible
exception of zero power factor measurements and with
jomewhat larger uncertainties up to 5 kHz.
ACKNOWLEDGMENT
The author wishes to thank N.M. Oldham for assistance
with obtaining the intercomparison data and A.G. Perrey
for help with the construction of the electronic circuitry,
both of the Electricity Division, National Bureau of
Standards.
REFERENCESWal-[1] P. J. Davis and R. Rabinowitz, Numerical Integration.
tham, Mass.: Blaisdell, 1967.
[2] W. C. Sze and F. R. Kotter, "The design of near-perfect instru-ment transformers of simple and inexpensive construction," J.Appl. Meas., vol. 2, pp. 22-27, 1974.
[3] M. Tomata, T. Sugiyama, and K. Yamaguchi, "An electronicmultiplier for accurate power measurements," IEEE Trans.Instrum. Meas., vol. IM-17, pp. 245-251, Dec. 1968.
[4] F. L. Hermach, J. E. Griffin, and E. S. Williams, "A system for
accurate direct and alternating voltage measurements," IEEETrans. Instrum. Meas., vol. IM-14, pp. 215-224, Dec. 1965.
Reprinted by permission from IEEE TRANSACTIONS ON INSTRUMENTATION AND MEASUREMENTVol. IM-23, No. 4, December 1974, pp. 337-341
Copyright 1975 by the Institute of Electrical and Electronics Engineers, Inc.
PRINTED IN THE U.S.A.
31

U.S. DEPT. OF COMM.BIBLIOGRAPHIC DATA
SHEET
1. PUBLICATION OR REPORT NO.
NBS TN-870
2. Gov't AccessionNo.
3. Recipient's Accession No.
4. TITLE AND SUBTITLE
Sampling Techniques for Electric Power Measurement
5. Publication Date
June 19756. Performing Organization Code
7. AUTHOR(S)
R. S. Turgel8. Performing Organ. Report No.
9. PERFORMING ORGANIZATION NAME AND ADDRESS
NATIONAL BUREAU OF STANDARDSDEPARTMENT OF COMMERCEWASHINGTON, D.C. 20234
10. Project/Task/Work Unit No.
11. Contract/Grant No.
12. Sponsoring Organization Name and Complete Address (Street, City, State, ZIP) 13. Type of Report & PeriodCovered
Final
14. Sponsoring Agency Code
15. SUPPLEMENTARY NOTES
Library of Congress Catalog Card Number: 75-600034
16. ABSTRACT (A 2 00- word or less factual summary of most significant information. If document includes a significant
bibliography or literature survey, mention it here.)
A system is described that determines average electric power by periodicallysampling current and voltage waveforms and calculating the result from digitizedvalues of measured instantaneous currents and voltages. System performance is
modeled on a digital computer to investigate the effects of noise, harmonics andsampling time errors on the result of a simulated power measurement. With 15bit analog- to- digital conversion and 512 measured sample points an accuracy of0. 01% can the^--*-^=>Uv be obtained from dc up to 5 kHz.
17. KEY WORDS (six to twelve entries; alphabetical order; capitalize only the first letter of the first key word unless a propername; separated by semicolons)
Analog- to- digital conversion; digital; electric power; electricity; measurement;sampling; simulation; wattmeter.
18. AVAILABILITY \JQ Unlimited
IFor Official Distribution. Do Not Release to NTIS
Cg Order From Sup. of Doc, U.S. Government PrintinE OfficeWashington, D.C. 20402, SD Cat. No. CI 3. 46:870
U Order From National Technical Information Service (NTIS)Springfield, Virginia 22151
19. SECURITY CLASS(THIS REPORT)
UNCLASSIFIED
20. SECURITY CLASS(THIS PAGE)
UNCLASSIFIED
21. NO. OF PAGES
35
22. Price
$1.05
USCOMM-DC 29042-P74

NBS TECHNICAL PUBLICATIONS
PERIODICALS
JOURNAL OF RESEARCH reports National Bureau
of Standards research and development in physics,
mathematics, and chemistry. It is published in two sec-
tions, available separately:
• Physics and Chemistry (Section A)
Papers of interest primarily to scientists working in
these fields. This section covers a broad range of physi-
cal and chemical research, with major emphasis on
standards of physical measurement, fundamental con-
stants, and properties of matter. Issued six times a
year. Annual subscription: Domestic, $17.00; Foreign,
$21.25.
• Mathematical Sciences (Section B)
Studies and compilations designed mainly for the math-
ematician and theoretical physicist. Topics in mathe-
matical statistics, theory of experiment design, numeri-
cal analysis, theoretical physics and chemistry, logical
design and programming of computers and computer
systems. Short numerical tables. Issued quarterly. An-
nual subscription: Domestic, $9.00; Foreign, $11.25.
DIMENSIONS/NBS (formerly Technical News Bul-
letin)—This monthly magazine is published to inform
scientists, engineers, businessmen, industry, teachers,
students, and consumers of the latest advances in
science and technology, with primary emphasis on the
work at NBS. The magazine highlights and reviews such
issues as energy research, fire protection, building tech-
nology, metric conversion, pollution abatement, health
and safety, and consumer product performance. In addi-
tion, it reports the results of Bureau programs in
measurement standards and techniques, properties of
matter and materials, engineering standards and serv-
ices, instrumentation, and automatic data processing.
Annual subscription: Domestic, $9.45; Foreign, $11.85.
NONPERIODICALS
Monographs—Major contributions to the technical liter-
ature on various subjects related to the Bureau's scien-
tific and technical activities.
Handbooks—Recommended codes of engineering andindustrial practice (including safety codes) developedin cooperation with interested industries, professional
organizations, and regulatory bodies.
Special Publications—Include proceedings of confer-
ences sponsored by NBS, NBS annual reports, and otherspecial publications appropriate to this grouping suchas wall charts, pocket cards, and bibliographies.
Applied Mathematics Series—Mathematical tables,
manuals, and studies of special interest to physicists,
engineers, chemists, biologists, mathematicians, com-puter programmers, and others engaged in scientific
and technical work.
National Standard Reference Data Series—Providesquantitative data on the physical and chemical proper-ties of materials, compiled from the world's literature
and critically evaluated. Developed under a world-wide
program coordinated by NBS. Program under authority
of National Standard Data Act (Public Law 90-396).
NOTE: At present the principal publication outlet for
these data is the Journal of Physical and Chemical
Reference Data (JPCRD) published quarterly for NBSby the American Chemical Society (ACS) and the Amer-ican Institute of Physics (AIP). Subscriptions, reprints,
and supplements available from ACS, 1155 Sixteenth
St. N. W., Wash. D. C. 20056.
Building Science Series—Disseminates technical infor-
mation developed at the Bureau on building materials,
components, systems, and whole structures. The series
presents research results, test methods, and perform-
ance criteria related to the structural and environmen-
tal functions and the durability and safety character-
istics of building elements and systems.
Technical Notes—Studies or reports which are complete
in themselves but restrictive in their treatment of a
subject. Analogous to monographs but not so compre-
hensive in scope or definitive in treatment of the sub-
ject area. Often serve as a vehicle for final reports of
work performed at NBS under the sponsorship of other
government agencies.
Voluntary Product Standards—Developed under pro-
cedures published by the Department of Commerce in
Part 10, Title 15, of the Code of Federal Regulations.
The purpose of the standards is to establish nationally
recognized requirements for products, and to provide
all concerned interests with a basis for common under-
standing of the characteristics of the products. NBSadministers this program as a supplement to the activi-
ties of the private sector standardizing organizations.
Federal Information Processing Standards Publications
(FIPS PUBS)—Publications in this series collectively
constitute the Federal Information Processing Stand-ards Register. Register serves as the official source of
information in the Federal Government regarding stand-
ards issued by NBS pursuant to the Federal Propertyand Administrative Services Act of 1949 as amended,Public Law 89-306 (79 Stat. 1127), and as implementedby Executive Order 11717 (38 FR 12315, dated May 11,
1973) and Part 6 of Title 15 CFR (Code of Federal
Regulations).
Consumer Information Series—Practical information,
based on NBS research and experience, covering areasof interest to the consumer. Easily understandablelanguage and illustrations provide useful backgroundknowledge for shopping in today's technological
marketplace.
NBS Interagency Reports (NBSIR)—A special series of
interim or final reports on work performed by NBS for
outside sponsors (both government and non-govern-ment). In general, initial distribution is handled by the
sponsor; public distribution is by the National TechnicalInformation Service (Springfield, Va. 22161) in papercopy or microfiche form.
Order NBS publications (except NBSIR's and Biblio-
graphic Subscription Services) from: Superintendent ofDocuments, Government Printing Office, Washington,D.C. 20402.
BIBLIOGRAPHIC SUBSCRIPTION SERVICESThe following current-awareness and literature-surveybibliographies are issued periodically by the Bureau:Cryogenic Data Center Current Awareness Service
A literature survey issued biweekly. Annual sub-
scription: Domestic, $20.00; foreign, $25.00.
Liquefied Natural Gas. A literature survey issued quar-terly. Annual subscription: $20.00.
Superconducting Devices and Materials. A literature
survey issued quarterly. Annual subscription: $20.00.
Send subscription orders and remittances for the pre-
ceding bibliographic services to National TechnicalInformation Service, Springfield, Va. 22161.
Electromagnetic Metrology Current Awareness ServiceIssued monthly. Annual subscription: $100.00 (Spe-cial rates for multi-subscriptions). Send subscriptionorder and remittance to Electromagnetics Division,
National Bureau of Standards, Boulder, Colo. 80302.

U.S. DEPARTMENT OF COMMERCENational Bureau of StandardsWashington. D.C. 20234
OFFICIAL BUSINESS
Penalty for Private Use. S300
POSTAGE AND FEES PAIDU.S. DEPARTMENT OF COMMERCE
COM-215
SPECIAL FOURTH-CLASS RATEBOOK
'^8-rtT*>