Sampling Distributions of Proportions. Parameter A number that describes the population Symbols we...
25
Sampling Sampling Distributions Distributions of Proportions of Proportions
-
Upload
myles-austin -
Category
Documents
-
view
225 -
download
2
Transcript of Sampling Distributions of Proportions. Parameter A number that describes the population Symbols we...

Sampling Sampling Distributions of Distributions of
ProportionsProportions

Parameter
• A number that describes the population
• Symbols we will use for parameters include- mean
– standard deviation
– proportion (p)
– y-intercept of LSRL
– slope of LSRL

Statistic
• A number that that can be computed from sample data without making use of any unknown parameter
• Symbols we will use for statistics includex – mean
s– standard deviation
p– proportion
a– y-intercept of LSRL
b– slope of LSRL

A distributiondistribution is all the values that a variable can be.

• Toss a penny 20 times and record the number of heads.
• Calculate the proportion of heads & mark it on the dot plot on the board.
What shape do you think the What shape do you think the dot plot will have?dot plot will have?
The dotplot is a partial graph of the sampling distribution of all sample proportions of sample
size 20. If I found all the possible sample proportions – this would
be approximately normal!
Sampling DistributionSampling Distribution
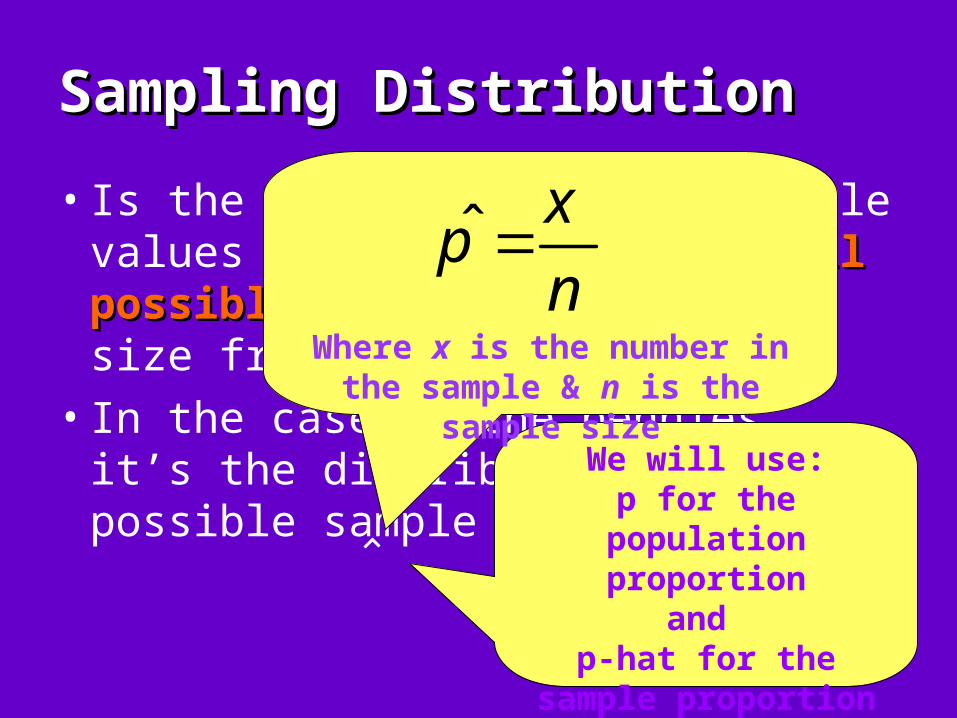
• Is the distribution of possible values of a statisticstatistic from all possibleall possible samples of the same size from the same population
• In the case of the pennies, it’s the distribution of all possible sample proportions (p)
We will use:p for the population
proportionand
p-hat for the sample proportion
Where x is the number in the sample & n is the sample size
nx
pˆ

Suppose we have a population of six Suppose we have a population of six people: Alice, Ben, Charles, Denise, people: Alice, Ben, Charles, Denise, Edward, & FrankEdward, & Frank
We are interested in the proportion of females. This is called
What is the proportion of females?
Draw samples of two from this population.Draw samples of two from this population.
How many different samples are possible?
The parameter of interestThe parameter of interest
66CC22 =15 =15
1/31/3
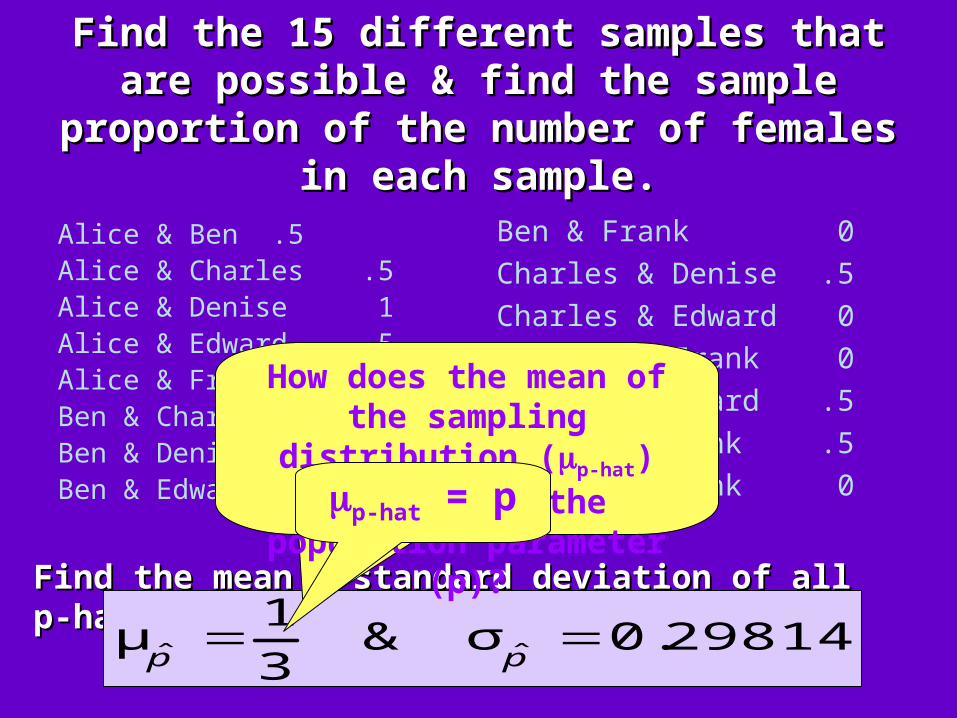
Find the 15 different samples that are Find the 15 different samples that are possible & find the sample proportion of the possible & find the sample proportion of the
number of females in each sample.number of females in each sample.
Alice & Ben .5Alice & Charles .5Alice & Denise 1Alice & Edward .5Alice & Frank .5Ben & Charles 0Ben & Denise .5Ben & Edward 0
Ben & Frank 0
Charles & Denise .5
Charles & Edward 0
Charles & Frank 0
Denise & Edward.5
Denise & Frank .5
Edward & Frank 0
Find the mean & standard deviation of all p-hats.Find the mean & standard deviation of all p-hats.
29814.0σ&31
μ ˆˆ pp
How does the mean of the sampling distribution (p-hat) compare to the population
parameter (p)?p-hat = p

Suppose we have a population of six Suppose we have a population of six people: Alice, Ben, Charles, Denise, people: Alice, Ben, Charles, Denise, Edward, & FrankEdward, & Frank
Draw samples of three from this Draw samples of three from this population.population.
How many different samples are possible?
Find the mean & standard deviation of all p-hats.
66CC3 3 = 20= 20
2108.0&31
ˆˆ pp
What do you notice about the means & standard
deviations?
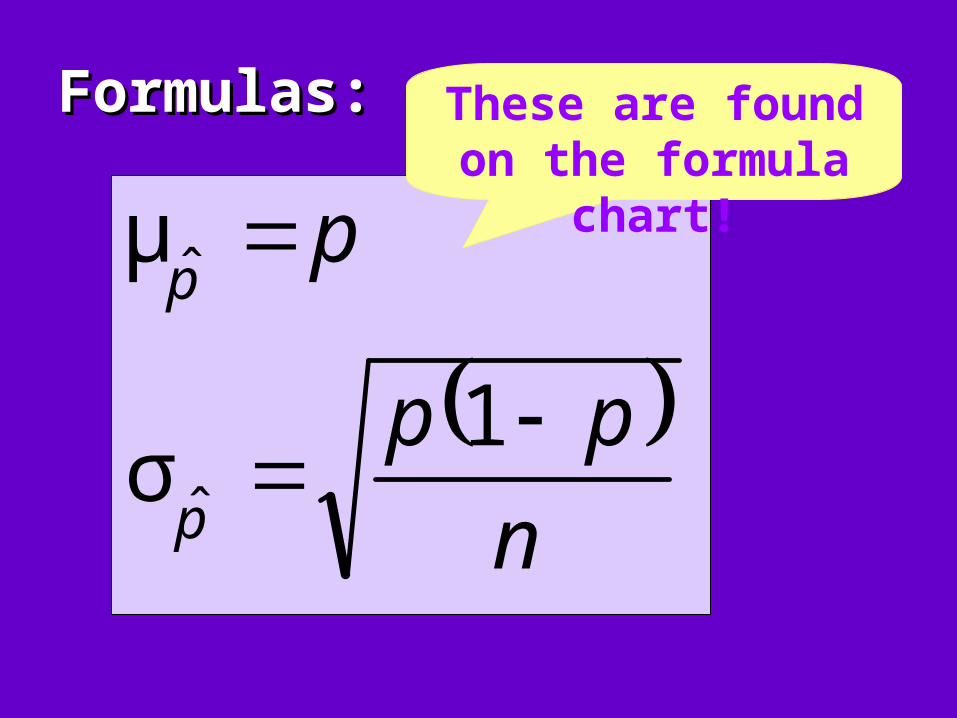
Formulas:Formulas:
npp
p
p
p
1σ
μ
ˆ
ˆ
These are found on the formula chart!
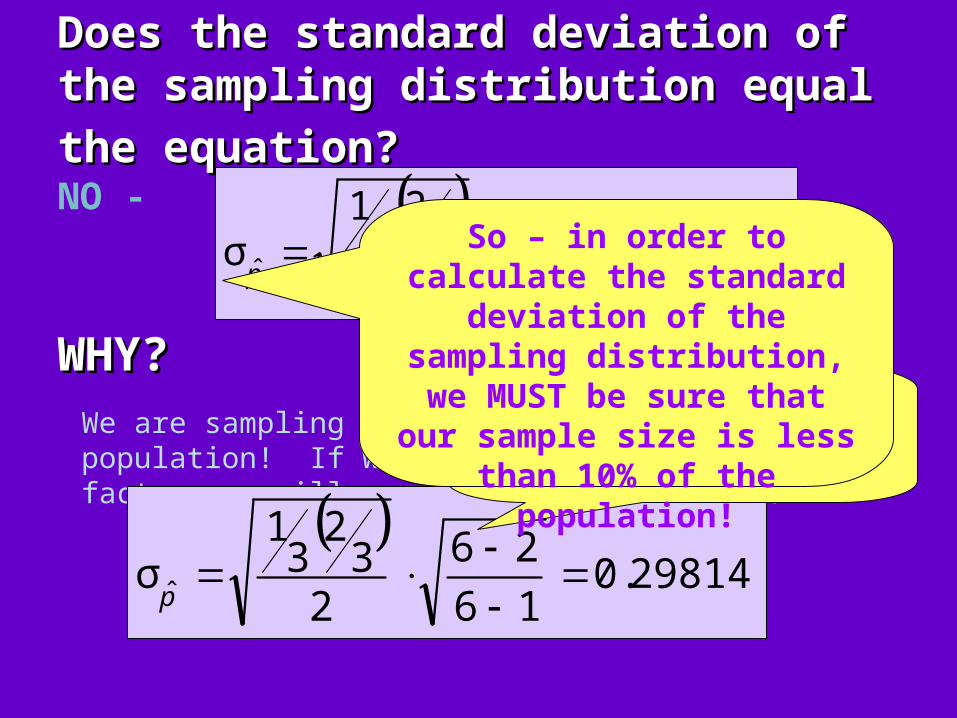
Does the standard deviation of the Does the standard deviation of the sampling distribution equal the sampling distribution equal the
equation?equation? NO -
29814.031
23
231
σˆ p
WHY?WHY?We are sampling more than 10% of our population! If we use the correction factor, we will see that we are correct.
29814.0
1626
23
231
σˆ
p
Correction factor – multiply by
1
NnN
So – in order to calculate the standard deviation of the sampling distribution, we
MUST be sure that our sample size is less than 10%
of the population!

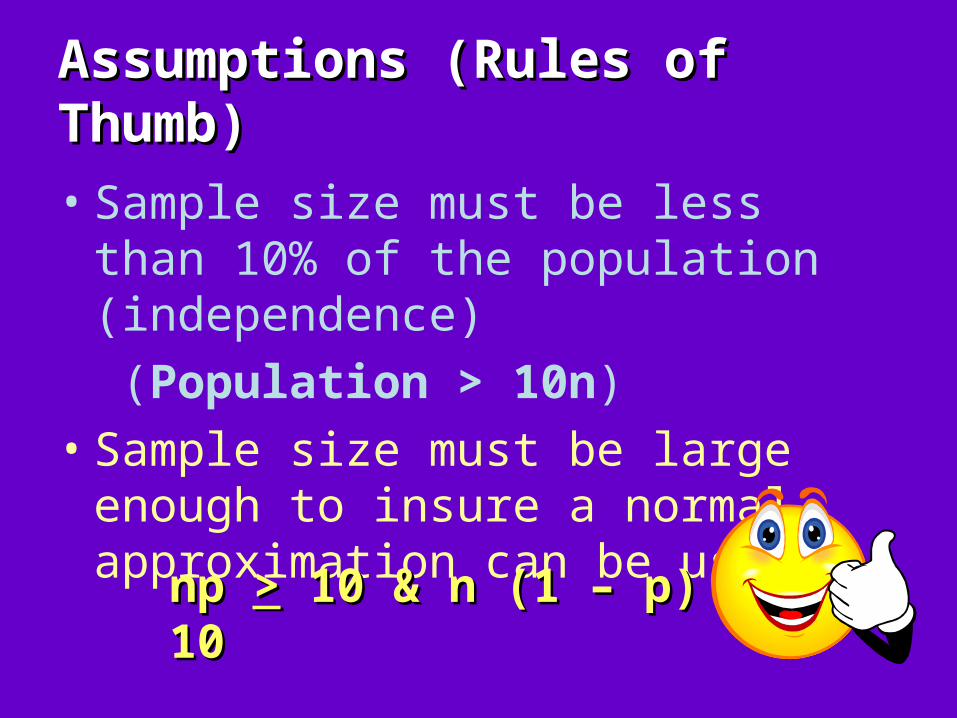
Assumptions (Rules of Thumb)Assumptions (Rules of Thumb)
• Sample size must be less than 10% of the population (independence)
(Population > 10n)
• Sample size must be large enough to insure a normal approximation can be used.
np np >> 10 & n (1 – p) 10 & n (1 – p) >> 10 10

Why does the second assumption insure Why does the second assumption insure an approximate normal distribution?an approximate normal distribution?
Suppose n = 10 & p = 0.1 (probability of a success), a histogram of this distribution is strongly skewed right!
Remember back to binomial distributions
What would happen if the fixed number was
100?
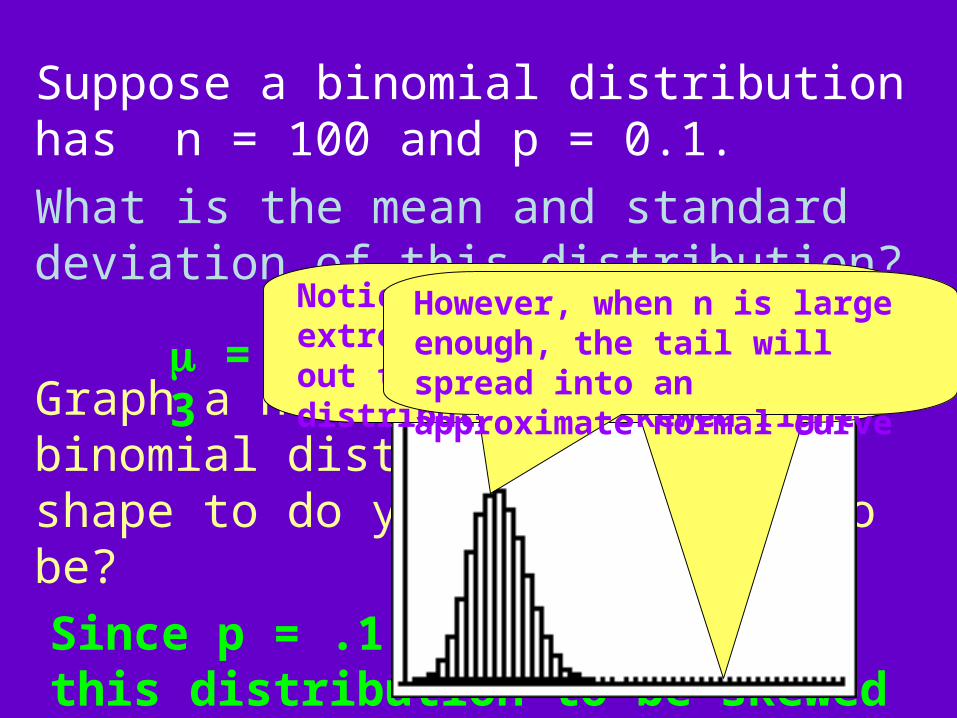
Suppose a binomial distribution has n = 100 and p = 0.1.
What is the mean and standard deviation of this distribution?
Graph a histogram of this binomial distribution. What shape to do you expect this to be?
= 10 & = 3
Since p = .1, we would expect this distribution to be skewed right
Notice that these bars are extremely small and extend out to 100 – so this distribution is skewed right
However, when n is large enough, the tail will spread into an approximate normal curve
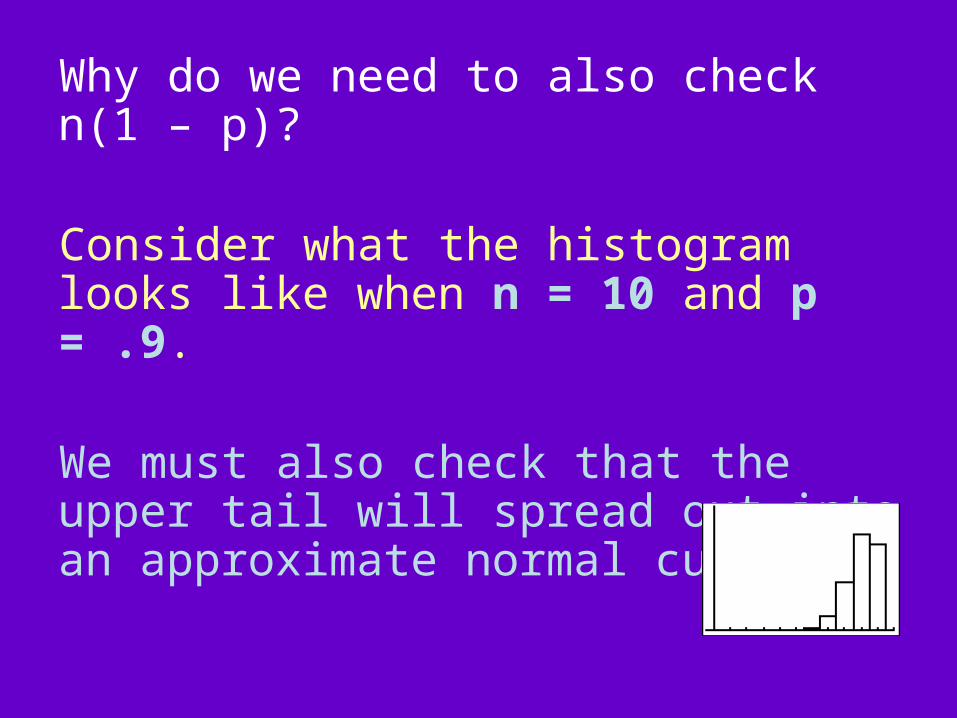
Why do we need to also check n(1 – p)?
Consider what the histogram looks like when n = 10 and p = .9.
We must also check that the upper tail will spread out into an approximate normal curve.
Assumptions (Rules of Thumb)Assumptions (Rules of Thumb)
• Sample size must be less than 10% of the population (independence)
(Population > 10n)
• Sample size must be large enough to insure a normal approximation can be used.
np np >> 10 & n (1 – p) 10 & n (1 – p) >> 10 10

Chip Activity:Chip Activity:
•Select three samples of size 5, 10, and 15 and record the number of blue chips.
•Place your proportions on the appropriate dotplots.
What do you notice about these distributions?

Some proportion distributions where = 0.2
0.2
n = 10
0.2
n = 50
0.2
n = 20
0.2
n = 100
Let p be the proportion of successes in a random sample of size n from a population whose proportion of S’s (successes) is .
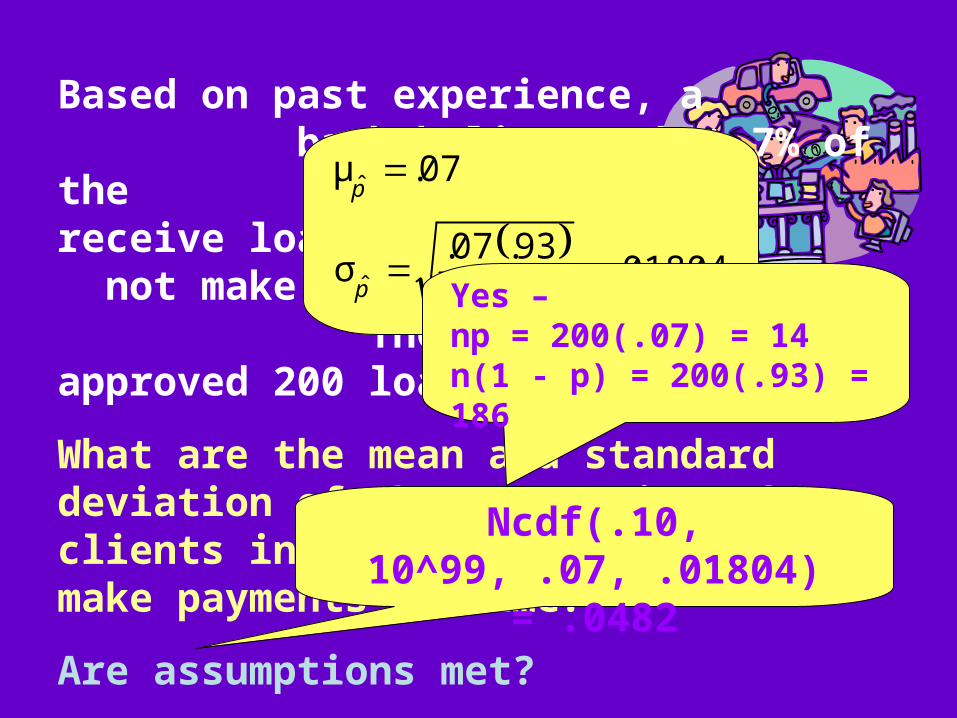
Based on past experience, a bank believes that 7% of the people who receive loans will not make payments on time. The bank recently approved 200 loans.
What are the mean and standard deviation of the proportion of clients in this group who may not make payments on time?
Are assumptions met?
What is the probability that over 10% of these clients will not make payments on time?
01804.
20093.07.
σ
07.μ
ˆ
ˆ
p
p
Yes – np = 200(.07) = 14n(1 - p) = 200(.93) = 186
Ncdf(.10, 10^99, .07, .01804) = .0482
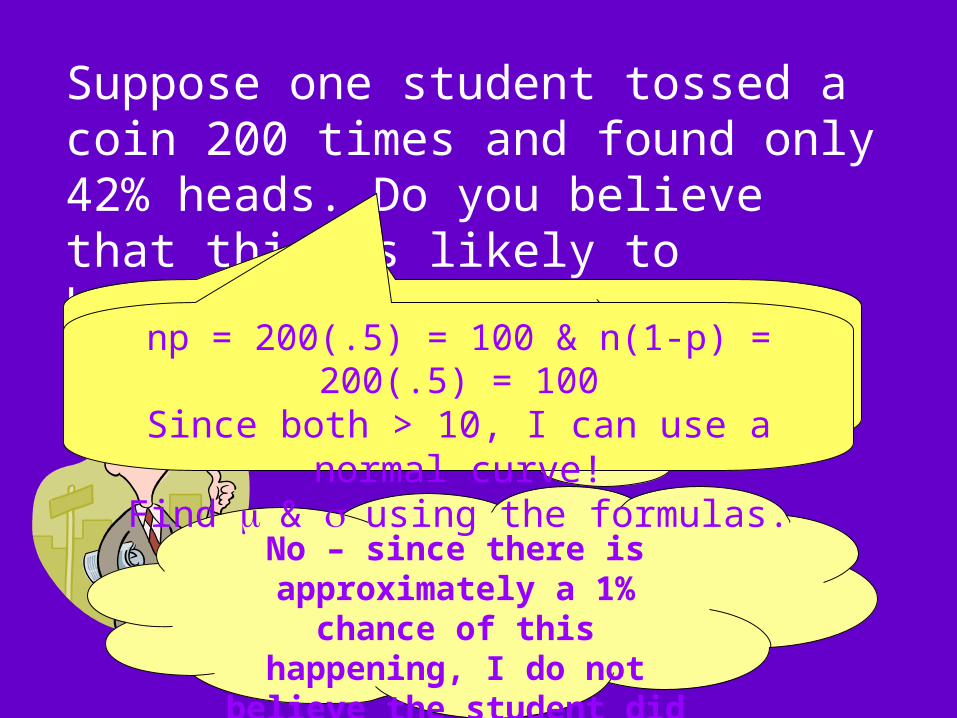
Suppose one student tossed a coin 200 times and found only 42% heads. Do you believe that this is likely to happen? Find the probability that a coin would land heads less than 42% of the time. 0118.
200)5(.5.
,5,.42,.
ncdf
No – since there is approximately a 1% chance of
this happening, I do not believe the student did this.
np = 200(.5) = 100 & n(1-p) = 200(.5) = 100Since both > 10, I can use a normal curve!
Find & using the formulas.
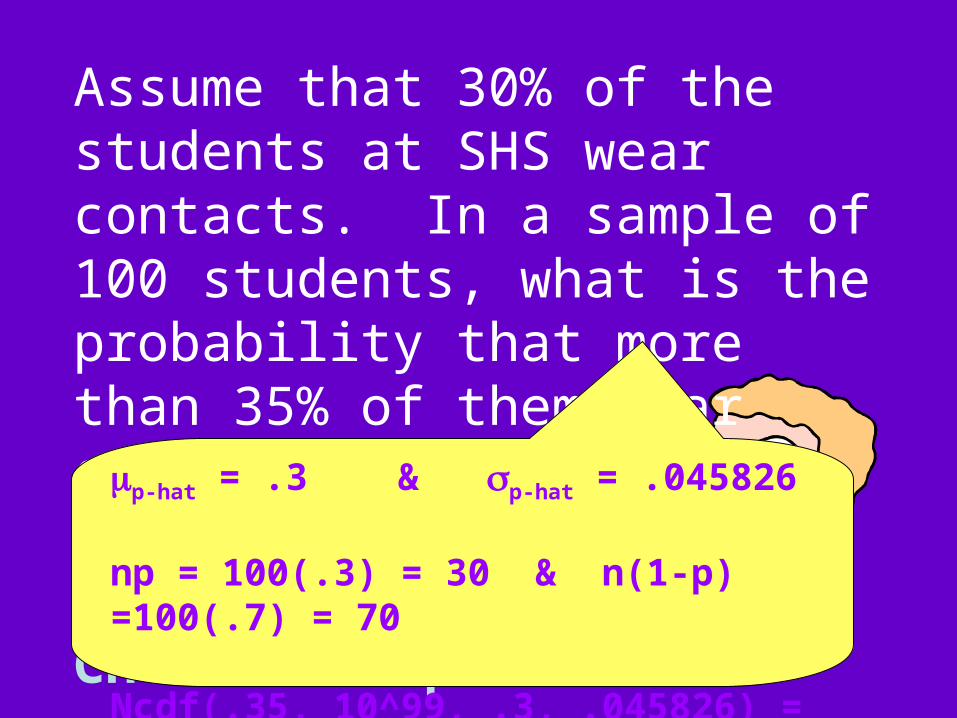
Assume that 30% of the students at SHS wear contacts. In a sample of 100 students, what is the probability that more than 35% of them wear contacts?
Check assumptions!p-hat = .3 & p-hat = .045826
np = 100(.3) = 30 & n(1-p) =100(.7) = 70
Ncdf(.35, 10^99, .3, .045826) = .1376

Example
If the true proportion of defectives produced by a certain manufacturing process is 0.08 and a sample of 400 is chosen, what is the probability that the proportion of defectives in the sample is greater than 0.10?
Since n400(0.08)10 and
n(1-) = 400(0.92) = 368 > 10,it’s reasonable to use the normal approximation.
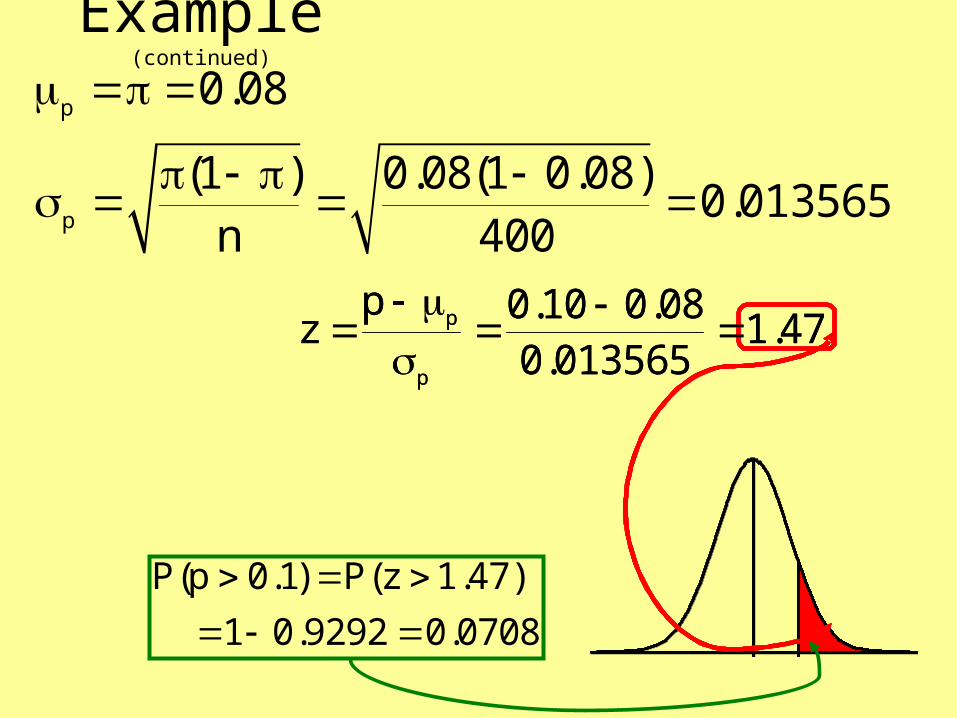
Example (continued)
P(p 0.1) P(z 1.47)
1 0.9292 0.0708
p
p
0.08
(1 ) 0.08(1 0.08)0.013565
n 400
p
p
p 0.10 0.08z 1.47
0.013565
p
p
p 0.10 0.08z 1.47
0.013565
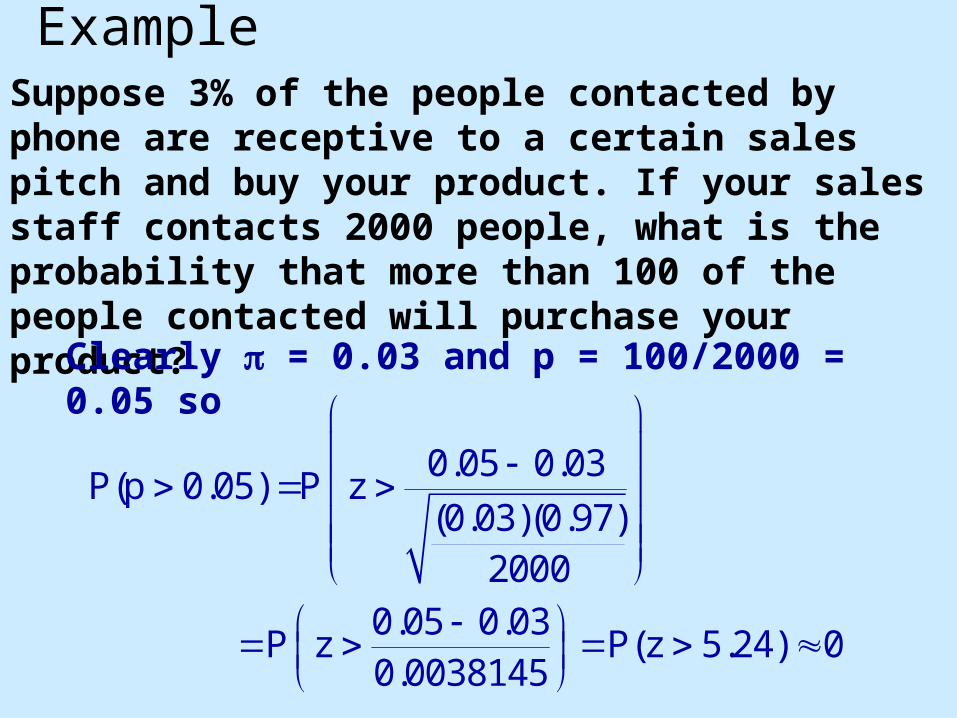
ExampleSuppose 3% of the people contacted by phone are receptive to a certain sales pitch and buy your product. If your sales staff contacts 2000 people, what is the probability that more than 100 of the people contacted will purchase your product?
Clearly = 0.03 and p = 100/2000 = 0.05 so
0.05 0.03P(p 0.05) P z
(0.03)(0.97)2000
0.05 0.03P z P(z 5.24) 0
0.0038145
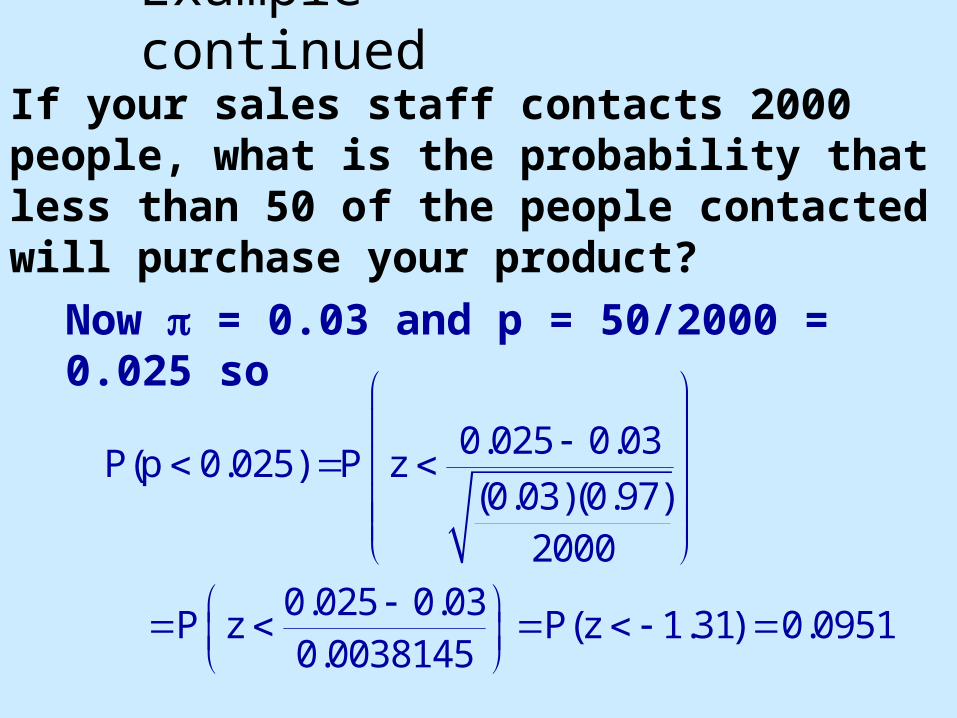
Example - continued
If your sales staff contacts 2000 people, what is the probability that less than 50 of the people contacted will purchase your product?
Now = 0.03 and p = 50/2000 = 0.025 so
0.025 0.03P(p 0.025) P z
(0.03)(0.97)2000
0.025 0.03P z P(z 1.31) 0.0951
0.0038145