Sampling Distribution ● Tells what values a sample statistic (such as sample proportion) takes and...
17
Sampling Distribution ● Tells what values a sample statistic (such as sample proportion) takes and how often it takes those values in repeated sampling. i.e., assigns probabilities to the values a statistic can take. These probabilities must satisfy Rules A- D. ● The sample statistic can take on many values in repeated sampling, so sampling distribution typically described by continuous distributions such as the normal. Probability of the sample statistic falling in a given interval of values determined by the area under the density curve between the interval. ● Often this density curve is a normal curve – So can apply the “68-95-99.7 rule” or any other tricks we've learned about the normal distribution ● It is proven that sample proportions and sample means are approximately normally distributed.
-
Upload
caitlin-barnett -
Category
Documents
-
view
220 -
download
1
Transcript of Sampling Distribution ● Tells what values a sample statistic (such as sample proportion) takes and...

Sampling Distribution● Tells what values a sample statistic (such as sample
proportion) takes and how often it takes those values in repeated sampling. i.e., assigns probabilities to the values a statistic can take. These probabilities must satisfy Rules A-D.
● The sample statistic can take on many values in repeated sampling, so sampling distribution typically described by continuous distributions such as the normal. Probability of the sample statistic falling in a given interval of values determined by the area under the density curve between the interval.
● Often this density curve is a normal curve– So can apply the “68-95-99.7 rule” or any other tricks we've
learned about the normal distribution
● It is proven that sample proportions and sample means are approximately normally distributed.

Sampling Distribution of a Sample Proportion

Sampling Distribution of a Sample Proportion

Sampling Distribution of the Sample Proportion (true p=.5)

Sampling Distribution for Proportion Who Voted
● 61.7% of registered voters actually voted in the 2008 presidential election.
● In a random sample of 1600 voters, the proportion who claimed to have voted was 63.7%
● Such sample proportions from repeated sampling would have a normal distribution with mean .617 and standard deviation .012
● What is the probability of observing a sample proportion as large or larger than .637?
Z=(.637 - .617) / .012 = 1.67 From normal table, this corresponds to about 95%
percentile. So only about 5% chance that observe sample proportion larger than .637.

Inference about Population Parameters:Confidence Intervals
● Sampling distributions can be used to infer about population parameters:– Confidence intervals– Hypothesis testing (next time)
● A level C confidence interval for a parameter has two parts;
– An interval calculated from the data– A confidence level C, which gives the probability
that the interval will capture the true parameter value in repeated samples.
– C is typically set at 95%.

Confidence Interval for Population Proportion● Using the 68-95-99.7 empirical rule for normal distributions we
know that, for example, 95% of the time, the sample proportion falls within its mean (the population proportion p) plus or minus two times its standard deviation
● Simply re-arranging terms turns this statement into one about the population parameter p ( is the same as
)● We estimate the p in the formula for the s.d. of the sample
proportion with the sample proportion.
p− 2 sd≤ p≤ p 2 sdp− 2 sd≤ p≤ p 2 sd

Confidence Interval for Population Proportion● Meaning: if we compute the CI for p in this fashion, 95% of such
intervals based on the sample data will contain the true p.

Confidence Interval for Population Proportion● e.g. Aids Behavioural Survey data: proportion of
individuals with multiple partners.➔ If we can draw many samples of 2673, 95% of the CI's
constructed with the sample proportions will contain the true population proportion.
➔ If we only have one such sample, we say we are 95% confident that the true p is contained within the CI from this one sample.

Confidence Interval for Population Proportion:Arbitrary C value
● -Z* and Z* are called “critical values”
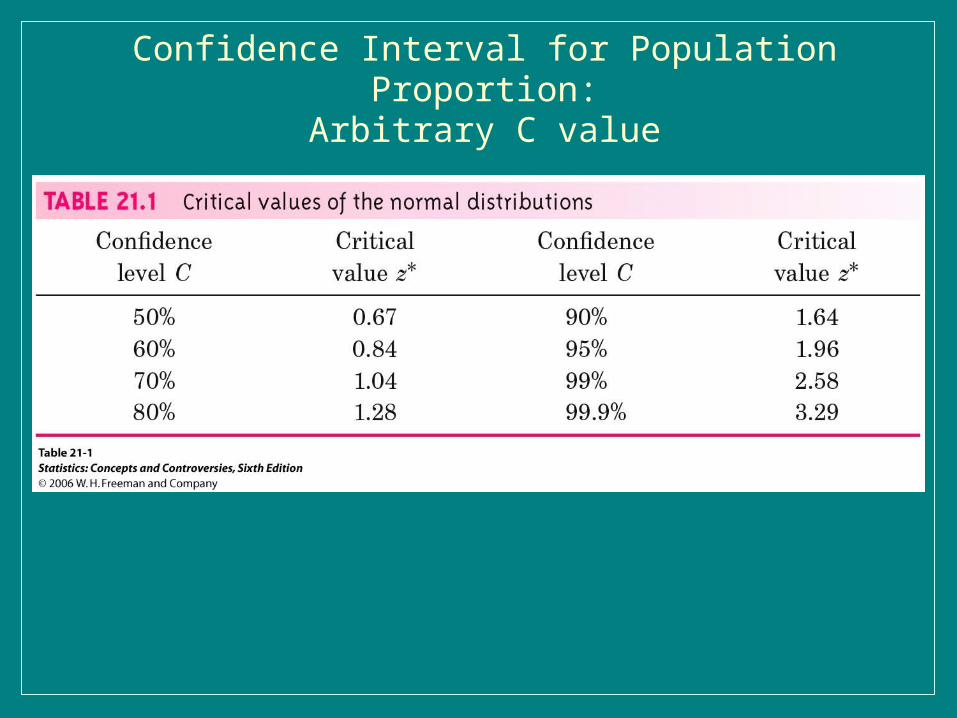
Confidence Interval for Population Proportion:Arbitrary C value

Confidence Interval for Population Proportion:Arbitrary C value
● Stata: Statistics-->Summary stats--> Confidence interval (or CI calculators)

Confidence Intervals for the Population Mean
● Exactly the same idea as for proportions: need to know the sampling distribution of the sample mean (which fortunately turns out to be approximately normal too), and then can use tricks about the normal distribution.

Sampling Distribution of a Sample Mean:the distribution approximates normal as N gets large
● This holds for any population distribution (e.g., it works for the binary coin toss.) This is called the Central Limit Theorem

Sampling Distribution of a Sample Mean:the standard deviation gets smaller as N gets
larger

Confidence Intervals for the Population Mean
● The population sd, , is rarely known and is often estimated using the sample sd, s. When N is small, this changes the distribution into what's called a “Student-t distribution”, which looks similar to the normal but has fatter tails.
● Using Stata: Statistics-->summary stats-->Confidence Intervals (normal)

Confidence Intervals for the Population Mean: Example
● National Assessment of Educational Progress (NAEP) quantitative test scores for young men aged 21-25. (Score can range from 0-500)
● A random sample of 840 men 21-25 yrs of age has a sample mean of 272, and sample standard deviation of 59.
● What can we say about the mean score in the population of all 9.5 million young men in this age group based on this data?
● 95% CI for the population mean is
272 +- 1.96*59/sqrt(840) =
272 +- 4 = [268, 276]