Sampling design and analytical advances allow for ...
9
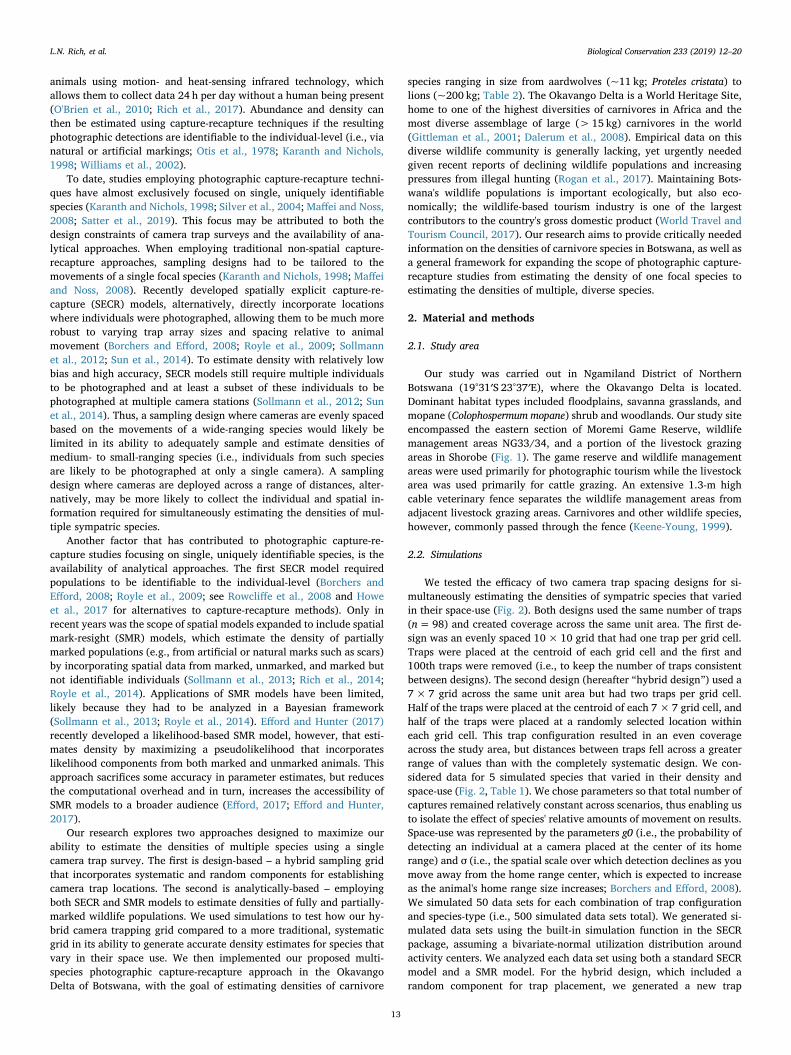
Contents lists available at ScienceDirect Biological Conservation journal homepage: www.elsevier.com/locate/biocon Sampling design and analytical advances allow for simultaneous density estimation of seven sympatric carnivore species from camera trap data Lindsey N. Rich a, ⁎ , David A.W. Miller b , David J. Muñoz b , Hugh S. Robinson c , J. Weldon McNutt d , Marcella J. Kelly a a Department of Fish and Wildlife Conservation, Virginia Tech, 146 Cheatham Hall, Blacksburg, VA 24061-0321, USA b Department of Ecosystem Science and Management, Penn State University, 411 Forest Resources Building, University Park, PA 16802, USA c Panthera and College of Forestry and Conservation, University of Montana, Missoula, MT 59812, USA d Botswana Predator Conservation Trust, Private Bag 13, Maun, Botswana ARTICLE INFO Keywords: Camera trap Spatially explicit models Multispecies Population density Sampling design ABSTRACT Population density is a fundamental parameter needed to assess wildlife populations but is difficult to obtain given species are often wide-ranging and elusive. Photographic capture-recapture techniques do not require direct observations and thus, have become a common approach for estimating wildlife densities. To date, however, these studies have typically focused on single species. Our research explores study design- and ana- lytical-based approaches for expanding photographic capture-recapture studies to assess multiple species si- multaneously. We developed a hybrid-sampling scheme that varied inter-camera distances and used simulations to test the efficacy of this design versus a systematically spaced grid in estimating densities of species with varied space use. Through simulations we found the hybrid design facilitated density estimates for a wider range of species with little or no cost in accuracy for most species. We implemented a hybrid camera design across a 1154-km 2 area in northern Botswana to estimate densities of lions, spotted hyenas, leopards, wild dogs, servals, civets, and aardwolves. We estimated densities of these small- to wide-ranging carnivores, where all or some portion of the population was individually identifiable, using spatially explicit capture-recapture and mark- resight models. Mean estimates ranged from 1.2 (95% CI = 0.72–1.99) lions to 10.1 (95% CI = 8.69–11.63) spotted hyenas/100 km 2 and provided empirical information needed for the conservation of these species in Botswana. Our research demonstrates how photographic capture-recapture studies can be expanded to estimate the densities of multiple species versus just a single species within a community, thus increasing the conservation value of this globally implemented approach. 1. Introduction Among the most fundamental quantities needed to assess wildlife populations are abundance and/or density (Otis et al., 1978; Seber, 1982). Without such key, baseline parameters it is difficult to detect when common species are becoming uncommon, when invasive or exotic species are proliferating, or when climate- and land-use changes are acting as large-scale ecological stressors (Pereira et al., 2013; Schmeller, 2015; Steenweg et al., 2017). Consequently, estimating wildlife density is key to species conservation (Seber, 1982; Karanth and Nichols, 1998; Sollmann et al., 2012). Information on the population dynamics of carnivorous mammals is of particular interest given their vulnerability to extinction and their impacts on ecosystems as a whole (Woodroffe and Ginsberg, 1998; Ripple et al., 2014; Bauer et al., 2015). Among the 31 largest carni- vores, 19 are listed as threatened by the International Union for the Conservation of Nature and many (e.g., African wild dogs- Lycaon pictus and African lions- Panthera leo) are disappearing from a large portion of their historical range (Ripple et al., 2014; Bauer et al., 2015). Tracking the status of these carnivore populations is challenging, however, given they are generally far-ranging, elusive and thus, difficult to count di- rectly (Silver et al., 2004; Karanth et al., 2006). As a result of these challenges, photographic capture-recapture techniques have emerged as an increasingly common approach for estimating abundances and densities of carnivore populations as they do not require animals to be handled or observed directly. Remote sensing cameras detect passing https://doi.org/10.1016/j.biocon.2019.02.018 Received 17 April 2018; Received in revised form 5 February 2019; Accepted 13 February 2019 ⁎ Corresponding author. E-mail addresses: [email protected] (L.N. Rich), [email protected] (D.A.W. Miller), [email protected] (D.J. Muñoz), [email protected] (H.S. Robinson), [email protected] (J.W. McNutt), [email protected] (M.J. Kelly). Biological Conservation 233 (2019) 12–20 0006-3207/ © 2019 Elsevier Ltd. All rights reserved. T
Transcript of Sampling design and analytical advances allow for ...
Contents lists available at ScienceDirect
Biological Conservation
journal homepage: www.elsevier.com/locate/biocon
Sampling design and analytical advances allow for simultaneous densityestimation of seven sympatric carnivore species from camera trap data
Lindsey N. Richa,⁎, David A.W. Millerb, David J. Muñozb, Hugh S. Robinsonc, J. Weldon McNuttd,Marcella J. Kellya
a Department of Fish and Wildlife Conservation, Virginia Tech, 146 Cheatham Hall, Blacksburg, VA 24061-0321, USAbDepartment of Ecosystem Science and Management, Penn State University, 411 Forest Resources Building, University Park, PA 16802, USAc Panthera and College of Forestry and Conservation, University of Montana, Missoula, MT 59812, USAd Botswana Predator Conservation Trust, Private Bag 13, Maun, Botswana
A R T I C L E I N F O
Keywords:Camera trapSpatially explicit modelsMultispeciesPopulation densitySampling design
A B S T R A C T
Population density is a fundamental parameter needed to assess wildlife populations but is difficult to obtaingiven species are often wide-ranging and elusive. Photographic capture-recapture techniques do not requiredirect observations and thus, have become a common approach for estimating wildlife densities. To date,however, these studies have typically focused on single species. Our research explores study design- and ana-lytical-based approaches for expanding photographic capture-recapture studies to assess multiple species si-multaneously. We developed a hybrid-sampling scheme that varied inter-camera distances and used simulationsto test the efficacy of this design versus a systematically spaced grid in estimating densities of species with variedspace use. Through simulations we found the hybrid design facilitated density estimates for a wider range ofspecies with little or no cost in accuracy for most species. We implemented a hybrid camera design across a1154-km2 area in northern Botswana to estimate densities of lions, spotted hyenas, leopards, wild dogs, servals,civets, and aardwolves. We estimated densities of these small- to wide-ranging carnivores, where all or someportion of the population was individually identifiable, using spatially explicit capture-recapture and mark-resight models. Mean estimates ranged from 1.2 (95% CI=0.72–1.99) lions to 10.1 (95% CI=8.69–11.63)spotted hyenas/100 km2 and provided empirical information needed for the conservation of these species inBotswana. Our research demonstrates how photographic capture-recapture studies can be expanded to estimatethe densities of multiple species versus just a single species within a community, thus increasing the conservationvalue of this globally implemented approach.
1. Introduction
Among the most fundamental quantities needed to assess wildlifepopulations are abundance and/or density (Otis et al., 1978; Seber,1982). Without such key, baseline parameters it is difficult to detectwhen common species are becoming uncommon, when invasive orexotic species are proliferating, or when climate- and land-use changesare acting as large-scale ecological stressors (Pereira et al., 2013;Schmeller, 2015; Steenweg et al., 2017). Consequently, estimatingwildlife density is key to species conservation (Seber, 1982; Karanthand Nichols, 1998; Sollmann et al., 2012).
Information on the population dynamics of carnivorous mammals isof particular interest given their vulnerability to extinction and their
impacts on ecosystems as a whole (Woodroffe and Ginsberg, 1998;Ripple et al., 2014; Bauer et al., 2015). Among the 31 largest carni-vores, 19 are listed as threatened by the International Union for theConservation of Nature and many (e.g., African wild dogs- Lycaon pictusand African lions- Panthera leo) are disappearing from a large portion oftheir historical range (Ripple et al., 2014; Bauer et al., 2015). Trackingthe status of these carnivore populations is challenging, however, giventhey are generally far-ranging, elusive and thus, difficult to count di-rectly (Silver et al., 2004; Karanth et al., 2006). As a result of thesechallenges, photographic capture-recapture techniques have emergedas an increasingly common approach for estimating abundances anddensities of carnivore populations as they do not require animals to behandled or observed directly. Remote sensing cameras detect passing
https://doi.org/10.1016/j.biocon.2019.02.018Received 17 April 2018; Received in revised form 5 February 2019; Accepted 13 February 2019
⁎ Corresponding author.E-mail addresses: [email protected] (L.N. Rich), [email protected] (D.A.W. Miller), [email protected] (D.J. Muñoz),
[email protected] (H.S. Robinson), [email protected] (J.W. McNutt), [email protected] (M.J. Kelly).
Biological Conservation 233 (2019) 12–20
0006-3207/ © 2019 Elsevier Ltd. All rights reserved.
T
animals using motion- and heat-sensing infrared technology, whichallows them to collect data 24 h per day without a human being present(O'Brien et al., 2010; Rich et al., 2017). Abundance and density canthen be estimated using capture-recapture techniques if the resultingphotographic detections are identifiable to the individual-level (i.e., vianatural or artificial markings; Otis et al., 1978; Karanth and Nichols,1998; Williams et al., 2002).
To date, studies employing photographic capture-recapture techni-ques have almost exclusively focused on single, uniquely identifiablespecies (Karanth and Nichols, 1998; Silver et al., 2004; Maffei and Noss,2008; Satter et al., 2019). This focus may be attributed to both thedesign constraints of camera trap surveys and the availability of ana-lytical approaches. When employing traditional non-spatial capture-recapture approaches, sampling designs had to be tailored to themovements of a single focal species (Karanth and Nichols, 1998; Maffeiand Noss, 2008). Recently developed spatially explicit capture-re-capture (SECR) models, alternatively, directly incorporate locationswhere individuals were photographed, allowing them to be much morerobust to varying trap array sizes and spacing relative to animalmovement (Borchers and Efford, 2008; Royle et al., 2009; Sollmannet al., 2012; Sun et al., 2014). To estimate density with relatively lowbias and high accuracy, SECR models still require multiple individualsto be photographed and at least a subset of these individuals to bephotographed at multiple camera stations (Sollmann et al., 2012; Sunet al., 2014). Thus, a sampling design where cameras are evenly spacedbased on the movements of a wide-ranging species would likely belimited in its ability to adequately sample and estimate densities ofmedium- to small-ranging species (i.e., individuals from such speciesare likely to be photographed at only a single camera). A samplingdesign where cameras are deployed across a range of distances, alter-natively, may be more likely to collect the individual and spatial in-formation required for simultaneously estimating the densities of mul-tiple sympatric species.
Another factor that has contributed to photographic capture-re-capture studies focusing on single, uniquely identifiable species, is theavailability of analytical approaches. The first SECR model requiredpopulations to be identifiable to the individual-level (Borchers andEfford, 2008; Royle et al., 2009; see Rowcliffe et al., 2008 and Howeet al., 2017 for alternatives to capture-recapture methods). Only inrecent years was the scope of spatial models expanded to include spatialmark-resight (SMR) models, which estimate the density of partiallymarked populations (e.g., from artificial or natural marks such as scars)by incorporating spatial data from marked, unmarked, and marked butnot identifiable individuals (Sollmann et al., 2013; Rich et al., 2014;Royle et al., 2014). Applications of SMR models have been limited,likely because they had to be analyzed in a Bayesian framework(Sollmann et al., 2013; Royle et al., 2014). Efford and Hunter (2017)recently developed a likelihood-based SMR model, however, that esti-mates density by maximizing a pseudolikelihood that incorporateslikelihood components from both marked and unmarked animals. Thisapproach sacrifices some accuracy in parameter estimates, but reducesthe computational overhead and in turn, increases the accessibility ofSMR models to a broader audience (Efford, 2017; Efford and Hunter,2017).
Our research explores two approaches designed to maximize ourability to estimate the densities of multiple species using a singlecamera trap survey. The first is design-based – a hybrid sampling gridthat incorporates systematic and random components for establishingcamera trap locations. The second is analytically-based – employingboth SECR and SMR models to estimate densities of fully and partially-marked wildlife populations. We used simulations to test how our hy-brid camera trapping grid compared to a more traditional, systematicgrid in its ability to generate accurate density estimates for species thatvary in their space use. We then implemented our proposed multi-species photographic capture-recapture approach in the OkavangoDelta of Botswana, with the goal of estimating densities of carnivore
species ranging in size from aardwolves (~11 kg; Proteles cristata) tolions (~200 kg; Table 2). The Okavango Delta is a World Heritage Site,home to one of the highest diversities of carnivores in Africa and themost diverse assemblage of large (> 15 kg) carnivores in the world(Gittleman et al., 2001; Dalerum et al., 2008). Empirical data on thisdiverse wildlife community is generally lacking, yet urgently neededgiven recent reports of declining wildlife populations and increasingpressures from illegal hunting (Rogan et al., 2017). Maintaining Bots-wana's wildlife populations is important ecologically, but also eco-nomically; the wildlife-based tourism industry is one of the largestcontributors to the country's gross domestic product (World Travel andTourism Council, 2017). Our research aims to provide critically neededinformation on the densities of carnivore species in Botswana, as well asa general framework for expanding the scope of photographic capture-recapture studies from estimating the density of one focal species toestimating the densities of multiple, diverse species.
2. Material and methods
2.1. Study area
Our study was carried out in Ngamiland District of NorthernBotswana (19°31′S 23°37′E), where the Okavango Delta is located.Dominant habitat types included floodplains, savanna grasslands, andmopane (Colophospermum mopane) shrub and woodlands. Our study siteencompassed the eastern section of Moremi Game Reserve, wildlifemanagement areas NG33/34, and a portion of the livestock grazingareas in Shorobe (Fig. 1). The game reserve and wildlife managementareas were used primarily for photographic tourism while the livestockarea was used primarily for cattle grazing. An extensive 1.3-m highcable veterinary fence separates the wildlife management areas fromadjacent livestock grazing areas. Carnivores and other wildlife species,however, commonly passed through the fence (Keene-Young, 1999).
2.2. Simulations
We tested the efficacy of two camera trap spacing designs for si-multaneously estimating the densities of sympatric species that variedin their space-use (Fig. 2). Both designs used the same number of traps(n=98) and created coverage across the same unit area. The first de-sign was an evenly spaced 10× 10 grid that had one trap per grid cell.Traps were placed at the centroid of each grid cell and the first and100th traps were removed (i.e., to keep the number of traps consistentbetween designs). The second design (hereafter “hybrid design”) used a7×7 grid across the same unit area but had two traps per grid cell.Half of the traps were placed at the centroid of each 7×7 grid cell, andhalf of the traps were placed at a randomly selected location withineach grid cell. This trap configuration resulted in an even coverageacross the study area, but distances between traps fell across a greaterrange of values than with the completely systematic design. We con-sidered data for 5 simulated species that varied in their density andspace-use (Fig. 2, Table 1). We chose parameters so that total number ofcaptures remained relatively constant across scenarios, thus enabling usto isolate the effect of species' relative amounts of movement on results.Space-use was represented by the parameters g0 (i.e., the probability ofdetecting an individual at a camera placed at the center of its homerange) and σ (i.e., the spatial scale over which detection declines as youmove away from the home range center, which is expected to increaseas the animal's home range size increases; Borchers and Efford, 2008).We simulated 50 data sets for each combination of trap configurationand species-type (i.e., 500 simulated data sets total). We generated si-mulated data sets using the built-in simulation function in the SECRpackage, assuming a bivariate-normal utilization distribution aroundactivity centers. We analyzed each data set using both a standard SECRmodel and a SMR model. For the hybrid design, which included arandom component for trap placement, we generated a new trap
L.N. Rich, et al. Biological Conservation 233 (2019) 12–20
13

configuration for each simulated data set. For analyses using the SMRmodel, we simulated ~40% of individuals in each scenario to be un-marked. We determined the proportion of data sets for which estimatesof density could be generated (i.e., at least one animal was caughtat> 1 trap location) and estimated mean error rates (a measure of bias)and mean absolute error rates (a measure of accuracy) for density es-timates. We used the secr package (vs. 3.1.3; Efford, 2017) throughprogram R version 3.2.2 (R Development Core Team, 2017) to simulateand analyze all data sets.
2.3. Camera trap survey and photo classification
We deployed camera traps at 221 locations across our 1154-km2
study area between February and July 2015 (Fig. 1). We used a com-bination of Panthera v4 incandescent-flash camera traps (0.18 s triggerspeed) and Bushnell TrophyCam infrared camera traps (0.3 s triggerspeed). To keep detection rates comparable among stations, we ensuredevery camera station included ≥1 Panthera camera. To guide the pla-cement of cameras, we used 5-km2 grid cells to ensure individuals fromsmall ranging species (e.g., aardwolf) could be photographed at> 1camera station. Within these grid cells, we placed cameras on sandroads to increase our probability of photographing carnivores as theyoften use lightly travelled roads as movement corridors (Forman andAlexander, 1998). We deployed two camera stations within each gridcell, one on the road closest to the predetermined center point of eachgrid cell and the second on the road closest to a predetermined randompoint within each grid cell. By moving camera locations to the closestroad, our design did not completely mimic the simulated hybrid design.Specifically, we did not deploy cameras in the subset of cells whereroads were sparse or missing and camera placement was concentratedin linear corridors. We were able to mimic, however, the distinguishingattribute of the design, which was having a range of intra-camera dis-tances as compared to a consistent intra-camera distance. In our fielddesign, camera stations were separated by a mean of 735m with the
Fig. 1. Locations of camera stations, which are color coded by sampling blocks, during our survey in northern Botswana, 2015. (For interpretation of the references tocolor in this figure legend, the reader is referred to the web version of this article.)
Fig. 2. Our simulation study used two alternative designs for the spacing ofcamera traps including a systematic 10×10 grid (below left) with traps placedat the centroid of each grid cell and a hybrid grid (below right) where half ofthe traps were placed at the centroids of a 7×7 grid and the remaining halfwere placed at a randomly selected location within each grid cell. We testedeach design using simulated species that varied in their patterns of space-use.The circles at the bottom of the figure depict 95% utilization regions for the fivesimulated species (i.e., the areas in which 95% of use is expected to occur basedon simulated σ values). While the species with larger utilization regions willoverlap multiple camera locations when employing either grid, the smallerutilization regions will only overlap multiple cameras locations when em-ploying the hydrid grid.
L.N. Rich, et al. Biological Conservation 233 (2019) 12–20
14
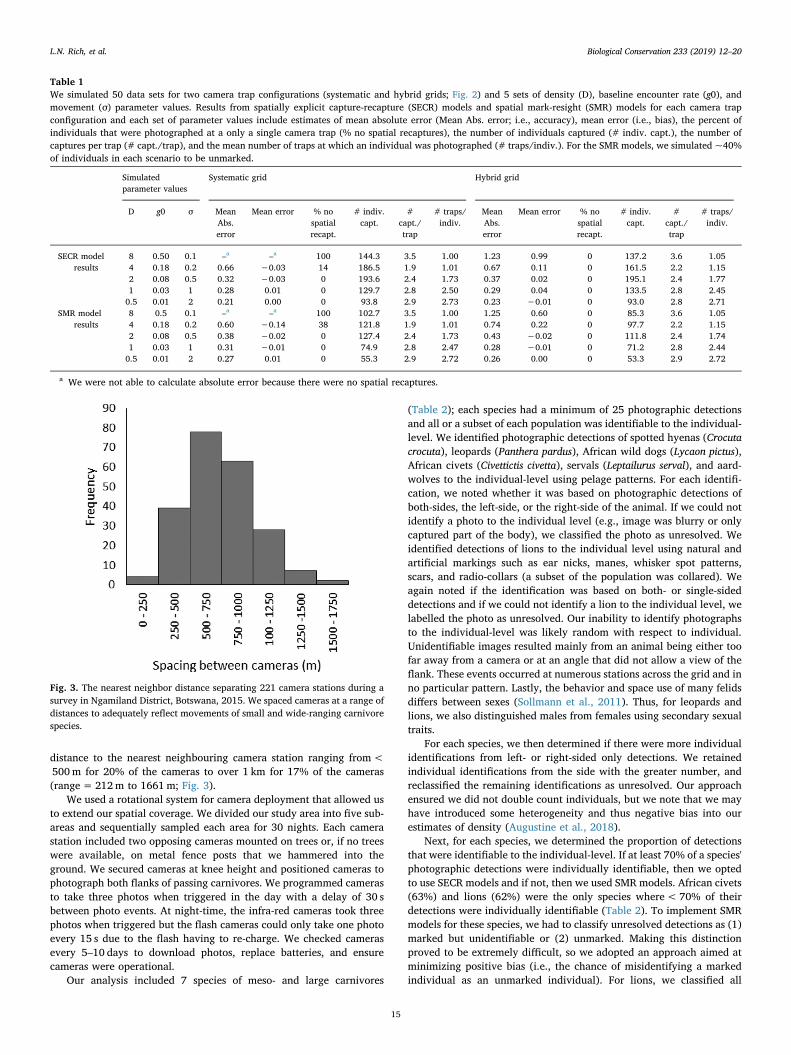
distance to the nearest neighbouring camera station ranging from<500m for 20% of the cameras to over 1 km for 17% of the cameras(range=212m to 1661m; Fig. 3).
We used a rotational system for camera deployment that allowed usto extend our spatial coverage. We divided our study area into five sub-areas and sequentially sampled each area for 30 nights. Each camerastation included two opposing cameras mounted on trees or, if no treeswere available, on metal fence posts that we hammered into theground. We secured cameras at knee height and positioned cameras tophotograph both flanks of passing carnivores. We programmed camerasto take three photos when triggered in the day with a delay of 30 sbetween photo events. At night-time, the infra-red cameras took threephotos when triggered but the flash cameras could only take one photoevery 15 s due to the flash having to re-charge. We checked camerasevery 5–10 days to download photos, replace batteries, and ensurecameras were operational.
Our analysis included 7 species of meso- and large carnivores
(Table 2); each species had a minimum of 25 photographic detectionsand all or a subset of each population was identifiable to the individual-level. We identified photographic detections of spotted hyenas (Crocutacrocuta), leopards (Panthera pardus), African wild dogs (Lycaon pictus),African civets (Civettictis civetta), servals (Leptailurus serval), and aard-wolves to the individual-level using pelage patterns. For each identifi-cation, we noted whether it was based on photographic detections ofboth-sides, the left-side, or the right-side of the animal. If we could notidentify a photo to the individual level (e.g., image was blurry or onlycaptured part of the body), we classified the photo as unresolved. Weidentified detections of lions to the individual level using natural andartificial markings such as ear nicks, manes, whisker spot patterns,scars, and radio-collars (a subset of the population was collared). Weagain noted if the identification was based on both- or single-sideddetections and if we could not identify a lion to the individual level, welabelled the photo as unresolved. Our inability to identify photographsto the individual-level was likely random with respect to individual.Unidentifiable images resulted mainly from an animal being either toofar away from a camera or at an angle that did not allow a view of theflank. These events occurred at numerous stations across the grid and inno particular pattern. Lastly, the behavior and space use of many felidsdiffers between sexes (Sollmann et al., 2011). Thus, for leopards andlions, we also distinguished males from females using secondary sexualtraits.
For each species, we then determined if there were more individualidentifications from left- or right-sided only detections. We retainedindividual identifications from the side with the greater number, andreclassified the remaining identifications as unresolved. Our approachensured we did not double count individuals, but we note that we mayhave introduced some heterogeneity and thus negative bias into ourestimates of density (Augustine et al., 2018).
Next, for each species, we determined the proportion of detectionsthat were identifiable to the individual-level. If at least 70% of a species'photographic detections were individually identifiable, then we optedto use SECR models and if not, then we used SMR models. African civets(63%) and lions (62%) were the only species where< 70% of theirdetections were individually identifiable (Table 2). To implement SMRmodels for these species, we had to classify unresolved detections as (1)marked but unidentifiable or (2) unmarked. Making this distinctionproved to be extremely difficult, so we adopted an approach aimed atminimizing positive bias (i.e., the chance of misidentifying a markedindividual as an unmarked individual). For lions, we classified all
Table 1We simulated 50 data sets for two camera trap configurations (systematic and hybrid grids; Fig. 2) and 5 sets of density (D), baseline encounter rate (g0), andmovement (σ) parameter values. Results from spatially explicit capture-recapture (SECR) models and spatial mark-resight (SMR) models for each camera trapconfiguration and each set of parameter values include estimates of mean absolute error (Mean Abs. error; i.e., accuracy), mean error (i.e., bias), the percent ofindividuals that were photographed at a only a single camera trap (% no spatial recaptures), the number of individuals captured (# indiv. capt.), the number ofcaptures per trap (# capt./trap), and the mean number of traps at which an individual was photographed (# traps/indiv.). For the SMR models, we simulated ~40%of individuals in each scenario to be unmarked.
Simulatedparameter values
Systematic grid Hybrid grid
D g0 σ MeanAbs.error
Mean error % nospatialrecapt.
# indiv.capt.
#capt./trap
# traps/indiv.
MeanAbs.error
Mean error % nospatialrecapt.
# indiv.capt.
#capt./trap
# traps/indiv.
SECR modelresults
8 0.50 0.1 –a –a 100 144.3 3.5 1.00 1.23 0.99 0 137.2 3.6 1.054 0.18 0.2 0.66 −0.03 14 186.5 1.9 1.01 0.67 0.11 0 161.5 2.2 1.152 0.08 0.5 0.32 −0.03 0 193.6 2.4 1.73 0.37 0.02 0 195.1 2.4 1.771 0.03 1 0.28 0.01 0 129.7 2.8 2.50 0.29 0.04 0 133.5 2.8 2.450.5 0.01 2 0.21 0.00 0 93.8 2.9 2.73 0.23 −0.01 0 93.0 2.8 2.71
SMR modelresults
8 0.5 0.1 –a –a 100 102.7 3.5 1.00 1.25 0.60 0 85.3 3.6 1.054 0.18 0.2 0.60 −0.14 38 121.8 1.9 1.01 0.74 0.22 0 97.7 2.2 1.152 0.08 0.5 0.38 −0.02 0 127.4 2.4 1.73 0.43 −0.02 0 111.8 2.4 1.741 0.03 1 0.31 −0.01 0 74.9 2.8 2.47 0.28 −0.01 0 71.2 2.8 2.440.5 0.01 2 0.27 0.01 0 55.3 2.9 2.72 0.26 0.00 0 53.3 2.9 2.72
a We were not able to calculate absolute error because there were no spatial recaptures.
Fig. 3. The nearest neighbor distance separating 221 camera stations during asurvey in Ngamiland District, Botswana, 2015. We spaced cameras at a range ofdistances to adequately reflect movements of small and wide-ranging carnivorespecies.
L.N. Rich, et al. Biological Conservation 233 (2019) 12–20
15

unresolved detections as marked but unidentifiable. For civets, wenoted that in two of our sampling blocks the majority of civet detectionswere classified as unresolved. Instead of including the nominal amountof information from marked animals, we opted to re-classify all civetdetections within these sampling blocks as unmarked. Civets tend torange over small areas (Ayalew et al., 2013) so it was unlikely thatcivets detected within these sampling blocks were previously identifiedindividuals. In the remaining sampling blocks, we classified all un-resolved detections as marked but unidentifiable. We note that some ofour ‘marked but unidentifiable’ detections of lions and civets couldhave been of new individuals. Thus, our estimates of civet and liondensities are likely biased low. Given likelihood-based SMR models area relatively new class of models, we compared estimates of civet andlion density based on SMR models to those based on SECR models todetermine if (1) the estimates were similar and (2) SMR models hadimproved accuracy.
2.4. Spatial models
We collapsed daily camera trapping data into 20, 1-week samplingoccasions and created species-specific capture histories. We also createdcamera trap input files, which included camera locations, samplinghistories (1= camera station active; 0= camera station not active) andestimates of vegetation density for each camera. Vegetation density wasa coarse measure of forb, shrub, and tree cover in the area surroundingthe camera station (see Rich et al., 2016 for details). Lastly, we createdinput files with camera- and sampling-occasion specific counts of thenumber of sightings classified as marked but not identifiable or un-marked.
We used the secr package (vs. 3.1.3; Efford, 2017) through programR version 3.2.2 (R Development Core Team, 2017) to implement boththe SECR and the SMR models. For both models, we assumed each in-dividual had an activity center and that activity centers were dis-tributed across the state space S (Borchers and Efford, 2008). To defineS, we trialed different buffer sizes in secr and selected the buffer sizethat was large enough to include the activity centers of all individualsexposed to trapping (i.e., buffer was at least 3× the size of σ anddensity estimate stayed comparable if the buffer size was increased).We used buffers surrounding our camera station grid ranging in sizefrom 5 km for the small-ranging species to 25 km for the wide-rangingspecies (Table 3). Further, we overlaid S with a habitat mask that wedeveloped using vegetation data from Bennitt et al. (2014). By as-suming that activity centers followed an inhomogeneous Poisson spatialdistribution, we were able to estimate density within each of the twomajor habitat strata, mopane woodlands (49% of area) and floodplains/savanna grasslands (51% of area), and to calculate an overall densityestimate as the area-weighted mean.
For individually identifiable animals (i.e., marked animals), which
constituted the entire population for the SECR models and a portion ofthe population for the SMR models, we assumed the number of pho-tographic detections of individual i at camera station j during samplingoccasion k, yijk, was a Poisson random variable with a mean encounterrate λijk (Borchers and Efford, 2008; Royle et al., 2009). We assumed λijkwould decline with distance between the camera trap and an in-dividual's activity center and modeled this decline using a half-normaldetection function, where the shape was dependent on g0, the baselineencounter rate, and σ, the spatial scale parameter. We included vege-tation density as a covariate for g0 as it is negatively related to thedetection probability of mammals in northern Botswana (Rich et al.,2016). For each of the individually identifiable animals (i.e., the SECRmodels), we then used the secr package to estimate habitat-specific andoverall densities by fitting Poisson processes through likelihood max-imization. Additional steps were necessary for the SMR models to ac-count for sightings classified as marked but unidentifiable or unmarked(Efford and Hunter, 2017). Using the secr package, we were able toimplement these steps and then estimate density by maximizing apseudolikelihood (i.e., a weighted combination of likelihood compo-nents for marked and unmarked animals) adjusted for spatial over-dispersion (see Efford and Hunter, 2017 for details).
3. Results
3.1. Simulations
Our results were largely similar for SECR and SMR data sets, withthe primary difference being greater accuracy for SECR and spatialrecaptures occurring less frequently for SMR (Fig. 4; Table 1; AppendixA). For species with small home-ranges (i.e., σ is small), the hybriddesign generated data that allowed for density to be estimated in manycases where the systematic design would not (Table 1). In 100% of thesimulated data sets for our smallest σ value, and in 14 and 38% of thedata sets for our next smallest σ value (analyzed using SECR and SMRmodels, respectively), animals were never photographed at> 1 cameratrap when employing the systematic grid configuration. This stands incontrast to the hybrid grid, where for all σ values at least some in-dividuals were photographed at> 1 camera, which allowed us to es-timate density for all values of σ.
Estimates were unbiased for all but the smallest σ (i.e., mean errorwas close to 0; Fig. 4; Table 1). In the case of the smallest σ, whereestimates could only be achieved for the hybrid design, density wasoverestimated (i.e., positively biased) by 12 and 8% on average whenemploying SECR and SMR models, respectively (Appendix A). Accuracyin density estimates, as measured by mean absolute error, was similarbetween the designs for the largest σ value when employing both SECRand SMR models (Table 1). For intermediate values of σ (σ=0.5), al-ternatively, the systematic grid was 15% more accurate than the hybrid
Table 2The total number of detections of seven carnivore species (Det.) during a camera trap survey in Ngamiland District, Botswana, 2015, the number of individualsidentified based on both-side or single-side detections (Both, Left, Right), classification of the detections based on whether they were individually identifiable (i.e.,detections of individuals from ‘both’ category + single-side category with larger number; Indiv. ID) or unresolved (i.e., detections of individuals from single-sidecategory with smaller number+ photos that were not individually identifiable), median number (range) of detections per individual (Det./indiv.), and mediannumber (range) of camera traps where an individual was photographed (Traps/indiv.).
Species Scientific name Det. Individuals Detection classifications Det./indiv. Traps/indiv.
Both Right Left Indiv. ID Unresolved
Spotted hyena Crocuta crocuta 947 167 27 16 764 183 3 (1–25) 2 (1–14)Leopard (F) Panthera pardus 120 28 3 1 93 27 2 (1−10) 2 (1–6)Leopard (M) Panthera pardus 232 28 2 0 218 14 5 (1−33) 4 (1−23)Wild dogs Lycaon pictus 302 50 0 0 280 22 5 (1–15) 5 (1−12)Serval Leptailurus serval 46 12 10 5 38 8 1 (1–6) 1 (1–4)African civet Civettictis civetta 325 41 45 50 205 120 1 (1–18) 1 (1–6)Aardwolf Proteles cristatus 36 10 5 6 27 9 1 (1–5) 1 (1–3)Lion Panthera leo 156 26 0 0 96 60 4 (1–8) 2 (1–7)
L.N. Rich, et al. Biological Conservation 233 (2019) 12–20
16

grid. In the case of SMR, accuracy was also lower for the hybrid gridwhen σ=0.2. However, this comparison is not direct since 38% of thesystematic data sets did not allow for density to be estimated at all (i.e.,no spatial recaptures; Table 1). In most cases, the hybrid design wassuccessful in allowing us to estimate density for a wider range of specieswith negligible decreases in accuracy.
3.2. Field density estimation
We recorded 2167 photographic detections of our 7 focal carnivorespecies over 6607 trap nights. Spotted hyenas were photographed mostoften with 947 detections while aardwolves were photographed leastwith 36 detections (Table 2). We identified high numbers of individualspotted hyenas, African civets, and leopards, and low numbers ofaardwolves, servals, and lions (Table 2).
Our hybrid camera trapping configuration resulted in at least someindividuals from all species being photographed at multiple camera
stations. Among the species, individual male leopards and individualwild dogs were detected the greatest number of times at the greatestnumber of cameras (Table 2). Conversely, individuals from the smallerranging species (i.e., aardwolves, servals, and civets) were detected thefewest number of times at the fewest cameras (Table 2). Male leopardsand African civets had the highest estimated baseline encounter rates,g0, whereas wild dogs and spotted hyenas had the largest estimatedmovement parameters, σ (Table 3). Estimates of g0 and σ were higherfor male leopards than for females, supporting that the space use offelids can differ between sexes (Table 3; Sollmann et al., 2011). Forlions, however, σ was similar for adult male lions (σ=3.8) and youngmale lions and females (σ=4.2), so we opted to model all lion detec-tions together. Our resulting density estimates ranged from 1.2 lions per100 km2 to 10.1 spotted hyenas per 100 km2 (Fig. 5). For the majorityof species, estimated densities were greater in non-mopane habitats(i.e., open areas) than in mopane woodlands but these relationshipswere weak (i.e., 95% confidence intervals overlapped; Fig. 5). We were
Table 3Summary statistics (estimated mean parameter values and 95% confidence intervals) from spatially explicit capture-recapture and spatial mark-resight models basedon photographic captures of carnivores in Ngamiland District, Botswana, 2015, including buffer widths and the resulting state space areas, and estimates of baselineencounter rate g0 and scale parameter σ.
Common name Buffer width (km) State space (km2) g0 σ (km)
Spotted hyena 25 6337 0.07 (0.06–0.08) 4.2 (4.01–4.46)Leopard (F) 15 3738 0.1 (0.07–0.15) 2.4 (2.06–2.70)Leopard (M) 20 4969 0.2 (0.15–0.22) 3.2 (2.93–3.51)Wild dogs 25 6337 0.07 (0.054–0.079) 4.8 (4.40–5.23)Serval 5 1666 0.06 (0.027–0.147) 1.2 (0.85–1.55)African civet 6 1867 0.3 (0.28–0.42) 1.3 (1.20–1.44)Aardwolf 5 1666 0.06 (0.026–0.130) 2.2 (1.64–3.03)Lion 25 6337 0.09 (0.044–0.110) 3.6 (3.26–4.56)
Fig. 4. We simulated 50 data sets using two camera trap configurations (systematic and hybrid grids; Fig. 2) and 5 sets of density, baseline encounter rate, andmovement parameter values, and then analyzed the data using both spatially explicit capture-recapture (SECR) and spatial mark-resight (SMR) models. Here, wepresent the resulting estimates of relative accuracy (mean absolute error - MAE) and relative bias (mean error - ME) for each camera trap configuration, eachsimulated population density, and each modeling approach. A star indicates there were no spatial recaptures and consequently, that we were not able to estimaterelative accuracy and bias.
L.N. Rich, et al. Biological Conservation 233 (2019) 12–20
17
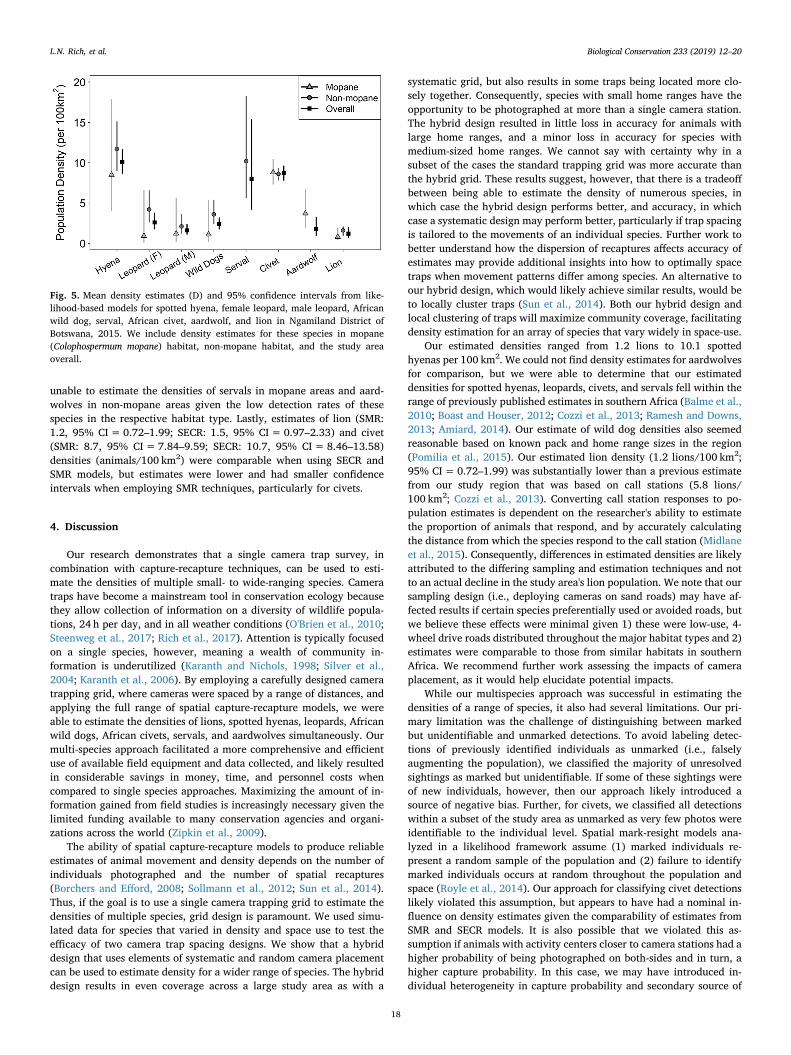
unable to estimate the densities of servals in mopane areas and aard-wolves in non-mopane areas given the low detection rates of thesespecies in the respective habitat type. Lastly, estimates of lion (SMR:1.2, 95% CI=0.72–1.99; SECR: 1.5, 95% CI= 0.97–2.33) and civet(SMR: 8.7, 95% CI=7.84–9.59; SECR: 10.7, 95% CI= 8.46–13.58)densities (animals/100 km2) were comparable when using SECR andSMR models, but estimates were lower and had smaller confidenceintervals when employing SMR techniques, particularly for civets.
4. Discussion
Our research demonstrates that a single camera trap survey, incombination with capture-recapture techniques, can be used to esti-mate the densities of multiple small- to wide-ranging species. Cameratraps have become a mainstream tool in conservation ecology becausethey allow collection of information on a diversity of wildlife popula-tions, 24 h per day, and in all weather conditions (O'Brien et al., 2010;Steenweg et al., 2017; Rich et al., 2017). Attention is typically focusedon a single species, however, meaning a wealth of community in-formation is underutilized (Karanth and Nichols, 1998; Silver et al.,2004; Karanth et al., 2006). By employing a carefully designed cameratrapping grid, where cameras were spaced by a range of distances, andapplying the full range of spatial capture-recapture models, we wereable to estimate the densities of lions, spotted hyenas, leopards, Africanwild dogs, African civets, servals, and aardwolves simultaneously. Ourmulti-species approach facilitated a more comprehensive and efficientuse of available field equipment and data collected, and likely resultedin considerable savings in money, time, and personnel costs whencompared to single species approaches. Maximizing the amount of in-formation gained from field studies is increasingly necessary given thelimited funding available to many conservation agencies and organi-zations across the world (Zipkin et al., 2009).
The ability of spatial capture-recapture models to produce reliableestimates of animal movement and density depends on the number ofindividuals photographed and the number of spatial recaptures(Borchers and Efford, 2008; Sollmann et al., 2012; Sun et al., 2014).Thus, if the goal is to use a single camera trapping grid to estimate thedensities of multiple species, grid design is paramount. We used simu-lated data for species that varied in density and space use to test theefficacy of two camera trap spacing designs. We show that a hybriddesign that uses elements of systematic and random camera placementcan be used to estimate density for a wider range of species. The hybriddesign results in even coverage across a large study area as with a
systematic grid, but also results in some traps being located more clo-sely together. Consequently, species with small home ranges have theopportunity to be photographed at more than a single camera station.The hybrid design resulted in little loss in accuracy for animals withlarge home ranges, and a minor loss in accuracy for species withmedium-sized home ranges. We cannot say with certainty why in asubset of the cases the standard trapping grid was more accurate thanthe hybrid grid. These results suggest, however, that there is a tradeoffbetween being able to estimate the density of numerous species, inwhich case the hybrid design performs better, and accuracy, in whichcase a systematic design may perform better, particularly if trap spacingis tailored to the movements of an individual species. Further work tobetter understand how the dispersion of recaptures affects accuracy ofestimates may provide additional insights into how to optimally spacetraps when movement patterns differ among species. An alternative toour hybrid design, which would likely achieve similar results, would beto locally cluster traps (Sun et al., 2014). Both our hybrid design andlocal clustering of traps will maximize community coverage, facilitatingdensity estimation for an array of species that vary widely in space-use.
Our estimated densities ranged from 1.2 lions to 10.1 spottedhyenas per 100 km2. We could not find density estimates for aardwolvesfor comparison, but we were able to determine that our estimateddensities for spotted hyenas, leopards, civets, and servals fell within therange of previously published estimates in southern Africa (Balme et al.,2010; Boast and Houser, 2012; Cozzi et al., 2013; Ramesh and Downs,2013; Amiard, 2014). Our estimate of wild dog densities also seemedreasonable based on known pack and home range sizes in the region(Pomilia et al., 2015). Our estimated lion density (1.2 lions/100 km2;95% CI= 0.72–1.99) was substantially lower than a previous estimatefrom our study region that was based on call stations (5.8 lions/100 km2; Cozzi et al., 2013). Converting call station responses to po-pulation estimates is dependent on the researcher's ability to estimatethe proportion of animals that respond, and by accurately calculatingthe distance from which the species respond to the call station (Midlaneet al., 2015). Consequently, differences in estimated densities are likelyattributed to the differing sampling and estimation techniques and notto an actual decline in the study area's lion population. We note that oursampling design (i.e., deploying cameras on sand roads) may have af-fected results if certain species preferentially used or avoided roads, butwe believe these effects were minimal given 1) these were low-use, 4-wheel drive roads distributed throughout the major habitat types and 2)estimates were comparable to those from similar habitats in southernAfrica. We recommend further work assessing the impacts of cameraplacement, as it would help elucidate potential impacts.
While our multispecies approach was successful in estimating thedensities of a range of species, it also had several limitations. Our pri-mary limitation was the challenge of distinguishing between markedbut unidentifiable and unmarked detections. To avoid labeling detec-tions of previously identified individuals as unmarked (i.e., falselyaugmenting the population), we classified the majority of unresolvedsightings as marked but unidentifiable. If some of these sightings wereof new individuals, however, then our approach likely introduced asource of negative bias. Further, for civets, we classified all detectionswithin a subset of the study area as unmarked as very few photos wereidentifiable to the individual level. Spatial mark-resight models ana-lyzed in a likelihood framework assume (1) marked individuals re-present a random sample of the population and (2) failure to identifymarked individuals occurs at random throughout the population andspace (Royle et al., 2014). Our approach for classifying civet detectionslikely violated this assumption, but appears to have had a nominal in-fluence on density estimates given the comparability of estimates fromSMR and SECR models. It is also possible that we violated this as-sumption if animals with activity centers closer to camera stations had ahigher probability of being photographed on both-sides and in turn, ahigher capture probability. In this case, we may have introduced in-dividual heterogeneity in capture probability and secondary source of
Fig. 5. Mean density estimates (D) and 95% confidence intervals from like-lihood-based models for spotted hyena, female leopard, male leopard, Africanwild dog, serval, African civet, aardwolf, and lion in Ngamiland District ofBotswana, 2015. We include density estimates for these species in mopane(Colophospermum mopane) habitat, non-mopane habitat, and the study areaoverall.
L.N. Rich, et al. Biological Conservation 233 (2019) 12–20
18

negative bias in abundance and density (Augustine et al., 2018). Whenrelying on natural marks, we expect that many practitioners will alsohave difficulty distinguishing between these unresolved classificationsand face similar limitations. Thus, we encourage the development of alikelihood-based SMR model where detections of unknown status couldbe grouped together potentially as an overall correction factor for de-tection.
Our multispecies capture-recapture framework demonstrates (1) theutility of a hybrid sampling design when the goal is to inform com-munity-level conservation and (2) the practicality of likelihood-based,spatial models for estimating the densities of partially to fully markedpopulations (Borchers and Efford, 2008; Efford and Hunter, 2017). Thisframework is applicable to not only the growing number of camera trapstudies worldwide (Steenweg et al., 2017; Rich et al., 2017), but also tosurvey methods (e.g., hair snares) that produce encounter history datawith corresponding spatial information (Royle et al., 2009). We appliedour multispecies approach to a camera trap survey in northern Bots-wana, specifically, to provide vitally needed information on the popu-lation status of 7 carnivore species, including the first published densityestimates for aardwolves, civets, servals, wild dogs, and leopards in thecountry. Conserving carnivore populations in the Okavango Delta ofBotswana is vital given it is a stronghold for many wildlife populationsand home to one of the highest diversities of carnivores in Africa(Gittleman et al., 2001). Similar to continent-wide trends, however,wildlife is perceived to be declining within the country and the dataneeded to quantify this trend is generally lacking (Ripple et al., 2014;Bauer et al., 2015; Rogan et al., 2017). We encourage continued re-search focused on improving our knowledge and understanding ofwildlife densities and abundances in Botswana, as well as elsewhere inthe world. Only then, will we be able to empirically detect populationdeclines and develop conservation plans aimed at effectively curtailingor reversing these declines (Collen et al., 2013; Pereira et al., 2013,Ripple et al., 2014; Bauer et al., 2015).
Data accessibility
We will publish our data in the Dryad Digital Repository uponmanuscript acceptance.
Acknowledgments
We thank the government of Botswana, the Ministry of theEnvironment, Wildlife and Tourism, and the Department of Wildlife andNational Parks for permission to conduct this study (permit EWT 8/36/4 XXIII 44). We thank J. Vitale, L. Van der Weyde, R.H. Walker, G.Gilfillan, and D. Kedikilwe at BPCT for helping to identify individualanimals, K. Golabek and N. Jordan for project assistance, R. Crous forpermission to survey his property, and A. Gabanakitso for field assis-tance. Thank you to M.G. Efford for help with the modeling and S.M.Karpanty and K.A. Alexander for feedback on the manuscript. This re-search was funded by a Fulbright U.S. Student Program, PEO ScholarAward, Wilderness Wildlife Trust, Columbus Zoo, ClevelandMetroparks Zoo, Wild Felid Association, Idea Wild, TemenosFoundation, Rufford Foundation, Virginia Tech, and the numerousdonors who support the BPCT.
Appendix A
We simulated 50 data sets for all combinations of five populationdensities, two statistical estimators, and two camera trap configura-tions. Our simulations included 98 cameras arranged in either a sys-tematic grid or a hybrid design, which combined systematic andrandom locations. Data generated in the simulations followed a spa-tially explicit capture-recapture (SECR) or spatial mark-resight (SMR)design and were analyzed using the respective estimator in the secrpackage in R. Finally, we simulated 5 different densities (0.5, 1, 2, 4, 8
animals per unit area), and assumed a strong negative correlation be-tween density and home range size. In all cases, we were unable toestimate density for the systematic grid when density was high (andmovement low) because spatial recaptures did not occur. We were alsounable to generate estimates of density in 7 cases for the SECR data and19 cases for the SMR data when the simulated density of 4 was used.
References
Amiard, P., 2014. Ecology of the African Civet (Civettictis civetta) in Three DifferentVegetation Types of South Africa: Study of the Population Density, the Habitat Useand the Diet (Master thesis). University of Reims Champagne-Ardenne, Reims,France.
Augustine, B.C., Royle, J.A., Kelly, M.J., Satter, C.B., Alonso, R.S., Boydston, E.E., Crooks,K.R., 2018. Spatial capture–recapture with partial identity: an application to cameratraps. Ann. Appl. Stat. 12, 67–95.
Ayalew, B., Afework, B., Balakrishnan, M., 2013. Home range and movement patterns ofAfrican civet Civettictis civetta in Wondo Genet, Ethiopia. Small Carniv. Conserv. 48,83–86.
Balme, G.A., Hunter, L.T.B., Slotow, R., 2010. Evaluating methods for counting crypticcarnivores. J. Wildl. Manag. 73, 433–441.
Bauer, H., Chapron, G., Nowell, K., Henschel, P., Funston, P., Hunter, L.T.B., Macdonald,D.W., Packer, C., 2015. Lion (Panthera leo) populations are declining rapidly acrossAfrica, except in intensively managed areas. Proc. Natl. Acad. Sci. U. S. A. 112,14894–14899.
Bennitt, E., Bonyongo, M.C., Harris, S., 2014. Habitat selection by African buffalo(Syncerus caffer) in response to landscape-level fluctuations in water availability ontwo temporal scales. PLoS One 9, e101346.
Boast, L.K., Houser, A., 2012. Density of large predators on commercial farmland inGhanzi, Botswana. S. Afr. J. Wildl. Res. 42, 138–143.
Borchers, D.L., Efford, M.G., 2008. Spatially explicit maximum likelihood methods forcapture-recapture studies. Biometrics 64, 377–385.
Collen, B., Pettorelli, B., Baillie, J.E., Durant, S.M., 2013. Biodiversity Monitoring andConservation: Bridging the Gap between Global Commitment and Local Action. JohnWiley and Sons, West Sussex, UK.
Cozzi, G., Broekhuis, F., McNutt, J.W., Schmid, B., 2013. Density and habitat use of lionsand spotted hyenas in northern Botswana and the influence of survey and ecologicalvariables on call-in survey estimation. Biodivers. Conserv. 22, 2937–2956.
Dalerum, F., Somers, M.J., Kunkel, K.E., Cameron, E.Z., 2008. The potential for largecarnivores to act as biodiversity surrogates in southern Africa. Biodivers. Conserv. 17,2939–2949.
Efford, M.G., 2017. secr: spatially explicit capture-recapture models. R package version3.0.1. Available from. http://CRAN.R-project.org/package=secr, Accessed date:August 2017.
Efford, M.G., Hunter, C.M., 2017. Spatial capture-mark-resight estimation of animal po-pulation density. Biometrics 73, 1–25.
Forman, R.T.T., Alexander, L.E., 1998. Roads and their major ecological effects. Annu.Rev. Ecol. Syst. 29, 207–231.
Gittleman, J.L., Funk, S.M., Macdonald, D.M., Wayne, R.K., 2001. CarnivoreConservation. Cambridge University Press, Cambridge, UK.
Howe, E.J., Buckland, S.T., Després-Einspenner, M.L., Kühl, H.S., 2017. Distance sam-pling with camera traps. Methods Ecol. Evol. 8, 1558–1565.
Karanth, K.U., Nichols, J.D., 1998. Estimation of tiger densities in India using photo-graphic captures and recaptures. Ecology 79, 2852–2862.
Karanth, K.U., Nichols, J.D., Kumar, N.S., Hines, J.E., 2006. Assessing tiger populationdynamics using photographic capture-recapture sampling. Ecology 87, 2925–2937.
Keene-Young, R., 1999. A thin line: Botswana's cattle fences. Afr. Environ. Wildl. 7,71–79.
Maffei, L., Noss, A.J., 2008. How small is too small? Camera trap survey areas and densityestimates for ocelots in the Bolivian Chaco. Biotropica 40, 71–75.
Midlane, N., O'Riain, M.J., Balme, G.A., Hunter, L.T.B., 2015. To track or to call: com-paring methods for estimating population abundance of African lions Panthera leo inKafue National Park. Biodivers. Conserv. 24, 1311–1327.
O'Brien, T.G., Baillie, J.E.M., Krueger, L., Cuke, M., 2010. The Wildlife Picture Index:monitoring top trophic levels. Anim. Conserv. 13, 335–343.
Otis, D.L., Burnham, K.P., White, G.C., Anderson, D.R., 1978. Statistical inference fromcapture data on closed animal populations. Wildl. Monogr. 62, 3–135.
Pereira, H.M., Ferrier, S., Walters, M., Geller, G.N., Jongman, R.H.G., Scholes, R.J., et al.,2013. Essential biodiversity variables. Science 339, 277–278.
Pomilia, M.A., McNutt, J.W., Jordan, N.R., 2015. Ecological predictors of African wilddog ranging patterns in northern Botswana. J. Mammal. 130, 1214–1223.
R Development Core Team, 2017. The R Project for statistical computing. https://www.r-project.org/, Accessed date: 15 January 2017.
Ramesh, T., Downs, C.T., 2013. Impact of farmland use on population density and activitypatterns of serval in South Africa. J. Mammal. 94, 1460–1470.
Rich, L.N., Kelly, M.J., Sollmann, R., Noss, A.J., Maffei, L., Arispe, R.L., ... Di Bitetti, M.S.,2014. Comparing capture-recapture, mark-resight and spatial mark-resight modelsfor estimating puma densities via camera traps. J. Mammal. 95, 382–391.
Rich, L.N., Miller, D.A.W., Robinson, H.S., McNutt, J.W., Kelly, M.J., 2016. Using cameratrapping and hierarchical occupancy modeling to evaluate the spatial ecology of anAfrican mammal and bird community. J. Appl. Ecol. 53, 1225–1235.
Rich, L.N., Davis, C.L., Farris, Z.J., Miller, D.A.W., Tucker, J.M., Hamel, S., ... Kelly, M.J.,2017. Assessing global patterns in mammalian carnivore occupancy by integrating
L.N. Rich, et al. Biological Conservation 233 (2019) 12–20
19
local camera trap sureys. Glob. Ecol. Biogeogr. 26, 918–929.Ripple et al, 2014. Status and ecological effects of the world's largest carnivores. Science
343, 151–162.Rogan, M.S., Lindsey, P.A., Tambling, C.J., Golabek, K.A., Chase, M.J., Collins, K.,
McNutt, J.W., 2017. Illegal bushmeat hunters compete with predators and threatenwild herbivore populations in a global tourism hotspot. Biol. Conserv. 210, 233–242.
Rowcliffe, J.M., Field, J., Turvey, S.T., Carbone, C., 2008. Estimating animal density usingcamera traps without the need for individual recognition. J. Appl. Ecol. 45,1228–1236.
Royle, J.A., Nichols, J.D., Karanth, K.U., Gopalaswamy, A.M., 2009. A hierarchical modelfor estimating density in camera trap studies. J. Appl. Ecol. 46, 118–127.
Royle, J.A., Chandler, R.B., Sollmann, R., Gardner, B., 2014. Spatial Capture-Recapture.Academic Press, Waltham, Massachusetts.
Satter, C.B., Augustine, B.C., Harmsen, B.J., Foster, R.J., Sanchez, E.E., Wultsch, C., Davis,M.L., Kelly, M.J., 2019. Long-term monitoring of ocelot densities in Belize. J. Wildl.Manag. 83, 283–294.
Schmeller, D.S., 2015. Towards a global terrestrial species monitoring program. J. Nat.Conserv. 25, 51–57.
Seber, G.A.F., 1982. The Estimation of Animal Abundance and Related Parameters,second ed. Charles Griffin, London, UK.
Silver, S.C., Ostro, L.E.T., Marsh, L.K., Maffei, L., Noss, A.J., Kelly, M.J., ... Ayala, G.,2004. The use of camera traps for estimating jaguar Panthera onca abundance anddensity using capture/recapture analysis. Oryx 38, 148–154.
Sollmann, R., Furtado, M.M., Gardner, B., Hofer, H., Jácomo, A.T.A., Tôrres, N.M.,
Silveira, L., 2011. Improving density estimates for elusive carnivores: accounting forsex-specific detection and movements using spatial capture-recapture models for ja-guars in central Belize. Biol. Conserv. 144, 1017–1024.
Sollmann, R., Gardner, B., Belant, J.L., 2012. How does spatial study design influencedensity estimates from spatial capture-recapture models? PLoS One 7, e34575.
Sollmann, R., Gardner, B., Parsons, A.W., Stocking, J.J., McClintock, B.T., Simons, T.R.,Pollock, K.H., O'Connell, A.F., 2013. A spatial mark-resight model augmented withtelemetry data. Ecology 94, 553–559.
Steenweg, R., Hebblewhite, M., Kays, R., Ahumada, J., Fisher, J.T., Burton, C., ... Rich,L.N., 2017. Scaling-up camera traps: monitoring the planet's biodiversity with net-works of remote sensors. Front. Ecol. Evol. 15, 26–34.
Sun, C.C., Fuller, A.K., Royle, A.R., 2014. Trap configuration and spacing influencesparameter estimates in spatial capture-recapture models. PLoS One 9, e88025.
Williams, B.K., Nichols, J.D., Conroy, M.J., 2002. Estimating abundance for closed po-pulations with mark-recapture methods. In: Williams, B.K., Nichols, J.D., Conroy,M.J. (Eds.), Analysis and Management of Animal Populations. Academic Press, SanDiego, California, pp. 232–289.
Woodroffe, R., Ginsberg, J.R., 1998. Edge effects and the extinction of populations insideprotected areas. Science 280, 2126–2128.
World Travel and Tourism Council, 2017. Travel & Tourism: Economic Impact 2017Botswana. World Travel & Tourism Council, London, United Kingdom.
Zipkin, E.F., DeWan, A., Royle, J.A., 2009. Impacts of forest fragmentation on speciesrichness: a hierarchical approach to community modeling. J. Appl. Ecol. 46,815–822.
L.N. Rich, et al. Biological Conservation 233 (2019) 12–20
20