Sampling bias in multi-agent simulation (MAS) models Buysse, J 1., Frija, A 1., Van der Straeten, B...
20
Sampling bias in multi-agent Sampling bias in multi-agent simulation (MAS) models simulation (MAS) models Buysse, J 1 ., Frija, A 1 ., Van der Straeten, B 1 ., Nolte, S. 1 , Lauwers, L. 1,2 , Claeys, D. 2 and Van Huylenbroeck G. (1)Ghent University, Department of Agricultural Economics (2)Institute for Agricultural and Fisheries Research, Merelbeke, Belgium 122 nd EAAE Seminar – Ancona 16- 18 February 2011 UGent – Faculty of Bioscience Engineering– Department Agricultural Economics
-
date post
22-Dec-2015 -
Category
Documents
-
view
214 -
download
0
Transcript of Sampling bias in multi-agent simulation (MAS) models Buysse, J 1., Frija, A 1., Van der Straeten, B...

Sampling bias in multi-agent Sampling bias in multi-agent simulation (MAS) modelssimulation (MAS) models
Buysse, J1., Frija, A1., Van der Straeten, B1., Nolte, S.1, Lauwers, L.1,2, Claeys, D.2 and Van Huylenbroeck G.
(1)Ghent University, Department of Agricultural Economics(2)Institute for Agricultural and Fisheries Research, Merelbeke, Belgium
122nd EAAE Seminar – Ancona 16- 18 February 2011UGent – Faculty of Bioscience Engineering– Department Agricultural Economics

Overview of the presentationOverview of the presentation
- Why MAS models?- Problem statement: the sampling bias in MAS- Objectives- Methodology- Results- Perspectives
122nd EAAE Seminar – Ancona 16- 18 February 2011UGent – Faculty of Bioscience Engineering– Department Agricultural Economics

Why MAS models? Why MAS models?
- Heterogeneity of opportunities and constraints at the individual level
-Accurate estimation of policy distributional effects
- Accurate estimation of agents interactions (spatial effects, TC, propensity of innovation, etc.)
- But…
122nd EAAE Seminar – Ancona 16- 18 February 2011UGent – Faculty of Bioscience Engineering– Department Agricultural Economics

Problem statementProblem statement
- The need for full population data
- In case of sampling, farms in sample cannot interact with the real-world farm
122nd EAAE Seminar – Ancona 16- 18 February 2011UGent – Faculty of Bioscience Engineering– Department Agricultural Economics

Problem statementProblem statement
122nd EAAE Seminar – Ancona 16- 18 February 2011UGent – Faculty of Bioscience Engineering– Department Agricultural Economics
Farmer i
Full population
Farmer j

Problem statementProblem statement
122nd EAAE Seminar – Ancona 16- 18 February 2011UGent – Faculty of Bioscience Engineering– Department Agricultural Economics
Farmer i
Sample
Farmer k

Problem statementProblem statement
-Systematic bias when TC between agents are simulated in MAS
- Most MAS empirical models rely on sample data
- Future large scale MAS models on sampled data !
122nd EAAE Seminar – Ancona 16- 18 February 2011UGent – Faculty of Bioscience Engineering– Department Agricultural Economics

Problem statementProblem statement
Illustration of sampling bias on real model (Van der Straeten et al. 2010)
- A MAS model used to simulation PR exchange between 30,000 farmers in Flanders
- The bias is correlated to the sample size
122nd EAAE Seminar – Ancona 16- 18 February 2011UGent – Faculty of Bioscience Engineering– Department Agricultural Economics
Bootstrap Number of repetitions
Average cost simulated
SD Average cost simulated/Average cost of population
S= 100 (0.26%) 100 3210.88 1200.77 + 59 %S= 200 (0.52%) 100 2698.58 666.24 + 33 %S= 500 (1.31%) 100 2581.09 755.91 + 28 %S= 750 (2%) 100 2571.13 536.30 + 27 %Full population (100%) - 2016.49 - -

ObjectivesObjectives
‣To test, illustrate, and quantify the sampling biases resulting in cases of existence of TC
‣To develop and to discuss mechanisms that can remove such sampling biases
122nd EAAE Seminar – Ancona 16- 18 February 2011UGent – Faculty of Bioscience Engineering– Department Agricultural Economics

MethodologyMethodology- Simplified MAS model
- minimizes transport costs of emissions and the cost of emission abatement:
Minimize Σn (Σm cnm τnm + ωn p)
s.t.
en + Σm τmn - Σm τnm ≤ rn + ωn
where‣n and m are farm indices,
‣τnm is the amount of transported emission form n to m,
‣ωn is the amount of emission abatement of agent n,
‣en is the amount of emission of farm n,
‣rn is the amount of emission rights of farm n,
‣cnm is the transport cost per transported emission from farm n to m ,
‣p is the penalty per overused emission right. 122nd EAAE Seminar – Ancona 16- 18 February 2011UGent – Faculty of Bioscience Engineering– Department Agricultural Economics

MethodologyMethodology
-Applied on synthetic population data (500 farmers): average cost per farm: 27.74
‣ Emission (en ) random sampled from normal distribution,‣ Emission right (rn ) random sampled from normal distribution,‣ Transport costs (cnm) is random sampled from uniform distribution
- We bootstrap on different sample sizes: 20-500
122nd EAAE Seminar – Ancona 16- 18 February 2011UGent – Faculty of Bioscience Engineering– Department Agricultural Economics

ResultsResults
122nd EAAE Seminar – Ancona 16- 18 February 2011UGent – Faculty of Bioscience Engineering– Department Agricultural Economics
100 200 300 400
05
00
10
00
15
00
20
00
Samplesize
ave
rag
e c
ost
s
Average cost of 27.7
Variations

ResultsResults - The order of magnitude of the sampling bias can be very large
- Nonlinear effect of the sample size on the bias
Cause:
- Subsamples do not always satisfy the real population balance
- Motivation for sampling bias correction via macrobalance coefficients
- The amount of emission is smaller than the total amount of emission rights (Σn en < Σn rn)
122nd EAAE Seminar – Ancona 16- 18 February 2011UGent – Faculty of Bioscience Engineering– Department Agricultural Economics

ResultsResults
100 200 300 400
10
02
00
30
04
00
50
0
Samplesize
ave
rag
e c
ost
s
122nd EAAE Seminar – Ancona 16- 18 February 2011UGent – Faculty of Bioscience Engineering– Department Agricultural Economics
Average cost of 27.7
Average costs of samples

Remove remaining bias with calibrationRemove remaining bias with calibration
- Calibration is the comparison of two measurements: - the measurement of a device with known correctness: full
population model
- is used to correct another measurement made by another device: sample model
- Once calibrated, the second device can make correct measurements: sample model can be used in for simulations
- Resampling data is used to estimate the calibration function: prediction of the bias as a function of the sample size
122nd EAAE Seminar – Ancona 16- 18 February 2011UGent – Faculty of Bioscience Engineering– Department Agricultural Economics

ResultsResults
coefficients of the polynomial of the simulated average costs on the sample size
122nd EAAE Seminar – Ancona 16- 18 February 2011UGent – Faculty of Bioscience Engineering– Department Agricultural Economics
Estimate Std. Error t value Pr(>|t|)
(sample size)^0 6,11E+05 2,68E+04 22.754 < 2e-16 ***
(sample size)^1 -2,53E+04 2,62E+03 -9.657 < 2e-16 ***
(sample size)^2 5,64E+02 9,35E+01 6.032 1.88e-09 ***
(sample size)^3 -7,46E+00 1,69E+00 -4.403 1.11e-05 ***
(sample size)^4 6,24E-02 1,78E-02 3.505 0.000464 ***
(sample size)^5 -3,42E-04 1,16E-04 -2.944 0.003267 **
(sample size)^6 1,24E-06 4,84E-07 2.563 0.010450 *
(sample size)^7 -2,95E-09 1,29E-09 -2.286 0.022337 *
(sample size)^8 4,42E-12 2,13E-12 2.076 0.037970 *
(sample size)^9 -3,78E-15 1,98E-15 -1.911 0.056064 .
(sample size)^10 1,41E-18 7,91E-19 1.778 0.075497 .

ResultsResults
100 200 300 400
10
20
30
40
50
Samplesize
ave
rag
e c
ost
s
122nd EAAE Seminar – Ancona 16- 18 February 2011UGent – Faculty of Bioscience Engineering– Department Agricultural Economics
Average cost of 27.7
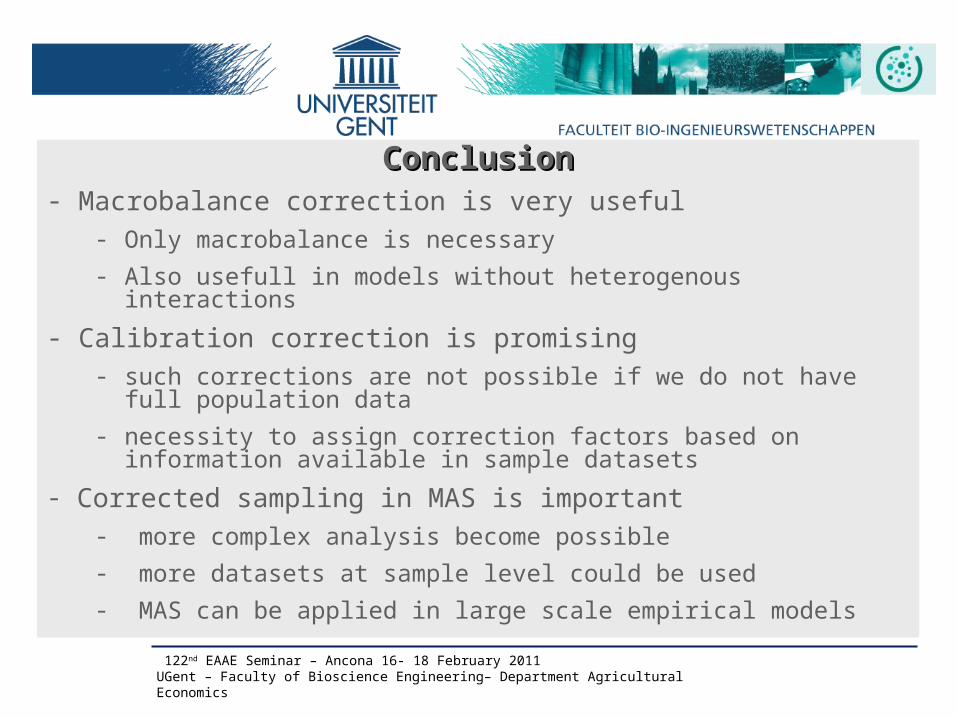
ConclusionConclusion- Macrobalance correction is very useful
- Only macrobalance is necessary
- Also usefull in models without heterogenous interactions
- Calibration correction is promising- such corrections are not possible if we do not have full population data
- necessity to assign correction factors based on information available in sample datasets
- Corrected sampling in MAS is important- more complex analysis become possible
- more datasets at sample level could be used
- MAS can be applied in large scale empirical models
122nd EAAE Seminar – Ancona 16- 18 February 2011UGent – Faculty of Bioscience Engineering– Department Agricultural Economics

Further researchFurther research- Check for:
- Impact on variance- Impact of changes in model structure- Impact of using synthetic full population as
calibration reference
- Search for: - Calibration correction without availability of full
population (see first attempts in paper)
122nd EAAE Seminar – Ancona 16- 18 February 2011UGent – Faculty of Bioscience Engineering– Department Agricultural Economics

THANK YOUTHANK YOU