Sampling and Confidence Interval Kenneth Kwan Ho Chui, PhD, MPH Department of Public Health and...
24
Sampling and Confidence Interval Kenneth Kwan Ho Chui, PhD, MPH Department of Public Health and Community Medicine [email protected] 617.636.0853 Epidemiology/ Biostatistics
-
Upload
felix-fisher -
Category
Documents
-
view
217 -
download
1
Transcript of Sampling and Confidence Interval Kenneth Kwan Ho Chui, PhD, MPH Department of Public Health and...

Sampling and Confidence Interval
Kenneth Kwan Ho Chui, PhD, MPHDepartment of Public Health and Community Medicine
Epidemiology/Biostatistics

Learning objectives in the syllabus
Understand how a histogram can be read as a probability distribution
Understand the importance of random sampling in statistics
Understand how sample means can have distributions
Explain the behavior (distribution) of sample means and the Central Limit Theorem
Know how to interpret confidence intervals as seen in the medical literature
Know how to calculate a confidence interval for a mean

Population Parameter
Sample statisticsSample
Types of dataHow to summarize data Central tendency VariabilityHow to evaluate graphs
Distribution of sample meansKnow how to interpret and calculate a confidence interval for statistical inference

Assumed knowledge for today
MeanVarianceStandard deviationThe 68-95-99 rule

Central tendency: Mean
Consider a variable with data:1, 2, 3, 3, 4, 4, 4, 5, 5, 6

Variance & Standard deviation
Observation #
Values
2
2
2 2 2
2
Sum them up
Divide by (sample size – 1)
Variance
SD = √Variance
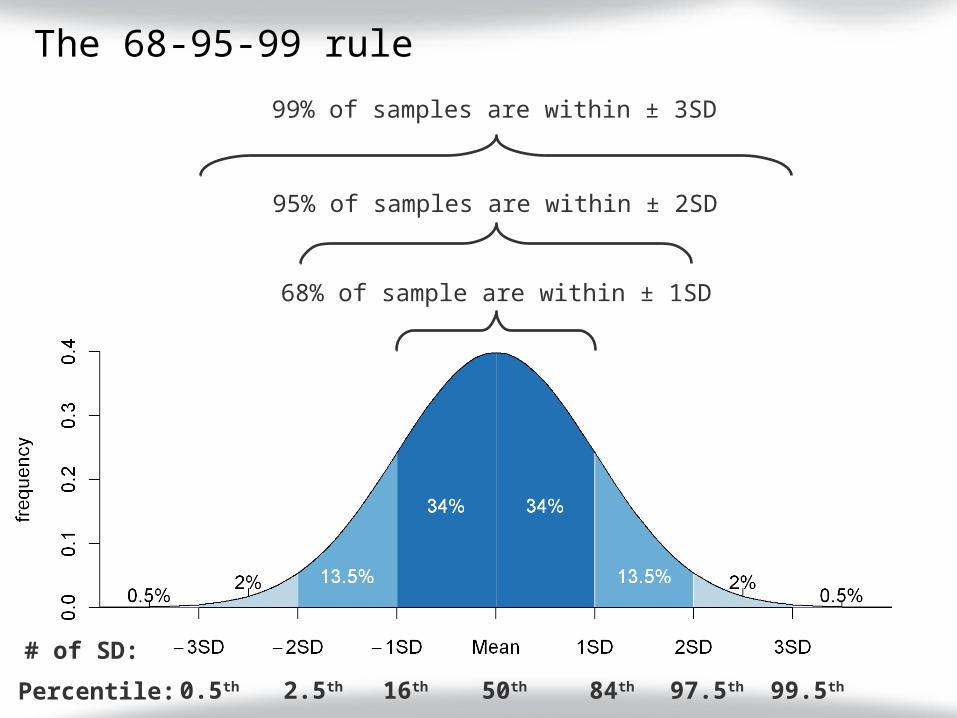
The 68-95-99 rule
68% of sample are within ± 1SD
95% of samples are within ± 2SD
99% of samples are within ± 3SD
50th 84th 97.5th 99.5th16th2.5th0.5thPercentile:
# of SD:

Population Parameter
Sample statisticsThe mean BMI ofa sample fromBoston, Massachusetts
The true mean BMI ofBoston, Massachusetts
Sample
Researcher
?

Sample variation
1, 2, 3, 4, 5, 6
2, 4 4, 6 1, 2 1, 6Samples
3.0 5.0 1.5 3.5Means
Researcher 1 Researcher 2 Researcher 3 Researcher 4Researchers
The whole population
?

Central
limittheorem
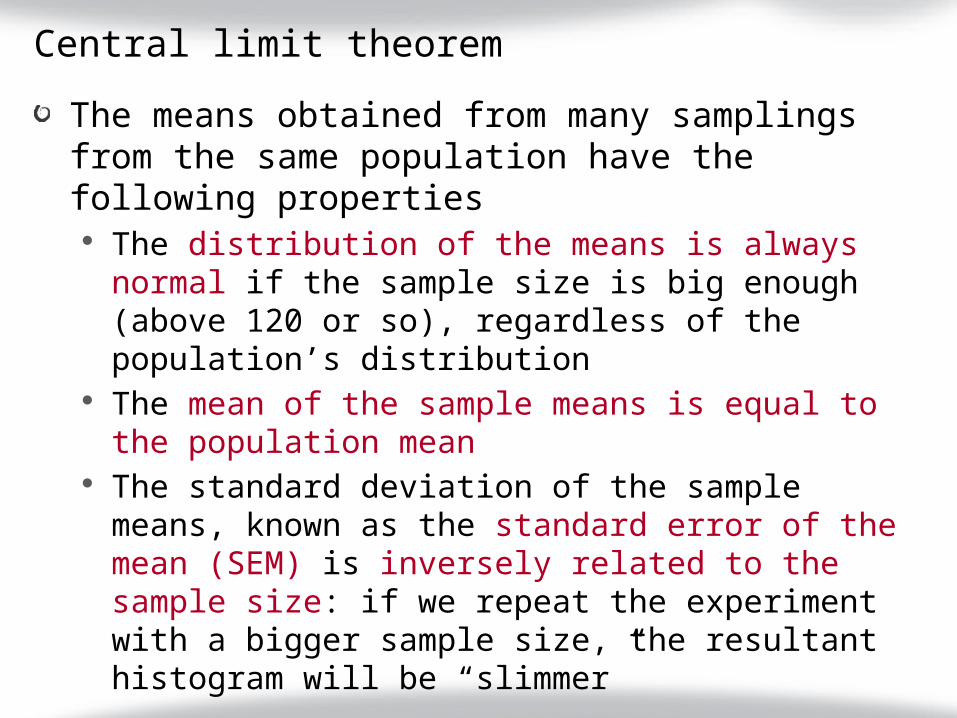
Central limit theorem
The means obtained from many samplings from the same population have the following properties
The distribution of the means is always normal if the sample size is big enough (above 120 or so), regardless of the population’s distribution
The mean of the sample means is equal to the population mean
The standard deviation of the sample means, known as the standard error of the mean (SEM) is inversely related to the sample size: if we repeat the experiment with a bigger sample size, the resultant histogram will be “slimmer”
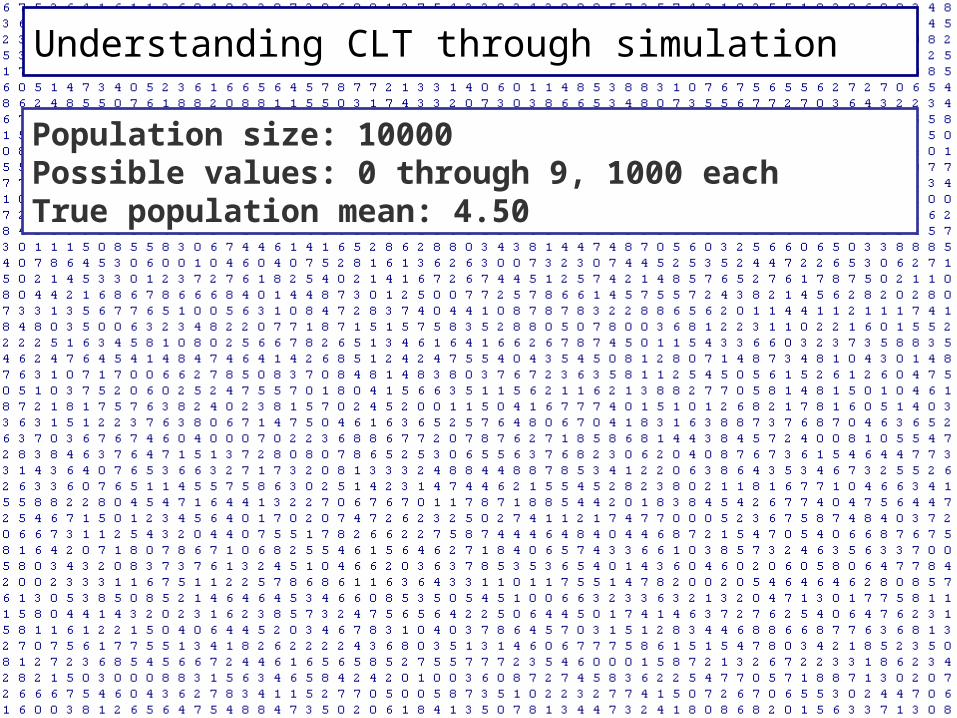
Understanding CLT through simulation
Population size: 10000Possible values: 0 through 9, 1000 eachTrue population mean: 4.50

Simulation scheme
A population of 10000Mean = 4.5
Samplen=500
Sample mean
Frequency
Sample mean
10000

Sample size = 500; # of draws = 10000
Sample means
Fre
qu
ency
4.5
68%
95%
99%SD = 0.13SE
±1 SE:67.95%
±2 SE:95.04%
±3 SE:99.10%
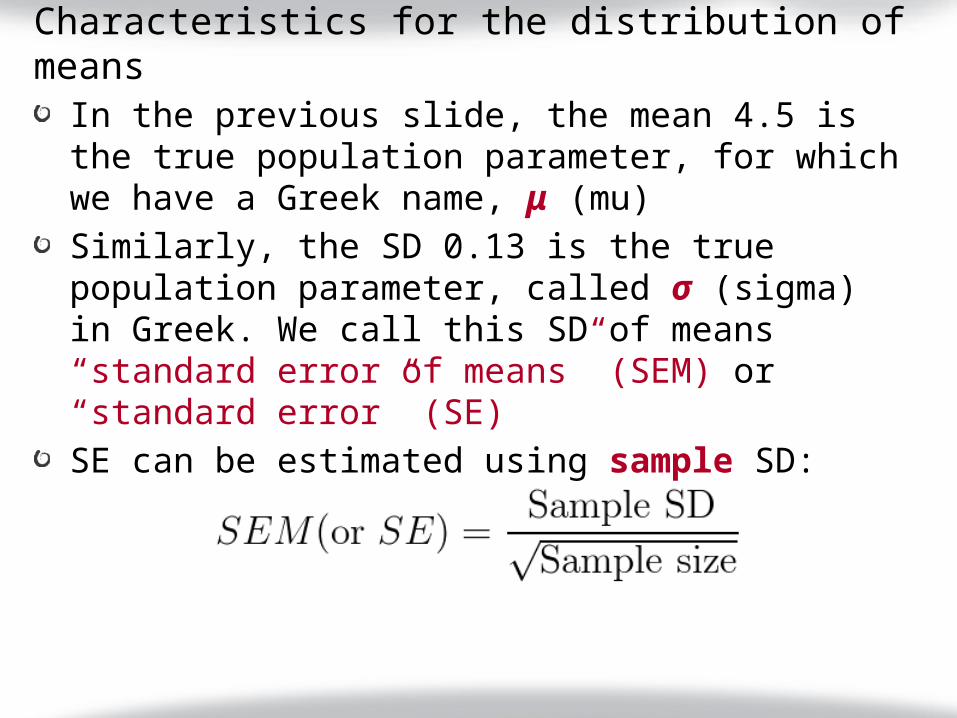
Characteristics for the distribution of means
In the previous slide, the mean 4.5 is the true population parameter, for which we have a Greek name, μ (mu)Similarly, the SD 0.13 is the true population parameter, called σ (sigma) in Greek. We call this SD of means “standard error of means” (SEM) or “standard error” (SE)SE can be estimated using sample SD:

Why bigger sample sizes are often better
Sample size = 500 Sample size = 1000Sample size = 200
Sample means Sample meansSample means
SE = 0.13 SE = 0.08SE = 0.20

Confidenceinterval

I got CLT, so now what?The histogram can be viewed as a “probability distribution”The sample mean from a researcher can be any pixel under the bell curveHow should we define “acceptably close” to the population mean? 95%

The confidence interval
95%
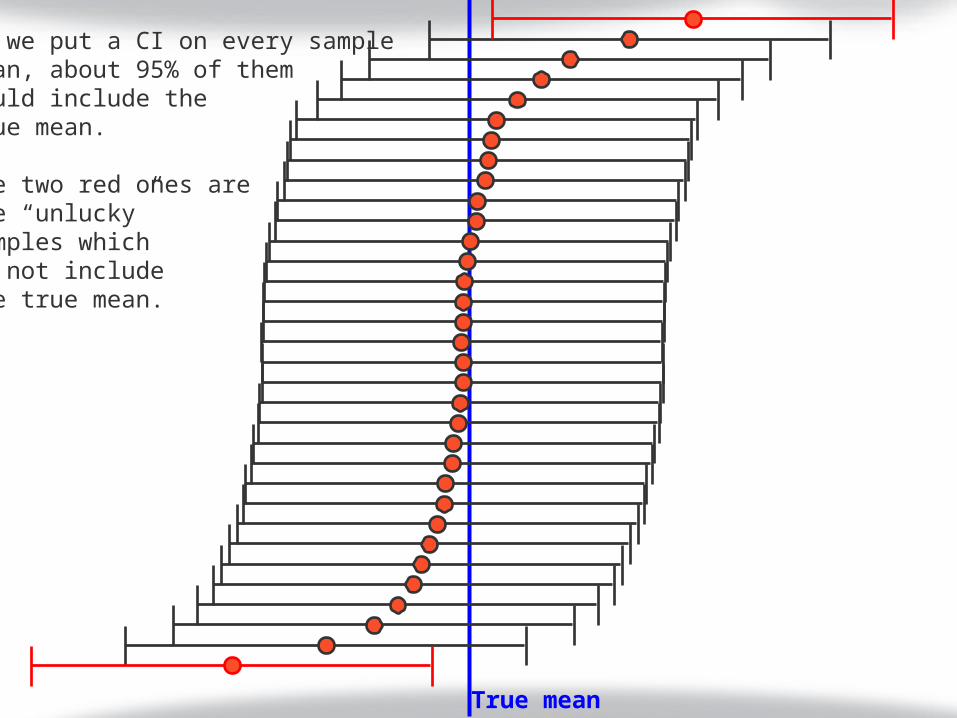
True mean
If we put a CI on every samplemean, about 95% of themwould include thetrue mean.
The two red ones arethe “unlucky”samples whichdo not includethe true mean.

Interpretation of a confidence interval
The mean and 95% confidence interval (CI) of the blood glucose of a sample is: 140 mg/dl (95%CI: 120, 160)We are 95% confident that the interval 120 and 160 mg/dl includes the true population mean. Our best estimate is 140 mg/dl (i.e. the sample mean)Why only 95% certain? Because the sample mean can be, unfortunately, an extreme one beyond ± 2 SE (the blue zones)
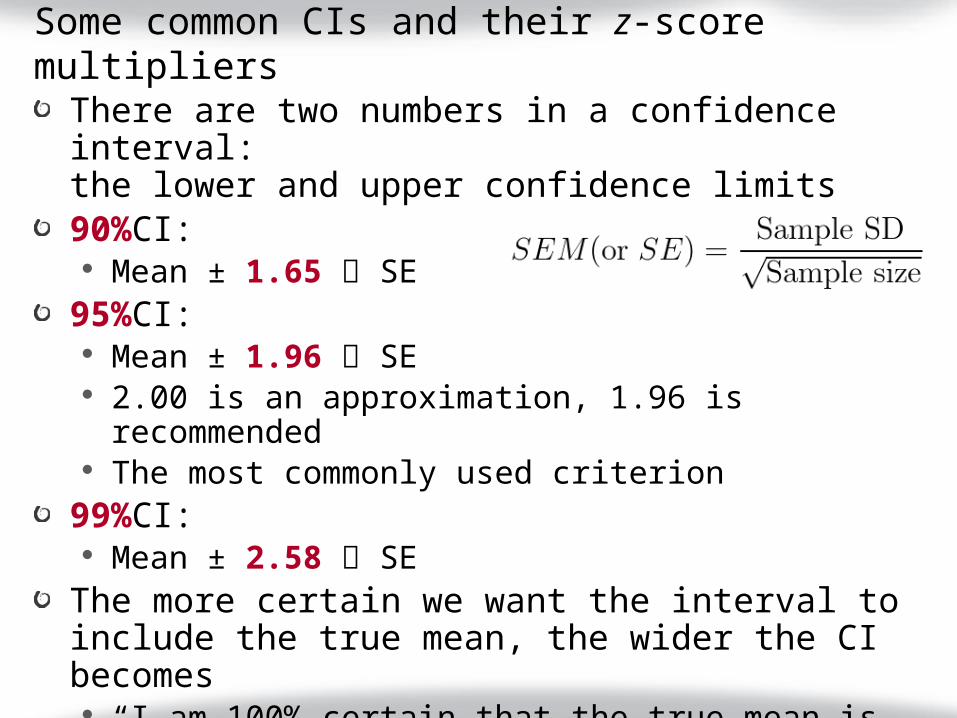
Some common CIs and their z-score multipliers
There are two numbers in a confidence interval:the lower and upper confidence limits90%CI:
Mean ± 1.65 SE95%CI:
Mean ± 1.96 SE 2.00 is an approximation, 1.96 is recommended The most commonly used criterion99%CI:
Mean ± 2.58 SEThe more certain we want the interval to include the true mean, the wider the CI becomes
“I am 100% certain that the true mean is between–∞ and ∞.”

How to narrow down confidence interval?
Lower our certainty by opting for, say, a 90%CI instead of a 95%CIDecrease sample standard deviation (for instance, using a more accurate measurement device)Increase sample size

Are confidence intervals always symmetric?
Not in all occasions. CIs for untransformed continuous variables are symmetricHowever, CIs for other statistics such as odds ratios and relative risks are calculated on logarithmic scale. When back-transformed to the ratios, the interval will be asymmetric
“Multivariable analysis revealed a more than 2-fold increase in the risk of total stroke among men with job strain (combination of high job demand and low job control) (hazard ratio, 2.73; 95% confidence interval, 1.17-6.38)”