Sample Size Determination Ziad Taib March 7, 2014.
35
Sample Size Determination Ziad Taib March 7, 2014
-
Upload
debra-rodgers -
Category
Documents
-
view
212 -
download
0
Transcript of Sample Size Determination Ziad Taib March 7, 2014.
Sample Size Determination
Ziad Taib March 7, 2014

(from ICH-E9)
• “The number of subjects in a clinical study should always be large enough to provide a reliable answer to the question(s) addressed.”
• “The sample size is usually determined by the primary objective of the trial.”
• “ Sample size calculation should be explicitly mentioned in the protocol .”
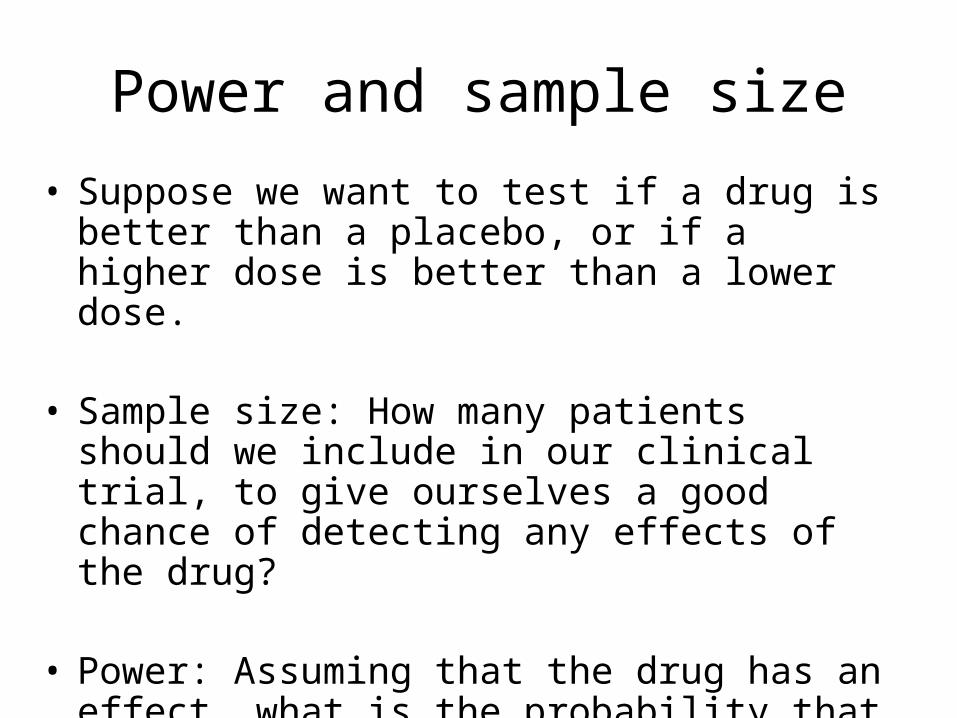
Power and sample size
• Suppose we want to test if a drug is better than a placebo, or if a higher dose is better than a lower dose.
• Sample size: How many patients should we include in our clinical trial, to give ourselves a good chance of detecting any effects of the drug?
• Power: Assuming that the drug has an effect, what is the probability that our clinical trial will give a significant result?

Sample Size and Power
• Sample size is contingent on design, analysis plan, and outcome
• With the wrong sample size, you will either– Not be able to make conclusions because the
study is “underpowered” – Waste time and money because your study is
larger than it needed to be to answer the question of interest
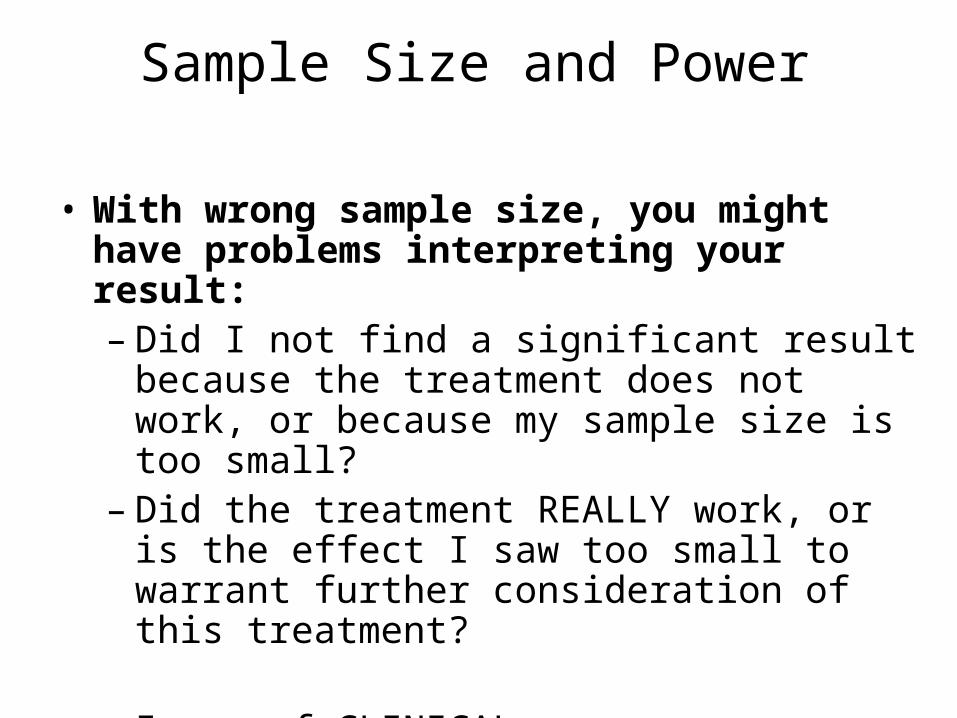
Sample Size and Power
• With wrong sample size, you might have problems interpreting your result:– Did I not find a significant result because the
treatment does not work, or because my sample size is too small?
– Did the treatment REALLY work, or is the effect I saw too small to warrant further consideration of this treatment?
– Issue of CLINICAL versus STATISTICAL significance

Sample Size and Power
• Sample size ALWAYS requires the investigator to make some assumptions– How much better do you expect the
experimental therapy group to perform than the standard therapy groups?
– How much variability do we expect in measurements?
– What would be a clinically relevant improvement?
• The statistician CANNOT tell what these numbers should be
• It is the responsibility of the clinical investigators to define these parameters
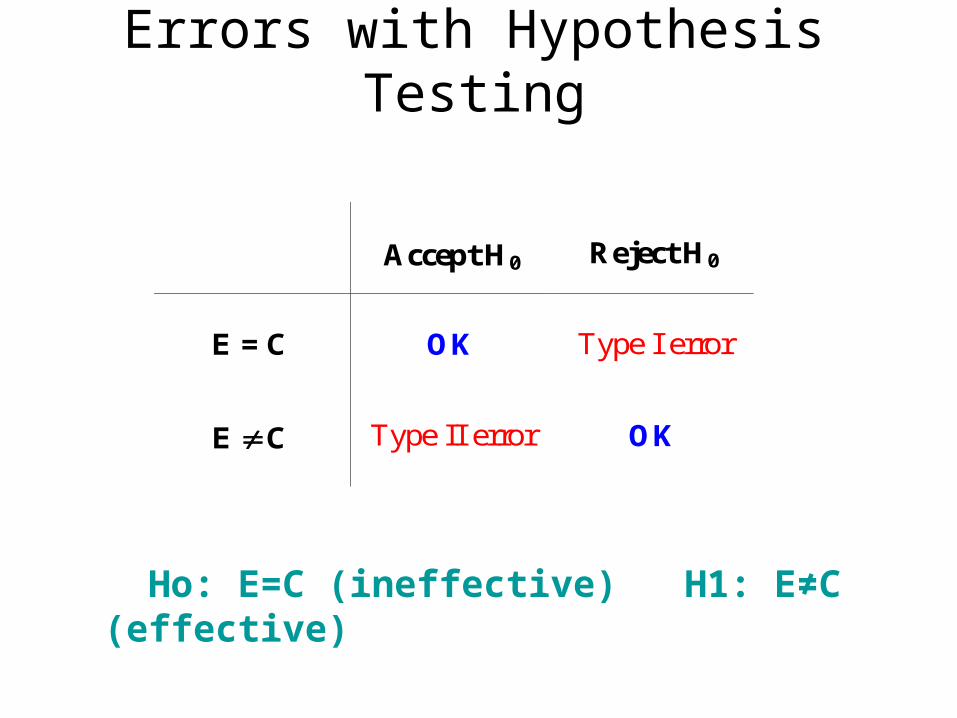
Errors with Hypothesis Testing
Accept H0
Reject H0
E = C
OK
Type I error
E C
Type II error
OK
Ho: E=C (ineffective) H1: E≠C (effective)
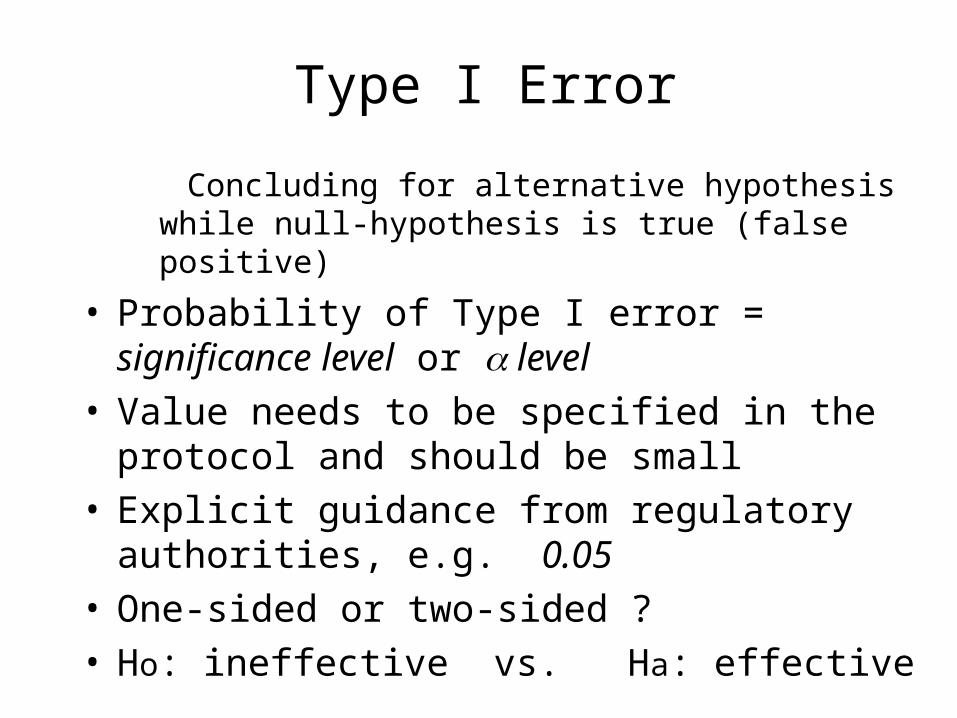
Type I Error
Concluding for alternative hypothesis while null-hypothesis is true (false positive)
• Probability of Type I error = significance level or level
• Value needs to be specified in the protocol and should be small
• Explicit guidance from regulatory authorities, e.g. 0.05
• One-sided or two-sided ?• Ho: ineffective vs. Ha: effective

Type II Error
• Concluding for null-hypothesis while alternative hypothesis is true (false negative)
• Probability of Type II error = level• Value to be chosen by the sponsor, and should be
small• No explicit guidance from regulatory authorities, e.g.
0.20, or 0.10• Power =1 - = 1 - Type II error rate = P(reject H0 when Ha is true) =P(concluding that the drug is effective when it is)• Typical values 0.80 or 0.90

Sample Size Calculation
• Following items should be specified– a primary variable– the statistical test method– the null hypothesis; the alternative hypothesis;
the study design– the Type I error– the Type II error– way how to deal with treatment withdrawals

Three common settings
1.Continuous outcome: e.g., number of units of blood transfused, CD4 cell counts, LDL-C.
2.Binary outcome: e.g., response vs. no response, disease vs. no disease
3.Time-to-event outcome: e.g., time to progression, time to death.

Continuous outcomes
• Easiest to discuss
• Sample size depends on – Δ: difference under the null hypothesis– α: type 1 error– β type 2 error– σ: standard deviation– r: ratio of number of patients in the two
groups (usually r = 1)

One-sample
• Assume that we wish to study a hypothesis related to a sample of independent and identically distributed normal random variables with mean and standard deviation . Assuming is known, a (1-)100% confidence interval for is given by
nZY
)
2(
• The maximum error in estimating iswhich is a function of n. If we want to pre specify E, then n
can be chosen according to
nZE
)
2(
2
22)2
(
E
Zn

• This takes care of the problem of determining the sample size required to attain a certain precision in estimating using a confidence interval at a certain confidence level. Since a confidence interval is equivalent to a test, the above procedure can also be used to test a null hypothesis. Suppose thus that we wish to test the hypothesis
– H0: μ1 = μ0
– Ha: μa > μ0
• with a significance level . For a specific alternative
H1: μa = μ0 + where >0, the power of the test is given by

Power(sample size)

• H0: μ1 – μ2 = 0
• H1: μ1 – μ2 ≠ 0
• With known variances 1 and 2, the power against a specific alternative μ1 = μ2 + is given by
Two samples
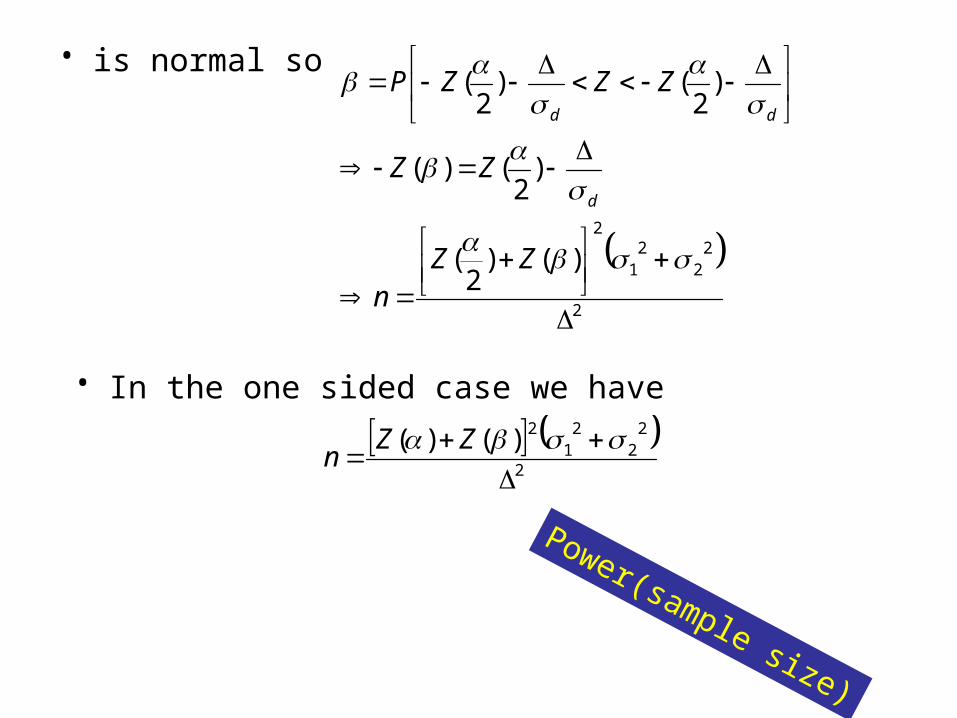
• is normal so
2
22
21
2
)()2
(
)2
()(
)2
()2
(
ZZn
ZZ
ZZZP
d
dd
• In the one sided case we have
2
22
21
2)()(
ZZ
n
Power(sample size)

Variants of two-sample formulaFor testing the difference in two means, with (equal) variance and equal allocation to each arm:
nZ Z
1
2 2
2( )
nr
r
Z Z1
2 2
2
1
( )
With Unequal allocation to each arm, where n2 = n1
2
2
If variance unknown, replace by t-distribution

0
We want to test• H0: P = P0
• Ha: P >P1
with a certain power (1-) and with a certain significance level (). The required sample of size is
One proportion
2
12
2
1100 )1()1(
pp
PPZPPZn
0

We want to test• H0: P1 = P2
• Ha: P1 ≠ P2
with a certain power (1-) and with a certain significance level (). The required sample of size is
Two proportion
2
)(
,)1()1()1()2/(
21
212
2
2211
PPP
pp
PPPPZPPZn
≠

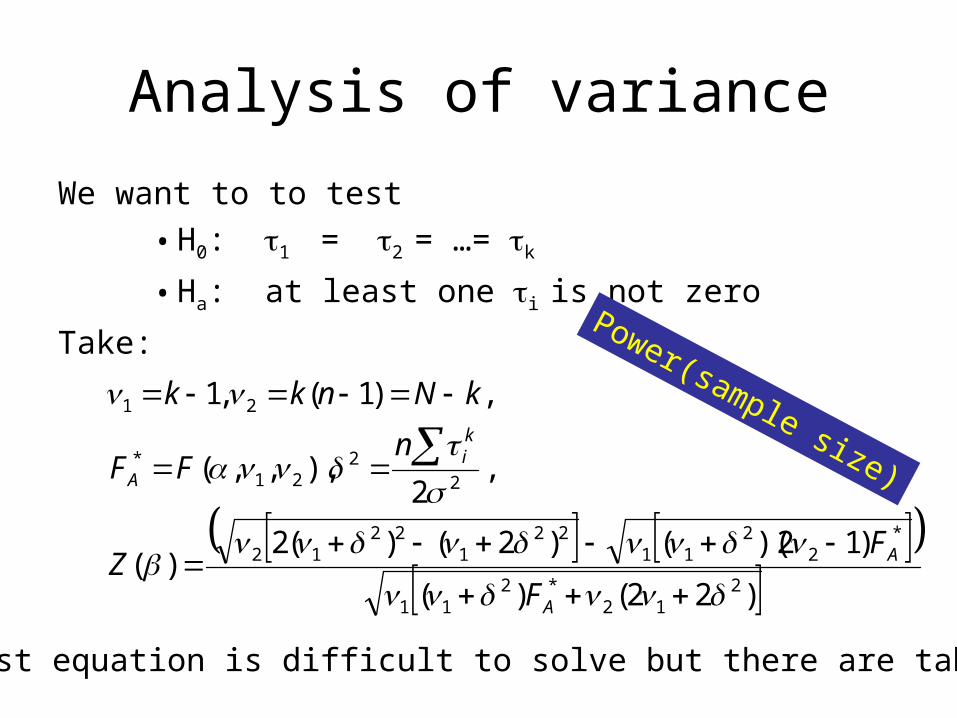
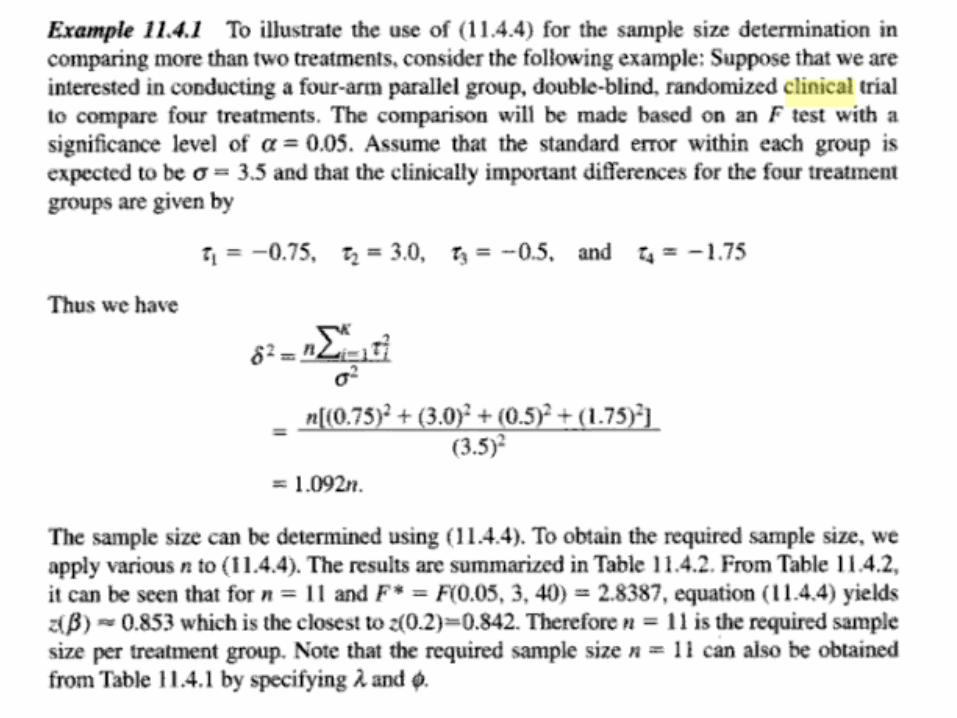
Analysis of variance
We want to to test
• H0: 1 = 2 = …= k
• Ha: at least one i is not zero
Take:
)22()(
)12)(()2()(2)(
,2
),,,(
,)1( ,1
212
*211
*2
211
221
2212
22
21*
21
A
A
ki
A
F
FZ
nFF
kNnkk
The last equation is difficult to solve but there are tables.
Power(sample size)

StudySize
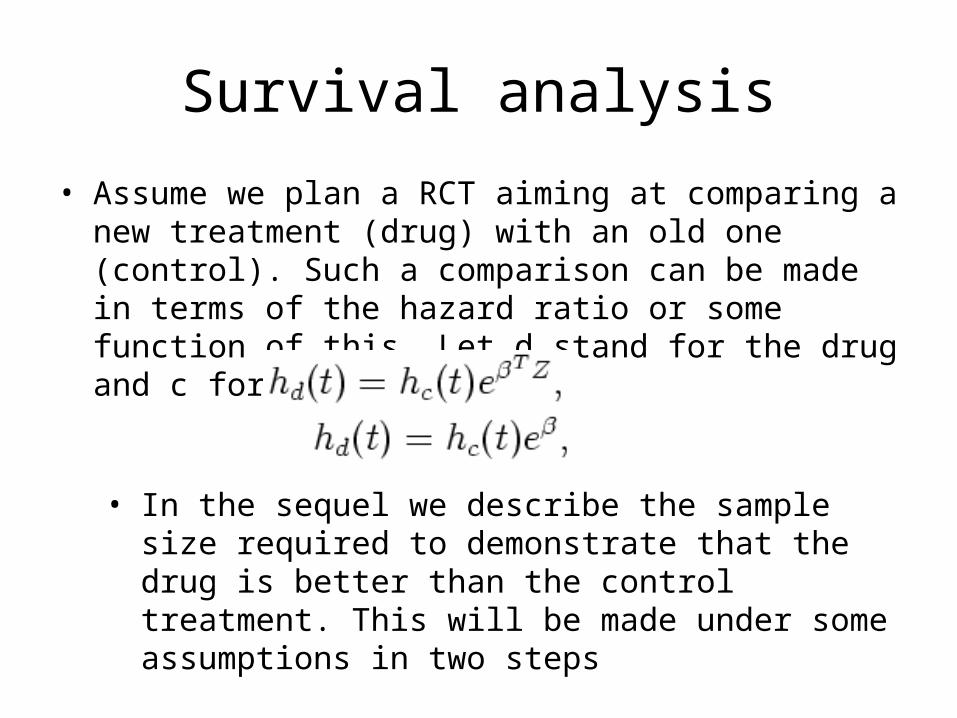
Survival analysis
• Assume we plan a RCT aiming at comparing a new treatment (drug) with an old one (control). Such a comparison can be made in terms of the hazard ratio or some function of this. Let d stand for the drug and c for control
• In the sequel we describe the sample size required to demonstrate that the drug is better than the control treatment. This will be made under some assumptions in two steps

• Step 1: specify the number of events needed• Step 2: specify the number of patients needed to
obtain the “the right” number of events.
Step 1
In what follows we will use the notation below to give a formula specifying the number of events needed to have a certain asymptotic power in many different cases like
The log-rank test – the score test – parametric tests based on the exponential distribution – etc.
ondistributi normal standard theof quantile upper The
test theof valuecritical The
events ofnumber required the
drug old thereceiveing individual of proportion The1
drug new thereceiveing individual of proportion The
Z
C
d
pq
p

• It is not clear how should estimated. The difficulty lies in the fact that this depends on the exact situation at hand. We illustrate that through some examples
2
2
pq
ZCd power

• EXAMPLE 1Assume that our observations follow exp()
under the old drug (control) and exp(exp) under the new drug. Then the ratio of medians of the two distributions will be
eeM
M
c
d 1
2ln
2ln
• To be able to discover a 50% increase in the median we take
3
2
2
31
eeM
M
c
d

1. It is possible to dress a table specifying as a function of the remaing parameters when =0.05 and p=q and the test is two sided.
2. Observe that and lead to the same number of events.
3. The largest power is obtained when p=q.4. When p and q are not equal divide the table
value by 4pq.5. For a one sided test, only C needs to be
changed from 1.96 to 1.64.
ee

8813425684421520.9
6510019163116070.8
517915049612640.7
3249943097870.5
2.001.751.501.251.15
power
e
The number of events needed for a certain powerUnder equal allocation.

Crossover Designs
• In this type of studies we are interested in testing a null hypothesis of the form – H0: T = P against – Ha: T P .
Period j=1Arm k=1
Period j=2
Period j=2
Period j=1
Arm k=2 Arm k=2
Arm k=1T11
T12T22
T21
Placebo
PlaceboDrug
Drug
≠
Crossoverdesign
A general model we can use for the response of the ith individual in the kth arm at the jth period is
where S and e are independent random effects with means zero and standard deviations and S. The above hypotheses can be tested using the statistic Td, which can also be used to determine the power of the test against a certain hypothesis of the type
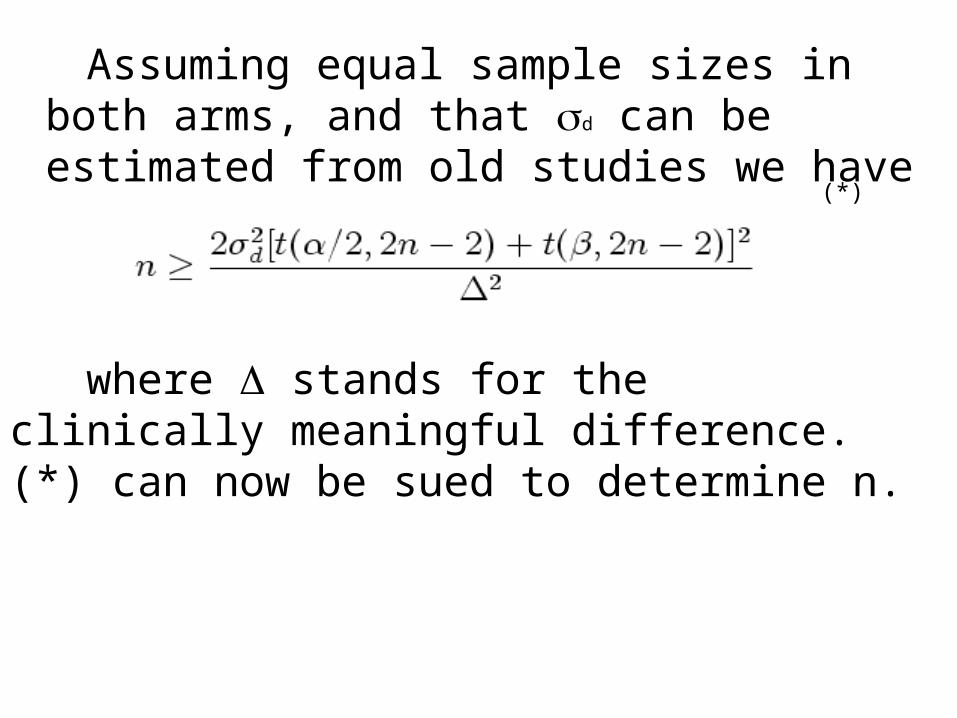
Assuming equal sample sizes in both arms, and that d can be estimated from old studies we have
where stands for the clinically meaningful difference. (*) can now be sued to determine n.
(*)

Software
• For common situations, software is available• Software available for purchase
– NQuery– StudySize– PASS– Power and Precision– Etc…..
• Online free software available on web search• http://biostat.mc.vanderbilt.edu/twiki/bin/view/Main/PowerSampleSize • http://calculators.stat.ucla.edu • http://hedwig.mgh.harvard.edu/sample_size/size.html