
SAMPLE: SITUATION AWARENESS MODEL FOR … SITUATION AWARENESS MODEL FOR PILOT IN-THE-LOOP EVALUATION...
29
SAMPLE: SITUATION AWARENESS MODEL FOR PILOT IN-THE-LOOP EVALUATION Greg L. Zacharias, Adam X. Miao, Christine Illgen, and Jake M. Yara Charles River Analytics 55 Wheeler Street Cambridge, MA 02138 George M. Siouris Development Planning Directorate Aeronautical Systems Center Wright-Patterson AFB, OH 45433-7209 Abstract This study assessed the feasibility of developing a Situation Awareness Model for Pilot-in-the-Loop Evaluation (SAMPLE) and a model-based metric for evaluating subsystems and tactics in enhancing pilot SA during the course of an air superiority mission. The study was directed at defining an overall architecture and implementing a software prototype to address key design questions. The SAMPLE prototype integrates: 1) an aircraft and subsystem simulation; 2) a multi-stage model of the pilot; 3) a model-based generator of objective metrics of SA and mission performance; and 4) a graphical user interface. The pilot model provides for explicit representation of the pilot’s behavior in information processing, situation assessment, and decision-making, using three key technologies: a) modern estimation filtering to represent the pilot’s processing of the available sensory cues; b) belief networks to model the pilot’s ongoing assessment of the tactical situation; and c) expert system production rules to represent situation- driven decision-making behavior. The key component in this structure is the belief network model of the SA process, since it can capture and computationally model all of the critical SA concepts and processes, including: situations, events, event cues, event propagation, event projection, situation assessment, and situation awareness. In conjunction with a model-based generator of objective metrics, the pilot model supports the computation of overall situational awareness based on the disparity between the actual situation and the model-generated one; it also supports performance-based metrics of scenario outcome. The SAMPLE prototype was developed in C++, to facilitate rapid integration with other object- oriented software packages. A graphical user interface was developed for the Windows95 operating system, using Visual Basic, Visio Technical, and Access. A demonstration of prototype operation was conducted to illustrate capabilities in rapid scenario specification, and visualization of the simulation results. The SAMPLE design provides the engagement analyst with an intuitive graphical facility for specifying not only the basic scenario attributes but also the key components of the pilot’s tactical strategy. SAMPLE supports multiple virtual pilots, and provides for individual instantiations of assessment strategy, and decision-making protocol. A replay mode visualizes explicit platform-related scenario events, as well as implicit events defining each pilot’s assessment process and decision-making behavior. Individual metrics of situation awareness and procedural correctness are also available. Several studies were conducted to evaluate SAMPLE’s potential in supporting trade-off studies in assessing subsystems and tactics. We demonstrated SAMPLE’s capability for generating awareness and performance metrics which could be used to quantitatively evaluate the impact of sensor and weapons performance on overall engagement performance. Similar additional evaluation exercises demonstrated SAMPLE’s potential for evaluating different air combat tactics. Although the scope of the evaluation exercises was limited, the effort demonstrated that the SAMPLE concept has the potential for development into a full scope tool for evaluating a range of subsystems and tactics, using a pilot-centered metric of overall situation awareness and engagement-level performance. 1. Introduction Air combat demands that pilots make dynamic decisions under high uncertainty and high time pressure. Under such conditions, numerous empirical studies (Stiffler, 1988) and pilots' own accounts (Shaw & Baines, 1988; Baker, 1986; Singleton, 1990) indicate that the most critical component of decision- making is situation awareness (SA), obtained via the rapid construction of tactical mental models that best capture or explain the accumulating evidence collected through continual observation of the tactical environment. Once a mental “picture” is developed, decisions are automatically driven by the selection of
Transcript of SAMPLE: SITUATION AWARENESS MODEL FOR … SITUATION AWARENESS MODEL FOR PILOT IN-THE-LOOP EVALUATION...

SAMPLE: SITUATION AWARENESS MODEL FOR PILOT IN-THE-LOOP EVALUATION
Greg L. Zacharias, Adam X. Miao, Christine Illgen, and Jake M. YaraCharles River Analytics
55 Wheeler StreetCambridge, MA 02138
George M. SiourisDevelopment Planning Directorate
Aeronautical Systems CenterWright-Patterson AFB, OH 45433-7209
AbstractThis study assessed the feasibility of developing a Situation Awareness Model for Pilot-in-the-Loop
Evaluation (SAMPLE) and a model-based metric for evaluating subsystems and tactics in enhancing pilotSA during the course of an air superiority mission. The study was directed at defining an overallarchitecture and implementing a software prototype to address key design questions. The SAMPLEprototype integrates: 1) an aircraft and subsystem simulation; 2) a multi-stage model of the pilot; 3) amodel-based generator of objective metrics of SA and mission performance; and 4) a graphical userinterface.
The pilot model provides for explicit representation of the pilot’s behavior in information processing,situation assessment, and decision-making, using three key technologies: a) modern estimation filtering torepresent the pilot’s processing of the available sensory cues; b) belief networks to model the pilot’songoing assessment of the tactical situation; and c) expert system production rules to represent situation-driven decision-making behavior. The key component in this structure is the belief network model of theSA process, since it can capture and computationally model all of the critical SA concepts and processes,including: situations, events, event cues, event propagation, event projection, situation assessment, andsituation awareness. In conjunction with a model-based generator of objective metrics, the pilot modelsupports the computation of overall situational awareness based on the disparity between the actualsituation and the model-generated one; it also supports performance-based metrics of scenario outcome.
The SAMPLE prototype was developed in C++, to facilitate rapid integration with other object-oriented software packages. A graphical user interface was developed for the Windows95 operating system,using Visual Basic, Visio Technical, and Access.
A demonstration of prototype operation was conducted to illustrate capabilities in rapid scenariospecification, and visualization of the simulation results. The SAMPLE design provides the engagementanalyst with an intuitive graphical facility for specifying not only the basic scenario attributes but also thekey components of the pilot’s tactical strategy. SAMPLE supports multiple virtual pilots, and provides forindividual instantiations of assessment strategy, and decision-making protocol. A replay mode visualizesexplicit platform-related scenario events, as well as implicit events defining each pilot’s assessment processand decision-making behavior. Individual metrics of situation awareness and procedural correctness arealso available.
Several studies were conducted to evaluate SAMPLE’s potential in supporting trade-off studies inassessing subsystems and tactics. We demonstrated SAMPLE’s capability for generating awareness andperformance metrics which could be used to quantitatively evaluate the impact of sensor and weaponsperformance on overall engagement performance. Similar additional evaluation exercises demonstratedSAMPLE’s potential for evaluating different air combat tactics. Although the scope of the evaluationexercises was limited, the effort demonstrated that the SAMPLE concept has the potential for developmentinto a full scope tool for evaluating a range of subsystems and tactics, using a pilot-centered metric ofoverall situation awareness and engagement-level performance.
1. IntroductionAir combat demands that pilots make dynamic decisions under high uncertainty and high time
pressure. Under such conditions, numerous empirical studies (Stiffler, 1988) and pilots' own accounts(Shaw & Baines, 1988; Baker, 1986; Singleton, 1990) indicate that the most critical component of decision-making is situation awareness (SA), obtained via the rapid construction of tactical mental models that bestcapture or explain the accumulating evidence collected through continual observation of the tacticalenvironment. Once a mental “picture” is developed, decisions are automatically driven by the selection of

pre-defined procedures associated with the recognized tactical situation. This is SA-centered decision-making (sometimes called Recognition-Primed Decision-making (RPD)) and it has been widely accepted asthe most appropriate representation of actual human decision-making in high tempo, high value situations(Klein, 1989a; Klein, 1989b; Stiffler, 1988; Fracker, 1990; Endsley, 1989, 1990; 1993, 1995a).
Many new technologies and subsystems are thus being considered to enhance pilot SA. These includeadvanced sensor systems, state-of-the-art data fusion systems, on-board datalinks to theater C3I systems,helmet mounted virtual reality (VR) displays, and novel multi-modality interface technologies. Theproblem is not one of a lack of subsystem development efforts; rather it is that there are few reliable toolsfor evaluating the utility of any given subsystem, in terms of its potential for enhancing pilot SA duringcritical portions of the engagement. We believe that this can be most effectively accomplished by startingwith a thorough understanding of how the adept pilot accomplishes on-line situation assessment,developing a computational model of that behavior and a model-based metric for the measurement of thatbehavior, and then implementing a version of that model and metric for the evaluation of the utility of anyproposed subsystem.
A variety of situation awareness/assessment models have been hypothesized and developed bypsychologists and human factors researchers, primarily through empirical studies in the field, butincreasingly so with computational modeling tools. Because of SA's critical role in air combat, the U.S. AirForce has taken the lead in studying the measurement and trainability of SA (Caretta, Perry & Ree, 1994).Numerous studies have been conducted to develop SA models and metrics for air combat (Stiffler, 1988;Spick, 1988; Harwood, Barnett & Wickens, 1988; Endsley, 1989; Endsley, 1990, 1993, 1995; Fracker,1990; Hartman & Secrist, 1991; Smith & Sage, 1991; Klein, 1994; Zacharias, Miao & Riley, 1992b;Zacharias, Miao, Illgen & Yara, 1995).
SA modeling can be roughly categorized into two efforts: descriptive model development andprescriptive (or computational) model development. Table 1-1 summarizes the major features of the twomodel classes and presents their relative advantages and disadvantages.
Table 1-1: Features, Advantages, and Disadvantages of Descriptive and Prescriptive SA ModelsCLASS FEATURES ADVANTAGES DISADVANTAGES• Descriptive • Data Driven
• Qualitative• Reflect actual SA process• Capable of handling qualitativeconstraints
• Lack of predictivecapability
• Provide vague and non-extensible conclusions
• Do not supportcomputationalimplementation
• Prescriptive • Assumption ortheory driven
• Quantitative
• Prescribe SA process• Support computational implementation• Support objective SA metric
development
• High development cost• Limitations inapplicability
Descriptive models dominate the SA modeling effort, and most developed SA models belong to thedescriptive group. Shown to accurately reflect actual pilot decision-making, the descriptive SA modelscontribute to the recognition of SA's importance for air combat and of a need to improve subsystems for SAenhancement (Stiffler, 1988; Spick, 1988; Harwood et al., 1988; Endsley, 1989, 1990, 1993, 1995; Fracker,1990; Hartman & Secrist, 1991). Although the descriptive models are capable of identifying the dependentrelationships between subsystem modifications and SA enhancements, they do not support a quantitativeevaluation of such relationships when no empirical data is available. There currently exists no descriptivemodel that has been developed into a computational model, for actual emulation of pilot decision-makingbehavior in real-time simulation studies.
In contrast to the situation with descriptive models, few prescriptive models of SA have beenproposed or developed. Early attempts use production rules (Baron, Zacharias, Muralidharan & Lancraft,1980; Milgram, van der Wijngaart, Veerbeek, Bleeker & Fokker, 1984; Zacharias, 1989c). In these efforts,the SA model was developed as a forward chaining production rule (PR) system where a situation isassessed using the rule "if a set of events E occurs, then the situation is S". There are several seriousshortcomings associated with this approach. First, the format of the PR approach, events -> situation, isopposite to that of SA as we know it. In an SA problem we expect beforehand that if the situation is S, thenE (a set of event cues associated with S) should occur. After we detect these events, we then attempt toreassess S, based on our understanding of the situation-event relations. In other words, the SA process is a

diagnostic process (from effects to possible reasons), instead of a deductive reasoning process. Unless thecorrespondence between situation and event is strictly one-to-one, we simply cannot deduce a situationfrom events by using the PR approach of events -> situation. An additional troubling aspect of the PRapproach is its essential lack of long-term memory or an internal mental model . The best that can be donewith this approach is to model the assessment of a situation using current event cues, whereas in the realworld, effective SA makes use of event histories and situational models.
Recognizing that SA is fundamentally a diagnostic reasoning process, Zacharias, Miao & Riley(1992a), and Zacharias, Miao, Kalkan & Kao (1994) used belief networks (BNs) for developingprescriptive SA models for two widely different domains: counterair operations and nuclear power plant(NPP) diagnostic monitoring. Both efforts modeled SA as an integrated inferential diagnostic process, inwhich situations are considered as hypothesized reasons, events as effects, and sensory (and sensor) data assymptoms (detected effects). SA starts with the detection of event occurrences. After the events aredetected, their likelihood (belief) impacts on the situations are evaluated by backward tracing the situation-event relation (diagnostic reasoning) using Bayesian logic. The updated situation likelihood assessmentsthen drive the projection of future event occurrences by forward inferencing along the situation-eventrelation (inferential reasoning) to guide the next step of event detection.
This approach to using belief networks (BNs) to model the pilot’s situation assessment/awarenessbehavior centers on human reasoning under uncertainty, namely, the process by which humans integrateevidence from multiple sources and generate a coherent interpretation of the evidence via an internalsource-evidence model. Simply speaking, BNs (also called Bayesian networks, inference nets, causal nets)are a unified probabilistic reasoning framework that provides a consistent and coherent solution toproblems of reasoning under uncertainty. A BN consists of a set of nodes, which represent deterministic orrandom variables (propositions), connected by directed links, which represent dependent or associativerelationship between nodes. After receiving evidential information on affected nodes, BNs propagate andfuse the information in such a way that, when equilibrium is reached, each variable is assigned a beliefmeasure consistent with the axioms of probability theory. A BN model is thus a very natural choice formodeling the pilot’s SA process in time-stressed high-value decision-making environments.
The additional development of model-based SA and performance metrics provides us with a means forevaluating the pilot’s situation awareness as it changes over the course of time, or as it is enhanced ordegraded with the introduction of new aircraft subsystems. The use of the model and model-based metricallows us to account for the pilot’s fundamental information-processing capabilities and limitations whileintegrating these pilot-related factors with critical system-related factors. In particular, the model and metricprovide us with a means of evaluating different subsystem options in terms of their corresponding model-based situation awareness metric values, so that candidate concepts can be screened, rank-ordered, andselected for further evaluation.
This paper describes the development of a Situation Awareness Model for Pilot-in-the-LoopEvaluation (SAMPLE) that consists of: 1) an SA-centered pilot model; 2) an SA/performance metricgenerator; and 3) an interactive Graphical User Interface (GUI). In the following sections, we focus on thepilot SA model and its implementation using Belief Network (BN) technology, the specification of model-based SA/performance metrics for subsystem evaluation, the description of the interactive GUI, and thedemonstration of SAMPLE for evaluation of aircraft subsystems and combat tactics.
2. Situation Awareness Model for Pilot-in-the-Loop Evaluation (SAMPLE)The overall architecture of SAMPLE is illustrated in figure 2-1, and consists of four distinct but tightly
coupled modules: 1) an interactive Graphical User Interface (GUI); 2) the SAMPLE Pilot Model; 3) theAircraft and Subsystem Model; and 4) the SAMPLE SA/Performance Metric Generator. The informationand control flow among subsystems are shown via the arrows.
The SAMPLE Pilot Model is implemented as a C++ class (abstract data type), from which arbitrarynumbers of object instantiations can be achieved to represent multiple pilots (Pilot 1 through Pilot N) in asimulation. Similarly, the Aircraft and Subsystem Model is another class from which multiple types ofaircraft with specific subsystem configurations can be created. Each instantiated pilot object is thenmatched to its corresponding aircraft object for message exchange. During a simulation, an aircraft objectpasses a set of information, whose characteristics are determined by its specific subsystem configuration, toits matched pilot object. Based on the received information, the pilot object makes decisions for navigation,flight control, subsystem monitoring/configuration, and communications, and sends these “controls” backto the aircraft object. Pilot actions associated with information processing (IP), situation assessment (SA),and decision-making (DM) actions are also sent to the SA/Performance Metric Generator for on-linegeneration of model-based SA metrics and performance metrics. Interfaced with all three functional

modules (pilot, aircraft, and metric), is an interactive Graphical User Interface (GUI), which serves as auser interface to support setting up the simulation, and providing on-line visualization of simulation resultsand metrics. We now give a brief functional overview of the four key modules of figure 2-1.
Aircraft & Subsystem Model
instantiation
IP, SA, DM measures
• • •
SAMPLE Pilot Model
Information Processor
SituationAssessor
Decision Maker
MentalModel
information
controls
Pilot 1
information
controls
SAMPLE Graphical User Interface (GUI)
F-16
• • •
SAMPLE SA/Performance Metric Generator
Pilot N
Mig-23• • •
Figure 2-1: Overall Architecture for SAMPLE
The SAMPLE Pilot Model emulates the pilot’s information processing (IP), situation assessment (SA),and decision-making (DM) activities, based on information received from the aircraft subsystems andsupported by an internal mental model of the simulated scenario. Since this model is at the core of ourdevelopment effort, we describe it in further detail in section 2.1 below.
The Aircraft and Subsystem Model simulates specific types of aircraft and subsystems to be modeledwithin the SAMPLE architecture. Model attributes include aircraft dynamics state changes (position andvelocity), display changes (visual, auditory, and tactile), missile firing, etc. Since our design task is at thesubsystem level of the vehicle, we have implemented the aircraft and subsystem modules as anencapsulation of independent subsystem class objects, such as aircraft platform, inertial navigation, radar,weaponry, display, etc. Each is parameterized by its own coefficient library. Depending on the simulationtask requirement, one or more of these subsystems can be used to construct the desired aircraft/subsystemobject. Consequently, it is straightforward to evaluate different aircraft (subsystem) designs since we canmanipulate both the system structure and parameters of each functional subsystem module in the evaluationprocess. Full details of the Aircraft and Subsystem Model implementation are given in Zacharias et al.(1995).
The SA/Performance Metric Generator provides multiple sets of model-based quantitative metricsfor quantifying the pilot’s IP, SA, and DM behavior. These quantitative metrics are used as the basis for aquantitative pilot-centered assessment of the merits of the evaluated subsystem and tactics, based on howthe subsystems and tactics serve to enhance to pilot’s situation awareness, his decision-makingeffectiveness, and the overall performance-based outcome of the scenario. We describe these model-basedSA and performance metrics in greater detail in section 2.2 below.
Finally, the interactive SAMPLE GUI implements two major functions. First, it allows a user to set upengagement scenarios and aircraft/subsystem attributes through a user friendly specification navigator.Second, it allows the user to choose what variables are to be displayed during an engagement simulationand to visualize, on-line, the simulation time events, trajectories, selected SA and performance metrics, andthe pilot’s internal SA and DM processes. We describe the GUI further in section 2.3.

2.1 SAMPLE Pilot ModelFigure 2.1-1 illustrates the SA-centered decision-making process. Five basic steps are involved:
1. Monitor the environment: Given the situation status established by an internal mental model of thescenario, a decision-maker monitors the environment looking for event cues that confirm ordisconfirm the current assessed situation.
2. Determine the need for situation assessment: If the event cues are consistent with the assessedsituation, continue monitoring (loop back to step 1); if they are not, proceed to the next step.
3. Propagate event cues: Based on the mental model, propagate the newly received event cues to start anew round of situation assessment. The result of this event cue propagation generates a new beliefdistribution among situations, and can lead to a new assessment of the situation.
4. Project events: Based on the updated situation beliefs, project situation-related event occurrences.These projected or predicted events are then fed back to guide the decision-maker's event monitoringstrategy to be used in step 1.
5. Assess Situation: Determine whether the updated situation beliefs support the confident assessment ofa new situation (or situations). If the answer is yes, proceed to step 6; otherwise, continue monitoringfor new events.
6. Make decision: If a new situation is assessed, a new decision procedure associated with the situation,is called upon, and acted upon to generate new situationally-relevant actions.
Notice the significant difference between this SA-centered model and the conventional decision-centered model which views the decision maker as "faced with alternatives, and considering theconsequences of each alternative in terms of analysis of future states (odds/probabilities) weighed againstalternative goals (preferences/utilities)" (Klein, 1989a). In the SA-centered model, no utility or alternativeis considered; instead, SA becomes the focus of all pilot actions. It not only defines a decision-maker's viewof his environment, but also serves to define his information needs and to drive his effective experiential(if-then) decision-making.
SA Mental Model
Scenario
Monitor Environment
? StartAssessment
information
no
evidence
Propagate Evidence
yes
? SituationAssessment
if situation = Sithen procedure = Pi
assessed situation
modification
situationbelief
InformationProcessing
SituationAssessment
projected events
Project Events
UpdatedSituation Beliefs
DecisionMaking
event cues
Situation Awareness
actions
ProcedureKnowledge Base
Figure 2.1-1: Conceptual Illustration of SA-Centered Decision-Making Behavior
Figure 2.1-2 illustrates the architecture of the SAMPLE Pilot Model, based on the SA-centeredapproach. The architecture includes three primary modules: 1) an Information Processor which processesinformation generated by the aircraft simulation, to yield system states and event cues; 2) a SituationAssessor which uses event cues to generate the current assessed situations; and 3) a Decision-Maker which,

based on the assessed situation and estimated system states, selects among alternative procedures toproduce control actions. The model is supported by a scenario dependent mental model which maintains thestructure and parameters defining the event/situation relationships, as well as the procedural rules definingthe pilot’s decision-making strategy (Rouse & Morris, 1985). Since SA is the center of this model, we firstdescribe the Situation Assessor (section 2.1.1), followed by the Information Processor (section 2.1.2), andfinally the Decision-Maker (section 2.1.3).
Information Processor
Situation Assessor
Decision Maker
event cues {ei }
assessed situation S*
controls {ui}
estimated states
informationrequests
communications
{x }i
information set
Mental Model
• SA mental model• Procedure KB
Figure 2.1-2: Architecture of SAMPLE Pilot Model
2.1.1 Belief Network Model of Situation AssessorA computational model of SA requires a technology which has: 1) a capability to quantitatively
represent the key SA concepts such as situations, events, and the pilot’s mental model; 2) a mechanism toreflect both diagnostic and inferential reasoning; and 3) an ability to deal with various levels and types ofuncertainties, since imprecise information prevails at each step of the SA process.
Belief network (BN) technology is an ideal tool for meeting these requirements and modeling(quantifying) SA behavior. Belief networks (also called Bayesian networks, inference nets, or causal nets)are directed acyclic graphs of nodes and directed links, where each node represents a probabilistic variablewhose probability distribution is denoted as a belief value, and each directed link represents an associativeor inferential dependency between nodes, quantified by a conditional probability matrix associated with thelink.
The origins of BNs can be traced back to the inference networks of PROSPECTOR (Duda et al., 1978).They were developed in their present form by Pearl (1986b), Heckerman (1995), and many otherresearchers, and were recently embraced by Microsoft as a corner-stone technology in developing itsintelligent operating systems, user interfaces, computer languages, and speech recognition paradigms(Lewinson, 1995).
The unique strength of BN technology comes from its combination of two powerful artificialintelligence (AI) tools: neural networks and Bayesian reasoning. Like conventional neural networks (e.g.feedforward), BNs represent domain knowledge using nodes and links that can carry and modifyinformation propagated among nodes. The knowledge stored in the network (nodes, links) can be specified,a priori, or learned from examples. The network outputs can be a nonlinear and intricate mapping from theinputs. However, unlike conventional neural networks whose knowledge representation and informationpropagation usually have no semantics and is totally incomprehensible, BNs represent knowledge in nodesand links using Bayesian reasoning that has semantics (beliefs and conditional if-then rules) naturallycommunicable to network developers. Furthermore, BNs use Bayesian reasoning logic as the basis for theinformation propagation and inferencing, reflecting a rational reasoning process.
A computational model of the situation assessor using BN technology is shown in figure 2.1-3. Itsdevelopment consists of two steps: 1) developing a specially structured BN to represent the SA mental

model; and 2) developing a belief update (propagation and projection) algorithm to reflect SA eventpropagation and projection.
The SA mental model representation uses a hierarchical BN of two types (or layers) of discrete nodes:situation (round) and event (square) nodes. As shown in figure 2.1-3, at the top of the BN are the singletonsituation nodes, each representing a particular situation. Below the situation nodes are event nodes, eachtaking on values from a set of mutually exclusive and collectively exhaustive states. An event staterepresents a specific event occurrence (e.g., a target range event might be represented via three states: long,medium, and short). The events can be observable or unobservable, and are represented by shadowed andnon-shadowed square nodes, respectively. An observable event is one in which evidence is available byobservation for inferencing the likelihood of event occurrence (e.g., the target range event is an observableevent whose event likelihood vector can be determined using radar measurements), while an unobservableevent node is one in which no directly observable evidence is available for inferencing its event likelihoodvector (e.g., the event targeted_by_a_missile is an unobservable event).
modification
status
S1
Situations
Events
E1
BN Representation of SA Mental Model
•••
•••
S2 SL
E2
E3
EM
S1
E1
Belief Propagation & Projection
•••
•••
S2 SL
E2
E3
EM
C2
Situation Awareness Situation Assessment
propagateproject
S S
Figure 2.1-3: Situation Assessor Model using Belief Networks
Situation and event nodes are related with each other through three kinds of links: situation-situation,situation-event, and event-event.
The situation-situation link is represented using the associative link (or lack of it). When a situationS1L's subset of situations S1, S2 ..., and SL are mutually exclusive, the relationship is represented by a one-level tree connecting all the situations; lack of the tree association indicates a set of inclusive situations. Inthe first case, we have
Bel(S1L)= Bel(S i)Σ
i =1
N
(2.1-1)That is, the belief in a situation is a summation of beliefs in its sub-situations. This implies that a sub-situation can never have a belief value which is larger than that of its parent situation. Consequently, if asituation were assessed to have a negligible belief value for its occurrence, there would be no need toconsider all of its sub-situations. In reality, it means that even though a decisionmaker may have a mentalmodel of many situation nodes, at any time, only a few possible situation nodes are actually involved in theSA process.
The situation-event links illustrated in figure 2.1-4 define a situation S via a specification of thecausal relationship between the situation S and its related events E1, E2 ..., EM. Specifically, the situation-event relation between situation S and event Ei, using a Ni by 2 probability matrix Pi associated with thelink, specifies that
• If situation is S, then event Ei is expected to occur with a probability
Prob(Ei | S) = (P11, , Pn1, , PNi1)T
• If situation is not S, then event Ei is expected to occur with a probability
Prob(Ei | ¬S) =(P11, , Pn1, , PNi1)T

We represent a priori SA knowledge in the mental model using the causal (from situations to events)instead of the diagnostic (from events to situations) relations. Since causal relations are often more reliablyassessed and more easily extracted from humans than diagnostic relations, as argued by Pearl (1986b) andHenrion, Breese & Horvitz (1991), it is desirable to encode a decision-maker's mental model in causalrelations.
E1 EM• • •
S
Ei• • •
Qi
Q1 QM
Figure 2.1-4: Situation-Event Relations
Finally, the event-event link specifies the inferential relationship among events. A directed linkpointing from an event node of I exclusive states to another event node of J states represents an inferentialdependency between two event nodes and is associated with an I by J conditional probability matrix PIJ,where element Pij of PIJ represents the if-then rule:
If the event state is Ei, then event Ej is expected to occur with a probability PijOnce an SA mental model and an initial situation belief distribution is specified, it is then necessary to
provide a means of dynamically updating the assessment, as events unfold. To accomplish this, wedeveloped a two-phase event propagation and event projection algorithm for representing situationassessment and situation awareness, respectively, based on two algorithms developed by Pearl: thealgorithm for singly connected networks (Pearl, 1986b) and the algorithm for singleton tree networks(Pearl, 1986a).
The event propagation phase represents situation assessment, and starts with an arrival of a new eventcue indicating the relative degree that its corresponding event E is believed to take on each of its states,based on the evidence. Using the local belief computation algorithm developed by Pearl (1986), eventbelief propagation is conducted along the reversed direction of situation-event and situation-situation linksuntil equilibrium (in time linearly proportional to the diameter of the network) is achieved, when eachsituation node is assigned a belief measure consistent with the axioms of probability theory. Notice that anupdated situation belief depends on not only the new event cue, but also depends on the previous situationbeliefs based on old event cues. In other words, the situation belief is a temporal measure that indicates thebelief in the situation based on information so far received.
The event projection phase represents situation awareness and starts after a round of situationassessment is complete. Model-based situation awareness is quantified by: 1) the belief distribution ofsituation nodes; and 2) the projection of future event occurrence along the situation-event links and event-event links by multiplying the situation (event) belief with the conditional probability matrix.
Finally, the activity of situation assessment is modeled via a simple threshold mechanism. If the beliefin the situation surpasses a preset threshold, the situation is considered as having occurred. Otherwise, it isconsidered as not having occurred.
In this effort, we have used BNs to develop a computational model of the SA process. Our approachhas the following four important advantages over other modeling approaches including rule-based,conventional neural network, and empirical approaches:
• First, it provides the capability and flexibility to represent a pilot's mental model in its full richness(or simplicity as the case might be) via a graphic representation structure as powerful as neuralnetworks but at same time directly comprehensible to the model developer. This first featurefacilitates the development of domain-specific SA mental models, via conventional knowledgeengineering paradigms.
• Second, each of the important SA concepts and processes such as situations, events, event cues,event propagation, event projection, situation assessment, and situation awareness is quantified. Thisenables a quantitative rather than just a qualitative description, to support comprehension andmeasurement of the SA process.

• Third, the event propagation algorithm reflects the continuity of situation assessment—an evidenceaccumulation process where the impact of new event cues is combined with the old ones to assessthe situation based on all the evidence so far received. Similarly, the event projection algorithmreflects the continuity of situation awareness—the projection of future events based on the currentlyassessed situation. This temporal continuity feature is not present in other memoryless approaches,such as rule-based and conventional neural network based approaches.
• Fourth, Bayesian logic is mathematically sound and provides a consistent and coherent automaticreasoning process. It is a normative reasoning process that prescribes what the ideal reasoning agentor operator associate should do, given the information-event-situation relationships and theinformation itself. This feature can thus be used for the design and development of on-line SA aidsfor the enhancement of pilot SA.
2.1.2 Modern Estimation Model of Information ProcessorWe model the Information Processor (recall figure 2.1-2) using two interconnected submodels: a
continuous state estimator and a discrete event cue detector, emulating a pilot's continuous state estimationand event detection (monitoring) functions, as shown in figure 2.1-5. Notice that the latter function alsodepends upon the events projected by the downstream Situation Assessor.
StateEstimator
Event Cue Detector
estimated states
state information
event cues
event information
SA Mental Model
projectedevents
Figure 2.1-5: Information Processor Model using Modern Estimation Techniques
We designed the state estimator using a Kalman filter. This approach was first established in theOptimal Control Model (OCM) of human controllers by Kleinman & Baron (1971). It has been validatedagainst experimental data in a series of human-machine tasks (e.g. flight path control), and has been widelyaccepted as a good representation of how humans deal with dyanmic continuous state information.
The event cue detector takes in the subsystem-related event information set and the continuous stateinformation from the state estimator, and converts them into discrete event cues. While there is littledifficulty in converting the subsystem-related event information set to discrete event cues, the conversion ofcontinuous state information to discrete event cues is not as straightforward. In this effort, we adopted asimple rule-based approach. For example, we defined a target range of less than 20 miles as short range,and one of longer than 20 miles as long range, thus defining simple event Booleans operating on bothdiscrete and continuous variables. An improved implementation of the event cue detector using FuzzyLogic (FL) technology is described in Zacharias, et al. (1995).
2.1.3 Expert System Model of Decision-MakerWe model the Decision-Maker using a cascade of two submodels: a procedure selector and a procedure
executor. In tandem, these emulate a pilot's rule-based decision-making behavior and psychomotor skills inexecuting a selected procedure.
With our SA-centered approach to pilot decision-making, we implemented the procedure selector as aproduction rule system, with a general structure given by:
If (Situation = Si) then (Procedure Set = Pi)This supports selection of a procedure set that is pre-assigned to the assessed situation specified in the
pilot's mental model. Details of the procedure set, and its linkages to the associated situation, aremaintained in the pilot’s procedure memory knowledge base.
A procedure set may contain one or more subprocedures. After a procedure set is selected, each firingof a subprocedure is determined using a forward chaining production system in response to event and stateevolution. The procedure selector is illustrated in figure 2.1-6.

The procedure executor simulates a pilot's psychomotor skills in executing the selected procedure. Theprocedure executor architecture is illustrated in figure 2.1-7. Here we show how the executor accepts aselected procedure and then converts it into the information, control, and communication actions(messages) needed to control the aircraft and its subsystems.
Procedure Memory
event cues {ci }
selected sub procedures {P*j }
S = S*
assessed situation S*
P = P*
Procedure Set P*
if c 1 and ci , then P1•••
if ck and ci , then Pn
{Pi}Forward ChainingProduction System
?
Figure 2.1-6: Procedure Selector Sub-Model Using Production Rules
Information Channel
controls
to aircraft
selectedprocedures{P*}
ControlChannel
CommunicationChannel
communicationsradarnavigationsystemsettings
estimated states x
j
Figure 2.1-7: Procedure Executor Sub-Model
2.2 SA/Performance Metric GeneratorSAMPLE provides us with internal estimates of pilot IP, SA, and DM activities and a timeline of these
activities. As a consequence, we can make use of a dual metric computation scheme as illustrated in figure2.2-1. For each simulation, we create two pilot models for each vehicle: 1) a reference pilot model whoreceives perfect information but does not control the aircraft simulation; and 2) an acting pilot model whichreceives the information processed by simulated onboard subsystems such as radar, display, etc., and whichactually controls the aircraft simulation. The reference pilot model generates ideal IP, SA, and DMactivities that are not affected by the onboard subsystems, while the acting pilot model produces the IP, SA,and DM activities that reflect the limitations imposed by the onboard subsystems. Comparing the referenceand actual IP, SA, DM activities in a metric computer thus provides us with a means of measuring thedisparity between the ideal activities and the pilot activities, broken down by IP, SA, and DM behaviors.This disparity, in turn, provides a direct metric reflecting how far the active pilot is from the ideal referencepilot, in a set of objective pilot-referenced dimensions.

ReferenceSAMPLE
Pilot Model
ActingSAMPLE
Pilot Model
perfect information actual information
ideal IP, SA, DM activities
inferred IP, SA, DM activities
Model-BasedMet r i c
Computer
model-based metrics
Figure 2.2-1: SAMPLE SA/Performance Metric Generator
In this effort, we defined three metrics for measuring pilot IP, SA, and DM activities, respectively.1) Information Disparity : This reflects pilot error in information processing (IP), particularly in
aircraft state estimation, and is defined by the normalized difference between the aircraft’s actual state x
and the estimated state x̂ . The information disparity metric is defined in the following manner
^ ^ ID(t) = (x (t) – (t))TΣ–1(t)( (t) – (t))x xx
(2.2-1)where Σ is the covariance matrix of the corresponding state variables, and is obtained from the Kalmanfilter in the information processor.
2) Situation Awareness Disparity: This reflects pilot errors in situation assessment (SA), and is definedas the normalized difference between the belief values of the actual and assessed situations via
SD(t) = |(Bel(S(t)) – Bel(S)(t))| (2.2-2)where Bel ( ) is the belief value of an actual or assessed situation.
3) Combat Advantage Index : This reflects pilot performance in decision-making (DM), and is definedas a weighted difference between the target and ownship, including aircraft altitude, speed, and geometricpotentials. The altitude and speed potentials are defined as:
∆h(t) = h s(t) – h t(t) and ∆v(t) = vs(t) – vt(t) (2.2-3)
where ∆h and ∆v greater than zero imply that ownship is at advantage. Otherwise, the target is at theadvantage. The geometric potential is defined by the relative position of the ownship and target vehicles.For example, if the target and ownship vehicles are coming at each other head on, they have the samegeometric potential of zero. If, however, the ownship is directly behind the target, then the ownship is at afull geometric advantage, designated by a +1 value. Other intermediate situations are detailed in Zachariaset. al (1995) and Hague (1981).
The combat advantage index CA(t) is then defined as the combination of altitude, speed, and geometricpotentials via:
CA(t) =Wh∆h(t) + Wv∆v(t) + Wg∆g(t)(2.2-4)
where Wh, Wv, and Wg are weighting terms. The CA index has a value normalized between -1 and +1,where -1 indicates that ownship is at the largest disadvantage, and +1 indicates that ownship is at the largestadvantage.
These three metrics provide a comprehensive if simplified view of the pilot's performance at threedifferent levels of processing. Specifically, the information disparity metric ID(t) reflects the pilot's errorsin vehicle state estimation only. The situation disparity metric SD(t) reflects the pilot's error in SA due to

both the SA activities and IP activities since SA depends on the result (event detection) of IP activities.Finally, the combat advantage index CA(t) reflects the pilot's performance level due to his combined IP,SA, and DM activities.
The three metrics can be time-averaged across a full simulation to reflect the overall pilot's IP, SA, andDM activities. For example, we define the overall situational disparity (SD) metric as
SD = 1
TSD(t)
0
Tdt (2.2-5)
which reflects overall pilot situation awareness (actually, its inverse) across the full span of the selectedsimulation.
In conjunction with the SAMPLE pilot model, these metrics provide us with a means for evaluating thepilot’s performance as it changes over the course of time, or as it is enhanced or degraded with theintroduction of new subsystems in the vehicle. The use of the metrics with the model allows us to accountfor the pilot’s fundamental information-processing capabilities and limitations, and to integrate these pilot-related factors with critical system-related factors such as the information quality of the supportingsubsystems, the display format, and the symbology of the human-machine interface. In particular, themodel and metrics provide us with a means of evaluating different subsystems and tactics in terms of theircorresponding model-based situation awareness metric values, so that candidate concepts can be screened,rank-ordered, and selected for further evaluation. They provide insight into the situation awareness andperformance improvements afforded by a range of proposed subsystem concepts, and can generate thenecessary guidance for selecting among a range of options.2.3 Interactive Graphical User Interface
We developed a Graphical User Interface (GUI) to facilitate subsystem evaluation and tacticsdevelopment, using Visual Basic, Microsoft Access, and Visio Technical - three Windows-based interfacedevelopment tools. The GUI is composed of a simulation setup navigator and an on-line simulationvisualization navigator. We briefly describe each of these; a detailed description of the GUI is provided inZacharias et al. (1995).
2.3.1 Simulation Setup NavigatorThe simulation setup navigator supports the user in the following tasks: 1) aircraft and subsystem
configuration for subsystem evaluation; 2) specification of initial scenario states; 3) creation andmodification of the pilot’s SA mental model; and 4) specification of situation-procedure relations for tacticsdevelopment. As shown in figure 2.3-1, the simulation setup navigator is activated by pressing theSimulation Setup button on the control bar of the GUI. Depressing the button automatically loads an airtheater onto the screen. The implementation of the air theater includes two aircraft templates, friendly(blue) and enemy (red), from which an arbitrary number of vehicles can be created simply by dragging atemplate into the theater as shown in the figure.
After all the vehicles to be used in a simulation are put into the theater, the user then configures thevehicles for a specific subsystem evaluation or combat tactics development task. The configuration beginswith the user selection of an instantiated vehicle by double-clicking as shown in figure 2.3-1. This actionpops up a vehicle configuration interface that looks like a small stack of four tabbed index cards. Each card,which can be accessed by clicking on its tab with the mouse, helps the user define:
1) Vehicle Specifications: This interface, shown in figure 2.3-1 allows the user to select vehicle type,weapons, RADAR, and display types for sybsystem evaluation using the pull-down text boxesprovided.
2) Initial Conditions: This interface allows the user to enter numerical data into textboxes for the initialscenario conditions specified by the vehicle coordinates, speed, and orientation.
3) Pilot SA Mental Model: This interface, shown in figure 2.3-2, assists the user in modifying or creatingthe pilot’s SA mental model. Activated by pressing the “VIEW” button in the Pilot Mental Modelindex card (in the upper portion of the figure), the interface has two components: a stencil and adrawing page. The stencil (on the left) contains master templates of a situation, an event, and twotypes of connectors (situation-situation links and situation-event links). The drawing page (on theright) is where the user can construct or view an SA model. The user edits the mental model bydragging the template from the stencil into the drawing page to create a new situation, event, orconnector in the window. The user can modify/create an SA mental model by building a hierarchy ofsituations and events and relating them using connectors. Double-clicking on an event, situation, orconnector, once it is in the window, loads another window interface, which allows the user to specify

the detailed attributes of individual situations, events, or connectors (or review those attributesdefined earlier).
4) Procedure Knowledge Base: This interface, shown in figure 2.3-3, allows the user to specify a pilot'sprocedure knowledge base. Activated by pressing the “VIEW” button in the Procedure KnowledgeBase index card (in the upper portion of the figure), the interface has two components: a stencil and adrawing page. The stencil (on the left) contains a template of the situation-procedure connector. Thedrawing page (on the right) contains, on the left hand side, a vertical “stack” of defined situations,and, on the right hand side, a vertical “stack” of available procedures. A connection from a situationto a procedure can be made by dragging a connector template from the stencil into the drawing pageto connect a situation to a procedure, implying that if the situation is assessed as true, the procedureis to be executed. Double clicking on a node (situation or procedure) in the drawing page will load asituation or procedure description window, which allows the user to specify the detailed attributes ofindividual situations or procedures.
double-click
drag
select button
control bar
Figure 2.3-1: Aircraft Configuration Using the Simulation Setup Navigator

Figure 2.3-2: GUI to Specify Pilot’s SA Mental Model

Figure 2.3-3: GUI to Specify Pilot’s Procedure Knowledge Base
2.3.2 On-Line Simulation Visualization NavigatorThe display setup navigator is composed of five main components that become accessible during
simulation: 1) Trajectory; 2) Event Timeline; 3) Performance Metrics; 4) Situation Assessment andDecision-Making; and 5) Supplementary Controls.
Trajectory: The user is presented with both top and side (2-D) views of evolving blue and red aircrafttrajectories, as well as that of their weapons. The top view is shown in figure 2.3-4. This display depicts thetrajectories of both red and blue vehicles and their corresponding weapons.
Events Timeline : This component is shown in the middle portion of the Display Navigator GUI infigure 2.3-5. The event component consists of two, content-selectable, frames. For example,by selecting

Blue 1 from the upper list box, the user can examine the situation, event, and procedure timelines for Blue 1in the top frame. He may also wish to select the Red 1 timeline in the lower frame. The contents of theseframes can be changed at any time during simulation.
Figure 2.3-4: Display Navigator: Trajectory Top View
Performance Metrics
Events
Supplementary ControlsDynamic SA and Decis ionmaking
Figure 2.3-5: Display Navigator Components

Performance Metrics: The user is able to visualize the situation disparity and information disparitymetrics. This is shown in the top portion of the GUI in figure 2.3-5. This component consists of two,content-selectable, frames which can display the information disparity metric or the situation disparitymetric for any vehicle. For example, the user can select Blue 1 information disparity from the list boxes inthe left frame. This result can then be viewed in conjunction with Blue 1 situation disparity in the rightframe. The contents of these frames can be changed at any time during simulation.
Situation Assessment and Decision-Making: This component of the GUI is shown in the lower leftcorner of figure 2.3-5. This interface allows the user to select, via list boxes, either a pilot mental model ora procedure knowledge base structure that was created earlier. Displaying a mental model structure allowsthe user to view dynamic belief updating by highlighting nodes corresponding to situations and events asthey occur during a scenario; a similar capability is provided for dynamic viewing of decision-makingchoices.
Supplementary Controls: This component of the GUI is shown in the lower right corner of figure 2.3-5.One aspect of this interface allows the user to set the speed during simulation. This feature becomesparticularly useful if the user wishes to slow the simulation speed in order to better view entities duringperiods rich with changes in situations, events, or procedures. Another aspect of this interface allows theuser to highlight individual vehicles in the top and side view displays. A Pause Simulation button allowsthe user to pause the simulation at any point and a Cancel button allows the user to cancel the simulation.
3. SAMPLE Operation and DemonstrationThis section demonstrates the use of SAMPLE for subsystem and tactics evaluation. Section 3.1
defines a 2v2 offensive counterair scenario selected to demonstrate SAMPLE feasibility, and develops theSA mental model and procedure knowledge base for the scenario. Section 3.2 demonstrates the use ofSAMPLE in several hypothetical subsystem and tactics evaluation examples.3.1 Scenario Definition and Pilot Mental Model Development
To demonstrate SAMPLE feasibility, we selected a 2v2 offensive counterair scenario based on an aircombat scenario described in Covault, 1988 and refined by subsequent interviews with a subject matterexpert, a retired fighter pilot.
A flight of two blue F-15E Eagles equipped with two AIM-120 missiles is ordered to conduct anoffensive counterair mission against a flight of two red Mig-25 equipped with two AA-9 missiles. Thescenario starts with both sides committed to an offensive mission. Both sides are flying towards theiropponent’s bullseye and are conducting radar searches on route. After the foes are detected and sorted,depending on the range and relative geometry situation, each side executes procedures (gain potential, LOSinterception, evasion, etc.) to maximize its Pk (kill probability) and Ps (survival probability). Missiles arefired when the maximum Pk is achieved, to obtain optimum fire point selection (FPS).
Based on the scenario and the knowledge elicitation session with the subject matter expert, wedeveloped an initial SA mental model for the offensive counterair scenario. Shown in figure 3.1-1, the SAmental model is a belief network (BN) representation of situation-event relations encapsulating the pilot'sprior knowledge of the scenario. At the top of the SA mental model is a root node indicating the overallsituation: offensive counterair. Directly below the root situation are three exclusive situation nodes: earlysetup, commit, and abort. The first node of situations includes all the situations before the pilot commits forcombat, the second node includes all the situations after the commitment, and the third node includes all thesituations for disengagement. We focused on the commit node, which is the root situation after the pilotcommits for combat. It includes three subsituations: search, sort and intercept. The intercept, in turn,includes a set of three exclusive situations: long range setup, medium range (or beyond visual range (BVR))interception, and fire (short) range maneuver. At the bottom of the situation tree are two subsituations of themedium range interception: attack and evade.
In the SA mental model, situations are defined using the causal relations between situations and events,as defined in table 3.1-1. To illustrate with the Attack Situation, we note that it is defined by twoconditional matrices (situation-event links) that specify that if the situation were indeed attack then whatkind of event states would be expected. The attack-range conditional matrix is defined as follows:
QAR =
0.0 0.50.8 0.10.2 0.4 (3.1-1)

Offensive Counter Air
EarlySetup
LongRange
Medium Range
FireRange
2 vs. 1 2 vs. 2
Commit Abort
Search Sort Intercept
2 vs. M
Detection
(y, n)
Range
(L, M, S)
Attack Evade
Targets
(1, 2, M)
Geometry
(LA, SA, N, SD, LD)
T Firing Status
(A, N, E)
Figure 3.1-1: SA Mental Model for Offensive Counterair Scenario
The first column defines target range probabilities for the Attack Situation and the second columndefines target range probabilities for the non-attack situation. In particular, this matrix represents, using acompact numerical representation, the following two rulesets:
• If a pilot is in the Attack Situation, then the chance of a target being at a long range is zero, being ata medium range is 80%, and being at a short range is 20%.
• If a pilot is not in the Attack Situation, then the chance of a target being at long, medium, or shortrange is 50%, 10%, and 40%, respectively (and dependent on other non-attack situations).
The conditional matrices between other situation-event links are similarly defined to quantify thecausal relation between a situation and its affected event. Notice that events may not be directly observable(e.g. target missile firing status) but must be projected, based on the pilot's situation awareness. In thiseffort, the specification of events, situations, event situation relations, and pilot SA mental model waslimited to a single offensive counterair scenario, and was also confined by the limited functionality of theaircraft and subsystem simulation that we developed.
Table 3.1-1: Offensive Counterair EventsEvent Event States DefinitionsTarget Detection (yes, no) A yes means that the pilot has
detected the targetTarget Range (long, medium, short) short < 20 NM
20NM < medium < 80NM80NM < long
Target Speed (high, medium, low) low < 500 knots500 knots < medium < 1000 knots1000 knots < high
Target Geometry (large advantage, small advantage, neutral,small disadvantage, large disadvantage)
A relative measurement of ownshiptarget potential
Target Missile Firing (yes, no) A yes means that the target has fireda missile
Once this SA mental model is defined, we then proceed to the second step of developing the pilot’sdecision-making mental model. Here, we focus on the air combat procedures for the scenario and define thesituation-procedure relations specifying the air combat tactics.
For our study, we developed pilot-centered procedures, which, unlike optimal guidance procedures(such as one would find on a modern air-to-air missile), do not specify detailed guidance laws, but ratherspecify general goals and desired aircraft kinematics states for a given situation. For example, the pursuitprocedure under this approach is defined as: achieving the maximum kill probability by pointing thevehicle at the target and closing to the target at the maximum speed. Since this is the same approach takenfor pilot training, the procedure and tactics developed under this approach should reasonably represent whatreal pilots do in combat.
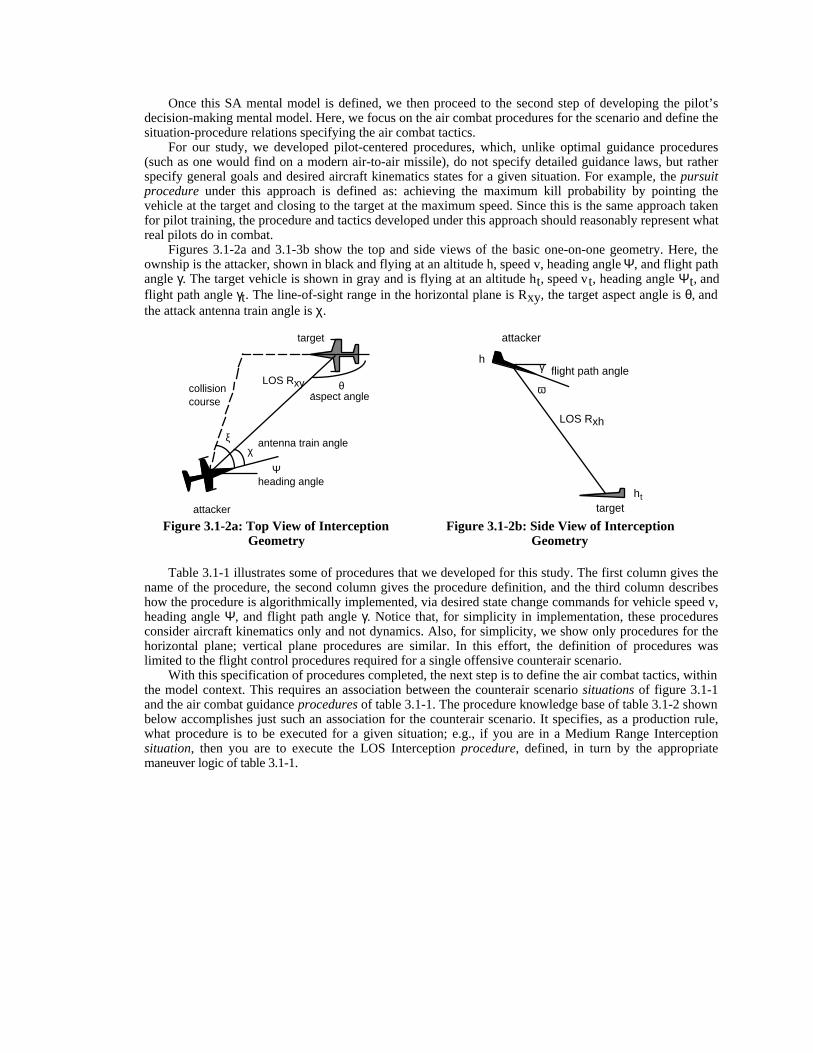
Figures 3.1-2a and 3.1-3b show the top and side views of the basic one-on-one geometry. Here, theownship is the attacker, shown in black and flying at an altitude h, speed v, heading angle Ψ, and flight pathangle γ. The target vehicle is shown in gray and is flying at an altitude ht, speed vt, heading angle Ψt, andflight path angle γt. The line-of-sight range in the horizontal plane is Rxy, the target aspect angle is θ, andthe attack antenna train angle is χ.
attacker
Ψ
LOS Rxy θaspect angle
heading angle
χantenna train angle
target
collisioncourse
ξ
γ flight path angle
ω
LOS Rxh
h
ht
attacker
target
Figure 3.1-2a: Top View of InterceptionGeometry
Figure 3.1-2b: Side View of InterceptionGeometry
Table 3.1-1 illustrates some of procedures that we developed for this study. The first column gives thename of the procedure, the second column gives the procedure definition, and the third column describeshow the procedure is algorithmically implemented, via desired state change commands for vehicle speed v,heading angle Ψ, and flight path angle γ. Notice that, for simplicity in implementation, these proceduresconsider aircraft kinematics only and not dynamics. Also, for simplicity, we show only procedures for thehorizontal plane; vertical plane procedures are similar. In this effort, the definition of procedures waslimited to the flight control procedures required for a single offensive counterair scenario.
With this specification of procedures completed, the next step is to define the air combat tactics, withinthe model context. This requires an association between the counterair scenario situations of figure 3.1-1and the air combat guidance procedures of table 3.1-1. The procedure knowledge base of table 3.1-2 shownbelow accomplishes just such an association for the counterair scenario. It specifies, as a production rule,what procedure is to be executed for a given situation; e.g., if you are in a Medium Range Interceptionsituation, then you are to execute the LOS Interception procedure, defined, in turn by the appropriatemaneuver logic of table 3.1-1.

Table 3.1-1: Air Combat Guidance ProceduresProcedure Definition Simulation MethodFly to point (x, y, h) at speed vd Fly to point (x, y, h) at a constant
speed vd v = sign(v – vd) vd
Combat air patrol Fly a race track at cruise speed Fly to point (x, y, h) at speed vFly along the direction d
Gain potential advantage Improve the potential advantage bymaneuvering from a lower potentialadvantage to a higher potentialadvantage geometry
Compute heading rate andacceleration using:
Ψ = sign (Ψ – Ψd) Ψd
v = sign (v – vd) vd
Line of Sight (LOS) interception Turn the vehicle heading towardsthe LOS by commanding anacceleration that is proportional tothe LOS rate of change
Compute LOS turn rate using
σ =sinθ – v sin χ
Rxy
vt
Compute closure rate & heading
Rxy = cosθ – v cosχv t
Ψ = –KLRxyσxy
Pure pursuit Achieve the maximum kill bypointing the vehicle at the targetand closing to the target at themaximum speed
Compute heading using: Ψ = –Kpχ
Collision course interception Fly the vehicle along a predictedcollision course with the target bycommanding a turn-rateproportional to the angular errorbetween the current target vectorand the LOS to the predictedintercept point
Compute collision antenna trainangle by
vbxy sinθ
vξ =sin-1 −
Ψ = −Κc(ξ-χ).
Table 3.1-2: Combat Tactics Procedure KBSituation Procedure• Search • Fly to Point• Sort • Sort• Long Range Setup • Gain Potential• Medium Range Interception • LOS Interception• Fire Range • Pure Pursuit• Evade • Evade
3.2 Demonstration of SAMPLE in a Subsystem Evaluation ExerciseThe primary objective of the demonstration exercise is to evaluate the effectiveness of the SAMPLE-
based metrics for evaluating and ranking subsystem design choices and/or tactical procedure options. Thiswas conducted using several low-fidelity aircraft subsystem models including: 1) aircraft models used tosimulate the blue team's F-15s and the red team's Mig-25s; 2) missile models to simulate the blue team’sAIM-120 and AIM-9B missiles;
and 3) radar subsystem models used to simulate three hypothesized radar subsystem designs (short,medium, and long range), for both blue and red.
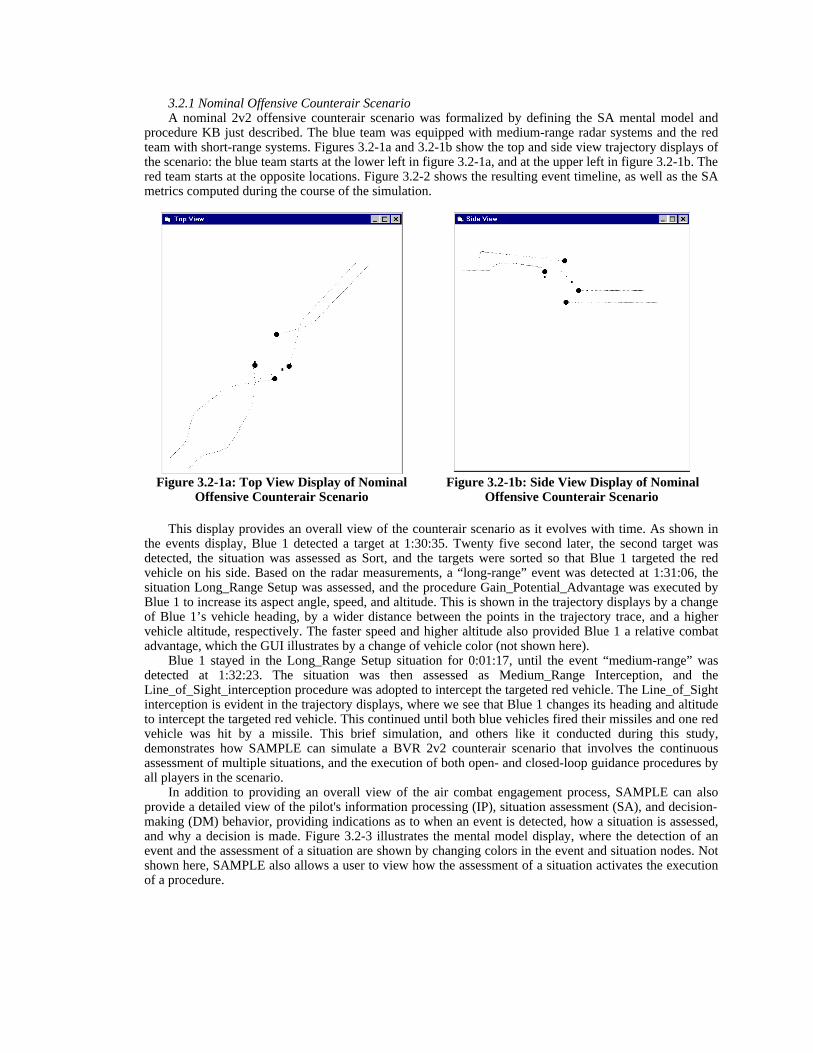
3.2.1 Nominal Offensive Counterair ScenarioA nominal 2v2 offensive counterair scenario was formalized by defining the SA mental model and
procedure KB just described. The blue team was equipped with medium-range radar systems and the redteam with short-range systems. Figures 3.2-1a and 3.2-1b show the top and side view trajectory displays ofthe scenario: the blue team starts at the lower left in figure 3.2-1a, and at the upper left in figure 3.2-1b. Thered team starts at the opposite locations. Figure 3.2-2 shows the resulting event timeline, as well as the SAmetrics computed during the course of the simulation.
Figure 3.2-1a: Top View Display of NominalOffensive Counterair Scenario
Figure 3.2-1b: Side View Display of NominalOffensive Counterair Scenario
This display provides an overall view of the counterair scenario as it evolves with time. As shown inthe events display, Blue 1 detected a target at 1:30:35. Twenty five second later, the second target wasdetected, the situation was assessed as Sort, and the targets were sorted so that Blue 1 targeted the redvehicle on his side. Based on the radar measurements, a “long-range” event was detected at 1:31:06, thesituation Long_Range Setup was assessed, and the procedure Gain_Potential_Advantage was executed byBlue 1 to increase its aspect angle, speed, and altitude. This is shown in the trajectory displays by a changeof Blue 1’s vehicle heading, by a wider distance between the points in the trajectory trace, and a highervehicle altitude, respectively. The faster speed and higher altitude also provided Blue 1 a relative combatadvantage, which the GUI illustrates by a change of vehicle color (not shown here).
Blue 1 stayed in the Long_Range Setup situation for 0:01:17, until the event “medium-range” wasdetected at 1:32:23. The situation was then assessed as Medium_Range Interception, and theLine_of_Sight_interception procedure was adopted to intercept the targeted red vehicle. The Line_of_Sightinterception is evident in the trajectory displays, where we see that Blue 1 changes its heading and altitudeto intercept the targeted red vehicle. This continued until both blue vehicles fired their missiles and one redvehicle was hit by a missile. This brief simulation, and others like it conducted during this study,demonstrates how SAMPLE can simulate a BVR 2v2 counterair scenario that involves the continuousassessment of multiple situations, and the execution of both open- and closed-loop guidance procedures byall players in the scenario.
In addition to providing an overall view of the air combat engagement process, SAMPLE can alsoprovide a detailed view of the pilot's information processing (IP), situation assessment (SA), and decision-making (DM) behavior, providing indications as to when an event is detected, how a situation is assessed,and why a decision is made. Figure 3.2-3 illustrates the mental model display, where the detection of anevent and the assessment of a situation are shown by changing colors in the event and situation nodes. Notshown here, SAMPLE also allows a user to view how the assessment of a situation activates the executionof a procedure.

Figure 3.2-2: Events and Metrics Display for Nominal Offensive Counterair Scenario
SAMPLE provides the user with a unique insight into the pilot’s behavior, because it combines andgraphically displays three disparate types of information: a) graphical visualizations of the trajectories; b)textual timelines that chart the course of the pilot’s IP, SA, and DM behavior; and c) network graphics thatillustrate the dynamic underlying linkages between IP, SA, and DM nodes.
Beyond providing insight into the pilot's IP, SA, and DM processes, SAMPLE also providesquantitative measurements of these processes. As shown in figure 3.2-2, the situation disparity andinformation disparity of Blue 1 at each time point is plotted, on-line, in the metric display.
Figure 3.2-4 plots the time histories of Blue 1's three metrics: information disparity, situation disparity,and combat advantage index. The information disparity (ID) reflects pilot errors in target state estimation.In this demonstration case, it was a function of radar type. As shown in figure 3.2-4, the hypothesizedmedium-range resulted in an ID level of 3%. The situation disparity (SD) reflects pilot errors in situationawareness. In the simulation, the pilot's SD metric started at a high 0.7 since the medium-range radar couldnot detect a target 100 NM away (with only an 80 NM range capability); it thus failed the pilot for thecorrect assessment of the Long_Range Setup situation. SD was significantly improved after two targetswere detected, being reduced to 0.1. The assessment of the Long_Range Setup situation at an early stagegave Blue 1 an opportunity to improve its combat advantage (CA), as quantified by the combat advantageindex.

Figure 3.2-3: Mental Model Display for Nominal Offensive Counterair Scenario
65432100.0
0.2
0.4
0.6
0.8
IDSDCA
Time (minutes)
Per
form
ance
Met
rics
Figure 3.2-4: Performance Metrics for Nominal Offensive Counterair Scenario3.2.2 Evaluation of Radar System EffectivenessTo evaluate the effectiveness of different types of radar subsystems on Blue team performance, we then
ran the same 2v2 offensive counterair scenario simulation, using the same SA mental model and procedureKB, but equipping the blue team with short- or long-range radar systems, instead of the nominal medium-

range system. Figures 3.2-5a and 3.2-5b show the top and side view trajectory displays resulting from theuse of the short-range radar. Direct comparison with the medium-range radar trajectories shown earlier infigures 3.2-1a, b reveals that the blue team detects the red team much later in the engagement, consequentlylosing the opportunity for a potential gain, and requiring the conduct of a direct Line_of_Sight interception.
Figure 3.2-5a: Top View Display of CounterairScenario Using Short-Range Radar
Figure 3.2-5b: Side View Display of CounterairScenario Using Short-Range Radar
The effect of the short-range radar system on pilot performance is reflected in the pilot's threeperformance metrics as shown in figure 3.2-6. Comparison with the medium-range case illustrated earlier infigure 3.2-4 shows that the pilot has a larger level of information disparity (ID), a much delayed reductionin situation disparity (SD), and a significant loss of combat advantage (CA), all directly attributable to thelimitations of the short-range radar subsystem.
The time-averaged ID, SD, and CA metrics defined earlier in section 2.2 reflect overall pilotperformance across the full span of the selected scenario, and can be used to measure the overall impact ofthe three different radar subsystems on pilot performance. Figure 3.2-7 compares the average ID, SD, andCA indices, using three different radar subsystems. It can be seen that in going from a short-range to amedium-range radar, we obtain a significant improvement in performance (a large drop in the ID, SD, andCA metrics), but in going from a medium-range to a long-range radar, we obtain only a marginalimprovement in performance. This evaluation is only meant to demonstrate the general approach, and is notto be taken as conclusive evidence that a longer-range radar is always better than a shorter-range radar, andthat marginal improvements come as ranges increase. However, we wish to emphasize that the sameevaluation process can be conducted in a full-scope effort using a much more sophisticated representationof subsystem models. We can then generate more rigorous engagement performance assessments groundedin realistic vehicle and subsystem models.
65432100.0
0.2
0.4
0.6
0.8
IDSDCA
Time (minutes)
Per
form
ance
Met
rics
Figure 3.2-6: Performance Metrics Using Short-Range Radar
ID SD CA0.0
0.1
0.2
0.3
0.4
Short-Range
Medium-Range
Long-Range
Ove
rall
Per
form
ance
Met
rics
Figure 3.2-7: Performance as Function of RadarSubsystem

3.2.3 Evaluation of Weapon System EffectivenessUsing this same 2v2 offensive counterair scenario, we evaluated the effect of missile range on combat
tactics and performance. In this evaluation, the blue team‘s AIM-120 missiles were replaced with short-range AIM-9B Sidewinder missiles, which have a range of less than 3 nm and can only acquire a target andlock onto it if the firing aircraft is behind the target. As in the nominal case, the evaluation was onlyconducted with the blue team equipped with medium-range radar systems and the red team with short-rangesystems. All other simulation setup parameters were the same as those of the nominal simulation.
Figures 3.2-8a and 3.2-8b show the top and side view trajectory displays of the evaluation scenario: theblue team starts at the lower left in figure 3.2-8a, and at the upper left in figure 3.2-8b. The red team startsat the opposite locations. A comparison of the trajectory displays with those of the nominal scenario usingmedium-range missiles (figures 3.2-1a and 3.2-1b) reveals an evident change in combat tactics. In thenominal medium-range all-aspect missile scenario, the blue team needs to make few on-line tacticsadaptations to counter the actions of the red team. When the red team finds out that it is under attack, theblue team has finished its potential gain, starts the interception, and is almost ready to fire its missiles(figures 3.2-1a, b). In the short-range limited aspect missile scenario (figures 3.2-8a, b), however, themissile limitations forces the blue team to maneuver into the tail position before firing its missiles. Thismaneuvering at short range, however, reveals the blue team's intention to the red team, before the blue teamcan finish its maneuvering. To get behind the targets and to fire the missiles, the blue team thus must adapt,on-line, its tactics to the actions of the red team.
As shown in figures 3.2-8a and 3.2-8b, the two blue vehicles did an initial sort, so that each takes itscorresponding head-on target. They each start to maneuver outside, to get into the tail position of theirrespective targets. This maneuvering, however, was detected by the red team before the blue attackerscould finish their maneuvering. The two red vehicles then evaded at high speed in opposite directionstoward the attackers. This reduced the effective separation between the attacking blue and the evading red,and made it impossible for blue to turn into the tail position of its original target. The two blue attackersadapted to this situation by swapping targets. After the swap, the blue attacker, which started nearest theleft edge of the window, continuously adapted its guidance controls in a closed-loop fashion, in response tothe target's evasive maneuvering, and got behind the target, finally shooting it down. The other blueattacker was not so lucky: it trailed behind its target too much and missed its chance to fire its missile.
Figure 3.2-8a: Top View Display Using Short-Range Missiles
Figure 3.2-8b: Side View Display Using Short-Range Missiles
The overall effect of short-range missiles on blue team performance is shown in figure 3.2-9, whichcompares the average ID, SD, and CA indices between the medium- and short-range missile scenarios. Itcan be seen that in going from the nominal medium-range all-aspect missiles (AIM-120) to the short-rangetail-aspect missiles (AIM-9B), the blue team's ID and SD metrics are almost unchanged. Its CA index,however, drops significantly, reflecting the drop in overall combat effectiveness. Again, we note that this

evaluation is only meant to demonstrate a feasible approach to evaluate weapon system effectiveness, andis not to be taken as conclusive evidence that medium-range all-aspect missiles are the key to a sure victory.A valid evaluation requires a high fidelity representation of actual weapon systems. If the same evaluationprocess were to be conducted using a more sophisticated representation of subsystem models, convincingconclusions could then be drawn on the effect of weapon subsystems options on combat tactics andperformance.
ID SD CA0.0
0.1
0.2
0.3
0.4
AIM-120AIM-9B
Ave
rag
e P
erfo
rman
ce M
etri
cs
Figure 3.2-9: Performance as Function of Missile Subsystem
3.2.4 Evaluation of Combat Tactics EffectivenessWe can also use SAMPLE to evaluate air combat tactics, by changing the procedure KB to reflect
alternative tactical options and strategies. We selected six 2v2 tactical interception doctrines described byShaw & Baines (1988): pincer, sweep, trial, spread, single-side, and drag. For each tactic, we developedand implemented situation and event-based guidance rules to simulate the combat engagement process in aclosed-loop fashion. This allows an attacker to determine its flight controls based on both the guidance ruleand the estimated target states.
Figure 3.2-10 illustrates the top and side views of of a scenario in which blue uses trail tactics. Theybegin with the leader attacking both targets, while the wingman trails behind. If one or both targets survivethe initial attack. The wingman will be exactly behind the remaining target(s) for the follow-up attack.
Figure 3.2-10a: Top View of Trail Figure 3.2-10b: Side View of Trail

By conducting multiple simulations in this fashion, across a range of scenarios, different tacticalstrategies can be objectively compared using the model-based performance metrics described earlier, sothat tactical options can be rank ordered, optimized, or eliminated from consideration.
5. SummaryThe primary result of this study is a proof-of-concept demonstration of SAMPLE for evaluating
subsystems and tactics in terms of their impact on enhancing pilot SA. The major study findings supportingthis demonstration effort can be summarized as follows.
• We demonstrated a capability of simulating a complete air-to-air combat scenario, in this case 2v2offensive counterair, from the start of a search to missile firing. This is done using SAMPLE and asimulation of the aircraft and its subsystems.
• The simulation supports general subsystem evaluations and tactics development. Simulation-generated timelines for situation assessment and procedure execution explicitly show the cause-effect relationships among key events, situations, and controls. Furthermore, the timeline shows thevalues and status of these key aircraft subsystem and pilot variables and their progress with time.
• We generated both internal and external views of the ongoing pilot SA process via a timeline, an SAmetric, and an individual account of the SA reasoning process. Together, they show: 1) how eachindividual cue contributes to overall SA; 2) how internal SA is achieved, starting with a triggeringcue and ending with the belief updating of all related situations and events; and 3) how SA evolvesvia the accumulation of cues over time.
• We demonstrated that the SA model has a capability for quantifying each of the important SAconcepts and processes such as situations, events, event cues, event propagation, event projection,situation assessment, and situation awareness. This enables a quantitative rather than simply aqualitative description, to enable comprehension and measurement of an SA process and SA-drivenpilot decision-making behavior.
• We demonstrated via a hypothesized radar subsystem evaluation example, SAMPLE's majoradvantage in providing model-based performance metrics for on-line assessment of the pilot model'sIP, SA, and DM performance, using metrics of information disparity, situation disparity, and combatadvantage.
• We demonstrated how we could use the three performance metrics to quantitatively evaluate theimpact of radar and weapons subsystem performance on overall pilot/vehicle engagementperformance. We also demonstrated SAMPLE’s potential for evaluating an array of complexmaneuvering tactics, and for assessing their contribution to overall engagement success.
In summary, using SAMPLE for subsystem evaluation and tactics development provides two majoradvantages over other possible approaches (empirical, handbook, or rule-based). First, SAMPLE providesinsights into how a subsystem affects a pilot's IP, SA, and DM activities via its trajectory displays,timelines, and especially its on-line visualization of pilot SA and DM processes. Such insights often canlead to the guidance needed for subsystem improvement. Second, SAMPLE provides a comprehensive setof model-based performance metrics that reflects and measures a pilot's IP, SA, and DM actions, thusavoiding the subjectiveness of empirical approaches and greatly improving the effectiveness of simple rule-based model approaches that have only a limited capability to measure pilot actions.
AcknowledgmentThis work was performed under Air Force contract F33657-95-C-2044, as part of the Small Business
Innovative Research (SBIR) Program. The authors wish to thank Mr. John Coleman of The BoeingCompany, for providing us information on MIL-AASPEM II, Dr. Eva Hudlicka of Psychometrix for hercontributions to our mental model constructs, and Dr. Sherif M. Botros and Mr. Paul G. Gonsalves ofCharles River Analytics, for their help in vehicle and pilot modeling. We also thank Ms. Kristy Shriver forher help in the creation and editing of this document.
References
Baker, J. R. (1986). “Tactics and The Fog of War”. USAF Fighter Weapons Review, Summer, 14-17.Baron, S., Zacharias, G., Muralidharan, R., & Lancraft, R. (1980). “PROCRU: A Model for Analyzing
Flight Crew Procedures in Approach to Landing”. 16th Annual Conf. on Manual Control, Cambridge,MA.
Caretta, T. R., Perry, D. C., & Ree, M. J. (1994). “The Ubiquitous Three in the Prediction of SituationAwareness: Round up the Usual Suspects”. In Gilson, Garland, & Koonce (Eds.), Situational
Awareness in Complex Systems, (pp. 125-137). Daytona Beach, FL: Embry-Riddle AeronauticalUniversity Press.
Covault, C. (1988). “Alaskan Air Battles Simulate F-15 Defense Against Soviet Fighters”. Aviation week &Space Technology, May 16, 1988, 56-57.
Duda, R. O., Gaschnig, J., Hart, P. E., Konolige, K., Reboh, R., Barrett, P., & Slocum, J. (1978).Development of the PROSPECTOR Consultation System for Mineral Exploration Inc. (Final Report6415): SRI International Inc., Menlo Park, CA
Endsley, M. R. (1989). “Pilot Situation Awareness: The Challenges for the Training Community”.Interservice/Industry Training Systems Conference, Ft. Worth, TX.
Endsley, M. R. (1990). “Predictive Utility of an Objective Measure of Situational Awareness”. Proc. of theHuman Factors Society 34th Annual Meeting, Santa Monica, CA.
Endsley, M. R. (1993). “A Survey of Situation Awareness Requirements in Air-to-Air Combat Fighters”.International Journal of Aviation Psychology, 3, 157-168.
Endsley, M. R. (1995). “Situation Awareness in Dynamic Systems”. Human Factors, 37(1).Endsley, M. R. (1995a). “Toward a Theory of Situation Awareness in Dynamic Systems”. Human Factors,
35(1), 32-45.Fracker, M. L. (1990). “Attention Gradients in Situation Awareness”, Situational Awareness in Aerospace
Operations AGARD-CP-478, . Neuilly-Sur-Siene, France: Advisory Group for Aerospace Researchand Development.
Hague, D. S. (1981). “Multi-Tactical Aircraft Combat Performance Evaluation System”. Journal ofAircraft, 18(7), 513-520.
Hartman, B., & Secrist, G. (1991). “Situation Awareness is More than Exceptional Vision”. Aviation, Spaceand Environmental Medicine, 62, 1084-1091.
Harwood, K., Barnett, B., & Wickens, C. D. (1988). “Situational Awareness: A Conceptual andMethodological Framework”. Proc. of the 11th Symposium of Psychology in the Department ofDefense.
Heckerman, D. (1995). A Tutorial on Learning Bayesian Networks (Technical Report MSR-TR-95-06):Microsoft Corporation (March 1995).
Henrion, M., Breese, J. S., & Horvitz, E. J. (1991). “Decision Analysis and Expert Systems”. AI Magazine,Winter, 64-91.
Klein, G. (1994). “Naturalistic Decision Making: Implications for Design”. Gateway, 5(1), 6-7.Klein, G. A. (1989a). “Recognition-Primed Decisions”. Advances in Man-Machine Systems Research, 5,
47-92.Klein, G. A., et. al. (1989b). “Critical Decision Method for Eliciting Knowledge”. IEEE Trans. on Systems,
Man and Cybernetics, 19(3), 462-472.Kleinman, D. L., & Baron, S. (1971). Analytic Evaluation of Display Requirements for Approach to
Landing (CR-1952): NASA (November).Lewinson, L. (1995). “AI at Microsoft”. PC AI, January/February, 18-21.Milgram, P., van der Wijngaart, R., Veerbeek, H., Bleeker, O. F., & Fokker, B. V. (1984). “Multi-Crew
Model Analytic Assessment of Landing Performance and Decision Making Demands”. Proc. 20thAnnual Conference on Manual Control, Moffett Field, CA.
Pearl, J. (1986a). “Fusion, Propogation, and Structuring in Belief Networks”. Artificial Intelligence, 29(3),241-288.
Pearl, J. (1986b). “On Evidence Reasoning in a Hierarchy of Hypotheses”. Artificial Intelligence, 28, 9-15.Rouse, W. B., & Morris, N. M. (1985). On Looking into the Black Box: Prospects and Limits in the Search
for the Mental Models (DTIC AD-A159080): Georgia Institute of TechnologyShaw, M. L. G., & Baines, B. R. (1988). “KITTEN: Knowledge Initiation and Transfer Tools for Experts
and Novices”. In Boose & Gaines (Eds.), Knowledge Acquisition Tools for Expert Systems, . NewYork: Academic Press.
Singleton, J. B. (1990). “The Four Levels of Wingmanship”. USAF Fighter Weapons Review, Spring, 15-16.
Smith, C. L., & Sage, A. P. (1991). “Situation Assessment in Command and Control”. In Andirole &Halpin (Eds.), Information Technology for Command and Control, (pp. 449-466).
Spick, M. (1988). The Ace Factor. Annapolis, MD: Naval Institute Press.

Stiffler, D. R. (1988). “Graduate Level Situation Awareness”. USAF Fighter Weapons Review(Summer),115-20.
Zacharias, G. L. (1989c). Situation Awareness Metric for Cockpit Configuration Evaluation (TechnicalReport R8910): Charles River Analytics Inc. (December).
Zacharias, G. L., Miao, A., Kalkan, A., & Kao, S. (1994). “Operator-Based Metric for Nuclear OperationsAutomation Assessment”. Transactions of the Twenty-Second Water Reactor Safety InformationMeeting, Bethesda, MD.
Zacharias, G. L., Miao, A. X., Illgen, C., & Yara, J. M. (1995). SAMPLE: Situation Awareness Model forPilot-in-the-Loop Evaluation (Final Report R95192): Charles River Analytics, Inc. (December 12,1995).
Zacharias, G. L., Miao, A. X., & Riley, E. W. (1992a). Passive Sensor Altitude and Terrain AwarenessSystem (Final R91071): Charles River Analytics Inc. (February).
Zacharias, G. L., Miao, A. X., & Riley, E. W. (1992b). Situation Awareness Model for the BVR Mission(Final Report R90011): Charles River Analytics (December 1992).


