Sample Selection - UPM EduTrain Interactive Learningvodppl.upm.edu.my/uploads/docs/Week 8 - Sample...
16
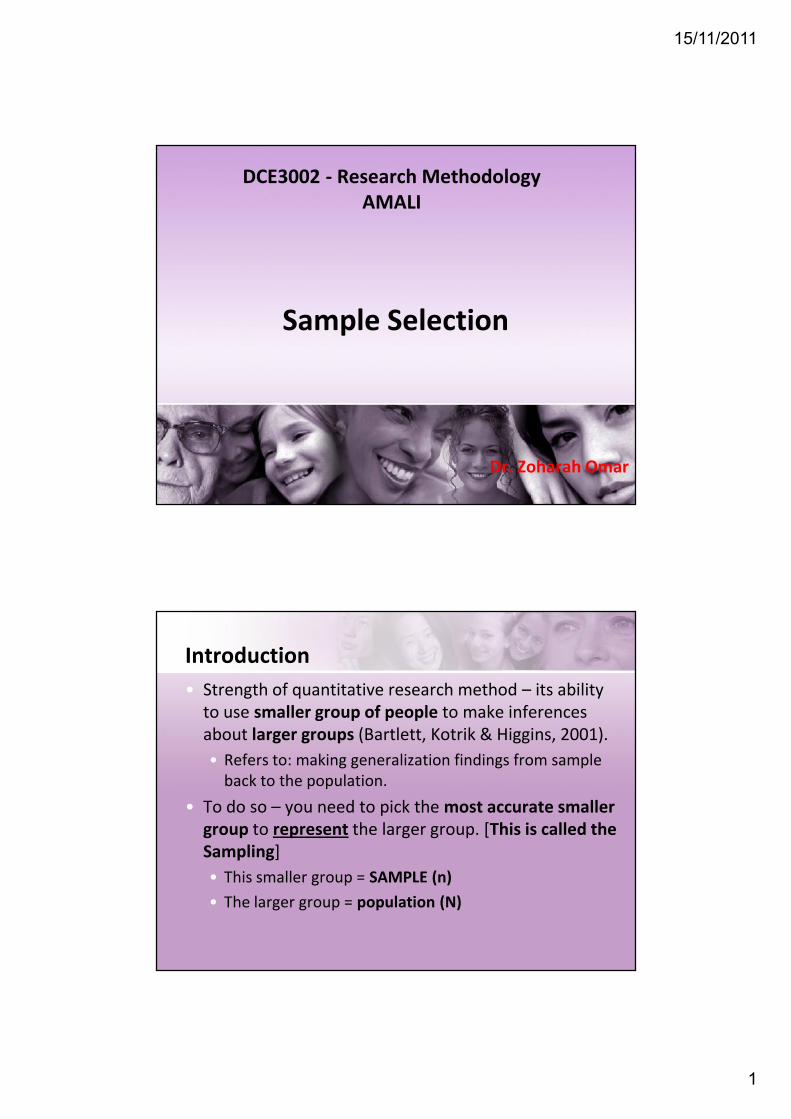
15/11/2011 1 Sample Selection DCE3002 - Research Methodology AMALI Dr. Zoharah Omar Introduction • Strength of quantitative research method – its ability to use smaller group of people to make inferences about larger groups (Bartlett, Kotrik & Higgins, 2001). • Refers to: making generalization findings from sample back to the population. • To do so – you need to pick the most accurate smaller group to represent the larger group. [This is called the Sampling] • This smaller group = SAMPLE (n) • The larger group = population (N)
Transcript of Sample Selection - UPM EduTrain Interactive Learningvodppl.upm.edu.my/uploads/docs/Week 8 - Sample...
15/11/2011
1
Sample Selection
DCE3002 - Research MethodologyAMALI
Dr. Zoharah Omar
Introduction• Strength of quantitative research method – its ability
to use smaller group of people to make inferencesabout larger groups (Bartlett, Kotrik & Higgins, 2001).• Refers to: making generalization findings from sample
back to the population.• To do so – you need to pick the most accurate smaller
group to represent the larger group. [This is called theSampling]• This smaller group = SAMPLE (n)• The larger group = population (N)
15/11/2011
2
Definitions: Population vs Sample• What is a sample?
• A finite part of a statistical population chosen to bestudied to represent the population.
• (Symbol = n)• What is a population?
• A population is a group of individuals persons, objects,or items from which samples are taken formeasurement.
• Data collected form the whole population – census.• (Symbol = N)
Sampling• What is sampling?
• Sampling is technique of selecting a suitable sample,or a representative part of a population for thepurpose of determining parameters or characteristicsof the whole population using a range of methods.
• Therefore in Sampling technique:• Select sample from population.• There are several methods/techniques to choose the
sample.
15/11/2011
3
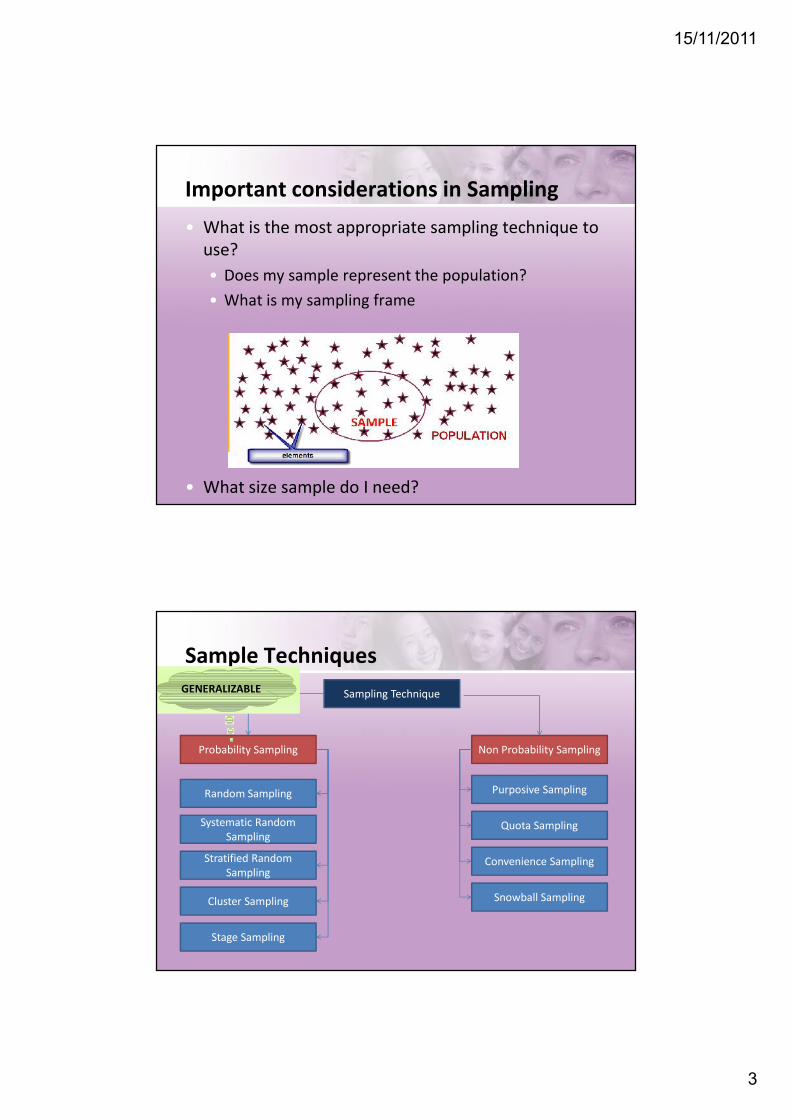
Important considerations in Sampling• What is the most appropriate sampling technique to
use?• Does my sample represent the population?• What is my sampling frame
• What size sample do I need?
Sample TechniquesSampling Technique
Probability Sampling Non Probability Sampling
Random Sampling
Stratified RandomSampling
Cluster Sampling
Stage Sampling
Purposive Sampling
Quota Sampling
Convenience Sampling
Snowball Sampling
Systematic RandomSampling
GENERALIZABLEGENERALIZABLE
15/11/2011
4
Probability Sampling• Probability Sampling
• The chance/probability of each case being selected fromthe sample .
• Allows to make inference from sample about population(generalization)
• Example:Sample = Consumer. Rate the price of Chocolate bar. 75%said expensive.Inference: 75% of all consumer feels the same.
• Use of inferential statistics – the Significance value (p-value) and confidence interval.
Types of Probability Sampling Techniques• Simple Random Sampling (Sample Rawak Mudah)
• Select sample at random from sampling frame• How:
• Number each cases in your sampling frame with a unique number.1,2,3,………
• Select cases using random numbers until you get the desired samplesize.
• Cast lots or computer program – Excel, SPSS (if data available incomputer).
• Example: Population – 200 Desired Sample: 100• Advantage: Easy to implement• Disadvantage: Require list of population elements, over
or under representativeness, time-consuming
15/11/2011
5
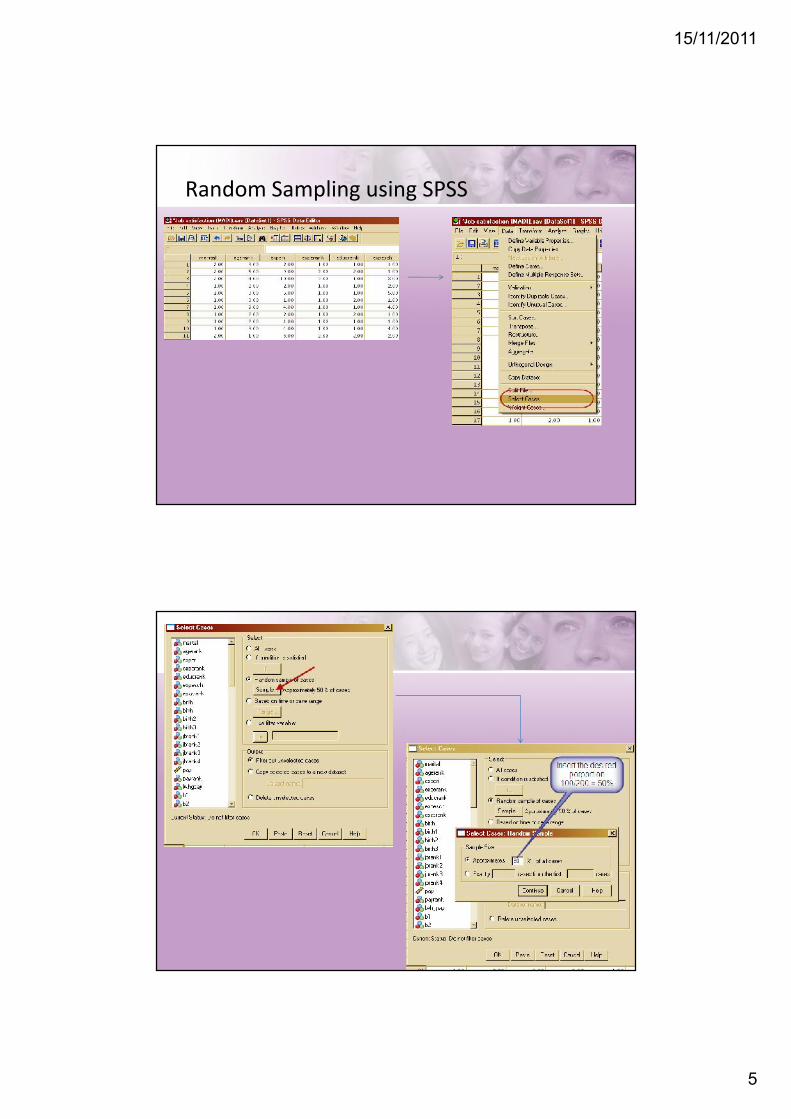
Random Sampling using SPSS

15/11/2011
6
Systematic Random Sampling – Samplerawak sistematik
• Select sample at regular intervals from the samplingframe.
• How:• Number each cases in sampling frame with unique number.
1,2,3,4,…….• Select the 1st case using a random number.• Calculate sampling fraction
Actual sample size/total population: 100/500 = 1/5 (selectone in every 5 case)
• Select subsequent cases (from the 1st case) using thesampling fraction.
15/11/2011
7
Advantages• Simple to design• Easier than simple random
Disadvantages• Periodicity within population
may skew sample and results• Trends in list may bias results• Moderate cost
Stratified Random Sampling• Divide the population according to several strata (sub-
sets).• A random or systematic sample is drawn from the sub-
sets/strata. How.• Choose the stratification variable (eg: age group, job
status, gender, etc.)• Divide the sampling frame into the sub-set• Number each of the cases within each subset with a
unique number.• Select sample using simple or systematic sampling
proportionately or disproportionately.
15/11/2011
8
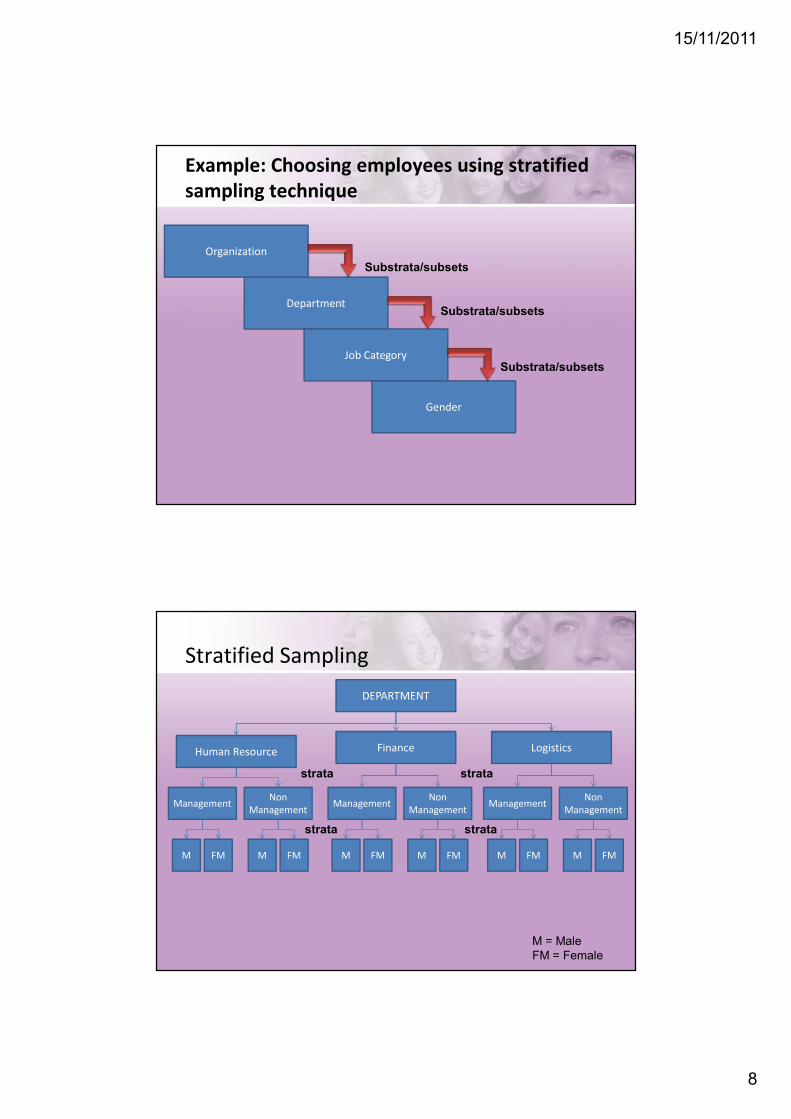
Example: Choosing employees using stratifiedsampling technique
Department
Organization
Job Category
Gender
Substrata/subsets
Substrata/subsets
Substrata/subsets
Stratified SamplingDEPARTMENT
Human Resource Finance Logistics
Management NonManagement Management Non
Management Management NonManagement
M FMM FM M FM M FM M FM M FM
M = MaleFM = Female
strata strata
stratastrata
15/11/2011
9
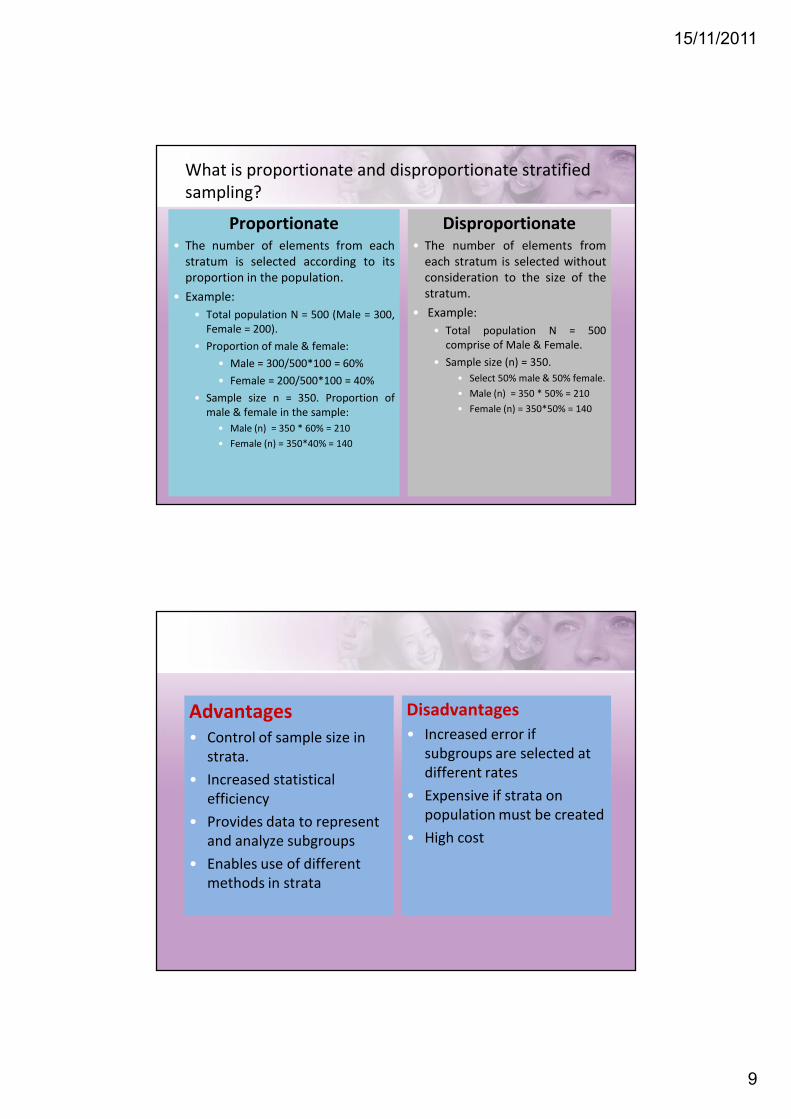
What is proportionate and disproportionate stratifiedsampling?
Proportionate• The number of elements from each
stratum is selected according to itsproportion in the population.
• Example:• Total population N = 500 (Male = 300,
Female = 200).• Proportion of male & female:
• Male = 300/500*100 = 60%• Female = 200/500*100 = 40%
• Sample size n = 350. Proportion ofmale & female in the sample:
• Male (n) = 350 * 60% = 210• Female (n) = 350*40% = 140
Disproportionate• The number of elements from
each stratum is selected withoutconsideration to the size of thestratum.
• Example:• Total population N = 500
comprise of Male & Female.• Sample size (n) = 350.
• Select 50% male & 50% female.• Male (n) = 350 * 50% = 210• Female (n) = 350*50% = 140
Advantages• Control of sample size in
strata.• Increased statistical
efficiency• Provides data to represent
and analyze subgroups• Enables use of different
methods in strata
Disadvantages• Increased error if
subgroups are selected atdifferent rates
• Expensive if strata onpopulation must be created
• High cost
15/11/2011
10
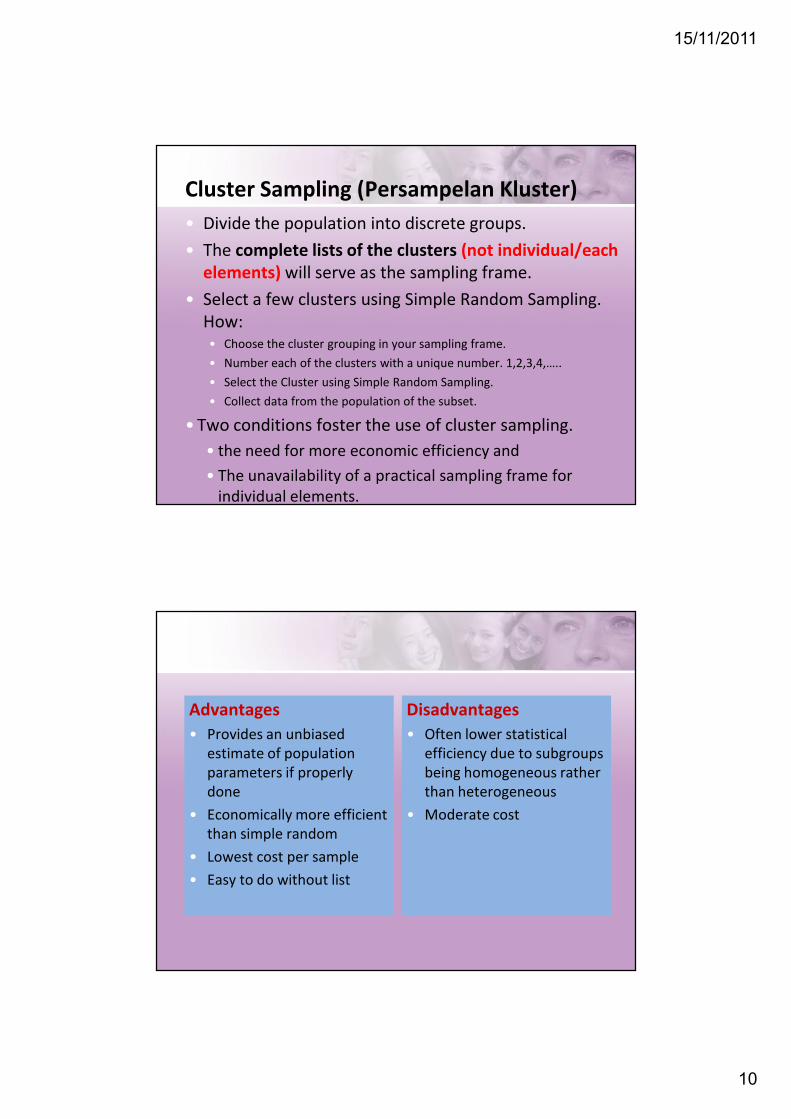
Cluster Sampling (Persampelan Kluster)• Divide the population into discrete groups.• The complete lists of the clusters (not individual/each
elements) will serve as the sampling frame.• Select a few clusters using Simple Random Sampling.
How:• Choose the cluster grouping in your sampling frame.• Number each of the clusters with a unique number. 1,2,3,4,…..• Select the Cluster using Simple Random Sampling.• Collect data from the population of the subset.
• Two conditions foster the use of cluster sampling.• the need for more economic efficiency and• The unavailability of a practical sampling frame for
individual elements.
Advantages• Provides an unbiased
estimate of populationparameters if properlydone
• Economically more efficientthan simple random
• Lowest cost per sample• Easy to do without list
Disadvantages• Often lower statistical
efficiency due to subgroupsbeing homogeneous ratherthan heterogeneous
• Moderate cost
15/11/2011
11
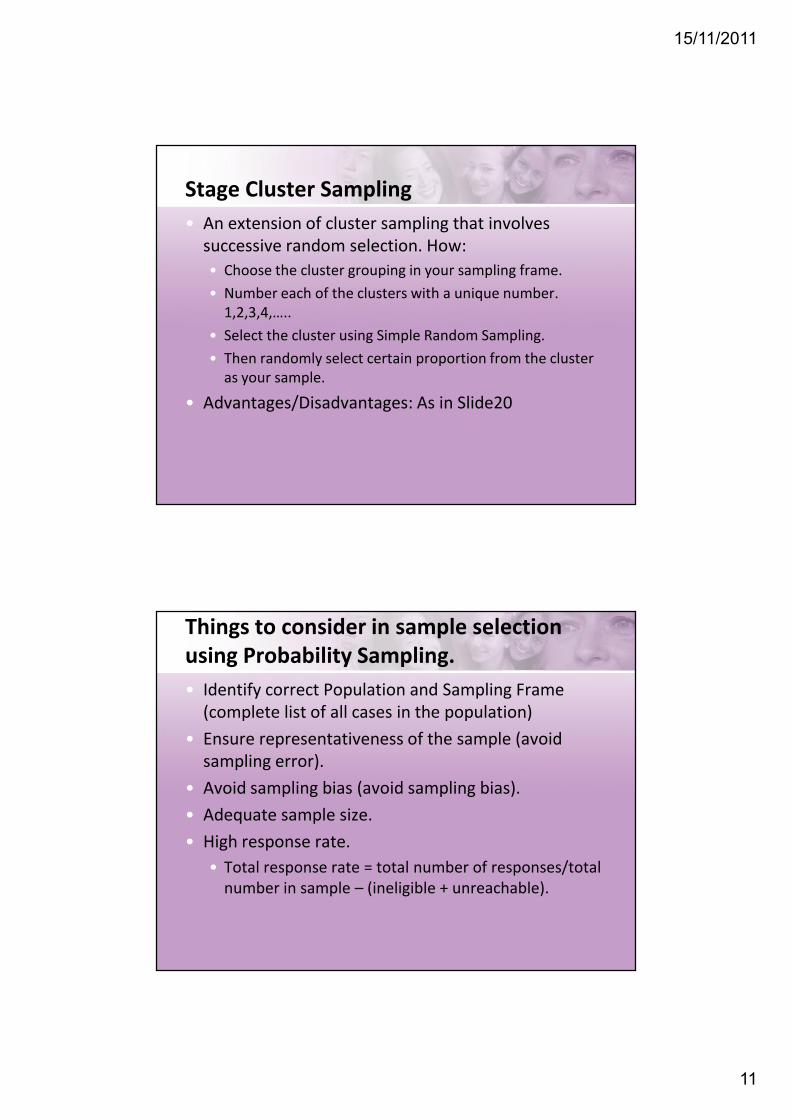
Stage Cluster Sampling• An extension of cluster sampling that involves
successive random selection. How:• Choose the cluster grouping in your sampling frame.• Number each of the clusters with a unique number.
1,2,3,4,…..• Select the cluster using Simple Random Sampling.• Then randomly select certain proportion from the cluster
as your sample.
• Advantages/Disadvantages: As in Slide20
Things to consider in sample selectionusing Probability Sampling.• Identify correct Population and Sampling Frame
(complete list of all cases in the population)• Ensure representativeness of the sample (avoid
sampling error).• Avoid sampling bias (avoid sampling bias).• Adequate sample size.• High response rate.
• Total response rate = total number of responses/totalnumber in sample – (ineligible + unreachable).
15/11/2011
12
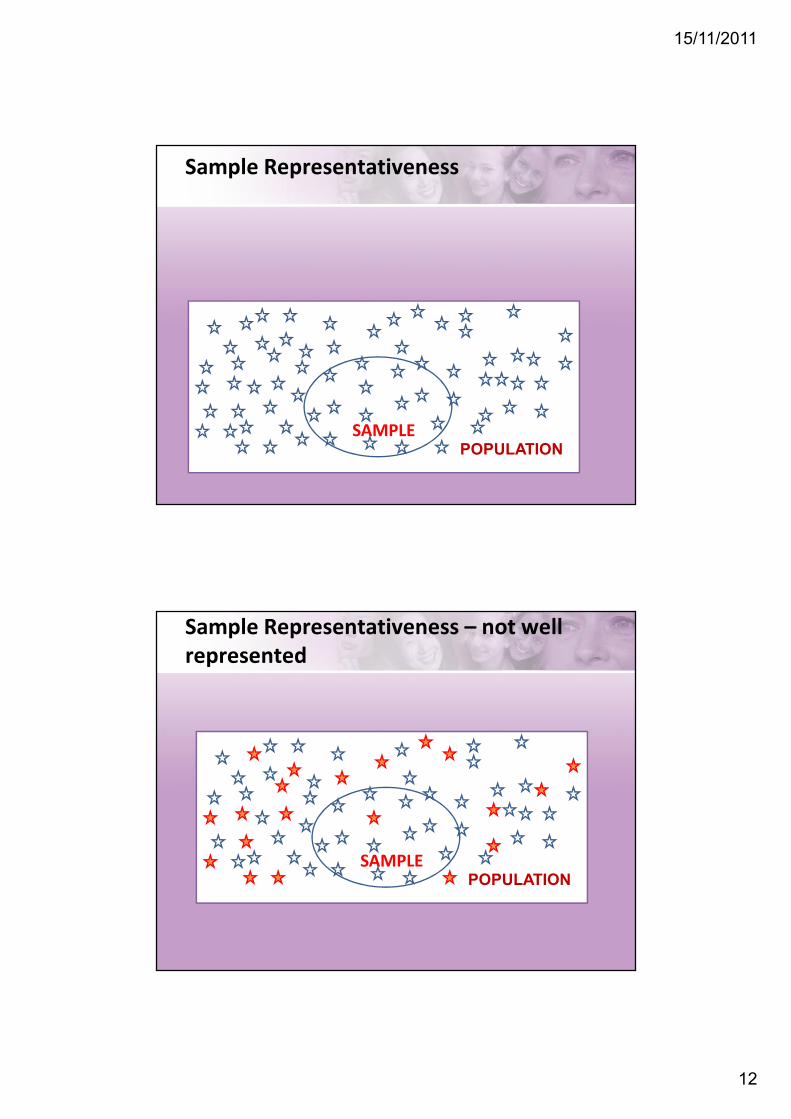
SAMPLEPOPULATION
Sample Representativeness
Sample Representativeness – not wellrepresented
SAMPLEPOPULATION
15/11/2011
13
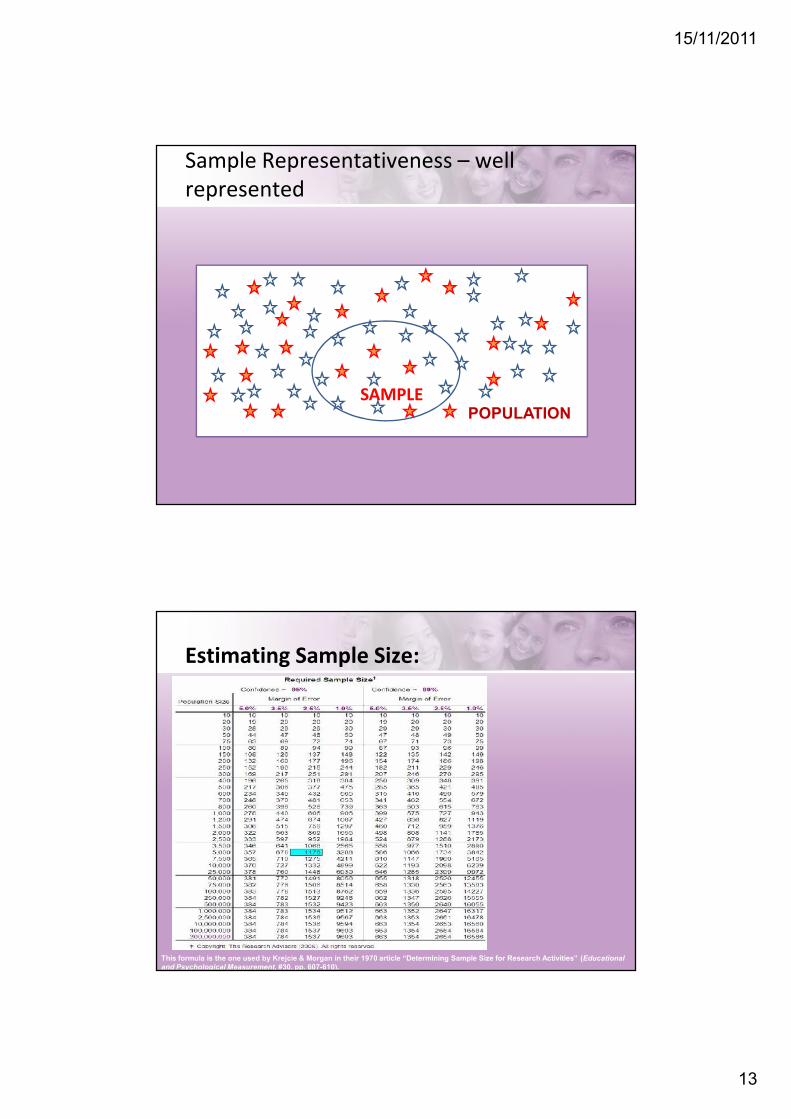
SAMPLEPOPULATION
Sample Representativeness – wellrepresented
Estimating Sample Size:
This formula is the one used by Krejcie & Morgan in their 1970 article “Determining Sample Size for Research Activities” (Educationaland Psychological Measurement, #30, pp. 607-610).
15/11/2011
14
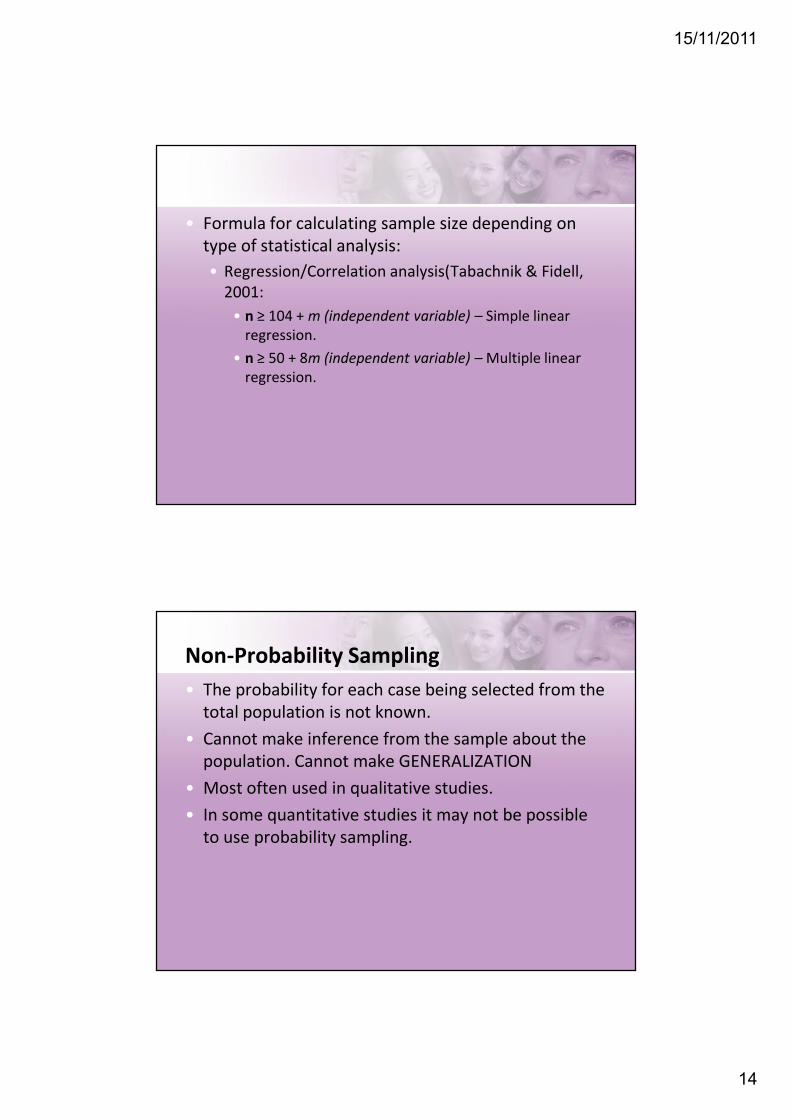
• Formula for calculating sample size depending ontype of statistical analysis:• Regression/Correlation analysis(Tabachnik & Fidell,
2001:• n ≥ 104 + m (independent variable) – Simple linear
regression.• n ≥ 50 + 8m (independent variable) – Multiple linear
regression.
Non-Probability Sampling• The probability for each case being selected from the
total population is not known.• Cannot make inference from the sample about the
population. Cannot make GENERALIZATION• Most often used in qualitative studies.• In some quantitative studies it may not be possible
to use probability sampling.
15/11/2011
15
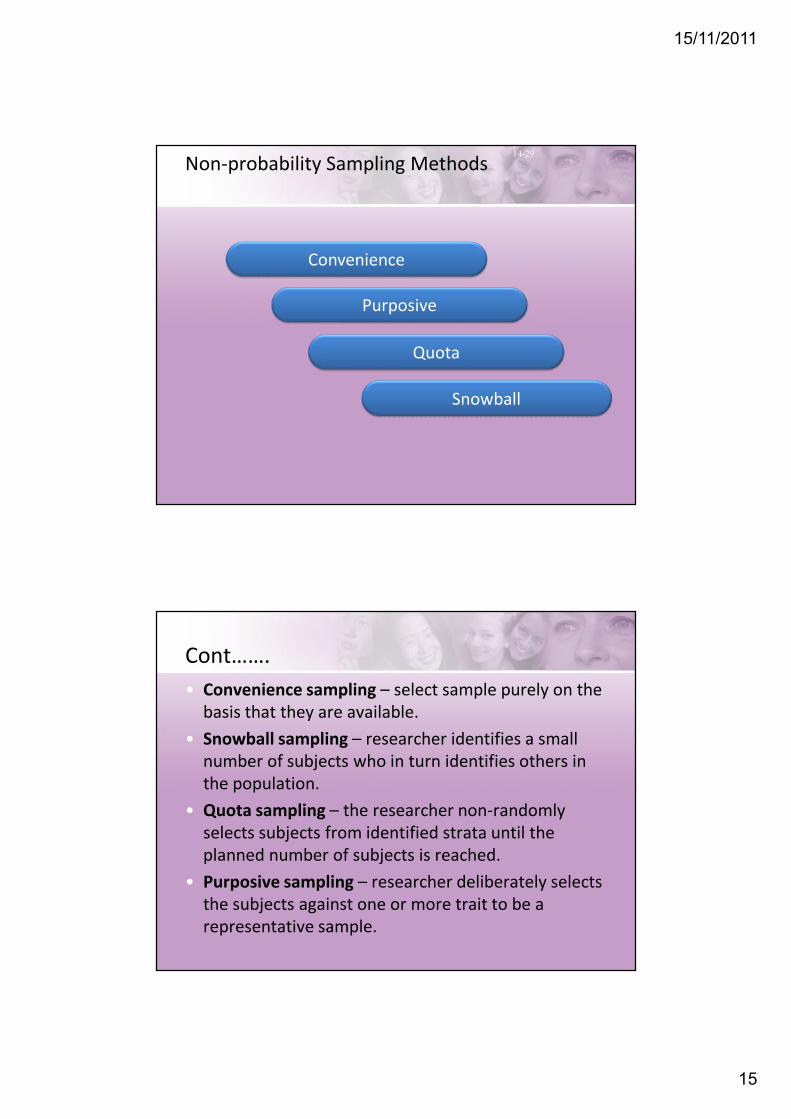
14-29Non-probability Sampling Methods
Convenience
Purposive
Quota
Snowball
Cont…….• Convenience sampling – select sample purely on the
basis that they are available.• Snowball sampling – researcher identifies a small
number of subjects who in turn identifies others inthe population.
• Quota sampling – the researcher non-randomlyselects subjects from identified strata until theplanned number of subjects is reached.
• Purposive sampling – researcher deliberately selectsthe subjects against one or more trait to be arepresentative sample.
15/11/2011
16
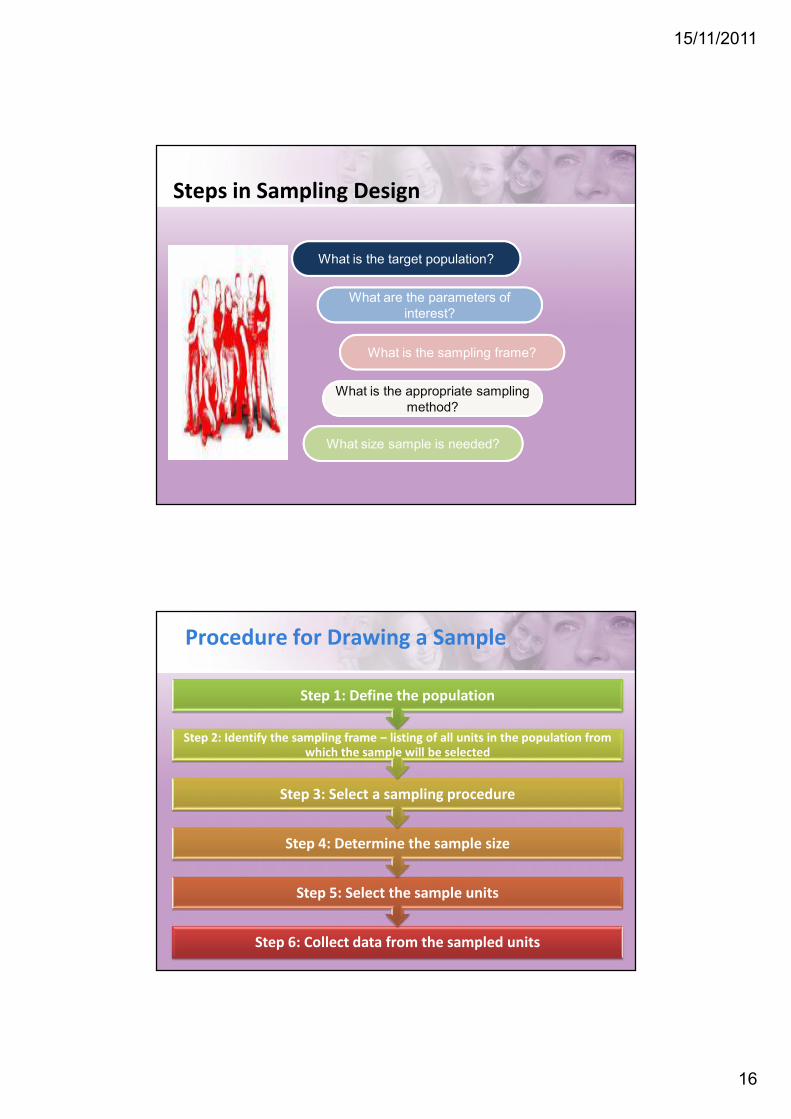
Steps in Sampling Design
What is the target population?What is the target population?
What are the parameters ofinterest?
What are the parameters ofinterest?
What is the sampling frame?What is the sampling frame?
What is the appropriate samplingmethod?
What is the appropriate samplingmethod?
What size sample is needed?What size sample is needed?
Procedure for Drawing a Sample
Step 6: Collect data from the sampled units
Step 5: Select the sample units
Step 4: Determine the sample size
Step 3: Select a sampling procedure
Step 2: Identify the sampling frame – listing of all units in the population fromwhich the sample will be selected
Step 1: Define the population