SAMPLE - ROI Business Continuity Assessing Program Effectiveness · ROI – Business ... data on...
35
SAMPLE – NOT REAL DATA Prepared by BC Management, Inc. 2011 - SAMPLE - ROI – Business Continuity Assessing Program Effectiveness Benchmarking. Plan Ahead. Be Ahead.
Transcript of SAMPLE - ROI Business Continuity Assessing Program Effectiveness · ROI – Business ... data on...
SAMPLE – NOT REAL DATA
Prepared by BC Management, Inc.
2011
- SAMPLE - ROI – Business Continuity
Assessing Program Effectiveness
Benchmarking. Plan Ahead. Be Ahead.

Copyright ©2011 BC Management, Inc. All rights reserved. SAMPLE REPORT - ROI
Page 2
Table of Contents
Introduction 3
Reporting History 3
Study Methodology 3
Assessment of Data & Reporting 4
Participant Data & Respondent Characteristics ~ An overview of respondent characteristics. 4-9
Business Continuity - Return on Investment - Awareness Study Topics 10-29
Business Continuity - Perception and Management View
Why Plan 10
Importance of Assessing the Value of the Business Continuity Program by Program Maturity 11
Management’s View of Business Continuity Program 12
Frequency of Executive Review by Program Maturity 13
View of Business Continuity Program – Cost of Doing Business by Program Maturity 14
View of Business Continuity Program – Value/ Investment by Program Maturity 15
Measuring Program Effectiveness
Methods to Justify Business Continuity Program by Program Maturity 16
Hard Dollar Costs in Measuring Program’s Effectiveness by Program Maturity 17
Soft Dollar Costs in Measuring Program’s Effectiveness by Program Maturity 18
What to include when Measuring Program Effectiveness by Program Maturity 19
Business Continuity Program Expenditures
Average Business Continuity Program Budget 20
Business Continuity Budget Line Expenditures 21
Estimated Financial Loss
Estimated Financial Loss by Hours of Downtime 22
Actual Impact from Events
Impact to Employees by Event 23
Impact to the Business by Event 24
Business Resumption Period by Event 25
Financial Loss by Event 26
Financial Benefit
Success Factors from Program Activation 27
Estimated Financial Benefit from Business Continuity Program by Program Maturity 28
Calculating Return on Investment (ROI)
Percent of Respondents who calculate Return on Investment by Program Maturity 29
What is the Formula Calculation, if a Formula is used to Calculate the Return on Investment (Open Text Responses from Study
30
Thank you to BC Management’s International Benchmarking Advisory Board 31
Thank you to our Sponsors and those Organizations who Distributed the Study and/or Report 31-33
About BC Management, Inc. & Where to Download Complimentary Reports 33
Customize a Report Exclusively for your Organization 34-35
Sample Report
This is a sample report. As such, the information within this report is NOT real data. The purpose of this report is
to provide an understanding of the data that is supplied in the ROI report. Please contact BC Management if you
would like to order the ROI report – [email protected]. A full listing of our available reports is also
available at http://www.bcmanagement.com/program-management-research-data.html.

Copyright ©2011 BC Management, Inc. All rights reserved. SAMPLE REPORT - ROI
Page 3
Since 2001 BC Management, Inc. has been gathering data on business continuity management programs and compensations to provide
professionals with the information they need to elevate their programs. Each year our organization strives to improve upon the study
questions, distribution of the study and the reporting of the data collected. Below is a timeline detailing BC Management’s eight years of
business continuity reporting expertise.
* The advisory board is composed of 20 international thought leaders coming from the United States of America, Canada, Latin America, the United Kingdom, Singapore, Australia, China, Japan, and India. Our board encompasses not only business continuity, but also risk management, emergency management, high availability and environmental health and safety.
The on-line study was developed by the BC Management team in conjunction with the BC Management International Benchmarking
Advisory Board. WorldAPP Key Survey, an independent company from BC Management, maintains the study and assesses the data
collected. The study was launched in March of 2010 and the study remained open for the duration of 2010. Participants were notified of
the study primarily through e-newsletters and notifications from BC Management and from many other industry organizations. A full list of
participating organizations is included within this report. The study has been translated in 5 languages and it accommodates professionals
who are permanently employed on a full-time or part-time basis, self-employed as an independent contractor or unemployed.
Respondents receive a unique path of branching questions, which is dependent upon their experience and employment status. The
advanced study is coded with extensive JAVA script to ensure a correct question branching path and to eliminate unintelligible data. The
comprehensive study is comprised of two sections spanning over 100 questions. The first section focuses on the factors that impact
compensations within the business continuity and related professions. The second section focuses on the business continuity program
management initiatives, which includes budgets, dedicated personnel, organizational reporting structure, maturity of the program,
exercises, auditing, vendor utilization, program activation during an event and much more. Respondents to the study have the option to
complete one or both sections. Only those respondents who manage a program within business continuity or a related discipline qualify to
complete the program management portion of the study. All participants are given the option of keeping their identity confidential.
2001 - First BC Management Study Launched
•BC Management's first annual business continuity management study was launched. The study focused exclusively on the factors that impact compensations within business continuity and related disciplines.
2005 - Program Management Section Added
•The study expanded to also include issues of importance in managing a business continuity program.
•BC Management published the first Business Continuity Management Benchmarking report.
2006 - Study Gained International Recognition
•BC Management launched an international distribution campaign to increase respondents worldwide.
•For the first time BC Management published customized business continuity compensation reports for Canada, the United Kingdom, India, and Asia Pacific.
•BC Management began offering customized program management benchmarking reports tailored to a companies specifications including, but not limited to industry, revenue, number of company employees and or number of company locations.
2009 - Study Elevated with Benchmarking Advisory Board and Advancement in Reporting
•The BC Management International Benchmarking Advisory Board * was formed to review the study and reporting to ensure it reflects topics of importance.
•WorldAPP Key Survey, a leader in survey technology, was selected to host the on-line study and assess the data. The reporting technology built into the study has significantly enhanced our ab ility to assess the data and thus given BC Management the ability to offer a true business intelligence dashboard assessment tool tailored for business continuity.
•The study was distributed in 5 languages, including: English, Spanish, French, Japanese and Chinese.
Reporting History
Study Methodology
Copyright ©2011 BC Management, Inc. All rights reserved. SAMPLE REPORT - ROI
Page 4
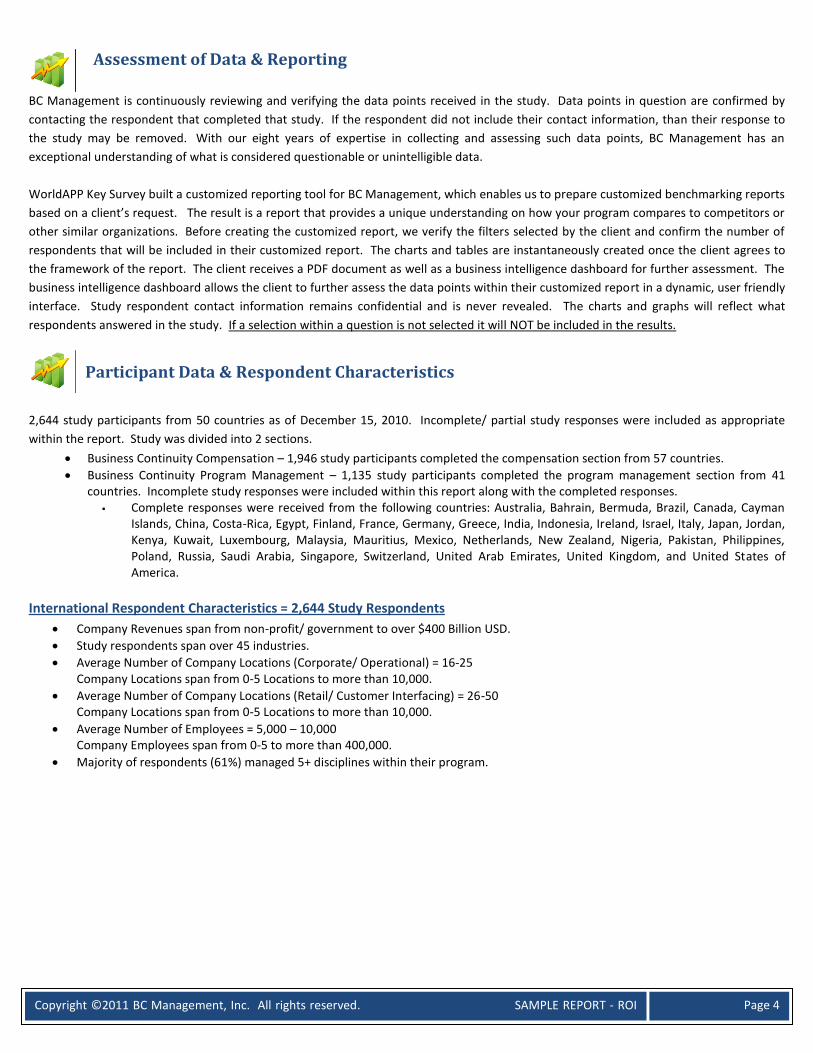
BC Management is continuously reviewing and verifying the data points received in the study. Data points in question are confirmed by
contacting the respondent that completed that study. If the respondent did not include their contact information, than their response to
the study may be removed. With our eight years of expertise in collecting and assessing such data points, BC Management has an
exceptional understanding of what is considered questionable or unintelligible data.
WorldAPP Key Survey built a customized reporting tool for BC Management, which enables us to prepare customized benchmarking reports
based on a client’s request. The result is a report that provides a unique understanding on how your program compares to competitors or
other similar organizations. Before creating the customized report, we verify the filters selected by the client and confirm the number of
respondents that will be included in their customized report. The charts and tables are instantaneously created once the client agrees to
the framework of the report. The client receives a PDF document as well as a business intelligence dashboard for further assessment. The
business intelligence dashboard allows the client to further assess the data points within their customized report in a dynamic, user friendly
interface. Study respondent contact information remains confidential and is never revealed. The charts and graphs will reflect what
respondents answered in the study. If a selection within a question is not selected it will NOT be included in the results.
2,644 study participants from 50 countries as of December 15, 2010. Incomplete/ partial study responses were included as appropriate
within the report. Study was divided into 2 sections.
Business Continuity Compensation – 1,946 study participants completed the compensation section from 57 countries.
Business Continuity Program Management – 1,135 study participants completed the program management section from 41 countries. Incomplete study responses were included within this report along with the completed responses.
Complete responses were received from the following countries: Australia, Bahrain, Bermuda, Brazil, Canada, Cayman Islands, China, Costa-Rica, Egypt, Finland, France, Germany, Greece, India, Indonesia, Ireland, Israel, Italy, Japan, Jordan, Kenya, Kuwait, Luxembourg, Malaysia, Mauritius, Mexico, Netherlands, New Zealand, Nigeria, Pakistan, Philippines, Poland, Russia, Saudi Arabia, Singapore, Switzerland, United Arab Emirates, United Kingdom, and United States of America.
International Respondent Characteristics = 2,644 Study Respondents
Company Revenues span from non-profit/ government to over $400 Billion USD.
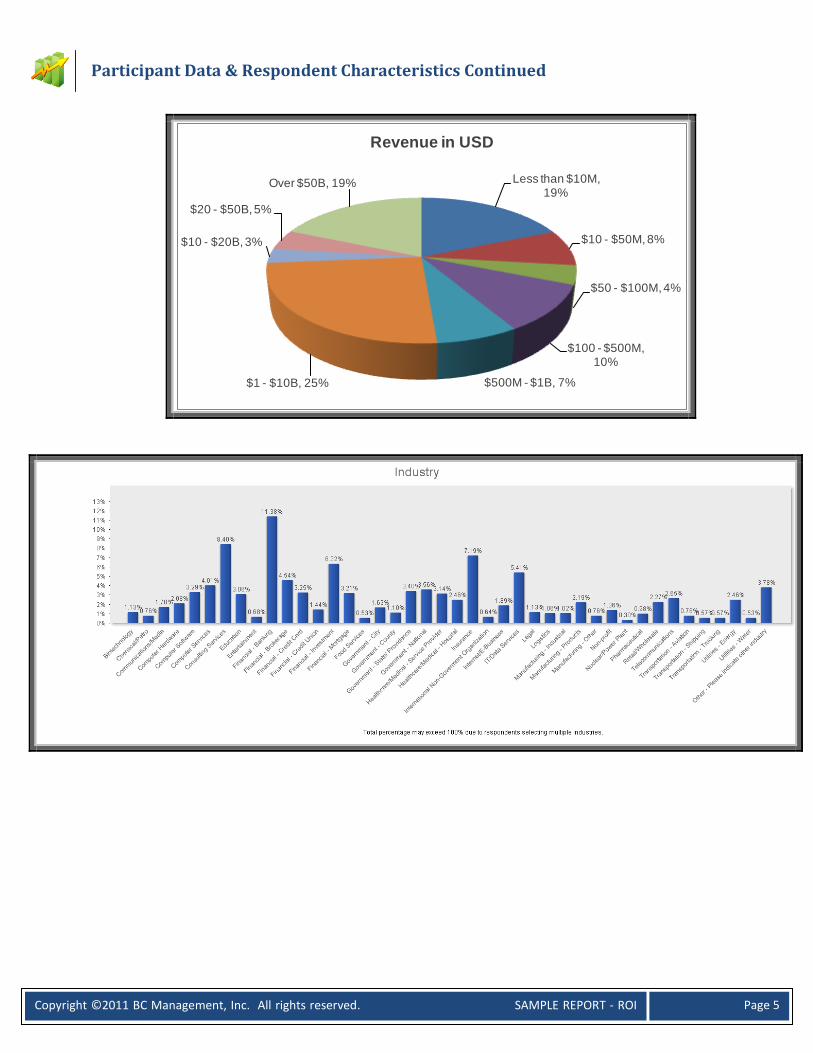
Study respondents span over 45 industries.
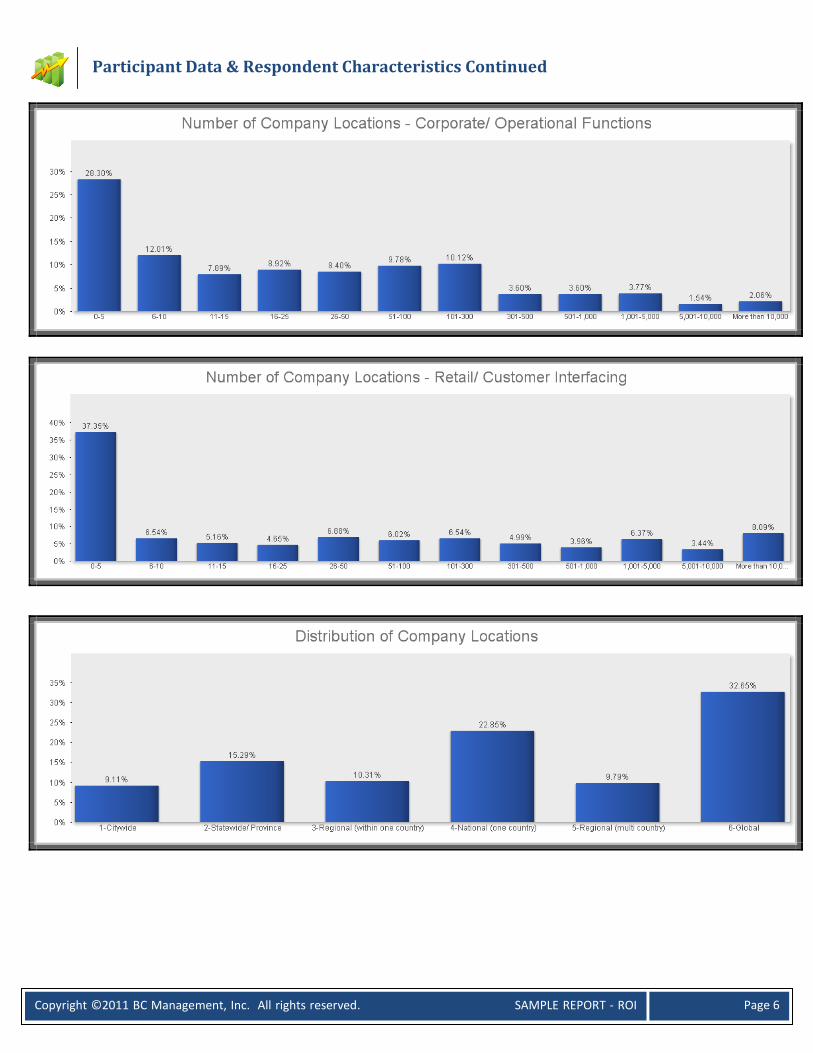
Average Number of Company Locations (Corporate/ Operational) = 16-25 Company Locations span from 0-5 Locations to more than 10,000.
Average Number of Company Locations (Retail/ Customer Interfacing) = 26-50 Company Locations span from 0-5 Locations to more than 10,000.
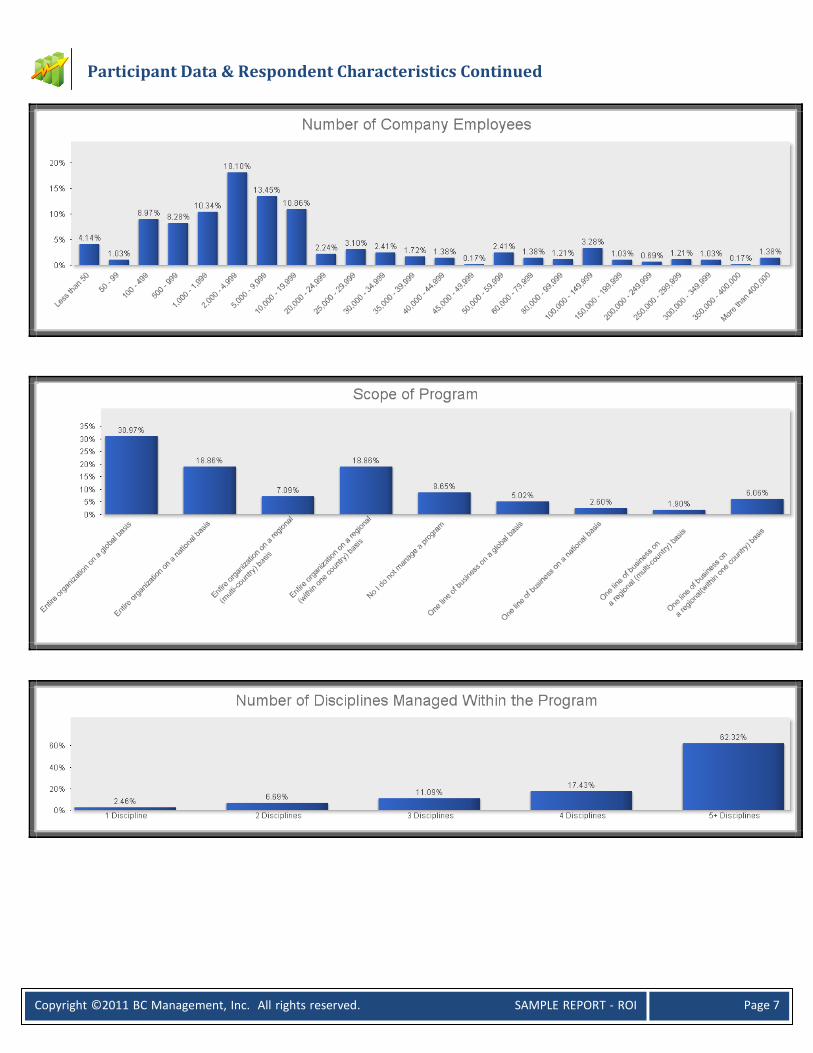
Average Number of Employees = 5,000 – 10,000 Company Employees span from 0-5 to more than 400,000.
Majority of respondents (61%) managed 5+ disciplines within their program.
Assessment of Data & Reporting
Participant Data & Respondent Characteristics
Copyright ©2011 BC Management, Inc. All rights reserved. SAMPLE REPORT - ROI
Page 5
Less than $10M, 19%
$10 - $50M, 8%
$50 - $100M, 4%
$100 - $500M, 10%
$500M - $1B, 7%$1 - $10B, 25%
$10 - $20B, 3%
$20 - $50B, 5%
Over $50B, 19%
Revenue in USD
Participant Data & Respondent Characteristics Continued
Copyright ©2011 BC Management, Inc. All rights reserved. SAMPLE REPORT - ROI
Page 6
Participant Data & Respondent Characteristics Continued
Copyright ©2011 BC Management, Inc. All rights reserved. SAMPLE REPORT - ROI
Page 7
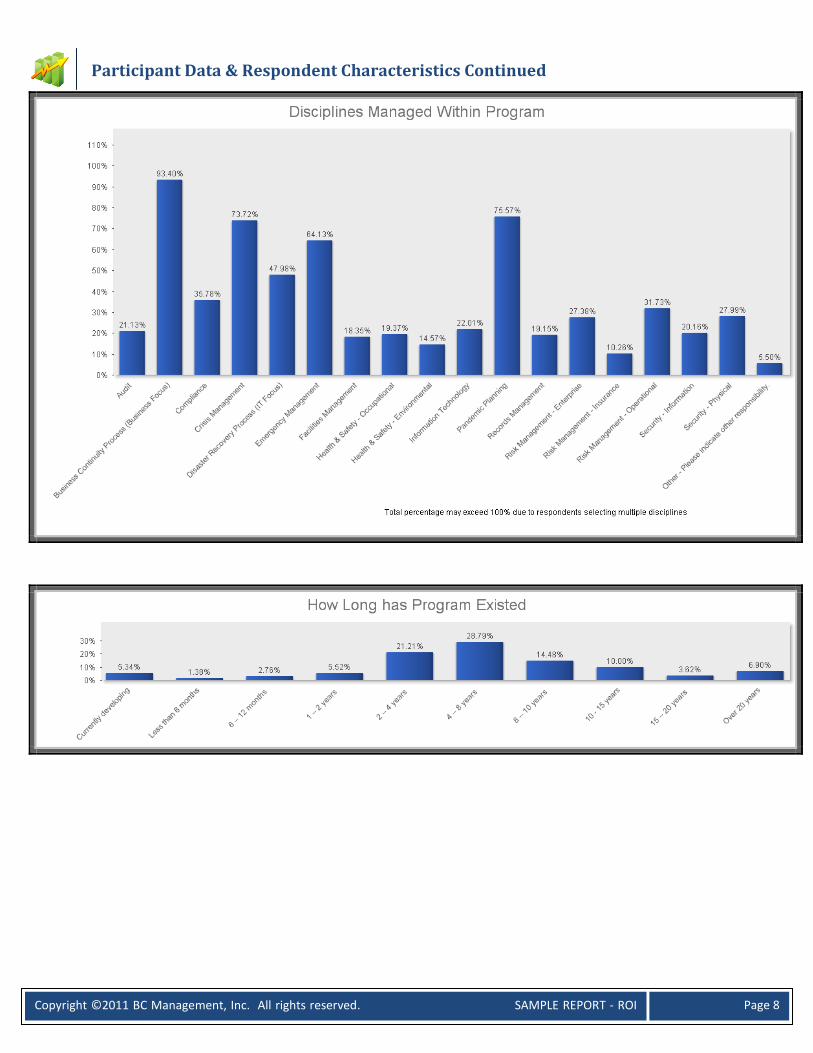
Participant Data & Respondent Characteristics Continued
Copyright ©2011 BC Management, Inc. All rights reserved. SAMPLE REPORT - ROI
Page 8
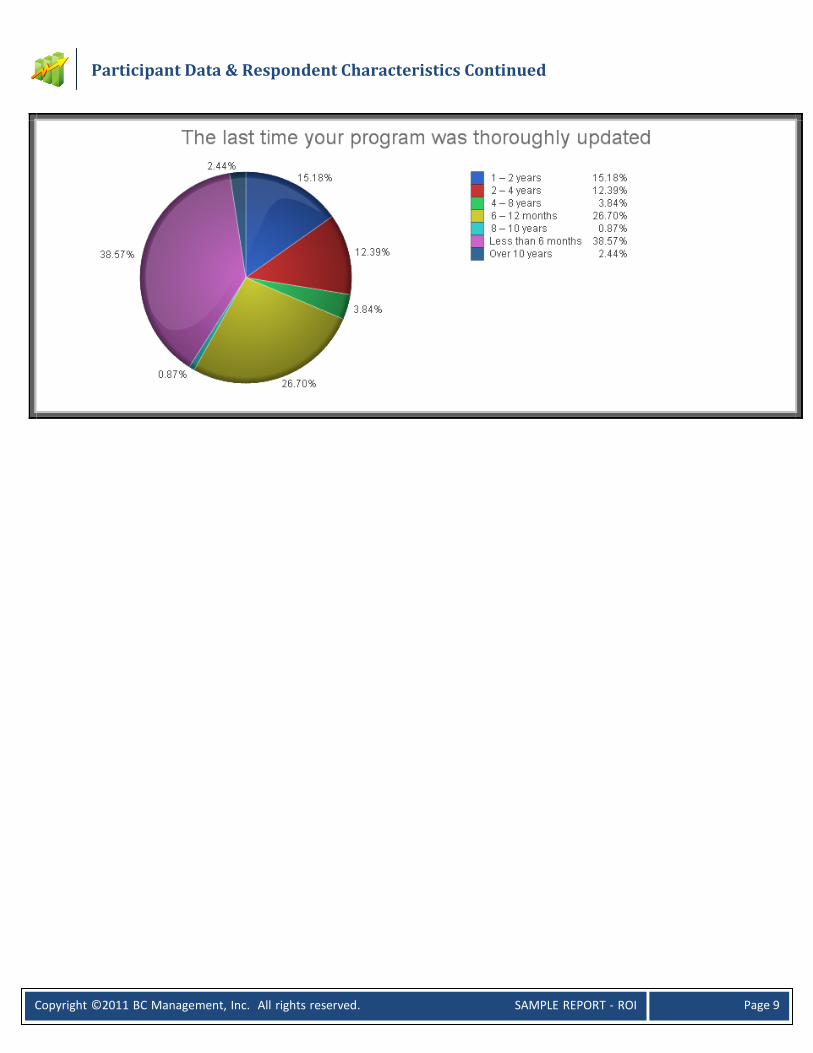
Participant Data & Respondent Characteristics Continued
Copyright ©2011 BC Management, Inc. All rights reserved. SAMPLE REPORT - ROI
Page 9
Participant Data & Respondent Characteristics Continued
Copyright ©2011 BC Management, Inc. All rights reserved. SAMPLE REPORT - ROI
Page 10
0% 20% 40% 60% 80% 100%
History of business interruption(s)
Minimize future impact
Protect stakeholders
Comply with regulations or laws
In response to audit results/recommendations
Good business sense
Right thing to do
Customer requirement
Contractual agreements/service-level agreements
Insurance policy recommendation
Organization wants to be globally competitive and must comply with
international standards.
Organization wants to be perceived to be compliant with good Corporate Governance.
Organization wants to ensure safety of their employees.
Organization wants to protect and increase its economic value.
Protection of reputation and brand of organization.
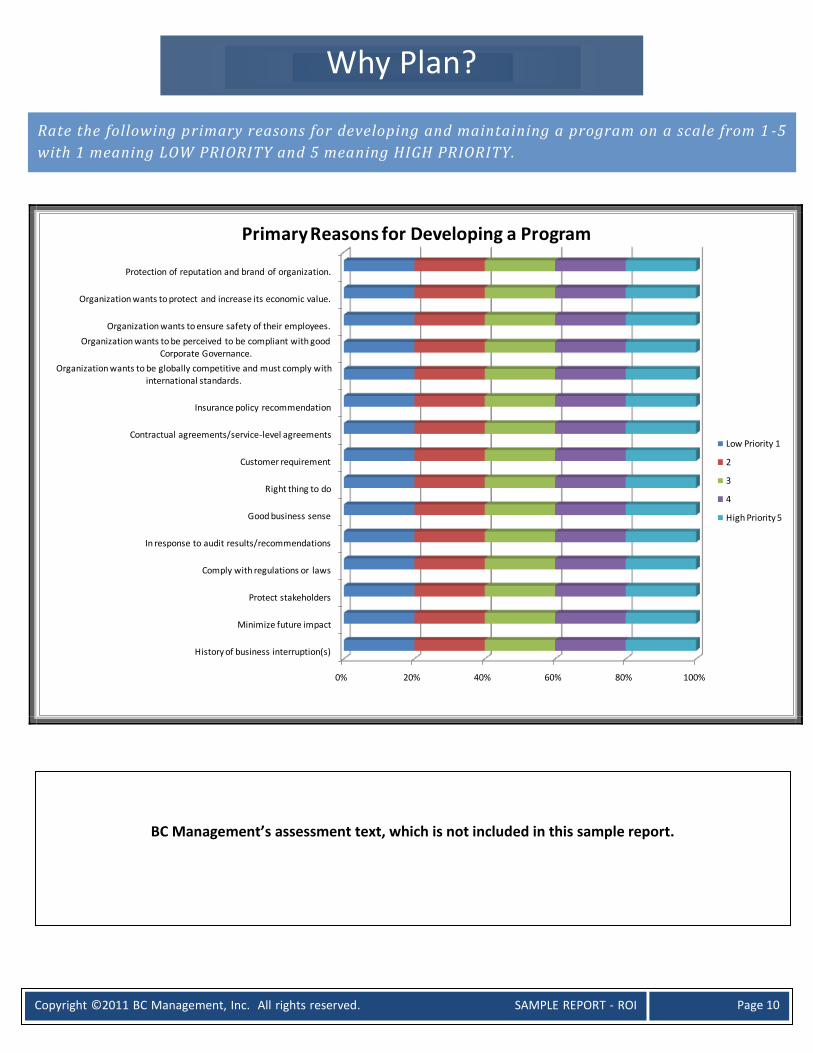
Primary Reasons for Developing a Program
Low Priority 1
2
3
4
High Priority 5
Why Plan?
Rate the following primary reasons for developing and maintaining a program on a scale from 1 -5
with 1 meaning LOW PRIORITY and 5 meaning HIGH PRIORITY.
BC Management’s assessment text, which is not included in this sample report.
Copyright ©2011 BC Management, Inc. All rights reserved. SAMPLE REPORT - ROI
Page 11
0%
5%
10%
15%
20%
25%
Depends on executive commitment to BCM
Lack of interest in assessing the BCM program’s value
Necessary to gain executive approval
Part of corporate culture
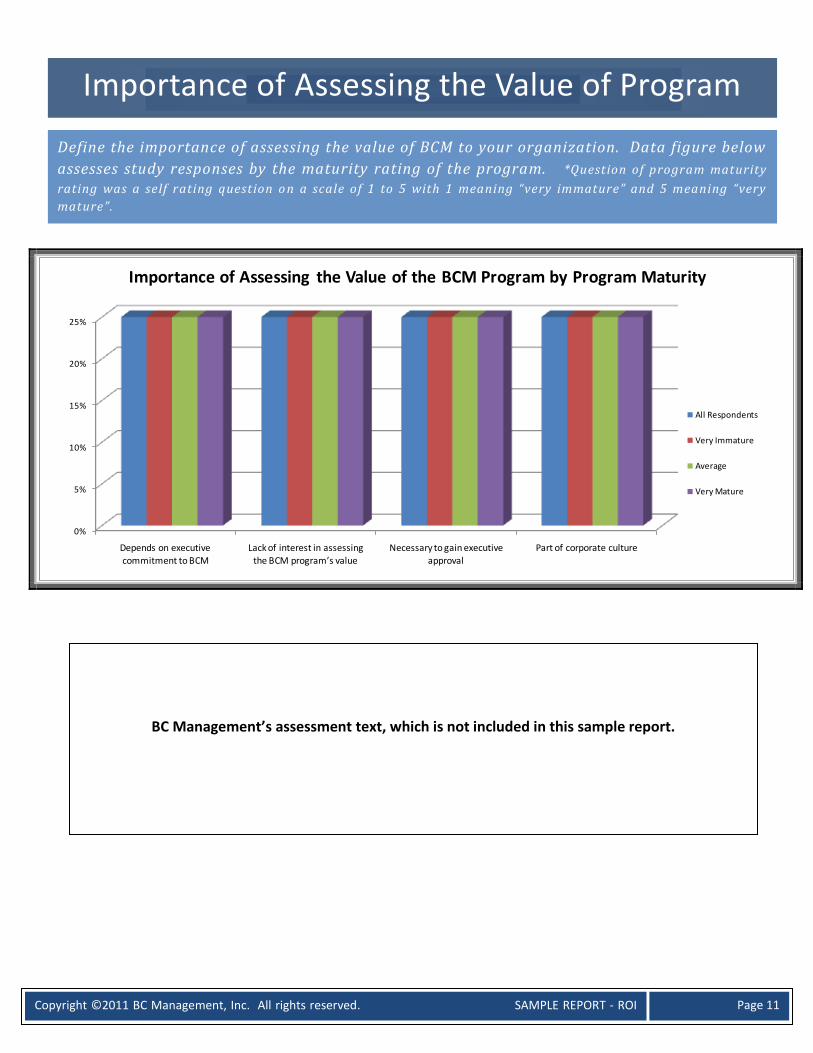
Importance of Assessing the Value of the BCM Program by Program Maturity
All Respondents
Very Immature
Average
Very Mature
Define the importance of assessing the value of BCM to your organization. Data figure below
assesses study responses by the maturity rating of the program. *Question of program maturity
rating was a self rating question o n a scale of 1 to 5 with 1 meaning “very immature” and 5 meaning “very
mature”.
Importance of Assessing the Value of Program
BC Management’s assessment text, which is not included in this sample report.
Copyright ©2011 BC Management, Inc. All rights reserved. SAMPLE REPORT - ROI
Page 12
0% 25% 50% 75% 100%
It is important to include ROI measurements within an annual business continuity report to senior management (actual
savings from disasters or estimated organizational savings)
Senior management cares more about risk identification and assessment (proactive planning) than recovery and
resumption (reactive planning).
Senior management teams who have gone through a real disaster or an incident understand the value of BCP better than those who have not gone through a disaster or an …
The real value of BCP is integrating BCP principles with existing management processes so management teams can make cost
effective risk intelligent decisions, not in developing plans …
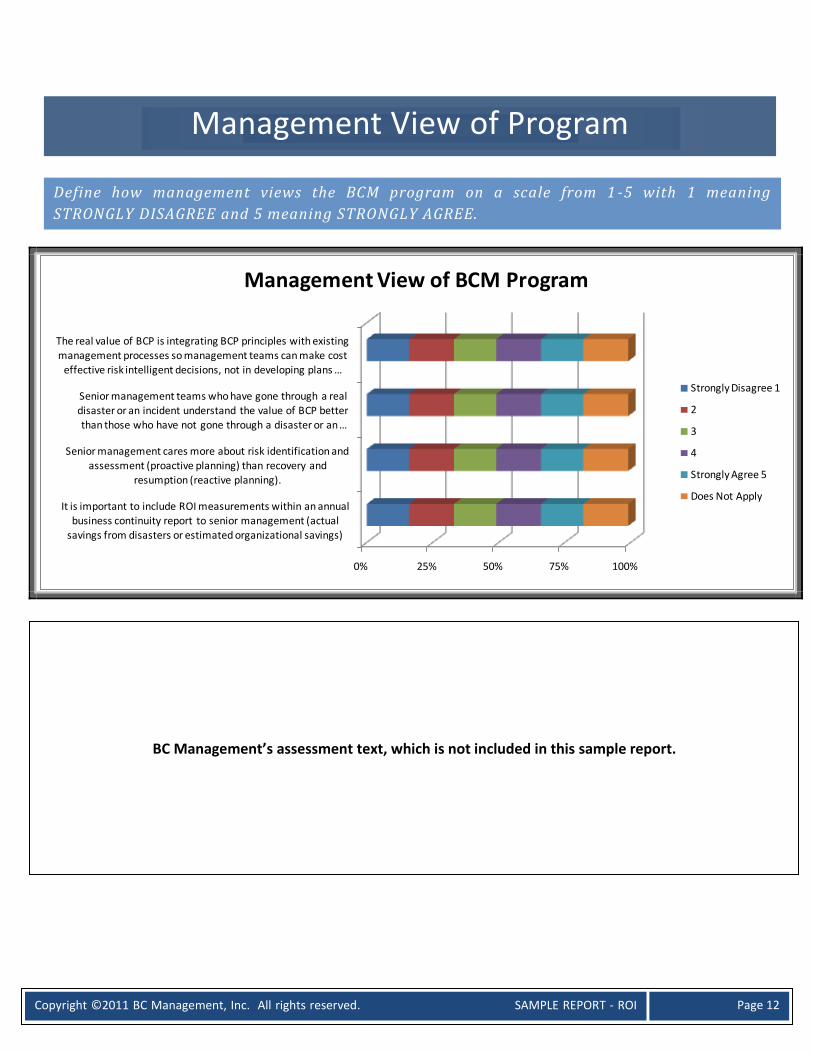
Management View of BCM Program
Strongly Disagree 1
2
3
4
Strongly Agree 5
Does Not Apply
Define how management views the BCM program on a scale from 1 -5 with 1 meaning
STRONGLY DISAGREE and 5 meaning STRONGLY AGREE.
BC Management’s assessment text, which is not included in this sample report.
Management View of Program
Copyright ©2011 BC Management, Inc. All rights reserved. SAMPLE REPORT - ROI
Page 13
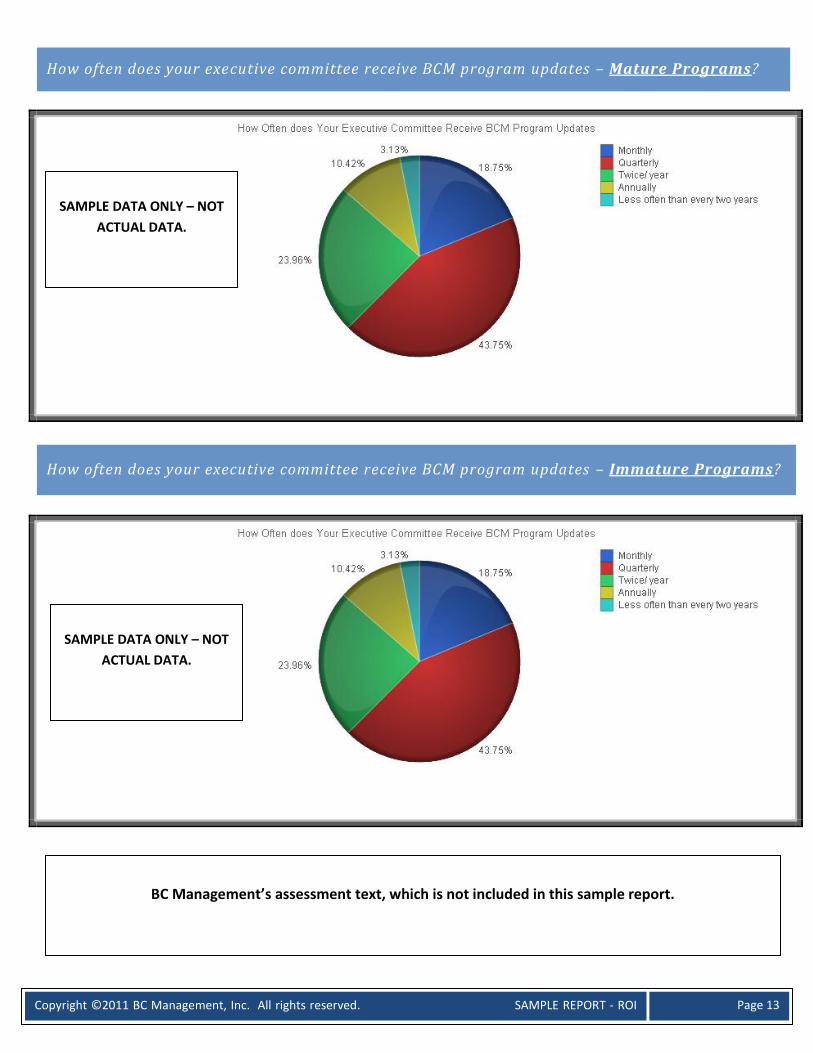
How often does your executive committee receive BCM program updates – Mature Programs?
How often does your executive committee receive BCM program updates – Immature Programs?
BC Management’s assessment text, which is not included in this sample report.
SAMPLE DATA ONLY – NOT
ACTUAL DATA.
SAMPLE DATA ONLY – NOT
ACTUAL DATA.
Copyright ©2011 BC Management, Inc. All rights reserved. SAMPLE REPORT - ROI
Page 14
0% 10% 20% 30% 40% 50% 60% 70% 80% 90% 100%
All Respondents
Very Immature
Average
Very Mature
All Respondents
Very Immature
Average
Very Mature
All Respondents
Very Immature
Average
Very Mature
All Respondents
Very Immature
Average
Very Mature
All Respondents
Very Immature
Average
Very Mature
Bu
sin
ess
con
tin
uit
y p
lan
nin
g is
a
cost
of
do
ing
bu
sin
ess
an
d
ne
ed
s to
be
q
uan
tifi
ed.
Bus
ines
s
cont
inui
ty
plan
ning
will
be
succ
essf
ul a
nd
sust
aini
ng a
s
long
as
seni
or
man
agem
ent
view
s B
CP c
ost
neu
tral
.
Th
e b
usi
ne
ss
con
tin
uit
y p
rog
ram
is
mai
nta
ined
b
eca
use
ou
r
cust
om
er
con
tra
cts
req
uir
e it
.
The
prim
ary
init
iati
ve o
f the
bu
sine
ss
cont
inui
ty
prog
ram
is t
o
pass
inte
rnal
an
d/or
ext
erna
l
audi
ts.
The
mai
n
purp
ose
of t
he
busi
ness
co
ntin
uity
pr
ogra
m is
to
com
ply
wit
h le
gal
and
/or
regu
lato
ry
req
uire
men
ts.
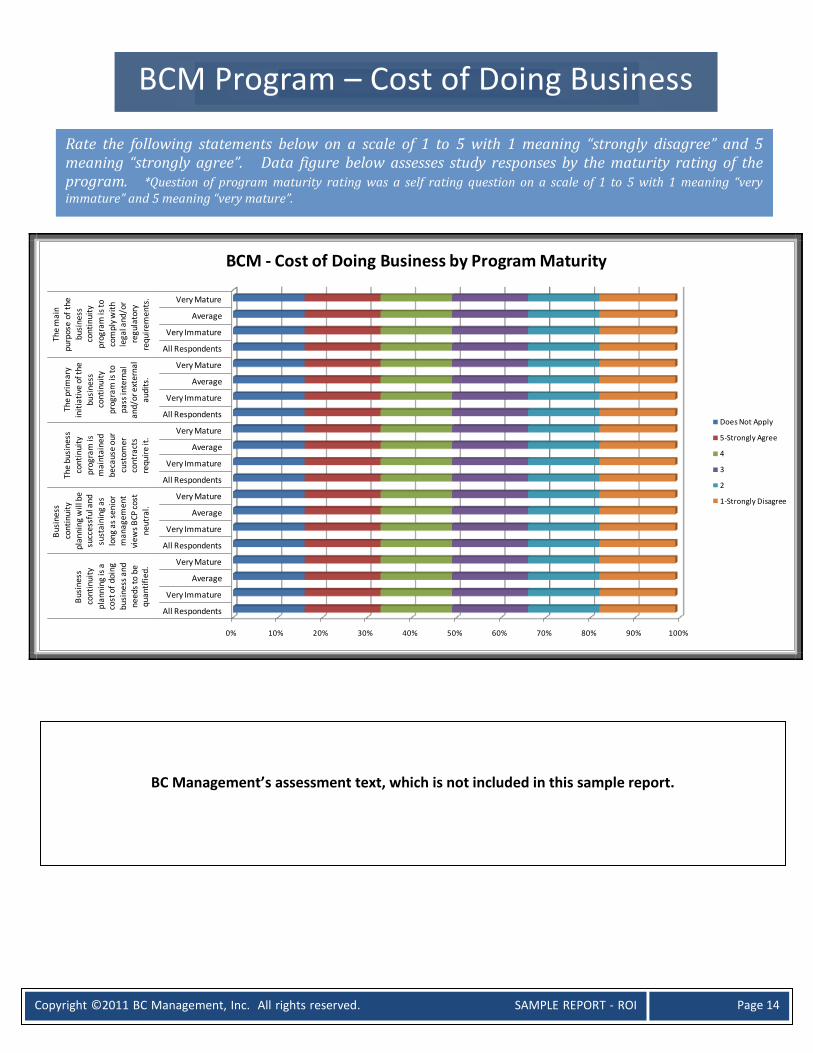
BCM - Cost of Doing Business by Program Maturity
Does Not Apply
5-Strongly Agree
4
3
2
1-Strongly Disagree
BCM Program – Cost of Doing Business
Rate the following statements below on a scale of 1 to 5 with 1 meaning “strongly disagree” and 5 meaning “strongly agree”. Data figure below assesses study responses by the maturity rating of the program. *Question of program maturity rating was a self rating question on a scale of 1 to 5 with 1 meaning “very immature” and 5 meaning “very mature”.
BC Management’s assessment text, which is not included in this sample report.
Copyright ©2011 BC Management, Inc. All rights reserved. SAMPLE REPORT - ROI
Page 15
0% 10% 20% 30% 40% 50% 60% 70% 80% 90% 100%
All Respondents
Very Immature
Average
Very Mature
All Respondents
Very Immature
Average
Very Mature
All Respondents
Very Immature
Average
Very Mature
All Respondents
Very Immature
Average
Very Mature
All Respondents
Very Immature
Average
Very Mature
It is
eas
y to
qu
anti
fy a
nd
show
val
ue o
f B
CP t
o se
nio
r m
anag
emen
t.
Sen
ior
man
agem
ent
need
s to
see
a
tang
ible
“va
lue”
for B
CP t
o be
su
cces
sful
and
su
stai
ning
.
The
valu
e of
for
disa
ster
reco
very
(dat
a ce
nter
) and
cy
ber
secu
rity
plan
ning
are
ea
sier
to
quan
tify
to
sen
ior
man
agem
ent
than
bus
ines
s re
cove
ry a
nd
inci
den
t
man
agem
ent
plan
ning
.
Inve
stin
g in
BCP
cr
eate
s a
com
peti
tive
ad
vant
age
that
is
mea
sure
able
–no
t jus
t a
cost
of
doin
g bu
sine
ss.
A “
retu
rn o
n in
vest
men
t” fo
r
reve
nue
prot
ecti
on
proj
ects
is m
ore
diff
icul
t to
quan
tify
to
seni
or
man
agem
ent
than
reve
nue
gen
erat
ing
proj
ects
.
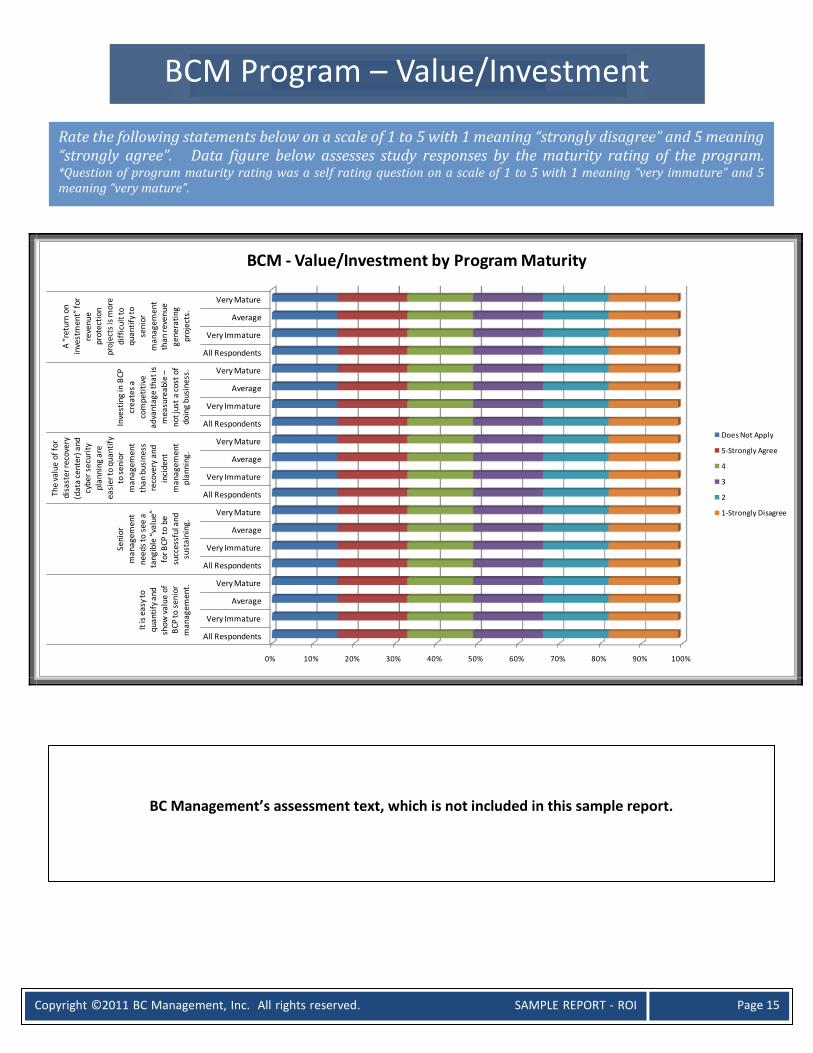
BCM - Value/Investment by Program Maturity
Does Not Apply
5-Strongly Agree
4
3
2
1-Strongly Disagree
BCM Program – Value/Investment
Rate the following statements below on a scale of 1 to 5 with 1 meaning “strongly disagree” and 5 meaning “strongly agree”. Data figure below assesses study responses by the maturity rating of the program. *Question of program maturity rating was a self rating question on a scale of 1 to 5 with 1 meaning “very immature” and 5 meaning “very mature”.
BC Management’s assessment text, which is not included in this sample report.
Copyright ©2011 BC Management, Inc. All rights reserved. SAMPLE REPORT - ROI
Page 16
0% 10% 20% 30% 40% 50% 60% 70% 80% 90% 100%
All Respondents
Very Immature
Average
Very Mature
All Respondents
Very Immature
Average
Very Mature
All Respondents
Very Immature
Average
Very Mature
All Respondents
Very Immature
Average
Very Mature
All Respondents
Very Immature
Average
Very Mature
All Respondents
Very Immature
Average
Very Mature
All Respondents
Very Immature
Average
Very Mature
Aft
er a
ctio
n re
view
s fr
om
exer
cise
s
Bus
ines
s
impa
ct
anal
ysis
, lin
king
the
prog
ram
ben
efit
s w
ith
the
orga
niza
tion
’s
key
perf
orm
ance
indi
cato
rs
Bus
ines
s un
it
owne
rshi
p
Cust
omer
te
stim
onia
ls
Ben
chm
arki
ng
sim
ilar
ind
ust
ry
com
pa
nie
sM
anag
emen
t su
rve
ys
Ris
k
Ass
essm
ent
-Id
enti
fica
tion
of
vu
lner
abili
ties
and
impa
ct to
co
mpa
ny
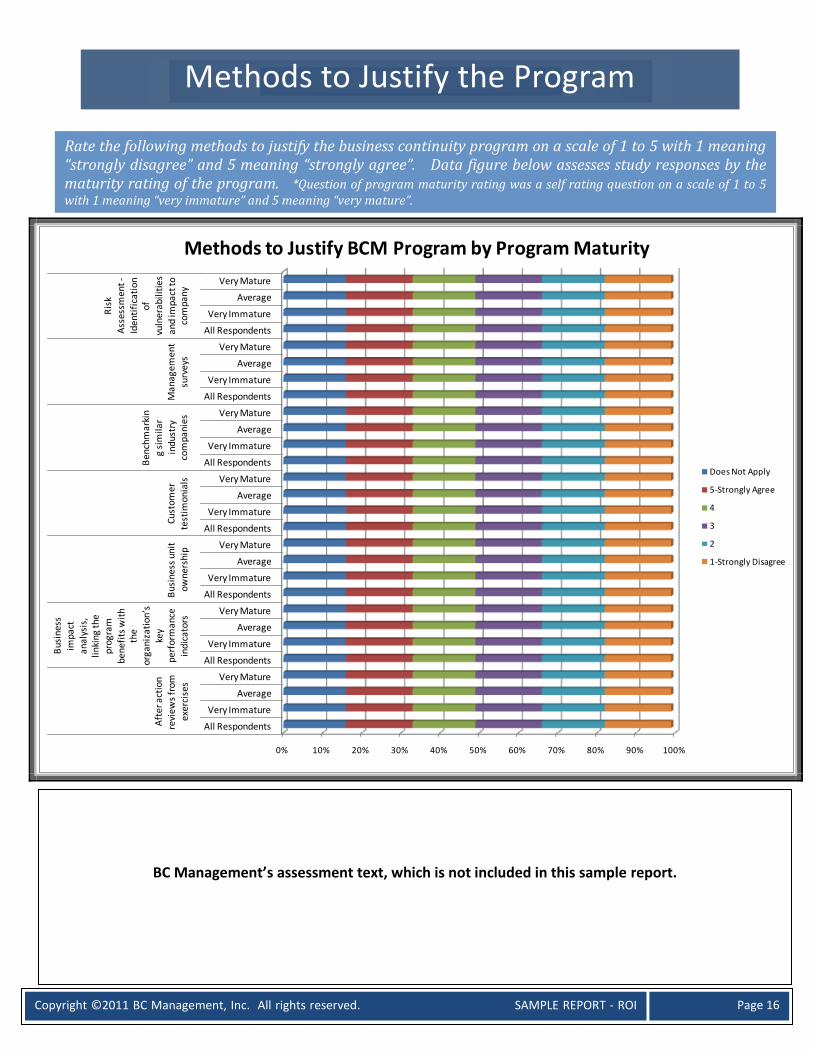
Methods to Justify BCM Program by Program Maturity
Does Not Apply
5-Strongly Agree
4
3
2
1-Strongly Disagree
Methods to Justify the Program
Rate the following methods to justify the business continuity program on a scale of 1 to 5 with 1 meaning “strongly disagree” and 5 meaning “strongly agree”. Data figure below assesses study responses by the maturity rating of the program. *Question of program maturity rating was a self rating question on a scale of 1 to 5 with 1 meaning “very immature” and 5 meaning “very mature”.
BC Management’s assessment text, which is not included in this sample report.
Copyright ©2011 BC Management, Inc. All rights reserved. SAMPLE REPORT - ROI
Page 17
0% 10% 20% 30% 40% 50% 60% 70% 80% 90% 100%
All Respondents
Very Immature
Average
Very Mature
All Respondents
Very Immature
Average
Very Mature
All Respondents
Very Immature
Average
Very Mature
All Respondents
Very Immature
Average
Very Mature
All Respondents
Very Immature
Average
Very Mature
All Respondents
Very Immature
Average
Very Mature
All Respondents
Very Immature
Average
Very Mature
Dat
a co
mm
unic
ati
on c
osts
Ener
gy c
ost
sIn
sura
nce
prem
ium
s
Op
erat
iona
l co
sts
Ove
rtim
e
Site
in
fras
truc
ture
(gen
erat
ors,
et
c)Si
te r
esil
ien
ce
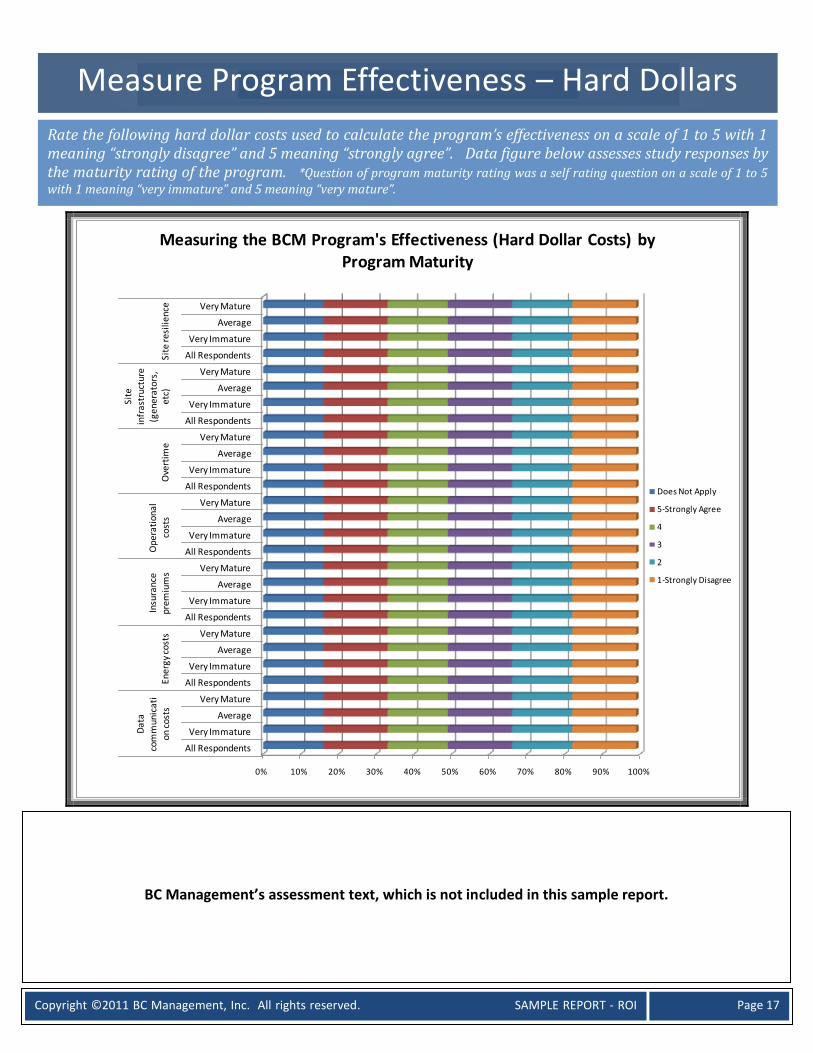
Measuring the BCM Program's Effectiveness (Hard Dollar Costs) by Program Maturity
Does Not Apply
5-Strongly Agree
4
3
2
1-Strongly Disagree
Measure Program Effectiveness – Hard Dollars
Rate the following hard dollar costs used to calculate the program’s effectiveness on a scale of 1 to 5 with 1 meaning “strongly disagree” and 5 meaning “strongly agree”. Data figure below assesses study responses by the maturity rating of the program. *Question of program maturity rating was a self rating question on a scale of 1 to 5 with 1 meaning “very immature” and 5 meaning “very mature”.
BC Management’s assessment text, which is not included in this sample report.
Copyright ©2011 BC Management, Inc. All rights reserved. SAMPLE REPORT - ROI
Page 18
0% 10% 20% 30% 40% 50% 60% 70% 80% 90% 100%
All Respondents
Very Immature
Average
Very Mature
All Respondents
Very Immature
Average
Very Mature
All Respondents
Very Immature
Average
Very Mature
All Respondents
Very Immature
Average
Very Mature
All Respondents
Very Immature
Average
Very Mature
All Respondents
Very Immature
Average
Very Mature
All Respondents
Very Immature
Average
Very Mature
Goo
dwill
Bra
nd
im
pa
ct
Mar
ket
shar
e/
Inve
stor
re
lati
ons
Cred
it
rati
ng/
Bon
d ra
ting
Rep
utat
ion/
Med
ia
cove
rage
Empl
oyee
m
oral
eD
ata
loss
Measuring the BCM program's effectiveness (Soft Dollar Costs) by Program Maturity
Does Not Apply
5-Strongly Agree
4
3
2
1-Strongly Disagree
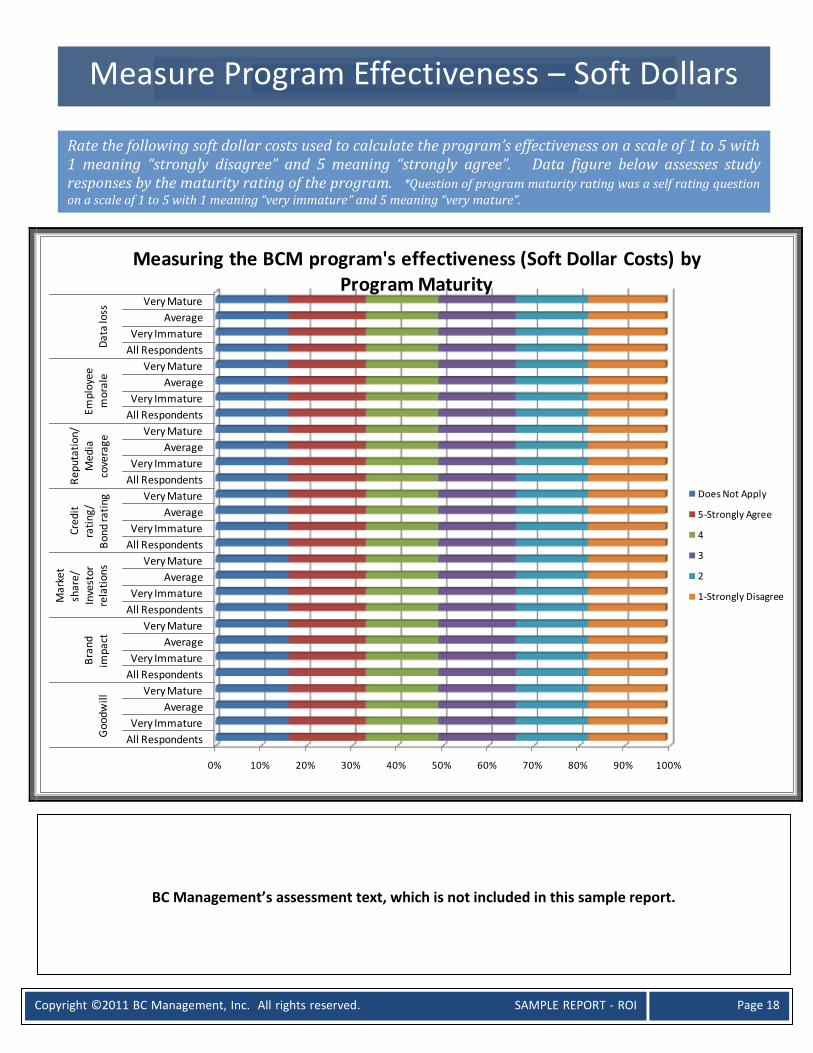
Rate the following soft dollar costs used to calculate the program’s effectiveness on a scale of 1 to 5 with 1 meaning “strongly disagree” and 5 meaning “strongly agree”. Data figure below assesses study responses by the maturity rating of the program. *Question of program maturity rating was a self rating question on a scale of 1 to 5 with 1 meaning “very immature” and 5 meaning “very mature”.
BC Management’s assessment text, which is not included in this sample report.
Measure Program Effectiveness – Soft Dollars
Copyright ©2011 BC Management, Inc. All rights reserved. SAMPLE REPORT - ROI
Page 19
0% 10% 20% 30% 40% 50% 60% 70% 80% 90% 100%
All Respondents
Very Immature
Average
Very Mature
All Respondents
Very Immature
Average
Very Mature
All Respondents
Very Immature
Average
Very Mature
All Respondents
Very Immature
Average
Very Mature
All Respondents
Very Immature
Average
Very Mature
All Respondents
Very Immature
Average
Very Mature
All Respondents
Very Immature
Average
Very Mature
All Respondents
Very Immature
Average
Very Mature
Imp
acts
Pla
n
dev
elo
pm
ent
Mai
nte
nan
ceTe
stin
gC
risi
s
com
mu
nic
ati
on
s
Ext
ern
al
ag
en
cie
sP
and
emic
Cri
tica
l su
pp
ly
cha
in
Measuring the BCM program's effectiveness by Program Maturity
Does Not Apply
5-Strongly Agree
4
3
2
1-Strongly Disagree
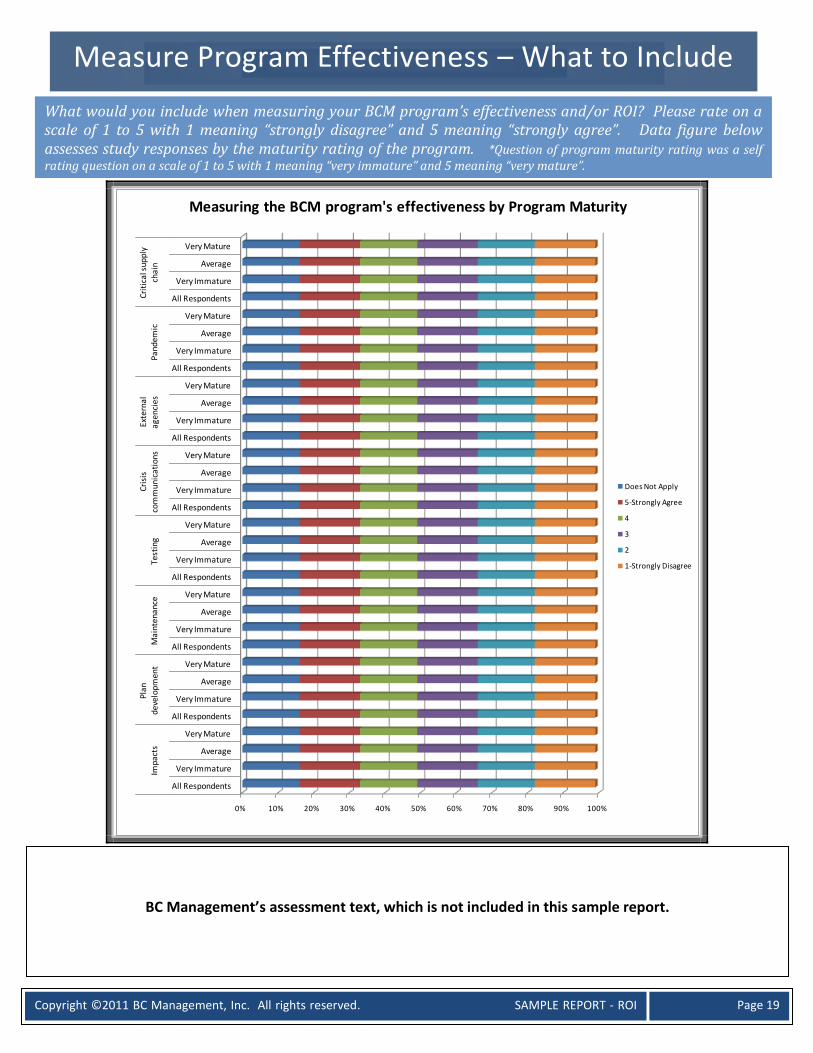
Measure Program Effectiveness – What to Include
What would you include when measuring your BCM program’s effectiveness and/or ROI? Please rate on a scale of 1 to 5 with 1 meaning “strongly disagree” and 5 meaning “strongly agree”. Data figure below assesses study responses by the maturity rating of the program. *Question of program maturity rating was a self rating question on a scale of 1 to 5 with 1 meaning “very immature” and 5 meaning “very mature”.
BC Management’s assessment text, which is not included in this sample report.
Copyright ©2011 BC Management, Inc. All rights reserved. SAMPLE REPORT - ROI
Page 20
$0
$500,000
$1,000,000
$1,500,000
$2,000,000
$2,500,000
$3,000,000
Program expenses are allocated independently from
other functions within the organization.
Program expenses are allocated to other department(s).
Program expenses do NOT have a defined budget.
$3,000,000 $3,000,000 $3,000,000
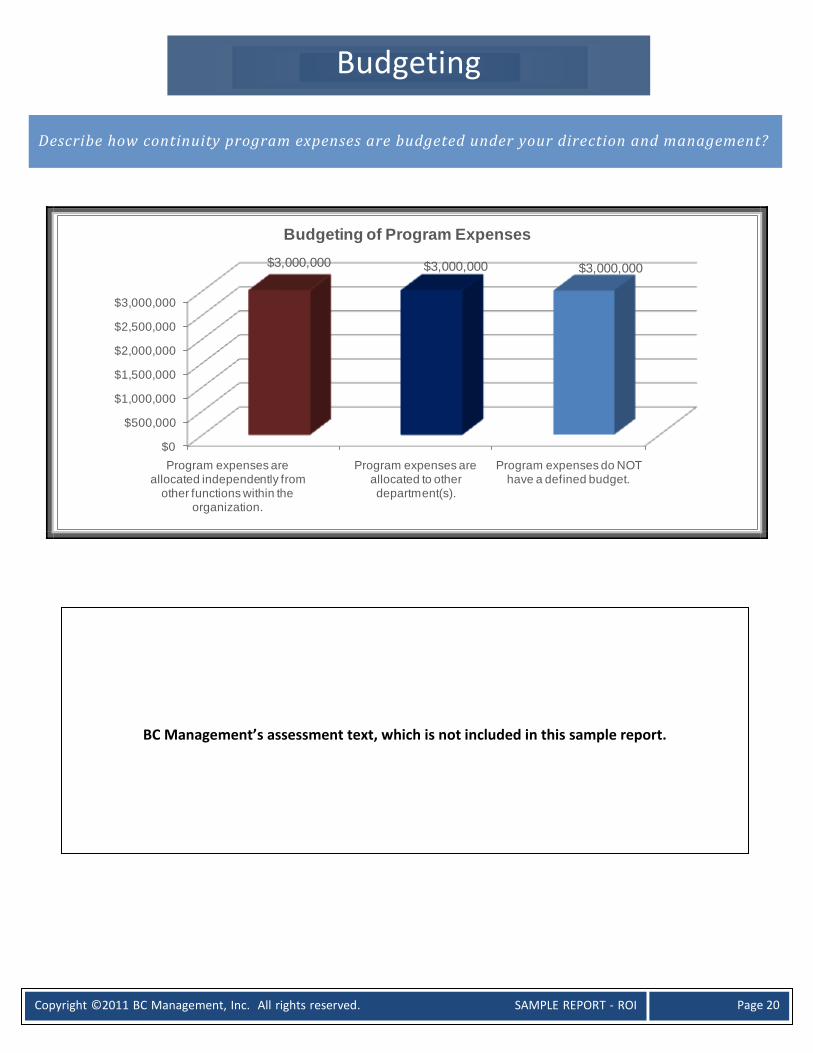
Budgeting of Program Expenses
Budgeting
Describe how continuity program expenses are budgeted under your direction and management?
BC Management’s assessment text, which is not included in this sample report.
Copyright ©2011 BC Management, Inc. All rights reserved. SAMPLE REPORT - ROI
Page 21
Budget Line Item % of Resp Include
Budget Item in
Total Budget
% of Total
Budget
Average
Budget Amount
Full Time Internal Staff xx.xx% xx.xx% $xxx,xxx.xx
Consultants/ Contractors (Business
focus) x.xx% xx.xx% $xxx,xxx.xx
Consultants/ Contractors (IT focus) x.xx% x.xx% $xxx,xxx.xx
Emergency Operations Center (EOC) x.xx% x.xx% $xxx,xxx.xx
Emergency Supplies x.xx% x.xx% $xxx,xxx.xx
Hardware x.xx% xx.xx% $x,xxx,xxx.xx
Hot-site/ Outsourced Alternate Site x.xx% xx.xx% $xxx,xxx.xx
Internal Recovery Site x.xx% xx.xx% $x,xxx,xxx.xx
Software x.xx% xx.xx% $xxx,xxx.xx
Notification/ Alerts x.xx% x.xx% $xx,xxx.xx
Mobile Recovery x.xx% xx.xx% $xxx,xxx.xx
DR Technology x.xx% xx.xx% $x,xxx,xxx.xx
Exercises xx.xx % x.xx% $xxx,xxx.xx
Training /Awareness xx.xx % x.xx% $xxx,xxx.xx
Travel xx.xx % x.xx% $xxx,xxx.xx
Other x.xx% xx.xx% $xxx,xxx.xx
Average Total N/A 100.00% $x,xxx,xxx.xx USD*
* All questionable or incomplete budget information was verified by directly contacting the study respondent. Questionable data responses that couldn’t be
confirmed were removed.
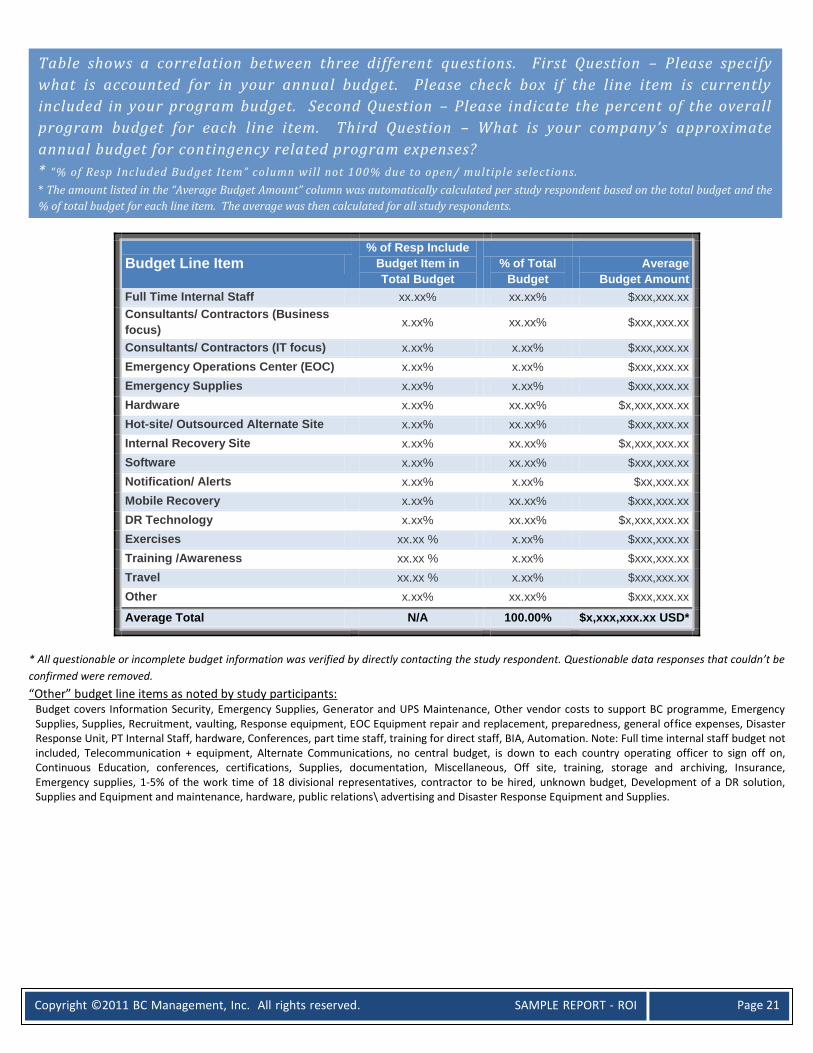
“Other” budget line items as noted by study participants: Budget covers Information Security, Emergency Supplies, Generator and UPS Maintenance, Other vendor costs to support BC programme, Emergency
Supplies, Supplies, Recruitment, vaulting, Response equipment, EOC Equipment repair and replacement, preparedness, general office expenses, Disaster Response Unit, PT Internal Staff, hardware, Conferences, part time staff, training for direct staff, BIA, Automation. Note: Full time internal staff budget not included, Telecommunication + equipment, Alternate Communications, no central budget, is down to each country operating officer to sign off on, Continuous Education, conferences, certifications, Supplies, documentation, Miscellaneous, Off site, training, storage and archiving, Insurance, Emergency supplies, 1-5% of the work time of 18 divisional representatives, contractor to be hired, unknown budget, Development of a DR solution, Supplies and Equipment and maintenance, hardware, public relations\ advertising and Disaster Response Equipment and Supplies.
Table shows a correlation between three different questions. First Question – Please specify
what is accounted for in your annual budget. Please check box if the line item is currently
included in your program budget. Second Question – Please indicate the percent of the overall
program budget for each line item. Third Question – What is your company’s approximate
annual budget for contingency related program expenses?
* “% of Resp Included Budget Item” column will not 100% due to open/ multiple selections.
* The amount listed in the “Average Budget Amount” column was automatically calculated per study respondent based on the total budget and the
% of total budget for each line item. The average was then calculated for all study respondents.

Copyright ©2011 BC Management, Inc. All rights reserved. SAMPLE REPORT - ROI
Page 22
0% 20% 40% 60% 80% 100%
1 Hour
8 Hours
12 Hours
48 Hours
72+ Hours
Estimated Financial Loss by Downtime
Less than $1,000 USD/Hr
$1,000 - $5,000 USD/Hr
$5,000 - $10,000 USD/Hr
$10,000 - $25,000 USD/Hr
$25,000 - $50,000 USD/Hr
$50,000 - $100,000 USD/Hr
$100,000 - $500,000 USD/Hr
$500,000 - $1,000,000 USD/Hr
More than $1,000,000 USD/Hr
Estimated Financial Loss
What is your organization's estimated financial loss PER HOUR of downtime? Consider your organization's MOST CRITICAL function(s) NOT operating. Please select by time of downtime. Be sure to consider ALL potential impacts to the organization and estimated financial losses.
BC Management’s assessment text, which is not included in this sample report.
Copyright ©2011 BC Management, Inc. All rights reserved. SAMPLE REPORT - ROI
Page 23
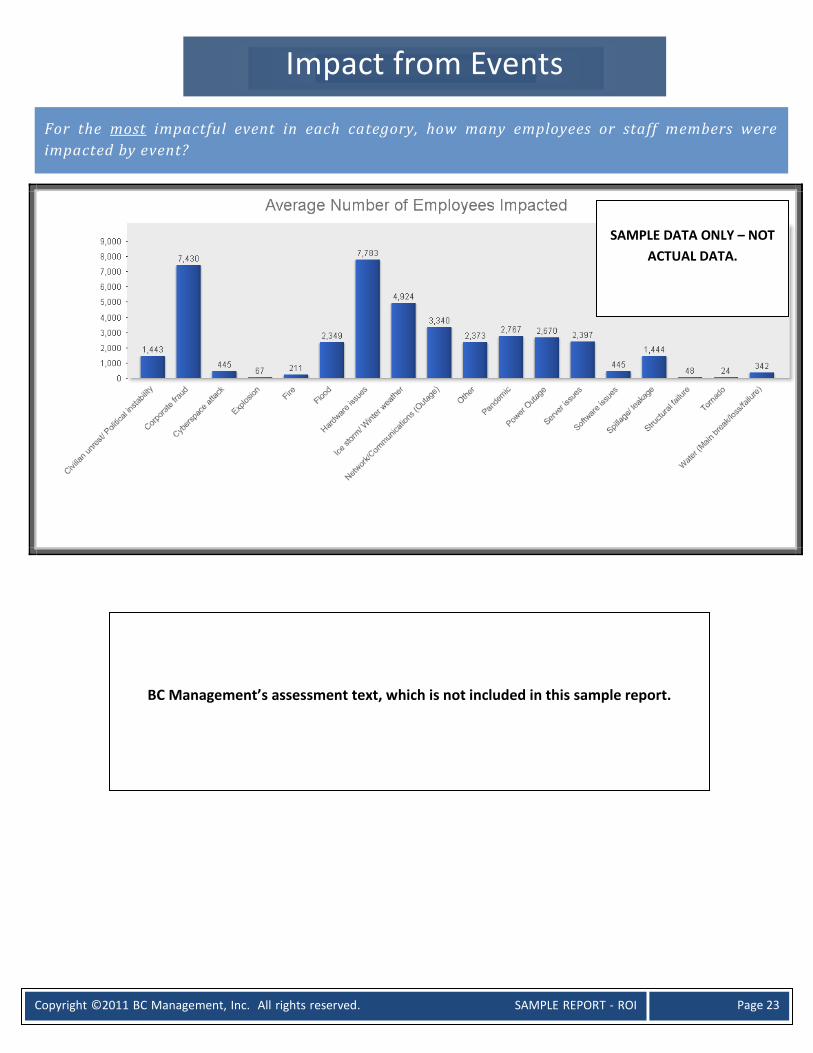
Impact from Events
For the most impactful event in each category, how many employees or staff members were
impacted by event?
BC Management’s assessment text, which is not included in this sample report.
SAMPLE DATA ONLY – NOT
ACTUAL DATA.

Copyright ©2011 BC Management, Inc. All rights reserved. SAMPLE REPORT - ROI
Page 24
What was the impact to the business for the most impactful event in each category? Select all
that apply. - Total percent will exceed 100% due to multiple selections
BC Management’s assessment text, which is not included in this sample report.
SAMPLE DATA ONLY – NOT
ACTUAL DATA.

Copyright ©2011 BC Management, Inc. All rights reserved. SAMPLE REPORT - ROI
Page 25
Business Resumption Period by Event Days
Accident
Other x.xx
Structural failure xx.xx Water (main break/loss/failure) x.xx
Human Disaster
Civilian unrest/ Political instability x.xx Corporate fraud xx.xx Disgruntled employee x.xx Negligence x.xx Other xx.xx Pandemic xxx.xx Shooting x.xx Terrorist activities xx.xx War or insurrection xxx.xx
Natural
Dust storm x Earthquake xx.xx Fire x.xx Flood xx.xx Hurricane xx.xx Ice storm/ Winter weather x.xx Landslide x Other xxx.xx Tornado x.xx Tsunami x.xx Typhoon x
Technical
Computer virus x.xx Cyberspace attack x.xx Hardware issues xxx.xx Network/Communication (outage) xx.xx Server issues xxx.xx Software issues x.xx
How long was your organization in business resumption for the most impactful event in each
category? Two drop down menus provided. Numeric – 1 thru 25 and timeframe of Hours, Days,
Weeks, Months and Years. All respondent answers were converted to days.
BC Management’s assessment text, which is not included in this sample
report.
XX
Copyright ©2011 BC Management, Inc. All rights reserved. SAMPLE REPORT - ROI
Page 26
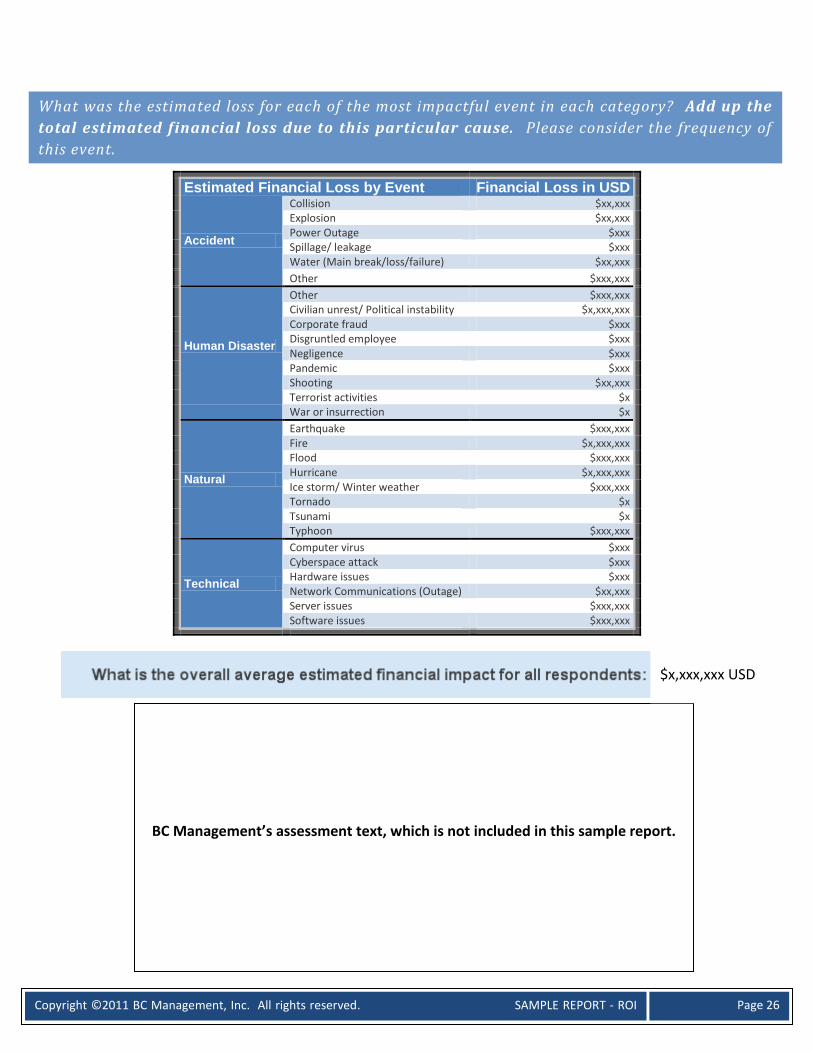
Estimated Financial Loss by Event Financial Loss in USD
Accident
Collision $xx,xxx Explosion $xx,xxx Power Outage $xxx Spillage/ leakage $xxx Water (Main break/loss/failure) $xx,xxx
Other $xxx,xxx
Human Disaster
Other $xxx,xxx Civilian unrest/ Political instability $x,xxx,xxx Corporate fraud $xxx Disgruntled employee $xxx Negligence $xxx Pandemic $xxx Shooting $xx,xxx Terrorist activities $x
War or insurrection $x
Natural
Earthquake $xxx,xxx Fire $x,xxx,xxx Flood $xxx,xxx Hurricane $x,xxx,xxx Ice storm/ Winter weather $xxx,xxx Tornado $x Tsunami $x Typhoon $xxx,xxx
Technical
Computer virus $xxx Cyberspace attack $xxx Hardware issues $xxx Network Communications (Outage) $xx,xxx Server issues $xxx,xxx Software issues $xxx,xxx
What was the estimated loss for each of the most impactful event in each category? Add up the
total estimated financial loss due to this particular cause. Please consider the frequency of
this event.
- Total percent may exceed 100% due to multiple selections. Table being reviewed for %. calculations.
BC Management’s assessment text, which is not included in this sample report.
$x,xxx,xxx USD

Copyright ©2011 BC Management, Inc. All rights reserved. SAMPLE REPORT - ROI
Page 27
0% 25% 50% 75% 100%
All Respondents
Very Immature
Very Mature
All Respondents
Very Immature
Very Mature
All Respondents
Very Immature
Very Mature
All Respondents
Very Immature
Very Mature
All Respondents
Very Immature
Very Mature
All Respondents
Very Immature
Very Mature
All Respondents
Very Immature
Very Mature
All Respondents
Very Immature
Very Mature
All Respondents
Very Immature
Very Mature
All Respondents
Very Immature
Very Mature
All Respondents
Very Immature
Very Mature
All Respondents
Very Immature
Very Mature
All Respondents
Very Immature
Very Mature
All Respondents
Very Immature
Very Mature
All Respondents
Very Immature
Very Mature
Incr
ea
sed
e
xecu
tive
sup
po
rt
Incr
ease
d o
rgan
izat
i
onal
aw
aren
ess
Incr
ease
d d
edic
atio
n
to t
he
pro
gram
Mee
t o
r ex
cee
ded
reco
very
ti
me
ob
ject
ives
Incr
ease
d em
plo
yee
mor
al
Min
imal
o
r n
o
imp
act
to
cust
omer
nee
ds
Min
imal
or n
o im
pac
t to
em
ploy
ees
du
rin
g
even
t
Min
imal
o
r n
o
impa
ct to
fa
cilit
ies
Min
imal
o
r n
o
impa
ct to
o
per
atio
ns
Me
et
or
exc
ee
de
d
org
an
iza
tio
na
l IT
ne
ed
s
Mee
t o
r
exce
eded
o
rgan
izat
ion
al
bu
sin
ess
need
s
Avo
ide
d
po
ten
tia
l
leg
al
act
ion
Incr
ease
d re
pu
tati
on
/com
mun
ity
tru
st
Incr
ease
d sh
are
valu
e
Save
d th
e o
rgan
izat
i
on m
oney
Activating Program and Success Factors
Does Not Apply
Strongly Agree 5
4
3
2
Strongly Disagree 1
Success Factors from Program Activation
Rate the following success factors of your program that were noted as a result of activating the
program on a scale from 1-5 with 1 meaning LOW PRIORITY and 5 meaning HIGH PRIORITY .
Copyright ©2011 BC Management, Inc. All rights reserved. SAMPLE REPORT - ROI
Page 28
0%
5%
10%
15%
20%
25%
Less than $100,000
$100,000 -$250,000
$250,000 -$500,000
$500,000 -$1,000,000
$1,000,000 -$2,500,000
$2,500,000 -$5,000,000
$5,000,000 -$10,000,000
Over $10,000,000
Financial Benefit of the BCM Program by Program Maturity
All Respondents
Very Immature
Average
Very Mature
0%
2%
4%
6%
8%
10%
12%
14%
Less than $100,000
$100,000 -$250,000
$250,000 -$500,000
$500,000 -$1,000,000
$1,000,000 -$2,500,000
$2,500,000 -$5,000,000
$5,000,000 -$10,000,000
Over $10,000,000
Financial Benefit of the BCM Program by Length of Program Existence
All Respondents
Currently Developing
Less than 12 months
1 - 4 years
4 - 8 years
8 - 15 years
Over 15 years
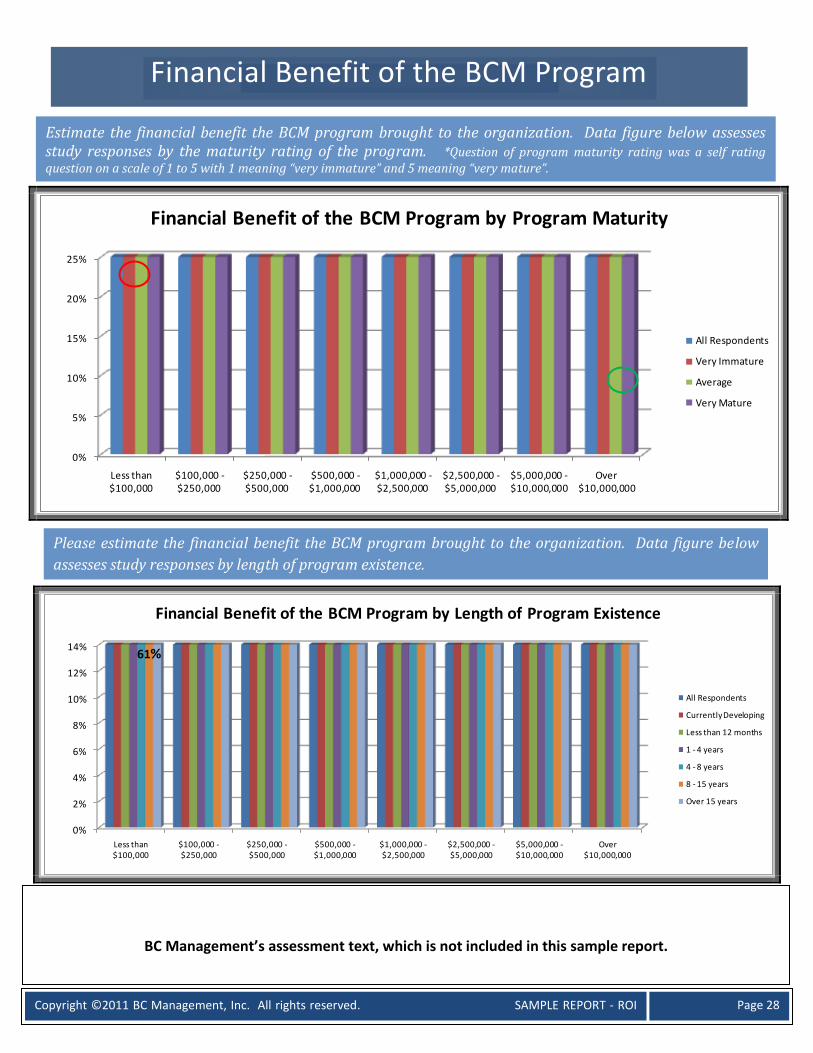
Financial Benefit of the BCM Program
Estimate the financial benefit the BCM program brought to the organization. Data figure below assesses study responses by the maturity rating of the program. *Question of program maturity rating was a self rating question on a scale of 1 to 5 with 1 meaning “very immature” and 5 meaning “very mature”.
Please estimate the financial benefit the BCM program brought to the organization. Data figure below
assesses study responses by length of program existence.
61%
BC Management’s assessment text, which is not included in this sample report.
Copyright ©2011 BC Management, Inc. All rights reserved. SAMPLE REPORT - ROI
Page 29
0%
5%
10%
15%
20%
25%
All Respondents
Very Immature Average Very Mature
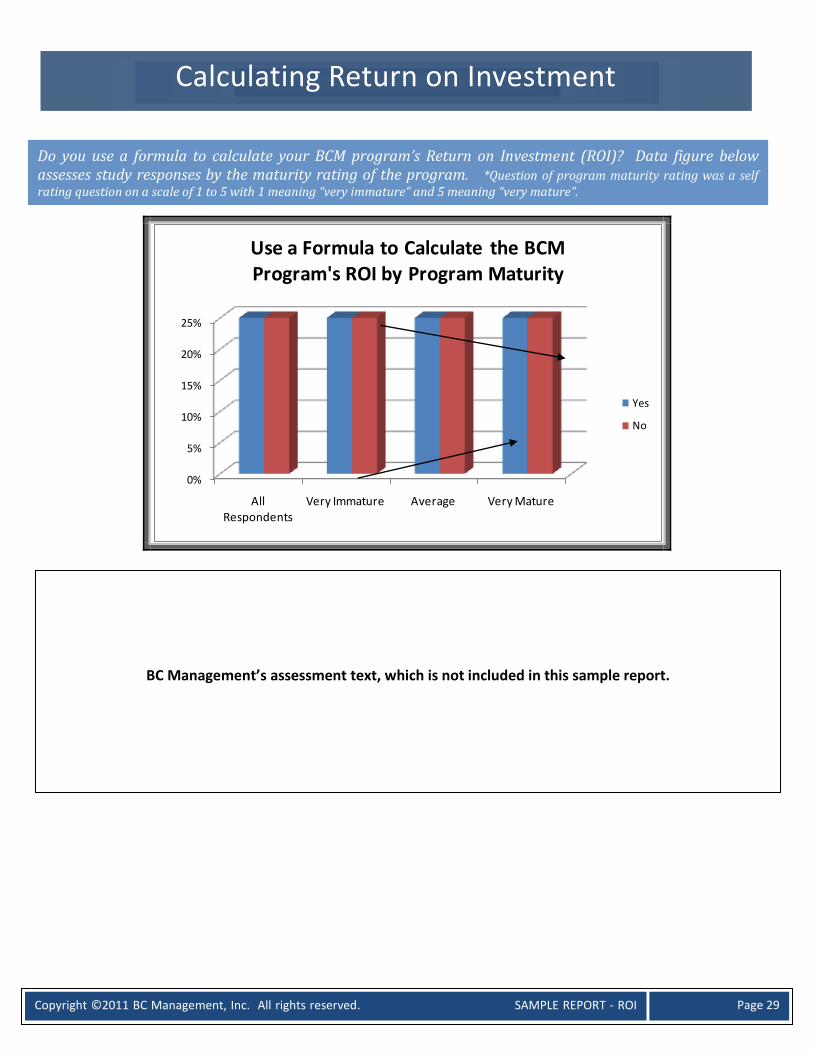
Use a Formula to Calculate the BCM Program's ROI by Program Maturity
Yes
No
Calculating Return on Investment
Do you use a formula to calculate your BCM program’s Return on Investment (ROI)? Data figure below assesses study responses by the maturity rating of the program. *Question of program maturity rating was a self rating question on a scale of 1 to 5 with 1 meaning “very immature” and 5 meaning “very mature”.
BC Management’s assessment text, which is not included in this sample report.
Copyright ©2011 BC Management, Inc. All rights reserved. SAMPLE REPORT - ROI
Page 30
If a formula is used to calculate your BCM program’s Return on Investment (ROI), what is ROI calculation used (open text answer question)? The text responses below is a continuous listing of all open text responses received from BC Management’s 9th Annual BCM Study.
This open text box contains open text responses on what each individual respondent
included for their ROI calculation, if they measure ROI and/or the value/program
effectiveness. This data is withheld from the SAMPLE ROI report.
Copyright ©2011 BC Management, Inc. All rights reserved. SAMPLE REPORT - ROI
Page 31
Our International Benchmarking Advisory Board was instrumental in reviewing the study to ensure it focused on the most relevant topics to continuity professionals today. The goal was to develop a credible reporting tool that would add value to the business continuity profession.
A special thanks to our sponsoring organizations that assisted in translating our study. Without these organizations the study may not have been available in Chinese and Japanese.
Distributing Organizations
BC Management also greatly appreciates the efforts of those organizations that assisted in this global effort. Below is a full list of participating organizations that assisted in distributing our annual study. The contribution of each individual organization does not indicate an endorsement of the study findings or the activities of BC Management, Inc. BC Management greatly appreciates the assistance of the following organizations that assisted with this global effort. This is NOT a complete list of distributing organizations.
Associations
– www.acp-international.com – www.arm.gr.jp/
– www.bcpwho.org
– www.cpohio.org – www.cpeworld.org
– www.drie.org – www.nedrix.com
Certifying Organizations
– www.thebci.org
BCI Asia BCI Brazil BCI Canada BCI India BCI Japan BCI Spain
Thank you to BC Management’s International Benchmarking Advisory Board
Thank you to our sponsors and organizations that assisted with this global effort
Global Data Solutions LTD
Sponsored the Chinese translation BCI Japan/IT Professional Group
Sponsored the Japanese translation
BCMIE Australia Inc. – www.bcmie-australia.org

Copyright ©2011 BC Management, Inc. All rights reserved. SAMPLE REPORT - ROI
Page 32
– www.drii.org
– www.dri-australia.org – www.dri.ca – www.dri-malaysia.org – www.dri-singapore.org
– www.iaem.com – www.theicor.org
Business Continuity/Disaster Recovery Service Providers
– www.allhands.us – www.avalution.com
– www.bcpasia.com – www.continuityleadership.com
– www.continuitylink.com – www.dell.com/modularservices
– www.ehdf.com – www.firestorm.com
– www.calamity.com.sg – www.fusionriskmgmt.com
– www.ketchconsulting.com – www.marsh.com
– www.riskresourcesindia.com
e-Groups
B2-ORM Yahoo e-group – Operational Risk Managers in Financial Services – http://groups.yahoo.com/group/B2-ORM/summary
– Virtual e-group – http://bcmix.groupsite.com/
Copyright ©2011 BC Management, Inc. All rights reserved. SAMPLE REPORT - ROI
Page 33
UK-BCP Yahoo e-group – http://finance.groups.yahoo.com/group/uk-bcp/
Periodicals/Media
– www.contingencyplanning.com – www.continuitycentral.com
– www.continuityinsights.com – www.drj.com
– www.disaster-resource.com
Universities/Colleges
– www.norwich.edu
BC Management, Inc. was founded in 2000. We are an executive search and research firm solely dedicated to the business continuity,
disaster recovery, risk management, emergency management, crisis management and information security professions. With decades of
industry expertise, our staff has a unique understanding of the challenges professionals face with hiring, benchmarking and analyzing best
practices within these niche fields.
BC Management’s Complimentary Research
BC Management has been collecting data on the factors that impact compensations and business continuity programs since 2001. To
download our complimentary reports please visit www.bcmanagement.com.
We Value Your Comments
Thank you for participating to our annual study. Your contribution adds value to our comprehensive reporting and allows us the
opportunity to assess industry trends. Please share any comments or suggestions on how we can elevate our study or reporting at
About BC Management, Inc.
BCPDRPIndia – Yahoo e-group – http://finance.groups.yahoo.com/group/BCPDRPIndia/
Copyright ©2011 BC Management, Inc. All rights reserved. SAMPLE REPORT - ROI
Page 34
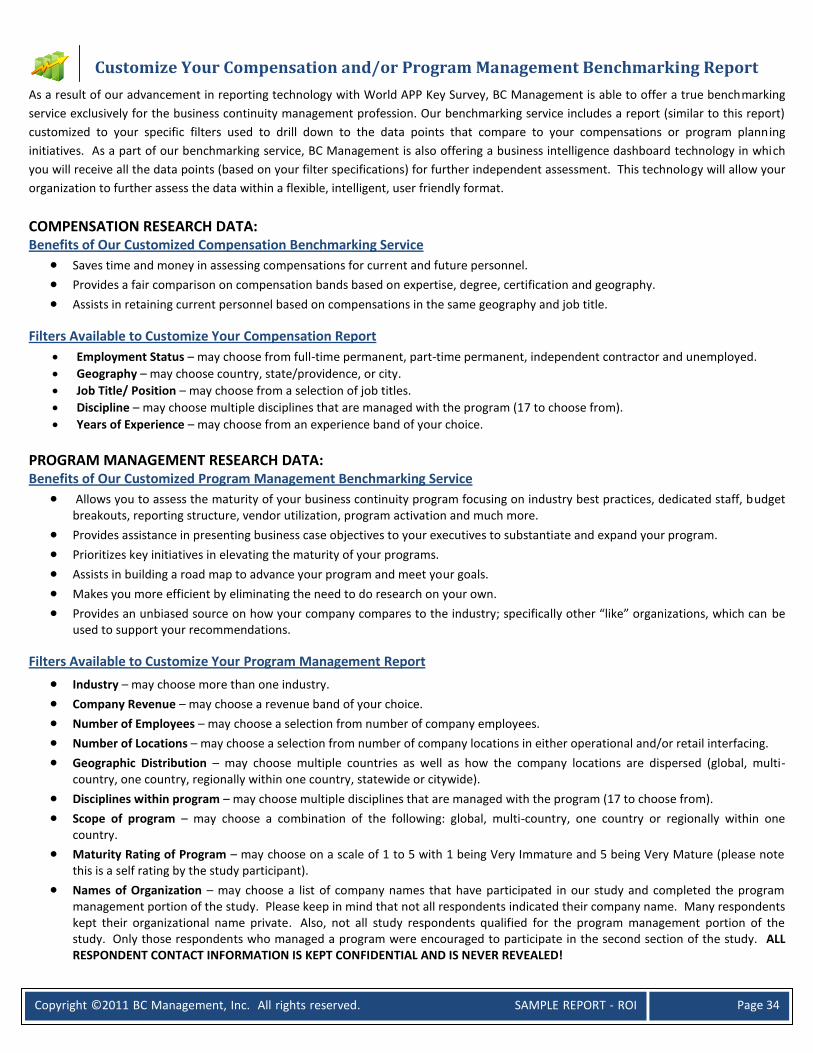
As a result of our advancement in reporting technology with World APP Key Survey, BC Management is able to offer a true benchmarking
service exclusively for the business continuity management profession. Our benchmarking service includes a report (similar to this report)
customized to your specific filters used to drill down to the data points that compare to your compensations or program planning
initiatives. As a part of our benchmarking service, BC Management is also offering a business intelligence dashboard technology in which
you will receive all the data points (based on your filter specifications) for further independent assessment. This technology will allow your
organization to further assess the data within a flexible, intelligent, user friendly format.
COMPENSATION RESEARCH DATA: Benefits of Our Customized Compensation Benchmarking Service
Saves time and money in assessing compensations for current and future personnel. Provides a fair comparison on compensation bands based on expertise, degree, certification and geography. Assists in retaining current personnel based on compensations in the same geography and job title.
Filters Available to Customize Your Compensation Report
Employment Status – may choose from full-time permanent, part-time permanent, independent contractor and unemployed.
Geography – may choose country, state/providence, or city.
Job Title/ Position – may choose from a selection of job titles.
Discipline – may choose multiple disciplines that are managed with the program (17 to choose from).
Years of Experience – may choose from an experience band of your choice.
PROGRAM MANAGEMENT RESEARCH DATA: Benefits of Our Customized Program Management Benchmarking Service
Allows you to assess the maturity of your business continuity program focusing on industry best practices, dedicated staff, budget breakouts, reporting structure, vendor utilization, program activation and much more.
Provides assistance in presenting business case objectives to your executives to substantiate and expand your program. Prioritizes key initiatives in elevating the maturity of your programs. Assists in building a road map to advance your program and meet your goals. Makes you more efficient by eliminating the need to do research on your own. Provides an unbiased source on how your company compares to the industry; specifically other “like” organizations, which can be
used to support your recommendations.
Filters Available to Customize Your Program Management Report
Industry – may choose more than one industry. Company Revenue – may choose a revenue band of your choice. Number of Employees – may choose a selection from number of company employees. Number of Locations – may choose a selection from number of company locations in either operational and/or retail interfacing. Geographic Distribution – may choose multiple countries as well as how the company locations are dispersed (global, multi-
country, one country, regionally within one country, statewide or citywide). Disciplines within program – may choose multiple disciplines that are managed with the program (17 to choose from). Scope of program – may choose a combination of the following: global, multi-country, one country or regionally within one
country. Maturity Rating of Program – may choose on a scale of 1 to 5 with 1 being Very Immature and 5 being Very Mature (please note
this is a self rating by the study participant). Names of Organization – may choose a list of company names that have participated in our study and completed the program
management portion of the study. Please keep in mind that not all respondents indicated their company name. Many respondents kept their organizational name private. Also, not all study respondents qualified for the program management portion of the study. Only those respondents who managed a program were encouraged to participate in the second section of the study. ALL RESPONDENT CONTACT INFORMATION IS KEPT CONFIDENTIAL AND IS NEVER REVEALED!
Customize Your Compensation and/or Program Management Benchmarking Report
Copyright ©2011 BC Management, Inc. All rights reserved. SAMPLE REPORT - ROI
Page 35
Inquiries
For more information or to order a report please email us at [email protected] or call us at (714) 969-8006 or toll free within the
United States (888) 250-7001
Confidential Report
This is a confidential report intended only for the organization that requested and purchased the research data. As such, this report is not
being distributed as a complimentary report among the profession. Please contact BC Management if you would like to share or site this
information.