Sample Report: Asia-Pacific Online Payment Methods: First Half 2017
13
Transcript of Sample Report: Asia-Pacific Online Payment Methods: First Half 2017


© Copyright 2015 ystats.com GmbH & Co. KG, 22765 Hamburg, Germany 2

3

4
GENERAL METHODOLOGY OF MARKET REPORTS
Secondary Market Research
The reports are compiled based on secondary market research. Secondary research is information gathered from previously published sources. Our reports are
based on information and data acquired from national and international statistical offices, industry and trade associations, business reports, business and
company databases, journals, company registries, news portals and many other reliable sources. By using various sources we ensure maximum objectivity for
reported data. As a result, companies gain a precise and unbiased impression of the market situation.
Cross referencing of data is conducted in order to ensure validity and reliability.
The source of information and its release date are provided on every chart. It is possible that the information contained in one chart is derived from several
sources. If this is the case, all sources are mentioned on the chart.
The reports include mainly data from the last 12 months prior to the date of report publication. Exact publication dates are mentioned in every chart.
Definitions
The reports take into account a broad definition of B2C E-Commerce, which might include mobile commerce. As definitions may vary among sources, exact
definition used by the source (if available) is included at the bottom of the chart.
Chart Types
Our reports include text charts, pie charts, bar charts, rankings, line graphs and tables. Every chart contains an Action Title, which summarizes the main
idea/finding of the chart and a Subtitle, which provides necessary information about the country, the topic, units or measures of currency, and the applicable time
period(s) to which the data refers. With respect to rankings, it is possible that the summation of all categories amounts to more than 100%. In this case, multiple
answers were possible, which is noted at the bottom of the chart.
Report Structure
Reports are comprised of the following elements, in the following order: Cover page, preface, legal notice, methodology, definitions, table of contents,
management summary (summarizing main information contained in each section of report) and report content (divided into sections and chapters). When
available, we also include forecasts in our report content. These forecasts are not our own; they are published by reliable sources. Within Global and Regional
reports, we include all major developed and emerging markets, ranked in order of importance by using evaluative criteria such as sales figures.
Notes and Currency Values
If available, additional information about the data collection, for example the time of survey and number of people surveyed, is provided in the form of a note. In
some cases, the note (also) contains additional information needed to fully understand the contents of the respective data.
When providing information about amounts of money, local currencies are most often used. When referencing currency values in the Action Title, the EUR
values are also provided in brackets. The conversions are made using the average currency exchange rate for the respective time period. Should the currency
figure be in the future, the average exchange rate of the past year is used.
5
METHODOLOGY OF THE CURRENT REPORT
Report Coverage
This report covers the online payment market in Asia-Pacific. It takes into account a wide definition of online payment, including payment methods used in online
shopping and mobile payment, such as remote and proximity payments.
The major countries in the region are covered, while data availability varied across the markets.
The report includes data mostly published within the first half of 2017. The exact date of publication of the source is stated on each chart. The time period which
the data refers to differs by source.
Report Structure
The global chapter opens the report, featuring an overview of global online and mobile payment developments.
Next, information about regional development and country comparisons are included.
The rest of the report contains country-specific information. Countries are grouped by advanced and emerging B2C E-Commerce markets. Within each group,
the countries are presented in the descending order of B2C E-Commerce sales.
Depending on data availability, the following types of market information are included: payment methods most used by online and mobile shoppers, number and
value of online/mobile payment transactions, rankings of online payment providers, and mobile payment usage. Not all the mentioned types of information are
available for each of the covered countries. For the two countries leading in the region in B2C E-Commerce sales, also online and mobile payment trends and
news about major players, such as payment providers and banks are presented on text charts.
6
DEFINITIONS
ONLINE PAYMENT Transfer of money made over the Internet following a consumer’s payment command, includes payments for product
and service purchased in (B2C) E-Commerce and M-Commerce.
MOBILE PAYMENT A wide definition of mobile payments includes remote payments made remotely in M-Commerce and proximity
payments made in-store, such as via QR code scanning and NFC technology.
MOBILE PROXIMITY PAYMENT A mobile payment where the merchant and the consumer are present in the same location and the interaction between
the consumer’s device (card, mobile device) and the POS is conducted using a proximity technology (e.g. NFC).
NFC Near Field Communication, a set of standards for smartphones and similar devices to create radio communication by
bringing them close together or having them touch each other. In that way, contactless data exchange and transactions
can take place.
ALTERNATIVE PAYMENTS
Generally refers to payment methods other than credit card or bank card payments. Widely defined, alternative online
payment methods include bank transfers and direct debit, digital wallets, pre-paid cards and private label cards, invoice,
and digital currency. May also include cash on delivery and card schemes by local companies other than global card
brands.
E-WALLET A prepaid digital account, allowing users to store money and use it in online or mobile transactions. The examples of E-
Wallets include Alipay and PayPal.
MOBILE WALLET
A software solution that enables consumers to store payment credentials, such as credit or debit card information, and
use the stored credentials to pay digitally for transactions made in-store, online or via mobile. Mobile wallets are
installed on mobile devices which are used to complete payments. The examples of mobile wallets include Apple Pay,
Samsung Pay and Android Pay.
INSTANT PAYMENTS Electronic payment solutions for retail which are available 24/7/365 and thus result in immediate or close-to-immediate
interbank clearing of transactions and crediting of the payees’ accounts and confirm the payment to the payer after
payment initiation.
B2C E-COMMERCE The sale of products (and services) through electronic transactions via the Internet from businesses to consumers.
M-COMMERCE M-Commerce, also called “Mobile Commerce”, means the sale of products (and services) through transactions via
mobile devices.
ONLINE SHOPPING Purchase of products or services by consumers via the Internet. Broadly defined, may include business to consumer
and consumer to consumer transactions.
The following expressions and definitions are used in this Online Payment Methods report*:
Note: *the definitions used by the original sources might differ from the ones stated on this chart; the exact definition used by each source, where available, is included on the respective
charts
7
TABLE OF CONTENTS (1 OF 4)
1. Management Summary
2. Global Developments
• Payment Methods Preferred in E-Commerce, in % of Online Shoppers, Q1 2017
• Reasons For Not Shopping Online, incl. Payment-Related, in % of Internet Users Who Do Not Shop Online, Q1 2017
• Card Spending, in USD trillion, and Breakdown by POS and E-Commerce, in %, 2015 & 2021f
• Contactless Payment Transaction Value, in USD billion, 2017e & 2019f
• Number of Contactless Payment Users of Apple Pay, Samsung Pay and Android Pay, in millions, 2015 - 2017e
• Share of Internet Users Who Are Likely To Use Mobile Payment in the Next Year, in % of Internet Users, by Selected Countries, Q1 2017
• Attitudes Towards Mobile Payment and Mobile Money, in % of Consumers, by Developed and Developing Markets, 2016
• Breakdown of the Number of Transactions/Purchases by Payment Methods, in %, as Perceived by Businesses and by Consumers, 2016
• Factors Most Important to Consumers in Deciding to Use Mobile Payments, in %, 2016
• Mobile Payment Security Features Demanded by Consumers and Implemented by Businesses, in %, 2016
• Entities Expected to Be The Most Disruptive in FinTech in the Next Five Years According to Financial Services and Fintech Executives, in
%, 2017
• Expected Annual ROI According to Financial Services and Fintech Executives, in %, 2017
3. Asia-Pacific
3.1. Regional
• Top Considerations in Online Shopping, incl. Payment-Related, in % of Consumers, November 2016
• Breakdown of the Number of E-Commerce Orders by Payment Methods in Southeast Asia, by Indonesia, Philippines, Singapore and
Thailand, in %, March 2017
• Top 3 Payment Activities on Mobile Phones, in % of Internet Users in Southeast Asia, by Indonesia, Malaysia, Philippines, Singapore and
Thailand, August 2016
3.2. Advanced Markets
3.2.1. Japan
• Online and Mobile Payment Trends, August 2017
• Top 3 Uses of Credit Card, in % of Credit Card Holders, 2016
• Mobile Payment User Penetration, in % of Individuals, May 2014, November 2015 & November 2016
• Reasons For Using Smartphone Payment, in % of Smartphone Payment Users, March 2017
8
TABLE OF CONTENTS (2 OF 4)
3. Asia-Pacific (Cont.)
3.1. Advanced Markets (Cont.)
3.2.2. South Korea
• Payment Methods Used in E-Commerce, in % of Online Shoppers, October 2016
• Payment Methods Used in E-Commerce, in % of Online Shoppers, by PC and Mobile, October 2016
• Payment Methods Used in Cross-Border E-Commerce, in % of Cross-Border Online Shoppers, October 2016
• Share of Internet Users Who Have Used Convenient Payment Services, in %, October 2016
• Breakdown of Preferred Method of Authentication in Convenient Payment Services, in % of Users, October 2016
• Reasons for Using Convenient Payment Services, in % of Users, October 2016
3.2.3. Australia
• Breakdown of the Number of Consumer Payments by Channels, in %, 2013 & 2016
• Share of Individuals Who Experienced Credit Card Fraud After Shopping Online, in %, November 2016
• Breakdown of Card Fraud by Type, incl. Card-Not-Present, in AUD million, 2011 - 2016
• Smartphone Payment User Penetration, in % of Consumers, May 2017
• Mobile Contactless Payment Awareness, in % of Individuals, by Total and by Generation, December 2016
3.2.4. New Zealand
• Share of Individuals Who Experienced Credit Card Fraud After Shopping Online, in %, November 2016
3.3. Emerging Markets
3.3.1. China
• Online and Mobile Payment Trends, August 2017
• Breakdown of Payment Methods Used in E-Commerce, in % of Online Shoppers, 2016
• Number of Online Payment Users, in millions, and Penetration, in % of Internet Users, 2012 – 2016
• Third-Party Online Payment Volume, in CNY trillion, by Two Comparative Estimates, Q1 2016 – Q1 2017
• Third-Party Online Payment Volume, in CNY trillion, by Two Comparative Estimates, 2013 - 2019f
• Breakdown of Third-Party Online Payment GMV by Players, in %, by Two Comparative Estimates, Q1 2017
9
TABLE OF CONTENTS (3 OF 4)
3. Asia-Pacific (Cont.)
3.3. Emerging Markets (Cont.)
3.3.1. China (Cont.)
• Breakdown of Third-Party Online Payment GMV by Segment, in %, Q1 2017
• Number of Mobile Payment Users, in millions, and Penetration, in % of Mobile Internet Users, 2014 - 2016
• Share of Internet Users Who Use Mobile Payment in Physical Stores, in %, 2016
• Breakdown of Mobile Payment Users by Gender and Age Group, in %, 2015 & 2016
• Third-Party Mobile Payment Volume, in CNY trillion, by Two Comparative Estimates, Q1 2016 – Q1 2017
• Third-Party Mobile Payment Volume, in CNY trillion, by Two Comparative Estimates, 2013 - 2019f
• Breakdown of Third-Party Mobile Payment GMV by Players, in %, by Two Comparative Estimates, Q1 2017
• Breakdown of Third-Party Mobile Payment GMV by Segment, in %, Q1 2017
3.3.2. Taiwan
• Categories of Products and Services Paid for In-Store Using Mobile Payment Systems, in % of Users, October 2016
3.3.3. India
• Breakdown of Payment Methods Used in M-Commerce, in % of Mobile Shoppers, 2016
• Payment Methods Used in E-Commerce, in % of Generation Z Online Shoppers, June 2017
• Number of RuPay Card Transactions, in millions, and Value, in INR billion, by POS and E-Commerce, FY 2014/2015 - FY 2016/2017
• Number of Mobile Payment Transactions, in billions, and Value, in INR trillion, FY 2016 - FY 2022f
• Breakdown of Mobile Payment Transaction Value by Segment, in %, FY 2017e
• Number of Mobile Wallet Transactions, in billions, and Value, in INR billion, FY 2016 - FY 2022f
• Breakdown of Mobile Wallet Transaction Value by Segment, in %, FY 2017e
• M-Wallet Market Size, in INR billion, FY 2016 - FY 2022f
• Mobile Wallet Transaction Value, in USD billion, FY 2015 & FY 2017
3.3.4. Indonesia
• Credit Card Uses, in % of Banked Adults Interested in Owning a Credit Card, March 2017
• Breakdown of Main Purposes of Using Online Banking, incl. “Shopping Online”, in % of Users, March 2017
• Number of E-Money Transactions, in millions, and Value, in IDR billion, 2012 – 2016 & H1 2017

10
TABLE OF CONTENTS (4 OF 4)
3. Asia-Pacific (Cont.)
3.3. Emerging Markets (Cont.)
3.3.5. Thailand
• Payment Methods Used in E-Commerce, by Number of Online Shoppers and Percentage of Online Shoppers, Q1 2016
• Value of Mobile Payment Transactions, in THB billion, and Volume, in millions, by Bank, Non-Bank and Total, 2011 – 2016
3.3.6. Singapore
• Breakdown of Payment Methods Preferred in Online Shopping, in % of Online Shoppers, 2016
• Breakdown of Credit Cards Used in Online Shopping, by Credit Card Network and Credit Card Issuer, in % of Online Shoppers Paying
with Credit Card, 2016
3.3.7. Malaysia
• Breakdown of Payment Methods Preferred in Online Shopping, in % of Online Shoppers, November 2016
3.3.8. Vietnam
• Breakdown of Payment Methods Used in E-Commerce, in % Online Shoppers, August 2016
• Credit Card Uses, in % of Adults, June 2017

11
9.6%
21.9%
24.8%
25.6%
39.4%
74.1%
0% 25% 50% 75% 100%
Mileage or Rewards Points
Convenient Payment Service
Mobile Phone Billing
Debit Card/Check Card
Account Transfer
Credit Card
in % of Online Shoppers
“Credit card” was the top payment method used by nearly three-
quarters (74.1%) of online shoppers in South Korea in October 2016. South Korea: Payment Methods Used in E-Commerce, in % of Online Shoppers, October 2016
Note: ages 12+
Survey: based on a survey of 25,000 households and 61,238 household members aged 3+, conducted from July to October 2016
Definition: convenient payment service is a payment service which enables to save card information once and pay by easy authentication, such as by entering a password, through
SMS, biometrics, etc.
Source: Ministry of Science, ICT and Future Planning, Korean Internet and Security Agency (KISA), March 2017
12
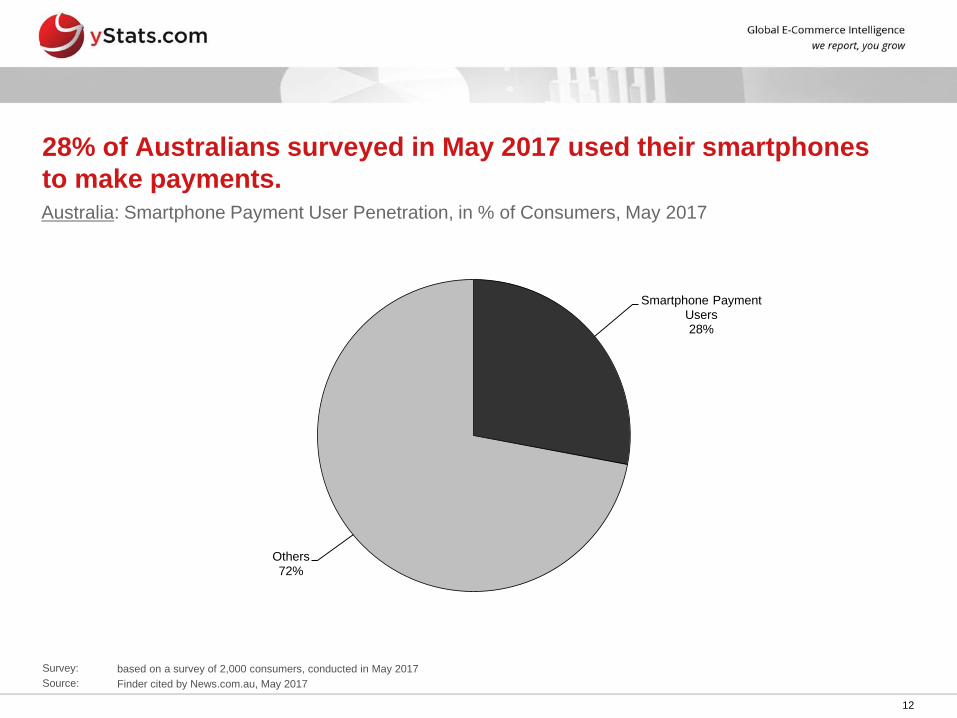
Smartphone Payment Users 28%
Others 72%
28% of Australians surveyed in May 2017 used their smartphones
to make payments. Australia: Smartphone Payment User Penetration, in % of Consumers, May 2017
Survey: based on a survey of 2,000 consumers, conducted in May 2017
Source: Finder cited by News.com.au, May 2017
13