
Sample Quarterly Performance Report -...
12
Sample Quarterly Performance Report Portfolio Summary Asset Allocation Summary Portfolio Appraisal Realized Gains and Losses Interest, Dividends and Expenses Performance History Consolidated Statements Your Strategic Asset Management investments will be consolidated into one account, making it easy for you and your advisor to monitor your portfolio’s overall results. The Strategic Asset Management Quarterly Performance Report provides timely, easy-to-understand information about your account. STRATEGIC ASSET MANAGEMENT
Transcript of Sample Quarterly Performance Report -...

Sample QuarterlyPerformance Report
Portfolio Summary �Asset Allocation Summary �Portfolio Appraisal �Realized Gains and Losses �Interest, Dividends and Expenses �Performance History �Consolidated Statements �
Your Strategic Asset Management investments will be consolidated into one account, making it easy for you and your advisor to monitor your portfolio’s overall results. The Strategic Asset Management Quarterly Performance Report provides timely, easy-to-understand information about your account.
Strategic aSSet ManageMent

2SaMPLe (client name) 1234-5678 / investment Objective: growthSample report is for illustration purposes only.
Portfolio SummaryThis report provides a snapshot of the Strategic Asset Management account. Key information is summarized on the top including the account registration and account number, the advisor’s name and telephone number, the selected investment objective and the date of the information included in the report.
The Portfolio Changes section tracks account activity for the previous quarter. “Net Change this Quarter” reflects the account’s appreciation or depreciation over the trailing quarter. Account activity is broken down by type (inflows, outflows, market fluctuation, etc.).
The Portfolio Summary section summarizes the market value for each type of security held in the account, and indicates what percent each security type represents out of the total portfolio. You can easily see how much was invested and what that investment is worth today. This information is summarized under the section titled “Net Change Since Inception.”
For questions regarding your account contact:Advisor Name: 555-555-5555
Strategic Asset Management

3SaMPLe (client name) 1234-5678 / investment Objective: growthSample report is for illustration purposes only.
Important Disclosure Information
This report has been prepared from data believed to be reliable but no representation is made as to accuracy or completeness. Securities prices may vary from actual liquidation value. Prices shown should only be used as a general guide to portfolio value.
When available, the original purchase price is used as the cost basis in this report if the data was provided by the client or the financial institution transferring the position to LPL Financial. If no such data was submitted, the cost basis used in this report is the market value of the asset at the time it was deposited into the account. For any assets purchased within the account, the cost basis is the actual purchase price including transaction charges. Short-term gains or losses are based on securities held for one year or less. Long-term gains or losses are based on securities held for more than one year.
Returns are expressed as a percentage, are calculated on a time-weighted basis and are presented net of the advisory fee and transaction charges. The deduction of other fees and charges is not reflected in the performance figures.
The LPL Financial benchmark, which may be displayed, is calculated using a weighted average of the indices, in the percentages specified, as noted in the chart below. The LPL Financial benchmark represents the benchmark for the current investment objective for the account. Please keep in mind that the investment objective for the account may have changed over time.
Clients should consider the following points when comparing account performance to either the LPL Financial benchmark or other indices that may be displayed. The LPL Financial benchmark is calculated using the month-end value of the index for each day of the month, rather than the actual daily value of the index. The Consumer Price Index is reported on a one-month lag. In addition, several of the other indices, which may be displayed, only publish performance figures monthly. As the account performance is displayed for the actual number of days the account was opened, the client should consider this disparity for the initial period when comparing account performance to the indices and benchmark returns.
Indices and benchmarks are unmanaged and cannot be invested into directly. If you need additional information regarding the indices that may be displayed, please contact your financial advisor.
Report calculations and figures should not be relied upon for tax purposes. For tax advice, please contact your tax advisor.
LPL Financial - A Registered Investment AdvisorOne Beacon Street, 22nd Floor, Boston, MA 02108-31069785 Towne Centre Drive, San Diego, CA 92121
Index LPL Financial Income with Capitol Preservation
Benchmark
LPL Financial Income with Moderate
Growth Benchmark
LPL Financial Growth with Income
Benchmark
LPL Financial Growth Benchmark
LPL Financial Aggressive Growth
Benchmark
3-Month Treasury Bill Yield
Lehmen Brothers Aggregated Bond Index
Russell 3000 Index
10%
70%
20%
7%
53%
40%
5%
35%
60%
5%
15%
80%
5%
0%
95%
4SaMPLe (client name) 1234-5678 / investment Objective: growthSample report is for illustration purposes only.
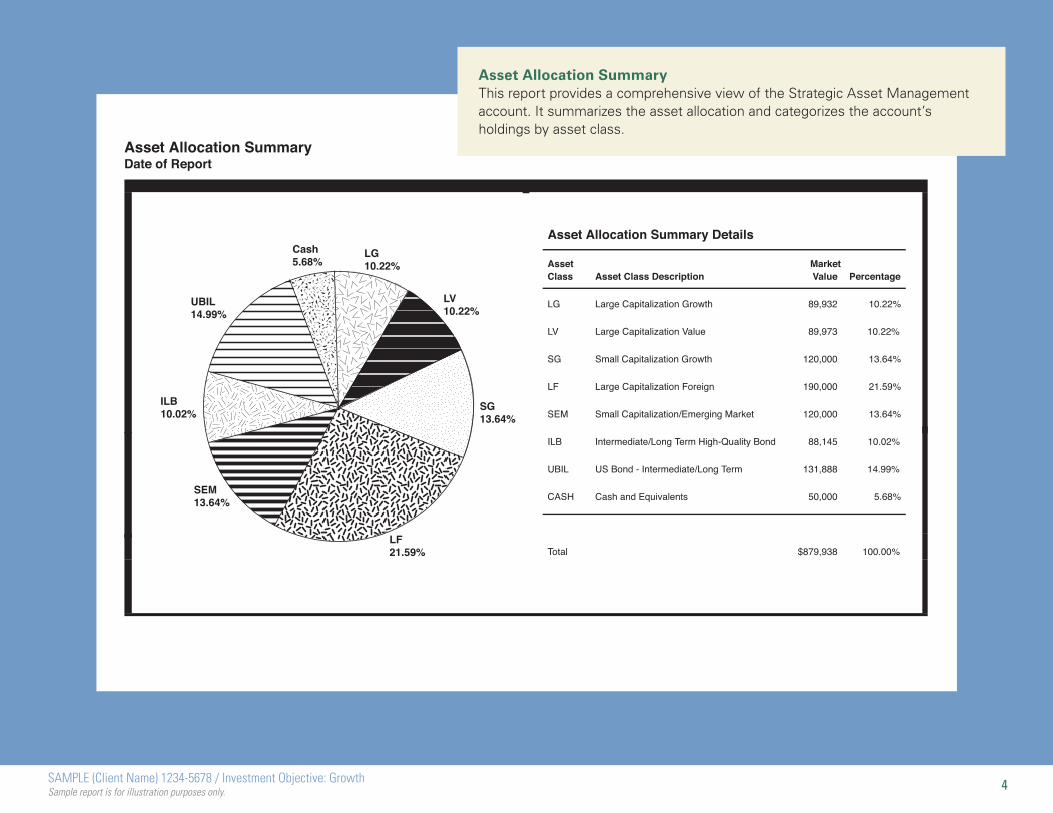
Asset Allocation Summary This report provides a comprehensive view of the Strategic Asset Management account. It summarizes the asset allocation and categorizes the account’s holdings by asset class.

5SaMPLe (client name) 1234-5678 / investment Objective: growthSample report is for illustration purposes only.
Portfolio AppraisalThis report lists each asset currently held in the Strategic Asset Management account (this includes assets that were either purchased or transferred into the account). Each asset is grouped by security type and may include further categorization by asset class.
Portfolio AppraisalDate of Report

6SaMPLe (client name) 1234-5678 / investment Objective: growthSample report is for illustration purposes only.
Portfolio Appraisal (continued)Date of Report

7SaMPLe (client name) 1234-5678 / investment Objective: growthSample report is for illustration purposes only.
Realized Gains and LossesWhenever assets are liquidated from a Strategic Asset Management account, the sale is recorded on this report. The acquisition date, closing date, number of shares, cost basis information and the amount of the redemption is detailed. The gains and losses are categorized as short- or long-term and sub-totaled by security. Finally, the total amount of the gain or loss is summarized at the bottom.
Realized Gains and LossesFrom Date Through Date

8SaMPLe (client name) 1234-5678 / investment Objective: growthSample report is for illustration purposes only.
Interest, Dividends and ExpensesIf any asset in the account generates interest or dividends during the previous quarter, the activity is listed on this report. In addition, you can see the dollar amount of the fee that was debited from the account.
Interest, Dividends and ExpensesFrom Date Through Date
9SaMPLe (client name) 1234-5678 / investment Objective: growthSample report is for illustration purposes only.
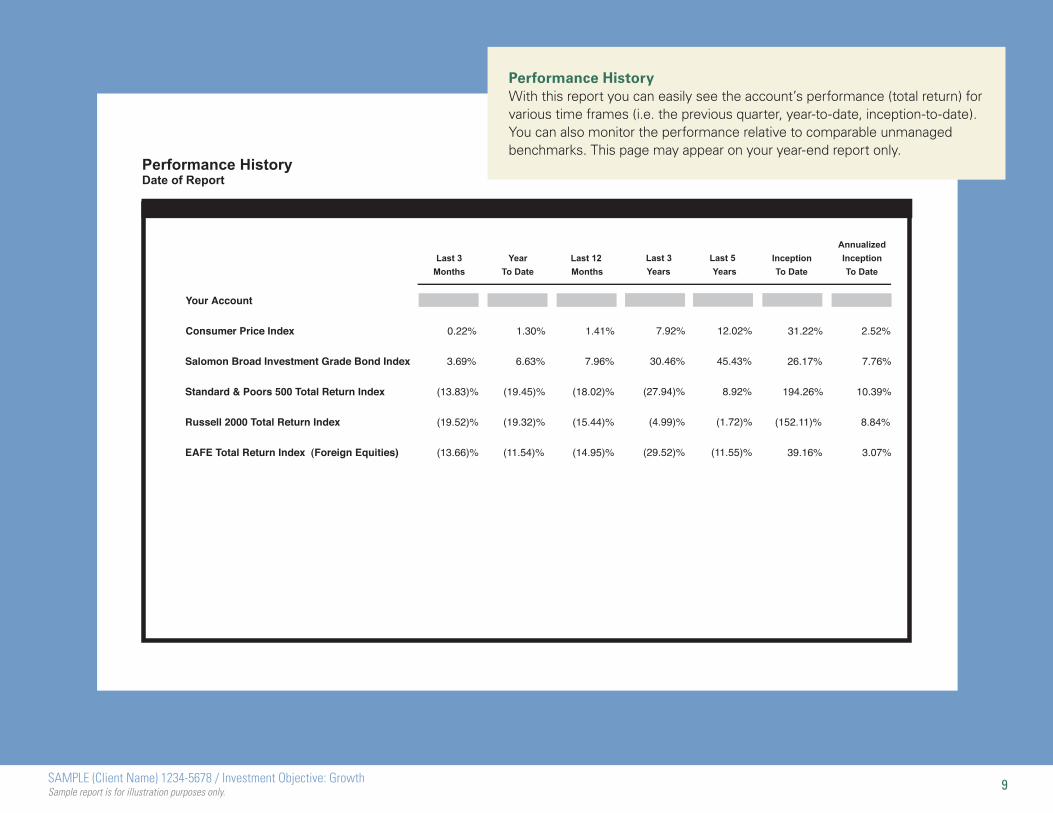
Performance HistoryWith this report you can easily see the account’s performance (total return) for various time frames (i.e. the previous quarter, year-to-date, inception-to-date). You can also monitor the performance relative to comparable unmanaged benchmarks. This page may appear on your year-end report only.
Performance HistoryDate of Report
10SaMPLe (client name) 1234-5678 / investment Objective: growthSample report is for illustration purposes only.
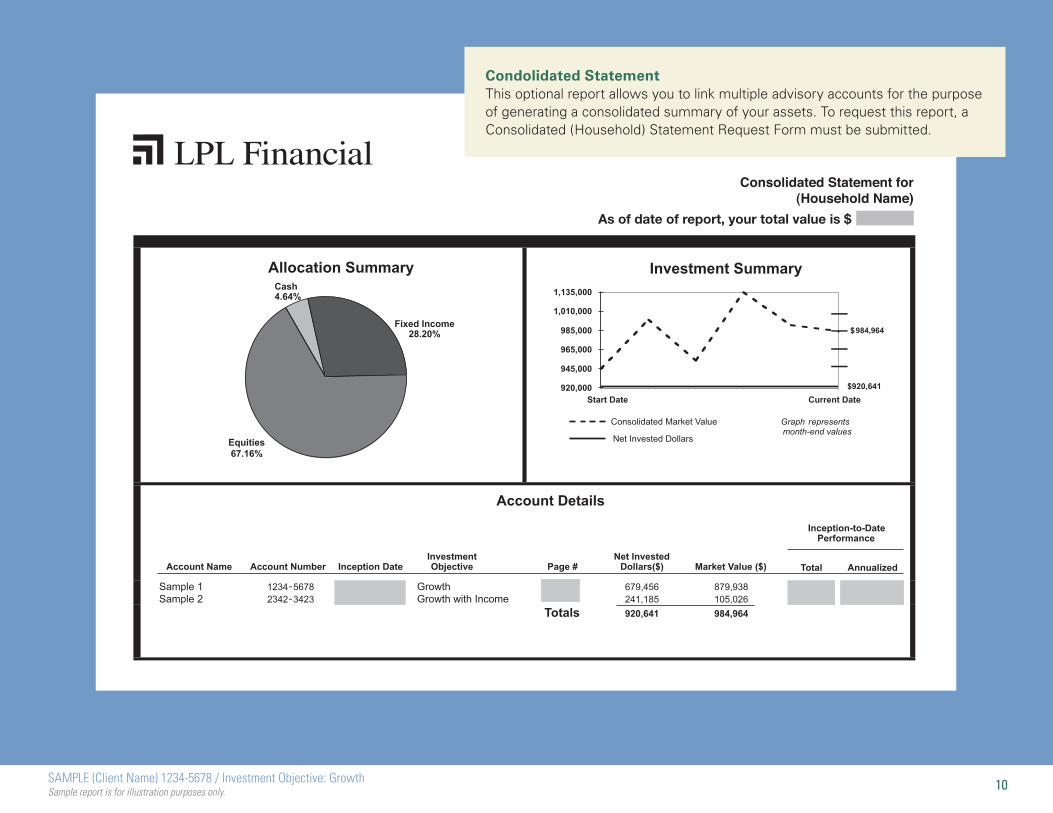
Condolidated StatementThis optional report allows you to link multiple advisory accounts for the purpose of generating a consolidated summary of your assets. To request this report, a Consolidated (Household) Statement Request Form must be submitted.
Consolidated Statement for(Household Name)
As of date of report, your total value is $

11SaMPLe (client name) 1234-5678 / investment Objective: growthSample report is for illustration purposes only.
Important Information About Your Consolidated Statement
This statement provides a summary of the accounts for which you have requested to receive consolidated information. Each individual account will continue to be managed on an individual basis only. They will not be managed on a consolidated basis. Accounts from different types of advisory programs may be included on the statement. The Consolidated Statement does not replace—and is provided in addition to—the enclosed individual account performance reports.
Allocation Summary
This pie chart illustrates, on a consolidated basis, how the securities in your accounts are allocated among four asset classes: “Equities,” “Fixed Income,” “Cash” and “Other.” “Other” consists primarily of securities that are unclassified.
The relative size of each allocation is determined as a percentage of the total market value of all accounts combined. If a piece of the pie has a negative market value, that piece will not be included in the total market value, and thus will not be represented in the allocation. Under some circumstances, it may not be possible to provide the pie chart and the following message will appear: “The Allocation Summary is Unavailable.”
Investment Summary
This line graph plots the consolidated market values (dotted line) and net invested dollars (solid line) for all accounts included on the Consolidated Statement using month-end values. The illustration begins at the first month-end for the account that has been opened for the longest period of time. The changes to net invested dollars are plotted in the middle of the month.
Under some circumstances, it may not be possible to create the line graph and the following message will appear: “The Investment Summary is Unavailable.” For example, the graph will not be included if the oldest account has not been opened for at least three months, or if some of the data is unavailable.
Please contact your LPL Financial advisor with any questions. For your convenience, your LPL Financial advisor’s name and telephone number appear on each of the enclosed individual performance reports.
LPL Financial, A Registered Investment AdvisorOne Beacon Street, 22nd Floor, Boston, MA 02108-31069785 Towne Centre Drive, San Diego, CA 92121

a registered investment advisor
acS-02888-0508tracking #417491 (exp. 05/10)
www.lpl.comMember Finra/SiPc
Please note that this sample is for illustration purposes only and does not represent the positions or performance of an actual Strategic asset Management account, or the advisory fee that would be charged.
the investment objective selected for this sample is “growth.” therefore, the investments shown herein are subject to more risk than those considered appropriate for more conservative investors.
this illustration is not intended to be a representation of any past recommen dations, nor does it suggest that any past recommendations would be profitable.
the LPL Financial family of affiliated companies includes LPL Financial, UVeSt Financial Services group, inc., Mutual Service corporation, Waterstone Financial group, inc., and associated Securities corp., each of which is a member of Finra/SiPc.
not FDic/ncUa insured | not Bank/credit Union guarantee | May Lose Value | not guaranteed by any government agency | not a bank/credit Union Deposit


