Sample PBR actuarial report (September 2007) · used for cash flow testing analysis at Surak Life....
36
Sample PBR Actuarial Report for Life Polices Subject to a PBR Valuation Prepared by Subgroup 1 of the Valuation Law and Manual Team Presented to the National Association of Insurance Commissioners’ Life and Health Actuarial Task Force (LHATF) LHATF Fall 2007 NAIC Meeting The American Academy of Actuaries is a national organization formed in 1965 to bring together, in a single entity, actuaries of all specializations within the United States. A major purpose of the Academy is to act as a public information organization for the profession. Academy committees, task forces and work groups regularly prepare testimony and provide information to Congress and senior federal policy- makers, comment on proposed federal and state regulations, and work closely with the National Association of Insurance Commissioners and state officials on issues related to insurance, pensions and other forms of risk financing. The Academy establishes qualification standards for the actuarial profession in the United States and supports two independent boards. The Actuarial Standards Board promulgates standards of practice for the profession, and the Actuarial Board for Counseling and Discipline helps to ensure high standards of professional conduct are met. The Academy also supports the Joint Committee for the Code of Professional Conduct, which develops standards of conduct for the U.S. actuarial profession. Valuation Law and Manual Team, Subgroup 1 David Neve, Chair, F.S.A., M.A.A.A. Mike Boerner, A.S.A., M.A.A.A. Katie Campbell, F.S.A., M.A.A.A. Alice Fontaine, F.S.A., F.C.I.A., M.A.A.A. Corinne Jacobson, F.S.A., M.A.A.A. Dan Keating, F.S.A., M.A.A.A. Kerry Krantz, F.S.A., M.A.A.A. Mike Lombardi, F.S.A., M.A.A.A., F.C.I.A. Russell Menze, F.S.A., M.A.A.A Tom Nace, F.S.A., M.A.A.A. Stephen Neill, A.S.A., M.A.A.A. Kristin Schaefer, F.S.A., M.A.A.A. Al Sekac, F.S.A., M.A.A.A. David Whittemore, F.S.A., M.A.A.A.
Transcript of Sample PBR actuarial report (September 2007) · used for cash flow testing analysis at Surak Life....

Sample PBR Actuarial Report for Life Polices Subject to a PBR Valuation
Prepared by Subgroup 1 of the Valuation Law and Manual Team
Presented to the National Association of Insurance Commissioners’ Life and Health Actuarial Task Force (LHATF)
LHATF Fall 2007 NAIC Meeting
The American Academy of Actuaries is a national organization formed in 1965 to bring together, in a single entity, actuaries of all specializations within the United States. A major purpose of the Academy is to act as a public information organization for the profession. Academy committees, task forces and work groups regularly prepare testimony and provide information to Congress and senior federal policy-makers, comment on proposed federal and state regulations, and work closely with the National Association of Insurance Commissioners and state officials on issues related to insurance, pensions and other forms of risk financing. The Academy establishes qualification standards for the actuarial profession in the United States and supports two independent boards. The Actuarial Standards Board promulgates standards of practice for the profession, and the Actuarial Board for Counseling and Discipline helps to ensure high standards of professional conduct are met. The Academy also supports the Joint Committee for the Code of Professional Conduct, which develops standards of conduct for the U.S. actuarial profession.
Valuation Law and Manual Team, Subgroup 1
David Neve, Chair, F.S.A., M.A.A.A.
Mike Boerner, A.S.A., M.A.A.A. Katie Campbell, F.S.A., M.A.A.A. Alice Fontaine, F.S.A., F.C.I.A., M.A.A.A. Corinne Jacobson, F.S.A., M.A.A.A. Dan Keating, F.S.A., M.A.A.A. Kerry Krantz, F.S.A., M.A.A.A. Mike Lombardi, F.S.A., M.A.A.A., F.C.I.A. Russell Menze, F.S.A., M.A.A.A Tom Nace, F.S.A., M.A.A.A. Stephen Neill, A.S.A., M.A.A.A. Kristin Schaefer, F.S.A., M.A.A.A. Al Sekac, F.S.A., M.A.A.A. David Whittemore, F.S.A., M.A.A.A.

CONFIDENTIAL SURAK LIFE INSURANCE COMPANY PBR ACTUARIAL REPORT ON POLICIES SUBJECT TO PBR VALUATION
As of December 31, 2011
This report is confidential and for the exclusive use of the management and state insurance examiners of the Surak Life Insurance Company.

TABLE OF CONTENTS I. OVERVIEW................................................................................................................................Page 1 A. INTRODUCTION........................................................................................................Page 1 B. PRODUCT DESCRIPTIONS......................................................................................Page 2 C. DESCRIIPTION OF CASH FLOW MODEL ............................................................Page 2
D. VALUATION ASSUMPTIONS AND MARGINS..……………………………..Page 2 E. REINSURANCE..........................................................................................................Page 3 F. DERIVATIVE PROGRAMS......................................................................................Page 3 G. PROCESS TO MONITOR CHANGES IN EXPERINCE ........................................Page 3 H. INTEREST RATE AND EQUITY PERFORMANCE SCENARIOS....................Page 4 I. USE OF MODELING DATE THAT PRECEDES VALUATION DATE............. Page 4 J. STOCHATIC MODELING EXCLUSION….… ………………………………. Page 4 K. SUMMARY OF RESERVE RESULTS................................................................. Page 4 L. SIGNATURE SECTION.......................................................................................... Page 5 II. PRODUCT ASSUMPTIONS...................................................................................................Page 6 A. MORTALITY ASSUMPTIONS……………………………………………… Page 6 B. PREMIUM PERSISTENCY……………………………………………………...Page 7 C. LAPSES……………………………………………………………………… . .Page 7 D. DYNAMIC LAPSE FORMULA………………………………….………………Page 7 E. COMPETITOR RATE…………………………………………….……………...Page 7 F. VARIABLE ACCOUNT ASSUMPTION……………………………………… Page 8 G. INTEREST CREDITING……………………………………….…………………Page 8 H. EXPENSES…………………………………………………………………….. Page 8 III. ASSETS………………………………………………..……………………………...…Page 9
A. PORTFOLIO DESCRIPTION……………………………………………… . .Page 9 B. MODEL SEGMENTS AND STARTING ASSETS………………………… Page 10 C. INVESTMENT ASSUMPTIONS……………..…………………………… .Page 10 D. DISINVESTMENT ASSUMPTIONS…………...………………………… ..Page 11 E. ASSET VALUATION BASIS…………………………………………………Page 11 F. DESCRIPTION OF ASSETS…………………….……………………… ….Page 11 G. DEFAULT ASSUMPTION……………………….…………………… ……Page 12 H. PREPAYMENTS………………………………………………………………Page 12 I. CALLS…………………………………………………………………… …Page 13 J. PUTS……………………………………………….………………………. Page 13 K. UL SEPARATE ACCOUNT…………………………………………………..Page 13

TABLE OF CONTENTS – continued
IV. OTHER DISCLOSURE ITEMS …………………………………….Page 14 A. IMPACT OF ASSUMPTION MARGINS……..……………………………….Page 14 B. MATERIAL RISKS NOT IN CASH FLOW MODEL…………………………Page 15 C. IMPACT OF AGGREGATION………………………………………………...Page 16
D. EMBEDDED SPREAD ON STARTING ASSETS………………………… Page 16 E. TEST OF CONSISTENCY OF DISCOUNT RATES……………………… Page 16
V. RESULTS……………………………………………...……………………………Page 17
A. BASIC RESULTS…………………………………..………….…………… ..Page 17 B. SENSITVITY TESTS……………………………….………….……………….Page 17 Results for Accumulation UL…………………….………….………………Page 18 Results for UL with Shadow Account……………………….………………Page 20 Results for Variable UL………………………………………..……… …. Page 23 C. MARGINS……..………………………………………………….……… …. Page 26
APPENDIX A: MORTALITY…………………………………………………...…………Page 27 APPENDIX B: PREMIUM PATTERN…………………………………………………….Page 30 APPENDIX C: LAPSES…………………………………………………………… ……Page 31

CONFIDENTIAL Report on PBR Reserves for Surak Life
February 28, 2012
1
I. OVERVIEW A. INTRODUCTION
This report has been prepared on the Surak Life Insurance Company in conjunction with the Actuarial Certification on the policies subject to a PBR valuation. This report details the all of the disclosure items for a PBR valuation as required by [insert applicable section] of the Valuation Manual for Surak Life for year-end 2011. The Surak Life Insurance Company has been determining the reserves for the products listed below on a PBR basis since 2008: Accumulation UL with no secondary guarantees UL with shadow account 20 year level term products Variable UL This report covers these products. The policies and assets examined were those in-force on December 31, 2011. This report and any conclusions contained therein have been prepared for the use of the PBR Review Actuary of Surak Life. This report has been prepared in conformity with its intended utilization by a person technically competent in the areas addressed and for the stated purpose only. Judgments as to the data contained in the report should be made only after studying the report in its entirety, as the conclusions reached by review of a section or sections on an isolated basis may be incorrect. I will be available to explain and/or amplify any matters presented herein, and it is assumed that the user of this report will seek such explanation and/or amplification as to any matter in question.
B. PRODUCT DESCRIPTIONS OF POLICIES SUBJECT TO PBR REQUIREMENTS
Accumulation UL with No Secondary Guarantees The Accumulation Universal Life policies are flexible premium policies. There are two death benefit options: Option 1 pays a death benefit at the Specified Amount plus the increase in the fund value since the last Anniversary Day; Option 2 has a death benefit equal to the Specified Amount plus the fund value. The fund value is accumulated as the total of: premiums plus interest credited less premium expense charges less partial surrenders less monthly deductions. The cash value equals the fund value less a fund charge. The fund charge is a percentage of fund value: 10% in the first year, grading down by 1% a year to 0 in years 11 and later. The guaranteed interest rate is 4%. Excess interest may be credited in a manner determined by the Company. Policy loans are made at the credited rate plus two percent. There are monthly deductions for the cost of insurance plus the monthly expense charge.

CONFIDENTIAL Report on PBR Reserves for Surak Life
February 28, 2012
2
CONFIDENTIAL Report on PBR Reserves for Surak Life
February 28, 2012
3
UL with Secondary Guarantees The Universal Life product with Secondary Guarantees is similar to the Accumulation UL product, except that there is a shadow account guarantee. This shadow account guarantee is for the life of the policy. The shadow account guarantees that, as long as the premiums paid plus interest are greater than amounts specified in the policy, the policy will not lapse, even if the fund account were to go to zero. 20 Year Term The 20 year term product has level premiums over the 20 year period. There is no renewal option after the 20 years. There are no cash values on this product. Variable UL The Variable UL product is similar to the Accumulation UL product, but there is no minimum interest rate guarantee on the cash values - investment risk on funds held in separate accounts backing variable life insurance is borne by the policyholder.
C. DESCRIPTION OF CASH FLOW MODEL USED FOR PBR CALCULATIONS
Surak Life uses the SuperPBR modeling system, a commercial software system owned by Whynot, for determining reserves. This system models both assets and liabilities. This is the same system that is being used for cash flow testing analysis at Surak Life. There were a few modifications that Surak Life made to the model in order to capture all the risks of their contracts for the PBR valuation, such as reflecting different potential premium payments for UL insurance. These changes have now also been incorporated into the asset adequacy testing model. The cash flow model is validated each year by . . . .
D. VALUATION ASSUMPTIONS AND MARGINS
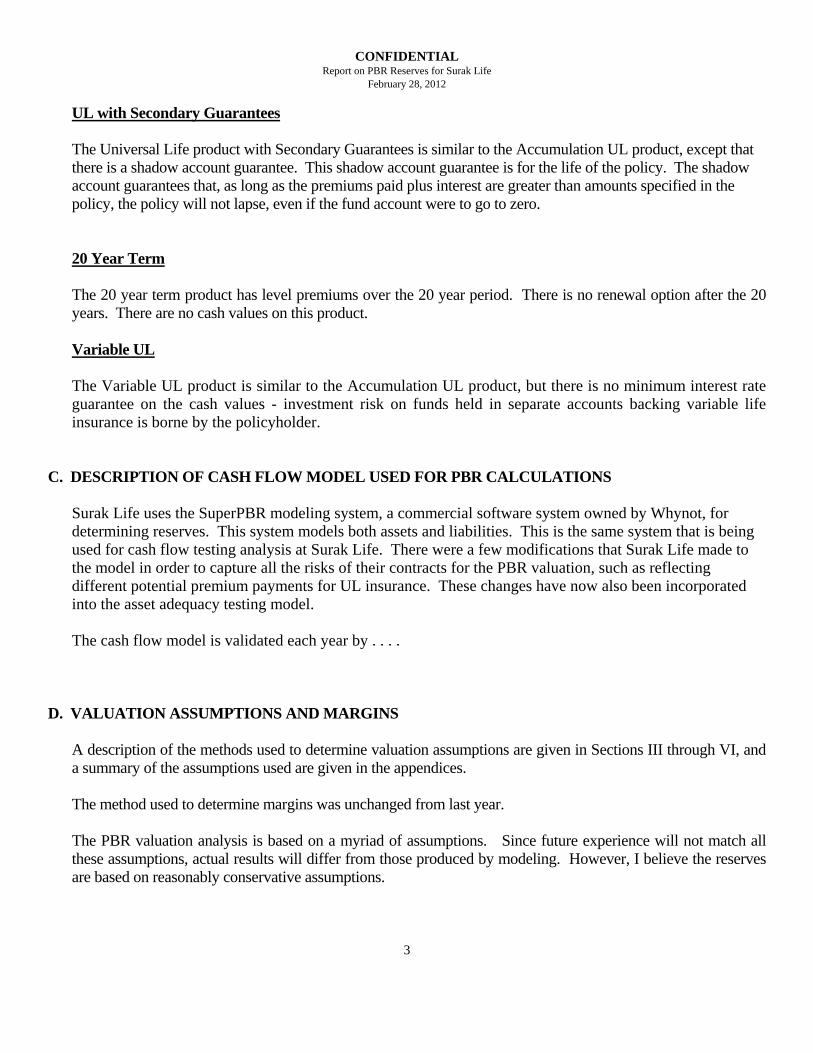
A description of the methods used to determine valuation assumptions are given in Sections III through VI, and a summary of the assumptions used are given in the appendices. The method used to determine margins was unchanged from last year.
The PBR valuation analysis is based on a myriad of assumptions. Since future experience will not match all these assumptions, actual results will differ from those produced by modeling. However, I believe the reserves are based on reasonably conservative assumptions.

CONFIDENTIAL Report on PBR Reserves for Surak Life
February 28, 2012
4
E. REINSURANCE
There were several reinsurance treaties in effect at the end of 2011 on Universal Life. These treaties were all for amounts of insurance in excess of the retention limit and are reinsured on a YRT basis. There is no financial reinsurance. The overall effect of reinsurance is to reduce the volatility of future benefit payment amounts by replacing the reinsured risk with a reinsurance premium. The 20 year term product was 90% coinsured with VerySafe Reinsurer.
F. DERIVATIVE PROGRAMS
Derivatives are utilized by Surak Life to hedge a variety of interest rate, exchange rate, and equity risks. They are also utilized for asset replication strategies. Derivatives that are associated with specific assets are linked with the asset for modeling purposes, recognizing the degree of effectiveness of the derivative (i.e. some hedges are less than 100% effective). Similarly, derivatives hedging specific liabilities are linked together for modeling purposes, recognizing the degree for effectiveness of the derivative.
G. PROCESS TO MONITOR CHANGES IN EXPEREINCE
The Company uses the following metrics to monitor changes in experience.
1. actual to expected mortality experience – quarterly 2. actual to expected lapse experience – quarterly 3. credit losses – annually 4. etc.
Prudent estimate valuation assumptions are reviewed during the 3Q of each year. Prudent estimate valuation assumptions are only modified from the prior year if one or more of the following conditions exist:
1. Future anticipated experience is expected to change, based on an analysis of past trends and/or a change in company practices.
2. There is greater uncertainty in fluctuations around anticipated experience. There were no changes in prudent estimate valuation assumptions compared to last year.

CONFIDENTIAL Report on PBR Reserves for Surak Life
February 28, 2012
5
H. INTEREST RATE AND EQUITY PERFORMANCE SCENARIOS
For general account products, 1000 scenarios were generated using the methodology specified in the American Academy of Actuaries RBC C-3 Phase 1 interest rate scenario generator. The variable annuity scenarios used were those specified in the American Academy of Actuaries C-3 Phase 2 scenario generator.
I. USE OF A MODELING DATE THAT PRECEDES THE VALUATION DATE
The stochastic modeling calculations were based on 9/30 data. This information was used to calculate the Reported Reserve on 12/31 by taking the growth in the Deterministic reserve from 9/30 to 12/31, and using this growth rate to approximate the growth in the Reported Reserve from 9/30 to 12/31. 12/31 Reported Reserve
1. Take the greater of the Deterministic Reserve and Stochastic Reserve as of 9/30. 2. Adjust the result of step 1 to reflect changes from 9/30 to 12/31 using the ratio of the Deterministic
Reserve as of 12/31 and 9/30.
J. STOCHASTIC MODELING EXCLUSION
The 20 year term product was tested using several adverse deterministic scenarios in June of 2011. There was less than a 1% difference between the reserves under these deterministic scenarios and the Deterministic Reserve for these policies. Hence, it was concluded that a stochastic modeling was not needed. This is consistent with the original pricing demonstration and the product having an insignificant amount of interest rate exposure risk. For all the UL products, stochastic modeling was done.
K. RESERVE RESULTS
Deterministic Reserve, 9/30: 425,000 Stochastic Reserve, 9/30: CTE Reserve (policies subject to stochastic modeling) 423,000 Modified Deterministic Reserve (policies not subject to stochastic modeling) 27,000 Total Stochastic Reserve, 9/30 450,000 Reported Reserve, 9/30: 450,000 Deterministic Reserve, 12/31: 437,000 Reported Reserve, 12/31: 450,000 * (437/425) = 462,705

CONFIDENTIAL Report on PBR Reserves for Surak Life
February 28, 2012
6
L. SIGNATURE SECTION
I will be available to explain and/or amplify any matters presented herein, and it is assumed that the user of such report will seek such explanation and/or amplification to any matter in question.
David E. Neve, FSA, M.A.A.A. Vice President and Actuary Surak Life Insurance Company 100 Accuracy Avenue Littletown, New York 11746 (212) 555-1501 February 28, 2012

CONFIDENTIAL Report on PBR Reserves for Surak Life
February 28, 2012
7
II. PRODUCT ASSUMPTIONS A. MORTALITY ASSUMPTIONS
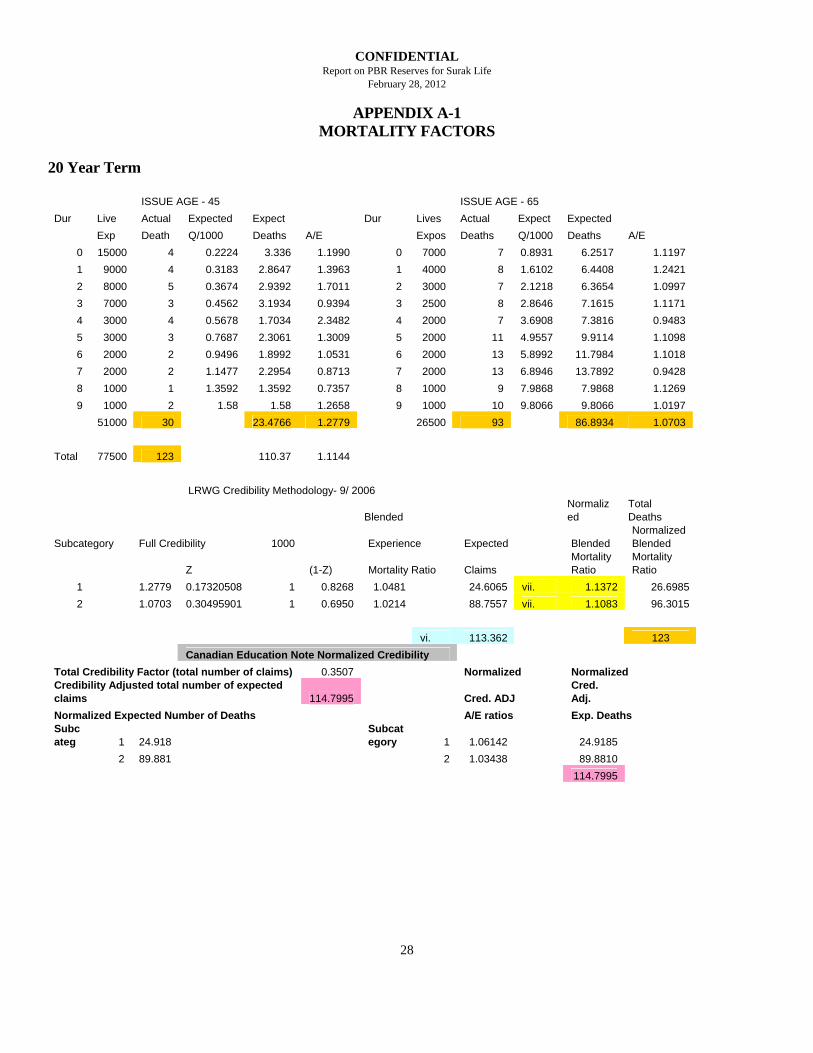
Surak Life does mortality studies yearly. One component of our expected mortality assumption is the results from the current rolling 5-year average mortality study. The current study was for the period 2004-2009. This is the basis for the experience mortality curve. In computing the mortality, the first step was to determine the underwriting score by applying the Underwriting Criteria algorithm to our current preferred underwriting rules. Using this score (“45”) we chose a published industry mortality table without margin table for scores in the range 35-50. This table (Industry Table 35-50) is used as expected mortality. The credibility method used to blend company experience with industry experience was the Canadian Normalized Credibility methodology. Mortality assumptions did not change since the last year.
Term Insurance Surak Life does not have full credibility for mortality. It was assumed that 1000 deaths were needed for full credibility. For term insurance, the actual number of deaths were 123, so the Total Credibility Factor was .35 (the square root of 123 divided by 1000). Since all policies issued have essentially the same face amount, I have excluded the effect of the variance in face amount when calculating the Total Credibility Factor. Credibility was assigned to subsegments using the Normalized Credibility Methodology. A summary of the mortality for term insurance is found in Appendix A. This produced mortality factor of 1.0614 for age 45 year olds, and 1.034 for 65 year olds. Note that, for term insurance, Surak Life had experience through 10 years. Therefore, the credibility weighted mortality curve for durations 11 through 20 was set equal to 1.04 times the Industry Table 35-50. . In addition, a margin was added to the mortality of 9.375 deaths per 1000 divided by ex . This is to add conservatism to reflect the possible variance in results. Reserves computed with the credibility weighted mortality curves, including the margins, were compared to reserves using standard industry mortality table with margins. It was determined that the valuation mortality table that most resembled these results was the 2011 Table D. This table was therefore used to compute reserves. Universal Life All universal life products were combined in the determination of the mortality.

CONFIDENTIAL Report on PBR Reserves for Surak Life
February 28, 2012
8
NOTE: Similar tables would be prepared to Appendix A for these products. After this analysis is done, the valuation table would be chosen, The results from the computed mortality weighted curves, including the margins, were compared to the industry mortality curves. It was determined that the valuation mortality table that most resembled these results was the 2011 Table C. This table was therefore used to compute reserves.
B. PREMIUM PERSISTENCY
The UL products may continue without a premium payment each period. The results differ slightly depending on which premium assumption is used. The actual premium payment patterns are given in Appendix B, along with the baseline assumption used for this.
C. LAPSES
A lapse study is done yearly for each product. The latest lapse study and the lapse assumptions used are shown in Appendix C. There was only 10 years of credible information on lapses for most products; for the UL with shadow account there was only 5 years of data. Beyond the year credible data is available, a conservative assumption was made. For UL, the lapse study currently does not break out the lapses by premium pattern. Therefore, an estimate was made as to the lapses by premium pattern, taking into account the fact that those paying lower premiums would likely lapse their products more than those who paid a level or single premium. For the term products and UL with secondary guarantees, the PBR products tested show worse results with lower lapses. Therefore, for these products I determined that a 30% lower lapse factor would be used as a reasonably conservative estimate. For the Accumulation UL and Variable UL, the products were marginally worse off with higher lapses, so 30% higher than expected lapses was used as a baseline. These assumptions did not change since last year.
D. DYNAMIC LAPSE FORMULA
For general account universal life, the excess lapses were assumed to be triggered off of the following formula: (Competitor rate-credited rate)*1.75. There were no dynamic lapses assumed for the 20 year term business or the variable UL business.
E. COMPETITOR RATE
For testing UL excess lapses, it was assumed that the competitor rate was assumed to be equal to the 5 year Treasury rate in any given scenario less 25 basis points.

CONFIDENTIAL Report on PBR Reserves for Surak Life
February 28, 2012
9
F. VARIABLE ACCOUNT ASSUMPTION
The Variable UL product does not have a fixed bucket, so there is no risk of money moving to or from a fixed account to select against the company.
G. INTEREST CREDITING
The 20 year level term product is fully guaranteed. The Accumulation UL and the UL with a shadow account credits interest above the minimum at a rate declared by the company. The goal is to earn a spread of 180 basis points over the portfolio rate.
H. EXPENSES
Expenses were determined for each contract based on pricing assumptions, plus a 5% load. Pricing assumptions are based on a fully allocated approach, reflecting both direct costs associated with the contracts and an allocation of indirect and overhead costs. For the year just ended, expenses allocated to the PBR block were only 5% of total company expenses, up from 3% last year. However, there was a revision to how the company allocated expenses between per policy and per $1000 expenses. The result was an increase in the per policy expenses and a decrease in the per $1000 expenses. These new expenses were used in the reserving, which resulted in a slight increase in overall expenses for UL insurance, and a decrease in expenses for term insurance (less than $1000).

CONFIDENTIAL Report on PBR Reserves for Surak Life
February 28, 2012
10
III. ASSETS
A. PORTFOLIO DESCRIPTION
The majority of invested assets backing PBR policies in Surak Life are investment grade corporate bonds, both public and private placements. The portfolio also includes a substantial holding in CMOs and other mortgage backed securities. The majority of the CMOs are government or agency backed. The portfolio is rounded out with commercial mortgages and residential mortgages. The table at the end of this section lists assets by type and by product. In support of the Asset/Liability Management Process, Surak Life has segmented its investment portfolio. This action, along with continued refinements of the segments, should facilitate the management of investment risks associated with the various lines of business. However, it should be understood that all assets of the company back all liabilities of the company. The assets backing the general account segments used for term insurance and UL are given below:
ASSETS BACKING PBR PRODUCTS Long Term Bonds Amount % of Total Exempt Obligations 21,705 4.6% NAIC 1 225,000 48.6% NAIC 2 130,000 28.1% NAIC 3 10,000 2.2% NAIC 4 5,000 1.1% NAIC 5 5,000 1.1% NAIC 6 1,000 0.2% Total Bonds 397,705 85.9% Commercial Mortgage Loans 20,000 4.3% Residential Mortgage Loans 20,000 4.3% Cash & Short Term 10,000 2.2% Miscellaneous 5,000 1.1% Policy Loans 10,000 2.2% Total 462,705 100%

CONFIDENTIAL Report on PBR Reserves for Surak Life
February 28, 2012
11
B. MODEL SEGMENTS AND STARTING ASSETS The Model Segments follow the company’s asset segmentation plan:
Segment 2: All term products Segment 3: All UL products Segment 4: All variable products
Starting assets in each model segment was based on an estimate of the PBR reserve used in the pricing model of the product. This estimated PBR reserve is:
Segment 2: Term: 50% of premium Segment 3: UL: 102% of account value Segment 4: VUL: 90% of total account value
This produces the following starting asset amounts:
Segment 2: 10% of total assets in asset segment 2, which equals: $25,000 Segment 3: 15% of total assets in asset segment 3, which equals: $350,000 Segment 4: Negative balance, as follows:
Account value: SA $98,000 GA 2,000 Total 100,000 Estimated PBR reserve: 90,000 (90%) = Total Starting Assets: 90,000 less SA Starting Assets: 98,000 = GA Starting Assets: (8,000)
The allocation of individual assets to each model segment was based on a pro-rata share of each asset from the respective asset segment, with the prorata percentage equal to the ratio of starting assets in each model segment to the total assets in the asset segment.
C. INVESTMENT ASSUMPTIONS
It is assumed that all cash will be invested in 10 year non-call bonds, 66% NAIC 1, 34% NAIC 2.

CONFIDENTIAL Report on PBR Reserves for Surak Life
February 28, 2012
12
D. DISINVESTMENT ASSUMPTION
For disinvestment, it is assumed that the company can borrow up to $1 million at the 90 day Treasury rate plus 2%. Additional disinvestment would be on a pro-rata slice of the remaining assets.
E. ASSET VALUATION BASIS
The valuation bases for the assets included in this memorandum are listed below. They have been valued in accordance with NAIC asset violation bases and procedures. Bonds Amortized Cost, Scientific Method CMOs Amortized Cost, Interest Method Mortgages Aggregate Unpaid Balance Policy Loans Aggregate Unpaid Balance
F. DESCRIPTION OF ASSETS
The bond category consists of publicly traded bonds and private placements. The default rate was assigned to each asset depended on the NAIC rating. The model reflects each asset on a seriatim basis. The model includes actual coupons and payment frequencies. Put and call options are reflected in the model. As of December 31, 2011, Surak Life had only 3 bonds below NAIC designation 3. The NAIC 1 category of assets used in cash flow testing included agency backed CMOs. The CMOs are primarily PACs and ADs (accretion directed). Although the current practice at Surak Life is to avoid highly volatile tranches of CMOs, a number of older accrual (Z) tranches remain in the portfolio. These were generally modeled using the CMO INTEX model (a commercial software modeling system). The information on most of these assets was checked against the NYMayor database. The modeled prepayments on these assets were spot checked using market consensus forecasts as listed in NYMayor. The mortgage category includes commercial and residential mortgages. These were modeled on a seriatim basis assuming defaults at the level of NAIC grade 3 bonds for commercial mortgages, NAIC grade 2 for residential mortgages. Policy Loans are almost exclusively associated with the traditional life and universal life lines of business. The level of loans outstanding can be responsive to changes in interest rates. This presents a risk in the policies with fixed guaranteed policy loan interest rates. Policy loans were included in the traditional life and universal life models.
CONFIDENTIAL Report on PBR Reserves for Surak Life
February 28, 2012
13
G. DEFAULT ASSUMPTION
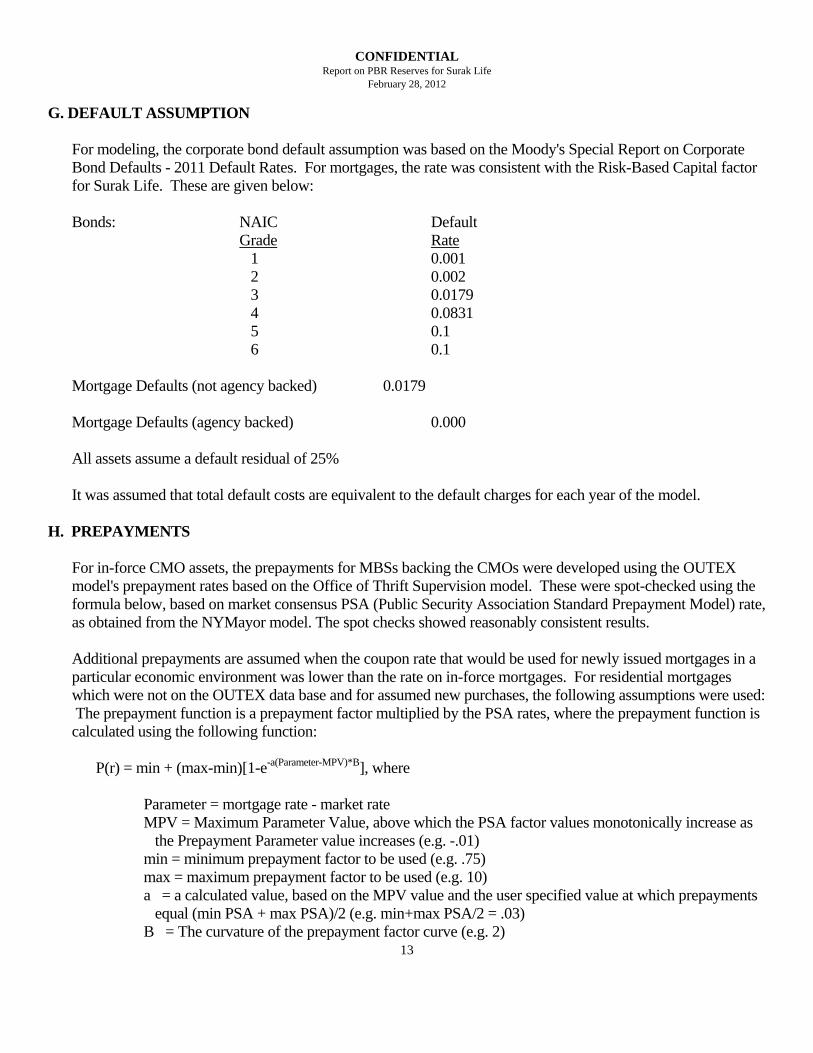
For modeling, the corporate bond default assumption was based on the Moody's Special Report on Corporate Bond Defaults - 2011 Default Rates. For mortgages, the rate was consistent with the Risk-Based Capital factor for Surak Life. These are given below: Bonds: NAIC Default Grade Rate 1 0.001 2 0.002 3 0.0179 4 0.0831 5 0.1 6 0.1 Mortgage Defaults (not agency backed) 0.0179 Mortgage Defaults (agency backed) 0.000 All assets assume a default residual of 25% It was assumed that total default costs are equivalent to the default charges for each year of the model.
H. PREPAYMENTS
For in-force CMO assets, the prepayments for MBSs backing the CMOs were developed using the OUTEX model's prepayment rates based on the Office of Thrift Supervision model. These were spot-checked using the formula below, based on market consensus PSA (Public Security Association Standard Prepayment Model) rate, as obtained from the NYMayor model. The spot checks showed reasonably consistent results. Additional prepayments are assumed when the coupon rate that would be used for newly issued mortgages in a particular economic environment was lower than the rate on in-force mortgages. For residential mortgages which were not on the OUTEX data base and for assumed new purchases, the following assumptions were used: The prepayment function is a prepayment factor multiplied by the PSA rates, where the prepayment function is calculated using the following function:
P(r) = min + (max-min)[1-e-a(Parameter-MPV)*B], where Parameter = mortgage rate - market rate MPV = Maximum Parameter Value, above which the PSA factor values monotonically increase as
the Prepayment Parameter value increases (e.g. -.01) min = minimum prepayment factor to be used (e.g. .75) max = maximum prepayment factor to be used (e.g. 10) a = a calculated value, based on the MPV value and the user specified value at which prepayments
equal (min PSA + max PSA)/2 (e.g. min+max PSA/2 = .03) B = The curvature of the prepayment factor curve (e.g. 2)

CONFIDENTIAL Report on PBR Reserves for Surak Life
February 28, 2012
14
Mortgages were modeled with different factors. These factors were chosen to approximate the actual prepayments where applicable. An example of how the above calculation would work is as follows: given a 30 year MBS issued in 1996, with an 8% coupon rate, the 100% PSA would equal 6%. This is the prepayment rate that would be expected in a level interest rate environment. Using the values given above as example, the calculated value of a would be 433.217. If interest rates were to fall 3%, the above formula would be: .75+9.25 x [1 - e-433.217x(.03--.01)*2], or a factor of 5.375 x PSA, or 32% prepayments expected if rates drop 3%.
I. CALLS
Call schedules and call premiums were entered on a seriatim basis for all bonds noted as callable. Calls are determined by using "call input parameters" and a hypothetical parameter equal to ratio of the theoretical market value to the call price. The first call input parameter is the maximum value of the call protected value/balance ratio where the call rate is assumed to be zero. The assumption used for modeling was 1.02. The second call input parameter is the minimum market value/call value ratio where the call rate is assumed to be one. This assumption is 1.06. The call rate is linearly interpolated between these two values. Therefore, if the market price of the bond rises 10% or more, 100% is assumed to be called.
J. PUTS
Surak Life owns a number of putable bonds which hedge the deferred annuity segment against rising interest rates. These are generally European Options and are assumed to be exercised if they are in the money when the option window is open.
K. UL VARIABLE ACCOUNT
There are three variable account choices for UL: an indexed S&P 500 fund, a bond fund, and an international fund.

CONFIDENTIAL Report on PBR Reserves for Surak Life
February 28, 2012
15
IV. OTHER DISCLOSURE ITEMS A. IMPACT OF ASSUMPTION MARGINS 1. Aggregate Impact of margins Total Seg 2 Seg 3 Seg 4 Deterministic Reserve 437,000 25,000 322,000 90,000 Reserve with no margins 375,000 20,000 295,000 60,000 Aggregate Margin 62,000 5,000 27,000 30,000
While not required, the company expressed the aggregate margin in terms of a margin ratio, which takes the ratio of the aggregate margin to the PV of future RBC requirements. For the following products, the values of the Margin Ratios are as follows:
20 Year Term Insurance At issue 45.7%After 10 years 44.4%
Accumulation UL At issue 9.9%After 10 years 9.5% UL With Shadow Account At issue 12.9%After 10 years 12.5% VUL At issue 7.9% After 10 years 7.5%

CONFIDENTIAL Report on PBR Reserves for Surak Life
February 28, 2012
16
2. Impact of each margin a. Mortality Total Seg 2 Seg 3 Seg 4
Deterministic Reserve 437,000 25,000 322,000 90,000 Reserve with no mortality margin 420,000 20,000 315,000 85,000 Mortality Margin 17,000 5,000 7,000 5,000
b. Policyholder Behavior Total Seg 2 Seg 3 Seg 4
Deterministic Reserve 437,000 25,000 322,000 90,000 Reserve with no PHB margin 412,000 25,000 305,000 82,000 PHB Margin 25,000 0 17,000 8,000
c. Asset return Total Seg 2 Seg 3 Seg 4
Deterministic Reserve 437,000 25,000 322,000 90,000 Reserve with no asset margin 407,000 25,000 312,000 70,000 Asset Margin 30,000 0 10,000 20,000
d. Expenses
Total Seg 2 Seg 3 Seg 4
Deterministic Reserve 437,000 25,000 322,000 90,000 Reserve with no expense margin 431,500 24,500 320,000 87,000 Asset Margin 5,500 500 2,000 3,000
B. MATERIAL RISKS NOT INCLUDED IN CASH FLOW MODEL NEEDING ADJUSTMENT None

CONFIDENTIAL Report on PBR Reserves for Surak Life
February 28, 2012
17
C. IMPACT OF AGGREGATION
The analysis of the impact of aggregation was performed on 6/30. The Reported Reserve was calculated for the policies in each asset segment on a standalone basis, and then summed and compared to the total Reported Reserve with full aggregation. Here is the result: Segment 2 standalone reserve $ 25,000
Segment 3 standalone reserve 350,000 Segment 4 standalone reserve 125,000 Total 500,000 Total reserve with aggregation 450,000 Impact of aggregation $ 50,000 D. EMBEDDED SPREAD ON STARTING ASSETS Seg 2 Seg 3 Seg 4 1. Market value of assets $24,000 $360,000 $105,000 2. Statutory value of assets $ 25,000 $350,000 $90,000 3. Gross option-adjusted spread 150 bp 165 bp 185 bp 4. Average annual default costs 40 45 60 5. Net option-adjusted spread 110 120 125 6. Aggregate weighted average life 6.5 8.2 7.3 E. TEST OF CONSISTENCY OF DISCOUNT RATES Segment 3 used for this test, under scenario #456. a. Starting assets for test = Scenario reserve for scenario #456: 365,000 b. Accumulated assets at GPVAD point (year 25): 10,000 c. Discounted value of (b) at time zero 2,500 Conclusion: value in (c) is close enough to zero to confirm consistency of discount rates.

CONFIDENTIAL Report on PBR Reserves for Surak Life
February 28, 2012
18
V. RESULTS A. BASIC RESULTS
The 20 year term was tested on a deterministic basis only. See Section I.(K).
The Scenario Reserves for the UL products are given in the tables below. B. SENSITIVITY TESTS
The sensitivity of the UL to different premium patterns is also given below.
1. Minimum premium scenario 2. No further premium payment scenario 3. Pre-payment of premiums – Single premium scenario 4. Pre-payment of premiums – Level premium scenario.

CONFIDENTIAL Report on PBR Reserves for Surak Life
February 28, 2012
19
Results for Accumulation UL
Scenario Reserves
0
20000
40000
60000
80000
100000
120000
140000
1 90 179 268 357 446 535 624 713 802 891 980

CONFIDENTIAL Report on PBR Reserves for Surak Life
February 28, 2012
20
Results for Accumulation UL Scenario Reserves
Various Premium Payment Patterns
Accum UL- No more prem
0
20000
40000
60000
80000
100000
120000
1 91 181 271 361 451 541 631 721 811 901 991
Accum UL - min prem
0
20000
40000
60000
80000
100000
120000
140000
1 89 177 265 353 441 529 617 705 793 881 969
Accum UL - Single Prem
0
20000
40000
60000
80000
100000
120000
1 89 177 265 353 441 529 617 705 793 881 969
Accum UL- Level Prem
0
20000
40000
60000
80000
100000
120000
1 89 177 265 353 441 529 617 705 793 881 969

CONFIDENTIAL Report on PBR Reserves for Surak Life
February 28, 2012
21
Results for UL with Shadow Account Scenario Reserves
0
50000
100000
150000
200000
250000
300000
1 90 179 268 357 446 535 624 713 802 891 980

CONFIDENTIAL Report on PBR Reserves for Surak Life
February 28, 2012
22
Results for UL with Shadow Account Scenario Reserves
Various Premium Payment Patterns
Shadow UL - min prem
0
50000
100000
150000
200000
250000
300000
1 125 249 373 497 621 745 869 993
Shadow UL- No more prem
0
50000
100000
150000
200000
250000
1 104 207 310 413 516 619 722 825 928

CONFIDENTIAL Report on PBR Reserves for Surak Life
February 28, 2012
23
Results for UL for Shadow Account Scenario Reserves
Various Premium Payment Patterns - continued
Shadow UL - Single Prem
0
50000
100000
150000
200000
250000
300000
1 109 217 325 433 541 649 757 865 973
Shadow UL- Level Prem
0
50000
100000
150000
200000
250000
300000
1 110 219 328 437 546 655 764 873 982

CONFIDENTIAL Report on PBR Reserves for Surak Life
February 28, 2012
24
Variable UL Results
Scenario Reserves
0
20000
40000
60000
80000
100000
120000
1 90 179 268 357 446 535 624 713 802 891 980

CONFIDENTIAL Report on PBR Reserves for Surak Life
February 28, 2012
25
Results for Variable UL Scenario Reserves
Various Premium Payment Patterns
VUL- No more prem
01000020000300004000050000
60000700008000090000
100000
1 104 207 310 413 516 619 722 825 928
VUL - min prem
0
20000
40000
60000
80000
100000
120000
140000
1 125 249 373 497 621 745 869 993

CONFIDENTIAL Report on PBR Reserves for Surak Life
February 28, 2012
26
Results for Variable UL Scenario Reserves
Various Premium Payment Patterns – continued
VUL - Single Prem
0
20000
40000
60000
80000
100000
120000
1 109 217 325 433 541 649 757 865 973
VUL- Level Prem
0
20000
40000
60000
80000
100000
120000
1 110 219 328 437 546 655 764 873 982

CONFIDENTIAL Report on PBR Reserves for Surak Life
February 28, 2012
27
C. MARGINS
20 Year Term Insurance For 20 year term insurance, the margins are as follows: Discount Rate Margin Deterministi
c Mortality Margin 0.009375/ex Lapse Rate Margin 30% Expense Margin 5% Accumulation UL Discount Rate Margin Stochastic Mortality Margin 0.009375/exLapse Rate Margin 30% Expense Margin 5% UL With Shadow Account Discount Rate Margin Stochastic Mortality Margin 0.009375/exLapse Rate Margin 30% Expense Margin 5% VUL Discount Rate Margin Stochastic Mortality Margin 0.009375/exLapse Rate Margin 30% Expense Margin 5%
CONFIDENTIAL Report on PBR Reserves for Surak Life
February 28, 2012
28
APPENDIX A-1 MORTALITY FACTORS
20 Year Term
ISSUE AGE - 45 ISSUE AGE - 65 Dur Live Actual Expected Expect Dur Lives Actual Expect Expected Exp Death Q/1000 Deaths A/E Expos Deaths Q/1000 Deaths A/E
0 15000 4 0.2224 3.336 1.1990 0 7000 7 0.8931 6.2517 1.1197 1 9000 4 0.3183 2.8647 1.3963 1 4000 8 1.6102 6.4408 1.2421 2 8000 5 0.3674 2.9392 1.7011 2 3000 7 2.1218 6.3654 1.0997 3 7000 3 0.4562 3.1934 0.9394 3 2500 8 2.8646 7.1615 1.1171 4 3000 4 0.5678 1.7034 2.3482 4 2000 7 3.6908 7.3816 0.9483 5 3000 3 0.7687 2.3061 1.3009 5 2000 11 4.9557 9.9114 1.1098 6 2000 2 0.9496 1.8992 1.0531 6 2000 13 5.8992 11.7984 1.1018 7 2000 2 1.1477 2.2954 0.8713 7 2000 13 6.8946 13.7892 0.9428 8 1000 1 1.3592 1.3592 0.7357 8 1000 9 7.9868 7.9868 1.1269 9 1000 2 1.58 1.58 1.2658 9 1000 10 9.8066 9.8066 1.0197
51000 30 23.4766 1.2779 26500 93 86.8934 1.0703 Total 77500 123 110.37 1.1144 LRWG Credibility Methodology- 9/ 2006
Blended Normalized
Total Deaths
Subcategory Full Credibility 1000 Experience Expected Blended Normalized Blended
Z (1-Z) Mortality Ratio Claims Mortality Ratio
Mortality Ratio
1 1.2779 0.17320508 1 0.8268 1.0481 24.6065 vii. 1.1372 26.6985 2 1.0703 0.30495901 1 0.6950 1.0214 88.7557 vii. 1.1083 96.3015
vi. 113.362 123 Canadian Education Note Normalized Credibility Total Credibility Factor (total number of claims) 0.3507 Normalized Normalized Credibility Adjusted total number of expected claims 114.7995 Cred. ADJ
Cred. Adj.
Normalized Expected Number of Deaths A/E ratios Exp. Deaths Subcateg 1 24.918
Subcategory 1 1.06142 24.9185
2 89.881 2 1.03438 89.8810 114.7995

CONFIDENTIAL Report on PBR Reserves for Surak Life
February 28, 2012
29
APPENDIX A-2 20 Year Term – age 45
Experience Normalized Credibility Extra
Table w/o Expose Actual Mortality A/E Blended Weighted Mort Mort
Margin Lives Deaths Curve Ratio Mortality Mortality Margin With Ratio Curve 9.375/ex Margin
45 0.2224 15000 4 0.2667 1.1990 1.0614 0.2361 0.2825 0.5186 46 0.3183 9000 4 0.4444 1.3963 1.0614 0.3378 0.2913 0.6291 47 0.3674 8000 5 0.6250 1.7011 1.0614 0.3900 0.3005 0.6905 48 0.4562 7000 3 0.4286 0.9394 1.0614 0.4842 0.3103 0.7945 49 0.5678 3000 4 1.3333 2.3482 1.0614 0.6027 0.3208 0.9235 50 0.7687 3000 3 1.0000 1.3009 1.0614 0.8159 0.3320 1.1479 51 0.9496 2000 2 1.0000 1.0531 1.0614 1.0079 0.3440 1.3519 52 1.1477 2000 2 1.0000 0.8713 1.0614 1.2182 0.3568 1.5750 53 1.3592 1000 1 1.0000 0.7357 1.0614 1.4427 0.3706 1.8133 54 1.58 1000 2 2.0000 1.2658 1.0614 1.6770 0.3855 2.0625 55 1.8197 1.04 1.8925 0.4016 2.2941 56 2.1744 1.04 2.2614 0.4190 2.6804 57 2.4917 1.04 2.5914 0.4380 3.0294 58 2.7872 1.04 2.8987 0.4586 3.3573 59 3.1829 1.04 3.3102 0.4812 3.7914 60 3.8114 1.04 3.9639 0.5061 4.4700 61 4.4188 1.04 4.5956 0.5336 5.1292 62 5.092 1.04 5.2957 0.5642 5.8599 63 5.8117 1.04 6.0442 0.5938 6.6425 64 6.5463 1.04 6.8082 0.5983 7.4450

CONFIDENTIAL Report on PBR Reserves for Surak Life
February 28, 2012
30
APPENDIX A-3 20 Year Term Age 65
Company Normaliz Credibility Extra Table w/o Expose Actual Mortality A/E Blended Weighted Mort Mort Margin Lives Deaths Curve Ratio Mortality Mortality Margin With Ratio Curve 9.375/e Margin
65 0.8931 7000 7 1 1.1197 1.034 0.9235 0.6803 1.6038 66 1.6102 4000 8 2 1.2421 1.034 1.6649 0.7159 2.3808 67 2.1218 3000 7 2.3333 1.0997 1.034 2.1939 0.7544 2.9483 68 2.8646 2500 8 3.2 1.1171 1.034 2.962 0.7962 3.7582 69 3.6908 2000 7 3.5 0.9483 1.034 3.8163 0.8416 4.6579 70 4.9557 2000 11 5.5 1.1098 1.034 5.1242 0.8912 6.0154 71 5.8992 2000 13 6.5 1.1018 1.034 6.0998 0.9455 7.0453 72 6.8946 2000 13 6.5 0.9428 1.034 7.129 1.0042 8.1332 73 7.9868 1000 9 9 1.1269 1.034 8.2584 1.0690 9.3274 74 9.8066 1000 10 10 1.0197 1.034 10.14 1.1398 11.2798 75 11.6696 1.04 12.1364 1.2171 13.3535 76 14.2336 1.04 14.8029 1.3020 16.1049 77 17.3517 1.04 18.0458 1.3956 19.4414 78 21.152 1.04 21.9981 1.5002 23.4983 79 25.6968 1.04 26.7247 1.6187 28.3434 80 31.0263 1.04 32.2674 1.7551 34.0225 81 35.4571 1.04 36.8754 1.9001 38.7755 82 40.2823 1.04 41.8936 2.0502 43.9438 83 46.1584 1.04 48.0047 2.2136 50.2183 84 53.2092 1.04 55.3376 2.3929 57.7305

CONFIDENTIAL Report on PBR Reserves for Surak Life
February 28, 2012
31
APPENDIX B PREMIUM PATTERN
Surak Life 2011 Premium Pattern UL with
Accum UL VUL
Shadow Acct
No further premiums paid 5.3% 5.1% 2.0%Minimum Premium 19.5% 8.5% 9.6%Pre-payment of premiums- Single Prem 10.0% 22.1% 35.7%Pre-payment of premiums- Level Prem 65.2% 64.3% 52.7% 100.0% 100.0% 100.0% Assumption UL with
Accum UL VUL
Shadow Acct
No further premiums paid 5.0% 5.0% 2.0%Minimum Premium 20.0% 10.0% 10.0%Pre-payment of premiums- Single Prem 10.0% 20.0% 35.0%Pre-payment of premiums- Level Prem 65.0% 65.0% 53.0% 100.0% 100.0% 100.0%

CONFIDENTIAL Report on PBR Reserves for Surak Life
February 28, 2012
32
APPENDIX C
Surak Life 2011 Lapse Study 20 Year Term
ACTUAL LAPSES Assumed Baseline Lapses Lapses 30% Lower
Dur Age 45 Age 65 Age 45 Age 65
1 10.6% 8.1% 10.0% 8.0% 7.0% 5.6% 2 5.5% 4.3% 5.0% 4.0% 3.5% 2.8% 3 3.2% 2.5% 4.0% 3.0% 2.8% 2.1% 4 4.6% 3.2% 3.0% 3.0% 2.1% 2.1% 5 2.0% 2.0% 2.0% 2.0% 1.4% 1.4% 6 1.0% 1.0% 2.0% 1.0% 1.4% 0.7% 7 4.0% 1.1% 2.0% 1.0% 1.4% 0.7% 8 2.5% 1.0% 2.0% 1.0% 1.4% 0.7% 9 3.0% 1.2% 2.0% 1.0% 1.4% 0.7%
10 2.0% 1.0% 2.0% 1.0% 1.4% 0.7% 11+ 2.0% 1.0% 1.4% 0.7%
20 100% 100% 100% 100%
ASSUMED LAPSES
Accum. UL and Var UL Assumed Baseline Level Prem No prem Min prem Single Pay
Lapses Lapses 30% Higher Lapses 30% Higher Lapses 30% Higher Lapses 30% Higher
Dur Age 45 Age 65 Age 45 Age 65
Age 45 Age 65 Age 45 Age 65
Age 45 Age 65
Age 45 Age 65
1 8.5% 6.5% 9.0% 7.0% 11.7% 9.1% 30.0% 25.0% 10.0% 10.0% 3.0% 2.0% 2 9.5% 6.8% 9.0% 7.0% 11.7% 9.1% 35.0% 35.0% 15.0% 15.0% 2.0% 1.0% 3 3.5% 5.2% 5.0% 5.0% 6.5% 6.5% 50.0% 50.0% 20.0% 15.0% 2.0% 1.0% 4 6.3% 4.3% 5.0% 5.0% 6.5% 6.5% 100.0% 100.0% 20.0% 15.0% 2.0% 1.0% 5 6.6% 5.6% 5.0% 5.0% 6.5% 6.5% 25.0% 20.0% 1.0% 1.0% 6 4.3% 3.9% 5.0% 4.0% 6.5% 5.2% 25.0% 20.0% 1.0% 1.0% 7 5.6% 3.8% 5.0% 4.0% 6.5% 5.2% 25.0% 20.0% 1.0% 1.0% 8 1.2% 4.2% 4.0% 4.0% 5.2% 5.2% 25.0% 20.0% 1.0% 1.0% 9 2.8% 3.2% 4.0% 4.0% 5.2% 5.2% 25.0% 20.0% 1.0% 1.0%
10 5.3% 4.8% 4.0% 4.0% 5.2% 5.2% 25.0% 20.0% 1.0% 1.0% 11+ 4.0% 4.0% 5.2% 5.2% 25.0% 20.0% 1.0% 1.0%
ASSUMED LAPSES
UL With Shadow Account Assumed Baseline No prem Min prem Single Pay
Lapses Level Prem Lapses 30% Lower Lapses 30% Lower Lapses 30% Lower
Dur Age 45 Age 65 Age 45 Age 65
Age 45
Age 65 Age 45 Age 65
Age 45 Age 65
Age 45 Age 65
1 7.3% 5.4% 5.0% 3.0% 3.5% 2.1% 25.0% 25.0% 5.0% 3.0% 2.0% 2.0% 2 4.5% 3.7% 3.0% 2.0% 2.1% 1.4% 30.0% 30.0% 4.0% 2.0% 1.0% 1.0% 3 3.0% 1.8% 3.0% 2.0% 2.1% 1.4% 40.0% 35.0% 3.0% 2.0% 1.0% 1.0% 4 2.5% 1.2% 2.0% 1.0% 1.4% 0.7% 40.0% 40.0% 3.0% 1.0% 1.0% 1.0% 5 1.8% 1.0% 1.0% 1.0% 0.7% 0.7% 60.0% 50.0% 3.0% 1.0% 1.0% 1.0%
6+ 1.0% 1.0% 0.7% 0.7% 100.0% 100.0% 2.0% 1.0% 1.0% 1.0%