Sample Drive Test Report
14
Sample Drive Test Report Last Updated: April 11, 2003
Transcript of Sample Drive Test Report
Sample Drive Test Report Last Updated: April 11, 2003
Sample Drive Test Report
EnVision Wireless, Inc. Confidential - i - 4/11/2003
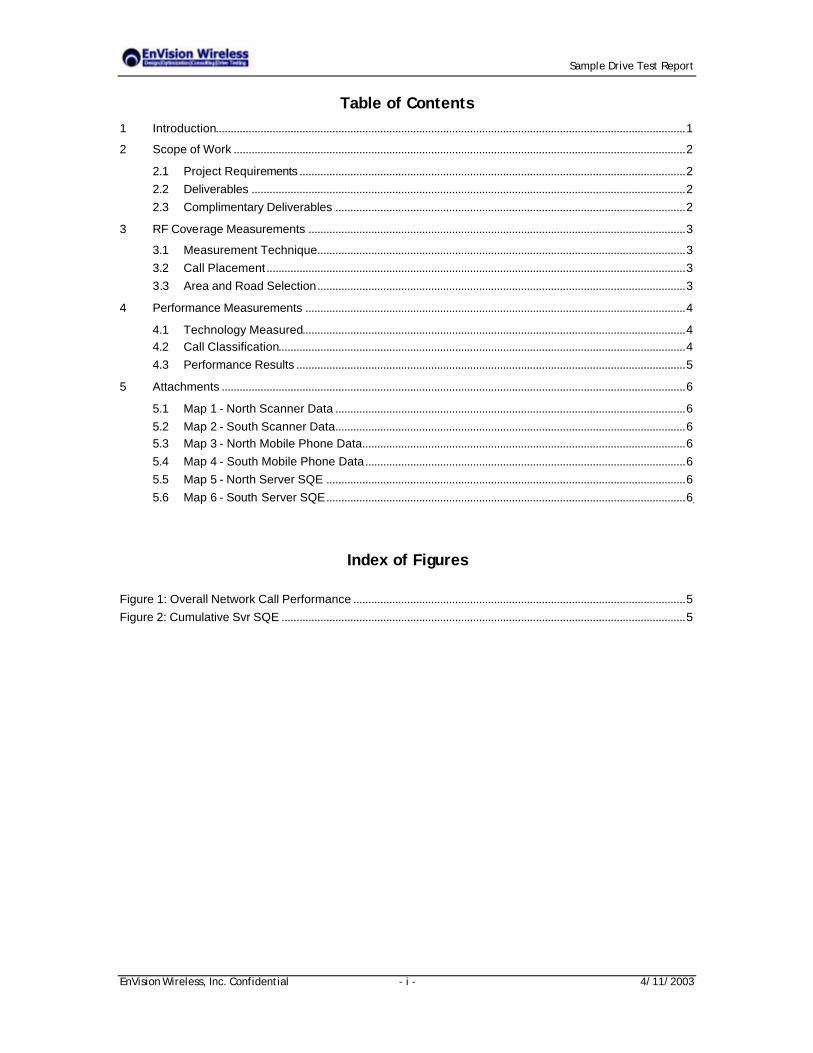
Table of Contents 1 Introduction.............................................................................................................................................................1 2 Scope of Work .......................................................................................................................................................2
2.1 Project Requirements .................................................................................................................................2 2.2 Deliverables .................................................................................................................................................2 2.3 Complimentary Deliverables .....................................................................................................................2
3 RF Coverage Measurements ..............................................................................................................................3 3.1 Measurement Technique...........................................................................................................................3 3.2 Call Placement............................................................................................................................................3 3.3 Area and Road Selection...........................................................................................................................3
4 Performance Measurements ...............................................................................................................................4 4.1 Technology Measured................................................................................................................................4 4.2 Call Classification........................................................................................................................................4 4.3 Performance Results ..................................................................................................................................5
5 Attachments ...........................................................................................................................................................6 5.1 Map 1 - North Scanner Data .....................................................................................................................6 5.2 Map 2 - South Scanner Data.....................................................................................................................6 5.3 Map 3 - North Mobile Phone Data............................................................................................................6 5.4 Map 4 - South Mobile Phone Data...........................................................................................................6 5.5 Map 5 - North Server SQE ........................................................................................................................6 5.6 Map 6 - South Server SQE........................................................................................................................6
Index of Figures
Figure 1: Overall Network Call Performance ...............................................................................................................5 Figure 2: Cumulative Svr SQE .......................................................................................................................................5
Sample Drive Test Report
EnVision Wireless, Inc. Confidential - 1 - 4/11/2003
1 Introduction
EnVision Wireless is an RF engineering firm that specializes in the design, optimization and testing of today’s wireless communication networks. Our engineering staff has experience in implementing networks based on all major wireless technologies including CDMA, GSM, iDEN and TDMA as well as the newer 3G technologies of CDMA2000 and UMTS. As an Agilent Authorized Services Provider (ASP), EnVision has been trained and certified in the use of Agilent’s engineering processes as well as their wireless products including Wizard, Nitro, Portable Voiceprint and OPAS32. Participation in this program provides EnVision with unprecedented access to the most advanced test and measurement tools available for the engineering of today’s wireless networks. The end result – EnVision can offer more advanced and efficient solutions to its clients at very competitive prices. The following is a list of the services we provide: § Wi-Fi design, testing and installation § Wizard propagation model optimization § Data analysis and post processing § Radio network design § Network optimization § Traffic planning § Frequency planning § Site validation § Search area map creation § Zoning support § On-site consulting § Training § Network benchmarking § Project management § Fixed network design § Facilities coordination
For more information on the services offered by EnVision Wireless, please call (321) 674-9010 or email us at [email protected].
Sample Drive Test Report
EnVision Wireless, Inc. Confidential - 2 - 4/11/2003
2 Scope of Work
The client has contracted EnVision Wireless for RF drive testing services. The following sections detail the project requirements and deliverables for this drive test survey.
2.1 Project Requirements
§ Passive RF measurements (RSL) will be recorded on the client’s network around multiple search rings.
§ Scanner and phone measurements will be recorded. § EnVision will provide one drive test team and equipment necessary to complete the
project. § EnVision will post process the data and generate coverage plots. § The client will provide a list of channels to be included in the scan lists for each search
ring. § The client will provide the search rings and/or drive test areas to be surveyed.
2.2 Deliverables
EnVision understands the client’s goal is to characterize the best server from their network in the drive test areas. The deliverables for this project are as follows: § RF coverage plots (strongest server) for each of the search rings measured. One plot
will be based on the data from the scanning receiver and one plot from the handset. Display bands have been specified by the client.
§ A CD containing the raw measured data collected by the drive test team.
2.3 Complimentary Deliverables
Additional services are being provided to the client at no additional charge. The following additional information is included in this report: § Overall network call statistics: Ø Completed Calls Ø Blocked Calls Ø Dropped Calls Ø No Services Calls
§ Svr SQE profile (distribution graph) § Svr SQE geographic plot
Sample Drive Test Report
EnVision Wireless, Inc. Confidential - 3 - 4/11/2003
3 RF Coverage Measurements
The following sections describe the equipment, configuration and methodology used during data collection phase of this project. Geographical coverage plots of the strongest server (scanner and mobile phone) are provided in section 3.3. To maintain detail, overall data was divided geographically (North and South) and mapped.
3.1 Measurement Technique
Agilent Portable Voiceprint equipment was configured with a DTI iDEN Seagull scanner to record continuous channel measurements. The channels, provided by the client, were scanned at a rate of 260 channels per second and recorded using Agilent Nitro software. Mobile phone metrics (Svr Power) were recorded using Agilent Portable Voiceprint equipment. Data was collected continuously during periods of idle and TI Encode call status. Null gain external antennas were used for both the scanner and mobile phone devices.
3.2 Call Placement
The following details the call placement requirements for this project: § The network testing was performed during the weekdays and between the hours of
7:00 AM and 9:00 PM. § A Motorola r370xl handset was used to place calls from within the drive test vehicle
(in-vehicle portable using an null gain external antenna configuration). § Calls were placed on the client’s network with a call duration of 90 seconds (typical
average call length) with an idle time of 20 seconds between calls.
3.3 Area and Road Selection
The following details the area and road selection requirements for this project: § Approximately 575 miles were driven over 3 days. § Area drive routes were selected by the client.
Sample Drive Test Report
EnVision Wireless, Inc. Confidential - 4 - 4/11/2003
4 Performance Measurements
This section discusses the technology measured, call classifications and the performance evaluation for this data collection project. Performance call statistics (graphical and tabular) are displayed in sections 4.3.1 and 4.3.2. A Cumulative SQE profile is shown in section 4.3.3 with a graphical presentation of Svr SQE in section 4.3.4.
4.1 Technology Measured
One network was evaluated for this survey. The carrier, technology and handset used for the measurements are shown in the following table as a reference.
Surveyed Network Information
Carrier Technology Handset
Client iDEN Motorola r370 xl
4.2 Call Classification
The following call classification definitions apply to all measurements presented in this report: § NO SERVICE - If the phone is out of the service area, the call is classified as no service.
In other words, the call is not completed due to a lack of synchronization on the control channel.
§ BLOCKED - A blocked call attempt has no voice channel assigned within the call setup
interval (typically 20 seconds). This includes calls being disconnected at the PSTN. § DROPPED - If the call ends prematurely after a voice channel has been assigned, the
call is classified as a dropped call. § COMPLETED - If the call ends correctly at the end of the specified call the call is
classified as a completed call. Although the call is classified as completed or good, this is considered the minimum standard of operation and is no indication of the user-perceived quality.
Sample Drive Test Report
EnVision Wireless, Inc. Confidential - 5 - 4/11/2003
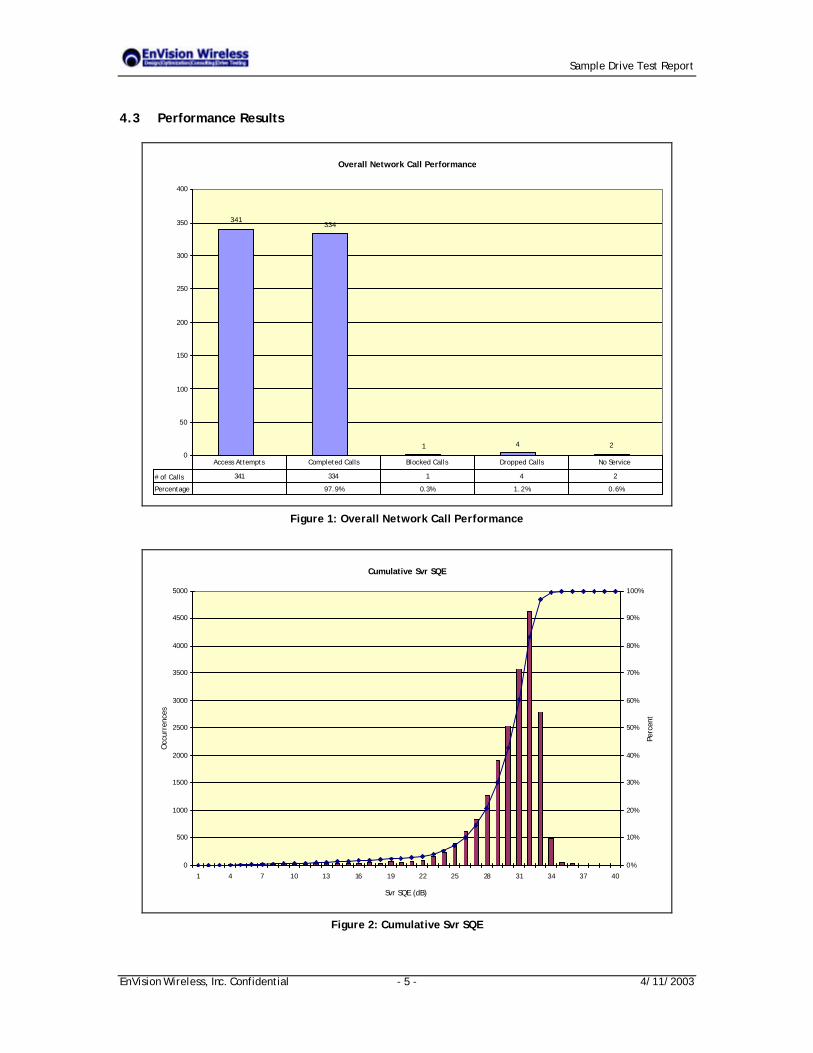
4.3 Performance Results
Overall Network Call Performance
341334
1 4 20
50
100
150
200
250
300
350
400
# of Calls 341 334 1 4 2
Percentage 97.9% 0.3% 1.2% 0.6%
Access Attempts Completed Calls Blocked Calls Dropped Calls No Service
Figure 1: Overall Network Call Performance
Cumulative Svr SQE
0
500
1000
1500
2000
2500
3000
3500
4000
4500
5000
1 4 7 10 13 16 19 22 25 28 31 34 37 40
Svr SQE (dB)
Occ
urre
nces
0%
10%
20%
30%
40%
50%
60%
70%
80%
90%
100%
Perc
ent
Figure 2: Cumulative Svr SQE

Sample Drive Test Report
EnVision Wireless, Inc. Confidential - 6 - 4/11/2003
5 Attachments
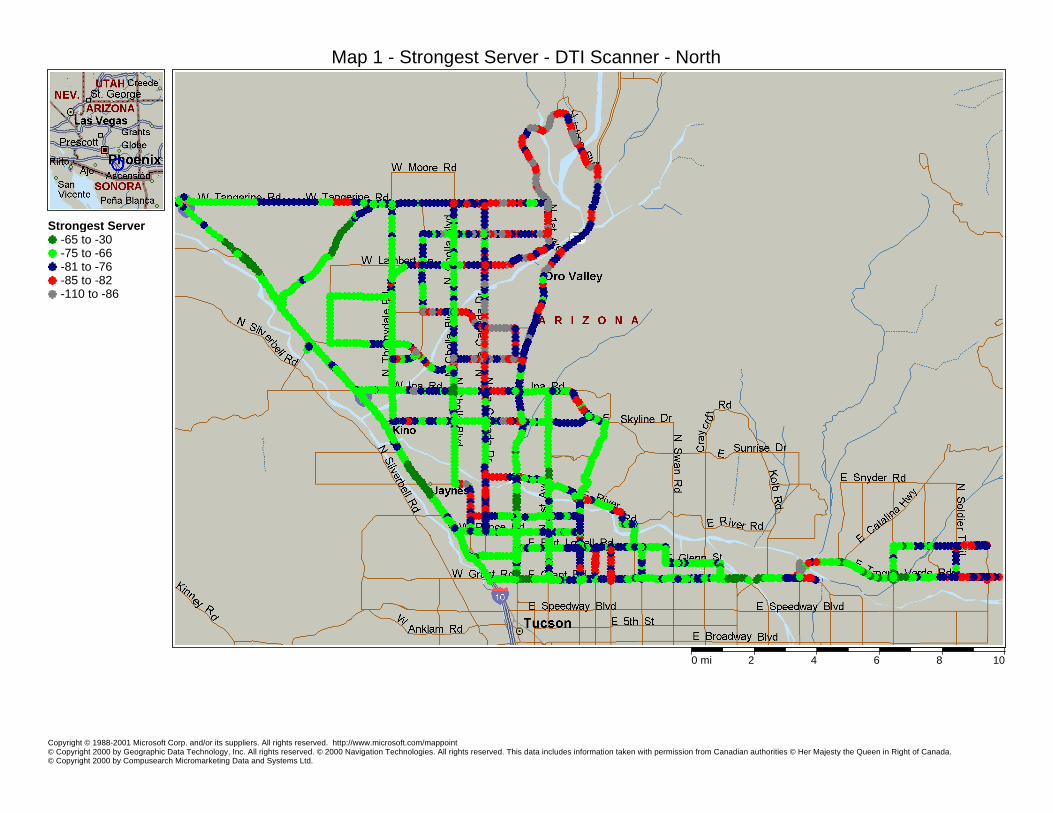
5.1 Map 1 - North Scanner Data
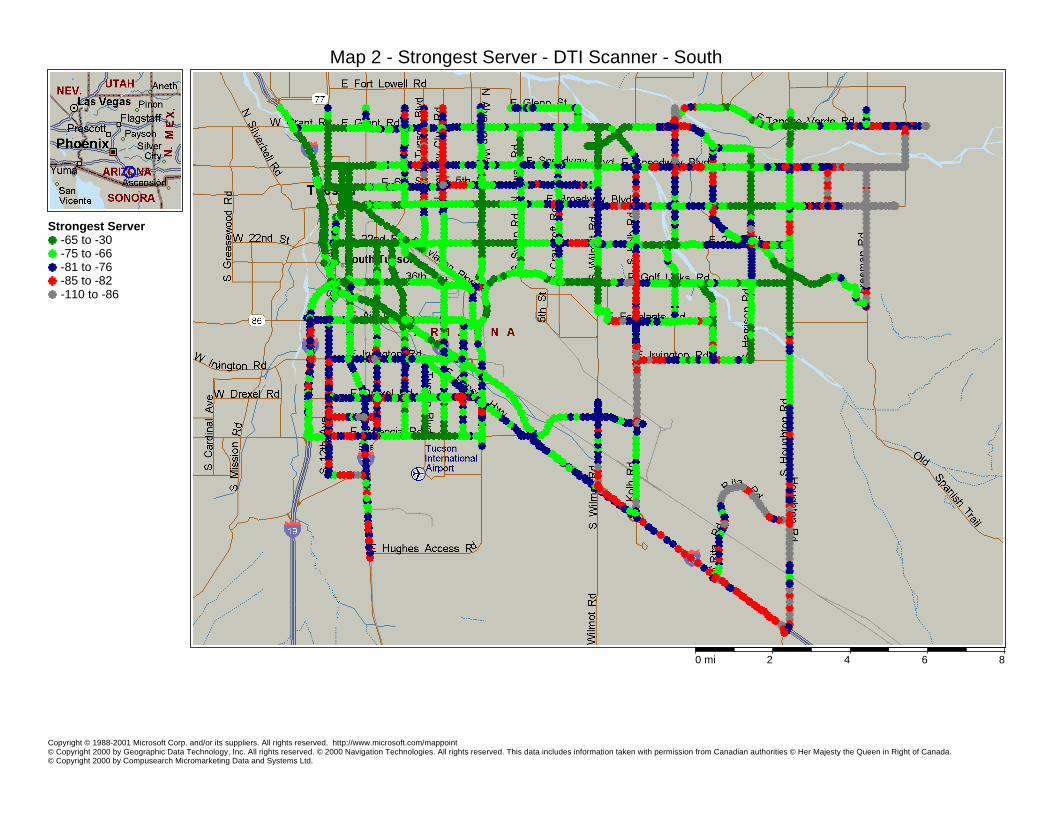
5.2 Map 2 - South Scanner Data
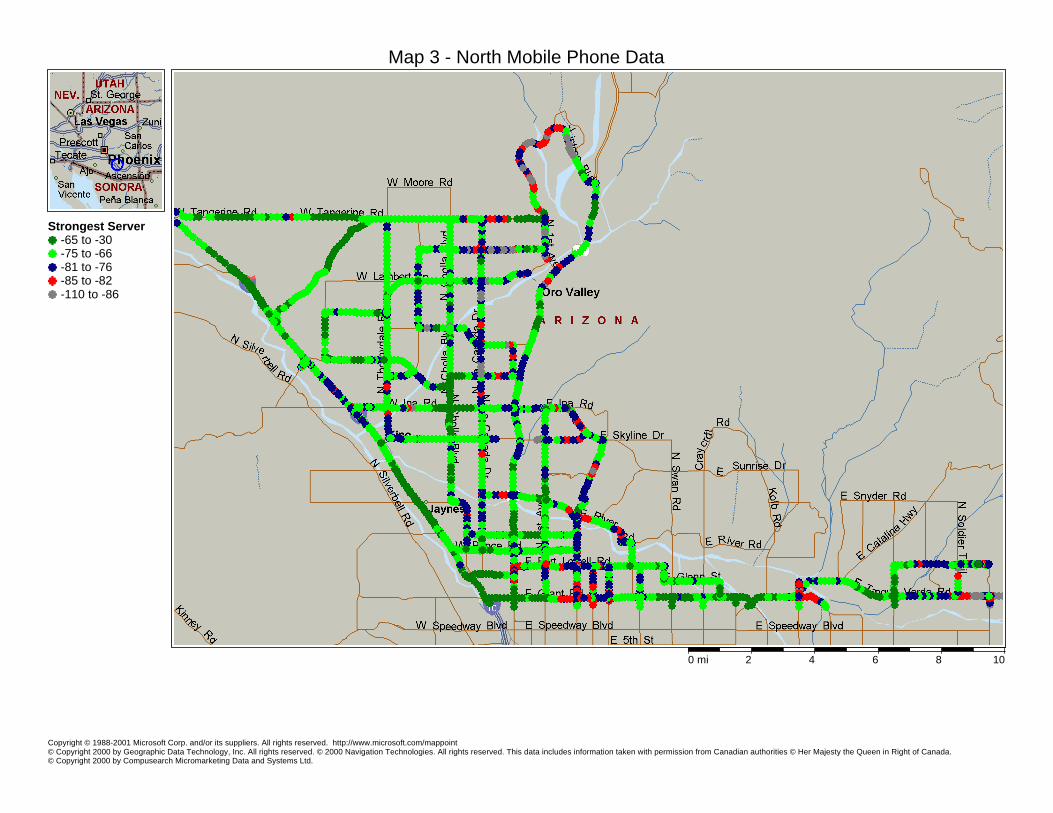
5.3 Map 3 - North Mobile Phone Data
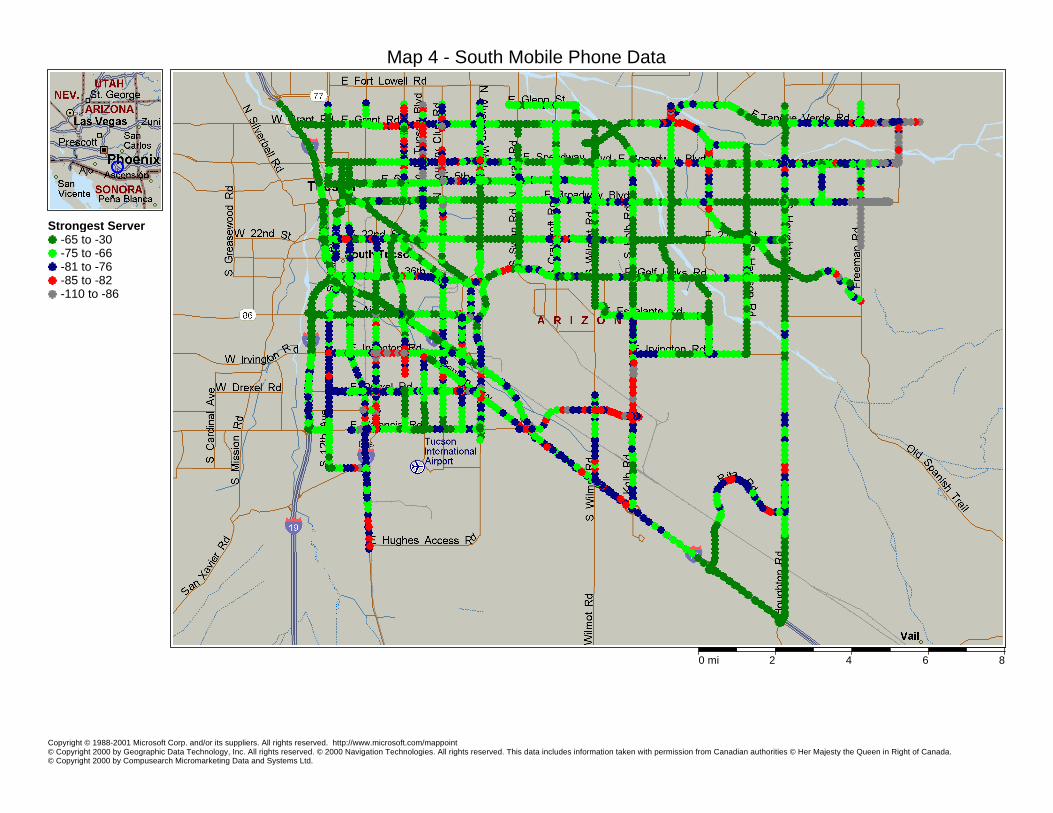
5.4 Map 4 - South Mobile Phone Data
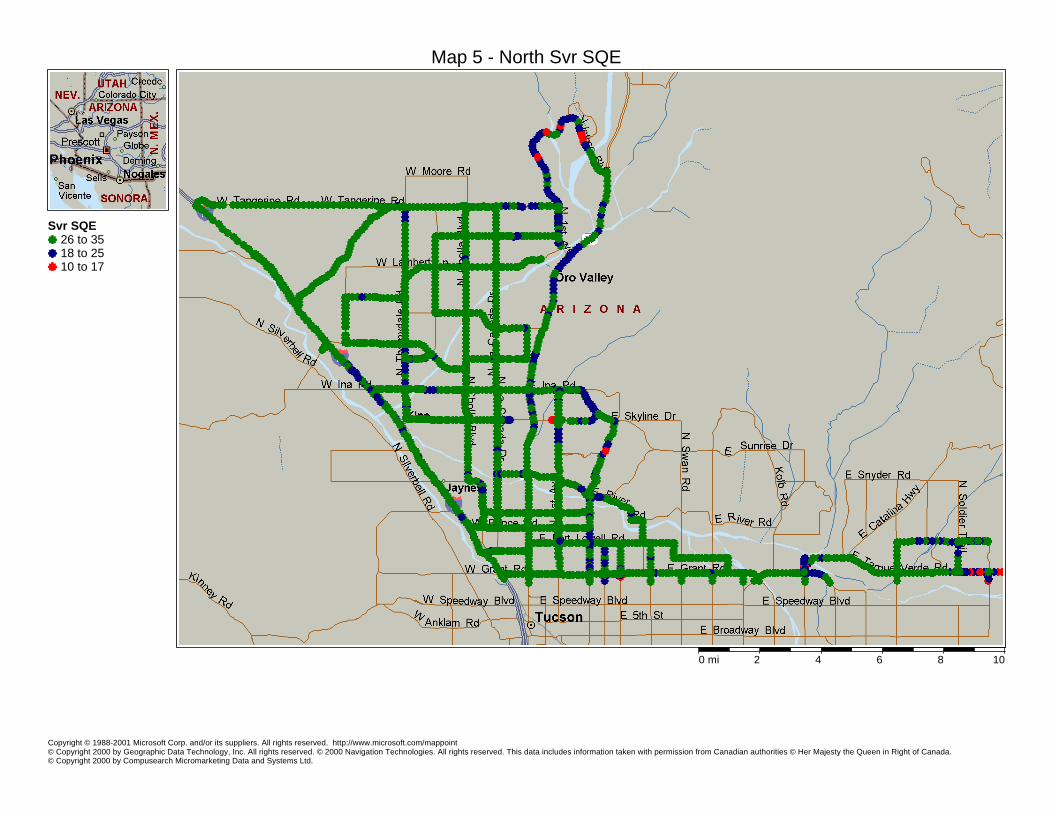
5.5 Map 5 - North Server SQE
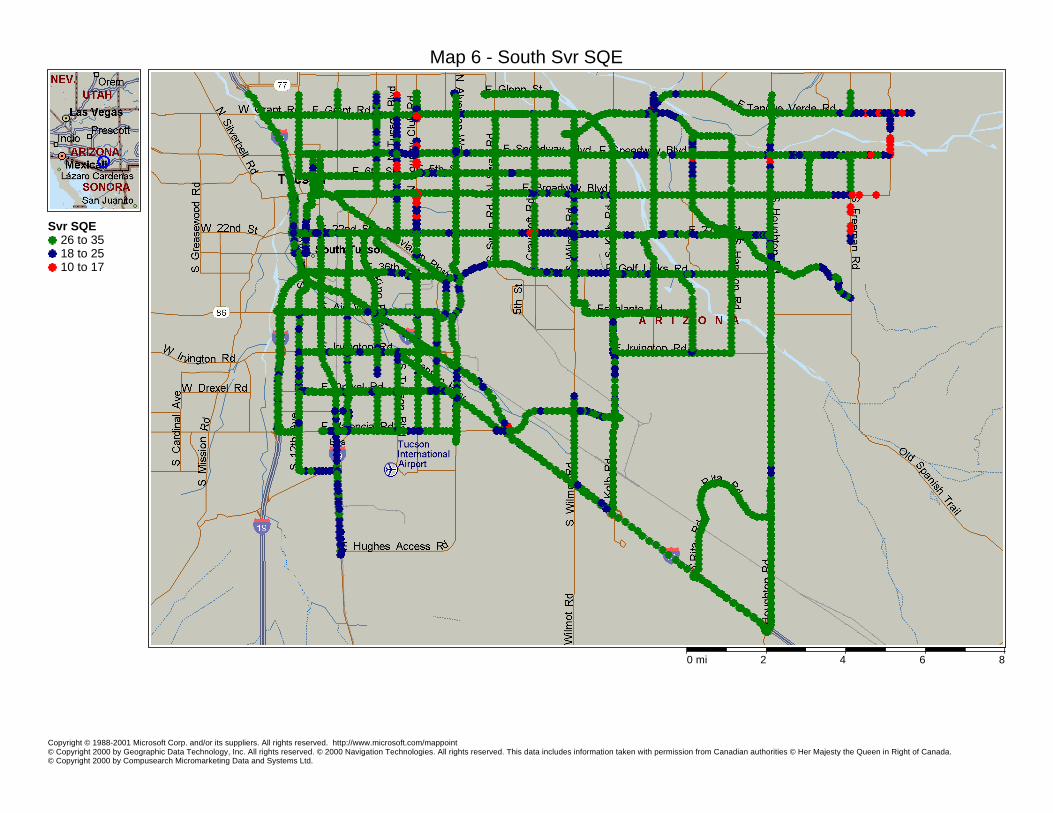
5.6 Map 6 - South Server SQE
Copyright © 1988-2001 Microsoft Corp. and/or its suppliers. All rights reserved. http://www.microsoft.com/mappoint© Copyright 2000 by Geographic Data Technology, Inc. All rights reserved. © 2000 Navigation Technologies. All rights reserved. This data includes information taken with permission from Canadian authorities © Her Majesty the Queen in Right of Canada. © Copyright 2000 by Compusearch Micromarketing Data and Systems Ltd.
Map 1 - Strongest Server - DTI Scanner - North
0 mi 2 4 6 8 10
Strongest Server-65 to -30-75 to -66-81 to -76-85 to -82-110 to -86
Copyright © 1988-2001 Microsoft Corp. and/or its suppliers. All rights reserved. http://www.microsoft.com/mappoint© Copyright 2000 by Geographic Data Technology, Inc. All rights reserved. © 2000 Navigation Technologies. All rights reserved. This data includes information taken with permission from Canadian authorities © Her Majesty the Queen in Right of Canada. © Copyright 2000 by Compusearch Micromarketing Data and Systems Ltd.
Map 2 - Strongest Server - DTI Scanner - South
0 mi 2 4 6 8
Strongest Server-65 to -30-75 to -66-81 to -76-85 to -82-110 to -86
Copyright © 1988-2001 Microsoft Corp. and/or its suppliers. All rights reserved. http://www.microsoft.com/mappoint© Copyright 2000 by Geographic Data Technology, Inc. All rights reserved. © 2000 Navigation Technologies. All rights reserved. This data includes information taken with permission from Canadian authorities © Her Majesty the Queen in Right of Canada. © Copyright 2000 by Compusearch Micromarketing Data and Systems Ltd.
Map 3 - North Mobile Phone Data
0 mi 2 4 6 8 10
Strongest Server-65 to -30-75 to -66-81 to -76-85 to -82-110 to -86
Copyright © 1988-2001 Microsoft Corp. and/or its suppliers. All rights reserved. http://www.microsoft.com/mappoint© Copyright 2000 by Geographic Data Technology, Inc. All rights reserved. © 2000 Navigation Technologies. All rights reserved. This data includes information taken with permission from Canadian authorities © Her Majesty the Queen in Right of Canada. © Copyright 2000 by Compusearch Micromarketing Data and Systems Ltd.
Map 4 - South Mobile Phone Data
0 mi 2 4 6 8
Strongest Server-65 to -30-75 to -66-81 to -76-85 to -82-110 to -86
Copyright © 1988-2001 Microsoft Corp. and/or its suppliers. All rights reserved. http://www.microsoft.com/mappoint© Copyright 2000 by Geographic Data Technology, Inc. All rights reserved. © 2000 Navigation Technologies. All rights reserved. This data includes information taken with permission from Canadian authorities © Her Majesty the Queen in Right of Canada. © Copyright 2000 by Compusearch Micromarketing Data and Systems Ltd.
Map 5 - North Svr SQE
0 mi 2 4 6 8 10
Svr SQE 26 to 3518 to 2510 to 17
Copyright © 1988-2001 Microsoft Corp. and/or its suppliers. All rights reserved. http://www.microsoft.com/mappoint© Copyright 2000 by Geographic Data Technology, Inc. All rights reserved. © 2000 Navigation Technologies. All rights reserved. This data includes information taken with permission from Canadian authorities © Her Majesty the Queen in Right of Canada. © Copyright 2000 by Compusearch Micromarketing Data and Systems Ltd.
Map 6 - South Svr SQE
0 mi 2 4 6 8
Svr SQE26 to 3518 to 2510 to 17