Sample Chapter 12
32
374 part three Commercial Banks WHY EVALUATE THE PERFORMANCE OF COMMERCIAL BANKS? CHAPTER OVERVIEW Unlike other private corporations, commercial banks (CBs) are unique in the special ser- vices they perform (e.g., assistance in the implementation of monetary policy) and the level of regulatory attention they receive (see Chapters 1 and 13). CBs are, as a result, unique in the types of assets and liabilities they hold. Like any for-profit corporation, how- ever, the ultimate measure of a CB’s performance is the value of its common equity to its shareholders. This chapter discusses the financial statements of these institutions. Man- agers, stockholders, depositors, regulators, and other parties use performance, earnings, and other measures obtained from financial statements to evaluate commercial banks. For example, the In The News box looks at how regulators use financial statement data to evaluate the overall safety and soundness of a bank. As we proceed through the chapter, notice the extent to which regulators’ evaluation of the overall safety and soundness of a bank (or their assignment of a so-called CAMELS rating) depends on financial statement data. Given the extensive level of regulation and the accompanying requirements for public availability of financial information, the financial statements of commercial banks are ideal candidates to use in examining the performance of depository institutions. This chapter uses commercial banks to illustrate a return on equity (ROE) frame- work as a method of evaluating depository institutions’ profitability. The ROE framework decomposes this frequently used measure of profitability into its various component parts Commercial Banks’ Financial Statements and Analysis Learning Goals LG 1. Understand the four major categories of assets on a commercial bank’s balance sheet. LG 2. Distinguish between core deposits and purchased funds. LG 3. Identify off-balance-sheet activities that commercial banks undertake. LG 4. Describe the major categories on a commercial bank’s income statement. LG 5. Examine ratios that can be used to analyze a commercial bank. OUTLINE Why Evaluate the Performance of Commercial Banks? Chapter Overview Financial Statements of Commercial Banks Balance Sheet Structure Off-Balance-Sheet Assets and Liabilities Other Fee-Generating Activities Income Statement Direct Relationship between the Income Statement and the Balance Sheet Financial Statement Analysis Using a Return on Equity Framework Return on Equity and Its Components Return on Assets and Its Components Other Ratios Impact of Market Niche and Bank Size on Financial Statement Analysis Impact of a Bank’s Market Niche Impact of Size on Financial Statement Analysis chapter 12
-
Upload
akash-bafna -
Category
Documents
-
view
333 -
download
4
description
study
Transcript of Sample Chapter 12

374
part three Commercial Banks
WHY EVALUATE THE PERFORMANCE OF COMMERCIAL BANKS? CHAPTER OVERVIEW Unlike other private corporations, commercial banks (CBs) are unique in the special ser-vices they perform (e.g., assistance in the implementation of monetary policy) and the level of regulatory attention they receive (see Chapters 1 and 13 ). CBs are, as a result, unique in the types of assets and liabilities they hold. Like any for-profit corporation, how-ever, the ultimate measure of a CB’s performance is the value of its common equity to its shareholders. This chapter discusses the financial statements of these institutions. Man-agers, stockholders, depositors, regulators, and other parties use performance, earnings, and other measures obtained from financial statements to evaluate commercial banks. For example, the In The News box looks at how regulators use financial statement data to evaluate the overall safety and soundness of a bank. As we proceed through the chapter, notice the extent to which regulators’ evaluation of the overall safety and soundness of a bank (or their assignment of a so-called CAMELS rating) depends on financial statement data. Given the extensive level of regulation and the accompanying requirements for public availability of financial information, the financial statements of commercial banks are ideal candidates to use in examining the performance of depository institutions.
This chapter uses commercial banks to illustrate a return on equity (ROE) frame-work as a method of evaluating depository institutions’ profitability. The ROE framework decomposes this frequently used measure of profitability into its various component parts
Commercial Banks’ Financial Statements and Analysis
L e a r n i n g G o a l s
LG 1. Understand the four major categories of assets on a commercial bank’s balance sheet .
LG 2. Distinguish between core deposits and purchased funds .
LG 3. Identify off-balance-sheet activities that commercial banks undertake .
LG 4. Describe the major categories on a commercial bank’s income statement .
LG 5. Examine ratios that can be used to analyze a commercial bank .
O U T L I N E
Why Evaluate the Performance of Commercial Banks? Chapter Overview Financial Statements of Commercial Banks
Balance Sheet Structure
Off-Balance-Sheet
Assets and Liabilities
Other Fee-Generating
Activities
Income Statement
Direct Relationship
between the Income
Statement and the
Balance Sheet
Financial Statement Analysis Using a Return on Equity Framework
Return on Equity and Its Components
Return on Assets and Its Components
Other Ratios
Impact of Market Niche and Bank Size on Financial Statement Analysis
Impact of a Bank’s
Market Niche
Impact of Size on Financial Statement Analysis
chap te r
12
sau34663_ch12_374-405.indd 374sau34663_ch12_374-405.indd 374 5/27/11 7:16:47 PM5/27/11 7:16:47 PM
First Pages

375
IN THE NEWS
The Uniform Financial Institutions Rating
System (UFIRS) was adopted by the
Federal Financial Institutions Examination
Council (FFIEC) on November 13, 1979.
Under the 1997 revision of the UFIRS,
each financial institution is assigned a
composite rating based on an evaluation
and rating of six essential components
of an institution’s financial condition
and operations that are summarized
in a composite “CAMELS” rating. The
acronym CAMELS stands for Capital
Adequacy, Asset Duality, Management,
Earnings, Liquidity, and Sensitivity to
Market Risk.
An institution’s Capital Adequacy
is evaluated in relation to the volume of
risk assets; the volume of marginal and
inferior quality assets; the bank’s growth
experience, plan, and prospects; and
the strength of management. Consid-
eration is also given to an institution’s
capital ratios relative to its peer group,
its earnings retention, its dividend poli-
cies, and its access to capital markets
or other appropriate sources of financial
assistance.
Asset Quality is evaluated by
the level, distribution, and severity of
adversely classified assets; the level and
distribution of nonaccrual and reduced-
rate assets; the adequacy of the allow-
ance for loan losses; and management’s
demonstrated ability to administer and
collect problem credits. In addition,
examiners evaluate the volume of concen-
trations of credit, trends in asset quality,
volume of out-of-territory loans, level and
severity of other real estate held, and the
bank’s underwriting standards.
Management is evaluated against
virtually all factors considered neces-
sary to operate the bank within accepted
banking practices and in a safe and
sound manner. Thus, management is
evaluated in relation to technical com-
petence; leadership and administrative
ability; compliance with banking regula-
tions and statutes; adequacy of, and
compliance with, internal policies and
controls; and whether the board has a
plan covering management succession.
The assessment of management also
takes into account the quality of internal
controls, operating procedures, and all
lending, investment, and other operating
policies. Finally, examiners review and
assess the composition, experience level,
abilities, and involvement of the officers,
directors, and shareholders.
Earnings are evaluated with respect
to their ability to cover losses and pro-
vide adequate capital protection; trends;
peer group comparisons; the quality
and composition of net income; and the
degree of reliance on interest-sensitive
funds. Consideration is also given to the
bank’s dividend payout ratio, the rate
of growth of retained earnings, and the
adequacy of bank capital. The adequacy
of provisions to the allowance for loan
losses, and the extern to which extraor-
dinary items, securities transactions,
and tax effects contribute to net income,
are also assessed.
Liquidity is evaluated in relation to
the volatility of deposits; the frequency
and level of borrowings, use of brokered
deposits, technical competence relative
to the structure of liabilities, availability
of assets readily convertible into cash;
and access to money markets or other
ready sources of funds. The overall effec-
tiveness of asset-liability management is
considered, as well as the adequacy of,
and compliance with, established liquidity
policies. The nature, volume, and antici-
pated use of credit commitments are
also factors that are weighed.
The Sensitivity to Market Risk
component reflects the degree to
which changes in interest rates, foreign
exchange rates, commodity prices,
or equity prices can adversely affect
a financial institution’s earnings or
economic capital. When evaluating
this component, consideration should
be given to: management’s ability to
identify, measure, monitor, and control
market risk; the institution’s size; the
nature and complexity of its activities;
and the adequacy of its capital and earn-
ings in relation to its level of market risk
exposure.
CAMELS ratings range from 1 to 5.
Composite “1” —Institutions in this group
are basically sound in every respect.
Composite “2” —Institutions in this group
are fundamentally sound, but may reflect
modest weaknesses correctable in the normal
course of business.
Composite “3” —Institutions in this cat-
egory exhibit financial, operational, or compli-
ance weaknesses ranging from moderately
severe to unsatisfactory.
Composite “4” —Institutions in this group
nave an immoderate volume of serious finan-
cial weaknesses or a combination of other
conditions that are unsatisfactory.
Composite “5” —This category is reserved
for institutions with an extremely high immedi-
ate or near term probability of failure.
Source : Federal Deposit Insurance Corpora-
tion, DOS Manual of Examination Policies,
October 2010. www.fdic.gov
The CAMELS Evaluation Components
sau34663_ch12_374-405.indd 375sau34663_ch12_374-405.indd 375 5/27/11 7:16:47 PM5/27/11 7:16:47 PM
First Pages

376 Part 3 Commercial Banks
to identify existing or potential financial management and risk exposure problems. 1 The fact that bank size and/or niche (i.e., the financial market segment the bank specializes in servicing) may affect the evaluation of financial statements is also highlighted.
Financial information on commercial banks is reported in two basic documents. The report of condition (or balance sheet) presents financial information on a bank’s assets, liabilities, and equity capital. The balance sheet reports a bank’s condition at a single point in time. The report of income (or the income statement) presents the major categories of revenues and expenses (or costs) and the net profit or loss for a bank over a period of time. Financial statements of commercial banks must be submitted to regulators and stock-holders at the end of each calendar quarter—March, June, September, and December. The Federal Financial Institutions Examination Council (FFIEC), based in Washington. D.C., prescribes uniform principles, standards, and report forms for depository institutions. 2
All financial institutions, and particularly commercial banks, are engaging in an increased level of off-balance-sheet (OBS) activities. These activities produce income (and sometimes losses) for the FI that are reported on the income statement. This chapter sum-marizes off-balance-sheet activities (and the risks involved with such activities), which are discussed in more detail in Chapters 19 and 23 .
To evaluate the performance of commercial banks, we use two financial services hold-ing companies 3 of varying sizes and market niches: Webster Financial Corporation and Bank of America Corporation.
Webster Financial Corporation (WBS) is a publicly traded commercial bank hold-ing company headquartered in Waterbury, Connecticut. In 2010, it had $17.69 billion in assets (among the 75 largest banks in the United States). Webster Financial Corp. offers products in both consumer and business banking, including mortgage loans, insurance, financial planning, and trust and investment services in Connecticut, New York, Massa-chusetts, and Rhode Island through over 180 banking offices, over 500 ATMs, telephone banking, and the Internet. The bank owns an asset-based lending firm (Webster Business Credit Corporation), an insurance premium finance company (Budget Installment Corp.), and an equipment finance company (Center Capital Corporation), and provides health sav-ings account trustee and administrative services through HSA Bank, a division of Webster Bank. WBS, by emphasizing retail banking, has been an efficient and profitable bank. Retail banks focus on individual consumer banking relationships, such as residential mortgages and consumer loans on the asset side of the portfolio, and individual demand. NOW, savings, and time deposits on the liability side. In contrast, wholesale banks focus their business activities on business banking relationships; they hold more business loans and fewer mortgages and consumer loans and use fewer consumer deposits and more pur-chased funds than retail banks do. Most large banks have both a retail side and a wholesale side of business—these two strategies are not mutually exclusive.
Bank of America Corporation (BOA), headquartered in Charlotte, North Carolina, was at one time the nation’s largest bank holding company, with holding company assets of $2,366 billion and bank assets of $1,787 billion as of 2010. Bank of America operates nationally and internationally with more than 5,900 offices in the United States and offices in 40 countries supporting approximately 57 million clients. The bank offers products in
FINANCIAL STATEMENTS OF COMMERCIAL BANKSFINANCIAL STATEMENTS OF COMMERCIAL BANKS
report of condition Balance sheet of a com-mercial bank reporting information at a single point in time.
report of condition Balance sheet of a com-mercial bank reporting information at a single point in time.
report of income Income statement of a commercial bank report-ing revenues, expenses, net profit or loss, and cash dividends over a period of time.
report of income Income statement of a commercial bank report-ing revenues, expenses, net profit or loss, and cash dividends over a period of time.
www.ffiec.gov www.ffiec.gov
www.websteronline.com
www.websteronline.com
retail bank A bank that focuses its business activities on consumer banking relationships.
retail bank A bank that focuses its business activities on consumer banking relationships.
wholesale bank A bank that focuses its business activities on commercial banking relationships.
wholesale bank A bank that focuses its business activities on commercial banking relationships.
www.bankofamerica.com
www.bankofamerica.com
2 The financial statements reported by banks use book value accounting Concepts; i.e., assets, liabilities, and equity accounts arc generally reported at their original cost or book value. An alternative accounting method frequently discussed for use by banks is market value accounting. We discuss the issues, consequences of, and current status of the use of market value accounting in Chapter 22 .
3 The U.S. Congress passed the Financial Services Modernization Act of 1999, which opened the door for the creation of full-service financial institutions in the United Stales. A financial services holding company can engage in banking activities, insurance activities, and securities activities. Thus, while we examine financial institutions by func-tional area, the financial services holding company (which combines many activities in a single financial institution) has become the dominant form of financial institution in terms of total assets (see Chapter 13 ).
1 This decomposition is often termed DuPont analysis.
sau34663_ch12_374-405.indd 376sau34663_ch12_374-405.indd 376 5/27/11 7:16:48 PM5/27/11 7:16:48 PM
First Pages

Chapter 12 Commercial Banks’ Financial Statements and Analysis 377
many business lines, including retail and wholesale banking, investment and trust manage-ment, and credit card company business. Bank of America has created the nation’s largest ATM network, with 18,000 ATMs serving more than 29 million active users, is one of the nation’s largest debit card issuers, is the nation’s leading small business lender, and is the number one institution in number of relationships, investment banking, treasury man-agement, syndications, secured and unsecured credit, and leasing to middle-market U.S. companies.
Balance Sheet Structure
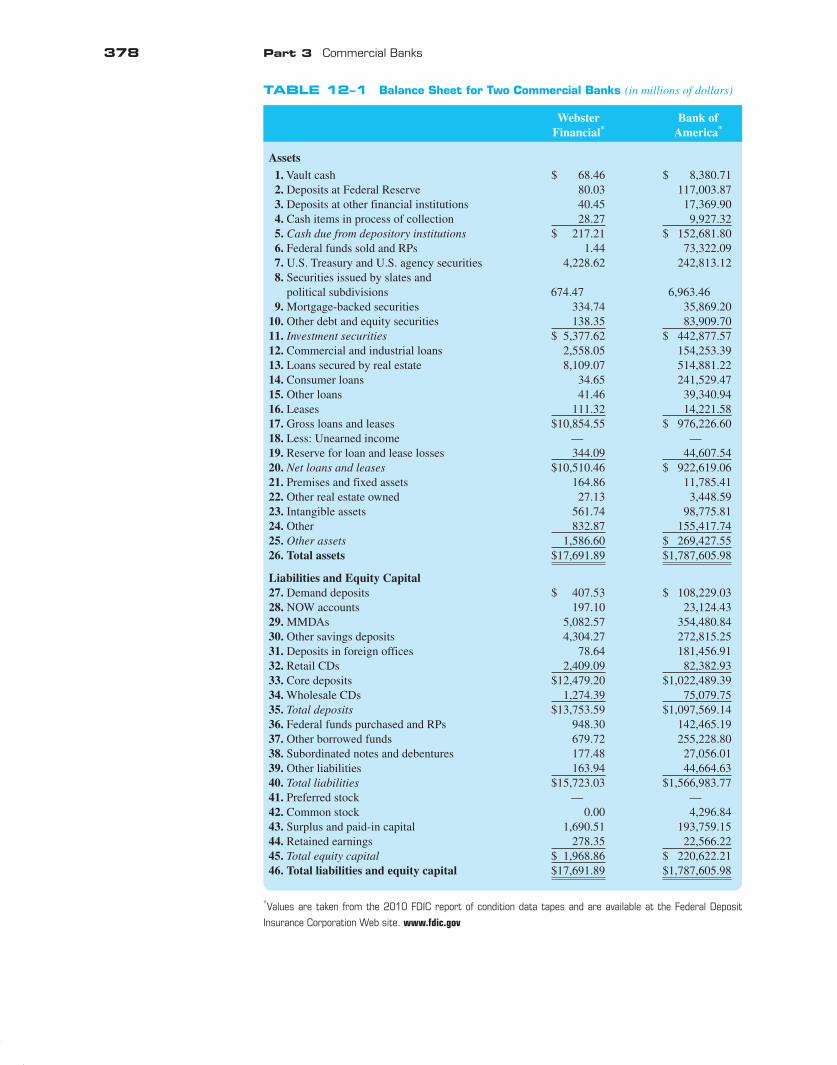
Table 12–1 presents 2010 balance sheet information for the two commercial bank holding companies (hereafter called banks). As stated in Chapter 11 , many banks are owned by parent bank holding companies. One-bank holding companies control only one subsidiary commercial bank: multiple-bank holding companies control two or more subsidiary com-mercial banks (see Chapter 13 ). The financial statements reported in this chapter are for the consolidated multiple-bank holding company, which includes the parent holding company plus bank subsidiaries. These data are taken from the Federal Deposit Insurance Corpora-tion call reports, available at the FDIC Web site. Pay particular attention to the fact that, unlike manufacturing corporations, the majority of a commercial bank’s assets are finan-cial assets rather than physical or fixed assets (such as buildings or machines). Addition-ally, a relatively large portion of a commercial bank’s liabilities are shot-term deposits and borrowings. In general, banks have higher leverage than manufacturing corporations do.
Assets. A bank’s assets are grouped into lour major subcategories: (1) cash due from depository institutions, (2) investment securities, (3) loans and leases, and (4) other assets. Investment securities and loans and leases are the bank’s earning assets. Cash due from depository institutions (item 5 in Table 12–1 ) consists of vault cash, deposits at the Federal Reserve (the central bank), deposits at other financial institutions, and cash items in the process of collection. None of these items generates much income for the bank, but each is held because they perform specific functions.
Cash Due from Depository Institutions. Vault cash (item 1) is composed of the currency and coin needed to meet customer withdrawals. Deposits at the Federal Reserve (item 2) are used primarily to meet legal reserve requirements (see Chapter 13 ), to assist in check clearing, wire transfers, and the purchase or sale of Treasury securities. Deposits at other financial institutions (item 3) are primarily used to purchase services from those institu-tions. These banks generally purchase services such as check collection. check processing, fed funds trading, and investment advice from correspondent banks (see below). Cash items in the process of collection (item 4) are checks written against accounts at other institutions that have been deposited at the bank. Credit is given to the depositor of these checks only after they clear.
Investment Securities. Investment securities (item 11 in Table 12–1 ) consist of federal funds sold, repurchase agreements (RPs or repos), U.S. Treasury and agency securities, securities issued by states and political subdivisions (municipals), mortgage-backed secu-rities, and other debt and equity securities. These securities generate some income for the bank and are used for liquidity risk management purposes. Investment securities are highly liquid, 4 have low default risk, and can usually be traded in secondary markets. Banks gen-erally maintain significant amounts of these securities to ensure that they can easily meet liquidity needs that arise unexpectedly. However, because the revenue generated from investment securities is low compared to that from loans and leases, many (particularly larger) banks attempt to minimize the amount of investment securities they hold.
www.fdic.gov www.fdic.gov
LG 1LG 1
correspondent bank A bank that provides services to another com-mercial bank.
correspondent bank A bank that provides services to another com-mercial bank.
4 Not all of a bank’s investment securities can be sold immediately. Some securities, such as U.S. Treasury securi-ties and municipals, can be pledged against certain types of borrowing by the bank and, therefore, must remain on the bank’s books until the debt obligation is removed or another security is pledged as collateral.
sau34663_ch12_374-405.indd 377sau34663_ch12_374-405.indd 377 5/27/11 7:16:48 PM5/27/11 7:16:48 PM
First Pages
378 Part 3 Commercial Banks
TABLE 12–1 Balance Sheet for Two Commercial Banks (in millions of dollars)
Webster Bank of Financial * America *
Assets
1. Vault cash $ 68.46 $ 8,380.71 2. Deposits at Federal Reserve 80.03 117,003.87 3. Deposits at other financial institutions 40.45 17,369.90 4. Cash items in process of collection 28.27 9,927.32 5. Cash due from depository institutions $ 217.21 $ 152,681.80 6. Federal funds sold and RPs 1.44 73,322.09 7. U.S. Treasury and U.S. agency securities 4,228.62 242,813.12 8. Securities issued by slates and
political subdivisions 674.47 6,963.46 9. Mortgage-backed securities 334.74 35,869.20 10. Other debt and equity securities 138.35 83,909.70 11. Investment securities $ 5,377.62 $ 442,877.57 12. Commercial and industrial loans 2,558.05 154,253.39 13. Loans secured by real estate 8,109.07 514,881.22 14. Consumer loans 34.65 241,529.47 15. Other loans 41.46 39,340.94 16. Leases 111.32 14,221.58 17. Gross loans and leases $10,854.55 $ 976,226.60 18. Less: Unearned income — — 19. Reserve for loan and lease losses 344.09 44,607.54 20. Net loans and leases $10,510.46 $ 922,619.06 21. Premises and fixed assets 164.86 11,785.41 22. Other real estate owned 27.13 3,448.59 23. Intangible assets 561.74 98,775.81 24. Other 832.87 155,417.74 25. Other assets 1,586.60 $ 269,427.55 26. Total assets $17,691.89 $1,787,605.98
Liabilities and Equity Capital 27. Demand deposits $ 407.53 $ 108,229.03 28. NOW accounts 197.10 23,124.43 29. MMDAs 5,082.57 354,480.84 30. Other savings deposits 4,304.27 272,815.25 31. Deposits in foreign offices 78.64 181,456.91 32. Retail CDs 2,409.09 82,382.93 33. Core deposits $12,479.20 $1,022,489.39 34. Wholesale CDs 1,274.39 75,079.75 35. Total deposits $13,753.59 $1,097,569.14 36. Federal funds purchased and RPs 948.30 142,465.19 37. Other borrowed funds 679.72 255,228.80 38. Subordinated notes and debentures 177.48 27,056.01 39. Other liabilities 163.94 44,664.63 40. Total liabilities $15,723.03 $1,566,983.77 41. Preferred stock — — 42. Common stock 0.00 4,296.84 43. Surplus and paid-in capital 1,690.51 193,759.15 44. Retained earnings 278.35 22,566.22 45. Total equity capital $ 1,968.86 $ 220,622.21 46. Total liabilities and equity capital $17,691.89 $1,787,605.98
* Values are taken from the 2010 FDIC report of condition data tapes and are available at the Federal Deposit
Insurance Corporation Web site. www.fdic.gov
sau34663_ch12_374-405.indd 378sau34663_ch12_374-405.indd 378 5/27/11 7:16:48 PM5/27/11 7:16:48 PM
First Pages
Chapter 12 Commercial Banks’ Financial Statements and Analysis 379
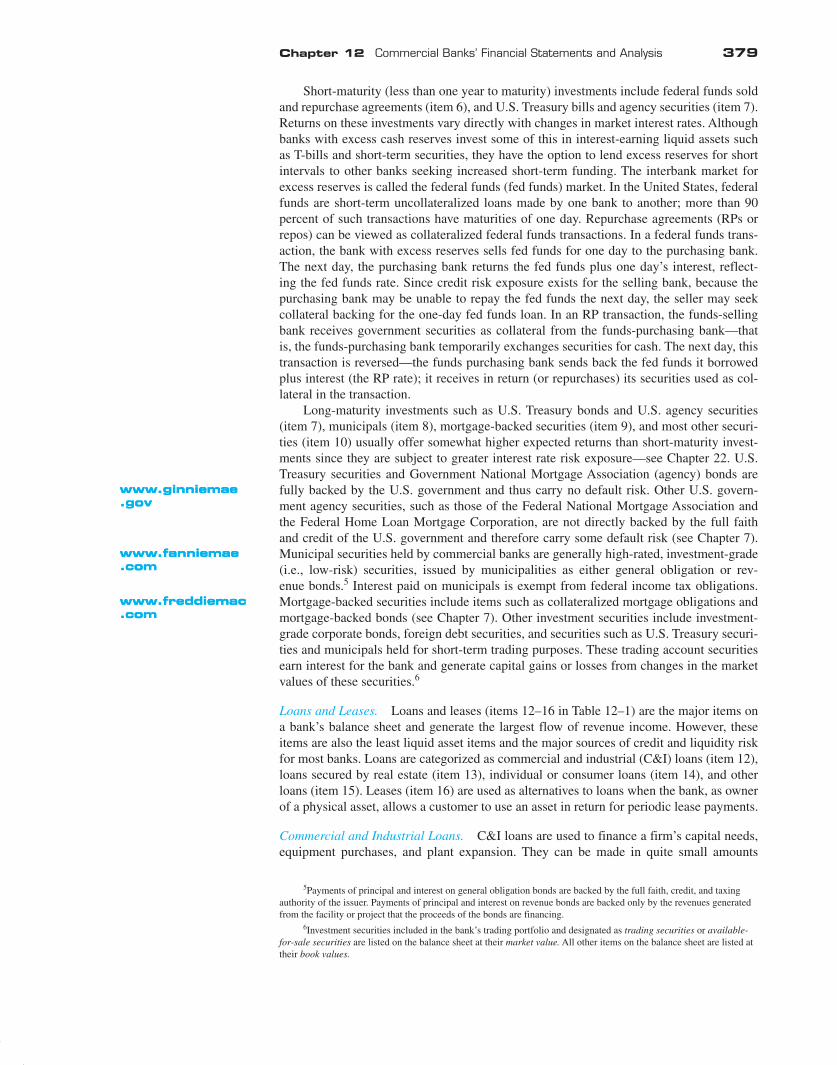
Short-maturity (less than one year to maturity) investments include federal funds sold and repurchase agreements (item 6), and U.S. Treasury bills and agency securities (item 7). Returns on these investments vary directly with changes in market interest rates. Although banks with excess cash reserves invest some of this in interest-earning liquid assets such as T-bills and short-term securities, they have the option to lend excess reserves for short intervals to other banks seeking increased short-term funding. The interbank market for excess reserves is called the federal funds (fed funds) market. In the United States, federal funds are short-term uncollateralized loans made by one bank to another; more than 90 percent of such transactions have maturities of one day. Repurchase agreements (RPs or repos) can be viewed as collateralized federal funds transactions. In a federal funds trans-action, the bank with excess reserves sells fed funds for one day to the purchasing bank. The next day, the purchasing bank returns the fed funds plus one day’s interest, reflect-ing the fed funds rate. Since credit risk exposure exists for the selling bank, because the purchasing bank may be unable to repay the fed funds the next day, the seller may seek collateral backing for the one-day fed funds loan. In an RP transaction, the funds-selling bank receives government securities as collateral from the funds-purchasing bank—that is, the funds-purchasing bank temporarily exchanges securities for cash. The next day, this transaction is reversed—the funds purchasing bank sends back the fed funds it borrowed plus interest (the RP rate); it receives in return (or repurchases) its securities used as col-lateral in the transaction.
Long-maturity investments such as U.S. Treasury bonds and U.S. agency securities (item 7), municipals (item 8), mortgage-backed securities (item 9), and most other securi-ties (item 10) usually offer somewhat higher expected returns than short-maturity invest-ments since they are subject to greater interest rate risk exposure—see Chapter 22 . U.S. Treasury securities and Government National Mortgage Association (agency) bonds are fully backed by the U.S. government and thus carry no default risk. Other U.S. govern-ment agency securities, such as those of the Federal National Mortgage Association and the Federal Home Loan Mortgage Corporation, are not directly backed by the full faith and credit of the U.S. government and therefore carry some default risk (see Chapter 7 ). Municipal securities held by commercial banks are generally high-rated, investment-grade (i.e., low-risk) securities, issued by municipalities as either general obligation or rev-enue bonds. 5 Interest paid on municipals is exempt from federal income tax obligations. Mortgage-backed securities include items such as collateralized mortgage obligations and mortgage-backed bonds (see Chapter 7 ). Other investment securities include investment-grade corporate bonds, foreign debt securities, and securities such as U.S. Treasury securi-ties and municipals held for short-term trading purposes. These trading account securities earn interest for the bank and generate capital gains or losses from changes in the market values of these securities. 6
Loans and Leases. Loans and leases (items 12–16 in Table 12–1 ) are the major items on a bank’s balance sheet and generate the largest flow of revenue income. However, these items are also the least liquid asset items and the major sources of credit and liquidity risk for most banks. Loans are categorized as commercial and industrial (C&I) loans (item 12), loans secured by real estate (item 13), individual or consumer loans (item 14), and other loans (item 15). Leases (item 16) are used as alternatives to loans when the bank, as owner of a physical asset, allows a customer to use an asset in return for periodic lease payments.
Commercial and Industrial Loans. C&I loans are used to finance a firm’s capital needs, equipment purchases, and plant expansion. They can be made in quite small amounts
www.ginniemae.gov www.ginniemae.gov
www.fanniemae.com www.fanniemae.com
www.freddiemac.com www.freddiemac.com
5 Payments of principal and interest on general obligation bonds are backed by the full faith, credit, and taxing authority of the issuer. Payments of principal and interest on revenue bonds are backed only by the revenues generated from the facility or project that the proceeds of the bonds are financing.
6 Investment securities included in the bank’s trading portfolio and designated as trading securities or available-for-sale securities are listed on the balance sheet at their market value. All other items on the balance sheet are listed at their book values.
sau34663_ch12_374-405.indd 379sau34663_ch12_374-405.indd 379 5/27/11 7:16:49 PM5/27/11 7:16:49 PM
First Pages
380 Part 3 Commercial Banks
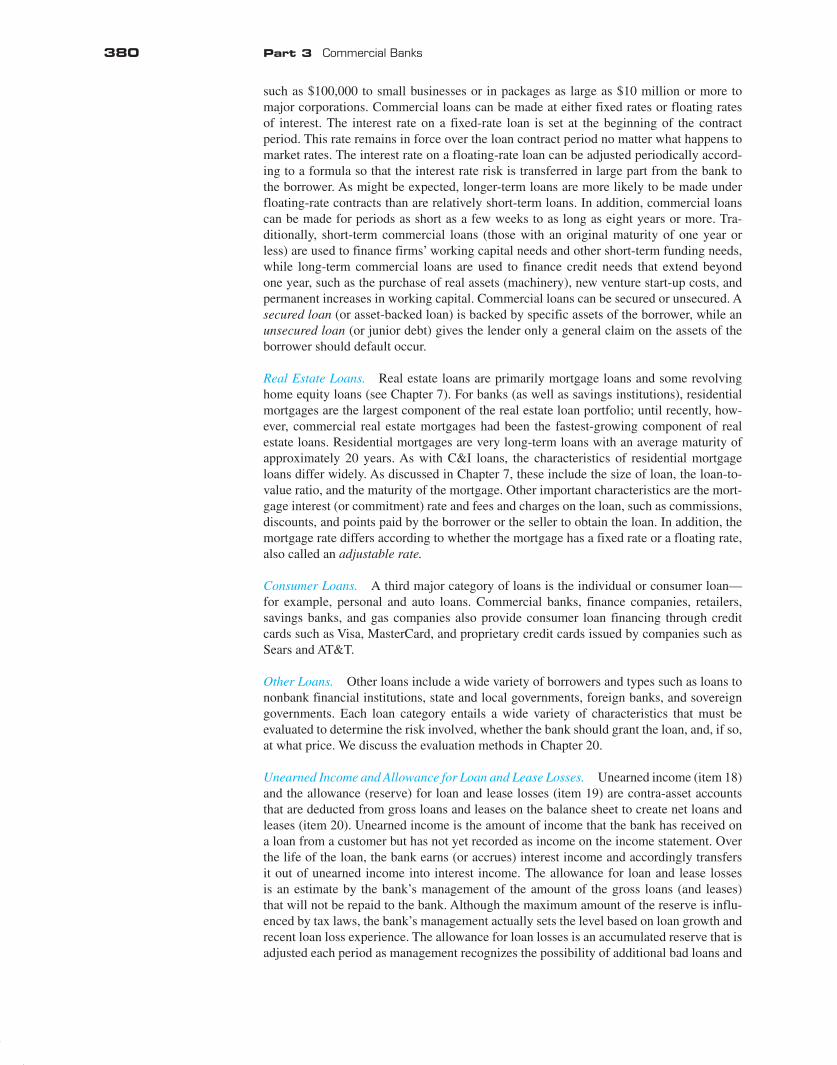
such as $100,000 to small businesses or in packages as large as $10 million or more to major corporations. Commercial loans can be made at either fixed rates or floating rates of interest. The interest rate on a fixed-rate loan is set at the beginning of the contract period. This rate remains in force over the loan contract period no matter what happens to market rates. The interest rate on a floating-rate loan can be adjusted periodically accord-ing to a formula so that the interest rate risk is transferred in large part from the bank to the borrower. As might be expected, longer-term loans are more likely to be made under floating-rate contracts than are relatively short-term loans. In addition, commercial loans can be made for periods as short as a few weeks to as long as eight years or more. Tra-ditionally, short-term commercial loans (those with an original maturity of one year or less) are used to finance firms’ working capital needs and other short-term funding needs, while long-term commercial loans are used to finance credit needs that extend beyond one year, such as the purchase of real assets (machinery), new venture start-up costs, and permanent increases in working capital. Commercial loans can be secured or unsecured. A secured loan (or asset-backed loan) is backed by specific assets of the borrower, while an unsecured loan (or junior debt) gives the lender only a general claim on the assets of the borrower should default occur.
Real Estate Loans. Real estate loans are primarily mortgage loans and some revolving home equity loans (see Chapter 7 ). For banks (as well as savings institutions), residential mortgages are the largest component of the real estate loan portfolio; until recently, how-ever, commercial real estate mortgages had been the fastest-growing component of real estate loans. Residential mortgages are very long-term loans with an average maturity of approximately 20 years. As with C&I loans, the characteristics of residential mortgage loans differ widely. As discussed in Chapter 7 , these include the size of loan, the loan-to-value ratio, and the maturity of the mortgage. Other important characteristics are the mort-gage interest (or commitment) rate and fees and charges on the loan, such as commissions, discounts, and points paid by the borrower or the seller to obtain the loan. In addition, the mortgage rate differs according to whether the mortgage has a fixed rate or a floating rate, also called an adjustable rate.
Consumer Loans. A third major category of loans is the individual or consumer loan— for example, personal and auto loans. Commercial banks, finance companies, retailers, savings banks, and gas companies also provide consumer loan financing through credit cards such as Visa, MasterCard, and proprietary credit cards issued by companies such as Sears and AT&T.
Other Loans. Other loans include a wide variety of borrowers and types such as loans to nonbank financial institutions, state and local governments, foreign banks, and sovereign governments. Each loan category entails a wide variety of characteristics that must be evaluated to determine the risk involved, whether the bank should grant the loan, and, if so, at what price. We discuss the evaluation methods in Chapter 20 .
Unearned Income and Allowance for Loan and Lease Losses. Unearned income (item 18) and the allowance (reserve) for loan and lease losses (item 19) are contra-asset accounts that are deducted from gross loans and leases on the balance sheet to create net loans and leases (item 20). Unearned income is the amount of income that the bank has received on a loan from a customer but has not yet recorded as income on the income statement. Over the life of the loan, the bank earns (or accrues) interest income and accordingly transfers it out of unearned income into interest income. The allowance for loan and lease losses is an estimate by the bank’s management of the amount of the gross loans (and leases) that will not be repaid to the bank. Although the maximum amount of the reserve is influ-enced by tax laws, the bank’s management actually sets the level based on loan growth and recent loan loss experience. The allowance for loan losses is an accumulated reserve that is adjusted each period as management recognizes the possibility of additional bad loans and
sau34663_ch12_374-405.indd 380sau34663_ch12_374-405.indd 380 5/27/11 7:16:49 PM5/27/11 7:16:49 PM
First Pages
Chapter 12 Commercial Banks’ Financial Statements and Analysis 381
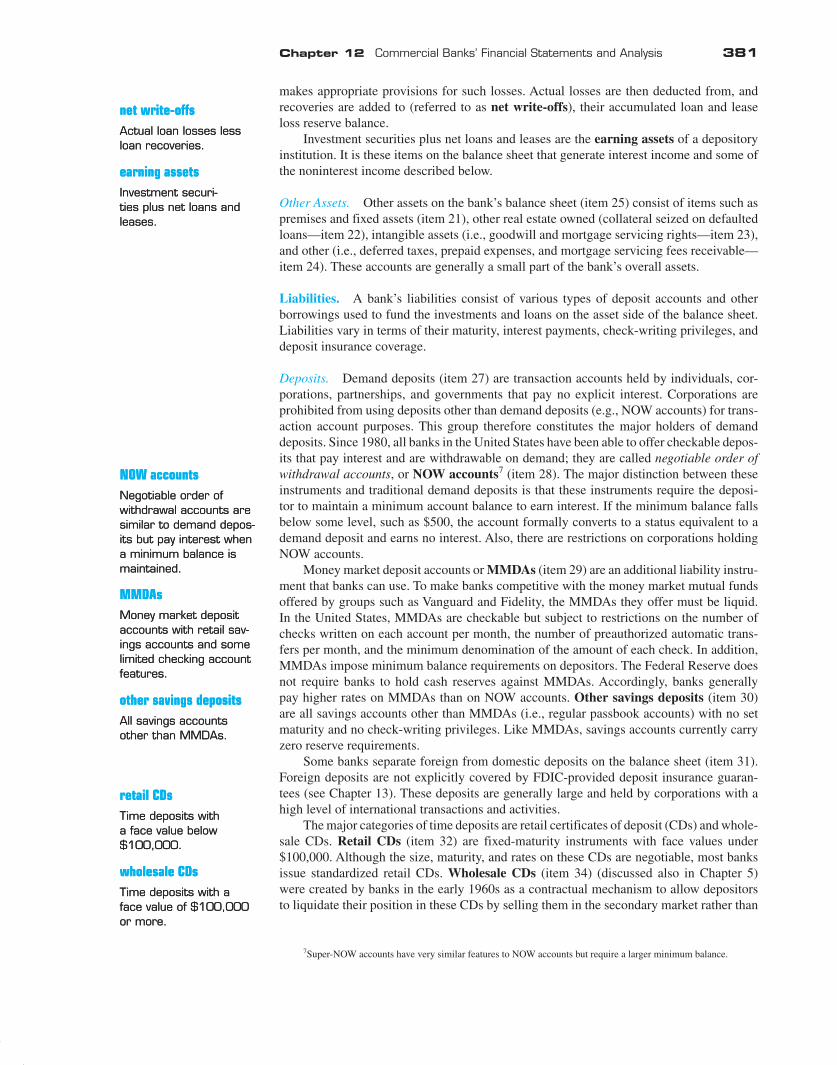
makes appropriate provisions for such losses. Actual losses are then deducted from, and recoveries are added to (referred to as net write-offs ), their accumulated loan and lease loss reserve balance.
Investment securities plus net loans and leases are the earning assets of a depository institution. It is these items on the balance sheet that generate interest income and some of the noninterest income described below.
Other Assets. Other assets on the bank’s balance sheet (item 25) consist of items such as premises and fixed assets (item 21), other real estate owned (collateral seized on defaulted loans—item 22), intangible assets (i.e., goodwill and mortgage servicing rights—item 23), and other (i.e., deferred taxes, prepaid expenses, and mortgage servicing fees receivable—item 24). These accounts are generally a small part of the bank’s overall assets.
Liabilities. A bank’s liabilities consist of various types of deposit accounts and other borrowings used to fund the investments and loans on the asset side of the balance sheet. Liabilities vary in terms of their maturity, interest payments, check-writing privileges, and deposit insurance coverage.
Deposits. Demand deposits (item 27) are transaction accounts held by individuals, cor-porations, partnerships, and governments that pay no explicit interest. Corporations are prohibited from using deposits other than demand deposits (e.g., NOW accounts) for trans-action account purposes. This group therefore constitutes the major holders of demand deposits. Since 1980, all banks in the United States have been able to offer checkable depos-its that pay interest and are withdrawable on demand; they are called negotiable order of withdrawal accounts , or NOW accounts 7 (item 28). The major distinction between these instruments and traditional demand deposits is that these instruments require the deposi-tor to maintain a minimum account balance to earn interest. If the minimum balance falls below some level, such as $500, the account formally converts to a status equivalent to a demand deposit and earns no interest. Also, there are restrictions on corporations holding NOW accounts.
Money market deposit accounts or MMDAs (item 29) are an additional liability instru-ment that banks can use. To make banks competitive with the money market mutual funds offered by groups such as Vanguard and Fidelity, the MMDAs they offer must be liquid. In the United States, MMDAs are checkable but subject to restrictions on the number of checks written on each account per month, the number of preauthorized automatic trans-fers per month, and the minimum denomination of the amount of each check. In addition, MMDAs impose minimum balance requirements on depositors. The Federal Reserve does not require banks to hold cash reserves against MMDAs. Accordingly, banks generally pay higher rates on MMDAs than on NOW accounts. Other savings deposits (item 30) are all savings accounts other than MMDAs (i.e., regular passbook accounts) with no set maturity and no check-writing privileges. Like MMDAs, savings accounts currently carry zero reserve requirements.
Some banks separate foreign from domestic deposits on the balance sheet (item 31). Foreign deposits are not explicitly covered by FDIC-provided deposit insurance guaran-tees (see Chapter 13 ). These deposits are generally large and held by corporations with a high level of international transactions and activities.
The major categories of time deposits are retail certificates of deposit (CDs) and whole-sale CDs. Retail CDs (item 32) are fixed-maturity instruments with face values under $100,000. Although the size, maturity, and rates on these CDs are negotiable, most banks issue standardized retail CDs. Wholesale CDs (item 34) (discussed also in Chapter 5 ) were created by banks in the early 1960s as a contractual mechanism to allow depositors to liquidate their position in these CDs by selling them in the secondary market rather than
net write-offs Actual loan losses less loan recoveries.
net write-offs Actual loan losses less loan recoveries.
earning assets Investment securi-ties plus net loans and leases.
earning assets Investment securi-ties plus net loans and leases.
NOW accounts Negotiable order of withdrawal accounts are similar to demand depos-its but pay interest when a minimum balance is maintained.
NOW accounts Negotiable order of withdrawal accounts are similar to demand depos-its but pay interest when a minimum balance is maintained.
MMDAs Money market deposit accounts with retail sav-ings accounts and some limited checking account features.
MMDAs Money market deposit accounts with retail sav-ings accounts and some limited checking account features.
other savings deposits All savings accounts other than MMDAs.
other savings deposits All savings accounts other than MMDAs.
retail CDs Time deposits with a face value below $100,000.
retail CDs Time deposits with a face value below $100,000.
wholesale CDs Time deposits with a face value of $100,000 or more.
wholesale CDs Time deposits with a face value of $100,000 or more.
7 Super-NOW accounts have very similar features to NOW accounts but require a larger minimum balance.
sau34663_ch12_374-405.indd 381sau34663_ch12_374-405.indd 381 5/27/11 7:16:49 PM5/27/11 7:16:49 PM
First Pages
382 Part 3 Commercial Banks
having to hold them to maturity or requesting that the bank cash in the deposit early (which involves a penalty cost for the depositor). Thus, a depositor can sell a relatively liquid instrument without causing adverse liquidity risk exposure for the bank. Consequently, the unique feature of wholesale CDs is not so much their large minimum denomination size of $100,000 or more but the fact that they are negotiable instruments. That is, they can be resold by title assignment in a secondary market to other investors. This means, for exam-ple, that if IBM had bought a $1 million three-month CD from J.P. Morgan Chase, but for unexpected liquidity reasons needed funds after only one month passed, it could sell this CD to another outside investor in the secondary market. This does not impose any obliga-tion on J.P. Morgan Chase in terms of an early funds withdrawal request. Wholesale CDs obtained through a brokerage or investment house rather than directly from a customer are referred to as brokered deposits. 8 CDs held in foreign offices and denominated in dollars are referred to as Eurodollar deposits (see Chapter 5 ).
Borrowed Funds. The liabilities described above are all deposit liabilities, reflecting deposit contracts issued by banks in return for cash. However, banks not only fund their assets by issuing deposits but borrow in various markets for purchased funds. Since the funds generated from these purchases are not deposits, they are subject to neither reserve requirements (as with demand deposits and NOW accounts) nor deposit insurance pre-mium payments to the FDIC (as with all the domestic deposits described earlier). 9 The largest market available for purchased funds is the federal funds market (item 36). As we discussed earlier, a bank with excess reserves can sell them in the fed funds mar-ket, recording them as an asset on the balance sheet. The bank that purchases fed funds shows them as a liability on its balance sheet. As with the fed funds market, the RP market (item 36) is a highly liquid and flexible source of funds for banks needing to increase their liabilities and to offset deposit withdrawals. Moreover, like fed funds, these transactions can be rolled over each day if the counterparty is willing. The major difference in flex-ibility of liability management for fed funds and RPs is that a fed funds transaction can be entered into at virtually any time in the banking day. In general, it is difficult to transact an RP borrowing late in the day since the bank sending the fed funds must be satisfied with the type and quality of the securities’ collateral proposed by the borrowing bank. Although this collateral is normally T-bills, T-notes, T-bonds, and mortgage-backed securities, the maturities and other features, such as callability or coupons, may be unattractive to the fund seller.
Fed funds and RPs have been the major sources of borrowed funds, but banks have utilized other borrowing (item 37) sources to supplement their flexibility in liability man-agement. Four of these sources are banker’s acceptances (BAs), commercial paper, medium-term notes, and discount window loans. Banks often convert off-balance-sheet letters of credit into on-balance-sheet BAs by discounting the letter of credit when the holder presents it for acceptance (see Chapter 5 ). In addition, these BAs may be resold to money market investors. As a result, BA sales to the secondary market are an additional funding source. Although a bank subsidiary itself cannot issue commercial paper, its parent holding com-pany can—that is, Citigroup can issue commercial paper but Citibank cannot. This provides banks owned by holding companies—most of the largest banks in the United States—with an additional funding source, since the holding company can “downstream” funds gener-ated from its commercial paper sales to its bank subsidiary. Finally, banks facing temporary liquidity crunches can borrow from the central bank’s discount window at the discount rate. Since this rate is not market determined and usually lies below fed funds and government
negotiable instrument An instrument whose ownership can be trans-ferred in the secondary market.
negotiable instrument An instrument whose ownership can be trans-ferred in the secondary market.
brokered deposits Wholesale CDs obtained through a brokerage house.
brokered deposits Wholesale CDs obtained through a brokerage house.
8 These are often purchased in $100,000 increments. For example, a broker may receive $1 million from an inves-tor and break this up into 10 lots of $100,000 CDs that are placed (brokered out) at 10 different banks. Thus, effectively, the full $1 million is covered by FDIC deposit insurance.
9 Foreign deposits are not subject to deposit insurance premiums. However, in the exceptional event of a very large failure in which all deposits are protected, under the 1991 FDICIA, the FDIC is required to levy a charge on surviving large banks proportional to their total asset size. To the extent that assets are partially funded by foreign liabilities, this is an implied premium on foreign deposits.
sau34663_ch12_374-405.indd 382sau34663_ch12_374-405.indd 382 5/27/11 7:16:49 PM5/27/11 7:16:49 PM
First Pages

Chapter 12 Commercial Banks’ Financial Statements and Analysis 383
security rates, it offers a very attractive borrowing opportunity to a bank with deficient reserves as the reserve maintenance period comes to an end (see Chapter 13 ).
A number of banks in search of stable sources of funds with low withdrawal risk have begun to issue subordinated notes and debentures (item 38), often in the five- to seven-year range. These notes are especially attractive because they are subject to neither reserve requirements nor deposit insurance premiums, and some can serve as (Tier 2) capital for the bank to satisfy Federal Reserve regulations regarding minimum capital requirements (see Chapter 13 ).
Some banks separate core deposits from purchased funds on their balance sheets. The stable deposits of the bank are referred to as core deposits (item 33). These deposits are not expected to be withdrawn over short periods of time and are therefore a more perma-nent source of funding for the bank. Core deposits are also the cheapest funds banks can use to finance their assets. Because they are both a stable and low-cost source of funding, core deposits are the most frequently used source of funding by commercial banks. Core deposits generally are defined as demand deposits, NOW accounts, MMDAs, other savings accounts, and retail CDs. Purchased funds are more expensive and/or volatile sources of funds because they are highly rate sensitive—these funds are more likely to be immedi-ately withdrawn or replaced as rates on competitive instruments change. Further, interest rates on these funds, at any point in time, are generally higher than rates on core deposits. Purchased funds are generally defined as brokered deposits, wholesale CDs, deposits at foreign offices, fed funds purchased, RPs, and subordinated notes and debentures.
Other Liabilities. Banks also list other liabilities (item 39) that do not require interest to be paid. These items consist of accrued interest, deferred taxes, dividends payable, minor-ity interests in consolidated subsidies, and other miscellaneous claims.
Equity Capital. The bank’s equity capital (item 45) consists mainly of preferred (item 41) and common (item 42) stock (listed at par value), surplus or additional paid-in capital (item 43), and retained earnings (item 44). Regulations require banks to hold a minimum level of equity capital to act as a buffer against losses from their on- and off-balance-sheet assets (see Chapter 13 ).
Off-Balance-Sheet Assets and Liabilities
Off-balance-sheet (OBS) items are contingent assets and liabilities that may affect the future status of a financial institution’s balance sheet. OBS activities are less obvious and often invisible to financial statement readers because they usually appear “below the bot-tom line,” frequently as footnotes to accounts. As part of the quarterly financial reports submitted to regulators, schedule L lists the notional dollar size of OBS activities of banks. We briefly summarized the OBS activities of commercial banks in Chapter 11 . In this chapter, we introduce the items as they appear off the FI’s balance sheet.
Although OBS activities are now an important source of fee income for many FIs, they have the potential to produce positive as well as negative future cash flows. Some OBS activities can involve risks that add to the institution’s overall risk exposure; others can hedge or reduce their interest rate, credit, and foreign exchange risks. A depository institution’s performance and solvency are also affected by the management of these items. Off-balance-sheet activities can be grouped into four major categories: loan commitments, letters of credit, loans sold, and derivative securities. The OBS activities for Webster Finan-cial and Bank of America are reported in Table 12–2 .
Loan Commitments. These days, most commercial and industrial loans are made by firms that take down (or borrow against) prenegotiated lines of credit or loan commitments rather than borrow cash immediately in the form of spot loans. A loan commitment agree-ment (item 1 in Table 12–2 ) is a contractual commitment by a bank or another FI (such as an insurance company) to loan to a customer a certain maximum amount (say, $10 million)
LG 2LG 2
core deposits Deposits of the bank that are stable over short periods of time and thus provide a long-term fund-ing source to a bank.
core deposits Deposits of the bank that are stable over short periods of time and thus provide a long-term fund-ing source to a bank.
purchased funds Rate-sensitive funding sources of the bank.
purchased funds Rate-sensitive funding sources of the bank.
LG 3LG 3
loan commitment Contractual commitment to loan to a firm a cer-tain maximum amount at given interest rate terms.
loan commitment Contractual commitment to loan to a firm a cer-tain maximum amount at given interest rate terms.
sau34663_ch12_374-405.indd 383sau34663_ch12_374-405.indd 383 5/27/11 7:16:50 PM5/27/11 7:16:50 PM
First Pages
384 Part 3 Commercial Banks
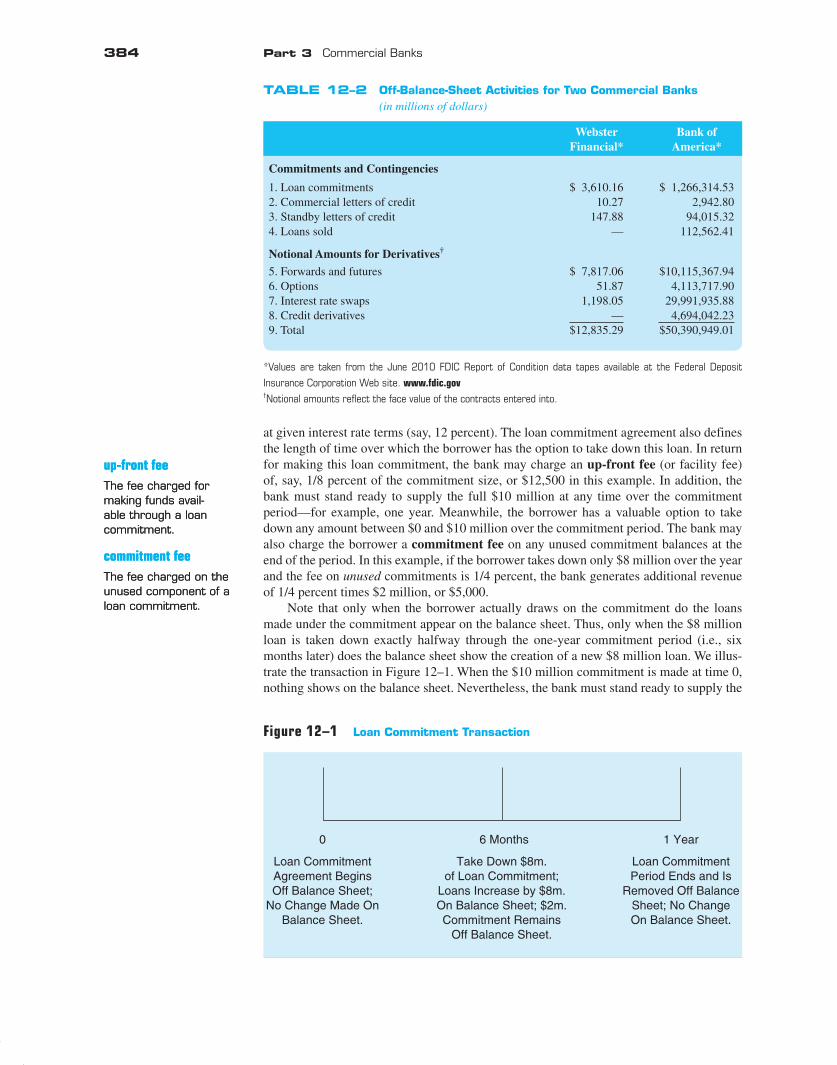
at given interest rate terms (say, 12 percent). The loan commitment agreement also defines the length of time over which the borrower has the option to take down this loan. In return for making this loan commitment, the bank may charge an up-front fee (or facility fee) of, say, 1/8 percent of the commitment size, or $12,500 in this example. In addition, the bank must stand ready to supply the full $10 million at any time over the commitment period—for example, one year. Meanwhile, the borrower has a valuable option to take down any amount between $0 and $10 million over the commitment period. The bank may also charge the borrower a commitment fee on any unused commitment balances at the end of the period. In this example, if the borrower takes down only $8 million over the year and the fee on unused commitments is 1/4 percent, the bank generates additional revenue of 1/4 percent times $2 million, or $5,000.
Note that only when the borrower actually draws on the commitment do the loans made under the commitment appear on the balance sheet. Thus, only when the $8 million loan is taken down exactly halfway through the one-year commitment period (i.e., six months later) does the balance sheet show the creation of a new $8 million loan. We illus-trate the transaction in Figure 12–1 . When the $10 million commitment is made at time 0, nothing shows on the balance sheet. Nevertheless, the bank must stand ready to supply the
up-front fee The fee charged for making funds avail-able through a loan commitment.
up-front fee The fee charged for making funds avail-able through a loan commitment.
commitment fee The fee charged on the unused component of a loan commitment.
commitment fee The fee charged on the unused component of a loan commitment.
TABLE 12–2 Off-Balance-Sheet Activities for Two Commercial Banks (in millions of dollars)
Webster Financial*
Bank of America*
Commitments and Contingencies
1. Loan commitments $ 3,610.16 $ 1,266,314.532. Commercial letters of credit 10.27 2,942.803. Standby letters of credit 147.88 94,015.324. Loans sold — 112,562.41
Notional Amounts for Derivatives†
5. Forwards and futures $ 7,817.06 $10,115,367.946. Options 51.87 4,113,717.907. Interest rate swaps 1,198.05 29,991,935.888. Credit derivatives — 4,694,042.239. Total $12,835.29 $50,390,949.01
*Values are taken from the June 2010 FDIC Report of Condition data tapes available at the Federal Deposit
Insurance Corporation Web site. www.fdic.gov
†Notional amounts reflect the face value of the contracts entered into.
Figure 12–1 Loan Commitment Transaction
Loan CommitmentAgreement BeginsOff Balance Sheet;
No Change Made OnBalance Sheet.
0 6 Months
Take Down $8m.of Loan Commitment;
Loans Increase by $8m.On Balance Sheet; $2m.Commitment Remains
Off Balance Sheet.
Loan CommitmentPeriod Ends and Is
Removed Off BalanceSheet; No ChangeOn Balance Sheet.
1 Year
sau34663_ch12_374-405.indd 384sau34663_ch12_374-405.indd 384 5/27/11 7:16:50 PM5/27/11 7:16:50 PM
First Pages
Chapter 12 Commercial Banks’ Financial Statements and Analysis 385
full $10 million in loans on any day within the one-year commitment period—at time 0 a new contingent claim on the resources of the bank is created. At time 6 months, when the $8 million is drawn down, the balance sheet will reflect this as an $8 million loan.
Commercial Letters of Credit and Standby Letters of Credit. In selling commercial letters of credit (LCs—item 2 in Table 12–2 ) and standby letters of credit (SLCs—item 3) for fees, banks add to their contingent future liabilities. Commercial letters of credit are widely used in both domestic and international trade. For example, they ease the shipment of grain between a farmer in Iowa and a purchaser in New Orleans or the shipment of goods between a U.S. importer and a foreign exporter. The bank’s role is to provide a formal guarantee that payment for goods shipped or sold will be forthcoming regardless of whether the buyer of the goods defaults on payment.
Standby letters of credit perform an insurance function similar to commercial and trade letters of credit. The structure and type of risk covered differ, however. FIs may issue SLCs to cover contingencies that are potentially more severe , less predictable or frequent, and not necessarily trade related. These contingencies include performance bond guar-antees by which an FI may guarantee that a real estate development will be completed in some interval of time. Alternatively, the FI may offer default guarantees to back an issue of commercial paper or municipal revenue bonds to allow issuers to achieve a higher credit rating and a lower funding cost than otherwise.
Both LCs and SLCs are essentially guarantees to underwrite performance that a depository institution sells to the buyers of the guarantees (such as a corporation). In eco-nomic terms, the depository institution that sells LCs and SLCs is selling insurance against the frequency or severity of some particular future event occurring. Further, similar to the different lines of insurance sold by property casualty insurers, LC and SLC contracts differ as to the severity and frequency of their risk exposures.
Loans Sold. Loans sold (item 4 in Table 12–2 ) are loans that a bank has originated and then sold to other investors that may be returned (sold with recourse ) to the originating institution in the future if the credit quality of the loans deteriorates. We discuss the types of loans that banks sell, their incentives to sell, and the way in which they can sell them in more detail in Chapter 24 . Banks and other FIs increasingly originate loans on their bal-ance sheets, but rather than holding the loans to maturity, they quickly sell them to outside investors. These outside investors include other banks, insurance companies, mutual funds, or even corporations. In acting as loan originators and loan sellers, banks are operating more as loan brokers than as traditional asset transformers (see Chapters 1 and 11 ).
When an outside party buys a loan with absolutely no recourse to the seller of the loan should the loan eventually go bad, loan sales have no OBS contingent liability implications for banks. Specifically, no recourse means that if the loan the bank sells should go bad, the buyer of the loan must bear the full risk of loss. In particular, the buyer cannot go back to the seller or originating bank to seek payment on the bad loan. Suppose that the loan is sold with recourse. Then, loan sales present a long-term off-balance-sheet or contingent credit risk to the seller. Essentially, the buyer of the loan holds an option to put the loan back to the seller, which the buyer can exercise should the credit quality of the purchased loan materially deteriorate. In reality, the recourse or nonrecourse nature of loan sales is often ambiguous. For example, some have argued that banks generally are willing to repur-chase bad no-recourse loans to preserve their reputations with their customers. Obviously, reputation concerns may extend the size of a selling bank’s contingent liabilities from OBS activities.
Derivative Contracts. Derivative securities (items 5 to 8 in Table 12–2 ) are the futures, forward, swap, and option positions taken by a bank for hedging and other purposes (see Chapters 10 and 23 ). We discussed the tremendous growth of derivative securities activity in Chapter 11 . Banks can be either users of derivative contracts for hedging (see Chapter 10 and 23 ) and other purposes or dealers that act as middlemen in trades with customers for
commercial letters of credit Contingent guarantees sold by an FI to under-write the trade or com-mercial performance of the buyers of the guarantees.
commercial letters of credit Contingent guarantees sold by an FI to under-write the trade or com-mercial performance of the buyers of the guarantees.
standby letters of credit Guarantees issued to cover contingencies that are potentially more severe and less predict-able than contingencies covered under trade-related or commercial letters of credit.
standby letters of credit Guarantees issued to cover contingencies that are potentially more severe and less predict-able than contingencies covered under trade-related or commercial letters of credit.
loans sold Loans originated by the bank and then sold to other investors that can be returned to the origi-nating institution.
loans sold Loans originated by the bank and then sold to other investors that can be returned to the origi-nating institution.
recourse The ability to put an asset or loan back to the seller should the credit quality of that asset deteriorate.
recourse The ability to put an asset or loan back to the seller should the credit quality of that asset deteriorate.
derivative securities Futures, forward, swap, and option positions taken by the FI for hedg-ing or other purposes.
derivative securities Futures, forward, swap, and option positions taken by the FI for hedg-ing or other purposes.
sau34663_ch12_374-405.indd 385sau34663_ch12_374-405.indd 385 5/27/11 7:16:50 PM5/27/11 7:16:50 PM
First Pages
386 Part 3 Commercial Banks
a fee. It has been estimated that some 1,064 U.S. banks use derivatives and that five large dealer banks—J.P. Morgan Chase, Bank of America, Goldman Sachs, Citigroup, and Morgan Stanley—account for some 95 percent of the derivatives that user banks hold. 10
Contingent credit risk is likely to be present when banks expand their positions in futures, forward, swap, and option contracts. This risk relates to the fact that the coun-terparty to one of these contracts may default on payment obligations, leaving the bank unhedged and having to replace the contract at today’s interest rates, prices, or exchange rates, which may be relatively unfavorable. In addition, such defaults are most likely to occur when the counterparty is losing heavily on the contract and the bank is in the money on the contract. This type of default risk is much more serious for forward contracts than for futures contracts. This is because forward contracts are nonstandard contracts entered into bilaterally by negotiating parties, such as two banks, and all cash flows are required to be paid at one time (on contract maturity). Thus, they are essentially over-the-counter (OTC) arrangements with no external guarantees should one or the other party default on the contract (see Chapter 10 ). By contrast, futures contracts are standardized contracts guar-anteed by organized exchanges such as the New York Futures Exchange (NYFE). Futures contracts, like forward contracts, make commitments to deliver foreign exchange (or some other asset) at some future date. If a counterparty were to default on a futures contract, how-ever, the exchange would assume the defaulting party’s position and payment obligations.
Option contracts can also be traded over the counter (OTC) or bought/sold on orga-nized exchanges. If the options are standardized options traded on exchanges, such as bond options, they are virtually default risk free. 11 If they are specialized options purchased OTC, such as interest rate caps (see Chapter 10 ), some elements of default risk exist. 12 Similarly, swaps are OTC instruments normally susceptible to default risk (see Chapter 10 ). 13 In general, default risk on OTC contracts increases with the time to maturity of the contract and the fluctuation of underlying prices, interest rates, or exchange rates. 14
Other Fee-Generating Activities
Commercial banks engage in other fee-generating activities that cannot be easily identi-fied from analyzing their on- and off-balance-sheet accounts. These include trust services, processing services, and correspondent banking.
Trust Services. The trust department of a commercial bank holds and manages assets for individuals or corporations. Only the largest banks have sufficient staff to offer trust ser-vices. Individual trusts represent about one-half of all trust assets managed by commercial banks. These trusts include estate assets and assets delegated to bank trust departments by less financially sophisticated investors. Pension fund assets are the second largest group of assets managed by the trust departments of commercial banks. The banks manage the pen-sion funds, act as trustees for any bonds held by the pension funds, and act as transfer and disbursement agents for the pension funds.
Processing Services. Commercial banks have traditionally provided financial data pro-cessing services for their business customers. These services include managing a customer’s accounts receivable and accounts payable. Similarly, bank cash management services
10 See OCC Bank Derivative Report, Second Quarter 2010 and Chapter 10 .
11 Note that the options still can be subject to interest rate risk; see the discussion in Chapter 23 .
12 Under an interest rate cap, the seller, in return for a fee, promises to compensate the buyer should interest rates rise above a certain level. If rates rise much more than expected, the cap seller may have an incentive to default to truncate the losses. Thus, selling a cap is similar to a bank’s selling interest rate risk insurance (see Chapter 10 for more details).
13 In a swap, two parties contract to exchange interest rate payments or foreign exchange payments. If interest rates (or foreign exchange rates) move a good deal, one party can face considerable future loss exposure, creating incentives to default.
14 Reputational considerations and the need for future access to markets for hedging deter the incentive to default (see Chapter 23 as well). However, most empirical evidence suggests that derivative contracts have reduced FI risk.
sau34663_ch12_374-405.indd 386sau34663_ch12_374-405.indd 386 5/27/11 7:16:50 PM5/27/11 7:16:50 PM
First Pages
Chapter 12 Commercial Banks’ Financial Statements and Analysis 387
include the provision of lockbox services where customers of a firm send payments to a post office box managed by a bank, which opens, processes, collects, and deposits checks within a very short time (sometimes as short as one hour) in the business customer’s account. Banks also provide personalized services for both large and small companies, including moving funds from savings accounts that earn interest to transactions accounts that do not earn interest as firms need to make payments. The larger commercial banks have broadened their range of business services to include management consulting, data processing, and information systems or other technological services. Information systems and software marketed by commercial banks assist clients in collecting, analyzing, and reporting data effectively and efficiently.
Correspondent Banking. Correspondent banking is the provision of banking services to other banks that do not have the staff resources to perform the service themselves. These services include check clearing and collection, foreign exchange trading, hedging services, and participation in large loan and security issuances. Correspondent banking services are generally sold as a package of services. Payment for the services is generally in the form of noninterest bearing deposits held at the bank offering the correspondent services.
Income Statement
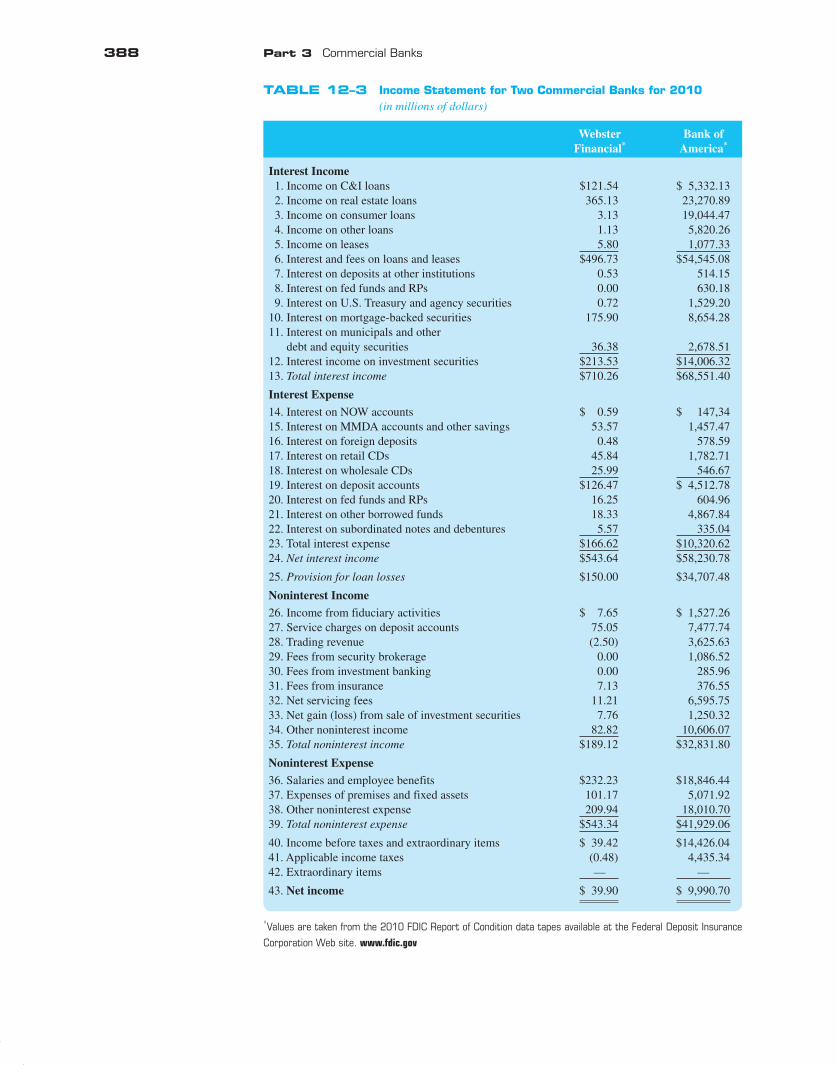
See Table 12–3 for the report of income or income statement for Webster Financial and Bank of America for 2010. The report of income identifies the interest income and expenses, net interest income, provision for loan losses, noninterest income and expenses, income before taxes and extraordinary items, and net income for the banks earned from the on- and off-balance-sheet activities described above. As we discuss the income statement, notice the direct relationship between it and the balance sheet (both on- and off-). The composition of an FI’s assets and liabilities, combined with the interest rates earned or paid on them, directly determines the interest income and expense on the income statement. In addition, because the assets and liabilities of FIs are mainly financial, most of the income and expense items reported on the income statement are interest rate related (rather than reflecting sales prices and cost of goods sold, as seen with manufacturing corporations).
Interest Income. The income statement for a commercial bank first shows the sources of interest income (item 13). Interest and fee income on loans and leases (item 6 in Table 12–3 ) is the largest interest income-producing category. Subcategories are often listed on the income statement (items 1–4) for each category of loan listed earlier. Most banks also list income on leases (item 5) as a separate item. Interest on investment securities held (item 12) is also included as interest income. These too may be listed by subcategories items 7–11) described earlier. Interest income is recorded on an accrued basis (see earlier discussion). Thus, loans on which interest payments are past due can still be recorded as generating income for a bank. 15 Interest income is taxable, except for that on municipal securities and tax-exempt income from direct lease financing. Tax-exempt interest can be converted to a taxable equivalent basis as follows:
Taxable equivalent interest income
Interest�
income
1 ’� Bank s tax rate
Interest Expenses. Interest expense (item 23) is the second major category on a bank’s income statement. Items listed here come directly from the liability section of the balance sheet: interest on deposits (item 19), NOW accounts (item 14), MMDAs and other savings (item 15), foreign deposits (item 16), retail CDs (item 17), and wholesale CDs (item 18), and interest on fed funds (item 20), RPs (item 20), and other borrowed funds (item 21). Interest on subordinated notes and debentures (item 22) is generally reported as a separate item.
LG 4LG 4
15 A bank can recognize income for at least 90 days after the due date of the interest payment.
sau34663_ch12_374-405.indd 387sau34663_ch12_374-405.indd 387 5/27/11 7:16:50 PM5/27/11 7:16:50 PM
First Pages
388 Part 3 Commercial Banks
TABLE 12–3 Income Statement for Two Commercial Banks for 2010 (in millions of dollars)
Webster Bank of Financial * America *
Interest Income 1. Income on C&I loans $121.54 $ 5,332.13 2. Income on real estate loans 365.13 23,270.89 3. Income on consumer loans 3.13 19,044.47 4. Income on other loans 1.13 5,820.26 5. Income on leases 5.80 1,077.33 6. Interest and fees on loans and leases $496.73 $54,545.08 7. Interest on deposits at other institutions 0.53 514.15 8. Interest on fed funds and RPs 0.00 630.18 9. Interest on U.S. Treasury and agency securities 0.72 1,529.20 10. Interest on mortgage-backed securities 175.90 8,654.28 11. Interest on municipals and other debt and equity securities 36.38 2,678.51 12. Interest income on investment securities $213.53 $14,006.32 13. Total interest income $710.26 $68,551.40
Interest Expense
14. Interest on NOW accounts $ 0.59 $ 147,34 15. Interest on MMDA accounts and other savings 53.57 1,457.47 16. Interest on foreign deposits 0.48 578.59 17. Interest on retail CDs 45.84 1,782.71 18. Interest on wholesale CDs 25.99 546.67 19. Interest on deposit accounts $126.47 $ 4,512.78 20. Interest on fed funds and RPs 16.25 604.96 21. Interest on other borrowed funds 18.33 4,867.84 22. Interest on subordinated notes and debentures 5.57 335.04 23. Total interest expense $166.62 $10,320.62 24. Net interest income $543.64 $58,230.78
25. Provision for loan losses $150.00 $34,707.48
Noninterest Income
26. Income from fiduciary activities $ 7.65 $ 1,527.26 27. Service charges on deposit accounts 75.05 7,477.74 28. Trading revenue (2.50) 3,625.63 29. Fees from security brokerage 0.00 1,086.52 30. Fees from investment banking 0.00 285.96 31. Fees from insurance 7.13 376.55 32. Net servicing fees 11.21 6,595.75 33. Net gain (loss) from sale of investment securities 7.76 1,250.32 34. Other noninterest income 82.82 10,606.07 35. Total noninterest income $189.12 $32,831.80
Noninterest Expense
36. Salaries and employee benefits $232.23 $18,846.44 37. Expenses of premises and fixed assets 101.17 5,071.92 38. Other noninterest expense 209.94 18,010.70 39. Total noninterest expense $543.34 $41,929.06
40. Income before taxes and extraordinary items $ 39.42 $14,426.04 41. Applicable income taxes (0.48) 4,435.34 42. Extraordinary items — —
43. Net income $ 39.90 $ 9,990.70
* Values are taken from the 2010 FDIC Report of Condition data tapes available at the Federal Deposit Insurance
Corporation Web site. www.fdic.gov
sau34663_ch12_374-405.indd 388sau34663_ch12_374-405.indd 388 5/27/11 7:16:51 PM5/27/11 7:16:51 PM
First Pages

Chapter 12 Commercial Banks’ Financial Statements and Analysis 389
Net Interest Income. Total interest income minus total interest expense is listed next on the income statement as net interest income (item 24). Net interest income is an important tool in assessing the bank’s ability to generate profits and control interest rate risk (see below).
Provision for Loan Losses. The provision for loan losses (item 25) is a noncash, tax-deductible expense. The provision for loan losses is the current period’s allocation to the allowance for loan losses listed on the balance sheet. This item represents the bank man-agement’s prediction of loans at risk of default for the period. While the loans remain on the bank’s balance sheet, the expected losses from any bad loans affect net income and equity on the income statement and balance sheet, respectively. For example, Bank of America increased its loan loss reserve (recording a provision for loan losses) by $13.4 billion in the second quarter of 2009. This loan loss provision expense was recorded in recognition of expected losses on mortgages and loans tied to the financial crisis. As a result, Bank of America’s earnings per share fell 54 percent. As mentioned earlier, the size of the provi-sion is determined by management, and in the United States it is subject to a maximum allowable tax deductible amount set by the Internal Revenue Service.
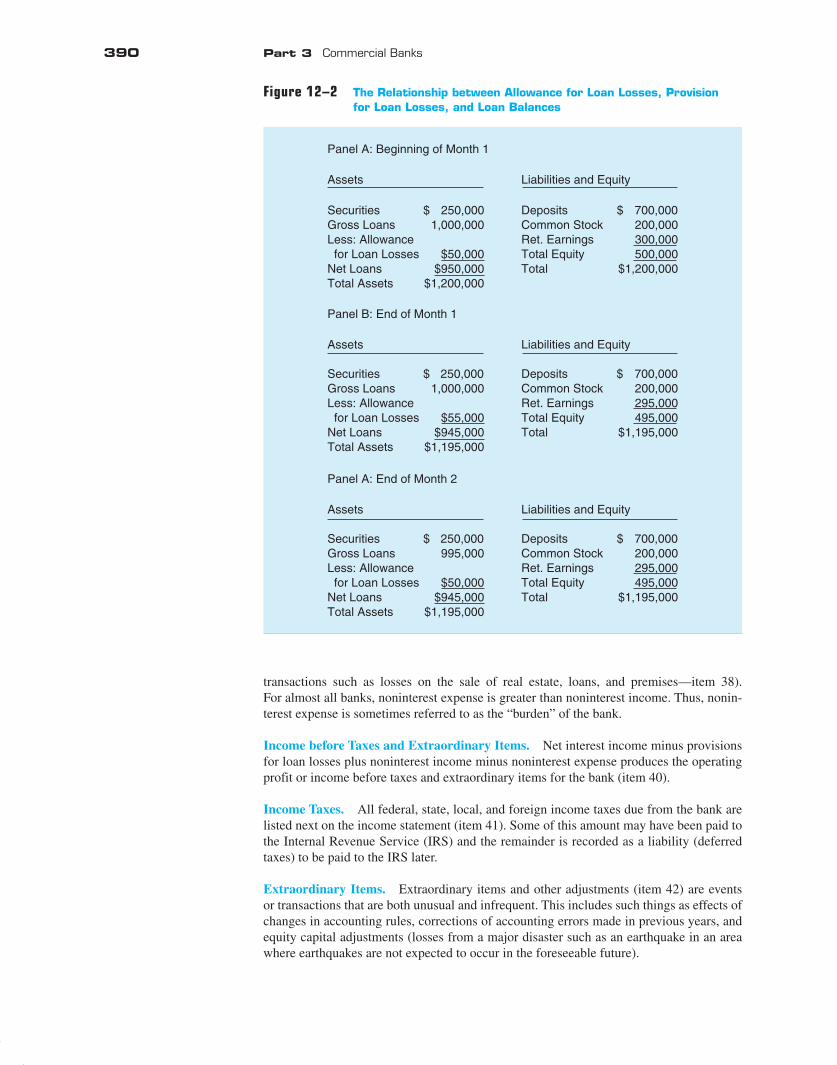
Example 12–1 The Relationship between Allowance for Loan Losses, Provision for Loan Losses, and Loan Balances
At the beginning of the month, a bank has $1 million in its loan portfolio and $50,000 in the allowance for loan losses (see Panel A of Figure 12–2 ). During the month, management estimates that an additional $5,000 of loans will not be paid as promised. Accordingly, the bank records an expense to loan loss provision (which reduces net income and thus retained earnings and equity of the bank) and increases the allowance for loan losses to $55,000 on the balance sheet (see Panel B in Figure 12–2 ). Notice that the loan is still listed as an asset on the bank’s balance sheet at this time. After another month, management feels there is no chance of recovering the loan and writes the $5,000 loan off its books. At this time, loans are reduced by $5,000 as is the allowance for loan losses (see Panel C in Figure 12–2 ). Notice when the loan is considered unrecoverable and actually removed from the balance sheet, there is no impact on the bank’s income or equity value.
Noninterest Income. Noninterest income (item 35) includes all other income received by the bank as a result of its on- and off-balance-sheet activities and is becoming increasingly important as the ability to attract core deposits and high-quality loan applicants becomes more difficult. Included in this category is income from fiduciary activities (for example, earnings from operating a trust department—item 26), service charges on deposit accounts (item 27), trading revenues (gains [losses] and fees from trading marketable instruments and OBS derivative instruments—item 28), fees from other-than-banking activities such as security brokerage (item 29), investment banking (item 30), insurance (item 31), servicing fees from mortgages, credit cards, and other assets (item 32), and gains and losses from the sale of investment securities (item 33), and other noninterest income (fee income from OBS loan commitments and letters of credit, ATM fees, money order, cashier’s check, and travelers’ check fees, data processing revenue, and revenue from one-time transactions such as sales of real estate owned, loans, premises, and fixed assets—item 34).
The sum of interest income and noninterest income is referred to as the bank’s total operating income or total revenue. Total operating income for a bank is equivalent to total sales in a manufacturing firm and represents the bank’s income received from all sources.
Noninterest Expense. Noninterest expense (item 39) items consist mainly of person-nel expenses and are generally large relative to noninterest income. Items in this category include salaries and employee benefits (item 36), expenses of premises and fixed assets (i.e., utilities, depreciation, and deposit insurance—item 37), and other (expenses of one-time
total operating income The sum of the interest income and noninterest income.
total operating income The sum of the interest income and noninterest income.
sau34663_ch12_374-405.indd 389sau34663_ch12_374-405.indd 389 5/27/11 7:16:51 PM5/27/11 7:16:51 PM
First Pages
390 Part 3 Commercial Banks
transactions such as losses on the sale of real estate, loans, and premises—item 38). For almost all banks, noninterest expense is greater than noninterest income. Thus, nonin-terest expense is sometimes referred to as the “burden” of the bank.
Income before Taxes and Extraordinary Items. Net interest income minus provisions for loan losses plus noninterest income minus noninterest expense produces the operating profit or income before taxes and extraordinary items for the bank (item 40).
Income Taxes. All federal, state, local, and foreign income taxes due from the bank are listed next on the income statement (item 41). Some of this amount may have been paid to the Internal Revenue Service (IRS) and the remainder is recorded as a liability (deferred taxes) to be paid to the IRS later.
Extraordinary Items. Extraordinary items and other adjustments (item 42) are events or transactions that are both unusual and infrequent. This includes such things as effects of changes in accounting rules, corrections of accounting errors made in previous years, and equity capital adjustments (losses from a major disaster such as an earthquake in an area where earthquakes are not expected to occur in the foreseeable future).
Panel A: Beginning of Month 1
Assets
Securities $ 250,000Gross Loans 1,000,000Less: Allowance for Loan Losses $50,000Net Loans $950,000Total Assets $1,200,000
Panel B: End of Month 1
Assets
Securities $ 250,000Gross Loans 1,000,000Less: Allowance for Loan Losses $55,000Net Loans $945,000Total Assets $1,195,000
Panel A: End of Month 2
Assets
Securities $ 250,000Gross Loans 995,000Less: Allowance for Loan Losses $50,000Net Loans $945,000Total Assets $1,195,000
Liabilities and Equity
Deposits $ 700,000Common Stock 200,000Ret. Earnings 300,000Total Equity 500,000Total $1,200,000
Liabilities and Equity
Deposits $ 700,000Common Stock 200,000Ret. Earnings 295,000Total Equity 495,000Total $1,195,000
Liabilities and Equity
Deposits $ 700,000Common Stock 200,000Ret. Earnings 295,000Total Equity 495,000Total $1,195,000
Figure 12–2 The Relationship between Allowance for Loan Losses, Provision for Loan Losses, and Loan Balances
sau34663_ch12_374-405.indd 390sau34663_ch12_374-405.indd 390 5/27/11 7:16:51 PM5/27/11 7:16:51 PM
First Pages

Chapter 12 Commercial Banks’ Financial Statements and Analysis 391
Net Income. Income before taxes and extraordinary items minus income taxes plus (or minus) extraordinary items results in the net income for the bank (item 43). Net income is the bottom line on the income statement.
Direct Relationship between the Income Statement and the Balance Sheet
As mentioned earlier, banks’ financial statements are directly related (more so than for nonfinancial companies). That is, the items on the income statement are determined by the balance sheet assets and liabilities along with the interest rates on each item. This direct relationship between the two financial state-ments can be seen by depicting the income statement as follows:
NI r A r L P NII NIE Tn n
n
N
m mm
M
� � � � � �� �1 1∑ ∑
where
NI � Bank’s net income A n � Dollar value of the bank’s n th asset L m � Dollar value of the bank’s m th liability r n � Rate earned on the bank’s n th asset r m � Rate paid on the bank’s m th liability P � Provision for loan losses NII � Noninterest income earned by the bank, including income from off-
balance-sheet activities NIE � Noninterest expenses incurred by the bank T � Bank’s taxes and extraordinary items N � Number of assets the bank holds M � Number of liabilities the bank holds
Net income is the direct result of (1) the amount and mix of assets and liabilities held by the bank taken from the balance sheet and (2) the interest rate on each of them. For example, increasing the dollar value of an asset, all else constant, results in a direct increase in the bank’s net income equal to the size of the increase times the rate of interest on the asset. Likewise, decreasing the rate paid on a liability, all else constant, directly increases net income by the size of the rate decrease times the dollar value of the liability on the balance sheet. Finally, changing the mix of assets or liabilities on the balance sheet has a direct effect on net income equal to the size of the rate difference times the dollar value of the asset or liability being changed. For example, suppose that a bank has the following net income: NI � .046(1m.) � .06(3m.) �. 035(3m.) � .0475(1m.) � $73,500
The bank replaces $500,000 of assets currently yielding 4.60 percent with assets yield-ing 6 percent. As a result, net income increases by $7,000 [(6% � 4.6%) � $500,000], or
NI � .046(0.5m.) � .06(3.5m.) � .035(3m.) � .0475(1m.) � $80,500
In the early and mid-2000s, the commercial banking industry experienced a period of record profits. The financial crisis brought about an abrupt reversal of this trend. Dur-ing periods of falling profits and even during periods of record profits, many banks have weak and inefficient areas that need to be addressed. One way to identify weaknesses and problem areas is by analyzing financial statements. In particular, an analysis of selected accounting ratios—ratio analysis—allows a bank manager to evaluate the bank’s current performance, the change in its performance over time ( time series analysis of ratios over
FINANCIAL STATEMENT ANALYSIS USING A RETURN ON EQUITY FRAMEWORKFINANCIAL STATEMENT ANALYSIS USING A RETURN ON EQUITY FRAMEWORK
time series analysis Analysis of financial statements over a period of time.
time series analysis Analysis of financial statements over a period of time.
DO YOU UNDERSTAND:
1. The difference between a wholesale bank and a retail bank?
2. What the trade-offs are in holding a large proportion of short-term securities, such as T-bills, versus long-term securities, such as loans?
3. What the trade-offs are in issuing short-term deposit accounts, such as demand deposits and retail CDs, versus long-term deposits and other funding sources, such as wholesale CDs and long-term debt?
4. What the major difference is between a commercial letter of credit and a standby letter of credit?
5. What counterparty risk in a forward contract means?
6. Which is riskier for a bank, loan sales with recourse or loan sales without recourse?
7. What the nature of the relationship is between balance sheet and income statement items?
8. How paying a lower rate for new deposits than for other liabilities impacts a bank’s income statement?
sau34663_ch12_374-405.indd 391sau34663_ch12_374-405.indd 391 5/27/11 7:16:51 PM5/27/11 7:16:51 PM
First Pages

392 Part 3 Commercial Banks
a period of time), and its performance relative to that of competitor banks ( cross-sectional analysis of ratios across a group of firms).
Analyzing ratio trends over time, along with absolute ratio levels, gives managers, analysts, and investors information about whether a firm’s financial condition is improving or deteriorating. For example, ratio analysis may reveal that a bank’s capital-to-assets ratio is decreasing. This suggests that capital is decreasing as a source of financing the assets of the bank and that deposits and purchased funds are being increasingly used to finance the bank’s assets. If this increase is the result of a deliberate policy to decrease capital and use cheaper sources of asset financing, the decreased capital ratio is good for the bank. Man-agers and investors should be concerned, on the other hand, if a decreased capital-to-asset ratio is the result of declining profits.
Looking at one bank’s financial ratios, even through time, gives managers, analysts, and investors only a limited picture of bank performance. Ratio analysis almost always includes a comparison of one bank’s ratios relative to the ratios of other firms in the industry, or cross-sectional analysis. Key to cross-sectional analysis is identifying similar banks in that they compete in the same markets, have similar sized assets, and operate in a similar man-ner to the bank being analyzed. Since no two banks are identical, obtaining such a compari-son group is no easy task. Thus, the choice of companies to use in cross-sectional analysis is at best subjective. A tool available to assist in cross-sectional analysis is the Uniform Bank Performance Report (UBPR) maintained by the Federal Financial Institutions Examination Council. The UBPR summarizes the performance of banks for various peer groups (banks similar in size and economic environment), for various size groups, and by state.
Figure 12–3 summarizes the return on equity (ROE) framework. 16 The ROE frame-work starts with the most frequently used measure of profitability, ROE, and then breaks it down to identify strengths and weaknesses in a bank’s performance. The resulting break-down provides a convenient and systematic method to identify strengths and weaknesses of a bank’s profitability. Identification of strengths and weaknesses, and the reasons for them, provides an excellent tool for bank managers as they look for ways to improve prof-itability. Table 12–4 summarizes the role of ROE and the first two levels of the ROE frame-work (from Figure 12–3 ) in analyzing an FI’s performance.
The remainder of this chapter applies the ROE framework to our two banks: Webster Financial and Bank of America. All of the ratios discussed as part of the ROE break-down are reported in Tables 12–5 through 12–7 . We refer to these ratios by number (1 through 123). In addition, Figure 12–3 lists these ratios (by ratio number) as they fit into the ROE framework.
Return on Equity and Its Components
ROE (ratio 1 in Table 12–5 ) is defined as:
ROE
Net income
Total equity capital�
It measures the amount of net income after taxes earned for each dollar of equity capital contributed by the bank’s stockholders. Taking these data from the financial statements for Webster Financial and Bank of America, the following ROEs for 2010 were: 17
Webster Financial Bank of America
ROE39 90
1 968 862 03
.
, .. %�
9 990 70
220 622 214 53
, .
, .. %�
cross-sectional analysis Analysis of financial statements comparing one firm with others.
cross-sectional analysis Analysis of financial statements comparing one firm with others.
www.ffiec.gov/UBPR.htm www.ffiec.gov/UBPR.htm
LG 5LG 5
16 The ROE framework is similar to the DuPont analysis that managers of nonfinancial institutions frequently use.
17 We are using quarter-end balance sheet data to calculate ratios. The use of these data may bias ratios in that they are data for one day in the year, whereas income statement data cover the full year. To avoid this bias, average values for balance sheet data are often used to calculate ratios.
sau34663_ch12_374-405.indd 392sau34663_ch12_374-405.indd 392 5/27/11 7:16:51 PM5/27/11 7:16:51 PM
First Pages

Chapter 12 Commercial Banks’ Financial Statements and Analysis 393
Figure 12–3 Classification of Ratios Listed in Tables 12–5 through 12–7
TABLE 12–4 Role of ROE, ROA, EM, PM, and AU in Analyzing Financial Institution Performance
Note: Ratios 6–8 are discussed in the section “Other Ratios” later in the chapter.
Net incomeTotal equity capital
Ratio 1
ROE
Total assetsTotal equity capital
Ratio 3
Equity Multiplier
Net incomeTotal operating income
Ratio 4
Profit Margin
ROA
Total operating incomeTotal assets
Ratio 5
Asset Utilization
Interest expenseTotal operating income
Ratio 9(components)(Ratios 13–20)(Ratios 24–31)(Ratios 32–44)(Ratios 45–53)
Provision for loan lossesTotal operating income
Ratio 10
Noninterest expenseTotal operating income
Ratio 11(components)(Ratios 21–23)(Ratios 54–56)(Ratios 57–59)Income taxes
Total operating income
Ratio 12
Interest incomeTotal assets
Ratio 60(components)(Ratios 62–71)(Ratios 72–81)(Ratios 82–94)
(Ratios 95–103)(Ratios 104–109)
Noninterest incomeTotal assets
Ratio 61(components)
(Ratios 110–116)(Ratios 117–123)
Net incomeTotal assets
Ratio 2
Return on Equity (ROE)—measures overall profitability of the FI per dollar of equity.Return on Assets (ROA)—measures profit generated relative to the FI’s assets.Equity Multiplier (EM)—measures the extent to which assets of the FI are funded with equity relative to debt.Profit Margin (PM)—measures the ability to pay expenses and generate net income from interest and noninterest income.Asset Utilization (AU)—measures the amount of interest and noninterest income generated per dollar of total assets.
sau34663_ch12_374-405.indd 393sau34663_ch12_374-405.indd 393 5/27/11 7:16:52 PM5/27/11 7:16:52 PM
First Pages
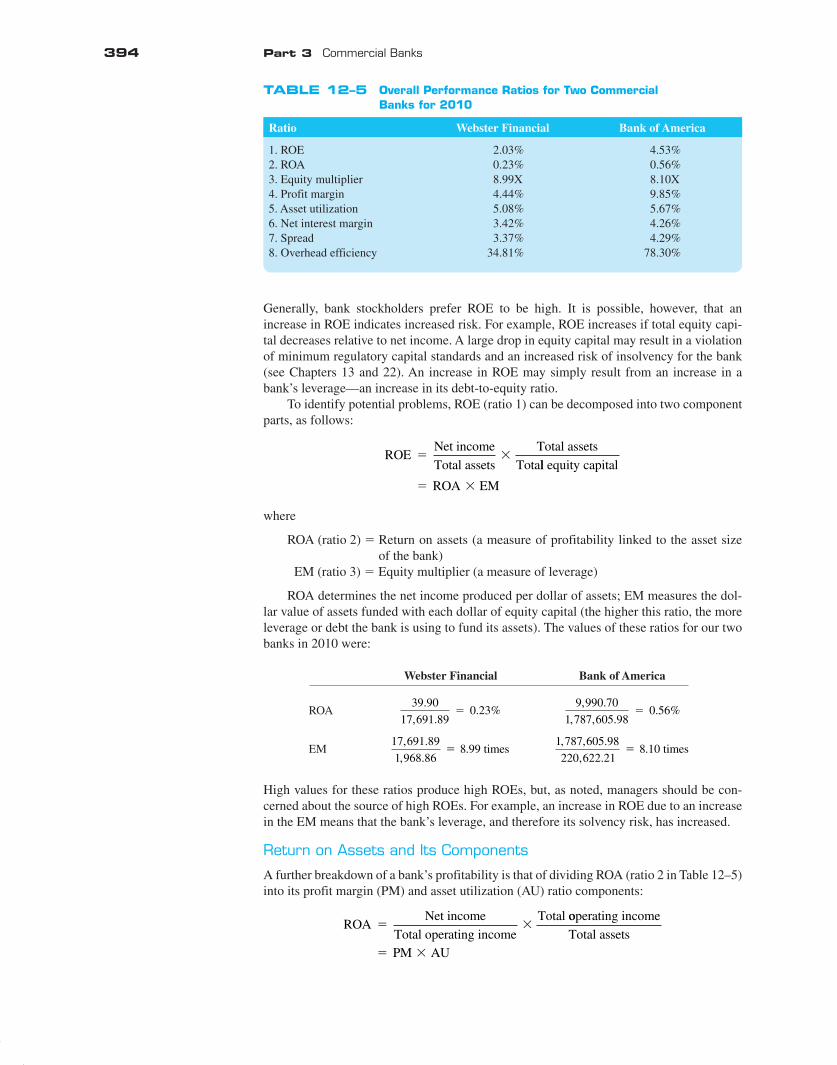
394 Part 3 Commercial Banks
Generally, bank stockholders prefer ROE to be high. It is possible, however, that an increase in ROE indicates increased risk. For example, ROE increases if total equity capi-tal decreases relative to net income. A large drop in equity capital may result in a violation of minimum regulatory capital standards and an increased risk of insolvency for the bank (see Chapters 13 and 22 ). An increase in ROE may simply result from an increase in a bank’s leverage—an increase in its debt-to-equity ratio.
To identify potential problems, ROE (ratio 1) can be decomposed into two component parts, as follows:
ROENet income
Total assets
Total assets
Tota� �
ll equity capital
ROA EM� �
where
ROA (ratio 2) � Return on assets (a measure of profitability linked to the asset size of the bank)
EM (ratio 3) � Equity multiplier (a measure of leverage)
ROA determines the net income produced per dollar of assets; EM measures the dol-lar value of assets funded with each dollar of equity capital (the higher this ratio, the more leverage or debt the bank is using to fund its assets). The values of these ratios for our two banks in 2010 were:
Webster Financial Bank of America
ROA39 90
17 691 890 23
.
, .. %�
9 990 70
1 787 605 980 56
, .
, , .. %�
EM17 691 89
1 968 86
, .
, ..� 8 99 times
1 787 605 98
220 622 21
, , .
, ..� 8 10 times
High values for these ratios produce high ROEs, but, as noted, managers should be con-cerned about the source of high ROEs. For example, an increase in ROE due to an increase in the EM means that the bank’s leverage, and therefore its solvency risk, has increased.
Return on Assets and Its Components
A further breakdown of a bank’s profitability is that of dividing ROA (ratio 2 in Table 12–5 ) into its profit margin (PM) and asset utilization (AU) ratio components:
ROANet income
Total operating income
Total� �
ooperating income
Total assetsPM AU� �
TABLE 12–5 Overall Performance Ratios for Two Commercial Banks for 2010
Ratio Webster Financial Bank of America
1. ROE 2.03% 4.53%2. ROA 0.23% 0.56%3. Equity multiplier 8.99X 8.10X4. Profit margin 4.44% 9.85%5. Asset utilization 5.08% 5.67%6. Net interest margin 3.42% 4.26%7. Spread 3.37% 4.29%8. Overhead efficiency 34.81% 78.30%
sau34663_ch12_374-405.indd 394sau34663_ch12_374-405.indd 394 5/27/11 7:16:52 PM5/27/11 7:16:52 PM
First Pages
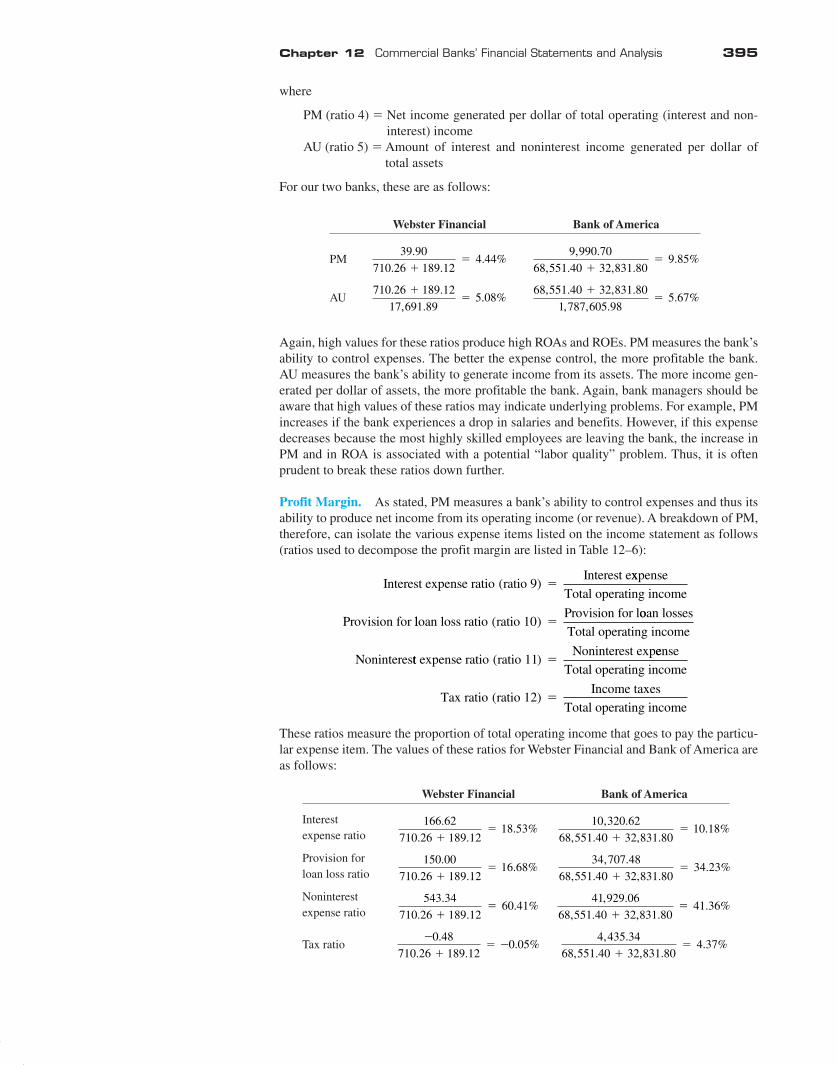
Chapter 12 Commercial Banks’ Financial Statements and Analysis 395
where
PM (ratio 4) � Net income generated per dollar of total operating (interest and non-interest) income
AU (ratio 5) � Amount of interest and noninterest income generated per dollar of total assets
For our two banks, these are as follows:
Webster Financial Bank of America
PM39 90
710 26 189 124 44
.
. .. %
��
9,990.70
68,551.409.85%
��
32 831 80, .
AU710 26 189 12
17 691 895 08
. .
, .. %
��
68 551 40 32 831 80
1 787 605 985 67
, . , .
, , .. %
��
Again, high values for these ratios produce high ROAs and ROEs. PM measures the bank’s ability to control expenses. The better the expense control, the more profitable the bank. AU measures the bank’s ability to generate income from its assets. The more income gen-erated per dollar of assets, the more profitable the bank. Again, bank managers should be aware that high values of these ratios may indicate underlying problems. For example, PM increases if the bank experiences a drop in salaries and benefits. However, if this expense decreases because the most highly skilled employees are leaving the bank, the increase in PM and in ROA is associated with a potential “labor quality” problem. Thus, it is often prudent to break these ratios down further.
Profit Margin. As stated, PM measures a bank’s ability to control expenses and thus its ability to produce net income from its operating income (or revenue). A breakdown of PM, therefore, can isolate the various expense items listed on the income statement as follows (ratios used to decompose the profit margin are listed in Table 12–6 ):
Interest expense ratio ratio 9Interest e
( ) �xxpense
Total operating income
Provision for lloan loss ratio ratio 10Provision for l
( ) �ooan losses
Total operating income
Noninterestt expense ratio ratio 11Noninterest exp
( ) �eense
Total operating income
Tax ratio ratio( 12Income taxes
Total operating income) �
These ratios measure the proportion of total operating income that goes to pay the particu-lar expense item. The values of these ratios for Webster Financial and Bank of America are as follows:
Webster Financial Bank of America
Interest expense ratio
166.62
710.26 189.1218.53%
��
10 320 62
68 551 40 32 831 8010 18
, .
, . , .. %
��
Provision for loan loss ratio
150 00
710 26 189 1216 68
.
. .. %
��
34 707 48
68 551 40 32 831 8034 23
, .
, . , .. %
��
Noninterest expense ratio
543 34
710 26 189 1260 41
.
. .. %
��
41 929 06
68 551 40 32 831 8041 36
, .
, . , .. %
��
Tax ratio�
�� �
0 48
710 26 189 120 05
.
. .. %
4 435 34
68 551 40 32 831 804 37
, .
, . , .. %
��
sau34663_ch12_374-405.indd 395sau34663_ch12_374-405.indd 395 5/27/11 7:16:52 PM5/27/11 7:16:52 PM
First Pages
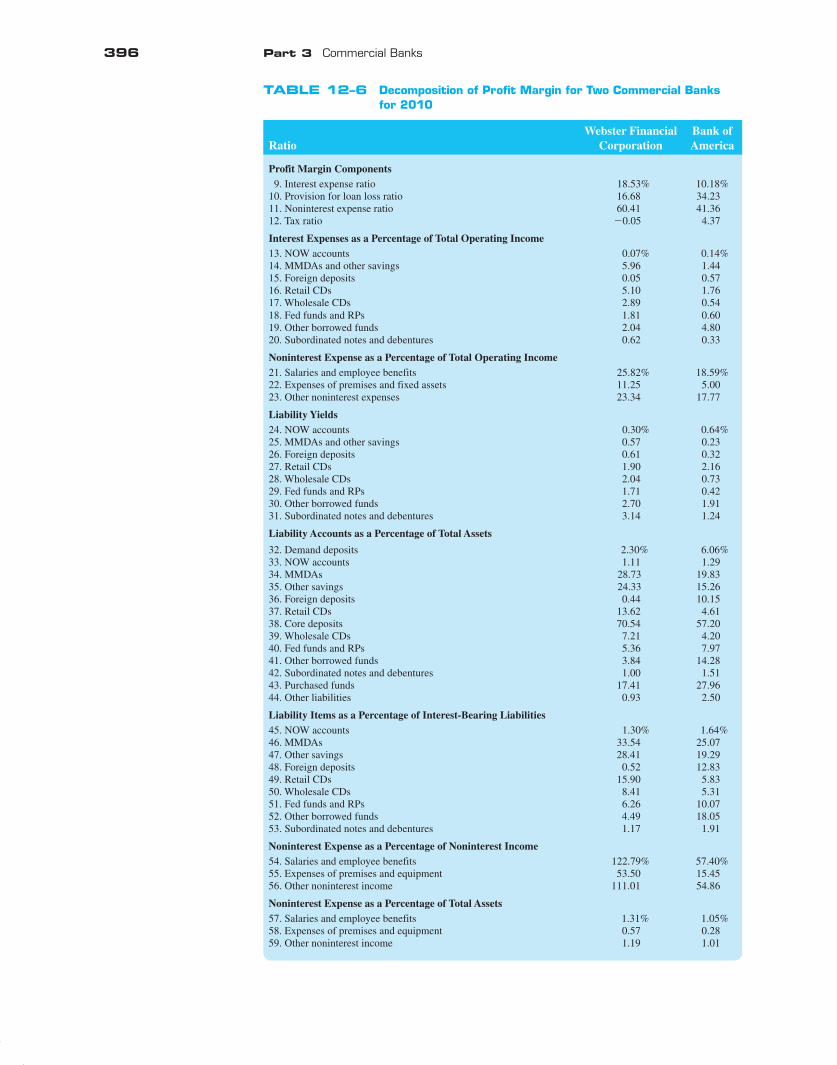
396 Part 3 Commercial Banks
TABLE 12–6 Decomposition of Profit Margin for Two Commercial Banks for 2010
RatioWebster Financial
CorporationBank of America
Profit Margin Components 9. Interest expense ratio 18.53% 10.18%10. Provision for loan loss ratio 16.68 34.2311. Noninterest expense ratio 60.41 41.3612. Tax ratio �0.05 4.37
Interest Expenses as a Percentage of Total Operating Income13. NOW accounts 0.07% 0.14%14. MMDAs and other savings 5.96 1.4415. Foreign deposits 0.05 0.5716. Retail CDs 5.10 1.7617. Wholesale CDs 2.89 0.5418. Fed funds and RPs 1.81 0.6019. Other borrowed funds 2.04 4.8020. Subordinated notes and debentures 0.62 0.33
Noninterest Expense as a Percentage of Total Operating Income21. Salaries and employee benefits 25.82% 18.59%22. Expenses of premises and fixed assets 11.25 5.0023. Other noninterest expenses 23.34 17.77
Liability Yields24. NOW accounts 0.30% 0.64%25. MMDAs and other savings 0.57 0.2326. Foreign deposits 0.61 0.3227. Retail CDs 1.90 2.1628. Wholesale CDs 2.04 0.7329. Fed funds and RPs 1.71 0.4230. Other borrowed funds 2.70 1.9131. Subordinated notes and debentures 3.14 1.24
Liability Accounts as a Percentage of Total Assets
32. Demand deposits 2.30% 6.06%33. NOW accounts 1.11 1.2934. MMDAs 28.73 19.8335. Other savings 24.33 15.2636. Foreign deposits 0.44 10.1537. Retail CDs 13.62 4.6138. Core deposits 70.54 57.2039. Wholesale CDs 7.21 4.2040. Fed funds and RPs 5.36 7.9741. Other borrowed funds 3.84 14.2842. Subordinated notes and debentures 1.00 1.5143. Purchased funds 17.41 27.9644. Other liabilities 0.93 2.50
Liability Items as a Percentage of Interest-Bearing Liabilities45. NOW accounts 1.30% 1.64%46. MMDAs 33.54 25.0747. Other savings 28.41 19.2948. Foreign deposits 0.52 12.8349. Retail CDs 15.90 5.8350. Wholesale CDs 8.41 5.3151. Fed funds and RPs 6.26 10.0752. Other borrowed funds 4.49 18.0553. Subordinated notes and debentures 1.17 1.91
Noninterest Expense as a Percentage of Noninterest Income54. Salaries and employee benefits 122.79% 57.40%55. Expenses of premises and equipment 53.50 15.4556. Other noninterest income 111.01 54.86
Noninterest Expense as a Percentage of Total Assets57. Salaries and employee benefits 1.31% 1.05%58. Expenses of premises and equipment 0.57 0.2859. Other noninterest income 1.19 1.01
sau34663_ch12_374-405.indd 396sau34663_ch12_374-405.indd 396 5/27/11 7:16:52 PM5/27/11 7:16:52 PM
First Pages
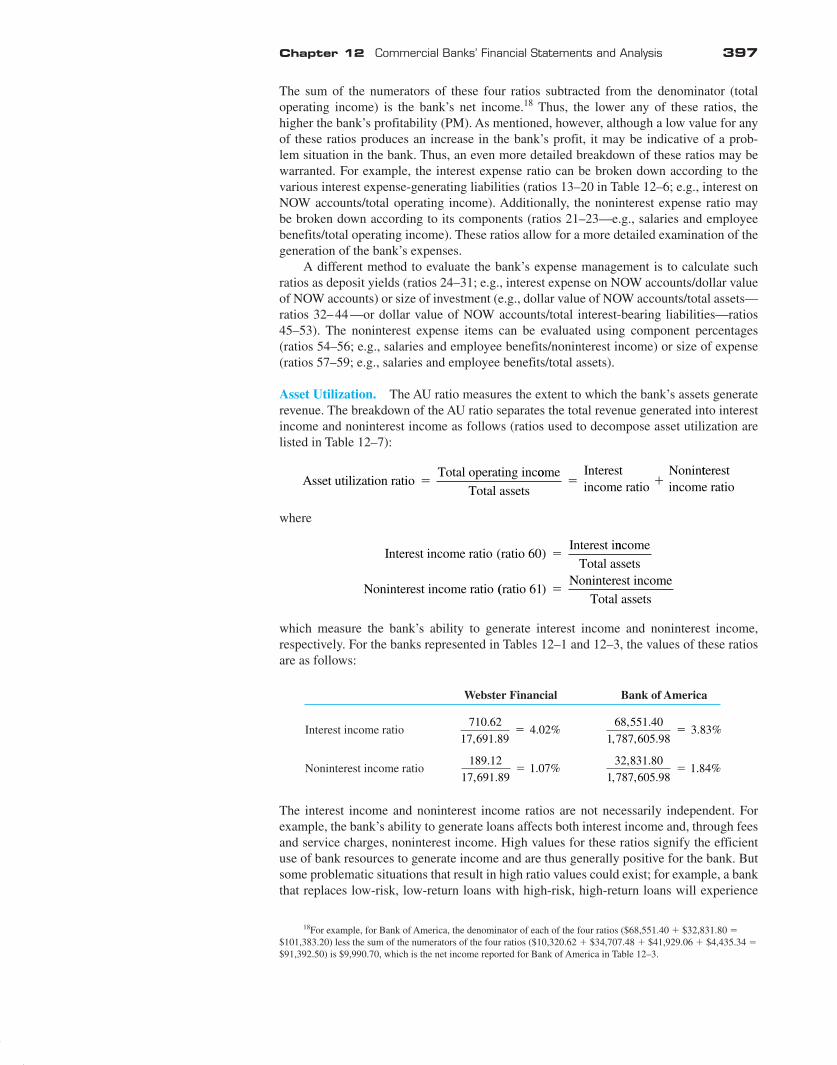
Chapter 12 Commercial Banks’ Financial Statements and Analysis 397
The sum of the numerators of these four ratios subtracted from the denominator (total operating income) is the bank’s net income. 18 Thus, the lower any of these ratios, the higher the bank’s profitability (PM). As mentioned, however, although a low value for any of these ratios produces an increase in the bank’s profit, it may be indicative of a prob-lem situation in the bank. Thus, an even more detailed breakdown of these ratios may be warranted. For example, the interest expense ratio can be broken down according to the various interest expense-generating liabilities (ratios 13–20 in Table 12–6 ; e.g., interest on NOW accounts/total operating income). Additionally, the noninterest expense ratio may be broken down according to its components (ratios 21–23—e.g., salaries and employee benefits/total operating income). These ratios allow for a more detailed examination of the generation of the bank’s expenses.
A different method to evaluate the bank’s expense management is to calculate such ratios as deposit yields (ratios 24–31; e.g., interest expense on NOW accounts/dollar value of NOW accounts) or size of investment (e.g., dollar value of NOW accounts/total assets— ratios 32– 44 —or dollar value of NOW accounts/total interest-bearing liabilities—ratios 45–53). The noninterest expense items can be evaluated using component percentages (ratios 54–56; e.g., salaries and employee benefits/noninterest income) or size of expense (ratios 57–59; e.g., salaries and employee benefits/total assets).
Asset Utilization. The AU ratio measures the extent to which the bank’s assets generate revenue. The breakdown of the AU ratio separates the total revenue generated into interest income and noninterest income as follows (ratios used to decompose asset utilization are listed in Table 12–7 ):
Asset utilization ratio
Total operating inc�
oome
Total assets
Interestincome ratio
Nonin� �
tterestincome ratio
where
Interest income ratio ratio 60Interest i
( ) �nncome
Total assets
Noninterest income ratio (( )ratio 61Noninterest income
Total assets�
which measure the bank’s ability to generate interest income and noninterest income, respectively. For the banks represented in Tables 12–1 and 12–3 , the values of these ratios are as follows:
Webster Financial Bank of America
Interest income ratio710 62
17 691 894 02
.
, .. %�
68 551 40
1 787 605 983 83
, .
, , .. %�
Noninterest income ratio189 12
17 691 891 07
.
, .. %�
32 831 80
1 787 605 981 84
, .
, , .. %�
The interest income and noninterest income ratios are not necessarily independent. For example, the bank’s ability to generate loans affects both interest income and, through fees and service charges, noninterest income. High values for these ratios signify the efficient use of bank resources to generate income and are thus generally positive for the bank. But some problematic situations that result in high ratio values could exist; for example, a bank that replaces low-risk, low-return loans with high-risk, high-return loans will experience
18 For example, for Bank of America, the denominator of each of the four ratios ($68,551.40 � $32,831.80 � $101,383.20) less the sum of the numerators of the four ratios ($10,320.62 � $34,707.48 � $41,929.06 � $4,435.34 � $91,392.50) is $9,990.70, which is the net income reported for Bank of America in Table 12–3 .
sau34663_ch12_374-405.indd 397sau34663_ch12_374-405.indd 397 5/27/11 7:16:53 PM5/27/11 7:16:53 PM
First Pages
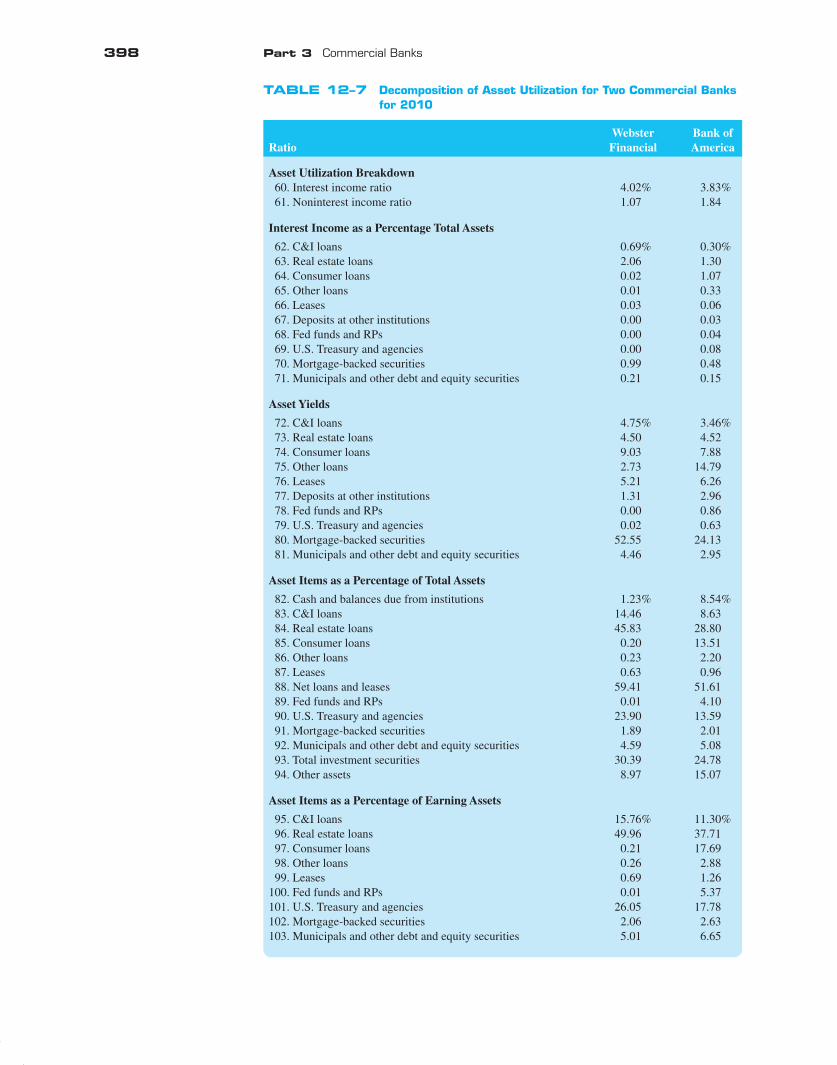
398 Part 3 Commercial Banks
TABLE 12–7 Decomposition of Asset Utilization for Two Commercial Banks for 2010
Webster Bank of Ratio Financial America
Asset Utilization Breakdown 60. Interest income ratio 4.02% 3.83% 61. Noninterest income ratio 1.07 1.84
Interest Income as a Percentage Total Assets
62. C&I loans 0.69% 0.30% 63. Real estate loans 2.06 1.30 64. Consumer loans 0.02 1.07 65. Other loans 0.01 0.33 66. Leases 0.03 0.06 67. Deposits at other institutions 0.00 0.03 68. Fed funds and RPs 0.00 0.04 69. U.S. Treasury and agencies 0.00 0.08 70. Mortgage-backed securities 0.99 0.48 71. Municipals and other debt and equity securities 0.21 0.15
Asset Yields
72. C&I loans 4.75% 3.46% 73. Real estate loans 4.50 4.52 74. Consumer loans 9.03 7.88 75. Other loans 2.73 14.79 76. Leases 5.21 6.26 77. Deposits at other institutions 1.31 2.96 78. Fed funds and RPs 0.00 0.86 79. U.S. Treasury and agencies 0.02 0.63 80. Mortgage-backed securities 52.55 24.13 81. Municipals and other debt and equity securities 4.46 2.95
Asset Items as a Percentage of Total Assets
82. Cash and balances due from institutions 1.23% 8.54% 83. C&I loans 14.46 8.63 84. Real estate loans 45.83 28.80 85. Consumer loans 0.20 13.51 86. Other loans 0.23 2.20 87. Leases 0.63 0.96 88. Net loans and leases 59.41 51.61 89. Fed funds and RPs 0.01 4.10 90. U.S. Treasury and agencies 23.90 13.59 91. Mortgage-backed securities 1.89 2.01 92. Municipals and other debt and equity securities 4.59 5.08 93. Total investment securities 30.39 24.78 94. Other assets 8.97 15.07
Asset Items as a Percentage of Earning Assets
95. C&I loans 15.76% 11.30% 96. Real estate loans 49.96 37.71 97. Consumer loans 0.21 17.69 98. Other loans 0.26 2.88 99. Leases 0.69 1.26 100. Fed funds and RPs 0.01 5.37 101. U.S. Treasury and agencies 26.05 17.78 102. Mortgage-backed securities 2.06 2.63 103. Municipals and other debt and equity securities 5.01 6.65
sau34663_ch12_374-405.indd 398sau34663_ch12_374-405.indd 398 5/27/11 7:16:53 PM5/27/11 7:16:53 PM
First Pages
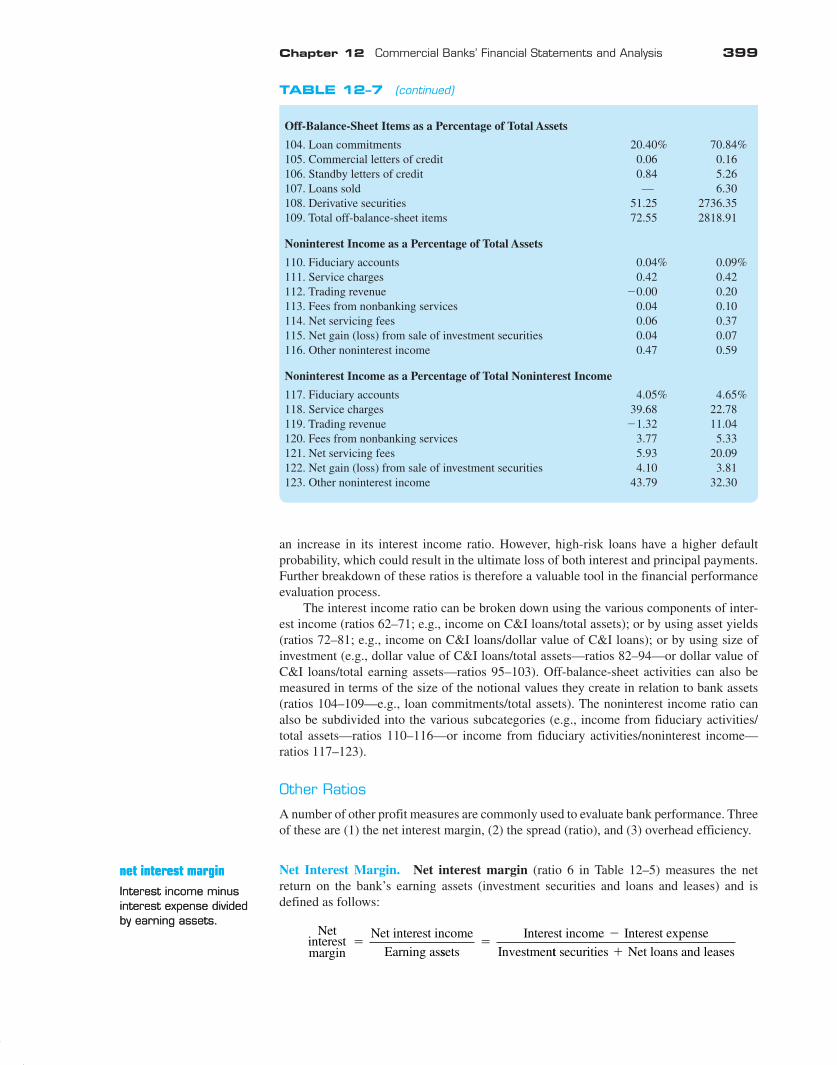
Chapter 12 Commercial Banks’ Financial Statements and Analysis 399
an increase in its interest income ratio. However, high-risk loans have a higher default probability, which could result in the ultimate loss of both interest and principal payments. Further breakdown of these ratios is therefore a valuable tool in the financial performance evaluation process.
The interest income ratio can be broken down using the various components of inter-est income (ratios 62–71; e.g., income on C&I loans/total assets); or by using asset yields (ratios 72–81; e.g., income on C&I loans/dollar value of C&I loans); or by using size of investment (e.g., dollar value of C&I loans/total assets—ratios 82–94—or dollar value of C&I loans/total earning assets—ratios 95–103). Off-balance-sheet activities can also be measured in terms of the size of the notional values they create in relation to bank assets (ratios 104–109—e.g., loan commitments/total assets). The noninterest income ratio can also be subdivided into the various subcategories (e.g., income from fiduciary activities/total assets—ratios 110–116—or income from fiduciary activities/noninterest income—ratios 117–123).
Other Ratios
A number of other profit measures are commonly used to evaluate bank performance. Three of these are (1) the net interest margin, (2) the spread (ratio), and (3) overhead efficiency.
Net Interest Margin. Net interest margin (ratio 6 in Table 12–5 ) measures the net return on the bank’s earning assets (investment securities and loans and leases) and is defined as follows:
Netinterestmargin
Net interest income
Earning as�
ssets
Interest income Interest expense
Investmen�
�
tt securities Net loans and leases�
net interest margin Interest income minus interest expense divided by earning assets.
net interest margin Interest income minus interest expense divided by earning assets.
Off-Balance-Sheet Items as a Percentage of Total Assets
104. Loan commitments 20.40% 70.84% 105. Commercial letters of credit 0.06 0.16 106. Standby letters of credit 0.84 5.26 107. Loans sold — 6.30 108. Derivative securities 51.25 2736.35 109. Total off-balance-sheet items 72.55 2818.91
Noninterest Income as a Percentage of Total Assets
110. Fiduciary accounts 0.04% 0.09% 111. Service charges 0.42 0.42 112. Trading revenue �0.00 0.20 113. Fees from nonbanking services 0.04 0.10 114. Net servicing fees 0.06 0.37 115. Net gain (loss) from sale of investment securities 0.04 0.07 116. Other noninterest income 0.47 0.59
Noninterest Income as a Percentage of Total Noninterest Income
117. Fiduciary accounts 4.05% 4.65% 118. Service charges 39.68 22.78 119. Trading revenue �1.32 11.04 120. Fees from nonbanking services 3.77 5.33 121. Net servicing fees 5.93 20.09 122. Net gain (loss) from sale of investment securities 4.10 3.81 123. Other noninterest income 43.79 32.30
TABLE 12–7 (continued)
sau34663_ch12_374-405.indd 399sau34663_ch12_374-405.indd 399 5/27/11 7:16:53 PM5/27/11 7:16:53 PM
First Pages

400 Part 3 Commercial Banks
Generally, the higher this ratio, the better. Suppose, however, that the preceding scenario (replacement of low-risk, low-return loans with high-risk, high-return loans) is the reason for the increase. This situation can increase risk for the bank. It highlights the fact that looking at returns without looking at risk can be misleading and potentially dangerous in terms of bank solvency and long-run profitability.
The Spread. The spread (ratio 7 in Table 12–5 ) measures the difference between the average yield on earning assets and the average cost of interest-bearing liabilities and is thus another measure of return on the bank’s assets. The spread is defined as:
Spread
Interest income
Earning assets
Intere� �
sst expense
Interest-bearing liabilities The higher the spread, the more profitable the bank, but again, the source of a high spread and the potential risk implications should be considered.
Overhead Efficiency. Overhead efficiency (ratio 8 in Table 12–5 ) mea-sures the bank’s ability to generate noninterest income to cover noninterest expenses. It is represented as:
Overhead efficiency
Noninterest income
Nonin�
tterest expense
In general, the higher this ratio, the better. However, because of the high levels of noninter-est expense relative to noninterest income, overhead efficiency is rarely higher than 1 (or in percentage terms, 100 percent). Further, low operating expenses (and thus low noninterest expenses) can also indicate increased risk if the institution is not investing in the most effi-cient technology or its back office systems are poorly supported. The values of these ratios for the two banks are as follows:
Webster Financial Bank of America
Net interest margin543 64
5 377 62 10 510 463 42
.
, . , .. %
��
58 230 78
442 877 57 922 619 344 26
, .
, . , .. %
��
Spread710 26
15 888 08
166 62
15 151 563 37
.
, .
.
, .. %� �
68 551 40
1 365 496 63
10 320 62
1 414 090 104 2
, .
, , .
, .
, , ..� � 99%
Overhead efficiency189 12
543 3434 81
.
.. %�
32 831 80
41 929 0678 30
, .
, .. %�
Impact of a Bank’s Market Niche
As mentioned earlier, in 2010, Webster Financial was a profitable and efficient bank that invested mainly in real estate loans and low-cost funding methods. Bank of America, on the other hand, operated with a larger and more balanced portfolio of assets and liabilities across both wholesale and retail banking. Keeping the more specialized market niche of Webster Financial in mind, let us make a comparative financial analysis using the ROE framework and the banks’ 2010 financial statements.
ROE and Its Components. As stated, the ROE (ratio 1) of 2.03 percent for Webster Financial Corp. (WBS) was lower than the 4.53 percent ROE reported for Bank of America
spread The difference between lending and borrowing rates.
spread The difference between lending and borrowing rates.
overhead efficiency A bank’s ability to gener-ate noninterest income to cover noninterest expense.
overhead efficiency A bank’s ability to gener-ate noninterest income to cover noninterest expense.
IMPACT OF MARKET NICHE AND BANK SIZE ON FINANCIAL STATEMENT ANALYSISIMPACT OF MARKET NICHE AND BANK SIZE ON FINANCIAL STATEMENT ANALYSIS
DO YOU UNDERSTAND:
9. Two scenarios in which a high value of ROE may signal a risk problem for a bank?
10. What ratios ROA can be broken down into?
11. What the spread measure means?
sau34663_ch12_374-405.indd 400sau34663_ch12_374-405.indd 400 5/27/11 7:16:53 PM5/27/11 7:16:53 PM
First Pages

Chapter 12 Commercial Banks’ Financial Statements and Analysis 401
(BOA). The breakdown of ROE indicates that WBS’s lower profitability was due to its ROA of 0.23 percent compared with that of 0.56 percent for BOA (ratio 2). However, WBS’s equity multiplier or leverage (ratio 3) was higher than that of BOA. WBS’s EM of 8.99X translated to an equity-to-asset ratio (� 1/EM) of 11.13 percent, and BOA’s EM of 8.10X translated to an equity-to-asset ratio of 12.34 percent. Thus, although both banks appeared to be well capitalized, WBS had less equity.
The more focused orientation of WBS relative to BOA can best be seen by looking at the composition of the asset, and particularly the loan, portfolios (ratios 82 through 94 in Table 12–7 ) and the liabilities (ratios 32 through 44 in Table 12–6 ) of the two banks. WBS held 45.83 percent of its total assets in the form of real estate loans. Thus, consistent with its niche, a large majority of WBS’s assets were tied up in real estate–related assets. BOA, on the other hand, had its asset investments more evenly distributed: 8.63 percent in C&I loans, 28.80 percent in real estate loans, 13.51 percent in consumer loans, and 2.20 percent in other loans.
On the liability side of the balance sheet, WBS issued mainly retail-oriented deposits: MMDAs were 28.73 percent of total assets, other savings were 24.33 percent, and retail CDs were 13.62 percent. BOA again used a broader array of deposits: demand deposits were 6.06 percent, MMDAs were 19.83 percent, other savings were 15.26 percent, foreign deposits were 10.15 percent, and retail CDs were 4.61 percent of total assets. Clearly, WBS has specialized its service in the retail area, while BOA offers a broader spectrum of financial services.
Impact of Size on Financial Statement Analysis
Bank size has traditionally affected the financial ratios of commercial banks, resulting in significant differences across size groups. Large banks’ relatively easy access to purchased funds and capital markets compared to small banks’ access is a reason for many of these differences. For example, large banks with easier access to capital markets generally oper-ate with lower amounts of equity capital than do small banks. Also, large banks generally use more purchased funds (such as fed funds and RPs) and fewer core deposits than do small banks. Large banks tend to put more into salaries, premises, and other expenses than small banks, and they tend to diversify their operations and services more than small banks. Large banks also generate more noninterest income (i.e., trading account, deriva-tive security, and foreign trading income) than small banks and when risky loans pay off, they earn more interest income. As a result, although large banks tend to hold less equity than small banks, large banks do not necessarily return more on their assets. A study by the Federal Reserve Bank of St. Louis reported that ROA consistently increased for banks grouped by size up to $15 billion in total assets, but decreased for banks with more than $15 billion.
Examining ratios for the relatively large Bank of America (BOA) compared to the smaller WBS, we see only some of these size-related effects on accounting ratios. Look-ing at ROA (ratio 2 in Table 12–5 ), BOA is the more profitable overall of the two banks.
Notice that BOA is producing the higher income per dollar of total operating income (ratio 4; PM for BOA � 9.85 percent and for WBS � 4.44 percent), and is producing more operating income per dollar of assets (AU for BOA � 5.67 percent and for WBS � 5.08 percent). The generation of total operat-ing income in the form of interest income (ratio 60 in Table 12–7 ) is slightly smaller for BOA (interest income ratio for BOA � 3.83 percent and for WBS � 4.02 percent). We do see that BOA generates much more noninterest income (1.84 percent of total assets) than WBS (1.07 percent of total assets; see ratio 61 in Table 12–7 ). This is likely due to BOA’s relatively large amount of OBS
activities (which is typical of large banks compared with small banks). Indeed, the notional or face value of BOA’s off-balance-sheet activities is 2,818.91 percent of its assets on bal-ance sheet compared to WBS’s 72.55 percent (see ratios 104 through 109 in Table 12–7 ).
DO YOU UNDERSTAND:
12. How a bank’s choice of market niche affects its financial ratios?
13. How a bank’s asset size affects its financial ratios?
sau34663_ch12_374-405.indd 401sau34663_ch12_374-405.indd 401 5/27/11 7:16:53 PM5/27/11 7:16:53 PM
First Pages

ww
w.m
hhe.c
om
/sc5
e402 Part 3 Commercial Banks
Notice, too, that BOA’s other assets (ratio 94 in Table 12–7 ) are 15.07 percent of total assets, compared with 8.97 percent for WBS. BOA also uses more purchased funds to total assets than WBS (27.96 percent versus 17.41 percent, respectively), and fewer core depos-its (57.20 percent versus 70.54 percent, respectively) (see ratios 43 and 38 in Table 12–6 ). Finally and a typically, notice that BOA is financing its assets with more equity than WBS. The equity multiplier (ratio 3 in Table 12–5 ) for BOA, 8.10X, translates to an equity ratio of 12.34 percent, while that for WBS, 8.99X, translates to an equity ratio of 11.13 percent. Characteristically, because of the size-related differences across the two banks, BOA’s ROE (ratio 1 in Table 12–5 ) is greater than that of WBS.
SUMMARY This chapter analyzed the financial statements of commercial banks. The assets, liabili-ties, and equity capital were described as they appear in the balance sheet. The financial statements of other FIs such as savings banks and credit unions take a similar form. The income and expenses were described as they appear in the income statement. From the items on the financial statements, the profitability of the two banks was analyzed using a return on equity (ROE) framework. What might appear as a favorable sign of profit-ability and performance can sometimes, in fact, indicate risk problems that management should address. Many problems and areas of managerial concern can be identified by performing a detailed breakdown of the financial ratios of banks. Thus, both profit-ability and risk management are interlinked and should be of concern to managers. The various risks to which FIs are exposed are examined in more detail in the next several chapters.
QUESTIONS
How does a bank’s report of condition differ from its report of income? ( LG1, LG4 )
Match these three types of cash balances with the functions that they serve: ( LG1 )
Vault cash (1) Used to meet legal reserve requirements Deposits at (2) Used to purchase services the Federal (3) Used to meet customer withdrawals Reserve Deposits at other FIs
Classify the following accounts into one of the following categories: ( LG1, LG3, LG4 )
Assets Liabilities Equity Revenue Expense Off-balance-sheet activities
(1) Service fees charged on deposit accounts (2) Retail CDs (3) Surplus and paid-in capital (4) Loan commitments (5) Consumer loans (6) Federal funds sold (7) Swaps
1.
2.
a.b.
c.
3.
a.b.c.d.e.f.
(8) Interest on municipals (9) Interest on NOW accounts (10) NOW accounts (11) Commercial letters of credit (12) Leases (13) Retained earnings (14) Provision for loan losses (15) Interest on U.S. Treasury securities
If we examine a typical bank’s asset portion of the balance sheet, how are the assets arranged in terms of expected return and liquidity? ( LG1 )
Repurchase agreements are listed as both assets and liabili-ties in Table 12–1 . How can an account be both an asset and a liability? ( LG1, LG2 )
How does a NOW account differ from a demand deposit? ( LG2 )
How does a retail CD differ from a wholesale CD? ( LG2 )
How do core deposits differ from purchased funds? ( LG2 )
What are the major categories of off-balance-sheet activi-ties? ( LG3 )
How does a bank’s annual net income compare with its annual cash flow? ( LG4 )
4.
5.
6.
7.
8.
9.
10.
sau34663_ch12_374-405.indd 402sau34663_ch12_374-405.indd 402 5/27/11 7:16:53 PM5/27/11 7:16:53 PM
First Pages

ww
w.m
hhe.c
om
/sc5
e Chapter 12 Commercial Banks’ Financial Statements and Analysis 403
How might the use of an end-of-the-year balance sheet bias the calculation of certain ratios? ( LG5 )
How does the asset utilization ratio for a bank compare to that of a retail company? How do the equity multipliers compare? ( LG5 )
What is the likely relationship between the interest income ratio and the noninterest income ratio? ( LG 5)
A security analyst calculates the following ratios for two banks. How should the analyst evaluate the financial health of the two banks? ( LG 5)
11.
12.
13.
14.
Bank A Bank B Return on equity 22% 24% Return on assets 2% 1.5% Equity multiplier 11X 16X Profit margin 15% 14% Asset utilization 13% 11% Spread 3% 3% Interest expense ratio 35% 40% Provision for loan loss ratio 1% 4%
What sort of problems or opportunities might ratio analysis fail to identify? ( LG 5)
15.
PROBLEMS A bank is considering two securities: a 30-year Treasury bond yielding 7 percent and a 30-year municipal bond yielding 5 percent. If the bank’s tax rate is 30 percent, which bond offers the higher tax equivalent yield? ( LG4 )
A bank is considering an investment in a municipal secu-rity that offers a yield of 6 percent. What is this security’s tax equivalent yield if the bank’s tax rate is 35 percent? ( LG4 )
The financial statements for First National Bank (FNB) are shown below: ( LG5 )
Balance Sheet First National Bank
Assets Liabilities and Equity Cash $ 450 Demand deposits $ 5,510 Demand deposits Small time from other FIs 1,350 deposits 10,800 Investments 4,050 Jumbo CDs 3,200 Federal funds Federal funds sold 2,025 purchased 2,250 Loans 15,525 Equity 2,200 Reserve for loan losses (1,125) Premises 1,685
Total Total assets $23,960 liabilities/equity $23,960
Income Statement First National Bank Interest income $2,600 Interest expense 1,650 Provision for loan losses 180 Noninterest income 140 Noninterest expense 420 Taxes 90
Calculate the dollar value of FNB’s earning assets. Calculate FNB’s ROA.
1.
2.
3.
a.b.
Calculate FNB’s asset utilization ratio. Calculate FNB’s spread.
The financial statements for BSW National Bank (BSWNB) are shown below: ( LG5 )
Balance Sheet BSW National Bank
Assets Liabilities and Equity Cash and due Demand from banks $ 936 deposits $ 5,040 Small time Investments 3,100 deposits 4,020 Federal funds sold 1,664 Jumbo CDs 4,680 Loans (less Federal funds reserve for purchased 312 loan losses of 2,400) 9,120 Equity 1,548 Premises 780
Total Total assets $15,600 liabilities/equity $15,600
Income Statement BSW National Bank Interest income $1,150 Interest expense 475 Provision for loan losses 150 Noninterest income 260 Noninterest expense 525 Taxes 60
What is the dollar value of earning assets held by BSWNB? What is the dollar value of interest-bearing liabilities held by BSWNB? What is BSWNB’s total operating income? Calculate BSWNB’s asset utilization ratio. Calculate BSWNB’s net interest margin.
c.d.
4.
a.
b.
c.d.e.
sau34663_ch12_374-405.indd 403sau34663_ch12_374-405.indd 403 5/27/11 7:16:54 PM5/27/11 7:16:54 PM
First Pages

ww
w.m
hhe.c
om
/sc5
e404 Part 3 Commercial Banks
The financial statements for MHM Bank (MHM) are shown below: ( LG5 )
Balance Sheet MHM Bank
Assets Liabilities and Equity Cash and due Demand from banks $ 1,920 deposits $10,620 Demand deposits Small time at other FIs 1,100 deposits 10,350 Investments 6,080 Jumbo CDs 7,670 Federal funds Federal funds sold 2,990 purchased 470 Loans (less Other reserve for liabilities 2,000 loan losses of 2,400) 20,040 Equity 3,290 Premises 2,270
Total Total assets $34,400 liabilities/equity $34,400
Income Statement MHM Bank Interest income $4,048 Interest expense 2,024 Provision for loan losses 100 Noninterest income 700 Noninterest expense 975 Taxes 235
Calculate the dollar value of MHM’s earning assets. Calculate the dollar value of MHM’s interest-bearing liabilities. Calculate MHM’s spread. Calculate MHM’s interest expense ratio.
The financial statements for THE Bank are shown below: ( LG5 )
Balance Sheet THE Bank
Assets Liabilities and Equity Cash $ 200 Demand deposits $ 2,450 Demand deposits Small time from other FIs 600 deposits 4,800 Investments 1,800 Jumbo CDs 1,425 Federal funds Federal funds sold 900 purchased 1,000 Loans 6,900 Equity 975 Reserve for loan losses (500) Premises 750
Total Total assets $10,650 liabilities/equity $10,650
Income Statement THE Bank Interest income $2,450 Interest expense 1,630 Provision for loan losses 80 Noninterest income 240 Noninterest expense 410 Taxes 40
Calculate THE Bank’s earning assets. Calculate THE Bank’s ROA.
5.
a.b.
c.d.
6.
a.b.
Calculate THE Bank’s total operating income. Calculate THE Bank’s spread.
Smallville Bank has the following balance sheet, rates earned on its assets, and rates paid on its liabilities.
Balance Sheet (in thousands)
Rate Earned Assets (%) Cash and due from banks $ 6,000 4 Investment securities 22,000 8 Repurchase agreements 12,000 6 Loans less allowance for losses 80,000 10 Fixed assets 10,000 0 Other assets 4,000 9
Total assets $134,000
Rate Liabilities Paid and Equity (%) Demand deposits $ 9,000 0 NOW accounts 69,000 5 Retail CDs 18,000 7 Subordinated debentures 14,000 8
Total liabilities 110,000 Common stock 10,000 Paid-in capital surplus 13,000 Retained earnings 11,000
Total liabilities and equity $134,000
If the bank earns $120,000 in noninterest income, incurs $80,000 in noninterest expenses, and pays $2,500,000 in taxes, what is its net income? ( LG5 )
Megalopolis Bank has the following balance sheet and income statement. ( LG5 )
Balance Sheet (in millions)
Assets Liabilities and Equity Cash and due Demand from banks $ 9,000 deposits $ 19,000 Investment securities 23,000 NOW accounts 89,000 Repurchase agreements 42,000 Retail CDs 28,000 Loans 90,000 Debentures 19,000
Fixed assets 15,000 Total liabilities $155,000 Other assets 4,000 Common stock 12,000
Total assets $183,000 Paid-in capital 4,000 Retained earnings 12,000
Total liabilities and equity $183,000
Income Statement Interest on fees and loans $ 9,000 Interest on investment securities 4,000 Interest on repurchase agreements 6,000 Interest on deposits in banks 1,000
Total interest income $20,000
c.d.
7.
8.
sau34663_ch12_374-405.indd 404sau34663_ch12_374-405.indd 404 5/27/11 7:16:54 PM5/27/11 7:16:54 PM
First Pages

ww
w.m
hhe.c
om
/sc5
e Chapter 12 Commercial Banks’ Financial Statements and Analysis 405
Interest on deposits $ 9,000 Interest on debentures 2,000
Total interest expense $11,000 Net interest income $ 9,000 Provision for loan losses 2,000 Noninterest income 2,000 Noninterest expenses 1,000
Income before taxes $ 8,000 Taxes 3,000
Net income $ 5,000
For Megalopolis, calculate: Return on equity Return on assets Asset utilization Equity multiplier
a.b.c.d.
Profit margin Interest expense ratio Provision for loan loss ratio Noninterest expense ratio Tax ratio
Anytown bank has the following ratios: ( LG 5) Profit margin: 21% Asset utilization: 11% Equity multiplier: 12X
Calculate Anytown’s ROE and ROA.
Everytown bank has the following ratios: ( LG 5) Profit margin: 5% Asset utilization: 20% Equity multiplier: 7.75X
Calculate Everytown’s ROE and ROA.
e.f.g.h.i.
9.a.b.c.
10.a.b.c.
Go to the Bank of America’s Web site at www.bankofamerica.com . Find the most recent Balance Sheet and Income Statement from the Annual Report using the following steps. Click on “About Bank of America.” Under “Shareholders,” click on “Annual Report.” Click on the most recent date for “20XX Annual Report.” This will download the most recent Annual Report to your computer. Go to the pages containing the Consolidated Balance Sheet and Consolidated Income Statement.
Questions 1. What is the most recent value of total assets for Bank of America? How has this changed since
2010 as reported in Table 12–1 ? 2. What is the most recent value of net income for Bank of America? How has this changed since
2010 as reported in Table 12–3 ? 3. From the most recent balance sheet and income statement, calculate the most recent ROA, ROE,
equity multiplier, profit margin, and asset utilization ratios. Which ratio has changed the most since 2010 as reported in Table 12–5 ?
SEARCH THE SITE
sau34663_ch12_374-405.indd 405sau34663_ch12_374-405.indd 405 5/27/11 7:16:54 PM5/27/11 7:16:54 PM
First Pages