3 levels Basic User Tasks Intermediate User Tasks Advanced User Tasks.
SAMPLE ASSESSMENT TASKS
MATHEMATICS ESSENTIAL GENERAL YEAR 12
2015/11172v5
Copyright
© School Curriculum and Standards Authority, 2015
This document – apart from any third party copyright material contained in it – may be freely copied, or communicated on an intranet, for non-commercial purposes in educational institutions, provided that the School Curriculum and Standards Authority is acknowledged as the copyright owner, and that the Authority’s moral rights are not infringed.
Copying or communication for any other purpose can be done only within the terms of the Copyright Act 1968 or with prior written permission of the School Curriculum and Standards Authority. Copying or communication of any third party copyright material can be done only within the terms of the Copyright Act 1968 or with permission of the copyright owners.
Any content in this document that has been derived from the Australian Curriculum may be used under the terms of the Creative Commons Attribution-NonCommercial 3.0 Australia licence
Disclaimer
Any resources such as texts, websites and so on that may be referred to in this document are provided as examples of resources that teachers can use to support their learning programs. Their inclusion does not imply that they are mandatory or that they are the only resources relevant to the course.
1
Sample assessment tasks | Mathematics Essential | General Year 12
Sample assessment task
Mathematics Essential – General Year 12
Task 8 – Unit 4
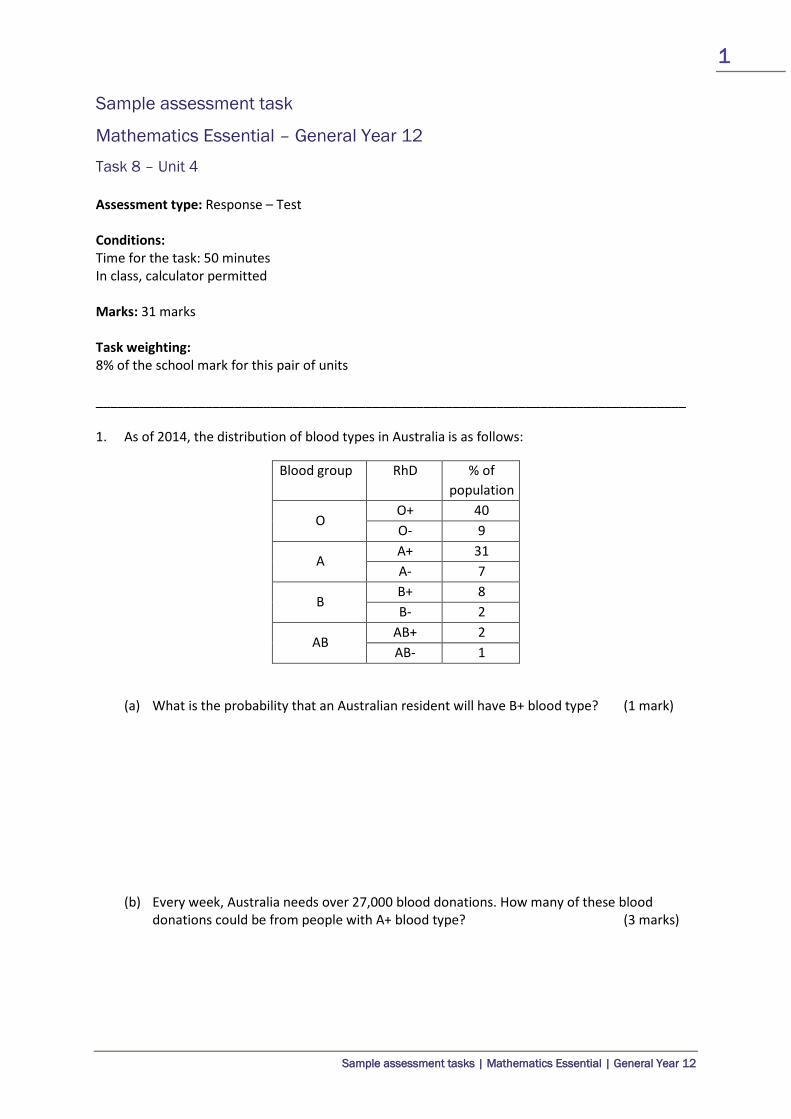
Assessment type: Response – Test Conditions: Time for the task: 50 minutes In class, calculator permitted Marks: 31 marks Task weighting: 8% of the school mark for this pair of units _________________________________________________________________________________ 1. As of 2014, the distribution of blood types in Australia is as follows:
Blood group RhD % of population
O O+ 40 O- 9
A A+ 31 A- 7
B B+ 8 B- 2
AB AB+ 2 AB- 1
(a) What is the probability that an Australian resident will have B+ blood type? (1 mark) (b) Every week, Australia needs over 27,000 blood donations. How many of these blood
donations could be from people with A+ blood type? (3 marks)

2
Sample assessment tasks | Mathematics Essential | General Year 12
2. The following tree diagram represents the possible outcomes of a family which has two children.
(a) Label the diagram to show the possibilities of boy and girl. (2 marks)
(b) What is the chance the family would have two girls? (2 marks)
(c) If the family had a third child, what is the chance there would be two girls and a boy? (4 marks)
3
Sample assessment tasks | Mathematics Essential | General Year 12
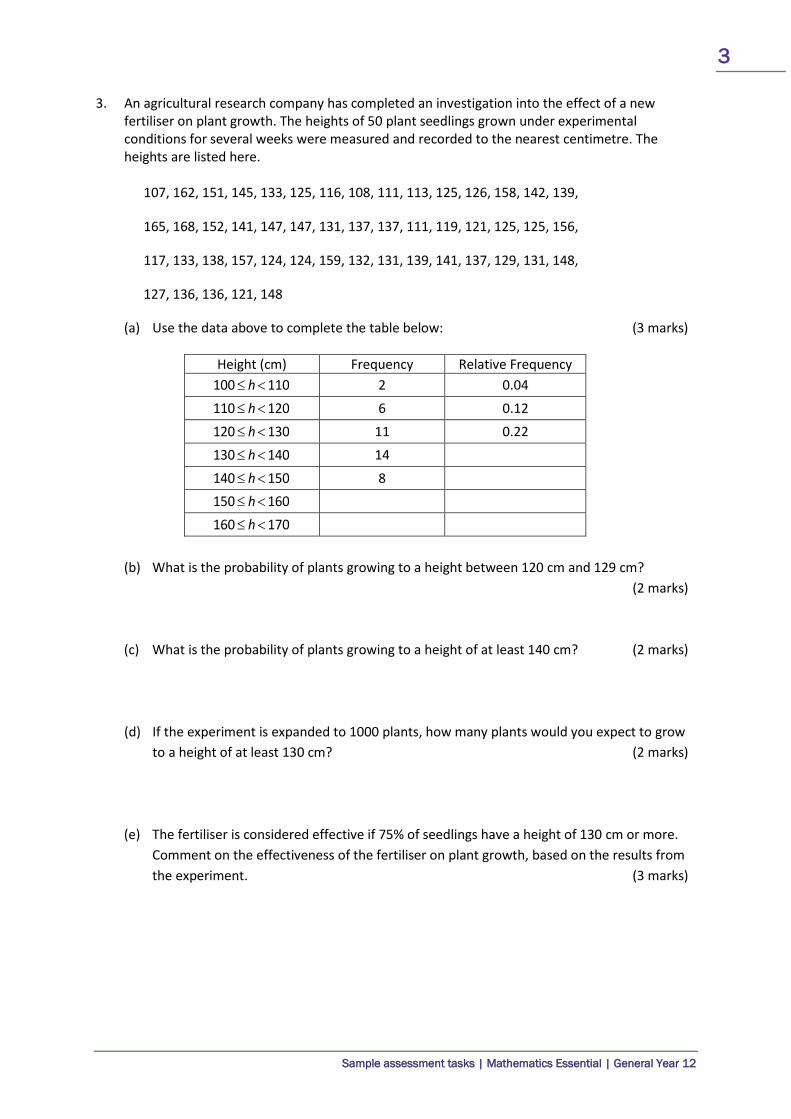
3. An agricultural research company has completed an investigation into the effect of a new fertiliser on plant growth. The heights of 50 plant seedlings grown under experimental conditions for several weeks were measured and recorded to the nearest centimetre. The heights are listed here.
107, 162, 151, 145, 133, 125, 116, 108, 111, 113, 125, 126, 158, 142, 139,
165, 168, 152, 141, 147, 147, 131, 137, 137, 111, 119, 121, 125, 125, 156,
117, 133, 138, 157, 124, 124, 159, 132, 131, 139, 141, 137, 129, 131, 148,
127, 136, 136, 121, 148
(a) Use the data above to complete the table below: (3 marks)
Height (cm) Frequency Relative Frequency ≤ <100 110h 2 0.04
≤ <110 120h 6 0.12
≤ <120 130h 11 0.22
≤ <130 140h 14
≤ <140 150h 8
≤ <150 160h
≤ <160 170h
(b) What is the probability of plants growing to a height between 120 cm and 129 cm? (2 marks)
(c) What is the probability of plants growing to a height of at least 140 cm? (2 marks)
(d) If the experiment is expanded to 1000 plants, how many plants would you expect to grow to a height of at least 130 cm? (2 marks)
(e) The fertiliser is considered effective if 75% of seedlings have a height of 130 cm or more. Comment on the effectiveness of the fertiliser on plant growth, based on the results from the experiment. (3 marks)
4
Sample assessment tasks | Mathematics Essential | General Year 12
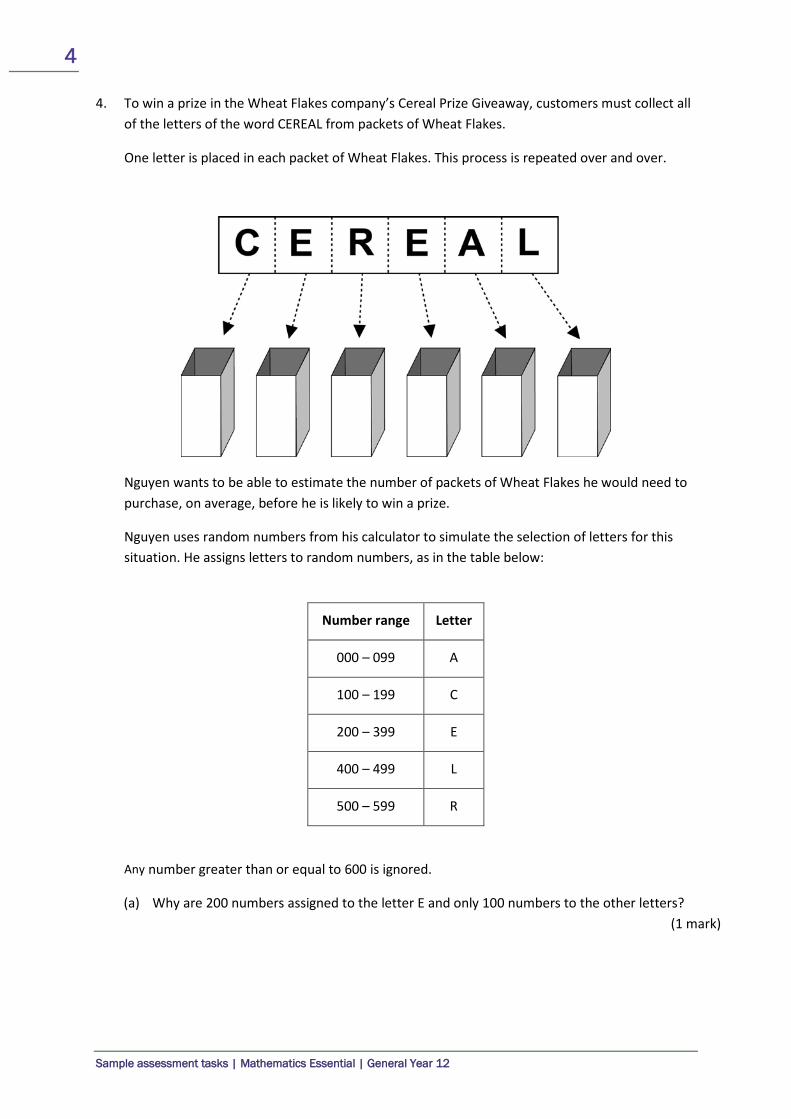
4. To win a prize in the Wheat Flakes company’s Cereal Prize Giveaway, customers must collect all of the letters of the word CEREAL from packets of Wheat Flakes.
One letter is placed in each packet of Wheat Flakes. This process is repeated over and over.
Nguyen wants to be able to estimate the number of packets of Wheat Flakes he would need to purchase, on average, before he is likely to win a prize.
Nguyen uses random numbers from his calculator to simulate the selection of letters for this situation. He assigns letters to random numbers, as in the table below:
Number range Letter
000 – 099 A
100 – 199 C
200 – 399 E
400 – 499 L
500 – 599 R
Any number greater than or equal to 600 is ignored.
(a) Why are 200 numbers assigned to the letter E and only 100 numbers to the other letters? (1 mark)
5
Sample assessment tasks | Mathematics Essential | General Year 12
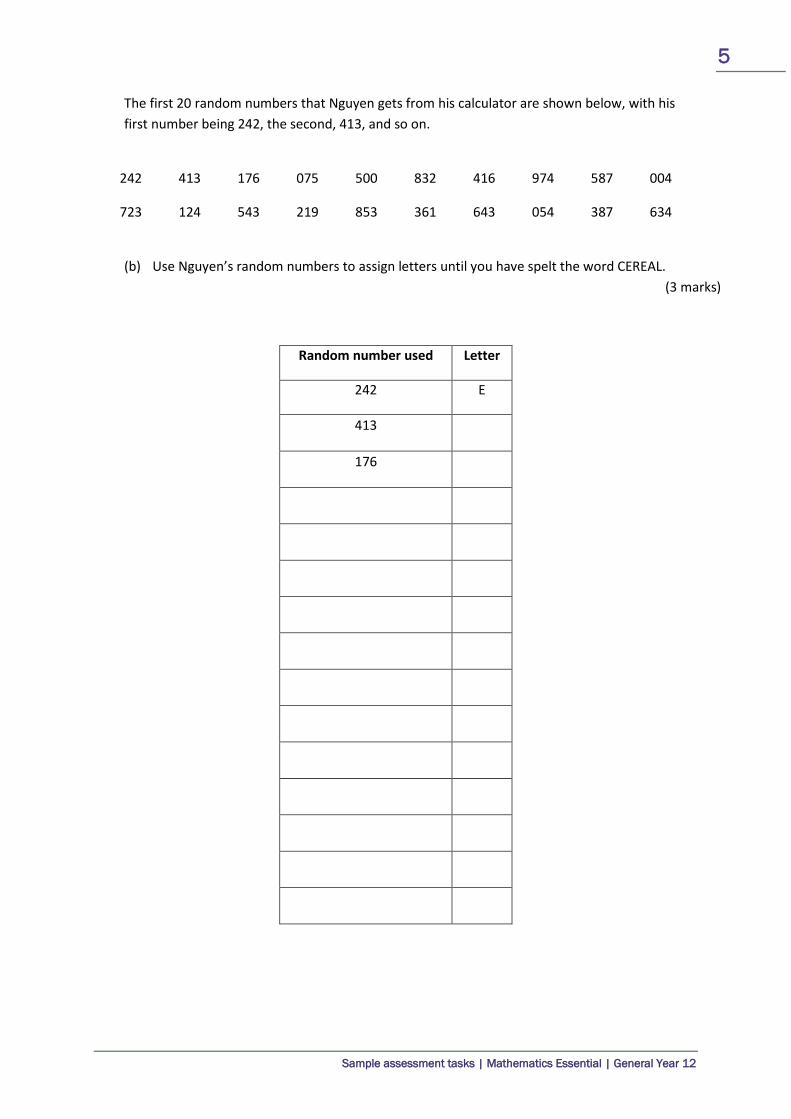
The first 20 random numbers that Nguyen gets from his calculator are shown below, with his first number being 242, the second, 413, and so on.
242 413 176 075 500 832 416 974 587 004
723 124 543 219 853 361 643 054 387 634
(b) Use Nguyen’s random numbers to assign letters until you have spelt the word CEREAL. (3 marks)
Random number used Letter
242 E
413
176

6
Sample assessment tasks | Mathematics Essential | General Year 12
(c) How many packets of Wheat Flakes would Nguyen need to buy to win a prize in this competition, on the basis of the results in part (b)? (1 mark)
(d) If you ran this simulation with your calculator, what would be the minimum number of times you would need to generate a random number to spell CEREAL? (1 mark)
(e) Nguyen’s friend Georgina buys 30 packets of Wheat Flakes. Will she definitely win a prize? Explain. (1 mark)

7
Sample assessment tasks | Mathematics Essential | General Year 12
Marking key for sample assessment Task 8 – Unit 4
1. (a) What is the probability that an Australian resident will have B+ blood type?
Solution
8% of the Australian population have B+ blood type, so the probability is 8% or 0.08
Specific behaviours Marks Rating Identifies the correct proportion from the table 1 simple
Total /1
(b) Every week, Australia needs over 27,000 blood donations. How many of these blood donations could be from people with A+ blood type?
Solution
31% of the population is A+ blood type
31% x 27 000 = 8370
It is possible approximately 8000 donors could be A+
Specific behaviours Marks Rating Identifies the percentage 1 simple Determines the proportion with A+ blood type 1 simple Gives an appropriate approximation 1 complex
Total /3
2. (a) Label the diagram to show the possibilities of boy and girl.
Solution
first child second child
Specific behaviours Marks Rating Correctly labels diagram for first child 1 simple Correctly labels diagram for second child 1 simple
Total /2

8
Sample assessment tasks | Mathematics Essential | General Year 12
(b) What is the chance the family would have two girls?
Solution
first child second child
The probability of having two girls is .14
Specific behaviours Marks Rating Recognises there are four possible outcomes 1 simple Determines the probability of two girls 1 simple
Total /2
(c) If the family had a third child, what is the chance there would be two girls and a boy?
Solution
There are eight possible outcomes with three of these outcomes having two girls and a boy.
The probability would be 38
or 0.375.
Specific behaviours Marks Rating Extends sample space 1 simple Recognises there are eight possible outcomes for three children 1 simple Identifies three outcomes with two girls and a boy 1 complex Determines the probability 1 simple
Total /4
9
Sample assessment tasks | Mathematics Essential | General Year 12
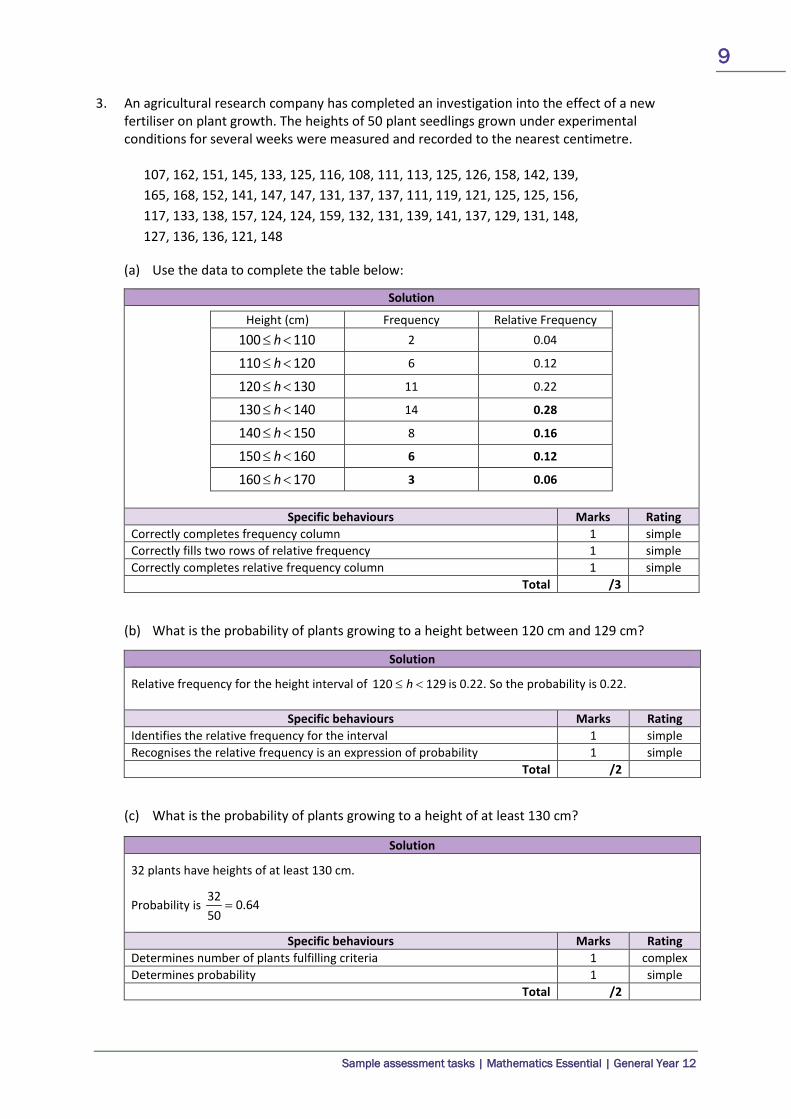
3. An agricultural research company has completed an investigation into the effect of a new fertiliser on plant growth. The heights of 50 plant seedlings grown under experimental conditions for several weeks were measured and recorded to the nearest centimetre.
107, 162, 151, 145, 133, 125, 116, 108, 111, 113, 125, 126, 158, 142, 139, 165, 168, 152, 141, 147, 147, 131, 137, 137, 111, 119, 121, 125, 125, 156, 117, 133, 138, 157, 124, 124, 159, 132, 131, 139, 141, 137, 129, 131, 148, 127, 136, 136, 121, 148
(a) Use the data to complete the table below:
Solution
Height (cm) Frequency Relative Frequency ≤ <100 110h 2 0.04
≤ <110 120h 6 0.12
≤ <120 130h 11 0.22
≤ <130 140h 14 0.28
≤ <140 150h 8 0.16
≤ <150 160h 6 0.12
≤ <160 170h 3 0.06
Specific behaviours Marks Rating Correctly completes frequency column 1 simple Correctly fills two rows of relative frequency 1 simple Correctly completes relative frequency column 1 simple
Total /3
(b) What is the probability of plants growing to a height between 120 cm and 129 cm?
Solution
Relative frequency for the height interval of 120 129≤ <h is 0.22. So the probability is 0.22.
Specific behaviours Marks Rating Identifies the relative frequency for the interval 1 simple Recognises the relative frequency is an expression of probability 1 simple
Total /2
(c) What is the probability of plants growing to a height of at least 130 cm?
Solution
32 plants have heights of at least 130 cm.
Probability is .320 64
50=
Specific behaviours Marks Rating Determines number of plants fulfilling criteria 1 complex Determines probability 1 simple
Total /2

10
Sample assessment tasks | Mathematics Essential | General Year 12
(d) If the experiment is expanded to 1000 plants, how many plants would you expect to grow to a height of at least 130 cm?
Solution
.0 64 1000 640× =
Would expect 640 plants to grow to a height of at least 130 cm.
Specific behaviours Marks Rating Applies relative frequency to calculation 1 simple Determines the number of plants expected to meet criteria 1 simple
Total /2
(e) The fertiliser is considered effective if 75% of seedlings have a height of 130 cm or more. Comment on the effectiveness of the fertiliser on plant growth based on the results from the experiment.
Solution
Relative frequency of 0.64 is the same as 64%
Of the 50 seedlings, only 64% reached a height of at least 130 cm , which suggests the fertiliser may not be effective.
Specific behaviours Marks Rating Refers to relative frequency 1 complex Connects relative frequency to percentage 1 complex Draws a conclusion based on results 1 complex
Total /3
4. (a) Why are 200 numbers assigned to the letter E and only 100 numbers to the other letters?
Solution
There are twice as many E’s as any other letter in the word CEREAL
Specific behaviours Marks Rating States the relationship of the number of E’s to the number of other letters 1 simple
Total /1 The first 20 random numbers that Nguyen gets from his calculator are shown below, with his
first number being 242, the second, 413, and so on.
242 413 176 075 500 832 416 974 587 004 723 124 543 219 853 361 643 054 387 634
11
Sample assessment tasks | Mathematics Essential | General Year 12
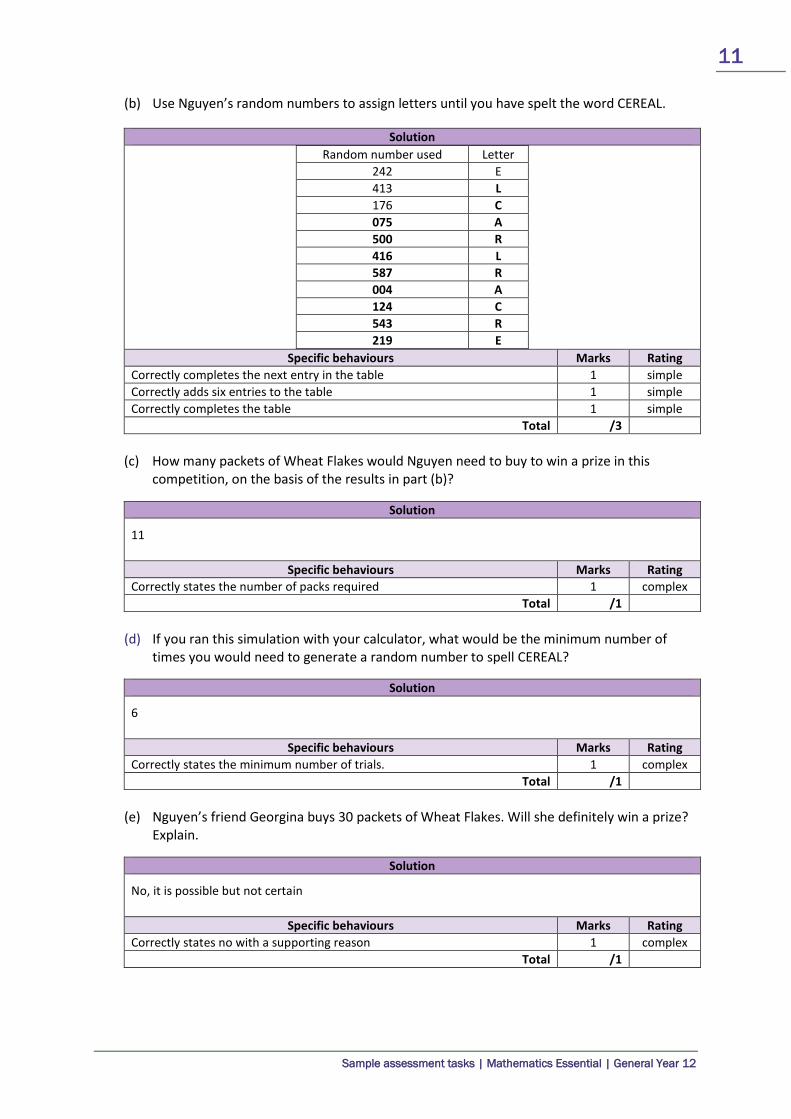
(b) Use Nguyen’s random numbers to assign letters until you have spelt the word CEREAL.
Solution Random number used Letter
242 E 413 L 176 C 075 A 500 R 416 L 587 R 004 A 124 C 543 R 219 E
Specific behaviours Marks Rating Correctly completes the next entry in the table 1 simple Correctly adds six entries to the table 1 simple Correctly completes the table 1 simple
Total /3
(c) How many packets of Wheat Flakes would Nguyen need to buy to win a prize in this competition, on the basis of the results in part (b)?
Solution
11
Specific behaviours Marks Rating Correctly states the number of packs required 1 complex
Total /1
(d) If you ran this simulation with your calculator, what would be the minimum number of times you would need to generate a random number to spell CEREAL?
Solution
6
Specific behaviours Marks Rating Correctly states the minimum number of trials. 1 complex
Total /1
(e) Nguyen’s friend Georgina buys 30 packets of Wheat Flakes. Will she definitely win a prize? Explain.
Solution
No, it is possible but not certain
Specific behaviours Marks Rating Correctly states no with a supporting reason 1 complex
Total /1
12
Sample assessment tasks | Mathematics Essential | General Year 12
Sample assessment task
Mathematics Essential – General Year 12
Task 3 – Unit 3
Assessment type: Practical application Conditions: Time for the task: 50 minutes In class under test conditions, calculator permitted Marks: 16 marks Task weighting: 7% of the school mark for this pair of units _________________________________________________________________________________
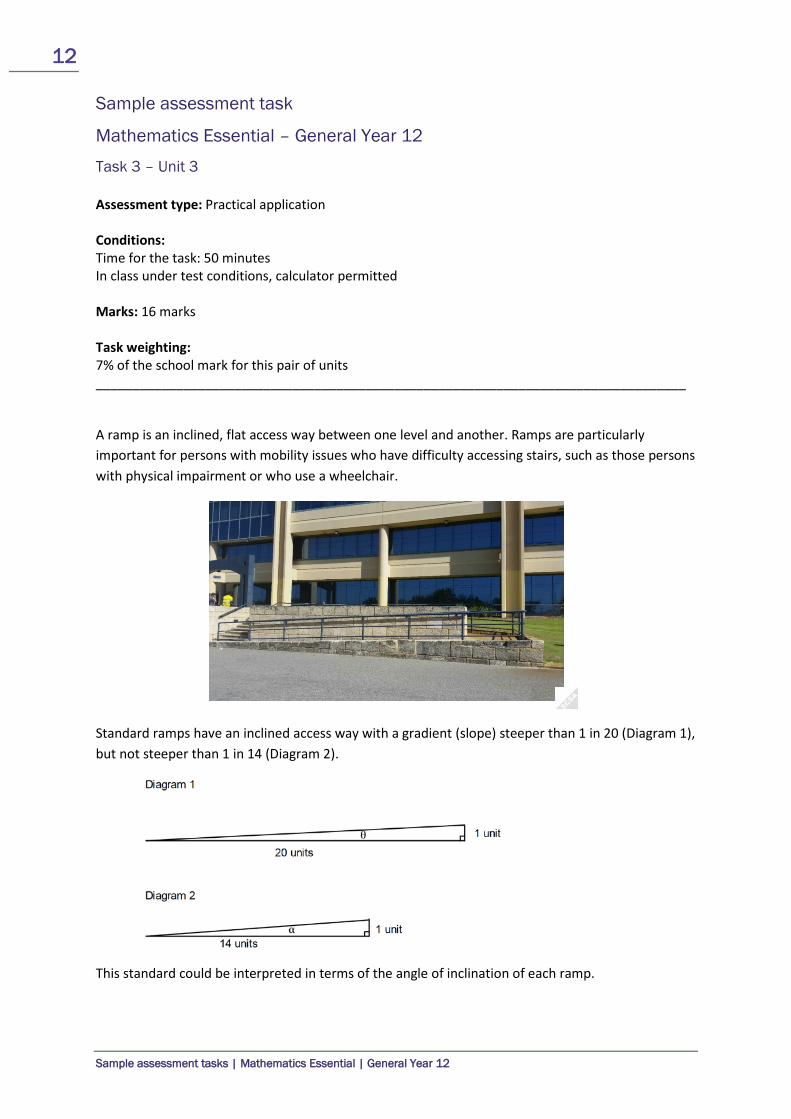
A ramp is an inclined, flat access way between one level and another. Ramps are particularly important for persons with mobility issues who have difficulty accessing stairs, such as those persons with physical impairment or who use a wheelchair.
Standard ramps have an inclined access way with a gradient (slope) steeper than 1 in 20 (Diagram 1), but not steeper than 1 in 14 (Diagram 2).
This standard could be interpreted in terms of the angle of inclination of each ramp.
13
Sample assessment tasks | Mathematics Essential | General Year 12
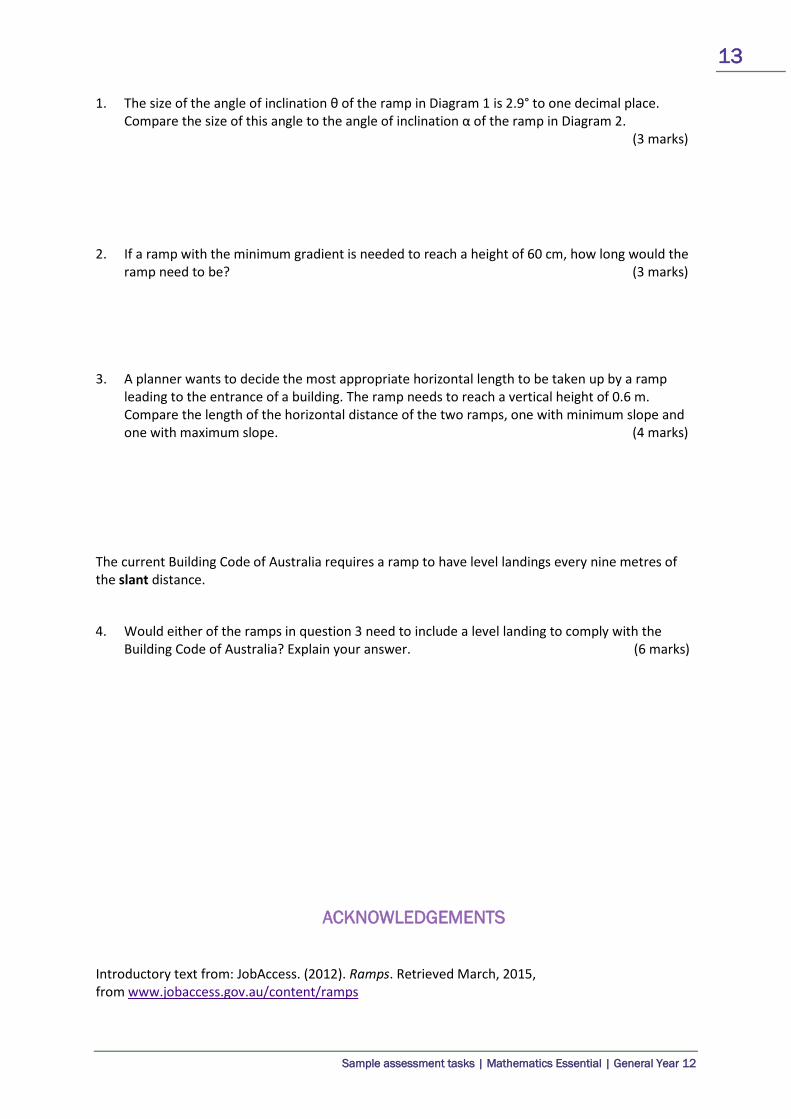
1. The size of the angle of inclination θ of the ramp in Diagram 1 is 2.9° to one decimal place. Compare the size of this angle to the angle of inclination α of the ramp in Diagram 2. (3 marks)
2. If a ramp with the minimum gradient is needed to reach a height of 60 cm, how long would the ramp need to be? (3 marks)
3. A planner wants to decide the most appropriate horizontal length to be taken up by a ramp leading to the entrance of a building. The ramp needs to reach a vertical height of 0.6 m. Compare the length of the horizontal distance of the two ramps, one with minimum slope and one with maximum slope. (4 marks)
The current Building Code of Australia requires a ramp to have level landings every nine metres of the slant distance.
4. Would either of the ramps in question 3 need to include a level landing to comply with the Building Code of Australia? Explain your answer. (6 marks)
ACKNOWLEDGEMENTS Introductory text from: JobAccess. (2012). Ramps. Retrieved March, 2015, from www.jobaccess.gov.au/content/ramps
14
Sample assessment tasks | Mathematics Essential | General Year 12
Marking key for sample assessment Task 3 – Unit 3
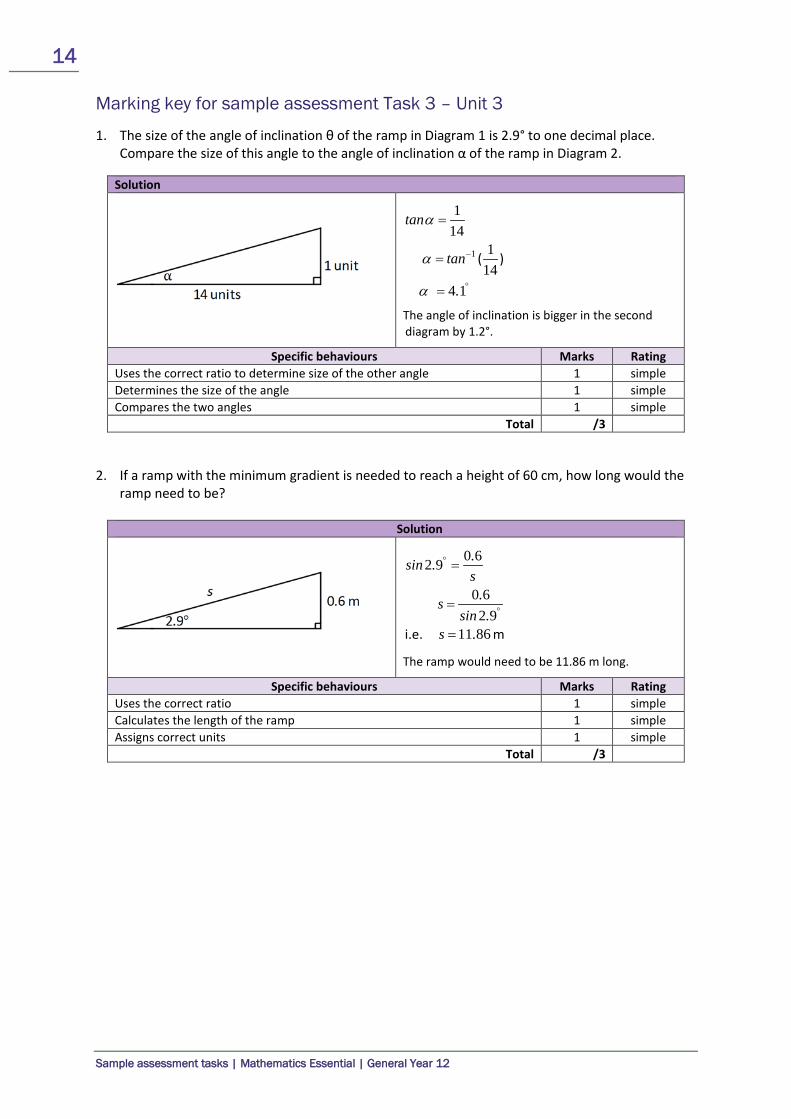
1. The size of the angle of inclination θ of the ramp in Diagram 1 is 2.9° to one decimal place. Compare the size of this angle to the angle of inclination α of the ramp in Diagram 2.
2. If a ramp with the minimum gradient is needed to reach a height of 60 cm, how long would the ramp need to be?
Solution
0 62 9
0 62 9
11 86
i.e. m
.sin .s
.ssin .
s .
°
°
=
=
=
The ramp would need to be 11.86 m long.
Specific behaviours Marks Rating Uses the correct ratio 1 simple Calculates the length of the ramp 1 simple Assigns correct units 1 simple
Total /3
Solution
1
114
114
4 1
( )
tan
tan
.
a
a
a
−
°
=
=
=
The angle of inclination is bigger in the second diagram by 1.2°.
Specific behaviours Marks Rating Uses the correct ratio to determine size of the other angle 1 simple Determines the size of the angle 1 simple Compares the two angles 1 simple
Total /3
15
Sample assessment tasks | Mathematics Essential | General Year 12
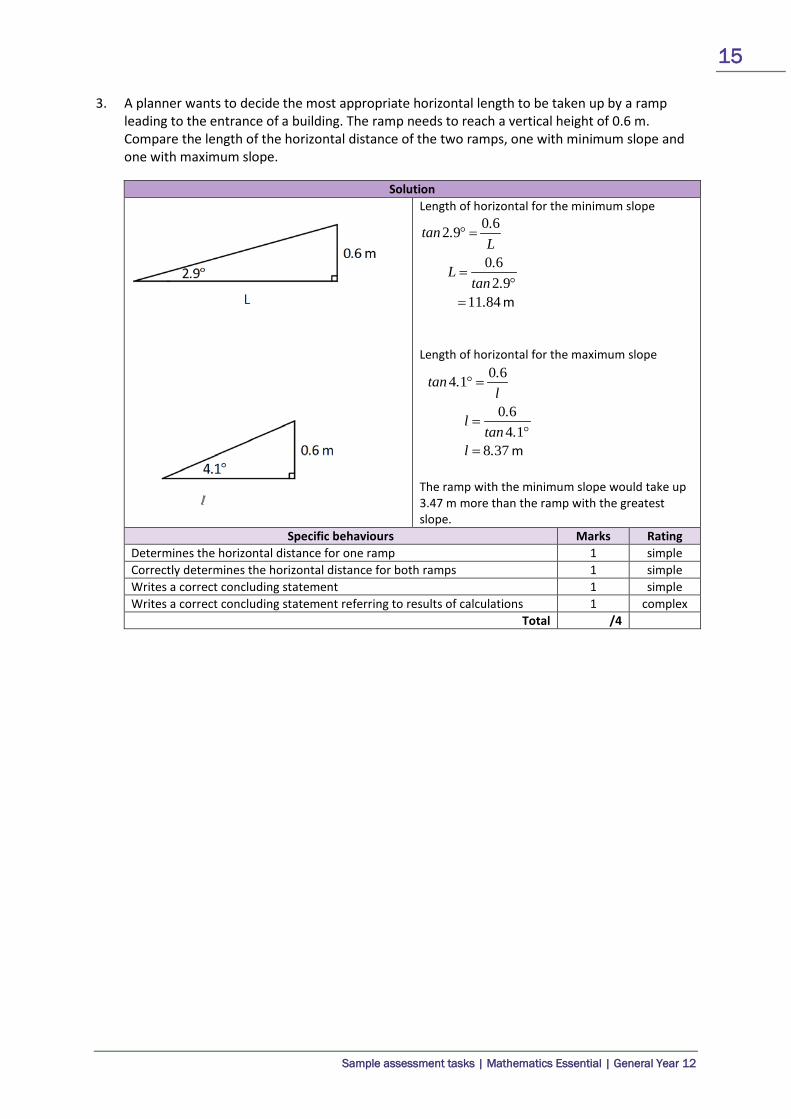
3. A planner wants to decide the most appropriate horizontal length to be taken up by a ramp leading to the entrance of a building. The ramp needs to reach a vertical height of 0.6 m. Compare the length of the horizontal distance of the two ramps, one with minimum slope and one with maximum slope.
Solution
Length of horizontal for the minimum slope 0 62 9
0 62 9
11 84
m
.tan .L.L
tan ..
° =
=°
=
Length of horizontal for the maximum slope 0 64 1
0 64 1
8 37
m
.tan .l
.ltan .
l .
° =
=°
=
The ramp with the minimum slope would take up 3.47 m more than the ramp with the greatest slope.
Specific behaviours Marks Rating Determines the horizontal distance for one ramp 1 simple Correctly determines the horizontal distance for both ramps 1 simple Writes a correct concluding statement 1 simple Writes a correct concluding statement referring to results of calculations 1 complex
Total /4
16
Sample assessment tasks | Mathematics Essential | General Year 12
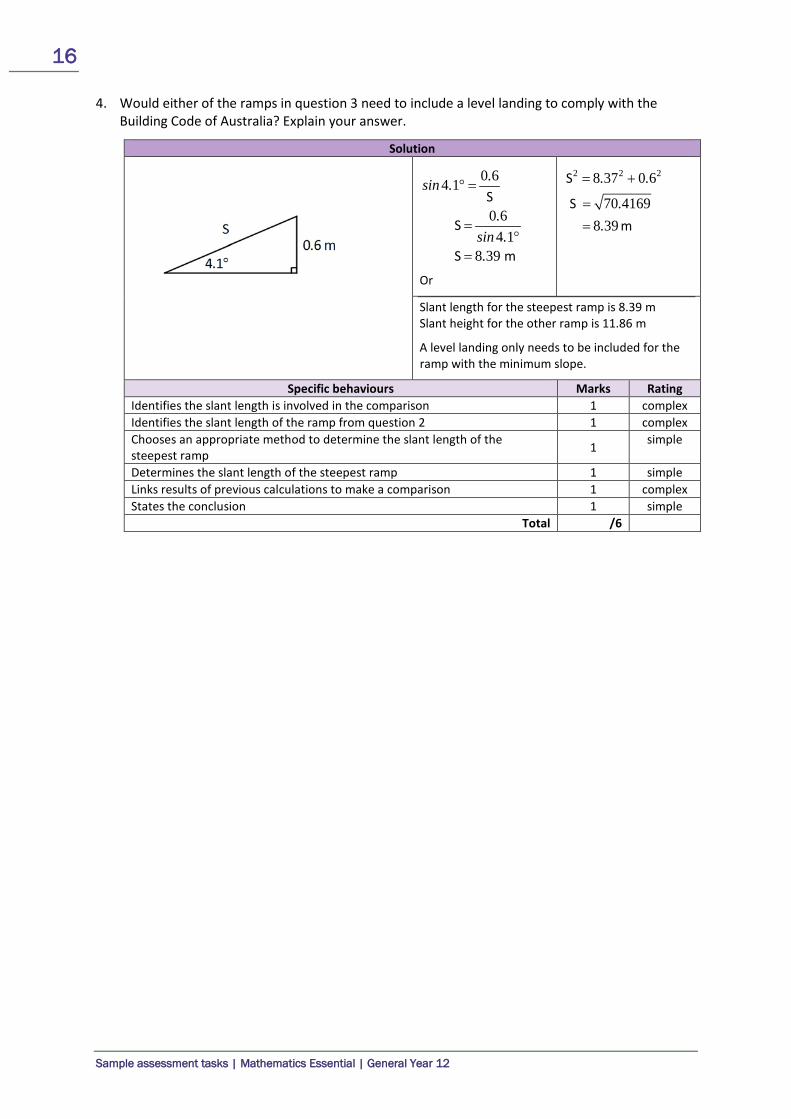
4. Would either of the ramps in question 3 need to include a level landing to comply with the Building Code of Australia? Explain your answer.
Solution
0 64 1
0 64 1
8 39
S
S
S m
.sin .
.sin ..
° =
=°
=
Or
2 2 28 37 0 6
70 41698 39
S
S m
. .
..
= +
==
Slant length for the steepest ramp is 8.39 m Slant height for the other ramp is 11.86 m
A level landing only needs to be included for the ramp with the minimum slope.
Specific behaviours Marks Rating Identifies the slant length is involved in the comparison 1 complex Identifies the slant length of the ramp from question 2 1 complex Chooses an appropriate method to determine the slant length of the steepest ramp 1 simple
Determines the slant length of the steepest ramp 1 simple Links results of previous calculations to make a comparison 1 complex States the conclusion 1 simple
Total /6
17
Sample assessment tasks | Mathematics Essential | General Year 12
Sample assessment task
Mathematics Essential – General Year 12
Task 5 – Unit 3
Assessment type: Statistical investigation process
This statistical investigation is in two parts:
Part A is done as class work and leads the student through the collection and analysis of a random sample of students’ data from the CensusAtSchool website.
Part B is an extension of the statistical investigation in Part A. Students will need to have access to technology with a spreadsheet function.
Feedback for Part A is not intended to be used to award marks for assessment. It is recommended to have class discussion and a review of Part A before administering Part B. Conditions: Period allowed for completion of the task: Part A: one week in class Part B: 50 minutes in class under test conditions, technology and/or calculator permitted Maximum number of marks: 26 marks Part A: 3 marks
Part B: 23 marks Task weighting: 7% of the school mark for this pair of units _________________________________________________________________________________
Can arm span be used as a predictor for height?
Archaeologists and forensic experts often unearth skeletons which are not complete. The proposition is that there is a strong enough association between the height and arm span of a person and therefore you can predict the height of a skeleton using the arm span.
Part A: Data collection
CensusAtSchool was a nationwide project that collected real data from students by way of an online questionnaire. It provided a snapshot of the characteristics, attitudes and opinions of those students who completed questionnaires from 2006 to 2014. It can be located online: http://www.abs.gov.au/websitedbs/CaSHome.nsf/Home/Home.
While the data base is very large, you can sample the results of the survey to allow you to answer statistical questions such as ‘Can arm span be used as a predictor for height?’

18
Sample assessment tasks | Mathematics Essential | General Year 12
Task 1
1. Go to CensusAtSchool using the link above.
2. Choose Random Sampler from the Explore Data & Stats menu and click on Accept for the conditions of use.
3. Follow the instructions to create and generate a random data sample: a) Reference year: Select 2014 b) Questions to display: Select data by question: Choose Question 9 and 11 c) Sample Size: 30 d) Sample characteristics: Select by state/territory: All states/territories Select year levels: All year levels Select sex: All e) Click on Get Data Sample
4. Download and save the data xls sample file. 5. Some data may be significantly different from the rest. These are outliers and are probably due
to an error in measurement or recording. Remove any pairs of measurements you consider are outliers.
6. Draw a scatterplot for the remaining data with height as the horizontal axis and arm span as the vertical axis.
7. Describe the association between the two variables i.e. Height and Arm Span. 8. Print the scatterplot and draw a trend line by eye. 9. Show how the trend line can be used to predict the height of a student who has an arm span of
150cm.
Task 2
1. Repeat the above process with a different random sample. 2. Were the predictions the same for each sample? Comment on why/why not the predictions
were the same.
19
Sample assessment tasks | Mathematics Essential | General Year 12
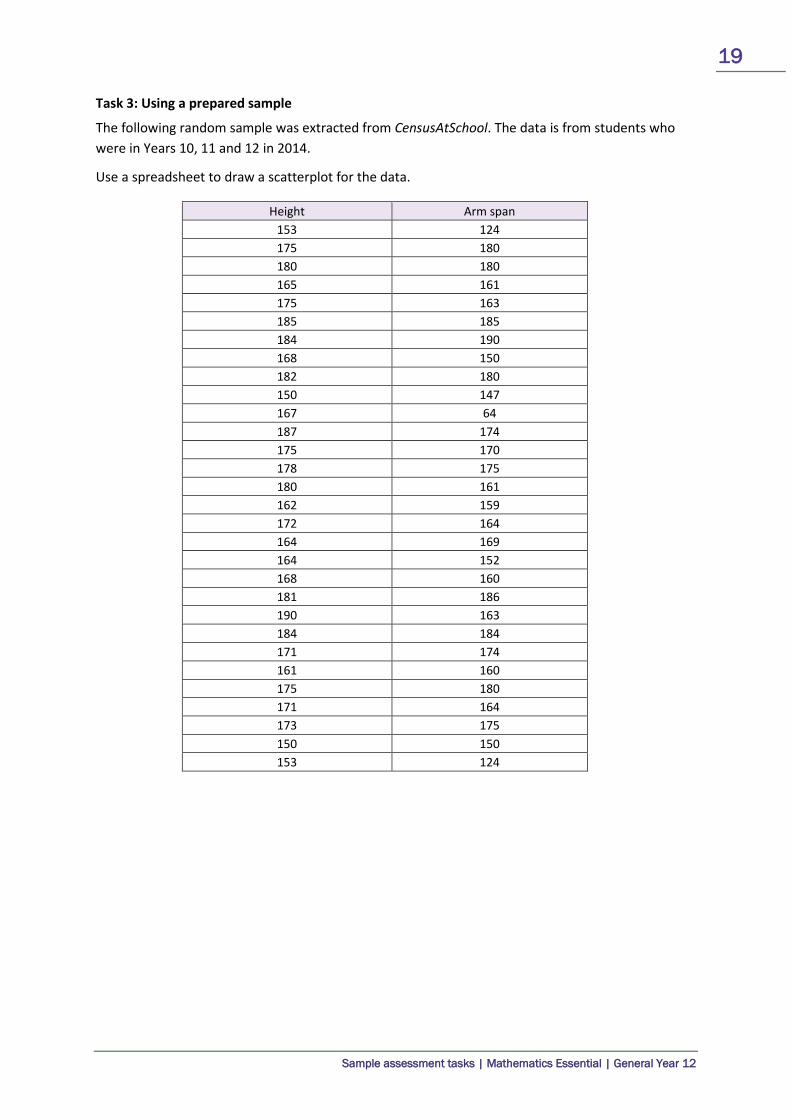
Task 3: Using a prepared sample
The following random sample was extracted from CensusAtSchool. The data is from students who were in Years 10, 11 and 12 in 2014.
Use a spreadsheet to draw a scatterplot for the data.
Height Arm span 153 124 175 180 180 180 165 161 175 163 185 185 184 190 168 150 182 180 150 147 167 64 187 174 175 170 178 175 180 161 162 159 172 164 164 169 164 152 168 160 181 186 190 163 184 184 171 174 161 160 175 180 171 164 173 175 150 150 153 124

20
Sample assessment tasks | Mathematics Essential | General Year 12
Feedback on Part A
Task 1
1–5. Sample of data generated from CensusAtSchool, with four outliers removed.
Height Arm span Height Arm span Height Arm span
156 155 159 57 127 129
168 63 169 160 161 167
150 23 183 80 160 150
135 134 171 171 153 149
171 175 167 159 178 20
158 163 162 151 144 140
155 155 160 165 166 166
145 149 140 123 178 180
161 156 169 168 158 169
157 150 143 140 165 134
6–8. Scatterplot with trendline by eye.
There is a strong, positive, linear association between height and arm span.
21
Sample assessment tasks | Mathematics Essential | General Year 12
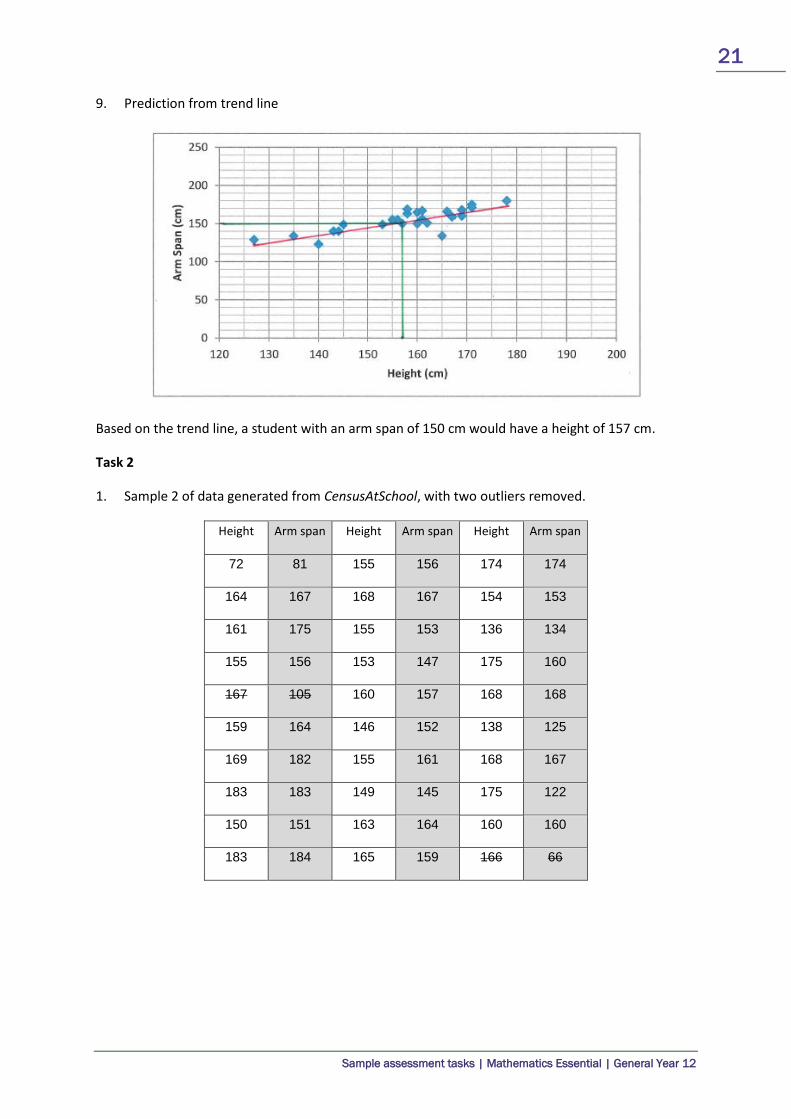
9. Prediction from trend line
Based on the trend line, a student with an arm span of 150 cm would have a height of 157 cm.
Task 2
1. Sample 2 of data generated from CensusAtSchool, with two outliers removed.
Height Arm span Height Arm span Height Arm span
72 81 155 156 174 174
164 167 168 167 154 153
161 175 155 153 136 134
155 156 153 147 175 160
167 105 160 157 168 168
159 164 146 152 138 125
169 182 155 161 168 167
183 183 149 145 175 122
150 151 163 164 160 160
183 184 165 159 166 66
22
Sample assessment tasks | Mathematics Essential | General Year 12
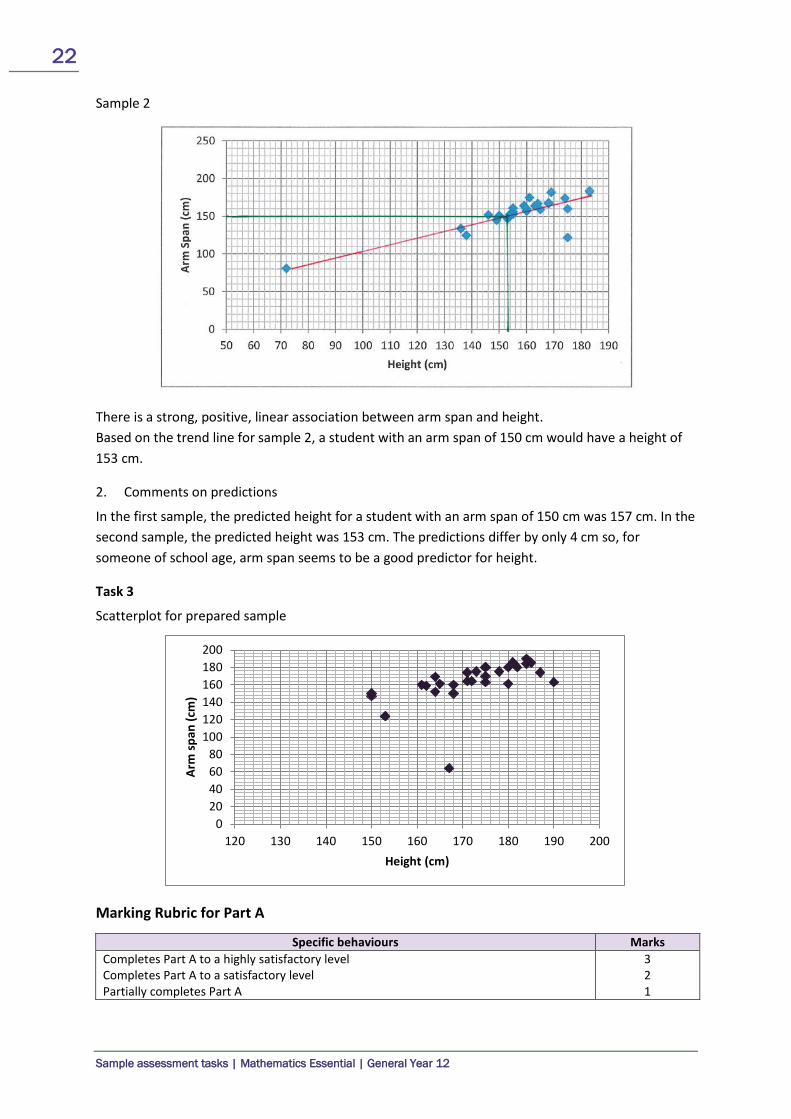
Sample 2
There is a strong, positive, linear association between arm span and height. Based on the trend line for sample 2, a student with an arm span of 150 cm would have a height of 153 cm.
2. Comments on predictions
In the first sample, the predicted height for a student with an arm span of 150 cm was 157 cm. In the second sample, the predicted height was 153 cm. The predictions differ by only 4 cm so, for someone of school age, arm span seems to be a good predictor for height.
Task 3
Scatterplot for prepared sample
Marking Rubric for Part A
Specific behaviours Marks Completes Part A to a highly satisfactory level Completes Part A to a satisfactory level Partially completes Part A
3 2 1
020406080
100120140160180200
120 130 140 150 160 170 180 190 200
Arm
span
(cm
)
Height (cm)
23
Sample assessment tasks | Mathematics Essential | General Year 12
Part B: Which, if any, is the better predictor for height – arm span or the length of a person’s right foot?
A completed statistical investigation should include: • an introduction that outlines the question to be answered and any further questions that could
be explored • selection and application of suitable mathematical and graphical techniques you have studied
to analyse the provided data • interpretation of your results, relating your answer to the original problem • communication of your results and conclusions in a concise, systematic manner. Your investigation report should include the following: (23 marks)
1. Introduction – two or three sentences providing an overview of your investigation (3 marks)
2. Numerical and graphical analysis • choose various statistical measures you have studied to analyse the data (4 marks) • consider the most appropriate graphs which represent the data provided (5 marks)
3. Interpretation of the results of this analysis in relation to the original question (7 marks) • describe any trend and pattern in your data (two to three sentences) • state how your data relates to the original problem (two to three sentences) • use your knowledge and understanding gained in this unit to explain your results in one
paragraph
4. Conclusion (4 marks) • summarise your findings and conclusions in one paragraph.

24
Sample assessment tasks | Mathematics Essential | General Year 12
DATA
A sample of data from the 2014 CensusAtSchool survey is provided below. The data includes the height, arm span and length of right foot for a random sample of 30 students.
Height Arm span Right foot
length Height Arm span
Right foot length
Height Arm span Right foot
length 170 71 23 158 150 30 162 130 25
155 150 21 169 174 28 147 27 24
169 173 26 55 55 23 176 176 26
177 176 23 165 160 36 148 149 23
153 149 26 147 142 21 156 155 24
150 166 25 175 176 25 172 178 25
159 156 26 166 157 26 150 142 24
170 162 26 150 136 21 158 80 25
169 154 26 176 171 24 145 147 21
162 152 26 163 164 23 167 169 21
ACKNOWLEDGEMENTS First paragraph under ‘Part A: Data collection’ adapted from: Australian Bureau of Statistics. (2014). CensusAtSchool. Retrieved March, 2015 from www.abs.gov.au/censusatschool Used under Creative Commons Attribution 2.5 Australia licence. Data in Task 3, Feedback on Part A (Tasks 1 & 2), and Part B from CensusAtSchool, Australian Bureau of Statistics. Used under Creative Commons Attribution 2.5 Australia licence.
25
Sample assessment tasks | Mathematics Essential | General Year 12
Marking key for sample assessment Task 5 – Unit 3
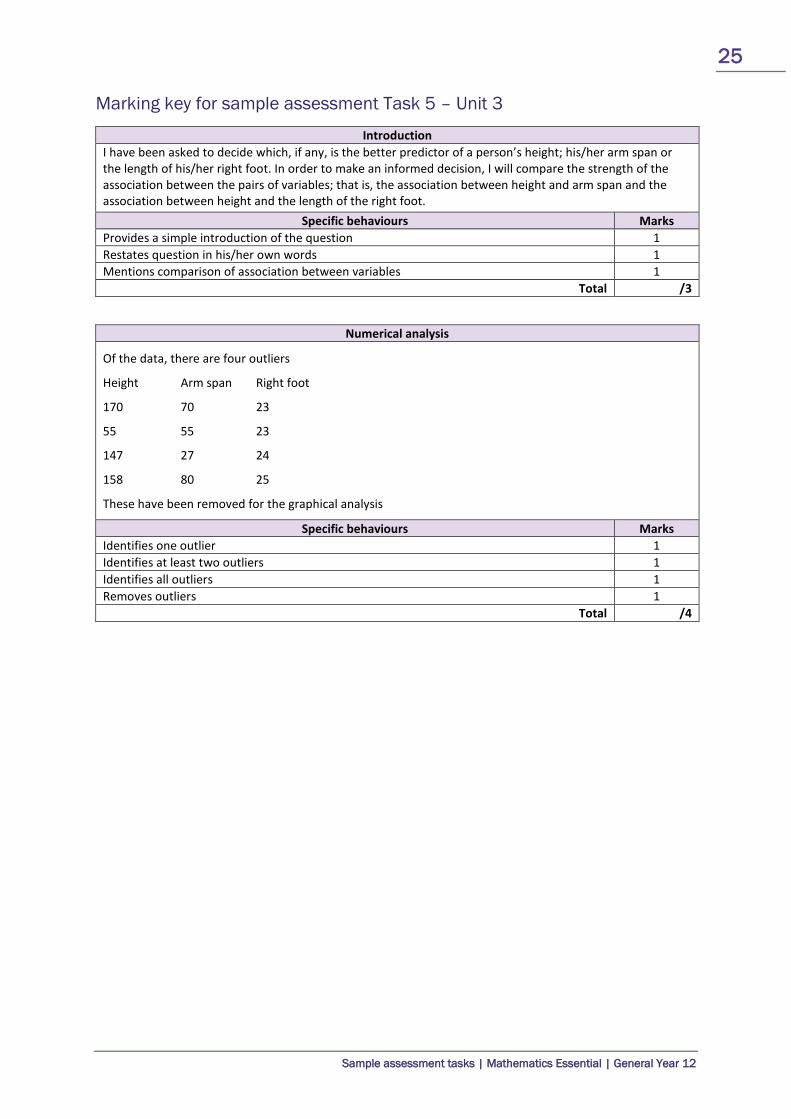
Introduction I have been asked to decide which, if any, is the better predictor of a person’s height; his/her arm span or the length of his/her right foot. In order to make an informed decision, I will compare the strength of the association between the pairs of variables; that is, the association between height and arm span and the association between height and the length of the right foot.
Specific behaviours Marks Provides a simple introduction of the question 1 Restates question in his/her own words 1 Mentions comparison of association between variables 1
Total /3
Numerical analysis
Of the data, there are four outliers
Height Arm span Right foot
170 70 23
55 55 23
147 27 24
158 80 25
These have been removed for the graphical analysis
Specific behaviours Marks Identifies one outlier 1 Identifies at least two outliers 1 Identifies all outliers 1 Removes outliers 1
Total /4
26
Sample assessment tasks | Mathematics Essential | General Year 12
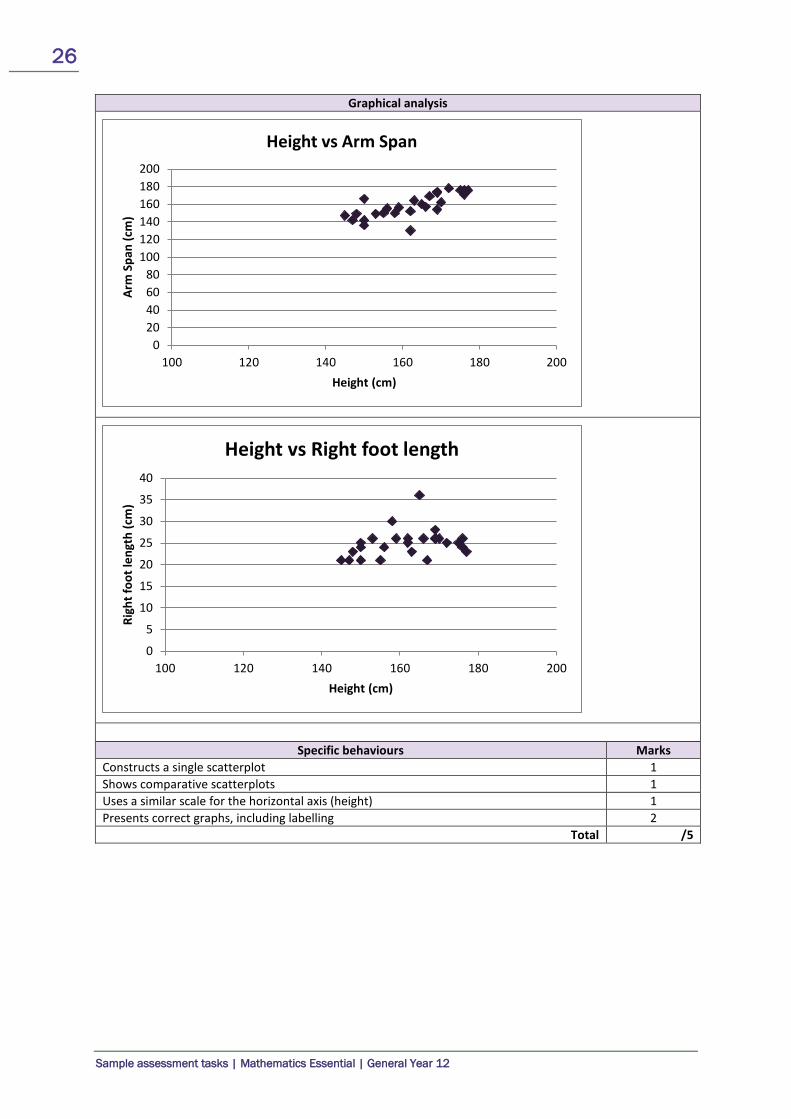
Graphical analysis
Specific behaviours Marks Constructs a single scatterplot 1 Shows comparative scatterplots 1 Uses a similar scale for the horizontal axis (height) 1 Presents correct graphs, including labelling 2
Total /5
020406080
100120140160180200
100 120 140 160 180 200
Arm
Spa
n (c
m)
Height (cm)
Height vs Arm Span
0
5
10
15
20
25
30
35
40
100 120 140 160 180 200
Righ
t foo
t len
gth
(cm
)
Height (cm)
Height vs Right foot length
27
Sample assessment tasks | Mathematics Essential | General Year 12
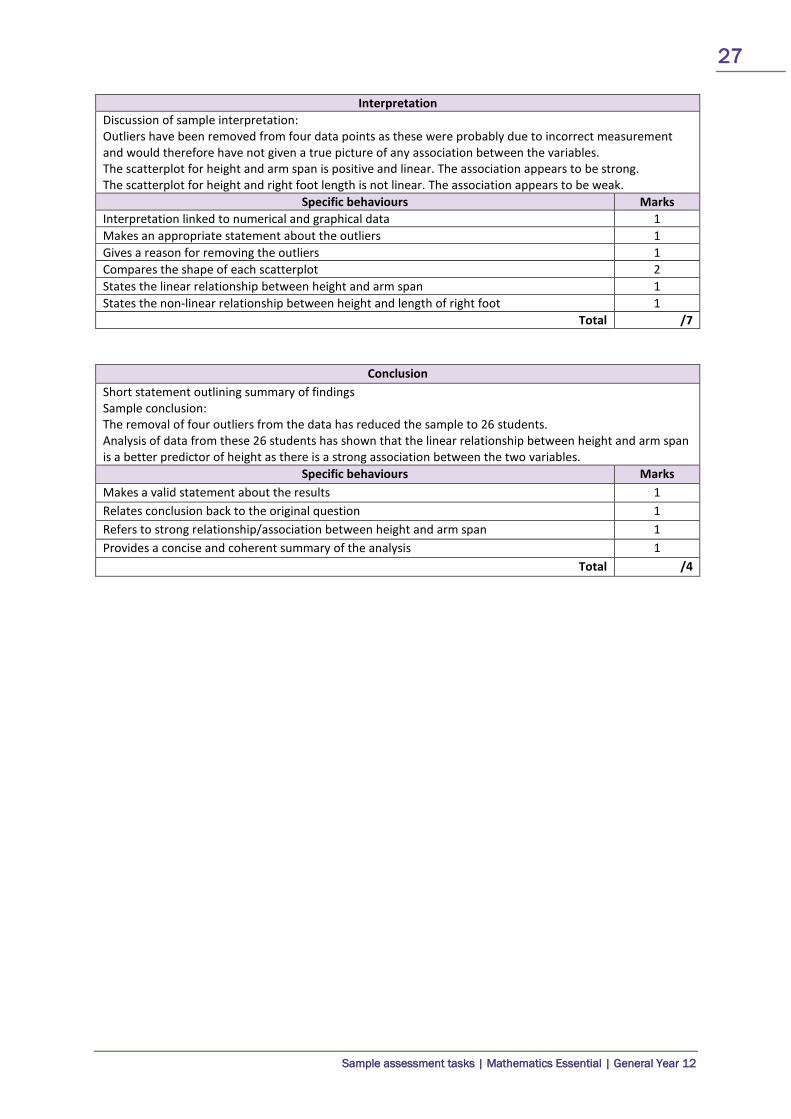
Interpretation Discussion of sample interpretation: Outliers have been removed from four data points as these were probably due to incorrect measurement and would therefore have not given a true picture of any association between the variables. The scatterplot for height and arm span is positive and linear. The association appears to be strong. The scatterplot for height and right foot length is not linear. The association appears to be weak.
Specific behaviours Marks Interpretation linked to numerical and graphical data 1 Makes an appropriate statement about the outliers 1 Gives a reason for removing the outliers 1 Compares the shape of each scatterplot 2 States the linear relationship between height and arm span 1 States the non-linear relationship between height and length of right foot 1
Total /7
Conclusion Short statement outlining summary of findings Sample conclusion: The removal of four outliers from the data has reduced the sample to 26 students. Analysis of data from these 26 students has shown that the linear relationship between height and arm span is a better predictor of height as there is a strong association between the two variables.
Specific behaviours Marks Makes a valid statement about the results 1 Relates conclusion back to the original question 1 Refers to strong relationship/association between height and arm span 1 Provides a concise and coherent summary of the analysis 1
Total /4