Sample A Geography IA final2013 -...
22
Geography Internal Assessment How well prepared are the communities of Bahcesehir and Karaagac in the event of a major earthquake? To what extent do demographic factors determine this? Word Count: 2,498 GEOGRAPHY HL Candidate Number: xxxxxxxxxx
Transcript of Sample A Geography IA final2013 -...
Geography Internal Assessment How well prepared are the communities of Bahcesehir and Karaagac in the event of a major earthquake? To what extent do demographic factors determine this? Word Count: 2,498
GEOGRAPHY HL
Candidate Number: xxxxxxxxxx

2
Table of Contents A: Fieldwork Question and Geographic Context………………………………………………………..3 B: Method(s) of Investigation……………………………………………………………………………………6 C/D: Quality and Treatment of Information Collected and Written Analysis……………..9
How well prepared are the communities of Bahcesehir and Karagaac in the event of an earthquake?...................................................................................9
To what extent to demographic factors determine this?................................14
Education………………………………………………………………………………………..14 Income…………………………………………………………………………………………….17
Previous Experience……………………………………………………………………….. 18 E: Conclusion…………………………………………………………………………………………………………..20 F: Evaluation……………………………………………………………………………………………………………21 Works Cited……………….……………………………………………………………………………………………22
3
A – Fieldwork Question and Geographic Context Fieldwork Question:
How well prepared are the communities of Bahcesehir and Karaagac in the event of
a major earthquake? To what extent do demographic factors determine this?
Hypothesis:
I believe demographic factors highly determine earthquake preparedness.
Thus, I would expect the residents of Bahcesehir to be better prepared for an
earthquake seeing as though it is a region of higher education, income, and
development. Overall, I suspect that those who have experienced earthquakes in the
past are more knowledgeable and more likely to be prepared for future earthquakes.
Geographic Context:
Turkey is located on the North Anatolian Fault, squeezed westwards as the
Arabian and the Eurasian plates move together. This is one of the most energetic
earthquake zones in the world.1
Specifically, we chose to conduct the fieldwork investigation in Bahcesehir
and Karaagac (Figure 2): two socio-‐economically different urban regions in Istanbul,
as they would allow for quantitative data collection and an analysis based on socio-‐
economic disparity. Additionally, these are local communities in respect to Istanbul
International Community School; Bahcesehir serves as a residence for many students
and teachers, and Karagaac often hosts bus faculty and provides goods and services
to school. While Bahcesehir occupies the transition and/or suburbs urban zone,
Karagaac is found in the rural-‐ urban Fringe. According to the scale of urban
settlements, Karagaac is a village, whereas Bahcesehir is a small town.
1 "North Anatolian Fault." ScienceDaily. ScienceDaily, n.d. Web. 20 Nov. 2013.
4
This investigation stems from our studies of Hazards and Disasters (Option D)
in IB Geography, where we have examined cases of risk assessment and response in
relation to earthquakes, predominantly the Haiti earthquake of 2010 and the Tohoku
earthquake of 2011. Vulnerable to earthquakes, we were eager to discover the level
of preparedness of the populations of Karaagac and Bahcesehir.
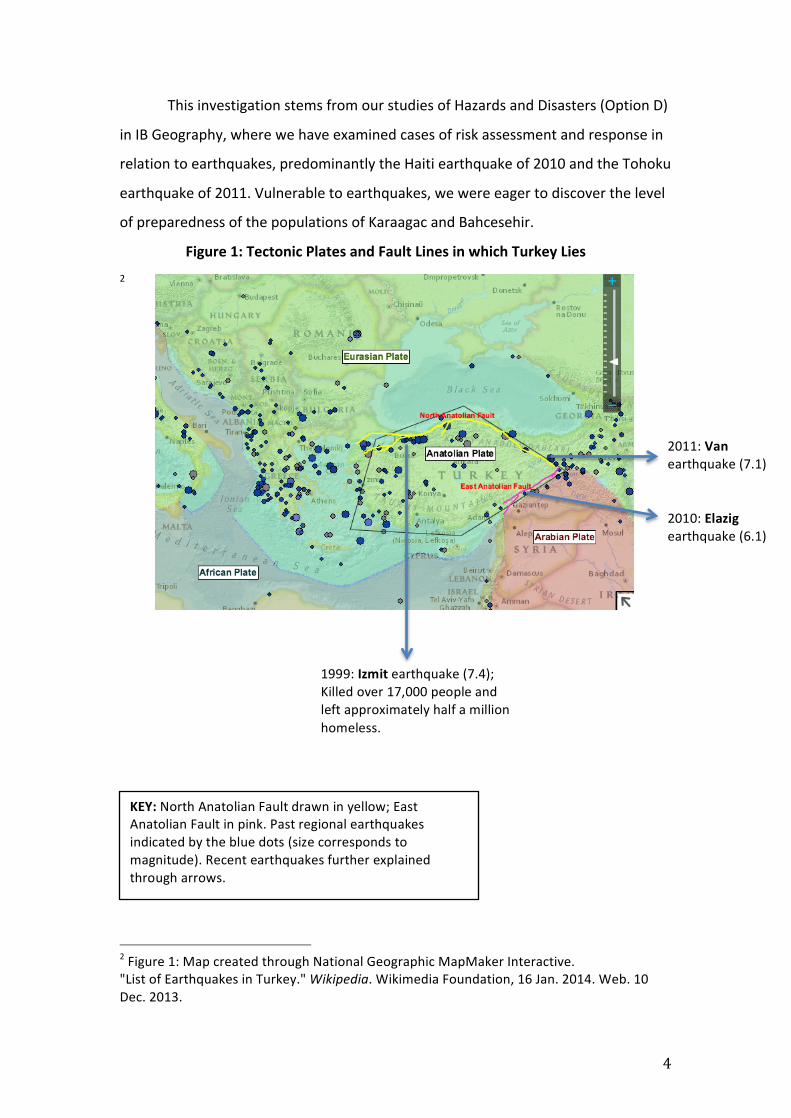
Figure 1: Tectonic Plates and Fault Lines in which Turkey Lies 2
2 Figure 1: Map created through National Geographic MapMaker Interactive. "List of Earthquakes in Turkey." Wikipedia. Wikimedia Foundation, 16 Jan. 2014. Web. 10 Dec. 2013.
KEY: North Anatolian Fault drawn in yellow; East Anatolian Fault in pink. Past regional earthquakes indicated by the blue dots (size corresponds to magnitude). Recent earthquakes further explained through arrows.
2011: Van earthquake (7.1)
2010: Elazig earthquake (6.1)
1999: Izmit earthquake (7.4); Killed over 17,000 people and left approximately half a million homeless.

5
Figure 2: Karagaac and Bahcesehir in respect to Istanbul
3 Karagaac and Bahcesehir in respect to Istanbul International Community School
3 Figure 2: Maps created through National Geographic MapMaker Interactive.
Central Business District (CBD)
Transition/Suburb
Rural-‐Urban Fringe
(residential compound)
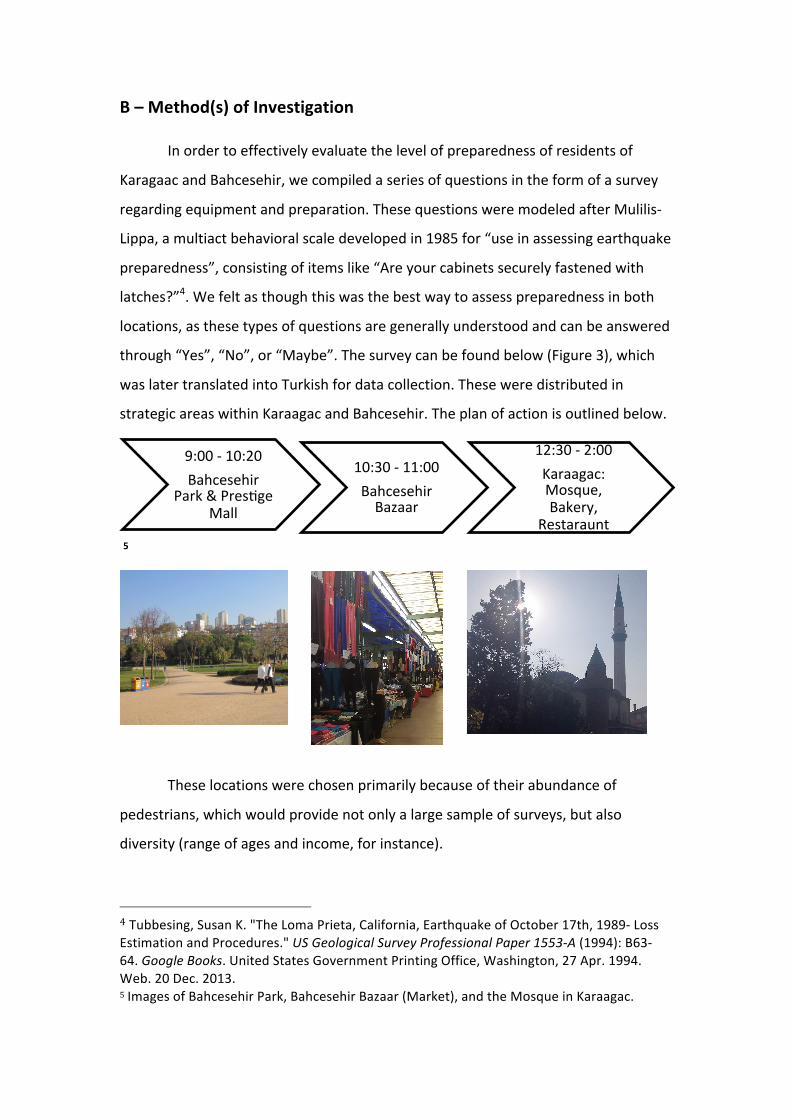
B – Method(s) of Investigation In order to effectively evaluate the level of preparedness of residents of
Karagaac and Bahcesehir, we compiled a series of questions in the form of a survey
regarding equipment and preparation. These questions were modeled after Mulilis-‐
Lippa, a multiact behavioral scale developed in 1985 for “use in assessing earthquake
preparedness”, consisting of items like “Are your cabinets securely fastened with
latches?”4. We felt as though this was the best way to assess preparedness in both
locations, as these types of questions are generally understood and can be answered
through “Yes”, “No”, or “Maybe”. The survey can be found below (Figure 3), which
was later translated into Turkish for data collection. These were distributed in
strategic areas within Karaagac and Bahcesehir. The plan of action is outlined below.
5
These locations were chosen primarily because of their abundance of
pedestrians, which would provide not only a large sample of surveys, but also
diversity (range of ages and income, for instance).
4 Tubbesing, Susan K. "The Loma Prieta, California, Earthquake of October 17th, 1989-‐ Loss Estimation and Procedures." US Geological Survey Professional Paper 1553-‐A (1994): B63-‐64. Google Books. United States Government Printing Office, Washington, 27 Apr. 1994. Web. 20 Dec. 2013. 5 Images of Bahcesehir Park, Bahcesehir Bazaar (Market), and the Mosque in Karaagac.
9:00 -‐ 10:20 Bahcesehir
Park & Preslge Mall
10:30 -‐ 11:00 Bahcesehir Bazaar
12:30 -‐ 2:00 Karaagac: Mosque, Bakery,
Restaraunt

7
6
Displayed above, aside from questions regarding preparation, we also
included demographics to enable the evaluation of a possible relation between
demographic factors, such as residence, education, and income, and level of
earthquake preparedness.
6 Figure 3: 12th Grade IB Geography 2013 I.A. Survey
! An#opera)ng#flashlight#?###YES## # ######NO#######################MAYBE#
! #Do#you#live#in:#Bahcesehir#######Karaagac######Neither##
! How#old#are#you?##Under#18#######18#–#24########25J44##########45J64##########65+##
! What#is#your#monthly#income?#
0J2,000#TL###############2,001#–#4,000#############4,000#+#
! Do#you#have#children#aged#under#12#living#in#your#home?####YES # #NO#
! Which#storey#of#your#building#do#you#live#in#?#____#
! An#opera)ng#transistor#radio#?###YES## # ######NO#######################MAYBE#
! A#complete#firstJaid#kit#?###YES## # ######NO#######################MAYBE#
! At#least#15#litres#of#water#in#plas)c#boXles?###YES## # ######NO#######################MAYBE#
! At#least#4#days#supply#of#dried#or#canned#food#?###YES## # ######NO#######################MAYBE#
! An#opera)ng#fire#ex)nguisher#?###YES## # ######NO#######################MAYBE#
! Loca)on#of#the#water#shut#?###YES## # ######NO#######################MAYBE#
! Loca)on#of#the#gas#shut#?###YES## # ######NO#######################MAYBE#
! Loca)on#of#the#electric#power#shut#?###YES## # ######NO#######################MAYBE#
! Have#you#stabilized/fixed#heavy#objects/furniture#in#your#home?#
##YES## # ######NO#######################MAYBE#
! Gender:## #Male# # # #Female#
! Have#you#experienced#a#major#earthquake#before?#Major#indicates#destruc)on#to#property#or#loss#of#life.#! If#yes#where#(City)#and#when#(Year)#write#below.##
! The#occurrence#and#associated#damage#of#an#earthquake#are#God’s#will?## #Strongly#Disagree###############Disagree######Uncertain#########Agree#############Strongly#Agree#
! Being#prepared#for#an#earthquake#could#help#save#the#lives#of#you#and#your#family?##Strongly#Disagree###############Disagree######Uncertain#########Agree#############Strongly#Agree#
! What#is#your#highest#level#of#formal#educa)on?##Primary######Secondary#####Graduate######PostJGraduate#+##
Supply#Items#
U)li)es#
Stabiliza)on#of#Items#
! Does#your#household#have#a#mee)ng#place#to#come#together#ager#a#possible#earthquake?#
#YES # #NO # #MAYBE#
! Do#you#read#material#on#earthquake#preparedness?#
YES## # ######NO#######################MAYBE#
! Does#your#household#have#earthquake#insurance?##YES## # ######NO#######################MAYBE#
Planning#
! Have#you#aXended#a#first#aid#training#course?##YES## # ######NO#######################MAYBE#
THANK#YOU#FOR#TAKING#THE#TIME#TO#HELP#US#
Earthquake Preparedness Questionnaire -‐ English
8
Collecting a total of 83 surveys, we analyzed the results using the Mulilis-‐
Lippa point system: If the surveyed answered “Yes”, they were given 3 points, 1
point for the answer “Maybe”, and 0 points for “No”. Thus, the greater amount of
points received indicated greater preparation for an earthquake. This transformed
our data into numerical values, which could then be processed, allowing for a
comprehensive analysis using tables and graphs.
The answers marked on the surveys were transferred manually to an Excel
spreadsheet, where the data could be manipulated through sorting, averaging,
among other tools. This made it possible to separate questions in order to analyze
relationships.

9
C/D – Quality and treatment of information collected and Written Analysis How well prepared are the communities of Bahcesehir and Karagaac in
the event of an earthquake?
In order to investigate this part of the research question, I selected two
aspects to focus upon: residence and the average preparedness total. I used Excel to
calculate preparedness scores by adding the points of each individual survey. I then
sorted the data by residence and found the average preparedness for Bahcesehir
and Karagaac. The graph below portrays the data accordingly:
42 being the highest possible preparedness score (three marks for all 14
questions), Karaagac averaged 16.79 of nineteen surveyed, while Bahcesehir
averaged 14.63 of forty surveyed. Opposing the hypothesis, Bahcesehir’s
preparedness score is smaller than that of Karagaac, which exceeds by solely 2.16
points. If 42 theoretically indicates 100% preparedness, we could conclude Karagaac
is only about 40% prepared, and Bahcesehir, roughly 35% prepared; both low values
that suggest neither community is significantly prepared for an earthquake.
Having established that there is no significant difference between these two
communities in relation to earthquake preparedness, I decided to evaluate different
aspects of preparedness instead. The survey was divided into planning, supply,
16.79 14.63
0
5
10
15
20
25
30
35
40
Karagaac Bahcesehir Average Prep
ared
ness (a
vg. p
repa
redn
ess
score)
Residence
Average Preparedness by Residence

10
utilities, and fixtures. The amount of preparedness regarding these different aspects
differs; hence, I decided to determine where exactly there is a lack of preparation.
Observe the following table.
Preparedness Questions Yes %
Location of the electric power shut? 89.2 An operating flashlight? 83.1 Location of the water shut? 79.5 Location of the gas shut? 74.7 At least 4 days supply of dried or canned food? 59.0 At least 15 liters of water in plastic bottles? 57.8 A complete first-‐aid kit? 50.6 Have you attended a first aid training course? 47.0 An operating fire extinguisher? 38.6 Do you read material on earthquake preparedness? 37.3 Does your household have earthquake insurance? 37.3 An operating transistor radio? 33.7 Does your household have a meeting place to come together after a possible earthquake?
31.3
Have you stabilized/fixed heavy objects/furniture in your home? 28.9 Key: Blue: Utilities Yellow: Supply Green: Planning Pink: Fixing It appears as though most people are well aware of their electric, gas, and
water shut, and therefore, more prepared in the aspect of utilities in the event of an
earthquake. Following utilities, the table ranking shows approximately 50% of these
communities possess the necessary supplies to help survive an earthquake:
predominantly the appropriate supply of food and water and a first-‐aid kit. It can be
noted that little planning has taken place (less than 50% have attended training,
read, and devised a household plan in case of a disaster). Lastly, just over one-‐fourth
of people have taken the time to fix perilous objects and furniture.
11
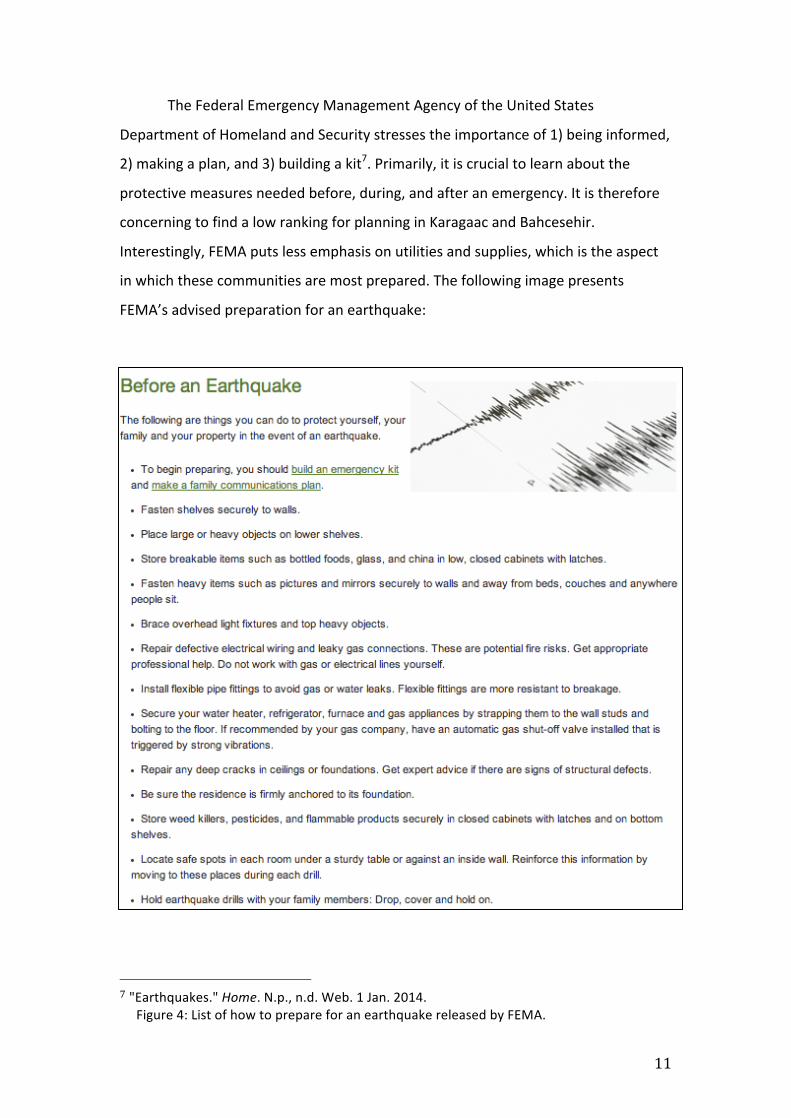
The Federal Emergency Management Agency of the United States
Department of Homeland and Security stresses the importance of 1) being informed,
2) making a plan, and 3) building a kit7. Primarily, it is crucial to learn about the
protective measures needed before, during, and after an emergency. It is therefore
concerning to find a low ranking for planning in Karagaac and Bahcesehir.
Interestingly, FEMA puts less emphasis on utilities and supplies, which is the aspect
in which these communities are most prepared. The following image presents
FEMA’s advised preparation for an earthquake:
7 "Earthquakes." Home. N.p., n.d. Web. 1 Jan. 2014. Figure 4: List of how to prepare for an earthquake released by FEMA.
12
Based on this form of preparation, the communities of Bahcesehir and
Karagaac are not well prepared for an earthquake. Utilities and supplies are only two
aspects of preparedness, and arguably not the most important. The lack of planning
by individuals and families, and fixing of harmful belongings is hindering the level of
preparedness demonstrated by these communities. Nonetheless, although FEMA is a
highly reputable organization devoted to boosting preparedness, aid emergency
situations, and provide relief, advice from country to country can vary dependent
upon local conditions.
13
To what extent do demographic factors determine this?
“Socioeconomic and demographic characteristics are commonly found to be
associated with preparedness behaviors although the direction of association is not
always consistent.”8 I have therefore chosen education, income, and previous
experience as demographic factors for my investigation, as I believe these possess a
linear correlation to earthquake preparedness.
Education
According to a case study done by Princeton attendees, education is
commonly regarded an indicator of socioeconomic status and therefore is included
as a vulnerability indicator in disaster preparedness, “…it is assumed that disaster
preparedness increases with education because highly educated individuals have
better economic resources to undertake preparedness actions.”9 In respect to the
data collected at Karagaac and Bahcesehir, I would suspect those who received a
Post-‐Graduate or higher education to be better prepared (achieve a higher
preparedness score) than those who received primary education. The average
preparedness total of each achievement level is displayed in the graph below.
(Overleaf)
8 Muttarak, Raya, and Wiraporn Pothisiri. The Role of Education on Disaster Preparedness: Case Study of 2012 Indian Ocean Earthquakes and Tsunami Warnings on Thailand’s Andaman Coast. Princeton University. N.p., n.d. Web. 01 Jan. 2014. 9 Muttarak, Raya, and Wiraporn Pothisiri. The Role of Education on Disaster Preparedness: Case Study of 2012 Indian Ocean Earthquakes and Tsunami Warnings on Thailand’s Andaman Coast. Princeton University. N.p., n.d. Web. 01 Jan. 2014.

14
The graph shows, overall, a slight increase in preparedness from primary to
post-‐graduate and above. Arguably the drop is an anomaly, but since there are only
four values, it is difficult to tell. Nonetheless, the data collected appears to reflect
previous studies and research regarding education and disaster preparedness.
Logically speaking, the more educated a person is, the more content he/she
possesses which would enable decision-‐making before and at the time of the
emergency. Aside specific instruction of how to prepare for an earthquake, concepts
like vulnerability, spatial extent, and earthquake prediction would significantly aid
preparedness. In Karagaac and Bahcesehir, education does not seem to be a
significant determining factor in earthquake preparedness.
I therefore decided to undertake the Spearman’s Rank Correlation Coefficient
to identify whether these two variables, education and preparedness, relate in a
monotonic function10. The general formula is displayed below (Figure 5).
10 "How to Calculate Spearman's Rank Correlation Coefficient." WikiHow. N.p., n.d. Web. 3 Jan. 2014.
17 16 18 18.5
0
5
10
15
20
25
30
35
40
Primary Secondary Graduate Post-‐Graduate + Average Prep
ared
ness (a
vg. p
repa
redn
ess
score)
Level of Educa[on
Average Preparedness by Educa[on

15
11
I input the corresponding values into the equation after the necessary calculations:
𝑟 = 1−6 1722680 80! − 1
Spearman’s Rank Result = 0.7981012658;
This value is closer to 1, which indicates a positive correlation between education
and preparedness, supporting the data displayed on the graph and the original
hypothesis.
11 Figure 5: Spearman’s Rank Formula ["How to Calculate Spearman's Rank Correlation Coefficient." WikiHow. N.p., n.d. Web. 3 Jan. 2014.]
16
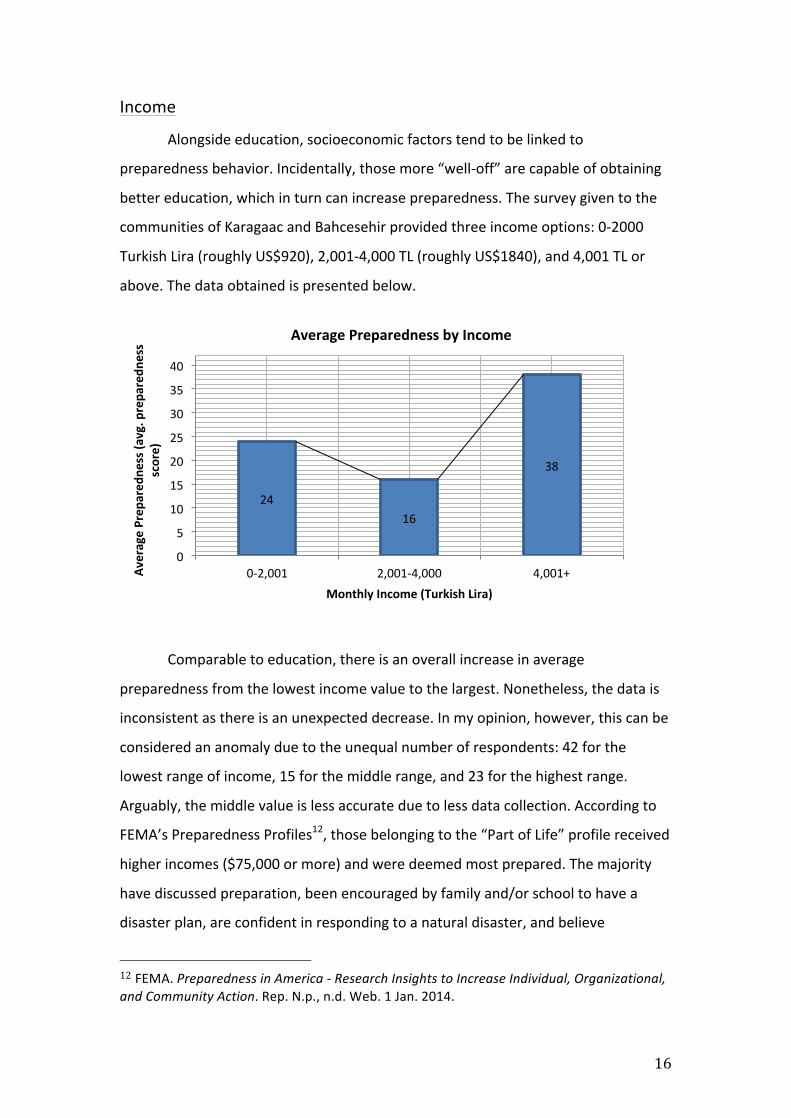
Income
Alongside education, socioeconomic factors tend to be linked to
preparedness behavior. Incidentally, those more “well-‐off” are capable of obtaining
better education, which in turn can increase preparedness. The survey given to the
communities of Karagaac and Bahcesehir provided three income options: 0-‐2000
Turkish Lira (roughly US$920), 2,001-‐4,000 TL (roughly US$1840), and 4,001 TL or
above. The data obtained is presented below.
Comparable to education, there is an overall increase in average
preparedness from the lowest income value to the largest. Nonetheless, the data is
inconsistent as there is an unexpected decrease. In my opinion, however, this can be
considered an anomaly due to the unequal number of respondents: 42 for the
lowest range of income, 15 for the middle range, and 23 for the highest range.
Arguably, the middle value is less accurate due to less data collection. According to
FEMA’s Preparedness Profiles12, those belonging to the “Part of Life” profile received
higher incomes ($75,000 or more) and were deemed most prepared. The majority
have discussed preparation, been encouraged by family and/or school to have a
disaster plan, are confident in responding to a natural disaster, and believe
12 FEMA. Preparedness in America -‐ Research Insights to Increase Individual, Organizational, and Community Action. Rep. N.p., n.d. Web. 1 Jan. 2014.
24 16
38
0
5
10
15
20
25
30
35
40
0-‐2,001 2,001-‐4,000 4,001+ Average Prep
ared
ness (a
vg. p
repa
redn
ess
score)
Monthly Income (Turkish Lira)
Average Preparedness by Income

17
preparation helps. This is an example of a region (United States) in which income
appears to have a positive correlation to disaster preparedness. Although the
beginning and end result of the communities of Karagaac ad Bahcesehir indicate the
same correlation, the whole of data is inconsistent. Aiming to further evaluate this
relationship, I calculated the Spearman’s Rank once more:
𝑟 = 1− 6(18069
80(80! − 1)
Spearman’s Rank Result: 0.7882208158;
This value suggests income and preparedness do relate monotonically: those with
higher incomes are prepared to a greater extent in the event of an earthquake.
18
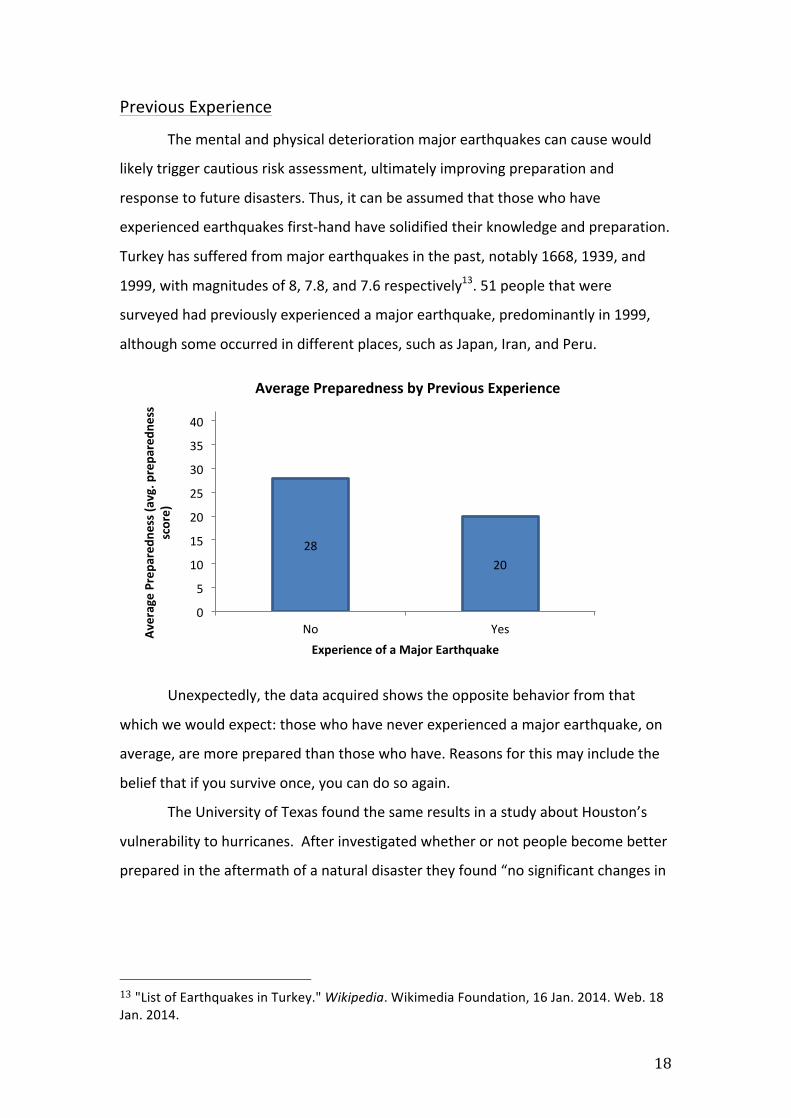
Previous Experience
The mental and physical deterioration major earthquakes can cause would
likely trigger cautious risk assessment, ultimately improving preparation and
response to future disasters. Thus, it can be assumed that those who have
experienced earthquakes first-‐hand have solidified their knowledge and preparation.
Turkey has suffered from major earthquakes in the past, notably 1668, 1939, and
1999, with magnitudes of 8, 7.8, and 7.6 respectively13. 51 people that were
surveyed had previously experienced a major earthquake, predominantly in 1999,
although some occurred in different places, such as Japan, Iran, and Peru.
Unexpectedly, the data acquired shows the opposite behavior from that
which we would expect: those who have never experienced a major earthquake, on
average, are more prepared than those who have. Reasons for this may include the
belief that if you survive once, you can do so again.
The University of Texas found the same results in a study about Houston’s
vulnerability to hurricanes. After investigated whether or not people become better
prepared in the aftermath of a natural disaster they found “no significant changes in
13 "List of Earthquakes in Turkey." Wikipedia. Wikimedia Foundation, 16 Jan. 2014. Web. 18 Jan. 2014.
28 20
0
5
10
15
20
25
30
35
40
No Yes Average Prep
ared
ness (a
vg. p
repa
redn
ess
score)
Experience of a Major Earthquake
Average Preparedness by Previous Experience

19
preparedness or evacuation plan in residents of Houston prior to and a year after
Hurricane Ike.”14.
Contrarily, FEMA conducted a survey in 2011 concerning personal and social
experiences that were analyzed in terms of preparedness behaviors and found that
“The personal disaster experience had a positive relationship with preparedness
behaviors…over half the respondents indicated experience with some type of
disaster and referencing past experiences should be reinforced.”15
14 V, Chen, Banerjee D, and Liu L. "Do People Become Better Prepared in the Aftermath of a Natural Disaster? The Hurricane Ike Experience in Houston, Texas."National Center for Biotechnology Information. US National Library of Medicine, May 2012. Web. 1 Jan. 2014. 15 FEMA. Preparedness in America -‐ Research Insights to Increase Individual, Organizational, and Community Action. Rep. N.p., n.d. Web. 1 Jan. 2014.
20
E – Conclusion
Firstly, there is clearly no significant difference between the communities of
Karaagac and Bahcesehir in terms of preparedness. If they were to be classified
under a category, they would most likely fall under the same one, as the overall
average preparedness of both areas lie fewer than 50% of the highest possible
preparedness score. This leads me to believe that both communities lack
preparation for potential earthquakes.
The data compiled also suggests these communities are more prepared in
terms of utilities and supplies, but have undergone little planning and fixing, vital
aspects of preparation.
Although not always consistent, demographic factors do relate to
preparedness behavior. High levels of education and income are thought to increase
preparedness, as shown in previous studies. In respect to Karagaac and Bahcesehir,
these factors show a general increase, but the correlation is not linear. Past
experience, however, does not seem to determine preparedness in this particular
area in which the research was conducted.
21
F – Evaluation In general terms, the data collection was very efficient. We had a large group,
two Turkish speakers to facilitate communication and translate the survey, and a
targeted a variety of areas in which different people were accessible (i.e. park, mall,
market, streets). These areas provided a large amount of samples, allowing for
quantitative and qualitative data for processing.
Nonetheless, there are evident limitations with surveys, such as the reliance
on the credibility of the data; there is no possible way of confirming the answers
were honest. In addition, many people were hesitant to respond, especially in the
village. This hindered our sampling and affected the amount of surveys we were able
to obtain. If there had been more data, the conclusions made could have been even
more accurate. Lastly, if I were to repeat this investigation, I would attempt to
collect the same amount of data for each community, as I believe difference in
samples (scarce in the village) affected the results.

22
Works Cited: "Earthquakes." Home. N.p., n.d. Web. 1 Jan. 2014.
FEMA. Preparedness in America -‐ Research Insights to Increase Individual,
Organizational, and Community Action. Rep. N.p., n.d. Web. 1 Jan. 2014.
"How to Calculate Spearman's Rank Correlation Coefficient." WikiHow. N.p., n.d.
Web. 3 Jan. 2014.
"List of Earthquakes in Turkey." Wikipedia. Wikimedia Foundation, 16 Jan. 2014.
Web. 10 Dec. 2013.
Muttarak, Raya, and Wiraporn Pothisiri. The Role of Education on Disaster
Preparedness: Case Study of 2012 Indian Ocean Earthquakes and Tsunami Warnings
on Thailand’s Andaman Coast. Princeton University. N.p., n.d. Web. 01 Jan. 2014.
North Anatolian Fault." ScienceDaily. ScienceDaily, n.d. Web. 20 Nov. 2013.
Tubbesing, Susan K. "The Loma Prieta, California, Earthquake of October 17th, 1989-‐
Loss Estimation and Procedures." US Geological Survey Professional Paper 1553-‐
A (1994): B63-‐64. Google Books. United States Government Printing Office,
Washington, 27 Apr. 1994. Web. 20 Dec. 2013.
V, Chen, Banerjee D, and Liu L. "Do People Become Better Prepared in the Aftermath
of a Natural Disaster? The Hurricane Ike Experience in Houston, Texas."National
Center for Biotechnology Information. US National Library of Medicine, May 2012.
Web. 1 Jan. 2014.