SAM Report (NSE Research at Mumbai CST & Chennai
55
Screen Audience Measurement (SAM) OOH Digital AUDIO VISUAL Media with Railways MUMBAI CST & CHENNAI Central Stations Research By: Armour Display Systems Pvt. Ltd.
-
Upload
kashifarmourds -
Category
Documents
-
view
47 -
download
0
Transcript of SAM Report (NSE Research at Mumbai CST & Chennai

S c r e e n A u d i e n c e M e a s u r e m e n t ( S A M )
O O H D i g i t a l A U D I O V I S U A L M e d i a w i t h R a i l w a y s M U M B A I C S T & C H E N N A I C e n t r a l S t a ti o n s
Research By: Armour Display Systems Pvt. Ltd.

ON
TAR
GET
C O N T E N T
Background Credentials of MRSS India
About MRSS India Industry Knowledge & Insight MRSS India Footprints Our Clients
Research Survey Details Research Survey Findings
S
cr
ee
n A
ud
ien
ce
M
ea
su
re
me
nt
(S
AM
)

ON
TAR
GET
Background
S
cr
ee
n A
ud
ien
ce
M
ea
su
re
me
nt
(S
AM
)
Armour Display Systems (ADS) provides train information to passengers waiting at the station lounge, on the platforms. These
information are displayed on the Plasma TV Screens placed at strategic locations and the announcements are done through high quality
speakers. The whole system is managed through their own dedicated control room at each of the station locations.
Currently, ADS is present at Mumbai, Chennai, Hyderabad, Bangalore and Pune stations.
With the amount of footfalls ( FRESH EYEBALLS EVERYDAY ) at any railway station, the integrated audio visual display systems is a new
medium for marketer to advertise their products.
With a view to gather a feedback on this medium and specifically the brand recall, MRSS India was designated to undertake a research
for NSE at Mumbai CST and Chennai Central stations.
MRSS India is Largest Independent Full Service Market Research Firm in Asia & MENA ( Middle East & North America) with 6 offices in
India with state of the art, qualitative research facilities having presence in almost all major cities in India and globally as well.
MRSS India conducted this research simultaneously at both the locations.
The subsequent slides provide an insight on the methodology and the research findings.

ON
TAR
GET
About MRSS India
Largest Independent Full Service Market Research Firm in Asia & MENA (Middle East &
North America)
6 offices in India with state of the art, qualitative research facilities.
65 CATI stations nation-wide.
CAPI capability (Tablet Based).
Video streaming PAN India.
Over a decade of deep experience across sectors.
Membership of ESOMAR, QRCA and MRA.
S
cr
ee
n A
ud
ien
ce
M
ea
su
re
me
nt
(S
AM
)

ON
TAR
GET
Industry Knowledge & Insight S
cr
ee
n A
ud
ien
ce
M
ea
su
re
me
nt
(S
AM
)
Creation Development Innovation Sales High Tech
Healthcare
Finance
Retail
Entertainment
Consumer electronics
Automotive • Opportunity
analysis • Concepts testing• Strategy
development• Strategy
development• Business planning
• Completion analysis
• Marketing Mix• Communication
Analysis• Market
Segmentation• Corporate image
• Effectiveness audio
• Brand extensions• War Games• New opportunities
identification• PKM
• Market research• Customer
satisfaction• Advertising testing• Buying Behaviors
Analysis
P
P
P
P
P
P
PPPPPP
PPPPPP
PPPPPP
We are able to help,
with « ad-hoc »
projects, at any step of
a company life-cycle, in
several different
business sectors

ON
TAR
GET
Our Clients S
cr
ee
n A
ud
ien
ce
M
ea
su
re
me
nt
(S
AM
)
FMCG ICT Auto Pharmaceutical Others• Johnson & Johnson• Unilever• Kellogg’s• Nestle• General Mills• Procter & Gamble
• Hewlett Packard• Microsoft• Dell• Nokia• Intel• IBM• Yahoo• Cisco• Motorola• Siemens• Alcatel-Lucent• Kaspersky Lab
• Tata Motors• Jaguar• Land Rover• Ford• Nissan• Toyota• Johnson Controls
• GlaxoSmithKline• Novartis• Ranbaxy• Bayer• Sanofi-Aventis• AstraZeneca• Bristol-Myers• Abbott Labs
• British Airways• Lufthansa• Levis• Femina• Toyota• Castrol• Vodafone• ICICI• Visa• Jaguar• Deloitte• Pro-Mexico

ON
TAR
GET
MRSS India conducted this research during 17th April – 19th April 2013.
At both the locations, we employed two teams in two different shifts – morning and
evening.
This was done so as to –
Tap both the inbound as well as outbound and also the waiting passengers.
Manage to get passengers of various ethnicity.
Permissions from the railway authorities to carry out the field-work were accorded to us
by ADS.
The sample size planned at each location was 1000 and the total sample size was 2000.
We maintained soft quotas for Gender.
Research Survey Details S
cr
ee
n A
ud
ien
ce
M
ea
su
re
me
nt
(S
AM
)

ON
TAR
GET
Sample Spread
CITY SAMPLE PLANNED
SAMPLE ACHIEVED
MUMBAI 1000 1002
CHENNAI 1000 1003
TOTAL 2000 2005
S
cr
ee
n A
ud
ien
ce
M
ea
su
re
me
nt
(S
AM
)

ON
TAR
GET
R E S E A R C H S U R V E Y F I N D I N G S
S
cr
ee
n A
ud
ien
ce
M
ea
su
re
me
nt
(S
AM
)
Respondent Profile – Overall Respondent Profile – At Mumbai Respondent Profile – At Chennai Respondent Profile – Overall Respondent Profile – At Mumbai Respondent Profile – At Chennai Respondent Profile – Amount Of Time Spent
Gender wise
Occupation & Income wise

ON
TAR
GET
Males58.2%
Females41.8%
GENDER
Respondent Profile – Overall
Tamil Nadu21%
Kerala10%
AP11%Maharashtra
17%
Karnataka8%
MP3%
UP11%
WB5%
Gujarat5%
Orissa4%
Others4%
NATIVE OF
Base: 2005 Base: 2005
• Of the total sample of respondents, 58% were males and 42% were females.
• At an overall level, for Mumbai and Chennai put together, passengers that were natives of Tamil Nadu formed around 22%, followed by Maharashtra at 17%, AP, UP & Kerala followed closely.
• Although local state respondents were predominant along with regional crowd, and, additionally other states ( pan India ) passengers form a significant group of passengers , thus reflecting a PAN INDIA SPREAD OUT.
S
cr
ee
n A
ud
ien
ce
M
ea
su
re
me
nt
(S
AM
)

ON
TAR
GET
Males57.1%
Females42.9%
GENDER
Base: 1002
Native of
9.3
6.6
7.5
30.6
5.83.3
16.4
6.6
5.92.65.2
OthersOrissaGujaratWBUPMPKarnatakaMaharashtraAPKeralaTN
Native of
4
6.3
8.6
33.3
5.63.5
12.8
5.1
7.4
7.9
5.6
OthersOrissaGujaratWBUPMPKarnatakaMaharashtraAPKeralaTN
All Figs in (%)
Maharashtra
UP
AP
Maharashtra
UP
TN
• At Mumbai, most of the passenger amongst males and females were from Maharashtra at 30.6% and 33.3% respectively, followed by that of UP along with a PAN INDIA SPREAD OUT.
Respondent Profile – At Mumbai S
cr
ee
n A
ud
ien
ce
M
ea
su
re
me
nt
(S
AM
)

ON
TAR
GET
Respondent Profile – At Chennai
• At Chennai, most of the passenger amongst males and females were from Tamil Nadu at 31.8% and 42.2% respectively, followed by that of Kerala and AP along with a PAN INDIA SPREAD OUT.
S
cr
ee
n A
ud
ien
ce
M
ea
su
re
me
nt
(S
AM
)
Males59.3%
Females40.7%
GENDER
Native of
31.8
13.4
13.6
3.7
10.6
3.9
8.1
43.74
3.2
OthersOrissaGujaratWBUPMPKarnatakaMaharashtraAPKeralaTN
Native of
42.2
12.3
14.2
1.7
10.3
1.25.93.73.42.92.2
OthersOrissaGujaratWBUPMPKarnatakaMaharashtraAPKeralaTN
All Figs in (%)
Base: 1003
Kerala
AP
TN
Kerala
AP
TN

ON
TAR
GET
Student24%
Salaried48%
Business20%
None7%
OCCUPATION
Respondent Profile – Overall
Rs. 5000 - Rs. 10,000
19%
Rs. 10,001 - Rs. 25,000
29%Rs. 25,001 - Rs. 50,000
41%
Rs. 50,001 and above12%
MONTHLY INCOME
Base: 2005 Base: 2005
• Passengers were mostly Salaried and comprised of 48% of the pie, followed by Students at 24% and Businessmen at 20%.
• 41% of the passengers were in the income category of Rs. 25,001/- – Rs. 50,000/-. The mean income was noticed to be at Rs. 30,788/-.
Mean Income: Rs. 30,778
S
cr
ee
n A
ud
ien
ce
M
ea
su
re
me
nt
(S
AM
)

ON
TAR
GET
Student24%
Salaried49%
Business21%
None6%
OCCUPATION
Respondent Profile – At Mumbai
Rs. 5000 - Rs. 10,000
19%
Rs. 10,001 - Rs. 25,000
28%
Rs. 25,001 - Rs. 50,000
39%
Rs. 50,001 and above
14%
MONTHLY INCOME
Base: 1002 Base: 1002 Mean Income: Rs. 31,380
• In Mumbai, salaried passengers comprised of 49% of the pie, followed by Students at 24% and Businessmen at 21% .
• 39% of the passengers were in the income category of Rs. 25,001/- – Rs. 50,000/- followed very closely by passengers in the income category of Rs. 10,001 – Rs. 25,000 at 28%. The mean income was noticed to be at Rs. 31,380/-.
S
cr
ee
n A
ud
ien
ce
M
ea
su
re
me
nt
(S
AM
)

ON
TAR
GET
Student24%
Salaried47%
Business20%
None9%
OCCUPATION
Respondent Profile – At Chennai
Rs. 5000 - Rs. 10,000
18%
Rs. 10,001 - Rs. 25,000
29%Rs. 25,001 - Rs. 50,000
42%
Rs. 50,001 and above11%
MONTHLY INCOME
Base: 1003 Base: 1003 Mean Income: Rs. 30,177
• In Chennai, salaried passengers comprised of 47% of the pie, followed by Students at 24% and Businessmen at 20%.
• 42% of the passengers were in the income category of Rs. 25,001/- – Rs. 50,000/- followed distantly by passengers in the income category of Rs. 10,001 – Rs. 25,000 at 29%. The mean income was noticed to be at Rs. 30,177/-.
S
cr
ee
n A
ud
ien
ce
M
ea
su
re
me
nt
(S
AM
)
ON
TAR
GET
Less than 30 Min.27%
30 Min. - 45 Min.39%
45 Min. - 1 Hr.20%
More than 1 Hr.
14%
AMOUNT OF TIME SPENT
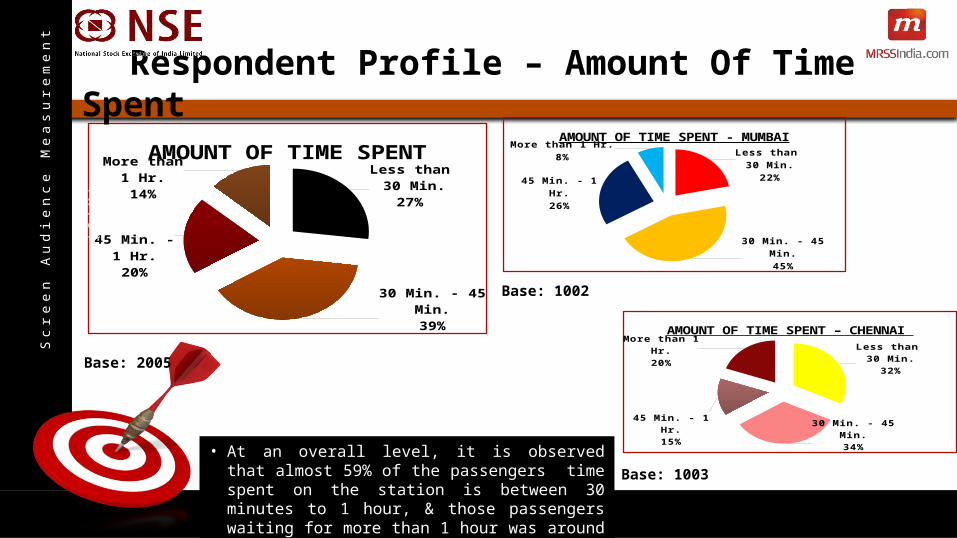
Respondent Profile – Amount Of Time Spent
Base: 2005
• At an overall level, it is observed that almost 59% of the passengers time spent on the station is between 30 minutes to 1 hour, & those passengers waiting for more than 1 hour was around 14%.
Less than 30 Min.22%
30 Min. - 45 Min.45%
45 Min. - 1 Hr.26%
More than 1 Hr.8%
AMOUNT OF TIME SPENT - MUMBAI
Less than 30 Min.32%
30 Min. - 45 Min.34%
45 Min. - 1 Hr.15%
More than 1 Hr.20%
AMOUNT OF TIME SPENT – CHENNAI
Base: 1002
Base: 1003
S
cr
ee
n A
ud
ien
ce
M
ea
su
re
me
nt
(S
AM
)

ON
TAR
GET
O V E R A L L
S
cr
ee
n A
ud
ien
ce
M
ea
su
re
me
nt
(S
AM
)
Advertisements Recalled Brands Recalled – Tom – Mumbai (Unaided) Brands Recalled – Tom – Mumbai (Aided) Brands Recalled – Tom – Chennai (Unaided) Brands Recalled – Tom – Chennai (Aided) Quality Of Announcement – City Wise Quality Of Announcement – Gender Wise Quality Of Display – City Wise Quality Of Display – Gender Wise

ON
TAR
GET
Yes66%
No34%
OVERALL
Advertisements Recalled
Base: 2005
Yes71%
No29%
MUMBAI
Base: 1002
Yes61%
No39%
CHENNAI
Base: 1003
• At an overall level, it is observed that almost 66% passengers recalled having seen an advertisement in between the train announcements.
• In Mumbai the recall for any advertisement was at a high of 71%, in Chennai it was around 61%.
S
cr
ee
n A
ud
ien
ce
M
ea
su
re
me
nt
(S
AM
)

ON
TAR
GET
Brands Recalled – TOM – Mumbai
All Figs in (%)
SET
MA
X - I
PL LIC
Revi
tal
Man
napu
ram
Sunf
east
Cas
hew
...
Tata
Mot
ors
ICIC
I Pru
Life
SBI B
ank
NSE
Ars
h Ka
lp
0.02.04.06.08.0
10.012.014.016.018.020.0
18.3
13.9 13.9
11.210.2
8.8 8.37.4
5.6
2.1
TOP OF MIND AWARENESS (UNAIDED)
• In Mumbai, IPL at 18.3% was the most recalled advertisement at TOM level, followed by LIC & Revital at 13.9%.Base: 909
S
cr
ee
n A
ud
ien
ce
M
ea
su
re
me
nt
(S
AM
)
Base: 909

ON
TAR
GET
Brands Recalled – Aided – Mumbai
All Figs in (%)
SET
MA
X - I
PL
Revi
tal
Tata
Mot
ors
Sunf
east
Cas
h...
SBI B
ank
ICIC
I Pru
Life
Man
napu
ram
NSE
Punj
ab N
ation
a...
Ars
h Ka
lp LIC
0.0
5.0
10.0
15.0
20.0
25.0
30.0
35.0
32.430.0
28.6
24.022.4
15.4 14.4 13.2
9.46.8
3.2
SPONTANEOUS & AIDED AWARENESS
• In Mumbai, IPL at 32.4% was the most recalled advertisement at Spontaneous & Aided level, followed by Revital & Tata Motors at 30% and 28.6% respectively.
Base: 733
S
cr
ee
n A
ud
ien
ce
M
ea
su
re
me
nt
(S
AM
)

ON
TAR
GET
Brands Recalled – TOM – Chennai
All Figs in (%)
SET
MA
X - I
PL LIC
Aas
hirw
ad S
...
Man
napu
ram
Air
cel
ICIC
I Pru
Life
Tata
Mot
ors
Chen
nai S
ilks
NSE
RKG
Ghe
e
Nar
asus
Coff
ee
V Ca
re S
pa
Tiru
mal
a M
ilk
Vent
ura
Pum
ps
Revi
tal0.0
5.0
10.0
15.0
20.0
25.0
30.0
35.033.0
10.6 10.5
7.0 6.9 6.95.1 4.1 3.7 2.9 2.6 2.5 1.5 1.3 0.3
TOP OF MIND AWARENESS (UNAIDED)
• IPL at 33% was the most recalled advertisement at TOM level, followed by LIC at 10.6% and Aashirwad Sambhar Masala at 10.5%.
Base: 631
S
cr
ee
n A
ud
ien
ce
M
ea
su
re
me
nt
(S
AM
)
ON
TAR
GET
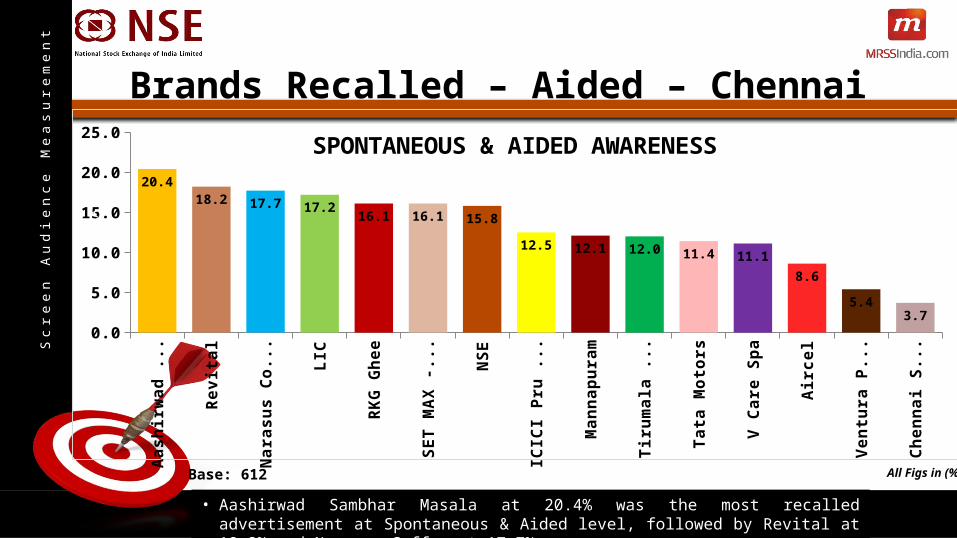
Brands Recalled – Aided – Chennai
All Figs in (%)
Aas
hirw
ad S
am...
Revi
tal
Nar
asus
Coff
ee LIC
RKG
Ghe
e
SET
MA
X - I
PL
NSE
ICIC
I Pru
Life
Man
napu
ram
Tiru
mal
a M
ilk
Tata
Mot
ors
V Ca
re S
pa
Air
cel
Vent
ura
Pum
ps
Chen
nai S
ilks
0.0
5.0
10.0
15.0
20.0
25.0
20.418.2 17.7 17.2
16.1 16.1 15.8
12.5 12.1 12.0 11.4 11.1
8.6
5.43.7
SPONTANEOUS & AIDED AWARENESS
• Aashirwad Sambhar Masala at 20.4% was the most recalled advertisement at Spontaneous & Aided level, followed by Revital at 18.2% and Narasus Coffee at 17.7%.
Base: 612
S
cr
ee
n A
ud
ien
ce
M
ea
su
re
me
nt
(S
AM
)

ON
TAR
GET
Quality Of Announcement – City Wise
All Figs in (%)
For the parameter of Quality of announcements at the railway stations, at an overall level, the top 2 box score was observed to be 70% and the mean score was 3.95.
In Mumbai, the top 2 box score was 67.7% with 50% passengers giving a rating of “above average”.
In Chennai, the top 2 box score bettered the overall score with 73.2% with almost 45% passengers giving a rating of “excellent”.
S
cr
ee
n A
ud
ien
ce
M
ea
su
re
me
nt
(S
AM
)
ALL Mumbai Chennai0%
10%20%30%40%50%60%70%80%90%
100%
1.3 1.8 0.700000000000001
2.9 4.8 0.700000000000001
25.6 25.825.4
39.850.4
27.5
30.417.3
45.7
Poor Below Average Average Above Average Excellent
4.2
3.95
70.2
6.6
3.77
67.7
1.4
4.17
73.2
Bottom 2 Box
Mean (5 point Scale)
Top 2 Box
Base 1787 959 828

ON
TAR
GET
Quality Of Announcement – Gender Wise
ALL Males Females0%
10%20%30%40%50%60%70%80%90%
100%
1.3 1.6 0.82.9 2.5 3.5
25.6 2230.7
39.8 40.239.2
30.4 33.725.7
Poor Below Average Average Above Average Excellent
4.2
3.95
70.2
4.1
4.02
73.9
4.4
3.86
65.0
Bottom 2 Box
Mean (5 point Scale)
Top 2 Box
All Figs in (%)Base 1787 1053 734
The top 2 box score for males was observed to be almost 74%, with 40% rating the quality to be “above average” and 33.7% rating the quality “excellent”.
The top 2 box score in case of females at 65% was slightly lower as compared to that for males, albeit the “above average” rating was almost similar and “excellent” rating was slightly lower in comparison to that in males.
S
cr
ee
n A
ud
ien
ce
M
ea
su
re
me
nt
(S
AM
)

ON
TAR
GET
Quality Of Display – City Wise
ALL Males Females0%
10%20%30%40%50%60%70%80%90%
100%
1 1 11.9 2.7 1
20.9 18.723.4
34.8 49.617.5
41.5 27.957.1
Poor Below Average Average Above Average Excellent
2.9
4.14
76.3
3.7
4.01
77.5
2.0
4.29
74.6
Bottom 2 Box
Mean (5 point Scale)
Top 2 Box
All Figs in (%)Base 1787 1053 734
The top 2 box score for males was observed to be almost 74%, with 40% rating the quality to be “above average” and 33.7% rating the quality “excellent”.
The top 2 box score in case of females at 65% was slightly lower as compared to that for males, albeit the “above average” rating was almost similar and “excellent” rating was slightly lower in comparison to that in males.
S
cr
ee
n A
ud
ien
ce
M
ea
su
re
me
nt
(S
AM
)

ON
TAR
GET
Quality Of Display – City Wise
ALL Mumbai Chennai0%
10%20%30%40%50%60%70%80%90%
100%
1 1 11.9 2.7 1
20.9 18.7 23.4
34.849.6
17.5
41.527.9
57.1
Poor Below Average Average Above Average Excellent
2.9
4.14
76.3
3.7
4.01
77.5
1.9
4.29
74.6
Bottom 2 Box
Mean (5 point Scale)
Top 2 Box
All Figs in (%)Base 1787 959 828
For the parameter of Quality of display at the railway stations, at an overall level, the top 2 box score was observed to be 76% and the mean score performed well at 4.14
In Mumbai, the top 2 box score bettered the national average at 77.6% with almost 50% passengers giving a rating of “above average”
In Chennai, the top 2 box score was 74.6% but a high of 57% passengers giving a rating of “excellent”
S
cr
ee
n A
ud
ien
ce
M
ea
su
re
me
nt
(S
AM
)

ON
TAR
GET
Quality Of Display – Gender Wise
ALL Males Females0%
10%
20%
30%
40%
50%
60%
70%
80%
90%
100%
1 1 11.9 1.9 1.9
20.9 19.9 22.2
34.8 34.1 35.7
41.5 43 39.2
Poor Below Average Average Above Average Excellent
2.9
4.14
76.2
2.9
4.16
77.1
2.9
4.10
74.9
Bottom 2 Box
Mean (5 point Scale)
Top 2 Box
All Figs in (%)Base 1787 1053 734
The top 2 box score for males was observed to be better than the overall level at 77.1%, with 43% rating the quality to be “excellent” and 34.1% rating the quality “above average”.
The top 2 box score in case of females almost at 75% was slightly lower as compared to that for males, the rating on above average was higher and rating on excellent was observed to be lower as compared to males.
S
cr
ee
n A
ud
ien
ce
M
ea
su
re
me
nt
(S
AM
)

ON
TAR
GET
N a t i o n a l S t o c k E x c h a n g e
S
cr
ee
n A
ud
ien
ce
M
ea
su
re
me
nt
(S
AM
)
Brand Specific Diagnostics Like To Know More Quality Of Advertisement – City Wise Quality Of Advertisement – Gender Wise

ON
TAR
GET
Male Female Male FemaleMumbai Chennai
05
1015202530354045
39 36
13
33
OBSERVED CARTOON CHARACTER – GENDER WISE BY CITY
Brand Specific Diagnostics
Mumbai Chennai0
10
20
30
40
38
21
OBSERVED CARTOON CHARACTER
Male Female0
10
20
30
40
26 34
OSBSERVED CARTOON CHARACTER
Base 1002 1003 Base 1167 838
All Figs in (%)
MUMBAI CHENNAI S
cr
ee
n A
ud
ien
ce
M
ea
su
re
me
nt
(S
AM
)
ON
TAR
GET
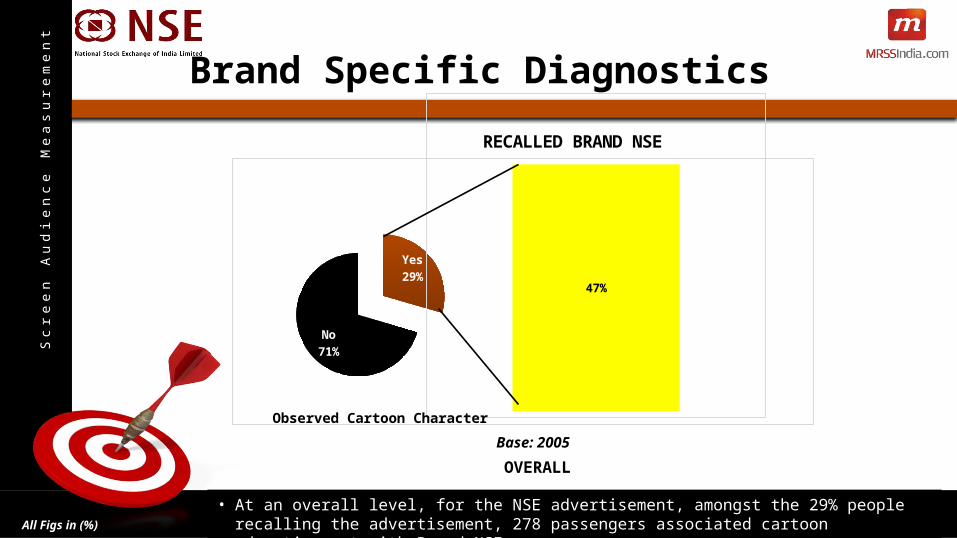
Brand Specific Diagnostics
All Figs in (%)
Yes29%
No71%
47%
RECALLED BRAND NSE
Observed Cartoon Character
Base: 2005
OVERALL
• At an overall level, for the NSE advertisement, amongst the 29% people recalling the advertisement, 278 passengers associated cartoon advertisement with Brand NSE.
S
cr
ee
n A
ud
ien
ce
M
ea
su
re
me
nt
(S
AM
)

ON
TAR
GET
Like To Know More – NSE / Nifty / ETF
Mumbai Chennai5658606264666870 68
61
Male Female0
50
100
63 68
Base 179 99 Base 148 130
All Figs in (%)
Male Female Male FemaleMumbai Chennai
0
20
40
60
80
70 6444
72
MUMBAI CHENNAI
LIKE TO KNOW MORE – GENDER WISE BY CITY
S
cr
ee
n A
ud
ien
ce
M
ea
su
re
me
nt
(S
AM
)

ON
TAR
GET
Quality Of Advertisement – City Wise
ALL Mumbai Chennai0%
10%20%30%40%50%60%70%80%90%
100%
1 1.1 0.91.5 1.9 0.9
27.216.1
46.9
47.4 65.116
22.8 15.935.2
Poor Below Average Average Above Average Excellent
2.5
3.90
70.2
2.9
3.93
81.0
1.9
3.84
51.2
Bottom 2 Box
Mean (5 point Scale)
Top 2 Box
All Figs in (%)
For the parameter of Quality of advertisement of NSE, at an overall level, the top 2 box score was observed to be 70% and the mean score was 3.9.
In Mumbai, the top 2 box score bettered the national average at 81% with 65% passengers giving a rating of “above average” and about 16% rating “excellent”.
In Chennai, the top 2 box score at 51% was lower compared to overall level mostly attributing to the fact that 47% rated it as “average”.
S
cr
ee
n A
ud
ien
ce
M
ea
su
re
me
nt
(S
AM
)

ON
TAR
GET
Quality Of Advertisement - Gender Wise
ALL Males Females0%
10%20%30%40%50%60%70%80%90%
100%
1 1 11.5 1 2.1
27.2 25.6 29
47.4 53.1 41.3
22.8 19.3 26.6
Poor Below Average Average Above Average Excellent
2.5
3.90
70.2
2.0
3.89
72.5
3.1
3.90
67.8
Bottom 2 Box
Mean (5 point Scale)
Top 2 Box
All Figs in (%)
The top 2 box score for
males was observed to be
better than the overall level at
72.5%, with 53% rating the
quality to be “above average”
and 19.3% rating the quality
“excellent”.
The top 2 box score in case
of females almost at 68% was
marginally lower as compared
to that for males, the rating on
above average was lower and
excellent was higher as
compared to males.
S
cr
ee
n A
ud
ien
ce
M
ea
su
re
me
nt
(S
AM
)

ON
TAR
GET
A d d i t i o n a l B R A N D S P E C I F I C
ICICI Prudential Life Insurance I T C (Sunfeast & Aashirwad Sambhar Masala)
S
cr
ee
n A
ud
ien
ce
M
ea
su
re
me
nt
(S
AM
)

ON
TAR
GET
I C I C I P r u L i f e I n s u r a n c e
S
cr
ee
n A
ud
ien
ce
M
ea
su
re
me
nt
(S
AM
)
Brand Specific Diagnostics Like To Know More Quality Of Advertisement – City Wise Quality Of Advertisement – Gender Wise

ON
TAR
GET
Brand Specific Diagnostics
Mumbai Chennai0
10
20
30
40
50
44
24
OBSERVED FAMILY
Male Female0
10
20
30
40
50
29
40
OSBSERVED FAMILY
Base 1002 1003 Base 1167 838
All Figs in (%)Male Female Male FemaleMumbai Chennai
0
10
20
30
40
50
44 43
15
38
MUMBAI CHENNAI
OBSERVED FAMILY- GENDER WISE BY CITY
S
cr
ee
n A
ud
ien
ce
M
ea
su
re
me
nt
(S
AM
)
ON
TAR
GET
Brand Specific Diagnostics
All Figs in (%)
Yes34%
No66%
35%
Observed family
Base: 2005
Yes44%No
56%73%
Observed family
Base: 1002
Yes24%
No76%
49%
Observed family
Base: 1003
OVERALL MUMBAI CHENNAI
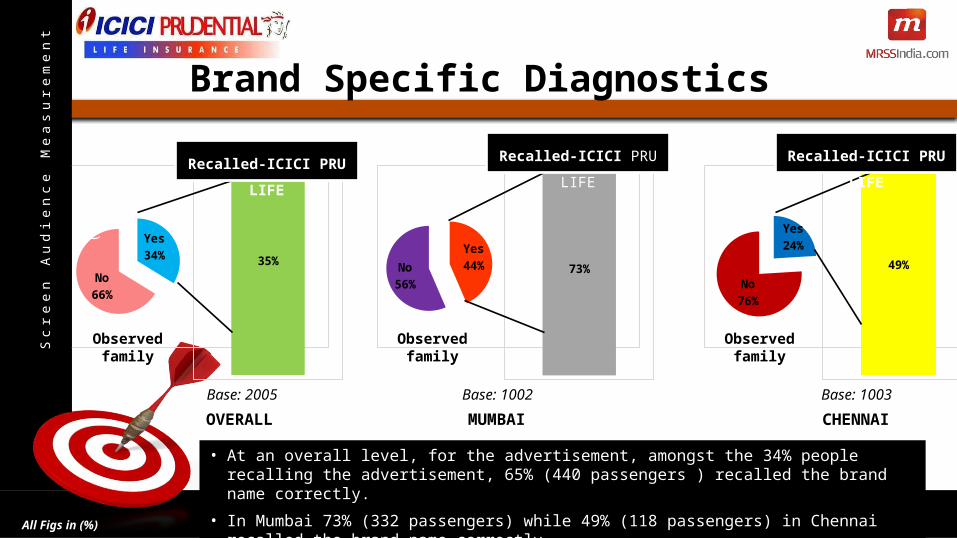
• At an overall level, for the advertisement, amongst the 34% people recalling the advertisement, 65% (440 passengers ) recalled the brand name correctly.
• In Mumbai 73% (332 passengers) while 49% (118 passengers) in Chennai recalled the brand name correctly.
Recalled-ICICI PRU LIFE Recalled-ICICI PRU LIFE Recalled-ICICI PRU LIFE
S
cr
ee
n A
ud
ien
ce
M
ea
su
re
me
nt
(S
AM
)
ON
TAR
GET
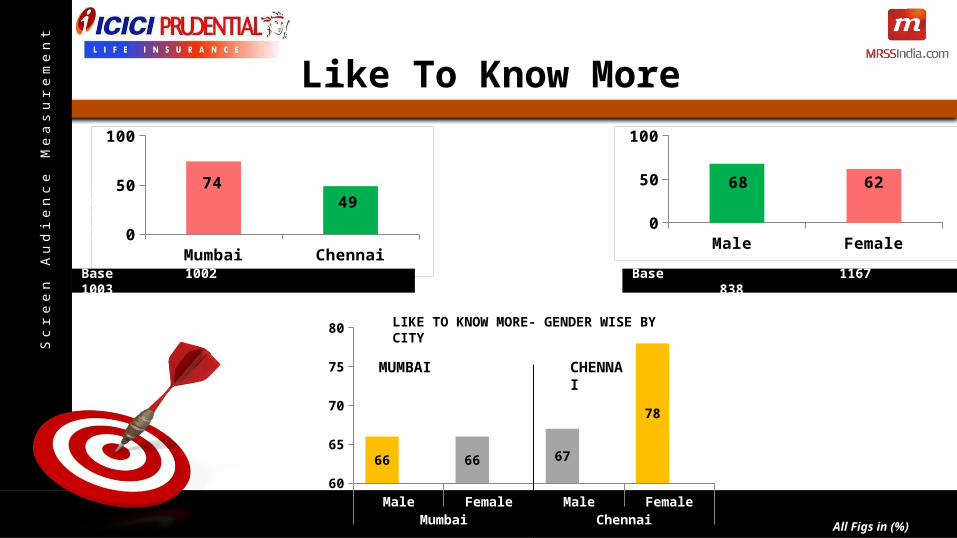
Like To Know More
Mumbai Chennai0
50
100
7449
Male Female0
50
100
68 62
Base 1002 1003 Base 1167 838
All Figs in (%)
Male Female Male FemaleMumbai Chennai
6062646668707274767880
66 66 67
78
MUMBAI CHENNAI
LIKE TO KNOW MORE- GENDER WISE BY CITY
S
cr
ee
n A
ud
ien
ce
M
ea
su
re
me
nt
(S
AM
)

ON
TAR
GET
ALL Mumbai Chennai0%
10%
20%
30%
40%
50%
60%
70%
80%
90%
100%
0.600000000000001
0.700000000000001 0.44.3 5.7 1.7
2311.9
43.2
47 6319
25 1937
Poor Below Average Average Above Average Excellent
4.9
3.92
72.1
6.4
3.93
81.7
2.1
3.89
54.8
Bottom 2 Box
Mean (5 point Scale)
Top 2 Box
All Figs in (%)
For the parameter of Quality of advertisement of ICICI Pru Life, at an overall level, the top 2 box score was observed to be 72% and the mean score was 3.92.
In Mumbai, the top 2 box score bettered the national average at 81% with 63% passengers giving a rating of “above average” and 19% rated “excellent”.
In Chennai, the top 2 box score at 55% was lower compared to overall level but the “excellent” rating at 37% was higher than overall levels at 25%.
Quality Of Advertisement – City Wise S
cr
ee
n A
ud
ien
ce
M
ea
su
re
me
nt
(S
AM
)

ON
TAR
GET
ALL Males Females0%
10%
20%
30%
40%
50%
60%
70%
80%
90%
100%
0.600000000000001
0.600000000000001
0.600000000000001
4.3 4.4 4.1
23 16.529.6
46.8 54.639.1
25.3 23.9 26.6
Poor Below Average Average Above Average Excellent
4.9
3.92
72.1
5.0
3.97
78.5
4.7
3.87
65.7
Bottom 2 Box
Mean (5 point Scale)
Top 2 Box
All Figs in (%)
The top 2 box score for males was observed to be better than the overall level at 78.5%, with almost 55% rating the quality to be “above average” and 24% rating the quality “excellent”
The top 2 box score in case of females almost at 66% was lower as compared to that for males, the rating on above average was lower and excellent was higher as compared to males
Quality Of Advertisement - Gender Wise S
cr
ee
n A
ud
ien
ce
M
ea
su
re
me
nt
(S
AM
)

ON
TAR
GET
I T C – S U N F E A S T & A A S H I R W A D S A M B H A R M A S A L A
S
cr
ee
n A
ud
ien
ce
M
ea
su
re
me
nt
(S
AM
)
Brand Specific Diagnostics Like To Know More Quality Of Advertisement – City Wise Quality Of Advertisement – Gender Wise
ON
TAR
GET
Mumbai Chennai0
50
100
5732
OBSERVED BRAND
Male Female0
1020304050
3447
OSBSERVED BRAND
Base 1002 1003 Base 1167 838
All Figs in (%)
Sunfeast badam cookies
Aashirwad Sambhar Masala
Male Female Male FemaleMumbai Chennai
010203040506070
56 59
1335
MUMBAI CHENNAIOBSERVED BRAND-GENDER WISE BY CITY
Brand Specific Diagnostics
S
cr
ee
n A
ud
ien
ce
M
ea
su
re
me
nt
(S
AM
)

ON
TAR
GET
All Figs in (%)
Yes57%
No43%
Observed ITC
Base: 1002
Observed ITC
Base: 1003
MUMBAI CHENNAI
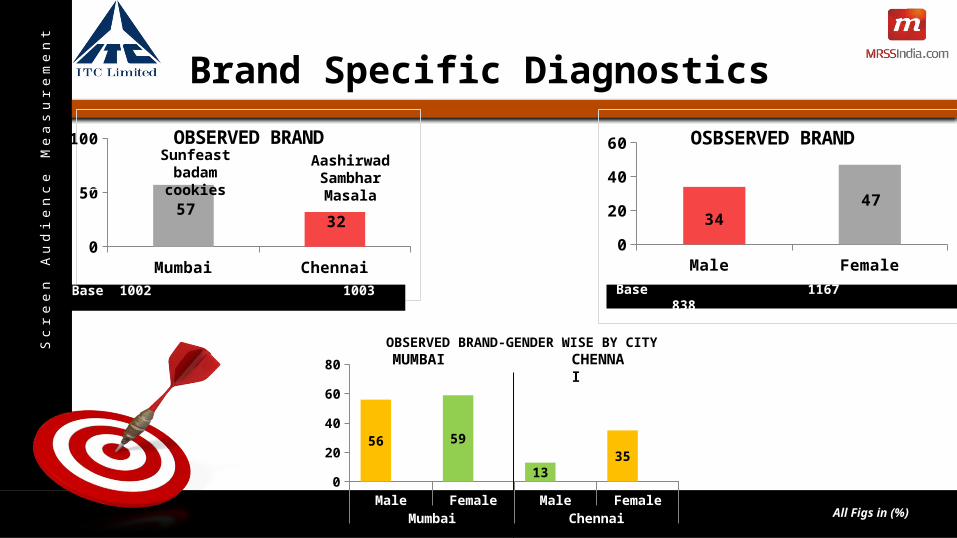
• At an overall level, for the ITC advertisement, amongst the 40% people recalling the advertisement, 82% (652 passengers ) recalled the brand name correctly.
• In Mumbai 87% while 50 % in Chennai recalled the brand name correctly.
87%
Recalled brand Sunfeast Recalled brand aashirwad sambhar masala
All Figs in (%)
Brand Specific Diagnostics
S
cr
ee
n A
ud
ien
ce
M
ea
su
re
me
nt
(S
AM
)

ON
TAR
GET
Mumbai Chennai90919293949596
95
92
Male Female0
20
40
60
80
10094 94
Base 1002 1003 Base 1002 1003
All Figs in (%)
Male Female Male FemaleMumbai Chennai
8687888990919293949596
9594
89
94
MUMBAI CHENNAILIKE TO BY THE PRODUCT – GENDER WISE BY CITY
Like To Know More S
cr
ee
n A
ud
ien
ce
M
ea
su
re
me
nt
(S
AM
)

ON
TAR
GET
ALL Mumbai Chennai0%
10%20%30%40%50%60%70%80%90%
100%
0.600000000000001
0.700000000000001 0.51.6 2.1 0.5
15.9 9.931.5
51.8 62.1 24.7
30.1 25.242.9
Poor Below Average Average Above Average Excellent
2.3
4.09
81.9
2.8
4.09
87.3
0.9
4.09
67.6
Bottom 2 Box
Mean (5 point Scale)
Top 2 Box
All Figs in (%)
For the parameter of Quality of advertisement of ITC, at an overall level, the top 2 box score was observed to be 82% and the mean score was a high of 4.1.
In Mumbai, the top 2 box score bettered the national average at 87% with 62% passengers giving a rating of “above average” and 25% with “excellent” rating.
In Chennai, the top 2 box score at 67% was lower compared to overall level but the “excellent” rating was high at 43%.
Quality Of Advertisement – City Wise S
cr
ee
n A
ud
ien
ce
M
ea
su
re
me
nt
(S
AM
)

ON
TAR
GET
ALL Males Females0%
10%20%30%40%50%60%70%80%90%
100%
0.600000000000001 0 1.31.6 1.5 1.815.9 11.5
20.3
51.8 62.3 41.1
30.1 24.835.5
Poor Below Average Average Above Average Excellent
2.3
4.09
81.9
1.5
4.10
87.0
3.0
4.08
76.6
Bottom 2 Box
Mean (5 point Scale)
Top 2 Box
All Figs in (%)
The top 2 box score for males was observed to be better than the overall level at 87%, with 62% rating the quality to be “above average” and 25% rating the quality “excellent”.
The top 2 box score in case of females almost at 77% lower as compared to that for males, the rating on above average was lower and excellent was higher as compared to males.
Quality Of Advertisement - Gender Wise S
cr
ee
n A
ud
ien
ce
M
ea
su
re
me
nt
(S
AM
)

ON
TAR
GET
I P L - S O N Y M A X
S
cr
ee
n A
ud
ien
ce
M
ea
su
re
me
nt
(S
AM
)
Brand Specific Diagnostics Like To Know More Quality Of Advertisement – City Wise Quality Of Advertisement – Gender Wise

ON
TAR
GET
Mumbai Chennai0
20406080
100
87
46
OBSERVED DANCE AD
Male Female63646566676869
65
68
OSBSERVED DANCE AD
Base 1002 1003 Base 1002 1003
All Figs in (%)Male Female Male FemaleMumbai Chennai
0102030405060708090
100
88 86
42 50
CHENNAIMUMBAIOBSERVED DANCE AD -GENDER WISE BY CITY
Brand Specific Diagnostics
S
cr
ee
n A
ud
ien
ce
M
ea
su
re
me
nt
(S
AM
)
ON
TAR
GET
All Figs in (%)
Yes66%
No34%
98%
Observed IPL Ad
Base: 2005
Yes87%
No13%
99%
Observed IPL Ad
Base: 1002
Yes46%No
54%96%
Observed IPL Ad
Base: 1003
OVERALL MUMBAI CHENNAI
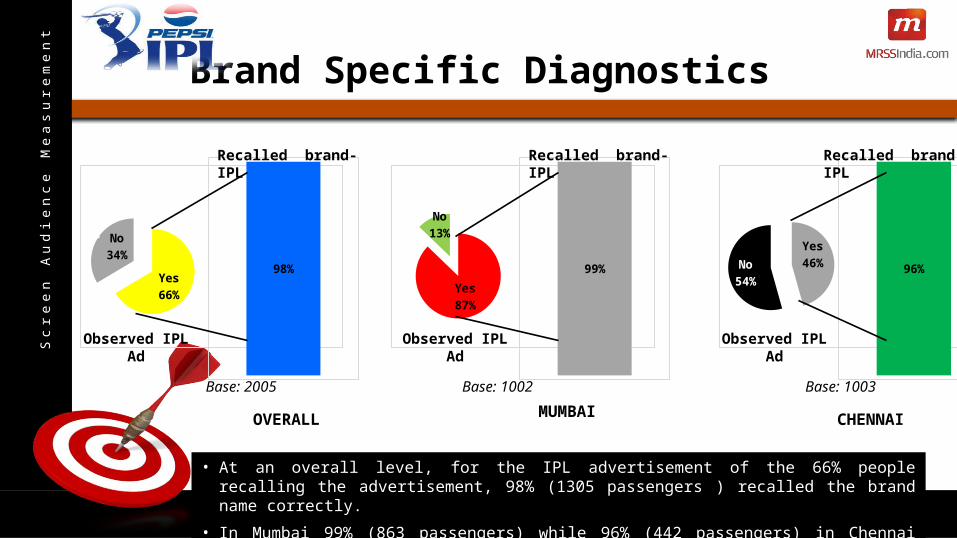
• At an overall level, for the IPL advertisement of the 66% people recalling the advertisement, 98% (1305 passengers ) recalled the brand name correctly.
• In Mumbai 99% (863 passengers) while 96% (442 passengers) in Chennai recalled the brand name correctly.
Recalled brand- IPL Recalled brand- IPL Recalled brand- IPL
Brand Specific Diagnostics
S
cr
ee
n A
ud
ien
ce
M
ea
su
re
me
nt
(S
AM
)

ON
TAR
GET
IPL – Noticed Dance Steps ?
Mumbai Chennai80859095
9085
Male Female8687888990
87
89
Base 1002 1003 Base 1002 1003
All Figs in (%)
Male Female Male FemaleMumbai Chennai
78
80
82
84
86
88
90
92
89 90
83
87
MUMBAI CHENNAI
NOTICED DANCE STEPS - GENDER WISE BY CITY
S
cr
ee
n A
ud
ien
ce
M
ea
su
re
me
nt
(S
AM
)

ON
TAR
GET
ALL Mumbai Chennai0%
10%20%30%40%50%60%70%80%90%
100%
0.4 0.3 0.41.1 1.5 0.213.2 14.8 10.3
42.452.9
22.5
42.930.5
66.6
Poor Below Average Average Above Average Excellent
1.4
4.27
85.4
1.8
4.12
83.4
0.7
4.55
89.1
Bottom 2 Box
Mean (5 point Scale)
Top 2 Box
All Figs in (%)
For the parameter of Quality of advertisement of IPL, at an overall level, the top 2 box score was observed to be 85% and the mean score was high of 4.27.
In Mumbai, the top 2 box was 83% with 53% passengers giving a rating of “above average” and 30% with “excellent” rating.
In Chennai, the top 2 box score was better as compared to overall level at 89% mostly attributing to the fact that 66% rated it as “excellent”.
Quality Of Advertisement – City Wise S
cr
ee
n A
ud
ien
ce
M
ea
su
re
me
nt
(S
AM
)

ON
TAR
GET
ALL Males Females0%
10%20%30%40%50%60%70%80%90%
100%
0.4 0.1 0.700000000000001
1.1 0.8 1.413.2 14.5 11.5
42.4 44.1 40.1
42.9 40.4 46.2
Poor Below Average Average Above Average Excellent
1.4
4.27
85.4
0.9
4.24
84.6
2.1
4.3
86.4
Bottom 2 Box
Mean (5 point Scale)
Top 2 Box
All Figs in (%)
The top 2 box score for males was observed to be better than the overall level at 84.6%, with a mean score of 4.24.
The top 2 box score in case of females was higher as compared to the overall level and amongst males, mostly attributing to the fact that the rating on “excellent” parameter performed better.
Quality Of Advertisement - Gender Wise S
cr
ee
n A
ud
ien
ce
M
ea
su
re
me
nt
(S
AM
)

ON
TAR
GET
Key Take – Outs S
cr
ee
n A
ud
ien
ce
M
ea
su
re
me
nt
(S
AM
)
HIGH CONTENT MEDIUM
• Quality of Display and Quality of Announcement is well appreciated with either above average or excellent.
AVERAGE
TIME SPENT
• The average time spent on both the railway stations (Mumbai & Chennai) was an average of 35 – 45 minutes or more.
RECALL
RATIO
• Overall – 76%
• Peak TOM – 33%
• Peak Aided – 32.4%

ON
TAR
GET
S
cr
ee
n A
ud
ien
ce
M
ea
su
re
me
nt
(S
AM
)
Recommendation
“A MUST MEDIUM FOR EVERY PLANNER especially for any
MASS BRAND”
S A M s a y s . . . .
THANK YOU