SALT LAKE CITY DEPARTMENT OF AIRPORTS · INTRODUCTORY SECTION Page ... rehabilitation, airfield...
81
i Comprehensive Annual Financial Report Salt Lake City Department of Airports (An Enterprise Fund of Salt Lake City, Utah) For the Years Ended June 30, 2017 and 2016
Transcript of SALT LAKE CITY DEPARTMENT OF AIRPORTS · INTRODUCTORY SECTION Page ... rehabilitation, airfield...

i
Comprehensive Annual Financial Report
Salt Lake City Department of Airports (An Enterprise Fund of Salt Lake City, Utah)
For the Years Ended June 30, 2017 and 2016

i
SALT LAKE CITY DEPARTMENT OF AIRPORTS
(An Enterprise Fund of Salt Lake City, Utah)
COMPREHENSIVE ANNUAL FINANCIAL REPORT
FOR THE YEARS ENDED JUNE 30, 2017 AND 2016
Prepared by the Airport
Finance Division
Salt Lake City International Airport
Salt Lake City, Utah
ii
SALT LAKE CITY DEPARTMENT OF AIRPORTS
Salt Lake City, Utah
Financial Statements
For the Years Ended June 30, 2017 and 2016
TABLE OF CONTENTS
INTRODUCTORY SECTION Page Title Page ......................................................................................................................................... i
Table of Contents ............................................................................................................................ ii
Letter of Transmittal ...................................................................................................................... iv
Organizational Chart ...................................................................................................................... ix
Certificate of Achievement ............................................................................................................. x
FINANCIAL SECTION
Independent Auditor’s Report .......................................................................................................... 2
Management’s Discussion and Analysis .......................................................................................... 4
Basic Financial Statements:
Statements of Net Position as of June 30, 2017 and 2016 ....................................................... 14
Statements of Revenues, Expenses and Changes in Net Position for the Years
Ended June 30, 2017 and 2016 ......................................................................................... 16
Statements of Cash Flows for the Years Ended June 30, 2017 and 2016 ............................... 17
Notes to Financial Statements .................................................................................................. 19
Required Supplementary Information:
Schedule of the Proportionate Share of the Net Pension Liability ................................... RSI-2
Schedule of Contributions ............................................................................................... RSI-4
Notes to Required Supplementary Information ............................................................... RSI-7
STATISTICAL SECTION (Unaudited)
Financial Trends
Summary of Changes in Net Position…… ............................................................................ S2
Total Annual Revenues, Expenses and Changes in Net Position ..................................... S3-S4
Cash Flow Trend .............................................................................................................. S5-S6
Ratios of Outstanding Debt ............................................................................................................ S7
Demographic and Economic Information
Demographic and Economic Statistics .................................................................................. S8
Utah Principal Employers .............................................................................................. S9-S10
Airport Employee Statistics ................................................................................................. S11
Summary of Capital Assets .................................................................................................. S12
Insurance
Schedule of Insurance Policies .......................................................................................... S13
Operating Information
O&D and Connecting Enplaned Passengers ....................................................................... S14
Airlines Operating at the Airport ........................................................................................ S15
Market Share of Enplaned Passengers ................................................................................ S16
Historical Aircraft Operations ............................................................................................ S17
Historical Landed Weights ................................................................................................ S18
Historical Air Cargo and Mail ............................................................................................ S19
Total Annual Revenues and Expenses ......................................................................... S20-S21
Summary of Operating Revenues ....................................................................................... S22
Sources of Airline Revenues ....................................................................................... S23-S24
Summary of Operating Expenses ...................................................................................... S25

INTRODUCTORY SECTION
THIS SECTION CONTAINS THE FOLLOWING
SUBSECTIONS:
Letter of Transmittal
Organizational Chart
Certificate of Achievement

iv
December 22, 2017
Honorable Mayor and City Council Members
Salt Lake City Department of Airports Advisory Board
Salt Lake City, Utah
Overview
The Comprehensive Annual Financial Report of the Salt Lake City Department of Airports (Airport) for
the fiscal year (FY) ended June 30, 2017 is submitted herewith. This report was prepared by the Airport’s
Finance Division, using generally accepted accounting principles (GAAP) for local governments as
prescribed by the Governmental Accounting Standards Board (GASB). The accuracy of the data and the
completeness and fairness of the presentations, including all disclosures, are the responsibility of the
Airport.
In developing and evaluating the Airport’s accounting system, consideration is given to the adequacy of
internal control. The management of the Airport has established a comprehensive internal control
framework that is designed to provide management with reasonable, but not absolute, assurance that assets
are safeguarded from loss from unauthorized use or disposition and transactions are executed in accordance
with management’s authorization and recorded properly for the preparation of the financial statements. The
concept of reasonable assurance recognizes that the cost of a control should not exceed the benefits likely
to be derived; and the evaluation of costs and benefits requires estimates and judgments by management.
We believe that the Airport’s internal control processes adequately safeguard assets, provide reasonable
assurance that financial transactions are recorded properly, and that to the best of our knowledge and belief,
this report is complete and reliable in all material respects.
Eide Bailly, LLP, an independent firm of Certified Public Accountants, has audited these basic financial
statements and related notes. Their report is included herein. The goal of the independent audit is to provide
reasonable assurance that the financial statements of the Airport for the fiscal year ended June 30, 2017 are
free of material misstatements. This independent audit involved examining, on a test basis, evidence
supporting the amounts and disclosures in the financial statements, assessing the accounting principles used,
and significant estimates made by management.
Additionally, Eide Bailly, LLP, audited the compliance requirements of Salt Lake City’s federal funds
expenditures (which include the Airport’s federal funds) for the year as part of the federally mandated
Single Audit designed to meet the special needs of federal grantor agencies. That report is available in a
separate report combined with Salt Lake City Corporation (City).
The Airport’s budget is prepared under the direction of the Airport Executive Director and Director of
Finance, and is submitted to the Salt Lake City Council for approval and inclusion in the City budget as an
enterprise fund.
v
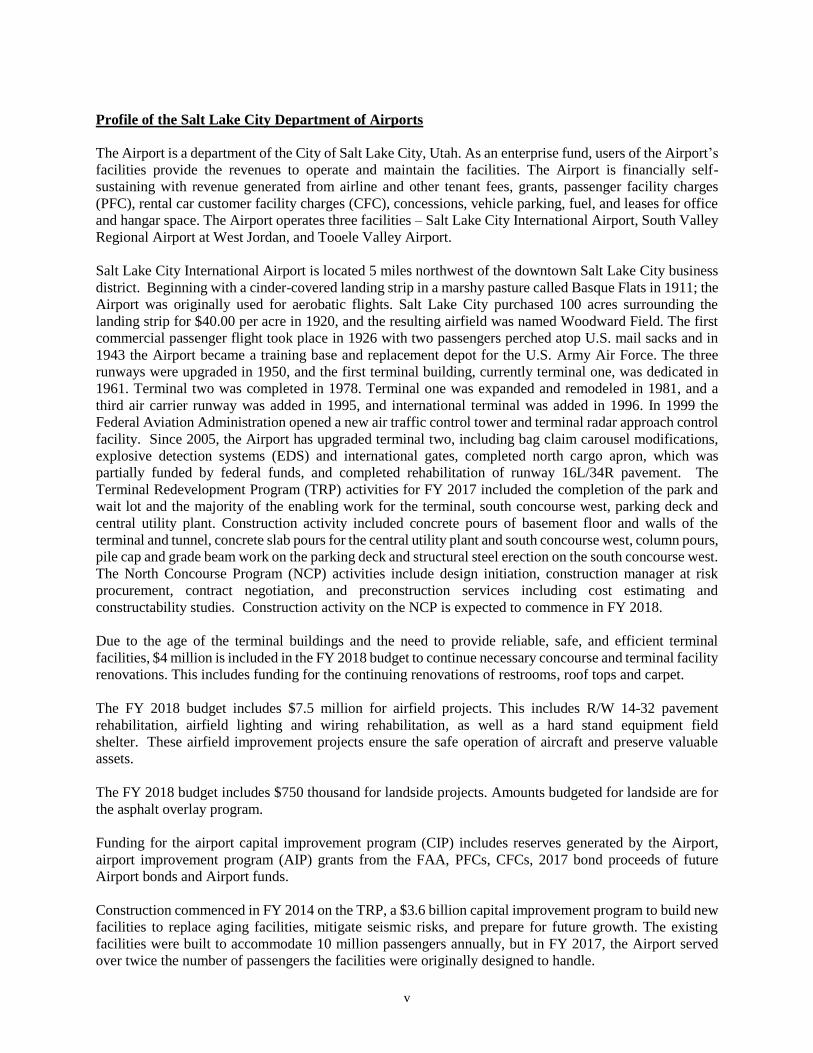
Profile of the Salt Lake City Department of Airports
The Airport is a department of the City of Salt Lake City, Utah. As an enterprise fund, users of the Airport’s
facilities provide the revenues to operate and maintain the facilities. The Airport is financially self-
sustaining with revenue generated from airline and other tenant fees, grants, passenger facility charges
(PFC), rental car customer facility charges (CFC), concessions, vehicle parking, fuel, and leases for office
and hangar space. The Airport operates three facilities – Salt Lake City International Airport, South Valley
Regional Airport at West Jordan, and Tooele Valley Airport.
Salt Lake City International Airport is located 5 miles northwest of the downtown Salt Lake City business
district. Beginning with a cinder-covered landing strip in a marshy pasture called Basque Flats in 1911; the
Airport was originally used for aerobatic flights. Salt Lake City purchased 100 acres surrounding the
landing strip for $40.00 per acre in 1920, and the resulting airfield was named Woodward Field. The first
commercial passenger flight took place in 1926 with two passengers perched atop U.S. mail sacks and in
1943 the Airport became a training base and replacement depot for the U.S. Army Air Force. The three
runways were upgraded in 1950, and the first terminal building, currently terminal one, was dedicated in
1961. Terminal two was completed in 1978. Terminal one was expanded and remodeled in 1981, and a
third air carrier runway was added in 1995, and international terminal was added in 1996. In 1999 the
Federal Aviation Administration opened a new air traffic control tower and terminal radar approach control
facility. Since 2005, the Airport has upgraded terminal two, including bag claim carousel modifications,
explosive detection systems (EDS) and international gates, completed north cargo apron, which was
partially funded by federal funds, and completed rehabilitation of runway 16L/34R pavement. The
Terminal Redevelopment Program (TRP) activities for FY 2017 included the completion of the park and
wait lot and the majority of the enabling work for the terminal, south concourse west, parking deck and
central utility plant. Construction activity included concrete pours of basement floor and walls of the
terminal and tunnel, concrete slab pours for the central utility plant and south concourse west, column pours,
pile cap and grade beam work on the parking deck and structural steel erection on the south concourse west.
The North Concourse Program (NCP) activities include design initiation, construction manager at risk
procurement, contract negotiation, and preconstruction services including cost estimating and
constructability studies. Construction activity on the NCP is expected to commence in FY 2018.
Due to the age of the terminal buildings and the need to provide reliable, safe, and efficient terminal
facilities, $4 million is included in the FY 2018 budget to continue necessary concourse and terminal facility
renovations. This includes funding for the continuing renovations of restrooms, roof tops and carpet.
The FY 2018 budget includes $7.5 million for airfield projects. This includes R/W 14-32 pavement
rehabilitation, airfield lighting and wiring rehabilitation, as well as a hard stand equipment field
shelter. These airfield improvement projects ensure the safe operation of aircraft and preserve valuable
assets.
The FY 2018 budget includes $750 thousand for landside projects. Amounts budgeted for landside are for
the asphalt overlay program.
Funding for the airport capital improvement program (CIP) includes reserves generated by the Airport,
airport improvement program (AIP) grants from the FAA, PFCs, CFCs, 2017 bond proceeds of future
Airport bonds and Airport funds.
Construction commenced in FY 2014 on the TRP, a $3.6 billion capital improvement program to build new
facilities to replace aging facilities, mitigate seismic risks, and prepare for future growth. The existing
facilities were built to accommodate 10 million passengers annually, but in FY 2017, the Airport served
over twice the number of passengers the facilities were originally designed to handle.
vi
In conjunction with the TRP, the NCP includes the development of a 30-gate midfield airside concourse
to the north of the new airside concourse to be developed as part of the TRP. The Airport received
unanimous support from all airlines serving SLC to build the north concourse in April 2016. At that time,
it was estimated that the NCP would cost approximately $737 million. Since then, the Airport has
initiated full design of the NCP, selected the construction manager at risk for the NCP and commenced
preconstruction services, including cost estimating and constructability studies. As a result of robust
construction activity in the Salt Lake City metropolitan area, the improved national economy, and various
other reasons, the Airport believes that the cost of the NCP will exceed the April 2016 estimate. The
construction manager at risk for the NCP and an independent cost estimator have each developed a
revised cost estimate for the NCP of approximately $1.36 billion. This estimate is based upon current
conditions and certain assumptions; however, there can be no assurance that the final cost of the NCP will
not change further due to additional changes in conditions or that certain assumptions will not occur and,
such change could be material. Airport management currently is working with the airlines operating at
the Airport, its construction team and other consultants to develop the alternatives available to the Airport
for addressing this cost increase.
The Airport is currently ranked the 25th busiest in the United States, and 87th busiest in the world in terms
of passenger numbers with over 361 scheduled daily departing flights serving more than 96 non-stop
destinations. The Airport served approximately 23.7 million passengers in FY 2017 and is one of Delta Air
Lines Inc.’s (Delta) largest hubs.
Economic Condition
According to the recently published State of Utah’s 2017 Economic Report to the Governor, Utah typically
grows more rapidly than the nation after a recession, and this pattern is continuing in the current recovery.
During 2016, Utah’s employment rate decreased to 3.4 percent compared to 3.7 percent in 2015.
Utah’s total personal income is estimated to have increased by 5.7 percent in 2016, in addition to the 4.5
percent increase in 2015. The 2016 increase in personal income was led by strong wage growth at 3.1
percent. Jobs were added across all industry sectors in the Utah economy during 2016, including significant
expansion in the information sector driven by the corridor of technology firms that continued to expand as
well as strong increase in financial activities.
The Airport plays an important role in supporting business and economic growth in the state. Its operations
are a key component in providing affordable access to worldwide destinations for business and individuals.
According to an analysis by GSBS Richman Consulting in 2013, the Airport has been a significant
economic driver for Utah and its capital for the past 50 years and will continue to underpin the economy.
The Airport in 2013 generated an estimated $1.1 billion in wages and income annually from an estimated
35,290 full-time jobs. Taking all spending into account, the airport contributes an estimated $1.9 billion
annually to Utah’s GDP.
The Airport operates within the economic conditions of the national and local economy as well as the airline
industry environment. An effective partnership between the airlines and the Airport requires a continued
focus on operating costs, while maintaining service and safety. Operating expenses increased by 10.4
percent while passengers increased 4.9 percent in FY 2017 over FY 2016. Approximately half of the
increase in operating costs relates to changes in pension benefits that increased the amount of pension
expense recognized in FY 2017 compared to FY 2016. The remaining increase in operating expenses
relates to capital projects that were expensed in the current year.
The Airport borrowed $1 billion by issuing its General Airport Revenue Bonds (GARB’s) in February 2017
to fund the ongoing construction of the TRP. Efforts are continually made to control operating costs at the
Airport and reduce airline cost per enplaned passenger. The Airport’s cost per enplaned passenger was
vii
$3.53 for FY 2017 and $3.69 for FY 2016, which is one of the lowest rates among large hub airports in the
nation. The Airport has total cash balances of $1.4 billion to be utilized during the next several years for
operating costs, CIP as well as the TRP and NCP with the exception of certain restricted funds. Financing
for the TRP and NCP are expected to be generated from federal grants, PFCs, CFCs, bond proceeds, and
Airport cash reserves.
Outlook
Over the last several years, Utah has outperformed the national economy. Absent any significant
deterioration in the macro-economic environment, this trend is expected to continue. Improvement in the
state’s labor market is expected to continue during 2017 with job growth projected at 1.7 percent, slightly
below the state’s long-term average. This growth is expected to cause Utah’s unemployment level to be at
3.5 percent by the end of 2017. Personal income is expected to increase by 4.4 percent in 2017, which is .7
percent higher than the anticipated U.S. increase.
Salt Lake City Airport passengers are projected to increase by 2 percent and operations are projected to
increase by 2.5 percent during FY 2018, compared to FY 2017. Flights remain fuller as airlines are
matching capacity to demand and offering additional flights which are causing an increase in the number
of passengers and daily flights. Airlines also continue to streamline costs, implement other revenue sources,
and operate more efficiently.
Current financial position, passenger statistics, and results from FY 2017 and earlier can be found in more
detail in Management’s Discussion and Analysis in this report.
Future Growth
According to the Federal Aviation Administration (FAA) Aerospace Forecast 2017-2037, as the economy
recovers from the most serious economic downturn and the slowest recovery in recent history, aviation will
continue to grow over the long run. Fundamentally, demand for aviation is driven by economic activity.
As economic growth picks up, so will growth in the aviation industry. The 2017 FAA forecast calls for
U.S. carrier passenger growth over the next 20 years to average 2.8 percent per year. For financial planning
purposes, the Salt Lake City Airport forecasts an average annual passenger growth rate of 2 percent in
future years.
Construction on the TRP is well underway. The TRP will replace terminal facilities that are over 50 years
old, require extensive maintenance, are not energy efficient and fail to meet current seismic standards. It is
expected that the TRP will achieve Leadership in Energy and Environmental Design (LEED) silver
certification as required by City ordinance. The TRP will consolidate passenger processing facilities into a
single facility to serve all concourses as well as replace the existing parking garage, construct new terminal
roadways, and a new central utility plant. Rental car services will be integrated with the new garage. A
new site for car rental operations and servicing, and a quick turn-around facility for car rentals have been
built. The planned airport will be capable of handling more passengers and aircraft. The number of parking
spaces in the garage will double from 1,770 to 3,600. The new terminal is expected to be operational by
winter/end 2020 with the entire TRP opening by 2024.
The NCP includes the development of 30 additional gates to accommodate additional passengers and
aircraft to meet forecasted growth. The first phase of the NCP, which includes 20 aircraft gate positions,
is expected to be operational by the end of 2020 with the second phase of the NCP opening by summer
2024.
In the 2017 State of Utah's Economic Report to the Governor it states that Salt Lake City is undergoing a10-year $2.9 billion remodel of the international airport that is expected to contribute $3.3 billion to theeconomy.
Awards and Acknowledgments
The Govemment Finance Officers Association of the United States and Canada (GFOA) awarded aCertificate of Achievement for Excellence in Financial Reporting to the Salt Lake City Departrnent ofAirports for its Comprehensive Annual Financial Report for the fiscal year ended June 30. 2016.
In order to be awarded a Certificate of Achievement, the Airport must publish an easily readable andefficiently organized Comprehensive Annual Financial Report, the contents of which conform to programstandards. Such reports must satisfy both Generally Accepted Accounting Principles and applicable legalrequirements.
A Cemificate of Achievement is valid for a period of one year only. We believe our current report continuesto conform to Certificate of Achievement Program requirements and we are submitting it to the GFOA todetermine its eligibility for another certificate.
The production of this report is a cooperative effort of the Finance Division of the Airport and Eide Bailly,LLP. We extend our iation to the staff for their efficient and dedicated services. we also thank thernernbers of the Ci il. the Mayor and members of the Department of Airports Advisory Board ofDi and sr-rpport in planning and conducting the financial operations of the Airporl
lve manncr.
Bill WyattSalt Lake City of AirportsExecutive Director
Salt Lake City Department of AirportsDirector of Finance

ix
ORGANIZATIONAL CHART
City of Salt Lake City, Utah
Mayor Jackie Biskupski
City Council Members District One James Rogers
District Two Andrew Johnston
District Three Stan Penfold, Chair
District Four Derek Kitchen
District Five Erin Mendenhall
District Six Charlie Luke, Vice Chair
District Seven Lisa Adams
Department of Airports
Advisory Board Members
J. T. Martin, Chair
Larry Pinnock, Vice Chair
Igor Best-Devereux
Wade B. Bitner
Michael D. Gallivan
Natalie Gochnour
Sam Granato
Karen Mayne
Cynthia D. Miller
Steve Price
James Rogers
Kim V. Rolfe
Executive Director Bill Wyatt
Directors Admin & Commercial Services John A. Buckner, Jr.
Airport Police Craig Vargo
Engineering Kevin F. Robins
Finance Ryan R. Tesch
Information Management Edwin Cherry
Maintenance Ed Clayson
Operations Peter L. Higgins
Planning & Environmental Allen G. McCandless
Public Relations/Marketing Nancy Volmer
x

FINANCIAL SECTION
THIS SECTION CONTAINS THE FOLLOWING
SUBSECTIONS:
Independent Auditor’s Report
Management’s Discussion and Analysis
Basic Financial Statements and Notes
Required Supplementary Information

www.eidebai l ly.com5 Triad Center, Ste. 600 | Salt Lake City, UT 84180-1106 | T 801.532.2200 | F 801.532.7944 | EOE
2
Independent Auditor’s Report
Honorable Mayor and City Council of Salt Lake City
Salt Lake City Department of Airports
Report on the Financial Statements
We have audited the accompanying financial statements of the Salt Lake City Department of Airports (the
“Airport”), an enterprise fund of Salt Lake City Corporation, which comprise the statements of net
position as of June 30, 2017 and 2016, and the related statements of revenues, expenses and changes in
net position and cash flows for the years then ended, and the related notes to the financial statements,
which collectively comprise the Airport’s basic financial statements as listed in the table of contents.
Management’s Responsibility for the Financial Statements Management is responsible for the preparation and fair presentation of these financial statements in
accordance with accounting principles generally accepted in the United States of America; this includes
the design, implementation, and maintenance of internal control relevant to the preparation and fair
presentation of financial statements that are free from material misstatement, whether due to fraud or
error.
Auditor’s Responsibility Our responsibility is to express an opinion on these financial statements based on our audits. We
conducted our audits in accordance with auditing standards generally accepted in the United States of
America. Those standards require that we plan and perform the audit to obtain reasonable assurance about
whether the financial statements are free from material misstatement.
An audit involves performing procedures to obtain audit evidence about the amounts and disclosures in
the financial statements. The procedures selected depend on the auditor’s judgment, including the
assessment of the risks of material misstatement of the financial statements, whether due to fraud or error.
In making those risk assessments, the auditor considers internal control relevant to the entity’s preparation
and fair presentation of the financial statements in order to design audit procedures that are appropriate in
the circumstances, but not for the purpose of expressing an opinion on the effectiveness of the entity’s
internal control. Accordingly, we express no such opinion. An audit also includes evaluating the
appropriateness of accounting policies used and the reasonableness of significant accounting estimates
made by management, as well as evaluating the overall presentation of the financial statements.
We believe that the audit evidence we have obtained is sufficient and appropriate to provide a basis for
our audit opinion.
Opinion In our opinion, the financial statements referred to above present fairly, in all material respects, the
financial position of the Airport as of June 30, 2017 and 2016, and the respective changes in its financial
position and its cash flows for the years then ended in accordance with accounting principles generally
accepted in the United States of America.
3
Emphasis of Matter
As discussed in Note 1, the financial statements of the Airport are intended to present the financial
position, the changes in financial position and cash flows of only that portion of the business-type
activities and each major fund of Salt Lake City Corporation that is attributable to the transactions of the
Airport. They do not purport to, and do not, present fairly the financial position of Salt Lake City
Corporation as of June 30, 2017 and 2016, the changes in its financial position, where applicable, its cash
flows for the years then ended in conformity with accounting principles generally accepted in the United
States of America. Our opinion is not modified with respect to this matter.
Other Matters
Required Supplementary Information
Accounting principles generally accepted in the United States of America require that the management’s
discussion and analysis and the required supplementary information identified in the table of contents be
presented to supplement the basic financial statements. Such information, although not a part of the basic
financial statements, is required by the Governmental Accounting Standards Board, who considers it to be
an essential part of financial reporting for placing the basic financial statements in an appropriate
operational, economic, or historical context. We have applied certain limited procedures to the required
supplementary information in accordance with auditing standards generally accepted in the United States
of America, which consisted of inquiries of management about the methods of preparing the information
and comparing the information for consistency with management’s responses to our inquiries, the basic
financial statements, and other knowledge we obtained during our audit of the basic financial statements.
We do not express an opinion or provide any assurance on the information because the limited procedures
do not provide us with sufficient evidence to express an opinion or provide any assurance.
Other Information
Our audit was conducted for the purpose of forming an opinion on the financial statements as a whole.
The introductory section and statistical section are presented for purposes of additional analysis and are
not a required part of the financial statements. The introductory section and statistical section have not
been subjected to the auditing procedures applied in the audit of the basic financial statements and,
accordingly, we do not express an opinion or provide any assurance on them.
Salt Lake City, Utah
December 22, 2017

SALT LAKE CITY DEPARTMENT OF AIRPORTS
Management’s Discussion and Analysis
(unaudited)
4
___________________________________________________________________
The following Management’s Discussion and Analysis (“MD&A”) of the Salt Lake City Department of
Airports’ activities and financial performance provides an introduction and overview to the financial
statements for the fiscal years ended June 30, 2017 and 2016.
The information in this MD&A has been prepared by Airport management and should be used in
combination with the accompanying financial statements and notes as well as supplemental information in
order to provide a complete understanding of the data contained in the financial statements.
FINANCIAL STATEMENTS
The Airport is an enterprise fund of Salt Lake City Corporation, but receives no state or City tax revenues.
It is instead supported by airport user charges. The Airport is responsible for the operation and maintenance
of the City’s three airports, Salt Lake City International Airport, South Valley Regional Airport, and Tooele
Valley Airport. No general tax fund revenues are used for the administration, promotion, operation or
maintenance of the airports in the system.
Financial statements are prepared on an accrual basis in accordance with generally accepted accounting
principles as set forth by the Governmental Accounting Standards Board (“GASB”). Revenues and
expenses are recorded when earned and incurred, not when received or paid, with the exception of passenger
facility charge revenues (“PFCs”) that are recorded when received based upon twelve full months of
revenue. Capital assets, except land and construction in progress, are depreciated over their useful lives.
See the notes to the financial statements for significant accounting policies.
FINANCIAL & OPERATIONAL HIGHLIGHTS
The Salt Lake City International Airport serves the Salt Lake City metropolitan area as well as the
surrounding areas of Utah, Idaho, Colorado, Nevada, and Wyoming. The Airport functions as one of
Delta’s largest hubs. According to Airports Council International data, the Airport ranks as the 25th busiest
in the United States and the 87th busiest in the world in terms of passenger numbers. In terms of operational
movements, the Airport ranks 22nd busiest in the United States and 45th busiest in the world.
The Airport has experienced several years of growth in total passenger numbers. In FY 2017, FY 2016 and
FY 2015, the economy and the airline industry continued to grow. Total passengers increased by 1.1
million, 921 thousand and 1.1 million in FY 2017, FY 2016 and FY 2015, respectively, to a total of 23.7
million, 22.6 million and 21.7 million passengers. Enplaned passengers alone increased by 557 thousand,
459 thousand and 539 thousand in FY 2017, FY 2016 and FY 2015 to a total of 11.9 million, 11.3 million
and 10.8 million enplaned passengers, respectively; a 4.9%, 4.2% and 5.3% increase in FY 2017, FY 2016
and FY 2015.
SALT LAKE CITY DEPARTMENT OF AIRPORTS
Management’s Discussion and Analysis
(unaudited)
5
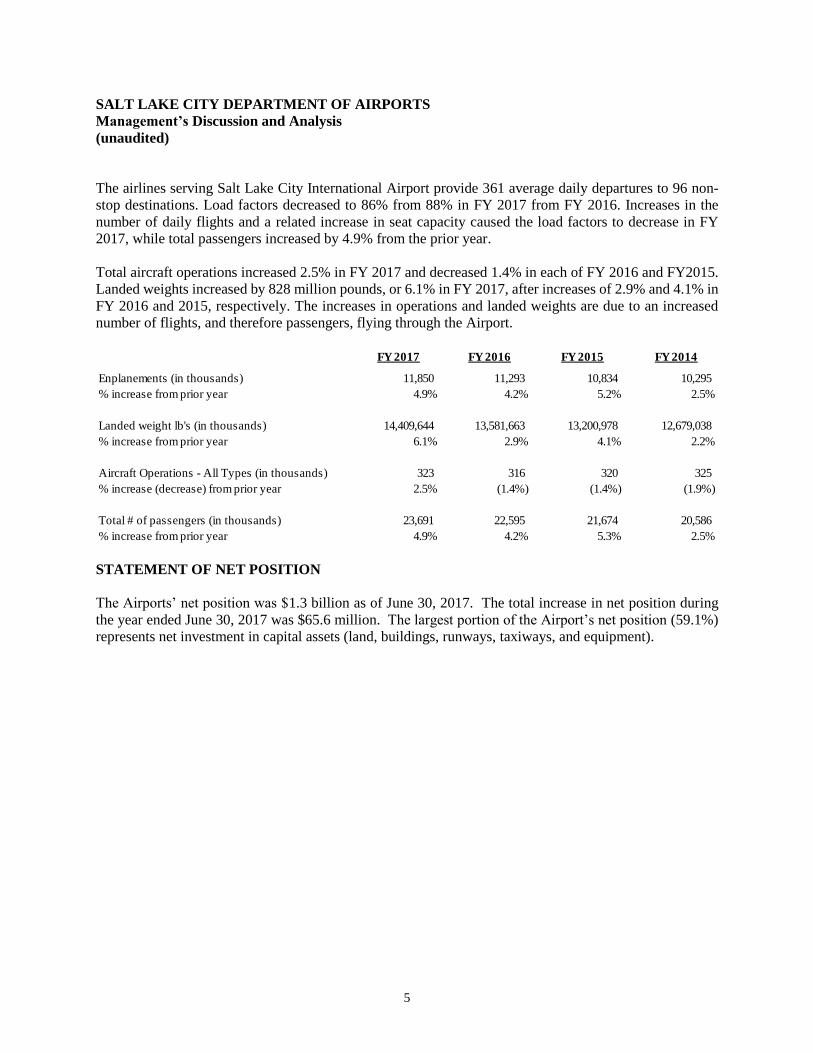
The airlines serving Salt Lake City International Airport provide 361 average daily departures to 96 non-
stop destinations. Load factors decreased to 86% from 88% in FY 2017 from FY 2016. Increases in the
number of daily flights and a related increase in seat capacity caused the load factors to decrease in FY
2017, while total passengers increased by 4.9% from the prior year.
Total aircraft operations increased 2.5% in FY 2017 and decreased 1.4% in each of FY 2016 and FY2015.
Landed weights increased by 828 million pounds, or 6.1% in FY 2017, after increases of 2.9% and 4.1% in
FY 2016 and 2015, respectively. The increases in operations and landed weights are due to an increased
number of flights, and therefore passengers, flying through the Airport.
STATEMENT OF NET POSITION
The Airports’ net position was $1.3 billion as of June 30, 2017. The total increase in net position during
the year ended June 30, 2017 was $65.6 million. The largest portion of the Airport’s net position (59.1%)
represents net investment in capital assets (land, buildings, runways, taxiways, and equipment).
FY 2017 FY 2016 FY 2015 FY 2014
Enplanements (in thousands) 11,850 11,293 10,834 10,295
% increase from prior year 4.9% 4.2% 5.2% 2.5%
Landed weight lb's (in thousands) 14,409,644 13,581,663 13,200,978 12,679,038
% increase from prior year 6.1% 2.9% 4.1% 2.2%
Aircraft Operations - All Types (in thousands) 323 316 320 325
% increase (decrease) from prior year 2.5% (1.4%) (1.4%) (1.9%)
Total # of passengers (in thousands) 23,691 22,595 21,674 20,586
% increase from prior year 4.9% 4.2% 5.3% 2.5%

SALT LAKE CITY DEPARTMENT OF AIRPORTS
Management’s Discussion and Analysis
(unaudited)
6
(Amounts in thousands) June 30, June 30, June 30,
STATEMENTS OF NET POSITION 2017 2016 2015
ASSETS:
Current and other assets 1,411,670$ 416,234$ 452,436$
Capital assets 1,114,398 869,232 779,343
TOTAL ASSETS 2,526,068 1,285,466 1,231,779
DEFERRED OUTFLOWS 11,948 10,181 3,566
TOTAL ASSETS AND DEFERRED OUTFLOWS 2,538,016 1,295,647 1,235,345
LIABILITIES:
Current liabilities 78,462 34,375 48,887
Noncurrent liabilities 1,165,104 33,200 26,348
TOTAL LIABILITIES 1,243,566 67,575 75,235
DEFERRED INFLOWS 6,641 5,838 2,129
TOTAL LIABILITIES AND DEFERRED INFLOWS 1,250,207 73,413 77,364
NET POSITION:
Invested in capital assets 761,198 869,232 779,343
Restricted
Capital Projects 189,115 143,297 196,439
Debt Service 240,783 - -
Unrestricted 96,713 209,705 182,199
Total Net Position 1,287,809 1,222,234 1,157,981
TOTAL LIABILITIES, DEFERRED INFLOWS, AND NET POSITION 2,538,016$ 1,295,647$ 1,235,345$
SUMMARY OF CHANGES IN NET POSITION FY 2017 FY 2016 FY 2015
Operating revenues 154,806$ 141,033$ 132,270$
Operating expenses (99,459) (90,065) (76,209)
Operating Income before depreciation 55,347 50,968 56,061
Depreciation (63,665) (61,657) (59,995)
Operating loss (8,318) (10,689) (3,934)
NON-OPERATING REVENUES (EXPENSES)
AND CAPITAL CONTRIBUTIONS:
Passenger facility charges 45,750 42,804 40,977
Customer facility charges 16,157 15,613 15,607
Contributions and grants 17,794 14,230 15,148
Interest expense (14,480) - -
Other, net 8,673 2,295 1,513
CHANGE IN NET POSITION 65,576$ 64,253$ 69,311$
SALT LAKE CITY DEPARTMENT OF AIRPORTS
Management’s Discussion and Analysis
(unaudited)
7
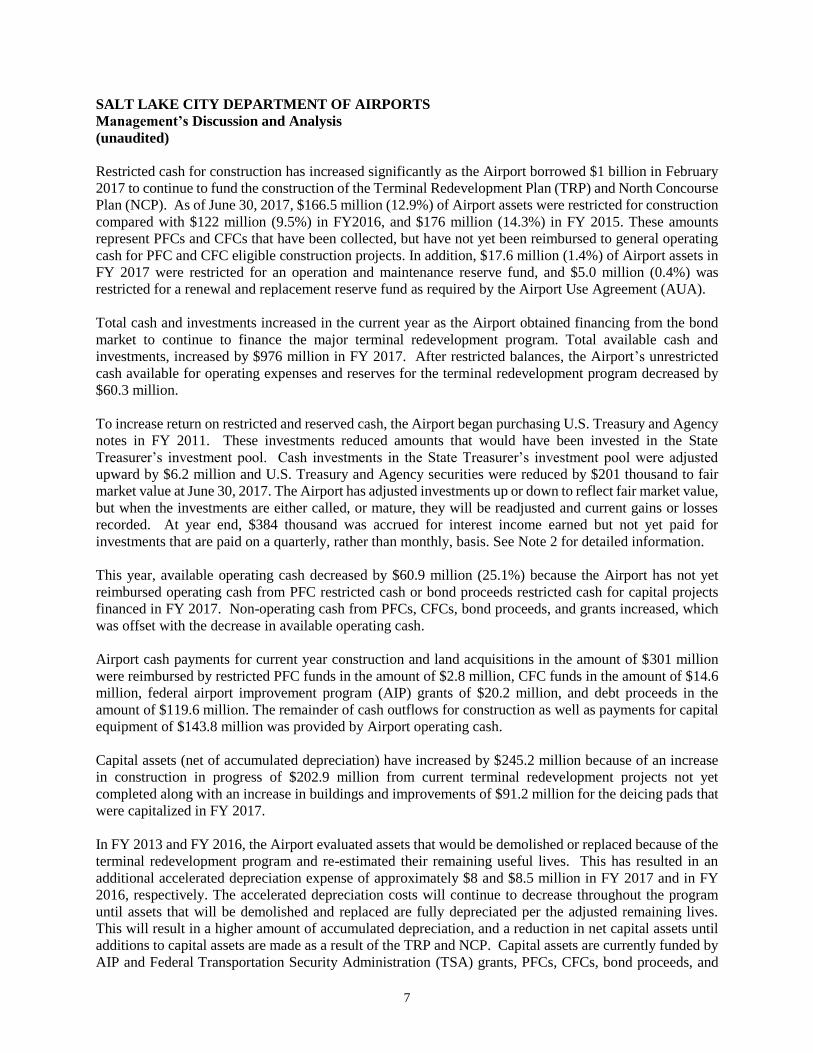
Restricted cash for construction has increased significantly as the Airport borrowed $1 billion in February
2017 to continue to fund the construction of the Terminal Redevelopment Plan (TRP) and North Concourse
Plan (NCP). As of June 30, 2017, $166.5 million (12.9%) of Airport assets were restricted for construction
compared with $122 million (9.5%) in FY2016, and $176 million (14.3%) in FY 2015. These amounts
represent PFCs and CFCs that have been collected, but have not yet been reimbursed to general operating
cash for PFC and CFC eligible construction projects. In addition, $17.6 million (1.4%) of Airport assets in
FY 2017 were restricted for an operation and maintenance reserve fund, and $5.0 million (0.4%) was
restricted for a renewal and replacement reserve fund as required by the Airport Use Agreement (AUA).
Total cash and investments increased in the current year as the Airport obtained financing from the bond
market to continue to finance the major terminal redevelopment program. Total available cash and
investments, increased by $976 million in FY 2017. After restricted balances, the Airport’s unrestricted
cash available for operating expenses and reserves for the terminal redevelopment program decreased by
$60.3 million.
To increase return on restricted and reserved cash, the Airport began purchasing U.S. Treasury and Agency
notes in FY 2011. These investments reduced amounts that would have been invested in the State
Treasurer’s investment pool. Cash investments in the State Treasurer’s investment pool were adjusted
upward by $6.2 million and U.S. Treasury and Agency securities were reduced by $201 thousand to fair
market value at June 30, 2017. The Airport has adjusted investments up or down to reflect fair market value,
but when the investments are either called, or mature, they will be readjusted and current gains or losses
recorded. At year end, $384 thousand was accrued for interest income earned but not yet paid for
investments that are paid on a quarterly, rather than monthly, basis. See Note 2 for detailed information.
This year, available operating cash decreased by $60.9 million (25.1%) because the Airport has not yet
reimbursed operating cash from PFC restricted cash or bond proceeds restricted cash for capital projects
financed in FY 2017. Non-operating cash from PFCs, CFCs, bond proceeds, and grants increased, which
was offset with the decrease in available operating cash.
Airport cash payments for current year construction and land acquisitions in the amount of $301 million
were reimbursed by restricted PFC funds in the amount of $2.8 million, CFC funds in the amount of $14.6
million, federal airport improvement program (AIP) grants of $20.2 million, and debt proceeds in the
amount of $119.6 million. The remainder of cash outflows for construction as well as payments for capital
equipment of $143.8 million was provided by Airport operating cash.
Capital assets (net of accumulated depreciation) have increased by $245.2 million because of an increase
in construction in progress of $202.9 million from current terminal redevelopment projects not yet
completed along with an increase in buildings and improvements of $91.2 million for the deicing pads that
were capitalized in FY 2017.
In FY 2013 and FY 2016, the Airport evaluated assets that would be demolished or replaced because of the
terminal redevelopment program and re-estimated their remaining useful lives. This has resulted in an
additional accelerated depreciation expense of approximately $8 and $8.5 million in FY 2017 and in FY
2016, respectively. The accelerated depreciation costs will continue to decrease throughout the program
until assets that will be demolished and replaced are fully depreciated per the adjusted remaining lives.
This will result in a higher amount of accumulated depreciation, and a reduction in net capital assets until
additions to capital assets are made as a result of the TRP and NCP. Capital assets are currently funded by
AIP and Federal Transportation Security Administration (TSA) grants, PFCs, CFCs, bond proceeds, and
SALT LAKE CITY DEPARTMENT OF AIRPORTS
Management’s Discussion and Analysis
(unaudited)
8
Airport funds. For more detailed information on changes in capital assets, refer to Note 4 in the notes to
the financial statements.
The Airport adopted GASB Statement No. 68, Accounting and Financial Reporting for Pensions in FY
2015. The Airport recorded deferred outflows of $1.8 million in FY 2017 which increased deferred
outflows to $11.9 million, which represents deferred outflow of resources (expenses) related to pensions in
future periods. The Airport also recorded deferred inflows of $774 thousand in FY 2017 which increased
deferred inflows to $6.6, million which represents resources (revenues) that will be recognized in future
periods.
(amounts in thousands)
STATEMENT OF REVENUES, EXPENSES AND CHANGES IN NET POSITION
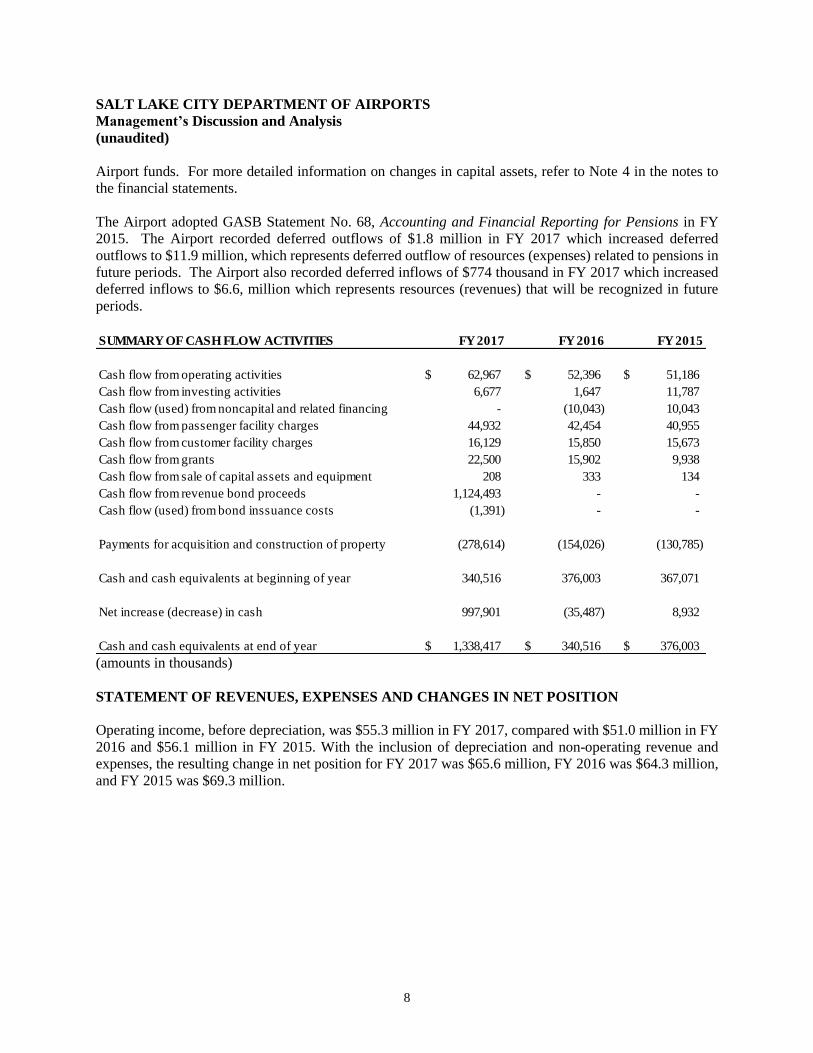
Operating income, before depreciation, was $55.3 million in FY 2017, compared with $51.0 million in FY
2016 and $56.1 million in FY 2015. With the inclusion of depreciation and non-operating revenue and
expenses, the resulting change in net position for FY 2017 was $65.6 million, FY 2016 was $64.3 million,
and FY 2015 was $69.3 million.
FY 2017 FY 2016 FY 2015
Cash flow from operating activities 62,967$ 52,396$ 51,186$
Cash flow from investing activities 6,677 1,647 11,787
Cash flow (used) from noncapital and related financing - (10,043) 10,043
Cash flow from passenger facility charges 44,932 42,454 40,955
Cash flow from customer facility charges 16,129 15,850 15,673
Cash flow from grants 22,500 15,902 9,938
Cash flow from sale of capital assets and equipment 208 333 134
Cash flow from revenue bond proceeds 1,124,493 - -
Cash flow (used) from bond inssuance costs (1,391) - -
Payments for acquisition and construction of property (278,614) (154,026) (130,785)
Cash and cash equivalents at beginning of year 340,516 376,003 367,071
Net increase (decrease) in cash 997,901 (35,487) 8,932
Cash and cash equivalents at end of year 1,338,417$ 340,516$ 376,003$
SUMMARY OF CASH FLOW ACTIVITIES

SALT LAKE CITY DEPARTMENT OF AIRPORTS
Management’s Discussion and Analysis
(unaudited)
9
Revenues
The following chart and table shows the major sources of revenues and the percentage to total revenues for
the year ended June 30, 2017:
Airline Revenue, 22%
Terminal Concessions, 7.4%
Landside Concessions, 26.1%
Lease Revenue, 2.8%
General Aviation, 0.9%
State Aviation Tax, 1.2%
Other, 2.3%
Passenger facility charges, 18.5%
Customer facility charges, 6.6%
Interest income, 3.3%
Investment fair market adjustment, 1.7% Contributions & grants,
7.2%
FY 2017 Percent FY 2016 Percent FY 2015 Percent
(Amounts in thousands) Amount of Total Amount of Total Amount of Total
Operating revenues:
Airline revenue 66,639$ 27.0% 62,454$ 28.9% 59,420$ 28.9%
Terminal concessions 18,120 7.3% 16,637 7.7% 16,016 7.8%
Landside concessions 64,408 26.1% 57,986 26.8% 52,550 25.6%
Lease revenue 6,927 2.8% 6,185 2.9% 6,093 3.0%
General aviation 2,334 0.9% 1,785 0.8% 1,691 0.8%
State aviation tax 2,983 1.2% 2,796 1.3% 2,545 1.2%
Other 5,564 2.3% 4,131 1.9% 3,894 1.9%
Operating revenues 166,975 151,974 142,209
Less: Airline revenue sharing (12,169) -4.9% (10,941) -5.1% (9,939) -4.8%
Total operating revenues 154,806 62.8% 141,033 65.3% 132,270 64.4%
Non-operating revenues and capital contributions:
Passenger facility charges 45,750 18.4% 42,804 19.8% 40,977 19.9%
Customer facility charges 16,157 6.6% 15,613 7.2% 15,607 7.6%
Interest income 8,006 3.2% 2,783 1.3% 1,789 0.9%
Investment fair market adjustment 4,146 1.7% (0) 0.0% 276 0.1%
Contributions & grants 17,794 7.2% 14,230 6.6% 15,148 7.4%
Loss on sale or disposition of assets (26) 0.0% (488) -0.2% (551) -0.3%
Total non-operating revenues 91,827 37.2% 74,942 34.7% 73,244 35.6%
Total revenues 246,633$ 100.0% 215,975$ 100.0% 205,514$ 100.0%
SALT LAKE CITY DEPARTMENT OF AIRPORTS
Management’s Discussion and Analysis
(unaudited)
10
Operating Revenues
Salt Lake City International Airport is served by seven domestic carriers: Alaska, American, Delta,
Frontier, JetBlue, Southwest, and United. On July 1, 2014, the airlines and the Airport entered into a ten
year Airport Use Agreement (AUA). Under the agreement, terminal rent calculations are on a compensatory
basis, recovering costs allocated to the occupied facilities. Landing fee calculations are residual based,
recovering net cost after the credits of nonairline revenue. Revenue sharing is available to signatory airlines
under the agreement consisting of one dollar ($1) per enplaned passenger, not to exceed 30% of net
remaining revenue. The signatory airline revenue sharing increased by $1.3 million over the prior year from
$10.9 million in FY 2016 to $12.2 million in FY 2017 due to increased enplaned passengers in FY 2017.
Airline revenue, net of airline revenue sharing, increased $3.0 million in FY 2017 over the prior year.
Landing fees increased by $3.0 million and terminal space and other building rentals increased by $47
thousand compared to the prior fiscal year. The Airport continues its efforts to keep airline costs low. The
Airport’s cost per enplaned passenger (CPE) for FY 2017 was $3.53, a decrease from the FY 2016 CPE of
$3.69.
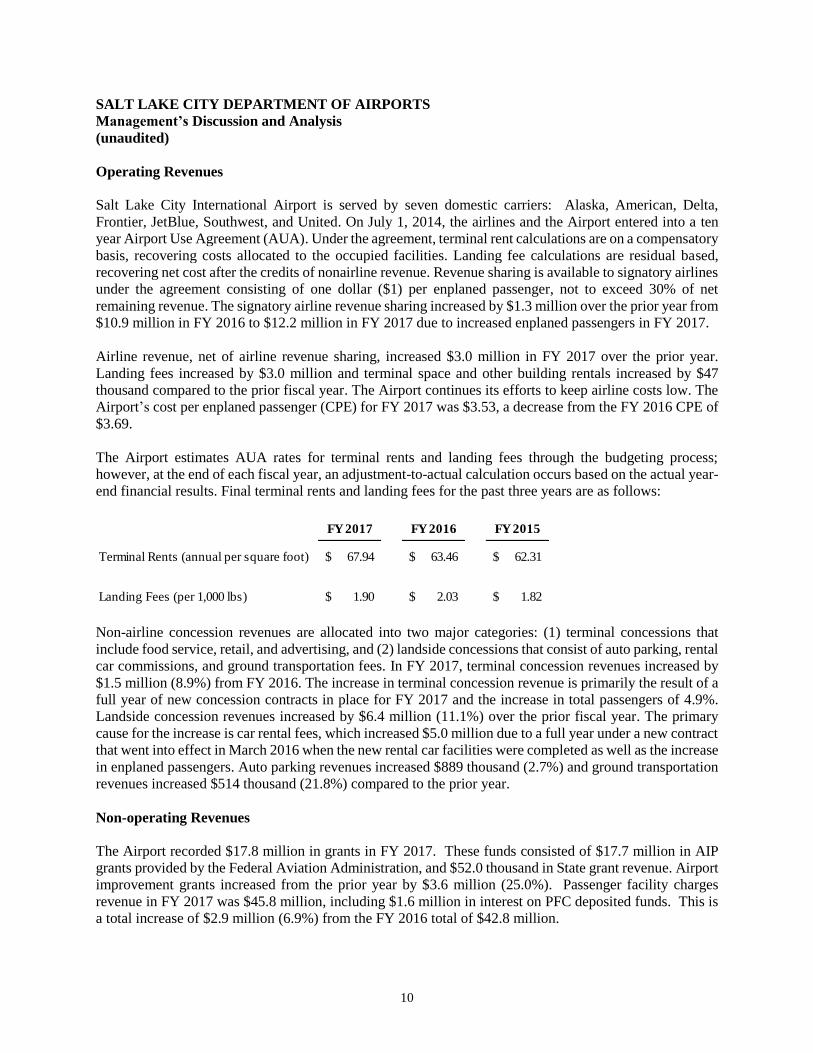
The Airport estimates AUA rates for terminal rents and landing fees through the budgeting process;
however, at the end of each fiscal year, an adjustment-to-actual calculation occurs based on the actual year-
end financial results. Final terminal rents and landing fees for the past three years are as follows:
Non-airline concession revenues are allocated into two major categories: (1) terminal concessions that
include food service, retail, and advertising, and (2) landside concessions that consist of auto parking, rental
car commissions, and ground transportation fees. In FY 2017, terminal concession revenues increased by
$1.5 million (8.9%) from FY 2016. The increase in terminal concession revenue is primarily the result of a
full year of new concession contracts in place for FY 2017 and the increase in total passengers of 4.9%.
Landside concession revenues increased by $6.4 million (11.1%) over the prior fiscal year. The primary
cause for the increase is car rental fees, which increased $5.0 million due to a full year under a new contract
that went into effect in March 2016 when the new rental car facilities were completed as well as the increase
in enplaned passengers. Auto parking revenues increased $889 thousand (2.7%) and ground transportation
revenues increased $514 thousand (21.8%) compared to the prior year.
Non-operating Revenues
The Airport recorded $17.8 million in grants in FY 2017. These funds consisted of $17.7 million in AIP
grants provided by the Federal Aviation Administration, and $52.0 thousand in State grant revenue. Airport
improvement grants increased from the prior year by $3.6 million (25.0%). Passenger facility charges
revenue in FY 2017 was $45.8 million, including $1.6 million in interest on PFC deposited funds. This is
a total increase of $2.9 million (6.9%) from the FY 2016 total of $42.8 million.
FY 2017 FY 2016 FY 2015
Terminal Rents (annual per square foot) 67.94$ 63.46$ 62.31$
Landing Fees (per 1,000 lbs) 1.90$ 2.03$ 1.82$

SALT LAKE CITY DEPARTMENT OF AIRPORTS
Management’s Discussion and Analysis
(unaudited)
11
The Airport recorded a loss of $26 thousand on the disposition and sale of property and equipment in FY
2017. In FY 2016, the loss on the disposition and sale of property and equipment was $488 thousand.
The average interest rate on investments that were held in the State Treasurer’s pool for FY 2017 was 1.1%,
compared to FY 2016 of 0.7% and 0.5% in FY 2015. In FY 2017, FY 2016, and FY 2015 interest earned
from the State Treasurer’s pool and depository accounts totaled $6.5 million, $1.6 million, and $1.3, million
respectively. Interest income increased because of higher balances in the State Treasurer’s pool, as the bond
proceeds were invested into the pool, as well as increasing interest rates from the Federal Reserve. As
referred to previously in the discussion on the Airport’s cash balances, beginning in FY 2011, the Airport
diversified its investments in U.S. Treasury and Agency notes to obtain a higher rate of return. Interest
earned on these investments totaled $492 thousand in FY 2017 and $466 thousand in FY 2016 (after
management fees). The weighted average yield, including discounts and premiums included at purchase,
was 1.02%. The investment in these securities reduced the balance in the Utah State Treasurer’s pool. See
Note 2 for cash investment details. The Airport recorded $972 thousand in FY 2017 and $730 thousand in
FY 2016 of interest income from financing CFC related projects from Airport reserves that will be paid
back to the Airport through future CFC collections.
Expenses
A chart and summary of expenses for the year ended June 30, 2017, including the amount and percentage
of change in relation to prior year amounts, is as follows:
Personnel services
30.3%
Operating &
maintenance
7.2%Charges/services/fees
23.5%
Depreciation
39.0%

SALT LAKE CITY DEPARTMENT OF AIRPORTS
Management’s Discussion and Analysis
(unaudited)
12
Operating Expenses
Operating expenses before depreciation have increased by $9.4 million (10.4%) in the current fiscal year.
These expenses increased by $13.9 million (18.2%) in FY 2016, and decreased by $11.4 million (-13.0%)
in FY 2015. Personnel services have increased by $4.2 million (9.4%) in the current fiscal year. Most of
this increase is related to increases in pension expense.
Operating and maintenance costs have increased by $785 thousand (7.2%) from prior year. Maintenance
supplies have increased by $83 thousand (1.1%), mainly due to painting and electrical supplies to enhance
the airfield and replace airfield lighting to accommodate FAA standards. Automotive supplies increased
$428 thousand (21.8%) compared to FY 2016, mostly because of an increase in fuel purchases at South
Valley Regional Airport, where the Airport is now the acting Fixed Based Operator (FBO). Other supplies
including computer supplies, small tools, and furniture have increased by $274 thousand (19.0%). This
increase is caused by increased purchases of computer supplies and software and small tools by $200
thousand with minor increases in other areas to accommodate the increased passengers at the Airport.
Expenses for charges and services have increased by $4.4 million (12.8%). The largest increase was $1.6
million from the expansion of the Airport’s parking lot shuttle programs. The expansion began in January
of FY 2016. Other professional and technical services increased $955 thousand because the Airport
expensed costs that had been capitalized in construction in progress in prior years because certain projects
were discontinued or the asset was determined to relate to routine maintenance rather than a capital asset.
Aircraft Rescue Fire Fighting (ARFF) services have also increased $289 thousand based on more classes
being offered, but less fire fighters being trained in the current year.
Depreciation expense increased by $2.0 million (3.3%) in FY 2017, increased by $1.7 million in FY 2016,
and increased by $968 thousand in FY 2015. In FY 2013 and FY 2016, the Airport evaluated assets that
would be demolished or replaced because of the TRP and updated the estimate of their remaining useful
lives. This resulted in additional depreciation expense in FY 2014, FY 2015, FY 2016, and FY 2017 and
will continue in varying amounts throughout the TRP as assets being replaced are fully depreciated over
shorter remaining useful lives.
NONOPERATING EXPENSES
Nonoperating expenses consist primarily of interest on long-term debt. Interest expense was $14.5 million
in FY 2017. This amount is net of any capitalized interest which is recorded in the Airport’s capital assets
as part of construction in process. There was no interest expense in FY 2016 and FY 2015 as the Airport
had no outstanding debt during these years.
Percent Percent Percent
(Amounts in thousands) FY 2017 of Total FY 2016 of Total FY 2015 of Total
Operating:
Personnel services 49,350$ 30.3% 45,096$ 29.7% 33,880$ 24.9%
Operating and maintenance 11,725 7.2% 10,940 7.2% 9,487 7.0%
Charges/services/fees 38,384 23.5% 34,029 22.4% 32,842 24.1%
Total operating expenses before depreciation 99,459 61.0% 90,065 59.3% 76,209 56.0%
Depreciation 63,665 39.0% 61,657 40.7% 59,995 44.0%
Total operating expenses 163,124$ 100.0% 151,722$ 100.0% 136,204$ 100.0%

SALT LAKE CITY DEPARTMENT OF AIRPORTSManagement's Discussion and Analysis(unaudited)
CAPITAL TRANSACTIONS
TRP activities for FY 201 7 included the completion of the park and wait lot and the rrajority of the enablingwork for the terntinal, south concolrrse west. parking deck and central utility plant. Construction activityincluded concrete pours of basement floor and rvalls of the terminal and tunnel, concrete slab pours for thecerrtral utility plant and south concoLlrse west, column pours, pile cap and grade beanr lvork on the parkingdeck and structural steel erection on the south concourse west.
NCP activities inclLrded design initiation, construction rranager at risk procllrement, contract negotiation,and preconstruction services including cost estimating and constructability studies. Construction activifyon the NCP is expected to corrrnence in FY 2018.
Otlrer projects completed in FY 2017 include two additionaldeicing pads, glycol system diversion valves,reconstruction of the pavetnetrt orr Taxi'uvay S, replacernent of the rnast lighting on the aprons, sllowcltemical storage building, and the replacement of a boiler. roof replacements, restroom relovationsthroughout the Airport carnpus as rvell as airfield lighting improvements.
At the beginning of the fiscal year, Airport projects totaling $219.6 rnillion were in the process ofconstruction. A total of $102 nrillion in projects and eqLriprnent lvere capitalized and placed in service in2017. $5.7 million was expensed, and 5422.5 million remair.rs in construction in progress. The largestportion of the $422.5 million of construction in progress is related to the TRP. The phased constlrction onthe TRP and NCP programs is planrrecl to continue throLrgh 2024. The terminal bLrilding is planned to becornpleted in 2020. Additional informatiorr regardirrg capital assets can be foLrnd irr note 4 in the Notes toFinancial Staternents.
LONG-TERM DEBT
AsofJune30,20lT,theAirporthadatotalof$l.lbillionoLrtstandinginGeneralAirportRevenueBonds.These bonds mature from July 1,2021to July 1,2047 and bear interest at the rate of 5oh per year. Thebonds do not constitute debt of the City or a pledge of tlre full faith and credit of the City. Additionalinformation regarding long-term debt can be found in note 8 in the Notes to Financial Statements.
CONCLUSION
The Airport continues to meet the challenges of a continually changing air travel industry that is respondingto current national and local economic conditions. While meeting these challenges, the Airport maintainsits mission of managing, developing and promoting airports that provide quality transportation facilitiesand services, and a convenient travel experience. These facilities and services promote economicdevelopment by providing business and leisure travelers' access to numerous domestic and internationaldestinations.
Ryan R Tesch, CPADirector of Finance

SALT LAKE CITY DEPARTMENT OF AIRPORTS
Statements of Net Position
(Amounts in Thousands)
See Notes to Financial Statements
14
June 30, 2017 2016
ASSETS
Current Assets
Cash and cash equivalents 136,907$ 197,218$
Restricted cash and cash equivalents 21,093 -
Investments 12,014 752
Airline and rental fees receivable 22,003 23,822
Other assets 4,583 4,205
Total current assets 196,600 225,997
Noncurrent Assets
Restricted cash and cash equivalents 1,180,417 143,298
Investments 32,650 44,527
Other assets 2,003 2,412
Total noncurrent assets and investments 1,215,070 190,237
Capital assets
Land 104,590 99,347
Buildings and improvements 1,369,273 1,278,012
Equipment 141,313 139,679
Construction in progress 422,505 219,613
Total capital assets - at cost 2,037,681 1,736,651
Less accumulated depreciation 923,283 867,419
Net capital assets 1,114,398 869,232
Total noncurrent assets 2,329,468 1,059,469
Total Assets 2,526,068 1,285,466
Deferred Outflows of Resources 11,948 10,181
Total Assets and Deferred Ouflows of Resources 2,538,016$ 1,295,647$

SALT LAKE CITY DEPARTMENT OF AIRPORTS
Statements of Net Position
(Amounts in Thousands)
See Notes to Financial Statements
15
June 30, 2017 2016
LIABILITIES
Current Liabilities
Accounts payable 36,458$ 6,874$
Accrued compensation 2,647 2,454
Interest payable 17,778 -
Other accrued liabilities 21,374 24,668
Deposits and advance rentals 205 379
Total current liabilities 78,462 34,375
Noncurrent Liabilities
Revenue bonds payable 1,124,812 -
Accrued compensation 3,790 3,629
Net pension liability 27,424 25,465
Other accrued liabilities 9,078 4,106
Total noncurrent liabilities 1,165,104 33,200
Total Liabilities 1,243,566 67,575
Deferred Inflows of Resources 6,641 5,838
NET POSITION
Net investment in capital assets 761,198 869,232
Restricted for
Capital projects 189,115 143,297
Debt service 240,783 -
Unrestricted 96,713 209,705
Net Position 1,287,809 1,222,234
Total Liabilities, Deferred Inflows of Resources, and Net Position 2,538,016$ 1,295,647$

SALT LAKE CITY DEPARTMENT OF AIRPORTS
Statements of Revenues, Expenses, and Changes in Net Position
(Amounts in Thousands)
See Notes to Financial Statements
16
For the years ended June 30, 2017 2016
Operating Revenues
Airline revenues 66,639$ 62,454$
Terminal concessions 18,120 16,637
Landside concessions 64,408 57,986
Lease revenue 6,927 6,185
General aviation 2,334 1,785
State aviation tax 2,983 2,796
Other revenue 5,564 4,131
Operating revenues 166,975 151,974
Less airline revenue sharing (12,169) (10,941)
Total operating revenues 154,806 141,033
Operating Expenses
Salaries and benefits 49,350 45,096
Materials and supplies 11,725 10,940
Maintenance contracts 8,399 8,202
Charges and services 13,730 10,484
Utilities 6,317 6,539
Intra-governmental 6,339 6,043
Other expense 3,599 2,761
Total operating expenses before depreciation 99,459 90,065
Operating Income Before Depreciation 55,347 50,968
Depreciation Expense 63,665 61,657
Operating Loss (8,318) (10,689)
Non-Operating Revenues (Expenses)
Passenger facility charges 45,750 42,804
Customer facility charges 16,157 15,613
Interest income 8,006 2,783
Interest expense (14,480) -
Bond issuance costs (3,454) -
Net increase in the fair value of investments 4,146 -
Loss on disposition of property and equipment (26) (488)
Net non-operating income 56,099 60,712
Contributition and Grants 17,794 14,230
Net Position
Increase in net position 65,575 64,253
Net Position, beginning of period 1,222,234 1,157,981
Net Position, end of period 1,287,809$ 1,222,234$

SALT LAKE CITY DEPARTMENT OF AIRPORTS
Statements of Cash Flows
(Amounts in Thousands)
See Notes to Financial Statements
17
For the years ended June 30, 2017 2016
Cash Flows from Operating Activities
Cash received from providing services 156,314$ 145,959$
Cash paid for services for intra-governmental charges (7,247) (7,043)
Cash paid to suppliers (37,228) (39,744)
Cash paid to employees (48,872) (46,776)
Net cash from operating activities 62,967 52,396
Cash Flows from Investing Activities
Cash paid for investments (13,627) (13,460)
Cash proceeds from investments 13,621 13,423
Interest received on investments 6,683 1,684
Net cash from investing activities 6,677 1,647
Cash Flows from Noncapital and Related Financing Activities
Cash overdraft with Salt Lake City Corporation pooled cash account - (10,043)
Net cash used for noncapital and related financing activities - (10,043)
Cash Flows from Capital and Related Financing Activities
Purchase of capital equipment (6,861) (7,185)
Payments for acquisition and construction of capital assets (271,753) (146,841)
Proceeds from issuance of revenue bonds payable 1,124,493 -
Bond issuance costs (1,391) -
Passenger facility charges 44,932 42,454
Customer facility charges 16,129 15,850
Proceeds from sale of capital assets and equipment 208 333
Contributions and grants 22,500 15,902
Net cash received and (used) for capital and related financing activities 928,257 (79,487)
Net Increase (Decrease) in Cash and Cash Equivalents 997,901 (35,487)
Cash and Cash Equivalents - Beginning of Year 340,516 376,003
Cash and Cash Equivalents - End of Year 1,338,417$ 340,516$
SALT LAKE CITY DEPARTMENT OF AIRPORTS
Statements of Cash Flows
(Amounts in Thousands)
See Notes to Financial Statements
18
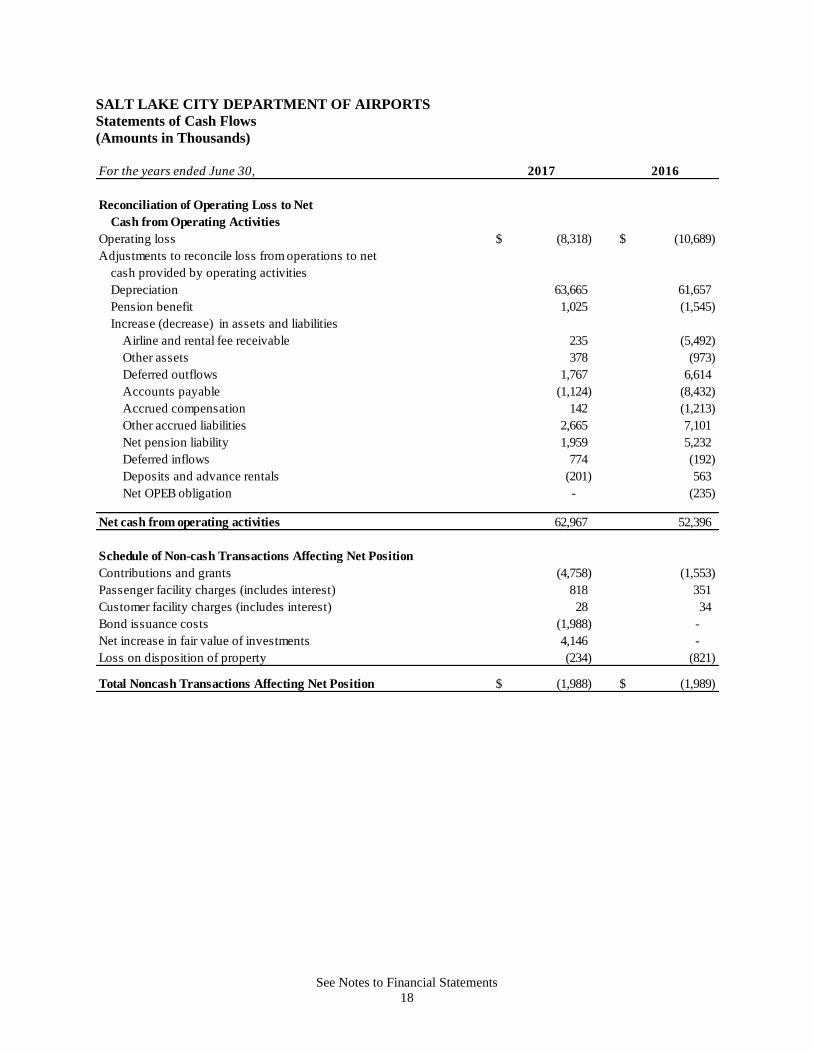
For the years ended June 30, 2017 2016
Reconciliation of Operating Loss to Net
Cash from Operating Activities
Operating loss (8,318)$ (10,689)$
Adjustments to reconcile loss from operations to net
cash provided by operating activities
Depreciation 63,665 61,657
Pension benefit 1,025 (1,545)
Increase (decrease) in assets and liabilities
Airline and rental fee receivable 235 (5,492)
Other assets 378 (973)
Deferred outflows 1,767 6,614
Accounts payable (1,124) (8,432)
Accrued compensation 142 (1,213)
Other accrued liabilities 2,665 7,101
Net pension liability 1,959 5,232
Deferred inflows 774 (192)
Deposits and advance rentals (201) 563
Net OPEB obligation - (235)
Net cash from operating activities 62,967 52,396
Schedule of Non-cash Transactions Affecting Net Position
Contributions and grants (4,758) (1,553)
Passenger facility charges (includes interest) 818 351
Customer facility charges (includes interest) 28 34
Bond issuance costs (1,988) -
Net increase in fair value of investments 4,146 -
Loss on disposition of property (234) (821)
Total Noncash Transactions Affecting Net Position (1,988)$ (1,989)$

SALT LAKE CITY DEPARTMENT OF AIRPORTS
Notes to the Financial Statements
For the Years Ended June 30, 2017 and 2016
19
NOTE 1 – ORGANIZATION AND SUMMARY OF SIGNIFICANT ACCOUNTING POLICIES
Organization – The Salt Lake City Department of Airports (Airport) is an enterprise fund of Salt Lake City
Corporation (City). Airport operations include Salt Lake City International Airport, South Valley Regional
Airport and Tooele Valley Airport.
Basis of Accounting – The accompanying financial statements have been prepared in conformity with
generally accepted accounting principles (GAAP) as applied to governmental units. The Governmental
Accounting Standards Board (GASB) is the accepted standard-setting body for establishing governmental
accounting and financial reporting principles.
The Airport’s activities are accounted for in a manner similar to those often found in the private sector using
the flow of economic resources measurement focus and the accrual basis of accounting. All assets,
liabilities, net position, revenues and expenses are accounted for through a single enterprise fund with
revenues recorded when earned and expenses recorded at the time liabilities are incurred.
In accordance with the provisions of GASB Statement No. 51, Accounting and Financial Reporting for
Intangible Assets, the Airport has identified intangible assets consisting of aviation easements and water
rights with indefinite lives that have been classified as non-amortized capital assets.
Annual Appropriated Budget – The Airport has a legally adopted annual budget which is not required to
be reported.
Capital Assets – Capital assets, which consist of property and equipment, are recorded at cost when
purchased. Cash outflows for the acquisition, construction, or equipping of capital projects, together with
related design, architectural, and engineering fees, are capitalized with a capitalization threshold of $5,000.
Depreciation of capital assets is computed using the straight-line method over the following estimated
useful lives:
Years
Buildings 10-50
Improvements 10-40
Equipment 3-20
No depreciation is provided on construction in progress until construction is complete and the asset is placed
in service. In FY 2013 and FY 2016, the Airport changed the estimated lives of some existing buildings,
improvements, and other assets to reflect the demolition schedule of the terminal redevelopment program
(TRP), resulting in shorter lives and additional annual depreciation expense. This increase in depreciation
expense continued in FY 2017, and will continue until those assets are fully depreciated or demolished.
Capital Contributions – The Airport has received contributions and grants for aid in construction from
various sources, principally from the Federal Airport Improvement Program (AIP). Contributions and
grants received for construction projects are recorded on an accrual basis as capital contributions. All other
contributions and grants received for operating expenses are recorded as operating revenue.
20
Passenger Facility Charges – The Airport has received approval from the Federal Aviation Administration
(FAA) to impose a passenger facility charge (PFC) of up to $4.50 for each enplaned passenger that utilizes
the Salt Lake International Airport. The charge is collected by all carriers and remitted to the Airport, less
an $0.11 per passenger handling fee. The proceeds from PFCs are restricted for use by the Airport for
certain FAA approved projects and debt service on bonds used to fund PFC eligible projects per Code of
Federal Regulations (C.F.R) 158.13. PFC proceeds are recorded as non-operating revenues.
Customer Facility Charges – In FY 2012, the Airport began assessing a customer facility charge (CFC) to
rental car customers. Current CFC charges, established by Salt Lake City ordinance, are $5 per day with a
limit of 12 days. The proceeds from CFCs are restricted for rental car facility construction projects as part
of the TRP. CFC proceeds are recorded as non-operating revenues.
Restricted and Unrestricted Resources – Some Airport construction projects may contain more than one
source of funding. The Airport is required to apply certain funds only to specific approved projects. The
Airport’s priority is to utilize AIP funds, then PFC and CFC funds, any State grants, TSA grants, bond
proceeds and, if needed, unrestricted Airport funds unless specific restrictions on any fund source requires
a different prioritization.
Cash and Cash Equivalents – The Airport considers all highly liquid debt instruments (including restricted
assets) purchased with an original maturity of three months or less to be cash equivalents.
Investments – Investments are recorded at fair value and include any accrued interest. Accordingly, the
change in fair value of investments is recognized as an increase or decrease to investment assets and
investment income.
Accounts Receivable – An allowance for uncollectible accounts receivable is established by charges to
operations for amounts required to maintain an adequate allowance, in management’s judgment, to cover
anticipated losses from customer accounts. Such accounts are charged to the allowance when collection
appears doubtful. Any subsequent recoveries are credited to the allowance account. As of June 30, 2017
and 2016, the Airport does not anticipate any material losses on accounts receivable, and no allowance is
has been established.
Capitalization of Interest Costs – Net interest costs incurred during the construction of the TRP as well as
the North Concourse Project (NCP) are capitalized as part of the historical costs of acquiring these assets.
The interest earned on investments acquired with proceeds from bonds (where such borrowings are
restricted to the acquisition of the assets) is offset against the related interest costs in determining either the
amount of interest to be capitalized or limitations on the amount of interest costs to be capitalized. Interest
is not capitalized on construction costs funded by government grants, PFC, or CFCs.
Total interest expense was approximately $14.5 million for the year ended June 30, 2017, while interest
capitalized as part of the cost of constructed assets was approximately $1.6 million.
Bond Discounts and Premiums – Bond discounts and premiums are deferred and amortized over the term
of the bonds using the effective interest rate method. Bond discounts and premiums are presented as a
reduction or addition to the face amount of the bonds payable.
Noise Mitigation Costs – Certain costs incurred in connection with the Airport’s noise mitigation program
have been capitalized as part of land.
Pollution Remediation Obligations – In FY 2010, the Airport recorded an operating expense and a future
liability obligation of $191 thousand associated with remediation of two pollution sites, both associated

21
with leaking underground fuel tanks from the early 1990s. In FY 2015, the Airport recorded additional
operating expenses and future liability obligations of $112 thousand for some additional leaking
underground fuel tanks. Since 2010, the Airport has incurred $138 thousand in costs for monthly
monitoring at both sites, including $10 thousand in FY 2017. The liability for remediation of pollution
recorded as of June 30, 2017 is a total of $166 thousand. The remainder of the current liability is for future
years’ ground water monitoring at the sites. Estimates of the expense and liability were based on the cost
of the equipment upgrades as well as cost of a contract negotiated with an outside contractor for future
monitoring. The potential exists for changes in these estimates, and both costs and future liabilities will be
adjusted if necessary in future periods. The Airport is self-insured for incidents of this magnitude, and no
insurance or other recoveries are anticipated.
Use of Estimates – The preparation of financial statements in conformity with GAAP requires management
to make estimates and assumptions that affect the reported amounts of assets and liabilities and disclosure
of contingent assets and liabilities at the date of the financial statements and the reported amounts of
revenues and expenses during the reporting period. Actual amounts could differ from those estimates.
Reclassifications – Certain amounts previously reported have been reclassified in order to be consistent
with the current year presentation.
Deferred Outflows and Deferred Inflows – In addition to assets, financial statements will sometimes report
a separate section for deferred outflows of resources. This separate financial statement element, deferred
outflows of resources, represents a consumption of net position that applies to a future period(s) and will
not be recognized as an outflow of resources (expense) until then. In addition to liabilities, the financial
statements will sometimes report a separate section for deferred inflows of resources. This separate
financial statement element, deferred inflows of resources, represents an acquisition of net position that
applies to a future period(s) and will not be recognized as an inflow of resources (revenue) until that time.
Revenue and Expense Recognition – Revenue for services is recognized at the time the service is
performed. Revenues from airlines, concessions, rental cars and parking are reported as operating revenues.
Revenue transactions which are capital, financing, or investing related are reported as non-operating
revenues. All expenses related to operating the Airport are reported as operating expenses. Interest expense
and financing costs are reported as non-operating expenses.
Pensions – For purposes of measuring the net pension liability, deferred outflows of resources and deferred
inflows of resources related to pensions, and pension expense, information about the fiduciary net position
of the Utah Retirement Systems Pension Plan (URS) and additions to/deductions from the URS’s fiduciary
net position have been determined on the same basis as they are reported by URS. For this purpose, benefit
payments (including refunds of employee contributions) are recognized when due and payable in
accordance with the benefit terms. Investments are reported at fair value.
Recent Accounting Pronouncements – In November 2016, the GASB issued Statement No. 83, Certain
Asset Retirement Obligations. The statement addresses accounting and financial reporting for certain asset
retirement obligations (AROs). An ARO is a legally enforceable liability associated with the retirement of
a tangible capital asset. A government that has legal obligations to perform future asset retirement activities
related to its tangible capital assets should recognize a liability based on the guidance in this statement.
This statement also establishes the criteria for determining the timing and pattern of recognition of a liability
and a corresponding deferred outflow of resources for AROs. Statement 83 is effective for fiscal years
beginning after June 15, 2018 and early adoption is encouraged. The Airport is currently evaluating the
impact of this statement on the financial statements when implemented.

22
In March 2017, the GASB issued Statement No. 85, Omnibus 2017. The statement addresses practice issues
that have been identified during implementation and application of certain GASB statements. This
statement addresses a variety of topics including issues related to blending component units, goodwill, fair
value measurement and application, and postemployment benefits (OPEB). Statement 85 is effective for
fiscal years beginning after June 15, 2017 and early adoption is encouraged. The Airport is currently
evaluating the impact of this statement on the financial statements when implemented.
In May 2017, the GASB issued Statement No. 86, Certain Debt Extinguishment Issues. The statement is
meant to improve consistency in accounting and financial reporting for in-substance defeasance of debt by
providing guidance for transactions in which cash and other monetary assets acquired with only existing
resources – resources other than the proceeds of refunding debt are placed in an irrevocable trust for the
sole purpose of extinguishing debt. This statement also improves accounting and financial reporting for
prepaid insurance on debt that is extinguished and notes to financial statements for debt that is defeased in
substance. Statement 86 is effective for fiscal years beginning after June 15, 2017 and early adoption is
encouraged. The Airport is currently evaluating the impact of this statement on the financial statements
when implemented.
In June 2017, the GASB issued Statement No. 87, Leases. The statement is meant to better meet the
information needs of financial statement users by improving accounting and financial reporting for leases
by governments. This statement increases the usefulness of governments’ financial statements by requiring
recognition of certain lease assets and liabilities for leases that previously were classified as operating leases
and recognized as inflows of resources or outflows of resources based on the payment provisions of the
contract. It establishes a single model for lease accounting based on the foundational principle that leases
are financings of the right to use an underlying asset. Under this statement, a lessee is required to recognize
a lease liability and an intangible right-to-use lease asset, and a lessor is required to recognize a lease
receivable and a deferred inflow resources, thereby enhancing the relevance and consistency of information
about governments’ leasing activities. Statement 87 is effective for fiscal years beginning after December
15, 2019 and early adoption is encouraged. The Airport is currently evaluating the impact of this statement
on the financial statements when implemented.
NOTE 2 – DEPOSITS AND INVESTMENTS
Cash and cash equivalents are comprised of the following as of June 30 (amounts in thousands):
The Airport maintains funds in Salt Lake City Corporation’s (City) pooled cash account. The Airport
receives from or pays to the City an allocation of interest income or expense based upon its balance in the
pooled cash account. Utah State Treasurer's Investment Pool balances reported in the Airport's Statement
of Net Position includes a write up of $6 million to the fair market value. The Airport's share of the State's
investment pool is based on the amount invested.
2017 2016
Fair Value Fair Value
Deposits
Petty Cash 2$ 2$
Unrestricted cash in the City's pooled cash account 2,363 8,403
Utah State Treasurer's Investments Pool 1,333,192 328,881
Zion's Bank operating accounts 2,860 3,230
Total 1,338,417$ 340,516$

23
It is the policy of the City to invest public funds in accordance with the principles of sound treasury
management and in compliance with state and local laws, regulations, and other policies governing the
investment of public funds, specifically, according to the terms and conditions of the Utah State Money
Management Act of 1974 and Rules of the State Money Management Council as currently amended and
the City’s own written investment policy. The City may place Airport money in investments/deposits
authorized by the Money Management Act (U.C.A. 51-7-11) (Act). In general these investments may be
placed in the Utah State Public Treasurer’s Investment Pool (Pool) subject to restrictions specified in the
Act. The Utah Money Management Council oversees the Pool and works in close partnership with the
Treasurer's Office, The Attorney General's office, the Utah Department of Financial Institutions and the
State of Utah's Division of Securities to oversee public deposits and investments to ensure the safety of
public funds in Utah.
Deposits
Credit Risk – State law requires that City funds, of which the Airport’s funds are part, be deposited with a
“qualified depository” as defined by the Act. “Qualified depository” includes any depository institution
which has been certified by the Utah State Commissioner of Financial Institutions as having met the
requirements as defined in Rule 11 of the Act. Rule 11 establishes the formula for determining the amount
of public funds which a qualified depository may accept. City policy provides that not more than 25% of
total City funds or 25% of the qualified depository’s allotment, whichever is less, may be invested in any
one qualified depository. Not more than 20% of total City funds may be invested in any one certified out-
of-state financial institution.
Custodial Credit Risk - At June 30, 2017 and 2016, the Airport had deposits with qualified depositories in
accordance with the Act totaling $2.9 million and $3.2 million, respectively. Of these amounts, $250
thousand was covered by federal depository insurance. The remaining balances of $2.6 million and $3.0
million, respectively, were uninsured and uncollateralized. The Commissioner of Financial Institutions
assigns a public funds allotment to each qualified depository and monitors public funds held monthly. Local
government deposits and repurchase agreements up to the allotment are not required by state law to be
insured or delivered to the public treasurer. The Airport’s deposits do not exceed the public funds allotment.
Investments Credit risk – The City’s investment policies are governed by state statutes. In addition, the City has its own
written investment policies. City funds, of which the Airport funds are part, are invested only in the
following: (1) negotiable or nonnegotiable deposits of qualified depositories (see definition of qualified
depository under “Deposits” above); (2) repurchase agreements with qualified depositories or certified
dealers, acting as principal for securities of the United States Treasury or other authorized investments, only
if these securities are delivered to the custody of the City Treasurer or the City’s safekeeping bank or are
held by a qualified depository; (3) commercial paper which is rated P-1 by Moody’s Investor Services or
A-1 by Standard and Poor’s, Inc., having a remaining term to maturity of 270 days or less. Commercial
paper can be purchased directly from the issuer provided proper delivery and safekeeping procedures are
followed with a qualified depository of the City Treasurer’s safe-keeping bank or trust company; (4)
bankers’ acceptances that are eligible for discount at a federal reserve bank and which have a remaining
term of maturity of 270 days or less; (5) negotiable certificates of deposit of $100k or more which have a
remaining term to maturity of 365 days or less; (6) obligations of the United States Treasury including
United States Treasury bills, United States Treasury notes, and United States Treasury bonds; (7)
obligations issued by or fully guaranteed as to principal and interest by the following agencies or
instrumentalities of the United States in which a market is made by a primary reporting government
securities dealer: Federal Home Loan Bank (FHLMC), Federal Farm Credit Bank, Federal National
Mortgage Association(FNMA); and (8) the Utah State Public Treasurer’s Investment Pool.

24
Investment interest rate risk – Investment interest rate risk is the risk that changes in interest rates of debt
investments will adversely affect the fair value of an investment. The City currently has no policy regarding
investment interest rate risk. The Utah State Public Treasurer’s Investment Pool is not rated, and the
average maturities of those investments are not known.
Custodial Credit Risk – A substantial portion of the Airport’s funds were invested in the Utah State
Treasurer’s Investment Pool, a pooled investments account that does not qualify for any of the above
categories. Oversight of the Utah State Treasurer’s Pool is internally managed by the Utah State Treasury
Office, and the Utah Public Treasurer’s Investment Fund was unrated as of June 30, 2017 by any outside
agency. The amount invested in the Utah State Treasurer’s Pool has been adjusted to market and reflects
the fair market value of the plan assets.
Unspent PFC revenue is invested in accordance with FAA guidelines. In addition, the Airport invested
PFC funds in U.S. Agency notes and corporate securities. Custodial credit risk for investments is the risk
that, in the event of a failure of the counter party, the Airport will not be able to recover the value of the
investment or collateral securities that are in the possession of an outside party. Of the $44.7 million
invested by the Airport, the entire amount was held in the Airport’s name by the counterparty and was
exposed to custodial credit risk. U.S. Agency notes are guaranteed by the federal government but are
uninsured investments.
Fair Value of Investments
The Airport categorizes its fair value measurements within the fair value hierarchy established by generally
accepted accounting principles. The hierarchy is based on the valuation inputs used to measure the fair
value of the asset. Level 1 inputs are quoted prices in active markets for identical assets; Level 2 inputs are
significant other observable inputs; Level 3 inputs are significant unobservable inputs.
The Airport has the following recurring fair value measurements as of June 30, 2017 and 2016;
U.S. Agency securities of $11.4 and $6.9 million are valued using quoted market prices
(Level 1 inputs)
U.S. Treasury securities of $33.3 and $38.3 million are valued using quoted market prices
(Level 1 inputs)
The table below shows the maturities, quality ratings, and fair value of the Airport’s investments (amounts
in thousands).
Quality FY 2017 FY 2016 Maturities
Debt Securities Ratings Fair Value Fair Value (in years)
U.S Agency Notes
FNMA AA+/Aaa 4,320$ 753$ 1-5
FHLMC AA+/Aaa 7,060 6,188 1-5
U.S Treasury Notes AA+/Aaa 33,284 38,338 1-5
44,664$ 45,279$
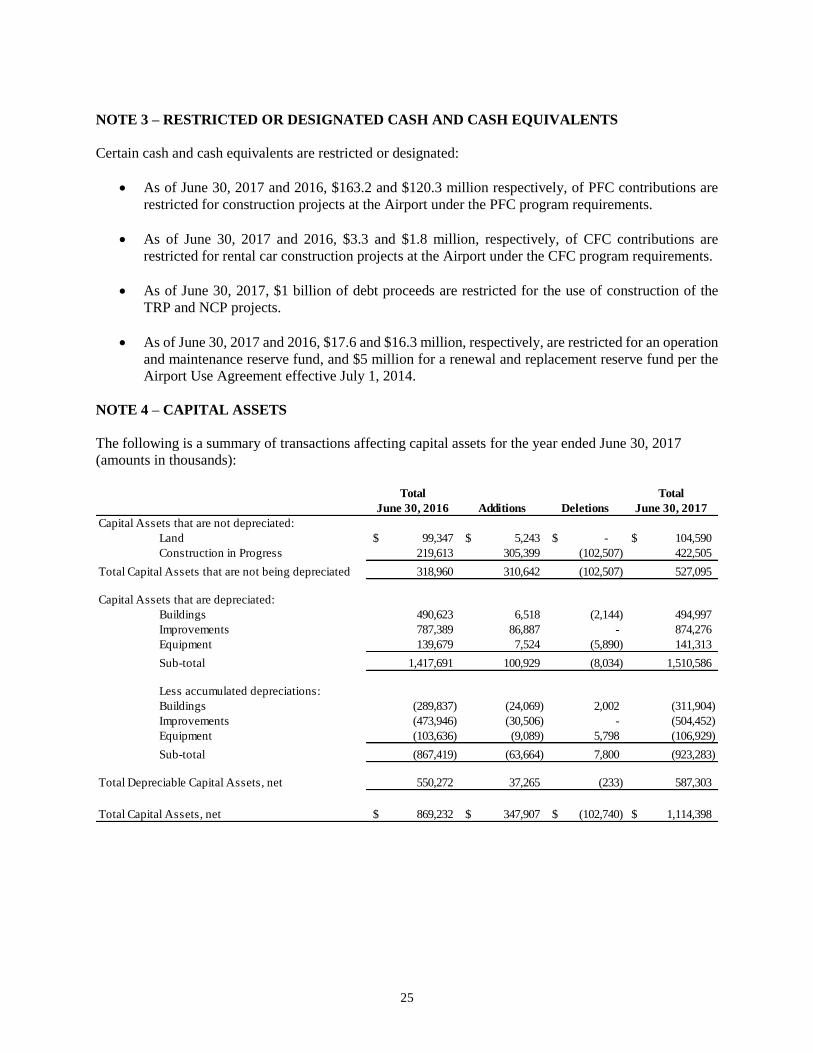
25
NOTE 3 – RESTRICTED OR DESIGNATED CASH AND CASH EQUIVALENTS
Certain cash and cash equivalents are restricted or designated:
As of June 30, 2017 and 2016, $163.2 and $120.3 million respectively, of PFC contributions are
restricted for construction projects at the Airport under the PFC program requirements.
As of June 30, 2017 and 2016, $3.3 and $1.8 million, respectively, of CFC contributions are
restricted for rental car construction projects at the Airport under the CFC program requirements.
As of June 30, 2017, $1 billion of debt proceeds are restricted for the use of construction of the
TRP and NCP projects.
As of June 30, 2017 and 2016, $17.6 and $16.3 million, respectively, are restricted for an operation
and maintenance reserve fund, and $5 million for a renewal and replacement reserve fund per the
Airport Use Agreement effective July 1, 2014.
NOTE 4 – CAPITAL ASSETS
The following is a summary of transactions affecting capital assets for the year ended June 30, 2017
(amounts in thousands):
Total Total
June 30, 2016 Additions Deletions June 30, 2017
Capital Assets that are not depreciated:
Land 99,347$ 5,243$ -$ 104,590$
Construction in Progress 219,613 305,399 (102,507) 422,505
Total Capital Assets that are not being depreciated 318,960 310,642 (102,507) 527,095
Capital Assets that are depreciated:
Buildings 490,623 6,518 (2,144) 494,997
Improvements 787,389 86,887 - 874,276
Equipment 139,679 7,524 (5,890) 141,313
Sub-total 1,417,691 100,929 (8,034) 1,510,586
Less accumulated depreciations:
Buildings (289,837) (24,069) 2,002 (311,904)
Improvements (473,946) (30,506) - (504,452)
Equipment (103,636) (9,089) 5,798 (106,929)
Sub-total (867,419) (63,664) 7,800 (923,283)
Total Depreciable Capital Assets, net 550,272 37,265 (233) 587,303
Total Capital Assets, net 869,232$ 347,907$ (102,740)$ 1,114,398$

26
The following is a summary of transactions affecting capital assets for the year ended June 30, 2016
(amounts in thousands):
NOTE 5 – LIMITED OBLIGATION SPECIAL FACILITY REVENUE BONDS
Delta Air Lines, Inc. (Delta) issued Limited Obligation Special Facility Revenue Bonds (Special Bonds),
series 2000, to finance the acquisition and construction of the Delta hangar, marketing, reservation and
training center (Delta Facilities) at the Airport. The outstanding balance of the Special Bonds as of June 30,
2017 and 2016 was $23.5 million. The Special Bonds are limited obligations of the City and are considered
conduit debt, and as such, do not constitute a debt of or a pledge of revenues of the City or the Airport,
other than the rental revenues received on the Delta Facilities. As the Airport’s assignee, Delta is absolutely
and unconditionally obligated under the lease agreement, dated June 1, 1987, between the Airport and Delta,
to make all principal and interest payments to the Special Bonds’ trustee.
NOTE 6 – COMMITMENTS AND CONTINGENCIES
At June 30, 2017, the Airport was committed to contractors and vendors for approximately $1.2 billion in
conjunction with Airport construction programs.
The Airport receives significant financial assistance from the U.S. Government in the form of contracts and
grants. Entitlement to these resources is generally contingent upon compliance with terms and conditions
of the contract or grant agreements and applicable federal regulations, including the expenditure of the
resources for eligible purposes. Substantially all federal grants and contracts are subject to a financial and
compliance audit under federal regulations. Disallowance as a result of compliance audits becomes a
liability of the Airport. In the opinion of management, the potential for a material liability because of future
audit disallowance is remote.
Total Total
June 30, 2015 Additions Deletions June 30, 2016
Capital Assets that are not depreciated:
Land 99,157$ 190$ -$ 99,347$
Construction in Progress 185,771 151,015 (117,173) 219,613
Total Capital Assets that are not being depreciated 284,928 151,205 (117,173) 318,960
Capital Assets that are depreciated:
Buildings 400,833 96,736 (6,946) 490,623
Improvements 777,077 14,448 (4,136) 787,389
Equipment 133,821 7,151 (1,293) 139,679
Sub-total 1,311,731 118,335 (12,375) 1,417,691
Less accumulated depreciations:
Buildings (273,307) (22,958) 6,428 (289,837)
Improvements (448,244) (29,736) 4,034 (473,946)
Equipment (95,765) (8,964) 1,093 (103,636)
Sub-total (817,316) (61,658) 11,555 (867,419)
Total Depreciable Capital Assets, net 494,415 56,677 (820) 550,272
Total Capital Assets, net 779,343$ 207,882$ (117,993)$ 869,232$
27
There are various suits and claims pending against the Airport from third parties. In the opinion of legal
counsel for the Airport and Airport management, these are not likely to have a material adverse impact on
the Airport's financial statements.
NOTE 7 – PENSION PLANS
Plan Description – Eligible plan participants are provided with pensions through the Utah Retirement
Systems. The Utah Retirement Systems are comprised of the following Pension Trust Funds:
Public Employees Noncontributory Retirement System (Noncontributory System);
Public Employees Contributory Retirement System (Contributory System);
The Public Safety Retirement System (Public Safety System) is a mixed agent and cost-sharing,
multiple-employer retirement system.;
Tier 2 Public Employees Contributory Retirement System (Tier 2 Public Employees System) is a
multiple employer cost sharing public employee retirement system;
Tier 2 Public Safety and Firefighter Contributory Retirement System (Tier 2 Public Safety and
Firefighters System) is a multiple employer, cost sharing, public employees retirement systems.
The Tier 2 Public Employees System became effective July 1, 2011. All eligible employees beginning on
or after July 1, 2011 who have no previous service credit with any of the Utah Retirement Systems, are
members of the Tier 2 Retirement System.
The Utah Retirement Systems (Systems) are established and governed by the respective sections of Title
49 of the Utah Code Annotated 1953, as amended. The Systems’ defined benefit plans are amended
statutorily by the State Legislature. The Utah State Retirement Office Act in Title 49 provides for the
administration of the Systems under the direction of the Utah State Retirement Board, whose members are
appointed by the Governor. The Systems are fiduciary funds defined as pension (and other employee
benefit) trust funds. URS is a component unit of the State of Utah. Title 49 of the Utah Code grants the
authority to establish and amend the benefit terms.
Systems issues a publicly available financial report that can be obtained by writing Utah Retirement
Systems, 560 E. 200 S, Salt Lake City, Utah 84102 or visiting the website: www.urs.org.
Benefits provided: Systems provides retirement, disability, and death benefits. Retirement benefits are as
follows:

28
Summary of Benefits by System
* with actuarial reductions
** All post-retirement cost-of-living adjustments are non-compounding and are based on the original
benefit except for Judges, which is a compounding benefit. The cost-of-living adjustments are also limited
to the actual Consumer Price Index (CPI) increase for the year, although unused CPI increases not met may
be carried forward to subsequent years.
Contributions – As a condition of participation in Systems, employers and/or employees are required to
contribute certain percentages of salary and wages as authorized by statute and specified by the Utah State
Retirement Board. Contributions are actuarially determined as an amount that, when combined with
employee contributions (where applicable) is expected to finance the costs of benefits earned by employees
during the year, with an additional amount to finance any unfunded actuarial accrued liability.
Contributions rates as of June 30, 2017 are as follows:
Years of service required
and/or age eligible for Benefit percentage
System Final Average Salary benefit per year of service COLA**
30 years any age
Noncontributory 25 years any age*
System Highest 3 Years 20 years age 60* 2.0% per year all years Up to 4%
10 years age 62*
4 years age 65
30 years any age
Contributory 25 years any age* 1.25% per year to June
System Highest 5 years 20 years age 60* 1975; 2.0% per year Up to 4%
10 years age 62* July 1975 to present
4 years age 65
Public Safety 20 years age 60 2.5% per year up to 20
System Highest 3 years 10 years age 60 years; 2.0% per year Up to 2.5% or 4% depending
4 years age 65 over 20 years on employer
Tier 2 Public 35 years any age
Employees Highest 5 years 20 years age 60* 1.5% per year all years Up to 2.5%
System 10 years age 62*
4 years age 65
Tier 2 Public 25 years any age
Safety and Highest 5 years 20 years age 60* 1.5% per year all years Up to 2.5%
Firefighter 10 years age 62*
System 4 years age 65
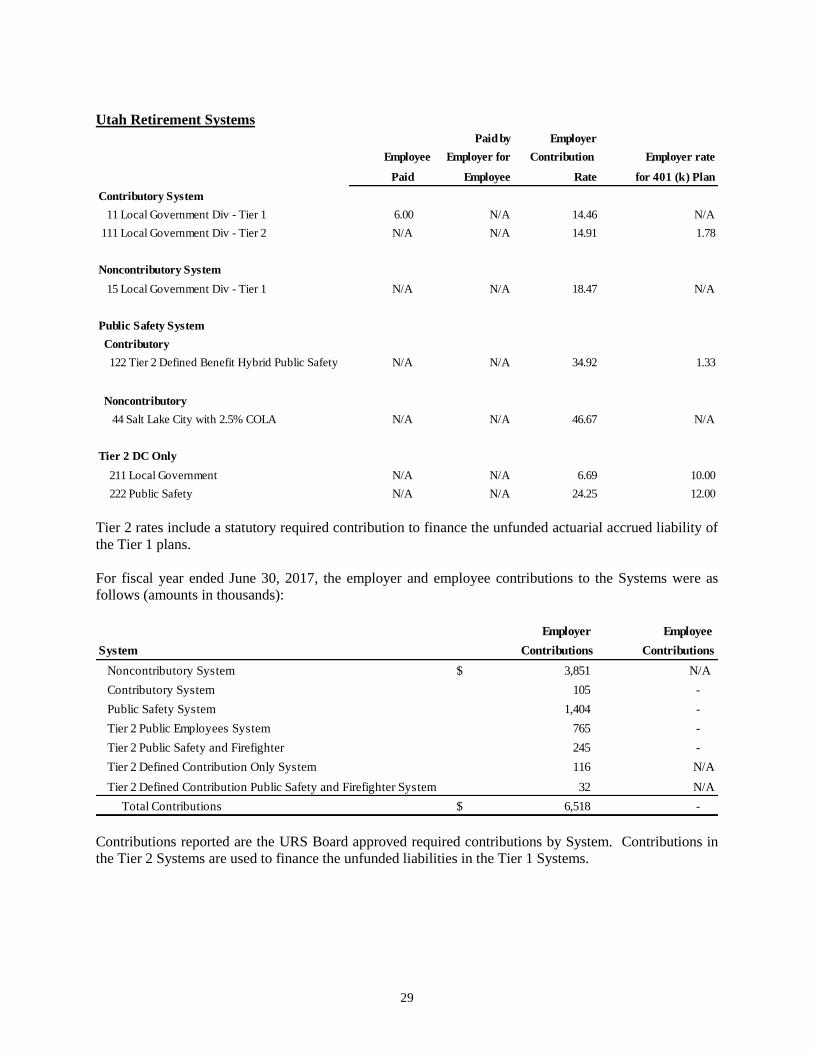
29
Utah Retirement Systems
Tier 2 rates include a statutory required contribution to finance the unfunded actuarial accrued liability of
the Tier 1 plans.
For fiscal year ended June 30, 2017, the employer and employee contributions to the Systems were as
follows (amounts in thousands):
Contributions reported are the URS Board approved required contributions by System. Contributions in
the Tier 2 Systems are used to finance the unfunded liabilities in the Tier 1 Systems.
Paid by Employer
Employee Employer for Contribution Employer rate
Paid Employee Rate for 401 (k) Plan
Contributory System
11 Local Government Div - Tier 1 6.00 N/A 14.46 N/A
111 Local Government Div - Tier 2 N/A N/A 14.91 1.78
Noncontributory System
15 Local Government Div - Tier 1 N/A N/A 18.47 N/A
Public Safety System
Contributory
122 Tier 2 Defined Benefit Hybrid Public Safety N/A N/A 34.92 1.33
Noncontributory
44 Salt Lake City with 2.5% COLA N/A N/A 46.67 N/A
Tier 2 DC Only
211 Local Government N/A N/A 6.69 10.00
222 Public Safety N/A N/A 24.25 12.00
Employer Employee
System Contributions Contributions
Noncontributory System 3,851$ N/A
Contributory System 105 -
Public Safety System 1,404 -
Tier 2 Public Employees System 765 -
Tier 2 Public Safety and Firefighter 245 -
Tier 2 Defined Contribution Only System 116 N/A
Tier 2 Defined Contribution Public Safety and Firefighter System 32 N/A
Total Contributions 6,518$ -

30
Pension Assets, Liabilities, Expense, and Deferred Outflows of Resources and Deferred Inflow of
Resources Related to Pensions
At June 30, 2017 and 2016, the Airport reported a net pension asset of $9 thousand and $12 thousand,
respectively, and a net pension liability of $27.4 million and $25.5 million, respectively. The following
table shows the net pension asset and liability:
The net pension asset and liability was measured as of December 31, 2016, and the total pension liability
used to calculate the net pension asset and liability was determined by an actuarial valuation as of January
1, 2016 and rolled forward using generally accepted actuarial procedures. The proportion of the net pension
asset and liability is equal to the ratio of the employer’s actual contributions to the Systems during the plan
year over the total of all employer contributions to the System during the plan year.
For the years ended June 30, 2017 and 2016, the Airport recognized pension expense of $7.7 million and
$5.4 million, respectively.
At June 30, 2017 and 2016, the Airport reported deferred outflows of resources and deferred inflows of
resources related to pensions from the following sources:
Proportionate Net Pension Net Pension
(Amounts in thousaands) Share Asset Liability
Noncontributory System 2.65% -$ 17,029$
Contributory System 3.39% - 1,113
Public Safety System 10.04% - 9,205
Tier 2 Public Employees System 0.68% - 76
Tier 2 Public Safety and Firefighter System 0.99% 9 -
9$ 27,423$
(Measurement date December 31, 2016)
Proportionate Net Pension Net Pension
(Amounts in thousands) Share Asset Liability
Noncontributory System 2.58% -$ 14,586$
Contributory System 2.10% - 1,478
Public Safety System 11.05% - 9,402
Tier 2 Public Employees System 0.69% 2 -
Tier 2 Public Safety and Firefighter System 0.70% 10 -
12$ 25,464$
(Measurement date December 31, 2015)
Deferred Outflows Deferred Inflows
(Amounts in thousands) of Resources of Resources
Differences between expected and actual 678$ 570$
Changes in assumptions 3,176 676
Net difference between projected and actual
earnings on pension plan investment 5,202 1,521
Changes in proportion and differences between contributions
and proportinate share of contributions 119 -
Contributions subsequent to measurement 2,773 -
11,948$ 2,767$
December 31, 2016
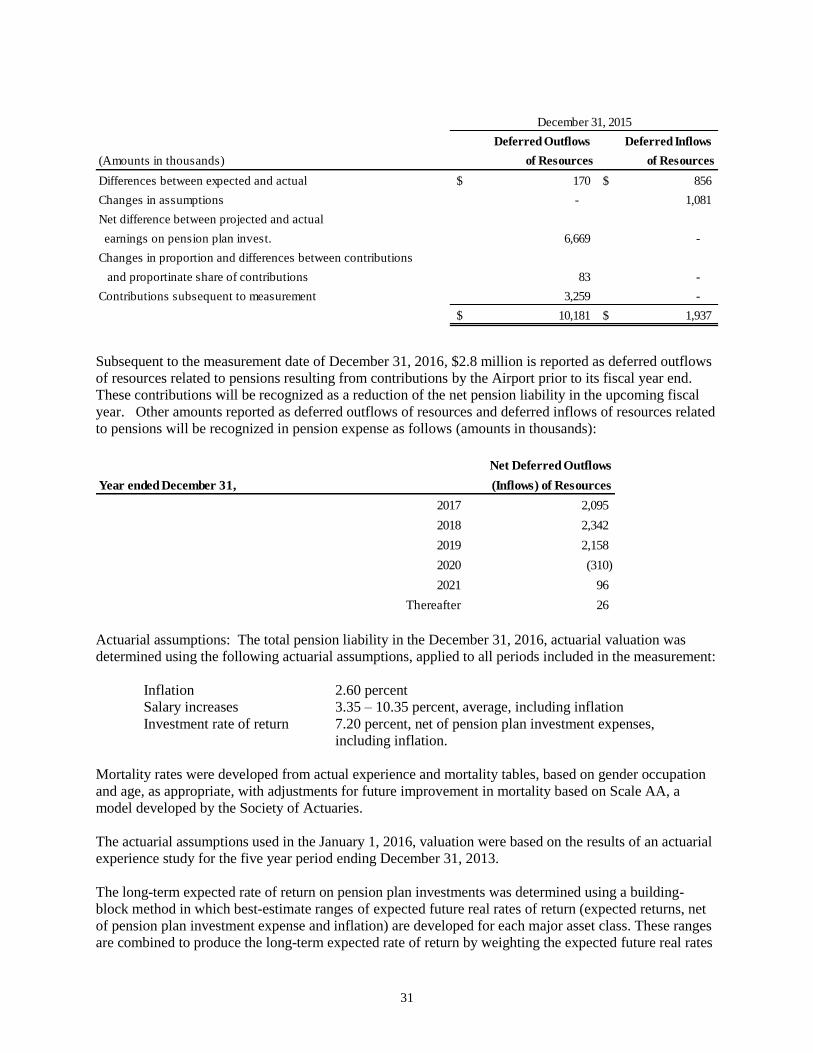
31
Subsequent to the measurement date of December 31, 2016, $2.8 million is reported as deferred outflows
of resources related to pensions resulting from contributions by the Airport prior to its fiscal year end.
These contributions will be recognized as a reduction of the net pension liability in the upcoming fiscal
year. Other amounts reported as deferred outflows of resources and deferred inflows of resources related
to pensions will be recognized in pension expense as follows (amounts in thousands):
Actuarial assumptions: The total pension liability in the December 31, 2016, actuarial valuation was
determined using the following actuarial assumptions, applied to all periods included in the measurement:
Inflation 2.60 percent
Salary increases 3.35 – 10.35 percent, average, including inflation
Investment rate of return 7.20 percent, net of pension plan investment expenses,
including inflation.
Mortality rates were developed from actual experience and mortality tables, based on gender occupation
and age, as appropriate, with adjustments for future improvement in mortality based on Scale AA, a
model developed by the Society of Actuaries.
The actuarial assumptions used in the January 1, 2016, valuation were based on the results of an actuarial
experience study for the five year period ending December 31, 2013.
The long-term expected rate of return on pension plan investments was determined using a building-
block method in which best-estimate ranges of expected future real rates of return (expected returns, net
of pension plan investment expense and inflation) are developed for each major asset class. These ranges
are combined to produce the long-term expected rate of return by weighting the expected future real rates
Deferred Outflows Deferred Inflows
(Amounts in thousands) of Resources of Resources
Differences between expected and actual 170$ 856$
Changes in assumptions - 1,081
Net difference between projected and actual
earnings on pension plan invest. 6,669 -
Changes in proportion and differences between contributions
and proportinate share of contributions 83 -
Contributions subsequent to measurement 3,259 -
10,181$ 1,937$
December 31, 2015
Net Deferred Outflows
Year ended December 31, (Inflows) of Resources
2017 2,095
2018 2,342
2019 2,158
2020 (310)
2021 96
Thereafter 26

32
of return by the target asset allocation percentage and by adding expected inflation. The target allocation
and best estimates of arithmetic real rates of return for each major asset class are summarized in the
following table:
Expected Return Arithmetic Basis
Asset class Target Asset
Allocation
Real Return
Arithmetic
Basis
Long-Term
Expected
Portfolio Real
Rate of Return
Equity securities 40% 7.06% 2.82%
Debt securities 20% 0.80% 0.16%
Real assets 13% 5.10% 0.66%
Private equity 9% 11.30% 1.02%
Absolute return 18% 3.15% 0.57%
Cash and cash equivalents 0% 0.00% 0.00%
Totals 100% 5.23%
Inflation 2.60%
Expected Arithmetic Nominal Return 7.83%
The 7.20% assumed investment rate of return is comprised of an inflation rate of 2.60%, and a real return
of 4.60% that is net of investment expense.
Discount rate: The discount rate used to measure the total pension liability was 7.20 %. The projection
of cash flows used to determine the discount rate assumed that employee contributions will be made at the
current contribution rate and that contributions from all participating employers will be made at
contractually required rates that are actuarially determined and certified by the URS Board. Based on
those assumptions, the pension plan’s fiduciary net position was projected to be available to make all
projected future benefits payments of current active and inactive employees. Therefore, the long-term
expected rate of return on pension plan investments was applied to all periods of projected benefit
payments to determine the total pension liability. The discount rate does not use the Municipal Bond
Index Rate. The discount rate was reduced to 7.20 percent from 7.50 percent from the prior measurement
period.
Sensitivity of the proportionate share of the net pension asset and liability to changes in the discount rate.
The following presents the proportionate share of the net pension liability calculated using the discount
rate of 7.20 percent, as well as what the proportionate share of the net pension liability (asset) would be if
it were calculated using a discount rate that is 1-percentage-point lower (6.20 percent) or 1-percentage-
point higher (8.20 percent) than the current rate (amounts in thousands):
Pension plan fiduciary net position: Detailed information about the pension plan’s fiduciary net position is
available in the separately issued URS financial report.
1% Decrease Discount Rate 1% Increase
System (6.20% ) (7.20% ) (8.20% )
Noncontributory System 35,274$ 17,029$ 1,806$
Contributory System 2,679 1,113 (206)
Public Safety System 13,896 9,206 5,343
Tier 2 Public Employees System 516 76 (259)
Tier 2 Public Safety and Firefighter System 60 (9) (61)
Total 52,425$ 27,415$ 6,623$

33
Defined Contribution Savings Plans
The Defined Contribution Savings Plans are administered by the Utah Retirement Systems Board and are
generally supplemental plans to the basic retirement benefits of the Retirement Systems, but may also be
used as a primary retirement plan. These plans are voluntary tax-advantaged retirement savings programs
authorized under sections 401(k), 457(b), and 408 of the Internal Revenue code. Detailed information
regarding plan provisions is available in the separately issued URS financial report.
The Airport participates in the following Defined Contribution Savings Plans with Utah Retirement
Systems:
*401(k) Plan
*457(b) Plan
*Roth IRA Plan
*Traditional IRA Plan
Employee and employer contributions to the Utah Retirement Defined Contribution Savings Plans for the
fiscal year ended June 30 were as follows (amounts in thousands):
NOTE 8 – BONDS PAYBLE
Changes in long-term debt for the year ended June 30, 2017 were as follows (amounts in thousands):
401(k) Plan 2017 2016 2015
Employer Contributions 337$ 286$ 237$
Employee Contributions 616 622 620
457 Plan
Employer Contributions 1 - -
Employee Contributions 277 253 253
Roth IRA Plan
Employer Contributions N/A N/A N/A
Employee Contributions 109 81 63
Traditional IRA Plan
Employer Contributions N/A N/A N/A
Employee Contributions 3$ 4$ 3$
Additions Retirements
General Airport Revenue Bonds
2017A and 2017B -$ 1,000,000$ -$ 1,000,000$
Unamortized net premiums - 126,481 1,669 124,812
Total bond debt -$ 1,126,481$ 1,669$ 1,124,812$
June 30,
2017
July 1,
2016
2017

34
The General Airport Revenue Bonds are not general obligations of the City, but are limited obligations of
the Airport payable solely from and secured by a pledge of the Airport system’s net revenues. Neither the
full faith and credit nor the taxing power of Salt Lake City is pledged to the payment of the General Airport
Revenue Bonds.
The maturity dates, interest rates, and principal amounts outstanding as of June 30, 2017 are as follows
(amounts in thousands):
The Airport term bonds are subject to certain optional redemption provisions. In addition the Airport bonds
are subject to certain mandatory sinking fund redemption requirements.
Bond debt service requirements of the Airport for bonds payable to maturity as of June 30, 2017 are as
follows (amounts in thousands):
On February 23, 2017 the Airport issued $826,210,000 of Series 2017A (AMT), and $173,790,000 of Series
2017B (Non-AMT) bonds. The proceeds of the bonds are being used to finance portions of the Terminal
Redevelopment Program and the North Concourse Program.
Bond Maturity Interest Rate
2017 2016
General Airport Revenue Bonds
Series 2017A Annually July 1, 2021-2047 5% 826,210$ -$
Series 2017B Annually July 1, 2021-2047 5% 173,790 -
Total revenue bonds 1,000,000 -
Net unamortized premiums 124,812
Total bonds payable noncurrent 1,124,812$ -$
Amount Outstanding
Principal Interest
Year:
2018 -$ 42,778$
2019 - 50,000
2020 - 50,000
2021 - 50,000
2022 1,140 49,972
2023 - 2027 56,975 242,775
2028 - 2032 143,595 218,484
2033- 2037 186,465 177,173
2038- 2042 237,970 124,369
2043- 2047 303,705 56,981
2048 70,150 1,754
Total 1,000,000$ 1,064,285$
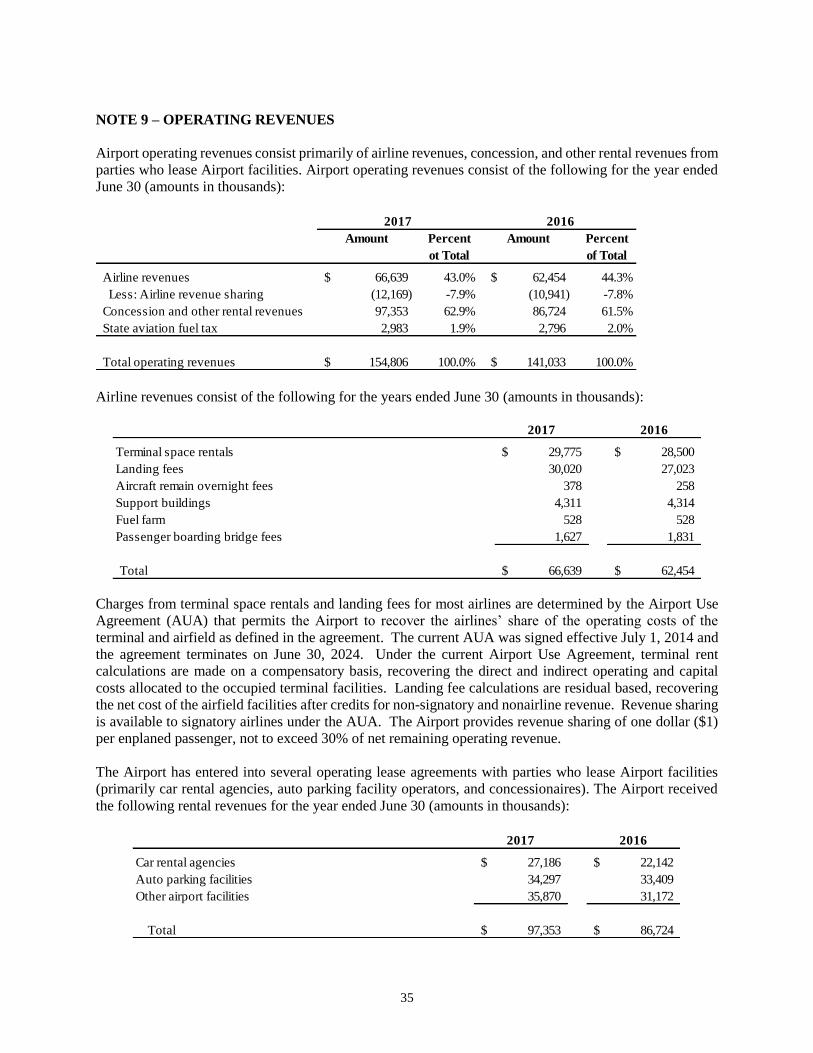
35
NOTE 9 – OPERATING REVENUES
Airport operating revenues consist primarily of airline revenues, concession, and other rental revenues from
parties who lease Airport facilities. Airport operating revenues consist of the following for the year ended
June 30 (amounts in thousands):
Airline revenues consist of the following for the years ended June 30 (amounts in thousands):
Charges from terminal space rentals and landing fees for most airlines are determined by the Airport Use
Agreement (AUA) that permits the Airport to recover the airlines’ share of the operating costs of the
terminal and airfield as defined in the agreement. The current AUA was signed effective July 1, 2014 and
the agreement terminates on June 30, 2024. Under the current Airport Use Agreement, terminal rent
calculations are made on a compensatory basis, recovering the direct and indirect operating and capital
costs allocated to the occupied terminal facilities. Landing fee calculations are residual based, recovering
the net cost of the airfield facilities after credits for non-signatory and nonairline revenue. Revenue sharing
is available to signatory airlines under the AUA. The Airport provides revenue sharing of one dollar ($1)
per enplaned passenger, not to exceed 30% of net remaining operating revenue.
The Airport has entered into several operating lease agreements with parties who lease Airport facilities
(primarily car rental agencies, auto parking facility operators, and concessionaires). The Airport received
the following rental revenues for the year ended June 30 (amounts in thousands):
Amount Percent Amount Percent
ot Total of Total
Airline revenues 66,639$ 43.0% 62,454$ 44.3%
Less: Airline revenue sharing (12,169) -7.9% (10,941) -7.8%
Concession and other rental revenues 97,353 62.9% 86,724 61.5%
State aviation fuel tax 2,983 1.9% 2,796 2.0%
Total operating revenues 154,806$ 100.0% 141,033$ 100.0%
20162017
2017 2016
Terminal space rentals 29,775$ 28,500$
Landing fees 30,020 27,023
Aircraft remain overnight fees 378 258
Support buildings 4,311 4,314
Fuel farm 528 528
Passenger boarding bridge fees 1,627 1,831
Total 66,639$ 62,454$
2017 2016
Car rental agencies 27,186$ 22,142$
Auto parking facilities 34,297 33,409
Other airport facilities 35,870 31,172
Total 97,353$ 86,724$

36
Minimum future rentals to be received on these non-cancelable leases as of June 30, for each of the next
five years and for five-year increments thereafter are as follows (amounts in thousands):
NOTE 10 – LONG-TERM LIABILITY ACTIVITY
Long-term liability activity for the year ended June 30, 2017 was as follows (amounts in thousands):
Long-term liability activity for the year ended June 30, 2016 was as follows (amounts in thousands):
Year Ending June 30:
2018 46,452$
2019 42,626
2020 37,201
2021 36,763
2022 34,330
2023-2027 101,850
2028-2032 8,098
2033-2037 3,967
2038-2042 2,614
Thereafter 458
Total 314,359$
Beginning Ending Due Within
Balance Additions Reductions Balance One Year
Accrued compensation 6,083$ 3,866$ (3,512)$ 6,437$ 2,647$
Net pension liability 25,465 1,959 - 27,424 -
Other long-term liabilities 4,106 10,737 (5,765) 9,078 5,765
Total long-term liabilities 35,654$ 16,562$ (9,277)$ 42,939$ 8,412$
Beginning Ending Due Within
Balance Additions Reductions Balance One Year
Accrued compensation 5,766$ 3,671$ (3,354)$ 6,083$ 2,454$
Net OPEB obligation 236 - (236) - -
Net pension liability 20,232 5,233 - 25,465 -
Other long-term liabilities 2,433 3,734 (2,061) 4,106 2,061
Total long-term liabilities 28,667$ 12,638$ (5,651)$ 35,654$ 4,515$
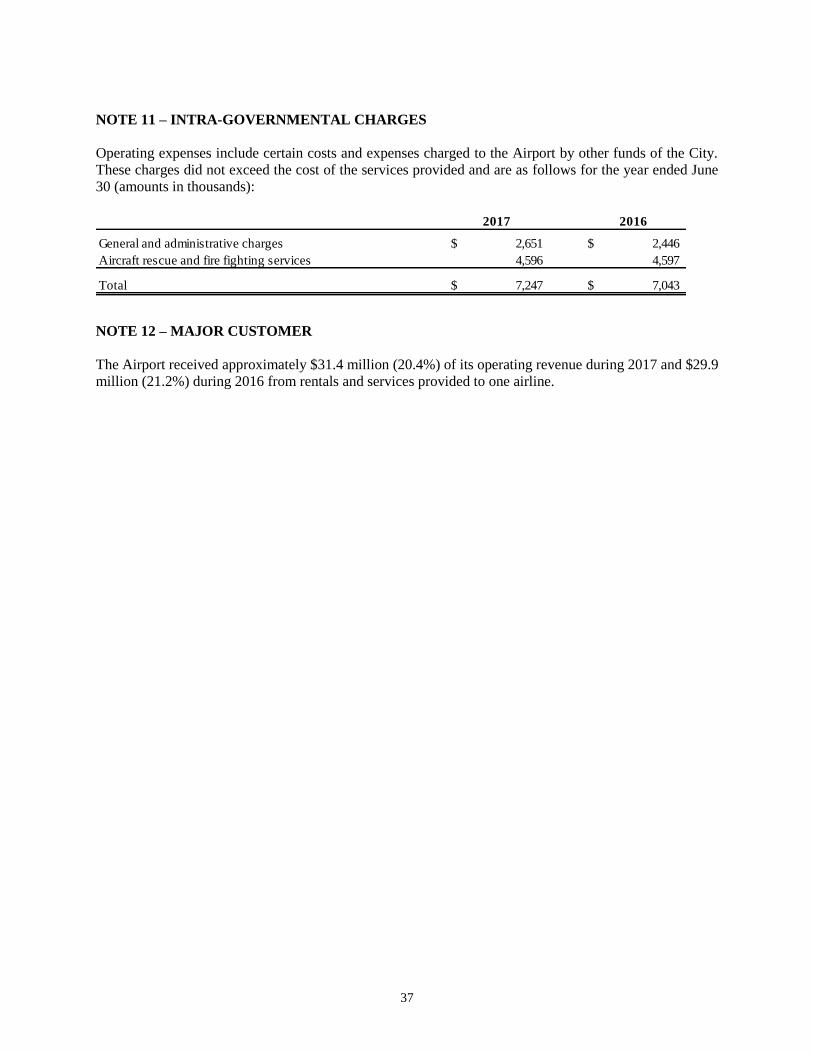
37
NOTE 11 – INTRA-GOVERNMENTAL CHARGES
Operating expenses include certain costs and expenses charged to the Airport by other funds of the City.
These charges did not exceed the cost of the services provided and are as follows for the year ended June
30 (amounts in thousands):
NOTE 12 – MAJOR CUSTOMER
The Airport received approximately $31.4 million (20.4%) of its operating revenue during 2017 and $29.9
million (21.2%) during 2016 from rentals and services provided to one airline.
2017 2016
General and administrative charges 2,651$ 2,446$
Aircraft rescue and fire fighting services 4,596 4,597
Total 7,247$ 7,043$
REQUIRED
SUPPLEMENTAL SCHEDULES

RSI-2
SALT LAKE CITY DEPARTMENT OF AIRPORTS
Schedule of Required Supplementary Information
Schedule of the Proportionate Share of the Net Pension Liability
Utah Retirement Systems
December 31, 2016
Last 10 Fiscal Years *
(Amounts in Thousands)
* In accordance with paragraph 81.a of GASB 68, employers will need to disclose a 10-year history of their proportionate share
of the Net Pension Liability (Asset) in their RSI. The 10-year schedule will need to be built prospectively. The schedule above
is for the three years currently available.
Noncontributory System 2016 2015 2014
Proportion of the net pension liability 2.65% 2.58% 2.53%
Proportionate share of the net pension liability 17,029$ 14,586$ 10,985$
Covered payroll 22,028 21,247 21,137
Proportionate share of the net pension liability
as a percentage of its covered payroll 77.3% 68.6% 52.0%
Plan fiduciary net position as a percentage of its
covered payroll 87.3% 90.2% 90.2%
Contributory Retirement System 2016 2015 2014
Proportion of the net pension liability 3.39% 2.1% 2.62%
Proportionate share of the net pension liability 1,113$ 1,478$ 757$
Covered payroll 814 896 1,405
Proportionate share of the net pension liability
as a percentage of its covered payroll 136.7% 165.0% 53.9%
Plan fiduciary net position as a percentage of its
covered payroll 92.9% 94.0% 94.0%
Public Safety System 2016 2015 2014
Proportion of the net pension liability 10.04% 11.05% 11.65%
Proportionate share of the net pension liability 9,205$ 9,402$ 8,490$
Covered payroll 3,121 3,158 3,292
Proportionate share of the net pension liability
as a percentage of its covered payroll 294.9% 297.8% 257.9%
Plan fiduciary net position as a percentage of its
covered payroll 74.0% 76.7% 76.7%
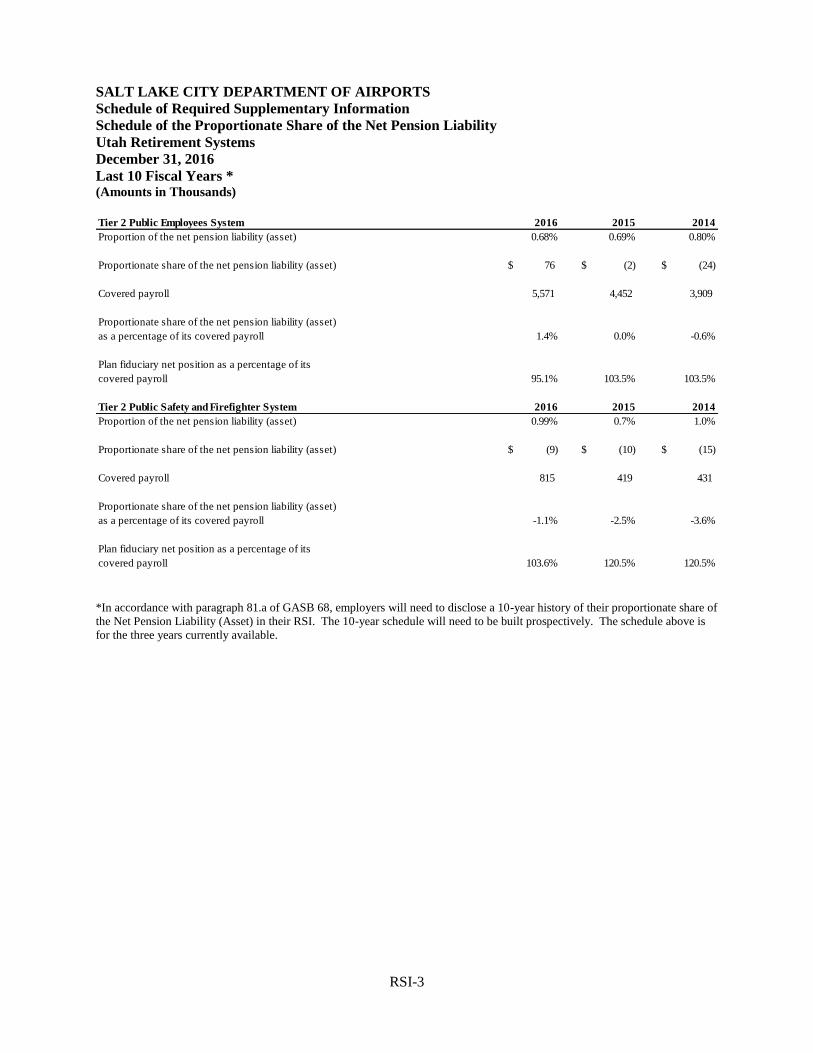
RSI-3
SALT LAKE CITY DEPARTMENT OF AIRPORTS
Schedule of Required Supplementary Information
Schedule of the Proportionate Share of the Net Pension Liability
Utah Retirement Systems
December 31, 2016
Last 10 Fiscal Years * (Amounts in Thousands)
*In accordance with paragraph 81.a of GASB 68, employers will need to disclose a 10-year history of their proportionate share of
the Net Pension Liability (Asset) in their RSI. The 10-year schedule will need to be built prospectively. The schedule above is
for the three years currently available.
Tier 2 Public Employees System 2016 2015 2014
Proportion of the net pension liability (asset) 0.68% 0.69% 0.80%
Proportionate share of the net pension liability (asset) 76$ (2)$ (24)$
Covered payroll 5,571 4,452 3,909
Proportionate share of the net pension liability (asset)
as a percentage of its covered payroll 1.4% 0.0% -0.6%
Plan fiduciary net position as a percentage of its
covered payroll 95.1% 103.5% 103.5%
Tier 2 Public Safety and Firefighter System 2016 2015 2014
Proportion of the net pension liability (asset) 0.99% 0.7% 1.0%
Proportionate share of the net pension liability (asset) (9)$ (10)$ (15)$
Covered payroll 815 419 431
Proportionate share of the net pension liability (asset)
as a percentage of its covered payroll -1.1% -2.5% -3.6%
Plan fiduciary net position as a percentage of its
covered payroll 103.6% 120.5% 120.5%

RSI-4
SALT LAKE CITY DEPARTMENT OF AIRPORTS
Schedule of Required Supplementary Information
Schedule of Contributions
June 30, 2017
Last 10 Fiscal Years * (Amounts in Thousands)
* In accordance with paragraph 81.a of GASB 68, employers will need to disclose a 10-year history of their proportionate share
of the Net Pension Liability (Asset) in their RSI. The 10-year schedule will need to be built prospectively. The schedule above
is for the three years currently available.
Noncontributory System 2017 2016 2015
Actuarial determined contributions 3,883$ 3,867$ 4,073$
Contributions in relation to the contractually required (3,883) (3,867) (4,073)
contribution
Contribution deficiency - - -
Covered payroll 22,395 22,735 21,046
Contributions as a percentage of covered payroll 17.3% 17.8% 19.4%
Contributory Retirement System 2017 2016 2015
Actuarial determined contributions 121$ 116$ 186$
Contributions in relation to the contractually required (121) (116) (186)
contribution
Contribution deficiency - - -
Covered payroll 827 958 1,399
Contributions as a percentage of covered payroll 14.7% 12.5% 13.3%
Public Safety System 2017 2016 2015
Actuarial determined contributions 1,376$ 1,477$ 1,574$
Contributions in relation to the contractually required (1,376) (1,477) (1,574)
contribution
Contribution deficiency - - -
Covered payroll 3,173 3,379 3,277
Contributions as a percentage of covered payroll 43.4% 45.1% 48.0%

RSI-5
SALT LAKE CITY DEPARTMENT OF AIRPORTS
Schedule of Required Supplementary Information
Schedule of Contributions
June 30, 2017
Last 10 Fiscal Years ** (Amounts in Thousands)
*Contributions in Tier 2 include an amortization rate to help fund the unfunded liabilities in the Tier 1 systems. Tier 2 systems
were created effective July 1, 2011
**In accordance with paragraph 81.a of GASB 68, employers will need to disclose a 10-year history of their proportionate share
of the Net Pension Liability (Asset) in their RSI. The 10-year schedule will need to be built prospectively. The schedule above
is for the three years currently available.
Tier 2 Public Employee System* 2017 2016 2015
Actuarial determined contributions 543$ 671$ 369$
Contributions in relation to the contractually required (543) (671) (369)
contribution
Contribution deficiency - - -
Covered payroll 5,004 4,763 3,892
Contributions as a percentage of covered payroll 10.9% 13.5% 9.5%
Tier 2 Public Safety and Firefighter System* 2017 2016 2015
Actuarial determined contributions 126$ 139$ 54$
Contributions in relation to the contractually required (126) (139) (54)
contribution
Contribution deficiency - - -
Covered payroll 732 448 429
Contributions as a percentage of covered payroll 17.2% 24.1% 12.7%
Tier 2 Public Employees DC Only System* 2017 2016 2015
Actuarial determined contributions 72$ 94$ -$
Contributions in relation to the contractually required (72) (94) -
contribution
Contribution deficiency - - -
Covered payroll 97 4,763 -
Contributions as a percentage of covered payroll 74.1% 13.5% 0.0%

RSI-6
SALT LAKE CITY DEPARTMENT OF AIRPORTS
(An Enterprise Fund of Salt Lake City Corporation)
Schedule of Required Supplementary Information
Schedule of Contributions
June 30, 2017
Last 10 Fiscal Years ** (Amounts in Thousands)
*Contributions in Tier 2 include an amortization rate to help fund the unfunded liabilities in the Tier 1 systems. Tier 2 systems
were created effective July 1, 2011
**In accordance with paragraph 81.a of GASB 68, employers will need to disclose a 10-year history of their proportionate share
of the Net Pension Liability (Asset) in their RSI. The 10-year schedule will need to be built prospectively. The schedule above
is for the three years currently available.
Tier 2 Public Safety and Firefighter DC Only System* 2017 2016 2015
Actuarial determined contributions 17$ 21$ -$
Contributions in relation to the contractually required (17) (21) -
contribution
Contribution deficiency - - -
Covered payroll 97 448 -
Contributions as a percentage of covered payroll 17.2% 24.1% 0.0%

RSI-7
SALT LAKE CITY DEPARTMENT OF AIRPORTS
Notes to Required Supplementary Information
For Fiscal Year Ended June 30, 2017
Changes in Assumptions:
The following actuarial assumption changes were adopted January 1, 2016. The assumed investment return
assumption was decreased from 7.50% to 7.20% and the assumed inflation rate was decreased from 2.75%
to 2.60%. With the decrease in the assumed rate of inflation, both the payroll growth and wage inflation
assumptions were decreased by 0.15% from the prior year’s assumption.

STATISTICAL SECTION
(Unaudited)

S1
STATISTICAL SECTION
(Unaudited)
This part of the Salt Lake City Department of Airport’s Comprehensive Annual Financial Report
presents detailed information as a context for understanding what the information in the financial
statements, note disclosures, and required supplementary information states about the Airport’s
overall financial health.
Contents Schedules
Financial Trends S2-S6
This schedule contains trend information to help the reader understand how
the Airport’s financial performance and well-being have changed over time.
Debt Capacity S7
This schedule presents information to help the reader assess the affordability
of the Airport’s current levels of outstanding debt and the compliance with
minimum debt ratios.
Demographic and Economic Information S8–S12
These schedules offer demographic and economic indicators to help
the reader understand the environment within which the Airport’s financial
activities take place.
Insurance S13
This schedule contains the various insurance policies and their terms to help the reader
understand the insurance coverage of the Airport.
Operating Information S14–S25
These schedules provide contextual information about the Airport’s operations and
resources to help readers use financial statement information to understand and assess the
Airport’s economic condition.

S2
2017 2016 2015 2014 2013 2012 2011 2010 2009 2008
Net Position
Invested in capital assets - net of debt 761,198$ 869,233$ 779,343$ 707,112$ 670,459$ 682,910$ 696,643$ 702,602$ 706,411$ 706,206$
Restricted
Capital Projects 189,115 143,297 196,439 179,263 132,827 95,738 50,546 7,468 1,525 706
Debt Service 240,783 - - - - - - - - -
Unrestricted 96,713 209,704 182,199 223,294* 251,418* 223,977* 207,225* 206,562* 180,211* 153,547*
Total Net Position 1,287,809$ 1,222,234$ 1,157,981$ 1,109,669$ 1,054,704$ 1,002,625$ 954,415$ 916,632$ 888,147$ 860,460$
* Balance has not been restated for GASB 68
SALT LAKE CITY DEPARTMENT OF AIRPORTS
SUMMARY OF CHANGES IN NET POSTION
LAST TEN FISCAL YEARS
(Amounts in Thousands)
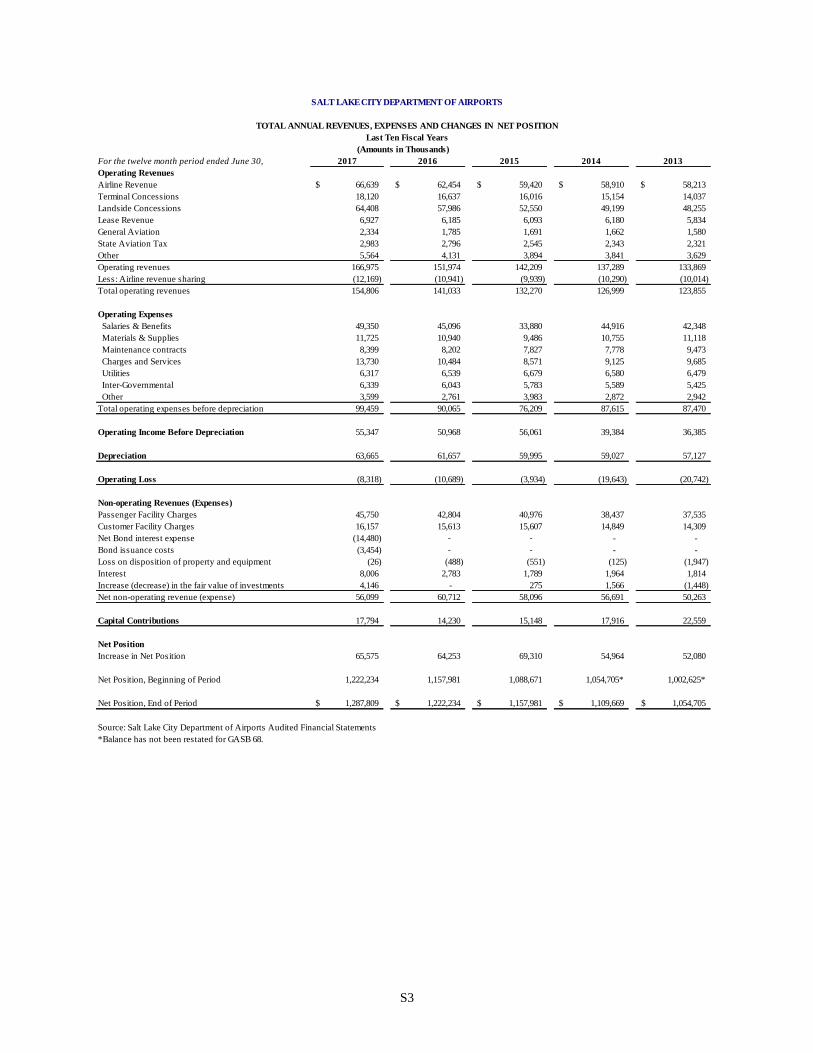
S3
For the twelve month period ended June 30, 2017 2016 2015 2014 2013
Operating Revenues
Airline Revenue 66,639$ 62,454$ 59,420$ 58,910$ 58,213$
Terminal Concessions 18,120 16,637 16,016 15,154 14,037
Landside Concessions 64,408 57,986 52,550 49,199 48,255
Lease Revenue 6,927 6,185 6,093 6,180 5,834
General Aviation 2,334 1,785 1,691 1,662 1,580
State Aviation Tax 2,983 2,796 2,545 2,343 2,321
Other 5,564 4,131 3,894 3,841 3,629
Operating revenues 166,975 151,974 142,209 137,289 133,869
Less: Airline revenue sharing (12,169) (10,941) (9,939) (10,290) (10,014)
Total operating revenues 154,806 141,033 132,270 126,999 123,855
Operating Expenses
Salaries & Benefits 49,350 45,096 33,880 44,916 42,348
Materials & Supplies 11,725 10,940 9,486 10,755 11,118
Maintenance contracts 8,399 8,202 7,827 7,778 9,473
Charges and Services 13,730 10,484 8,571 9,125 9,685
Utilities 6,317 6,539 6,679 6,580 6,479
Inter-Governmental 6,339 6,043 5,783 5,589 5,425
Other 3,599 2,761 3,983 2,872 2,942
Total operating expenses before depreciation 99,459 90,065 76,209 87,615 87,470
Operating Income Before Depreciation 55,347 50,968 56,061 39,384 36,385
Depreciation 63,665 61,657 59,995 59,027 57,127
Operating Loss (8,318) (10,689) (3,934) (19,643) (20,742)
Non-operating Revenues (Expenses)
Passenger Facility Charges 45,750 42,804 40,976 38,437 37,535
Customer Facility Charges 16,157 15,613 15,607 14,849 14,309
Net Bond interest expense (14,480) - - - -
Bond issuance costs (3,454) - - - -
Loss on disposition of property and equipment (26) (488) (551) (125) (1,947)
Interest 8,006 2,783 1,789 1,964 1,814
Increase (decrease) in the fair value of investments 4,146 - 275 1,566 (1,448)
Net non-operating revenue (expense) 56,099 60,712 58,096 56,691 50,263
Capital Contributions 17,794 14,230 15,148 17,916 22,559
Net Position
Increase in Net Position 65,575 64,253 69,310 54,964 52,080
Net Position, Beginning of Period 1,222,234 1,157,981 1,088,671 1,054,705* 1,002,625*
Net Position, End of Period 1,287,809$ 1,222,234$ 1,157,981$ 1,109,669$ 1,054,705$
Source: Salt Lake City Department of Airports Audited Financial Statements
*Balance has not been restated for GASB 68.
SALT LAKE CITY DEPARTMENT OF AIRPORTS
TOTAL ANNUAL REVENUES, EXPENSES AND CHANGES IN NET POSITION
Last Ten Fiscal Years
(Amounts in Thousands)
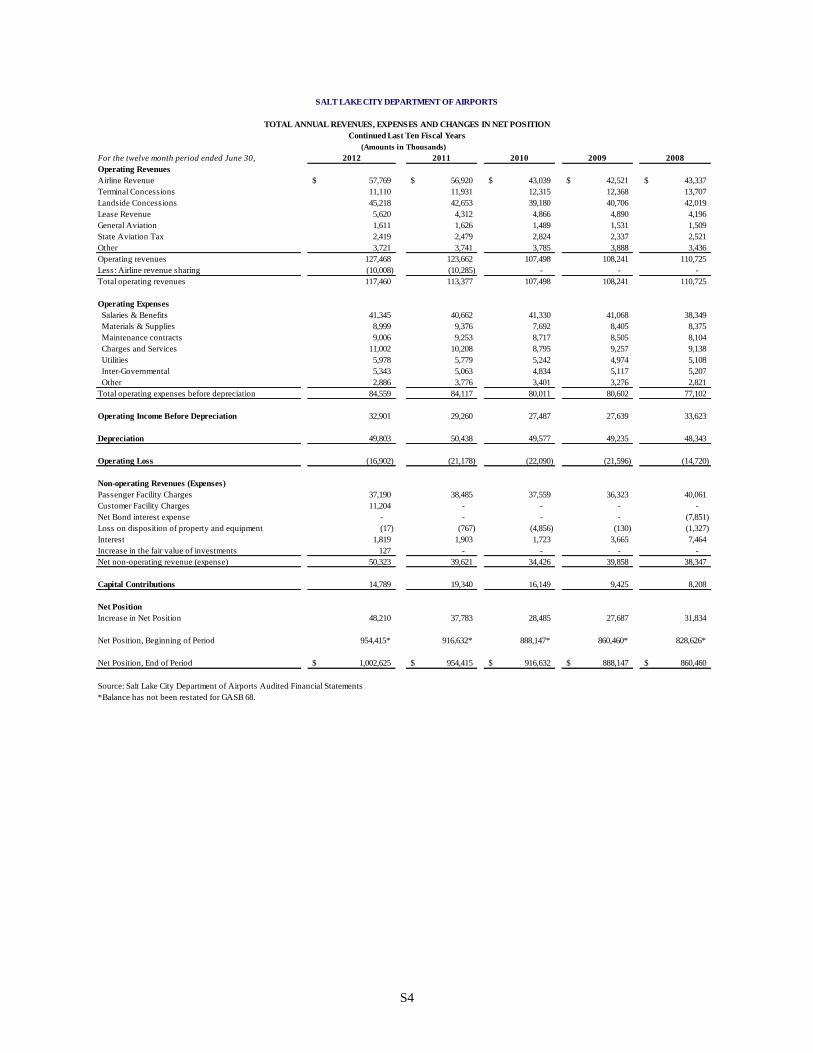
S4
For the twelve month period ended June 30, 2012 2011 2010 2009 2008
Operating Revenues
Airline Revenue 57,769$ 56,920$ 43,039$ 42,521$ 43,337$
Terminal Concessions 11,110 11,931 12,315 12,368 13,707
Landside Concessions 45,218 42,653 39,180 40,706 42,019
Lease Revenue 5,620 4,312 4,866 4,890 4,196
General Aviation 1,611 1,626 1,489 1,531 1,509
State Aviation Tax 2,419 2,479 2,824 2,337 2,521
Other 3,721 3,741 3,785 3,888 3,436
Operating revenues 127,468 123,662 107,498 108,241 110,725
Less: Airline revenue sharing (10,008) (10,285) - - -
Total operating revenues 117,460 113,377 107,498 108,241 110,725
Operating Expenses
Salaries & Benefits 41,345 40,662 41,330 41,068 38,349
Materials & Supplies 8,999 9,376 7,692 8,405 8,375
Maintenance contracts 9,006 9,253 8,717 8,505 8,104
Charges and Services 11,002 10,208 8,795 9,257 9,138
Utilities 5,978 5,779 5,242 4,974 5,108
Inter-Governmental 5,343 5,063 4,834 5,117 5,207
Other 2,886 3,776 3,401 3,276 2,821
Total operating expenses before depreciation 84,559 84,117 80,011 80,602 77,102
Operating Income Before Depreciation 32,901 29,260 27,487 27,639 33,623
Depreciation 49,803 50,438 49,577 49,235 48,343
Operating Loss (16,902) (21,178) (22,090) (21,596) (14,720)
Non-operating Revenues (Expenses)
Passenger Facility Charges 37,190 38,485 37,559 36,323 40,061
Customer Facility Charges 11,204 - - - -
Net Bond interest expense - - - - (7,851)
Loss on disposition of property and equipment (17) (767) (4,856) (130) (1,327)
Interest 1,819 1,903 1,723 3,665 7,464
Increase in the fair value of investments 127 - - - -
Net non-operating revenue (expense) 50,323 39,621 34,426 39,858 38,347
Capital Contributions 14,789 19,340 16,149 9,425 8,208
Net Position
Increase in Net Position 48,210 37,783 28,485 27,687 31,834
Net Position, Beginning of Period 954,415* 916,632* 888,147* 860,460* 828,626*
Net Position, End of Period 1,002,625$ 954,415$ 916,632$ 888,147$ 860,460$
Source: Salt Lake City Department of Airports Audited Financial Statements
*Balance has not been restated for GASB 68.
SALT LAKE CITY DEPARTMENT OF AIRPORTS
TOTAL ANNUAL REVENUES, EXPENSES AND CHANGES IN NET POSITION
Continued Last Ten Fiscal Years
(Amounts in Thousands)

S5
SALT LAKE CITY DEPARTMENT OF AIRPORTS
CASH FLOW TREND
2017 2016 2015 2014 2013
Cash Flows from Operating Activities
Cash received from providing services 156,314$ 145,959$ 139,279$ 135,719$ 129,243$
Cash paid for services by Salt Lake City (7,247) (7,043) (6,978) (7,060) (7,031)
Cash paid to suppliers (37,228) (39,744) (35,717) (39,568) (40,753)
Cash paid to employees (48,872) (46,776) (45,398) (43,763) (42,180)
Net cash from operating activities 62,967 52,396 51,186 45,328 39,279
Cash Flows from Investing Activities
Interest received on investments/Paid for investments 6,677 1,647 11,787 13,385 (45,951)
Net cash from investing activities 6,677 1,647 11,787 13,385 (45,951)
Cash Flows from Noncapital and Related Financing Activities
Cash overdraft with City pooled cash account - (10,043) 10,043 - -
Net cash from noncapital and related financing activities - (10,043) 10,043 - -
Cash Flows from Capital and Related Financing Activities
Purchase of capital equipment (6,861) (7,185) (3,905) (2,546) (2,367)
Payments for acquisition and construction of capital assets (271,753) (146,841) (126,880) (68,077) (43,333)
Proceeds from issuance of revenue bonds payable 1,124,493 - - - -
Bond issuance costs (1,391) - - - -
Passenger Facility Charges 44,932 42,454 40,955 39,096 37,097
Customer Facility Charges 16,129 15,850 15,673 15,563 14,572
Proceeds from sale of property 208 333 134 29 204
Airport improvement grants 22,500 15,902 9,938 25,206 18,150
Net cash from capital and related financing activities 928,257 (79,487) (64,084) 9,271 24,323
Net Increase (Decrease) in Cash and Cash Equivalents 997,901 (35,487) 8,932 67,984 17,651
Cash and Cash Equivalents - Beginning of Year 340,516 376,003 367,071 299,087 281,436
Cash and Cash Equivalents - End of Year 1,338,417$ 340,516$ 376,003$ 367,071$ 299,087$
Source: Salt Lake City Department of Airports Audited Financial Statements
Last Ten Fiscal Years
(Amounts in Thousands)
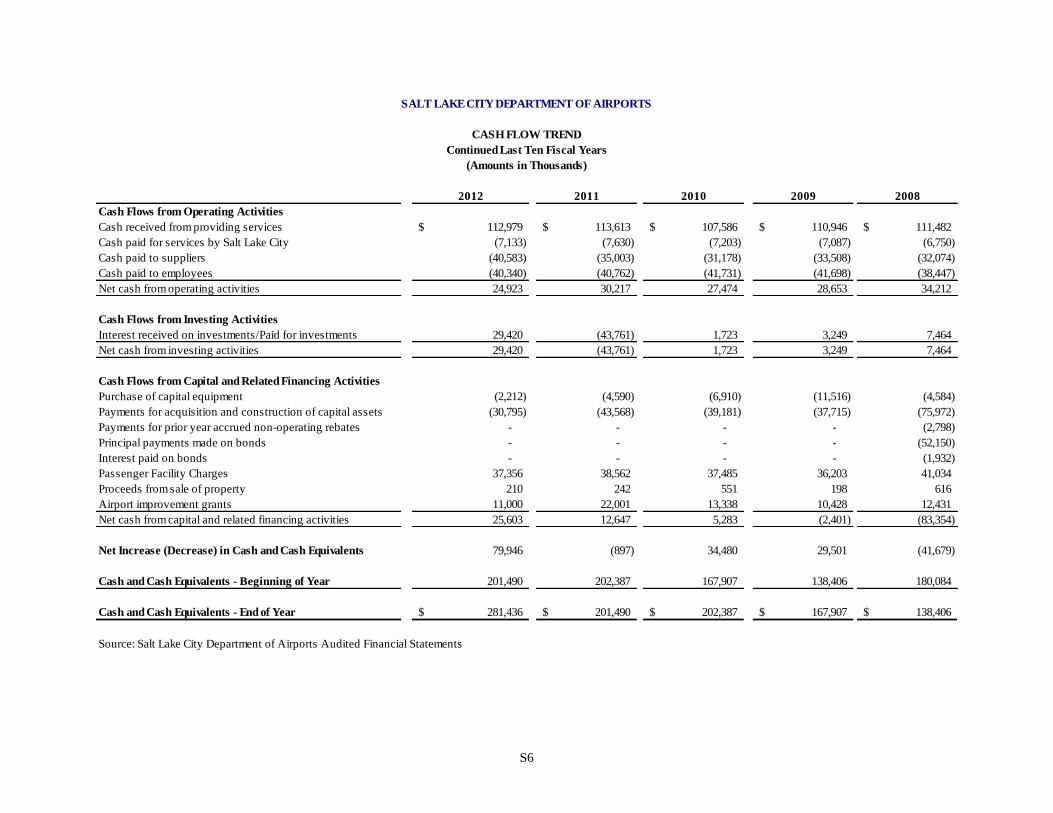
S6
SALT LAKE CITY DEPARTMENT OF AIRPORTS
CASH FLOW TREND
2012 2011 2010 2009 2008
Cash Flows from Operating Activities
Cash received from providing services 112,979$ 113,613$ 107,586$ 110,946$ 111,482$
Cash paid for services by Salt Lake City (7,133) (7,630) (7,203) (7,087) (6,750)
Cash paid to suppliers (40,583) (35,003) (31,178) (33,508) (32,074)
Cash paid to employees (40,340) (40,762) (41,731) (41,698) (38,447)
Net cash from operating activities 24,923 30,217 27,474 28,653 34,212
Cash Flows from Investing Activities
Interest received on investments/Paid for investments 29,420 (43,761) 1,723 3,249 7,464
Net cash from investing activities 29,420 (43,761) 1,723 3,249 7,464
Cash Flows from Capital and Related Financing Activities
Purchase of capital equipment (2,212) (4,590) (6,910) (11,516) (4,584)
Payments for acquisition and construction of capital assets (30,795) (43,568) (39,181) (37,715) (75,972)
Payments for prior year accrued non-operating rebates - - - - (2,798)
Principal payments made on bonds - - - - (52,150)
Interest paid on bonds - - - - (1,932)
Passenger Facility Charges 37,356 38,562 37,485 36,203 41,034
Proceeds from sale of property 210 242 551 198 616
Airport improvement grants 11,000 22,001 13,338 10,428 12,431
Net cash from capital and related financing activities 25,603 12,647 5,283 (2,401) (83,354)
Net Increase (Decrease) in Cash and Cash Equivalents 79,946 (897) 34,480 29,501 (41,679)
Cash and Cash Equivalents - Beginning of Year 201,490 202,387 167,907 138,406 180,084
Cash and Cash Equivalents - End of Year 281,436$ 201,490$ 202,387$ 167,907$ 138,406$
Source: Salt Lake City Department of Airports Audited Financial Statements
(Amounts in Thousands)
Continued Last Ten Fiscal Years
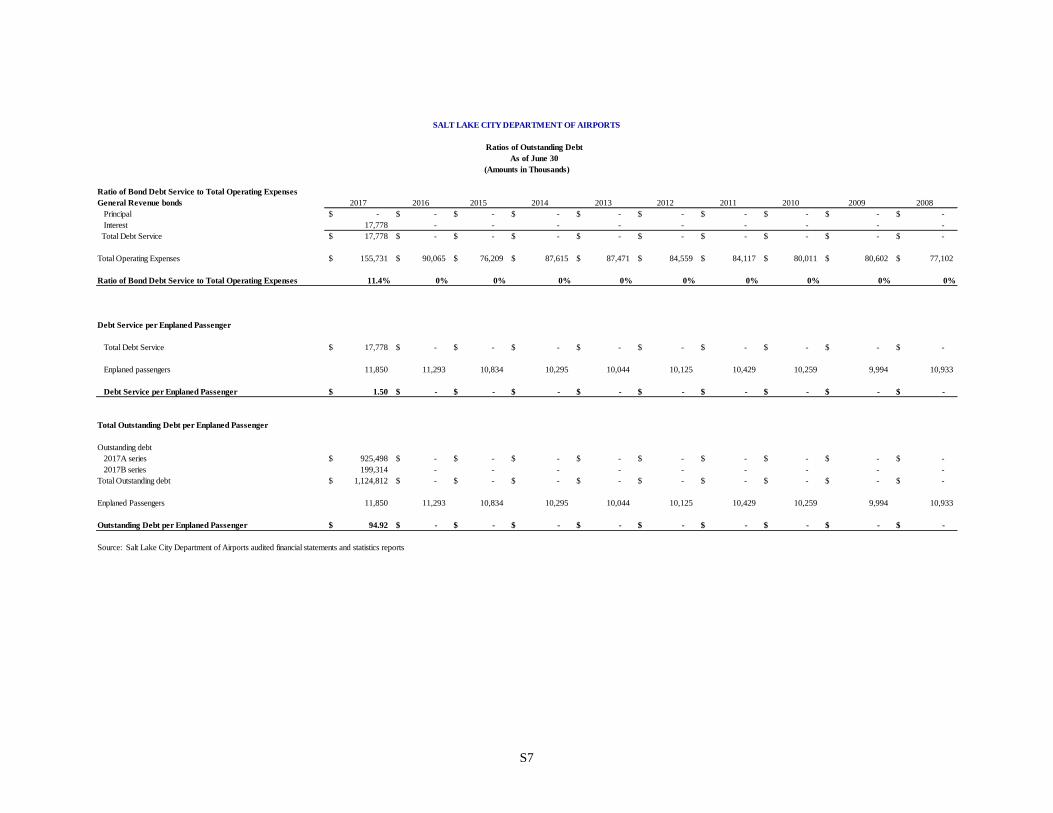
S7
Ratio of Bond Debt Service to Total Operating Expenses
General Revenue bonds 2017 2016 2015 2014 2013 2012 2011 2010 2009 2008
Principal -$ -$ -$ -$ -$ -$ -$ -$ -$ -$
Interest 17,778 - - - - - - - - -
Total Debt Service 17,778$ -$ -$ -$ -$ -$ -$ -$ -$ -$
Total Operating Expenses 155,731$ 90,065$ 76,209$ 87,615$ 87,471$ 84,559$ 84,117$ 80,011$ 80,602$ 77,102$
Ratio of Bond Debt Service to Total Operating Expenses 11.4% 0% 0% 0% 0% 0% 0% 0% 0% 0%
Debt Service per Enplaned Passenger
Total Debt Service 17,778$ -$ -$ -$ -$ -$ -$ -$ -$ -$
Enplaned passengers 11,850 11,293 10,834 10,295 10,044 10,125 10,429 10,259 9,994 10,933
Debt Service per Enplaned Passenger 1.50$ -$ -$ -$ -$ -$ -$ -$ -$ -$
Total Outstanding Debt per Enplaned Passenger
Outstanding debt
2017A series 925,498$ -$ -$ -$ -$ -$ -$ -$ -$ -$
2017B series 199,314 - - - - - - - - -
Total Outstanding debt 1,124,812$ -$ -$ -$ -$ -$ -$ -$ -$ -$
Enplaned Passengers 11,850 11,293 10,834 10,295 10,044 10,125 10,429 10,259 9,994 10,933
Outstanding Debt per Enplaned Passenger 94.92$ -$ -$ -$ -$ -$ -$ -$ -$ -$
Source: Salt Lake City Department of Airports audited financial statements and statistics reports
SALT LAKE CITY DEPARTMENT OF AIRPORTS
Ratios of Outstanding Debt
As of June 30
(Amounts in Thousands)
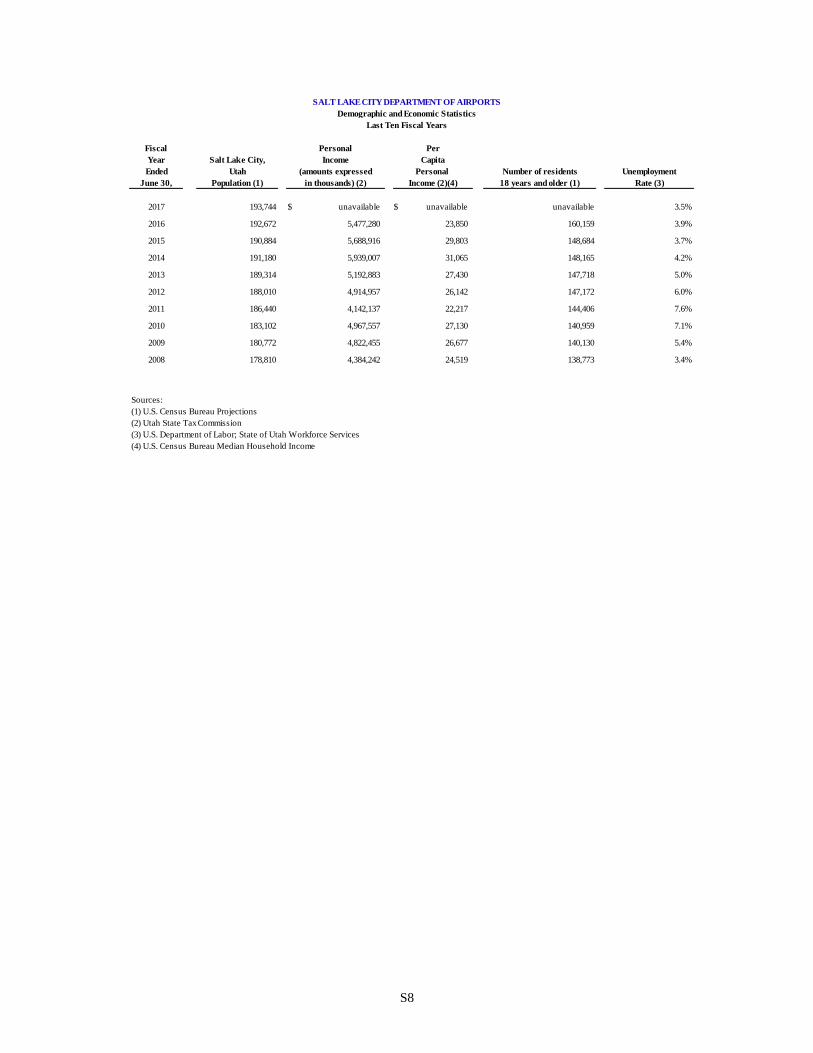
S8
Fiscal Personal Per
Year Salt Lake City, Income Capita
Ended Utah (amounts expressed Personal Number of residents Unemployment
June 30, Population (1) in thousands) (2) Income (2)(4) 18 years and older (1) Rate (3)
2017 193,744 $ unavailable $ unavailable unavailable 3.5%
2016 192,672 5,477,280 23,850 160,159 3.9%
2015 190,884 5,688,916 29,803 148,684 3.7%
2014 191,180 5,939,007 31,065 148,165 4.2%
2013 189,314 5,192,883 27,430 147,718 5.0%
2012 188,010 4,914,957 26,142 147,172 6.0%
2011 186,440 4,142,137 22,217 144,406 7.6%
2010 183,102 4,967,557 27,130 140,959 7.1%
2009 180,772 4,822,455 26,677 140,130 5.4%
2008 178,810 4,384,242 24,519 138,773 3.4%
Sources:
(1) U.S. Census Bureau Projections
(2) Utah State Tax Commission
(3) U.S. Department of Labor; State of Utah Workforce Services
(4) U.S. Census Bureau Median Household Income
SALT LAKE CITY DEPARTMENT OF AIRPORTS
Demographic and Economic Statistics
Last Ten Fiscal Years
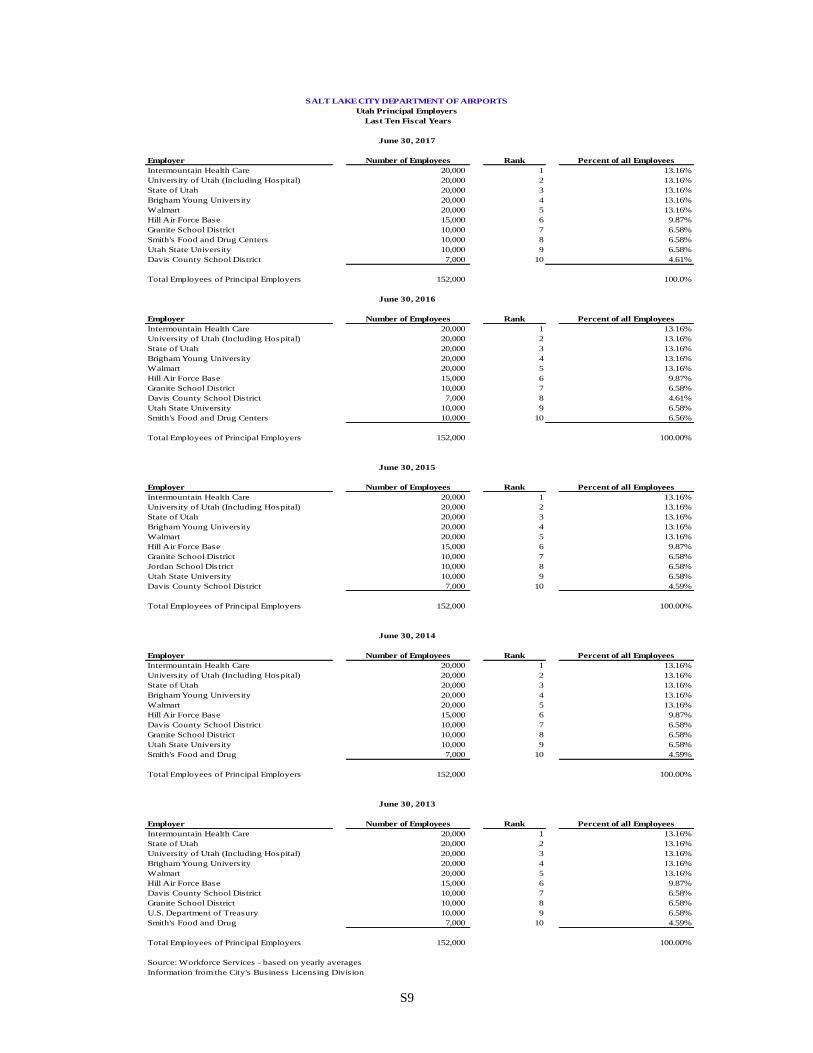
S9
Last Ten Fiscal Years
Employer Number of Employees Rank Percent of all Employees
Intermountain Health Care 20,000 1 13.16%
University of Utah (Including Hospital) 20,000 2 13.16%
State of Utah 20,000 3 13.16%
Brigham Young University 20,000 4 13.16%
Walmart 20,000 5 13.16%
Hill Air Force Base 15,000 6 9.87%
Granite School District 10,000 7 6.58%
Smith's Food and Drug Centers 10,000 8 6.58%
Utah State University 10,000 9 6.58%
Davis County School District 7,000 10 4.61%
Total Employees of Principal Employers 152,000 100.0%
Employer Number of Employees Rank Percent of all Employees
Intermountain Health Care 20,000 1 13.16%
University of Utah (Including Hospital) 20,000 2 13.16%
State of Utah 20,000 3 13.16%
Brigham Young University 20,000 4 13.16%
Walmart 20,000 5 13.16%
Hill Air Force Base 15,000 6 9.87%
Granite School District 10,000 7 6.58%
Davis County School District 7,000 8 4.61%
Utah State University 10,000 9 6.58%
Smith's Food and Drug Centers 10,000 10 6.56%
Total Employees of Principal Employers 152,000 100.00%
Employer Number of Employees Rank Percent of all Employees
Intermountain Health Care 20,000 1 13.16%
University of Utah (Including Hospital) 20,000 2 13.16%
State of Utah 20,000 3 13.16%
Brigham Young University 20,000 4 13.16%
Walmart 20,000 5 13.16%
Hill Air Force Base 15,000 6 9.87%
Granite School District 10,000 7 6.58%
Jordan School District 10,000 8 6.58%
Utah State University 10,000 9 6.58%
Davis County School District 7,000 10 4.59%
Total Employees of Principal Employers 152,000 100.00%
Employer Number of Employees Rank Percent of all Employees
Intermountain Health Care 20,000 1 13.16%
University of Utah (Including Hospital) 20,000 2 13.16%
State of Utah 20,000 3 13.16%
Brigham Young University 20,000 4 13.16%
Walmart 20,000 5 13.16%
Hill Air Force Base 15,000 6 9.87%
Davis County School District 10,000 7 6.58%
Granite School District 10,000 8 6.58%
Utah State University 10,000 9 6.58%
Smith's Food and Drug 7,000 10 4.59%
Total Employees of Principal Employers 152,000 100.00%
Employer Number of Employees Rank Percent of all Employees
Intermountain Health Care 20,000 1 13.16%
State of Utah 20,000 2 13.16%
University of Utah (Including Hospital) 20,000 3 13.16%
Brigham Young University 20,000 4 13.16%
Walmart 20,000 5 13.16%
Hill Air Force Base 15,000 6 9.87%
Davis County School District 10,000 7 6.58%
Granite School District 10,000 8 6.58%
U.S. Department of Treasury 10,000 9 6.58%
Smith's Food and Drug 7,000 10 4.59%
Total Employees of Principal Employers 152,000 100.00%
Source: Workforce Services - based on yearly averages
Information from the City's Business Licensing Division
June 30, 2014
SALT LAKE CITY DEPARTMENT OF AIRPORTS
Utah Principal Employers
June 30, 2013
June 30, 2016
June 30, 2017
June 30, 2015
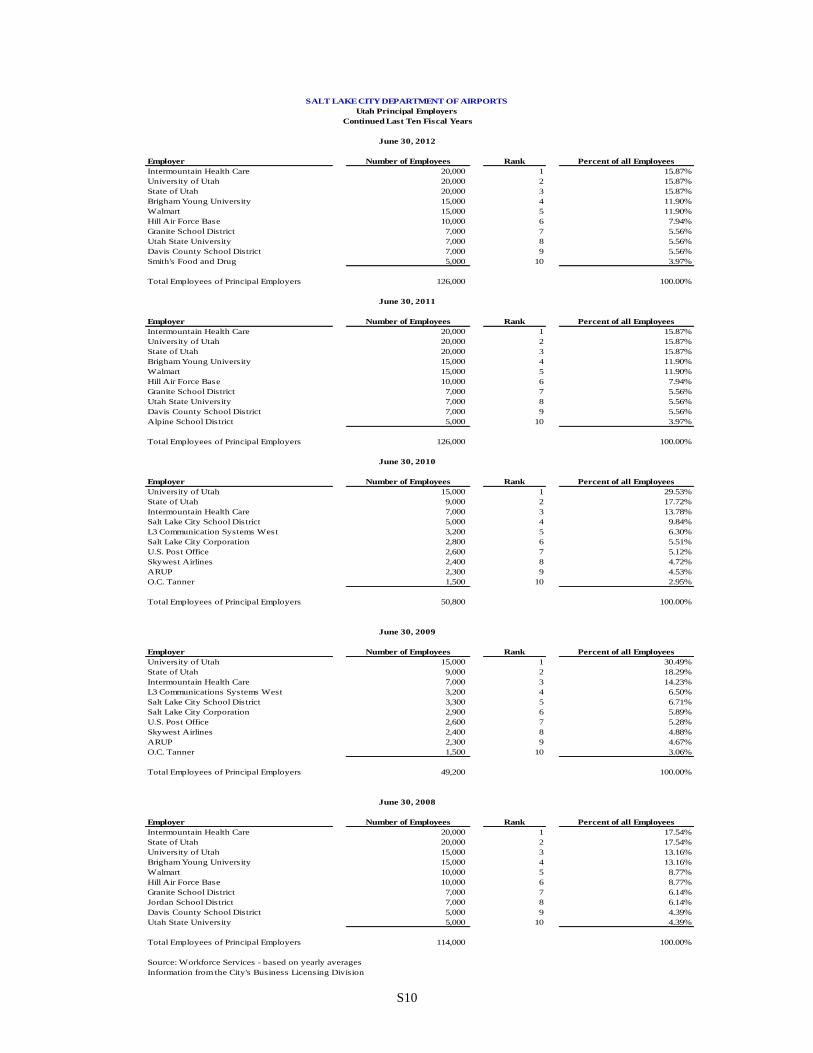
S10
Continued Last Ten Fiscal Years
Employer Number of Employees Rank Percent of all Employees
Intermountain Health Care 20,000 1 15.87%
University of Utah 20,000 2 15.87%
State of Utah 20,000 3 15.87%
Brigham Young University 15,000 4 11.90%
Walmart 15,000 5 11.90%
Hill Air Force Base 10,000 6 7.94%
Granite School District 7,000 7 5.56%
Utah State University 7,000 8 5.56%
Davis County School District 7,000 9 5.56%
Smith's Food and Drug 5,000 10 3.97%
Total Employees of Principal Employers 126,000 100.00%
Employer Number of Employees Rank Percent of all Employees
Intermountain Health Care 20,000 1 15.87%
University of Utah 20,000 2 15.87%
State of Utah 20,000 3 15.87%
Brigham Young University 15,000 4 11.90%
Walmart 15,000 5 11.90%
Hill Air Force Base 10,000 6 7.94%
Granite School District 7,000 7 5.56%
Utah State University 7,000 8 5.56%
Davis County School District 7,000 9 5.56%
Alpine School District 5,000 10 3.97%
Total Employees of Principal Employers 126,000 100.00%
Employer Number of Employees Rank Percent of all Employees
University of Utah 15,000 1 29.53%
State of Utah 9,000 2 17.72%
Intermountain Health Care 7,000 3 13.78%
Salt Lake City School District 5,000 4 9.84%
L3 Communication Systems West 3,200 5 6.30%
Salt Lake City Corporation 2,800 6 5.51%
U.S. Post Office 2,600 7 5.12%
Skywest Airlines 2,400 8 4.72%
ARUP 2,300 9 4.53%
O.C. Tanner 1,500 10 2.95%
Total Employees of Principal Employers 50,800 100.00%
Employer Number of Employees Rank Percent of all Employees
University of Utah 15,000 1 30.49%
State of Utah 9,000 2 18.29%
Intermountain Health Care 7,000 3 14.23%
L3 Communications Systems West 3,200 4 6.50%
Salt Lake City School District 3,300 5 6.71%
Salt Lake City Corporation 2,900 6 5.89%
U.S. Post Office 2,600 7 5.28%
Skywest Airlines 2,400 8 4.88%
ARUP 2,300 9 4.67%
O.C. Tanner 1,500 10 3.06%
Total Employees of Principal Employers 49,200 100.00%
Employer Number of Employees Rank Percent of all Employees
Intermountain Health Care 20,000 1 17.54%
State of Utah 20,000 2 17.54%
University of Utah 15,000 3 13.16%
Brigham Young University 15,000 4 13.16%
Walmart 10,000 5 8.77%
Hill Air Force Base 10,000 6 8.77%
Granite School District 7,000 7 6.14%
Jordan School District 7,000 8 6.14%
Davis County School District 5,000 9 4.39%
Utah State University 5,000 10 4.39%
Total Employees of Principal Employers 114,000 100.00%
Source: Workforce Services - based on yearly averages
Information from the City's Business Licensing Division
June 30, 2011
June 30, 2008
June 30, 2009
June 30, 2010
June 30, 2012
SALT LAKE CITY DEPARTMENT OF AIRPORTS
Utah Principal Employers
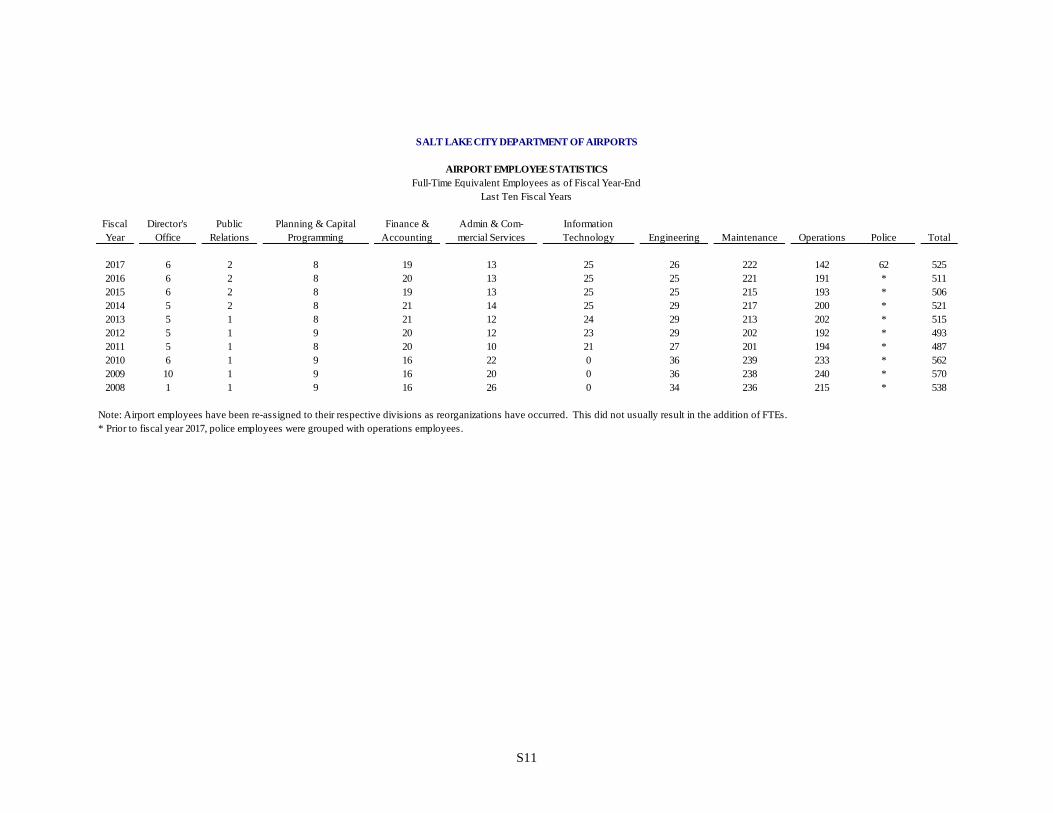
S11
Fiscal Director's Public Planning & Capital Finance & Admin & Com- Information
Year Office Relations Programming Accounting mercial Services Technology Engineering Maintenance Operations Police Total
2017 6 2 8 19 13 25 26 222 142 62 525
2016 6 2 8 20 13 25 25 221 191 * 511
2015 6 2 8 19 13 25 25 215 193 * 506
2014 5 2 8 21 14 25 29 217 200 * 521
2013 5 1 8 21 12 24 29 213 202 * 515
2012 5 1 9 20 12 23 29 202 192 * 493
2011 5 1 8 20 10 21 27 201 194 * 487
2010 6 1 9 16 22 0 36 239 233 * 562
2009 10 1 9 16 20 0 36 238 240 * 570
2008 1 1 9 16 26 0 34 236 215 * 538
Note: Airport employees have been re-assigned to their respective divisions as reorganizations have occurred. This did not usually result in the addition of FTEs.
* Prior to fiscal year 2017, police employees were grouped with operations employees.
SALT LAKE CITY DEPARTMENT OF AIRPORTS
AIRPORT EMPLOYEE STATISTICS
Full-Time Equivalent Employees as of Fiscal Year-End
Last Ten Fiscal Years
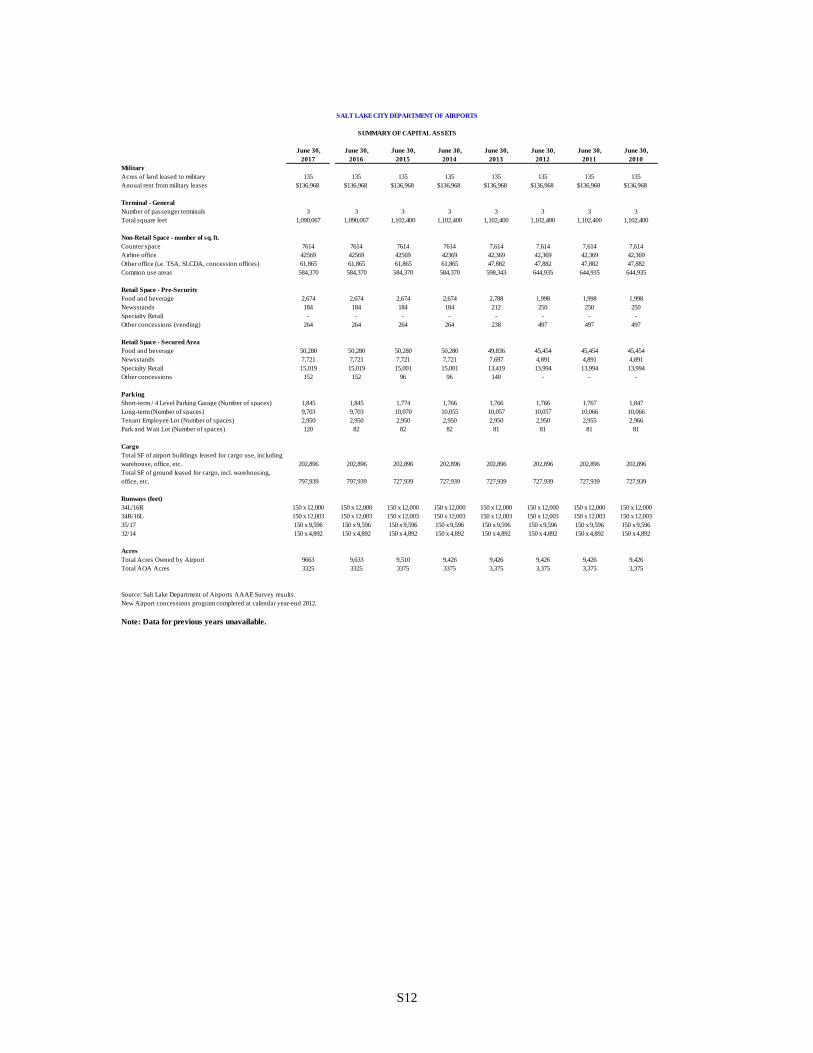
S12
June 30, June 30, June 30, June 30, June 30, June 30, June 30, June 30,
2017 2016 2015 2014 2013 2012 2011 2010
Military
Acres of land leased to military 135 135 135 135 135 135 135 135
Annual rent from military leases $136,968 $136,968 $136,968 $136,968 $136,968 $136,968 $136,968 $136,968
Terminal - General
Number of passenger terminals 3 3 3 3 3 3 3 3
Total square feet 1,090,067 1,090,067 1,102,400 1,102,400 1,102,400 1,102,400 1,102,400 1,102,400
Non-Retail Space - number of sq. ft.
Counter space 7614 7614 7614 7614 7,614 7,614 7,614 7,614
Airline office 42569 42569 42569 42369 42,369 42,369 42,369 42,369
Other office (i.e. TSA, SLCDA, concession offices) 61,865 61,865 61,865 61,865 47,882 47,882 47,882 47,882
Common use areas 584,370 584,370 584,370 584,370 598,343 644,935 644,935 644,935
Retail Space - Pre-Security
Food and beverage 2,674 2,674 2,674 2,674 2,788 1,998 1,998 1,998
Newsstands 184 184 184 184 212 250 250 250
Specialty Retail - - - - - - - -
Other concessions (vending) 264 264 264 264 238 497 497 497
Retail Space - Secured Area
Food and beverage 50,280 50,280 50,280 50,280 49,836 45,454 45,454 45,454
Newsstands 7,721 7,721 7,721 7,721 7,697 4,891 4,891 4,891
Specialty Retail 15,019 15,019 15,001 15,001 13,419 13,994 13,994 13,994
Other concessions 152 152 96 96 140 - - -
Parking
Short-term / 4 Level Parking Garage (Number of spaces) 1,845 1,845 1,774 1,766 1,766 1,766 1,767 1,847
Long-term (Number of spaces) 9,703 9,703 10,070 10,055 10,057 10,057 10,066 10,066
Tenant Employee Lot (Number of spaces) 2,950 2,950 2,950 2,950 2,950 2,950 2,955 2,966
Park and Wait Lot (Number of spaces) 120 82 82 82 81 81 81 81
Cargo
Total SF of airport buildings leased for cargo use, including
warehouse, office, etc. 202,896 202,896 202,896 202,896 202,896 202,896 202,896 202,896
Total SF of ground leased for cargo, incl. warehousing,
office, etc. 797,939 797,939 727,939 727,939 727,939 727,939 727,939 727,939
Runways (feet)
34L/16R 150 x 12,000 150 x 12,000 150 x 12,000 150 x 12,000 150 x 12,000 150 x 12,000 150 x 12,000 150 x 12,000
34R/16L 150 x 12,003 150 x 12,003 150 x 12,003 150 x 12,003 150 x 12,003 150 x 12,003 150 x 12,003 150 x 12,003
35/17 150 x 9,596 150 x 9,596 150 x 9,596 150 x 9,596 150 x 9,596 150 x 9,596 150 x 9,596 150 x 9,596
32/14 150 x 4,892 150 x 4,892 150 x 4,892 150 x 4,892 150 x 4,892 150 x 4,892 150 x 4,892 150 x 4,892
Acres
Total Acres Owned by Airport 9663 9,633 9,510 9,426 9,426 9,426 9,426 9,426
Total AOA Acres 3325 3325 3375 3375 3,375 3,375 3,375 3,375
Source: Salt Lake Department of Airports AAAE Survey results.
New Airport concessions program completed at calendar year-end 2012.
Note: Data for previous years unavailable.
SALT LAKE CITY DEPARTMENT OF AIRPORTS
SUMMARY OF CAPITAL ASSETS

S13
Coverage Type Carrier / Policy # Policy Limits Description / Deductibles Expiration
Bonds (1) Hartford Insurance $10,000,000 Treasurer's Bond 6/4/1752BSBGI7690 $0 Deductible
(2) Hartford Insurance Crimeshield Advanced (Employee Blanket Bond) 7/1/1652FA023369015 $1,000,000 Employee Dishonesty
$50,000 Deductible
$1,000,000 Computer and Funds Transfer Fraud, $50,000 deductible
$50,000 Credit, Debit or Charge Card Forgery$2,500 deductible
$50,000 Money, Securties and Other Property, $2,500 deductible
$50,000 Money Orders and Counterfeit Currency, $0 deductible
$25,000 Depositors Forgery and Alteration, $500 deductible
$25,000 Computer Systems Restoration Expenses, $1,000 deductible
$25,000 Identity Recovery Expenses Reimbursement, $0 deductible
Excess Workers' Comp Safety National $40,000,000 Excess Workers' Compensation 7/1/17SP4053159 Excess of SIR $1,000,000 Self-Insured Retention (SIR) per occurrence
$1,000,000 Employers' Liability coverageper occurrence
General Liability AIG $500,000,000 Bodily Injury, Property Damage, Auto Liability on Airport 6/30/17Dept. of Airports AP 007741005-56 Premises, Hangarkeepers Liability
$50,000,000 Personal & Advertising Injury, Incidental Medical Malpracticeeach offense
$250,000 Fire Legal Liability
$50,000,000 Excess Auto Legal Liability Off-PremisesExcess of SIR $500,000 SIR
Property Insurance Lexington Insurance Co. $500,000,000 Airport Terminals, Concourses, Buildings, Runways, Taxiways 6/30/17Dept. of Airports 014498273 Sublimits apply Equipment, Fuel Farm, Materials, Machinery
$150,000,000 Earth Movement and Flood2% deductible per location; $100,000 min. $5,000,000 max.
$100,000,000 Windstorm or Hail5% deductible, $250,000 min.
$165,971,730 Business Interruption2% deductible per location; $100,000 min. $5,000,000 max.
Not covered Terrorism, Certified & Non-Certified Acts
Comm. Auto Liability Ohio Casualty - Liberty Mutual $500,000 Scheduled Autos Only 6/30/17Dept. of Airports AS7Z11261948016 $0 deductible
SCHEDULE OF INSURANCE POLICIES
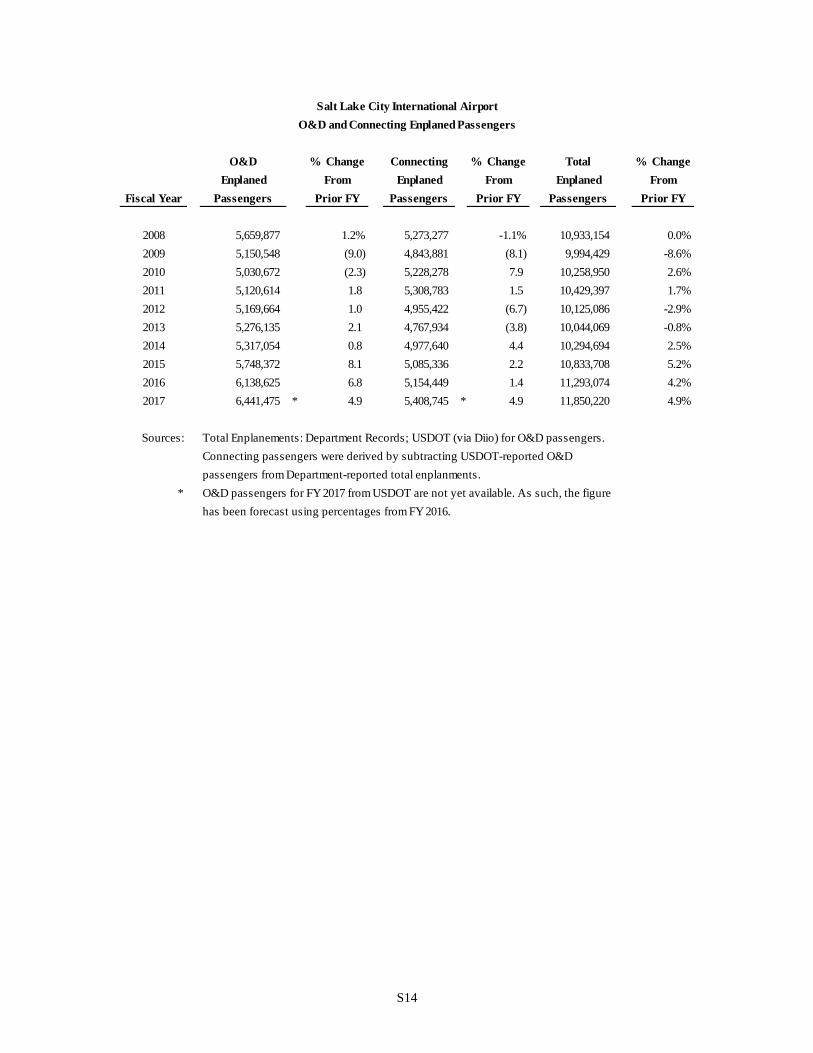
S14
O&D % Change Connecting % Change Total % Change
Enplaned From Enplaned From Enplaned From
Fiscal Year Passengers Prior FY Passengers Prior FY Passengers Prior FY
2008 5,659,877 1.2% 5,273,277 -1.1% 10,933,154 0.0%
2009 5,150,548 (9.0) 4,843,881 (8.1) 9,994,429 -8.6%
2010 5,030,672 (2.3) 5,228,278 7.9 10,258,950 2.6%
2011 5,120,614 1.8 5,308,783 1.5 10,429,397 1.7%
2012 5,169,664 1.0 4,955,422 (6.7) 10,125,086 -2.9%
2013 5,276,135 2.1 4,767,934 (3.8) 10,044,069 -0.8%
2014 5,317,054 0.8 4,977,640 4.4 10,294,694 2.5%
2015 5,748,372 8.1 5,085,336 2.2 10,833,708 5.2%
2016 6,138,625 6.8 5,154,449 1.4 11,293,074 4.2%
2017 6,441,475 * 4.9 5,408,745 * 4.9 11,850,220 4.9%
Sources: Total Enplanements: Department Records; USDOT (via Diio) for O&D passengers.
Connecting passengers were derived by subtracting USDOT-reported O&D
passengers from Department-reported total enplanments.
* O&D passengers for FY 2017 from USDOT are not yet available. As such, the figure
has been forecast using percentages from FY 2016.
Salt Lake City International Airport
O&D and Connecting Enplaned Passengers
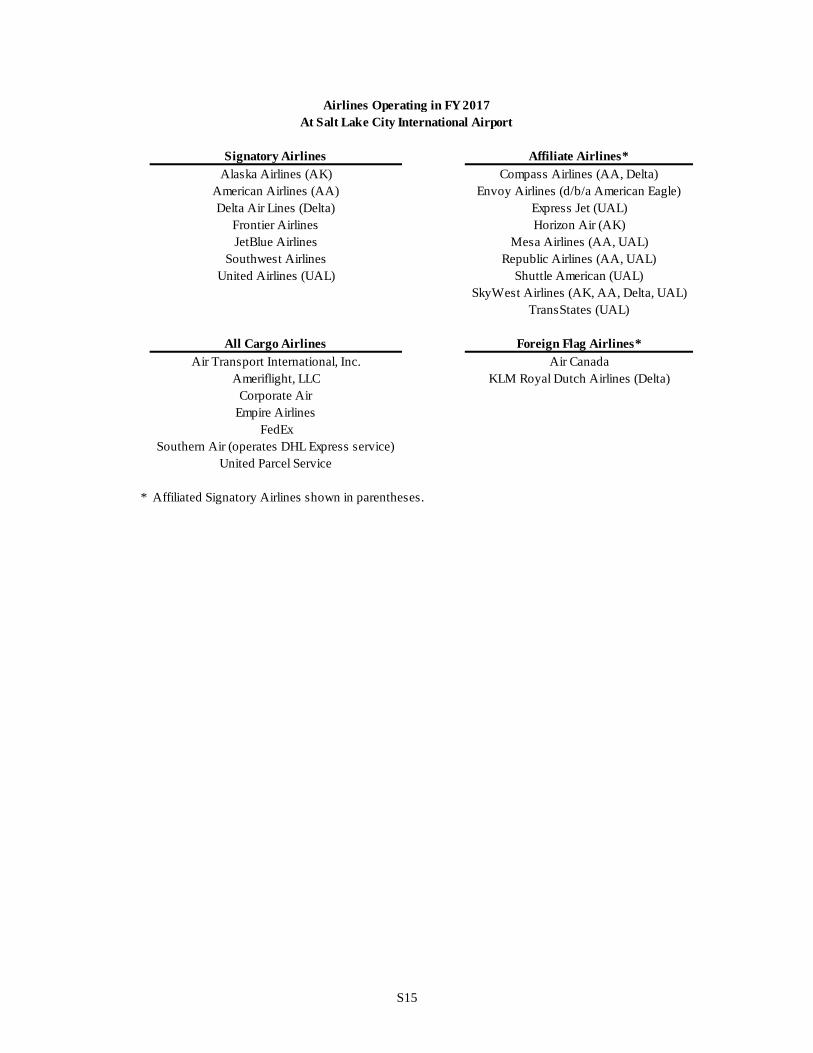
S15
Signatory Airlines Affiliate Airlines*
Alaska Airlines (AK) Compass Airlines (AA, Delta)
American Airlines (AA) Envoy Airlines (d/b/a American Eagle)
Delta Air Lines (Delta) Express Jet (UAL)
Frontier Airlines Horizon Air (AK)
JetBlue Airlines Mesa Airlines (AA, UAL)
Southwest Airlines Republic Airlines (AA, UAL)
United Airlines (UAL) Shuttle American (UAL)
SkyWest Airlines (AK, AA, Delta, UAL)
TransStates (UAL)
All Cargo Airlines Foreign Flag Airlines*
Air Transport International, Inc. Air Canada
Ameriflight, LLC KLM Royal Dutch Airlines (Delta)
Corporate Air
Empire Airlines
FedEx
Southern Air (operates DHL Express service)
United Parcel Service
* Affiliated Signatory Airlines shown in parentheses.
Airlines Operating in FY 2017
At Salt Lake City International Airport
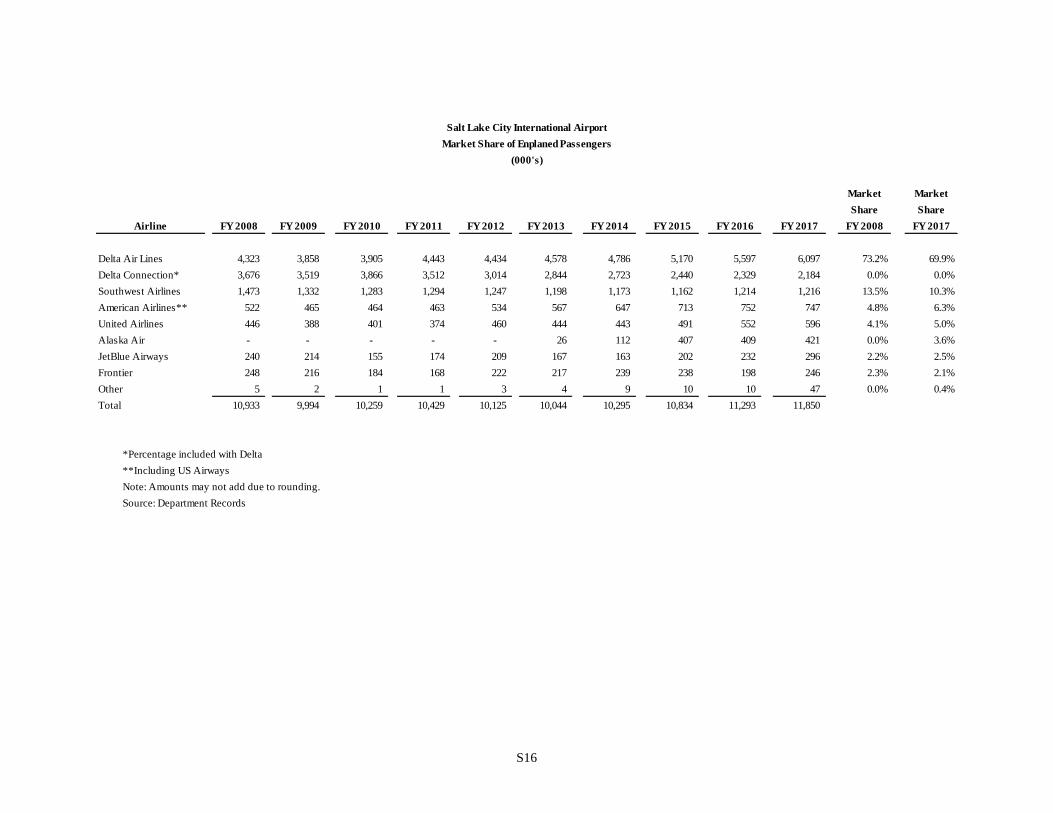
S16
Market Market
Share Share
Airline FY 2008 FY 2009 FY 2010 FY 2011 FY 2012 FY 2013 FY 2014 FY 2015 FY 2016 FY 2017 FY 2008 FY 2017
Delta Air Lines 4,323 3,858 3,905 4,443 4,434 4,578 4,786 5,170 5,597 6,097 73.2% 69.9%
Delta Connection* 3,676 3,519 3,866 3,512 3,014 2,844 2,723 2,440 2,329 2,184 0.0% 0.0%
Southwest Airlines 1,473 1,332 1,283 1,294 1,247 1,198 1,173 1,162 1,214 1,216 13.5% 10.3%
American Airlines** 522 465 464 463 534 567 647 713 752 747 4.8% 6.3%
United Airlines 446 388 401 374 460 444 443 491 552 596 4.1% 5.0%
Alaska Air - - - - - 26 112 407 409 421 0.0% 3.6%
JetBlue Airways 240 214 155 174 209 167 163 202 232 296 2.2% 2.5%
Frontier 248 216 184 168 222 217 239 238 198 246 2.3% 2.1%
Other 5 2 1 1 3 4 9 10 10 47 0.0% 0.4%
Total 10,933 9,994 10,259 10,429 10,125 10,044 10,295 10,834 11,293 11,850
*Percentage included with Delta
**Including US Airways
Note: Amounts may not add due to rounding.
Source: Department Records
Salt Lake City International Airport
Market Share of Enplaned Passengers
(000's)
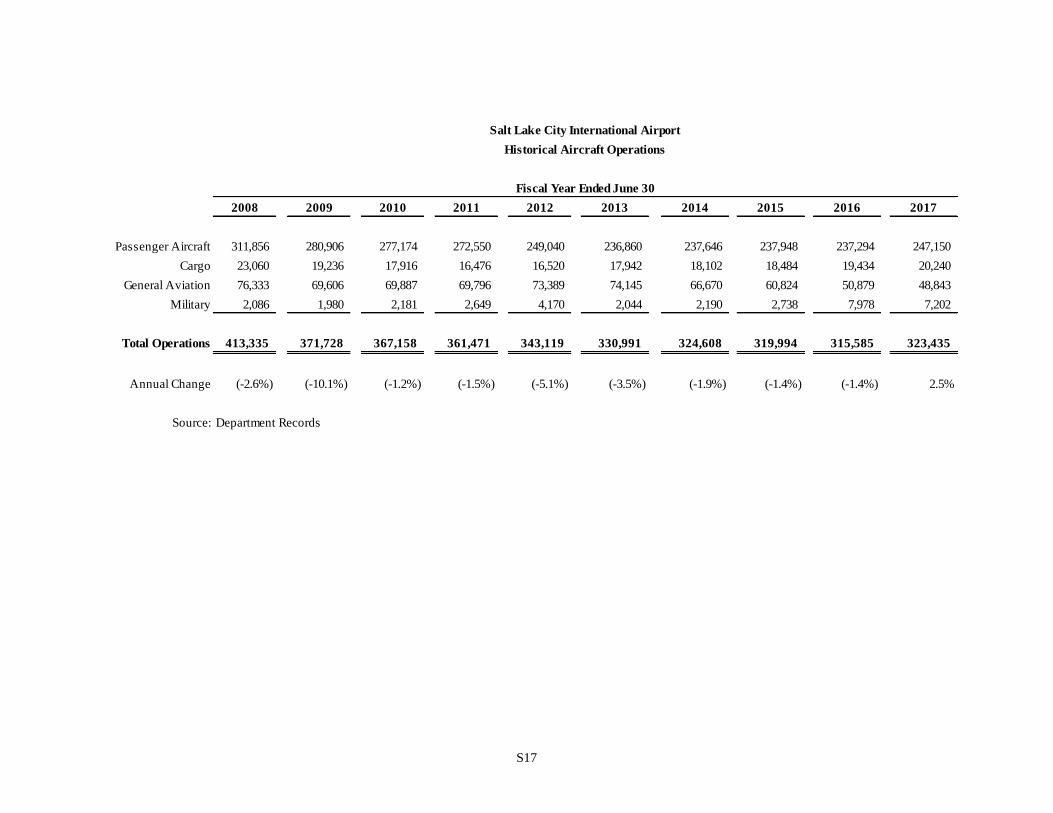
S17
2008 2009 2010 2011 2012 2013 2014 2015 2016 2017
Passenger Aircraft 311,856 280,906 277,174 272,550 249,040 236,860 237,646 237,948 237,294 247,150
Cargo 23,060 19,236 17,916 16,476 16,520 17,942 18,102 18,484 19,434 20,240
General Aviation 76,333 69,606 69,887 69,796 73,389 74,145 66,670 60,824 50,879 48,843
Military 2,086 1,980 2,181 2,649 4,170 2,044 2,190 2,738 7,978 7,202
Total Operations 413,335 371,728 367,158 361,471 343,119 330,991 324,608 319,994 315,585 323,435
Annual Change (-2.6%) (-10.1%) (-1.2%) (-1.5%) (-5.1%) (-3.5%) (-1.9%) (-1.4%) (-1.4%) 2.5%
Source: Department Records
Fiscal Year Ended June 30
Salt Lake City International Airport
Historical Aircraft Operations

S18
2008 2009 2010 2011 2012 2013 2014 2015 2016 2017
Airlines 13,605,760 12,607,823 12,224,725 12,352,045 11,731,536 11,463,695 11,740,729 12,202,986 12,511,833 13,303,497
Cargo 1,074,540 962,603 870,574 878,467 873,214 942,557 938,309 997,992 1,069,830 1,106,147
Total 14,680,300 13,570,426 13,095,299 13,230,512 12,604,750 12,406,252 12,679,038 13,200,978 13,581,663 14,409,644
Annual Change 1.4% (-7.6%) (-3.5%) 1.0% (-4.7%) (-1.6%) 2.2% 4.1% 2.9% 6.1%
Source: Department Records
Fiscal Year Ended June 30
Salt Lake City International Airport
Historical Landed Weights
(Amounts in Thousands of Pounds)
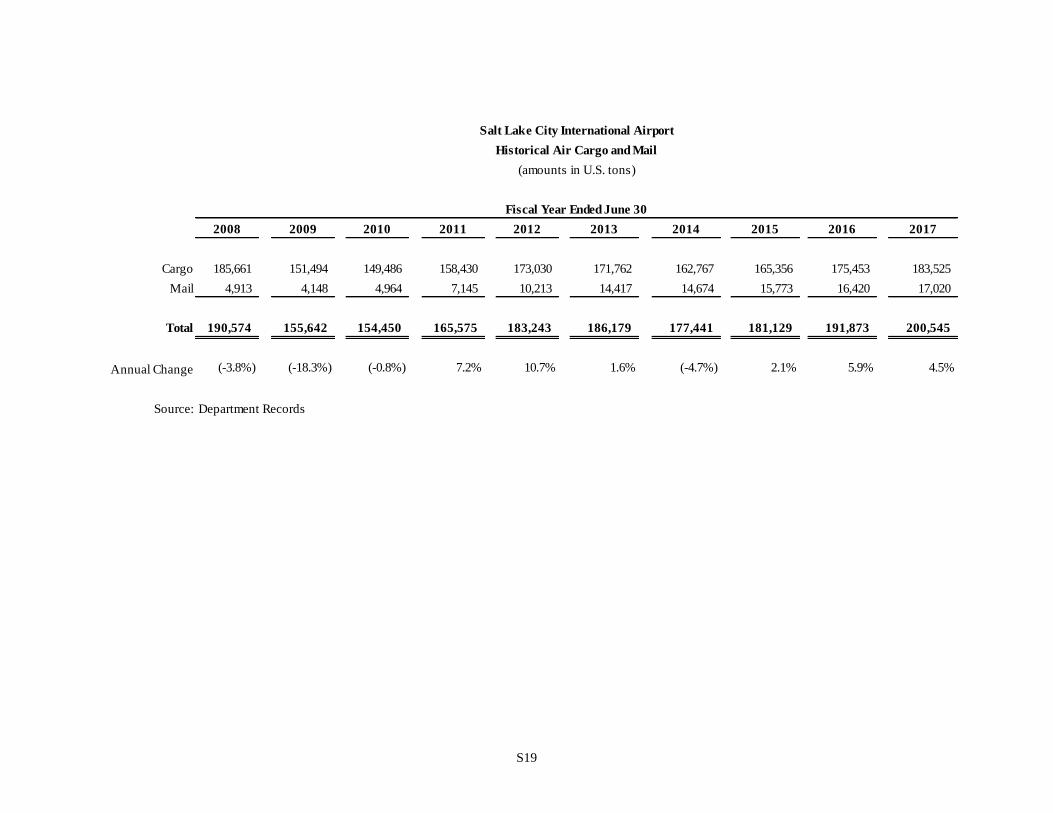
S19
2008 2009 2010 2011 2012 2013 2014 2015 2016 2017
Cargo 185,661 151,494 149,486 158,430 173,030 171,762 162,767 165,356 175,453 183,525
Mail 4,913 4,148 4,964 7,145 10,213 14,417 14,674 15,773 16,420 17,020
Total 190,574 155,642 154,450 165,575 183,243 186,179 177,441 181,129 191,873 200,545
Annual Change (-3.8%) (-18.3%) (-0.8%) 7.2% 10.7% 1.6% (-4.7%) 2.1% 5.9% 4.5%
Source: Department Records
Fiscal Year Ended June 30
Salt Lake City International Airport
Historical Air Cargo and Mail
(amounts in U.S. tons)
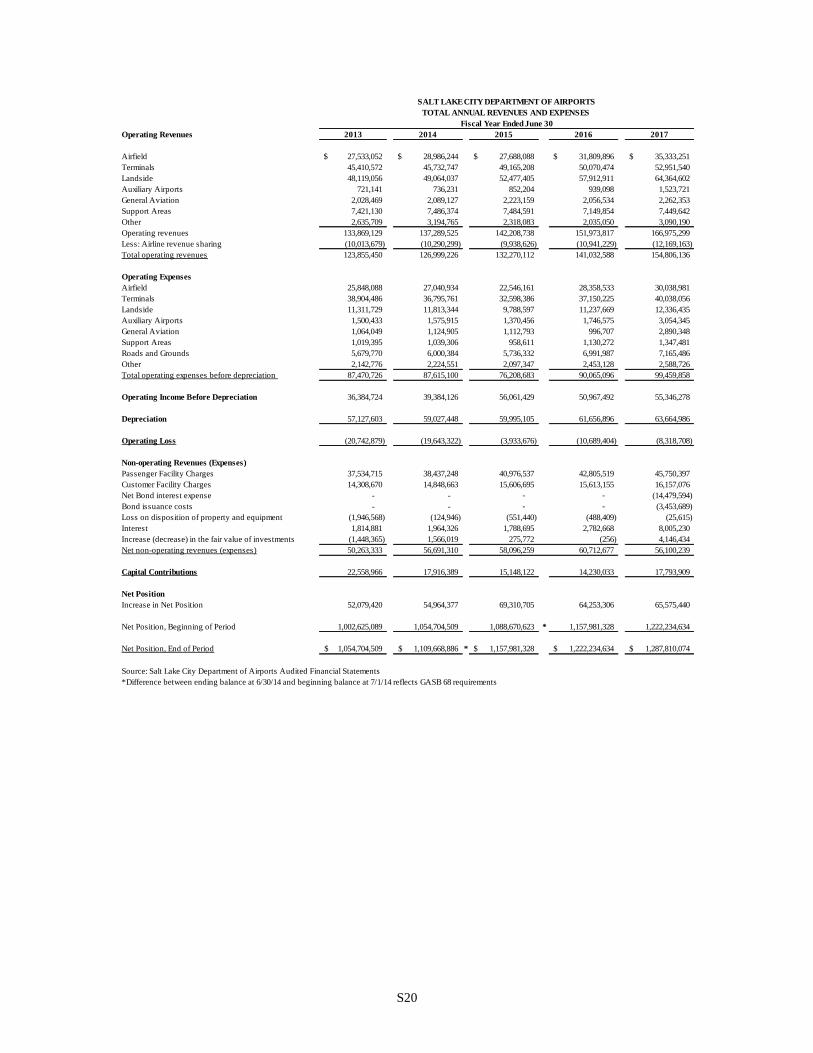
S20
Operating Revenues 2013 2014 2015 2016 2017
Airfield 27,533,052$ 28,986,244$ 27,688,088$ 31,809,896$ 35,333,251$
Terminals 45,410,572 45,732,747 49,165,208 50,070,474 52,951,540
Landside 48,119,056 49,064,037 52,477,405 57,912,911 64,364,602
Auxiliary Airports 721,141 736,231 852,204 939,098 1,523,721
General Aviation 2,028,469 2,089,127 2,223,159 2,056,534 2,262,353
Support Areas 7,421,130 7,486,374 7,484,591 7,149,854 7,449,642
Other 2,635,709 3,194,765 2,318,083 2,035,050 3,090,190
Operating revenues 133,869,129 137,289,525 142,208,738 151,973,817 166,975,299
Less: Airline revenue sharing (10,013,679) (10,290,299) (9,938,626) (10,941,229) (12,169,163)
Total operating revenues 123,855,450 126,999,226 132,270,112 141,032,588 154,806,136
Operating Expenses
Airfield 25,848,088 27,040,934 22,546,161 28,358,533 30,038,981
Terminals 38,904,486 36,795,761 32,598,386 37,150,225 40,038,056
Landside 11,311,729 11,813,344 9,788,597 11,237,669 12,336,435
Auxiliary Airports 1,500,433 1,575,915 1,370,456 1,746,575 3,054,345
General Aviation 1,064,049 1,124,905 1,112,793 996,707 2,890,348
Support Areas 1,019,395 1,039,306 958,611 1,130,272 1,347,481
Roads and Grounds 5,679,770 6,000,384 5,736,332 6,991,987 7,165,486
Other 2,142,776 2,224,551 2,097,347 2,453,128 2,588,726
Total operating expenses before depreciation 87,470,726 87,615,100 76,208,683 90,065,096 99,459,858
Operating Income Before Depreciation 36,384,724 39,384,126 56,061,429 50,967,492 55,346,278
Depreciation 57,127,603 59,027,448 59,995,105 61,656,896 63,664,986
Operating Loss (20,742,879) (19,643,322) (3,933,676) (10,689,404) (8,318,708)
Non-operating Revenues (Expenses)
Passenger Facility Charges 37,534,715 38,437,248 40,976,537 42,805,519 45,750,397
Customer Facility Charges 14,308,670 14,848,663 15,606,695 15,613,155 16,157,076
Net Bond interest expense - - - - (14,479,594)
Bond issuance costs - - - - (3,453,689)
Loss on disposition of property and equipment (1,946,568) (124,946) (551,440) (488,409) (25,615)
Interest 1,814,881 1,964,326 1,788,695 2,782,668 8,005,230
Increase (decrease) in the fair value of investments (1,448,365) 1,566,019 275,772 (256) 4,146,434
Net non-operating revenues (expenses) 50,263,333 56,691,310 58,096,259 60,712,677 56,100,239
Capital Contributions 22,558,966 17,916,389 15,148,122 14,230,033 17,793,909
Net Position
Increase in Net Position 52,079,420 54,964,377 69,310,705 64,253,306 65,575,440
Net Position, Beginning of Period 1,002,625,089 1,054,704,509 1,088,670,623 * 1,157,981,328 1,222,234,634
Net Position, End of Period 1,054,704,509$ 1,109,668,886$ * 1,157,981,328$ 1,222,234,634$ 1,287,810,074$
Source: Salt Lake City Department of Airports Audited Financial Statements
*Difference between ending balance at 6/30/14 and beginning balance at 7/1/14 reflects GASB 68 requirements
SALT LAKE CITY DEPARTMENT OF AIRPORTS
TOTAL ANNUAL REVENUES AND EXPENSES
Fiscal Year Ended June 30
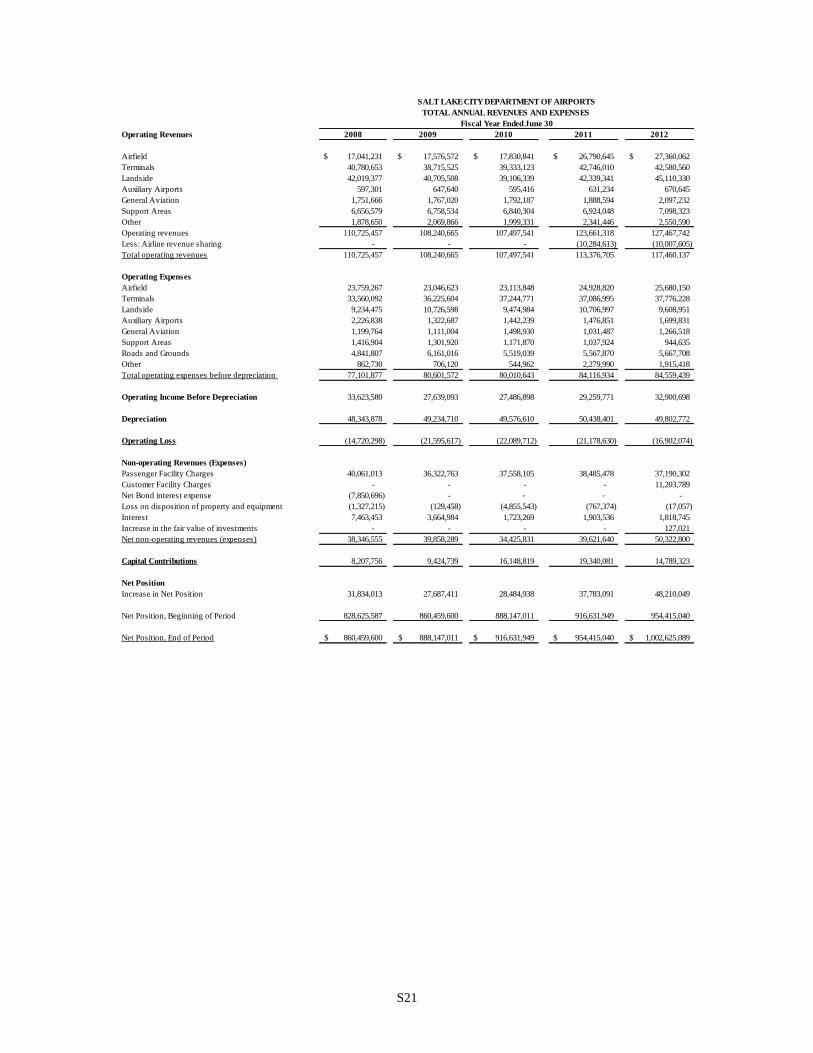
S21
Operating Revenues 2008 2009 2010 2011 2012
Airfield 17,041,231$ 17,576,572$ 17,830,841$ 26,790,645$ 27,360,062$
Terminals 40,780,653 38,715,525 39,333,123 42,746,010 42,580,560
Landside 42,019,377 40,705,508 39,106,339 42,339,341 45,110,330
Auxiliary Airports 597,301 647,640 595,416 631,234 670,645
General Aviation 1,751,666 1,767,020 1,792,187 1,888,594 2,097,232
Support Areas 6,656,579 6,758,534 6,840,304 6,924,048 7,098,323
Other 1,878,650 2,069,866 1,999,331 2,341,446 2,550,590
Operating revenues 110,725,457 108,240,665 107,497,541 123,661,318 127,467,742
Less: Airline revenue sharing - - - (10,284,613) (10,007,605)
Total operating revenues 110,725,457 108,240,665 107,497,541 113,376,705 117,460,137
Operating Expenses
Airfield 23,759,267 23,046,623 23,113,848 24,928,820 25,680,150
Terminals 33,560,092 36,225,604 37,244,771 37,086,995 37,776,228
Landside 9,234,475 10,726,598 9,474,984 10,706,997 9,608,951
Auxiliary Airports 2,226,838 1,322,687 1,442,239 1,476,851 1,699,831
General Aviation 1,199,764 1,111,004 1,498,930 1,031,487 1,266,518
Support Areas 1,416,904 1,301,920 1,171,870 1,037,924 944,635
Roads and Grounds 4,841,807 6,161,016 5,519,039 5,567,870 5,667,708
Other 862,730 706,120 544,962 2,279,990 1,915,418
Total operating expenses before depreciation 77,101,877 80,601,572 80,010,643 84,116,934 84,559,439
Operating Income Before Depreciation 33,623,580 27,639,093 27,486,898 29,259,771 32,900,698
Depreciation 48,343,878 49,234,710 49,576,610 50,438,401 49,802,772
Operating Loss (14,720,298) (21,595,617) (22,089,712) (21,178,630) (16,902,074)
Non-operating Revenues (Expenses)
Passenger Facility Charges 40,061,013 36,322,763 37,558,105 38,485,478 37,190,302
Customer Facility Charges - - - - 11,203,789
Net Bond interest expense (7,850,696) - - - -
Loss on disposition of property and equipment (1,327,215) (129,458) (4,855,543) (767,374) (17,057)
Interest 7,463,453 3,664,984 1,723,269 1,903,536 1,818,745
Increase in the fair value of investments - - - - 127,021
Net non-operating revenues (expenses) 38,346,555 39,858,289 34,425,831 39,621,640 50,322,800
Capital Contributions 8,207,756 9,424,739 16,148,819 19,340,081 14,789,323
Net Position
Increase in Net Position 31,834,013 27,687,411 28,484,938 37,783,091 48,210,049
Net Position, Beginning of Period 828,625,587 860,459,600 888,147,011 916,631,949 954,415,040
Net Position, End of Period 860,459,600$ 888,147,011$ 916,631,949$ 954,415,040$ 1,002,625,089$
Fiscal Year Ended June 30
SALT LAKE CITY DEPARTMENT OF AIRPORTS
TOTAL ANNUAL REVENUES AND EXPENSES

S22
2008 2009 2010 2011 2012 2013 2014 2015 2016 2017
Landing Fees 12,888$ 13,528$ 13,541$ 22,092$ 23,059$ 23,662$ 25,000$ 23,199$ 27,023$ 30,020$
Airline Terminal Space Rentals 23,645 22,277 22,934 27,378 27,827 27,590 26,812 29,019 28,500 29,775
Other Airline Revenues 7,099 7,051 6,918 6,427 6,881 7,171 7,098 7,201 6,931 6,844
Car Rental 16,314 14,149 14,505 16,346 16,697 17,482 18,064 19,341 22,142 27,186
Auto Parking Facilities 24,817 25,714 23,811 25,067 26,282 28,619 29,228 31,117 33,409 34,297
Other Terminal Rentals 22,955 22,698 22,497 23,405 23,862 26,909 28,431 29,467 30,859 35,042
Other Revenues 3,007 2,824 3,292 2,947 2,860 2,436 2,657 2,864 3,110 3,811
Credit Revenue Sharing - - - (10,285) (10,008) (10,014) (10,290) (9,938) (10,941) (12,169)
Total Operating Revenues 110,725$ 108,241$ 107,498$ 113,377$ 117,460$ 123,855$ 127,000$ 132,270$ 141,033$ 154,806$
Source: Department Records
SALT LAKE CITY DEPARTMENT OF AIRPORTS
SUMMARY OF OPERATING REVENUES
(Amounts in Thousands)
Fiscal Year Ended June 30,
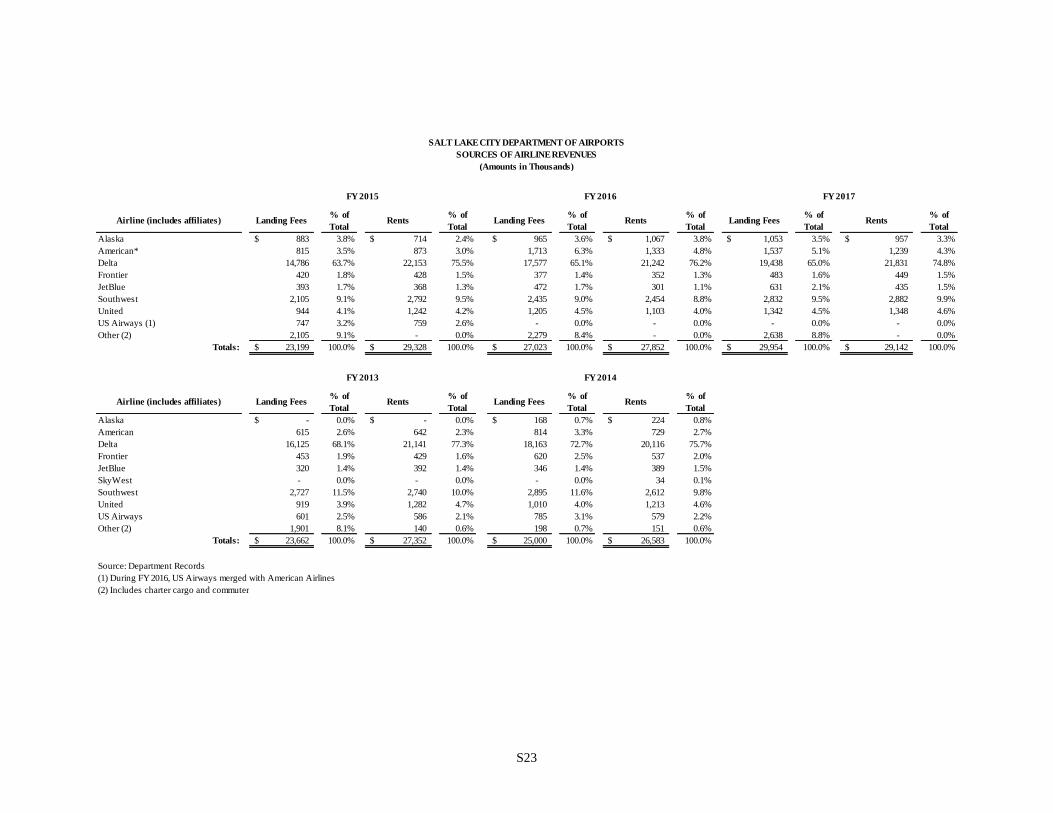
S23
Airline (includes affiliates) Landing Fees% of
TotalRents
% of
TotalLanding Fees
% of
TotalRents
% of
TotalLanding Fees
% of
TotalRents
% of
Total
Alaska 883$ 3.8% 714$ 2.4% 965$ 3.6% 1,067$ 3.8% 1,053$ 3.5% 957$ 3.3%
American* 815 3.5% 873 3.0% 1,713 6.3% 1,333 4.8% 1,537 5.1% 1,239 4.3%
Delta 14,786 63.7% 22,153 75.5% 17,577 65.1% 21,242 76.2% 19,438 65.0% 21,831 74.8%
Frontier 420 1.8% 428 1.5% 377 1.4% 352 1.3% 483 1.6% 449 1.5%
JetBlue 393 1.7% 368 1.3% 472 1.7% 301 1.1% 631 2.1% 435 1.5%
Southwest 2,105 9.1% 2,792 9.5% 2,435 9.0% 2,454 8.8% 2,832 9.5% 2,882 9.9%
United 944 4.1% 1,242 4.2% 1,205 4.5% 1,103 4.0% 1,342 4.5% 1,348 4.6%
US Airways (1) 747 3.2% 759 2.6% - 0.0% - 0.0% - 0.0% - 0.0%
Other (2) 2,105 9.1% - 0.0% 2,279 8.4% - 0.0% 2,638 8.8% - 0.0%
Totals: 23,199$ 100.0% 29,328$ 100.0% 27,023$ 100.0% 27,852$ 100.0% 29,954$ 100.0% 29,142$ 100.0%
Airline (includes affiliates) Landing Fees% of
TotalRents
% of
TotalLanding Fees
% of
TotalRents
% of
Total
Alaska -$ 0.0% -$ 0.0% 168$ 0.7% 224$ 0.8%
American 615 2.6% 642 2.3% 814 3.3% 729 2.7%
Delta 16,125 68.1% 21,141 77.3% 18,163 72.7% 20,116 75.7%
Frontier 453 1.9% 429 1.6% 620 2.5% 537 2.0%
JetBlue 320 1.4% 392 1.4% 346 1.4% 389 1.5%
SkyWest - 0.0% - 0.0% - 0.0% 34 0.1%
Southwest 2,727 11.5% 2,740 10.0% 2,895 11.6% 2,612 9.8%
United 919 3.9% 1,282 4.7% 1,010 4.0% 1,213 4.6%
US Airways 601 2.5% 586 2.1% 785 3.1% 579 2.2%
Other (2) 1,901 8.1% 140 0.6% 198 0.7% 151 0.6%
Totals: 23,662$ 100.0% 27,352$ 100.0% 25,000$ 100.0% 26,583$ 100.0%
Source: Department Records
(1) During FY 2016, US Airways merged with American Airlines
(2) Includes charter cargo and commuter
FY 2015
FY 2013 FY 2014
SALT LAKE CITY DEPARTMENT OF AIRPORTS
SOURCES OF AIRLINE REVENUES
(Amounts in Thousands)
FY 2017FY 2016
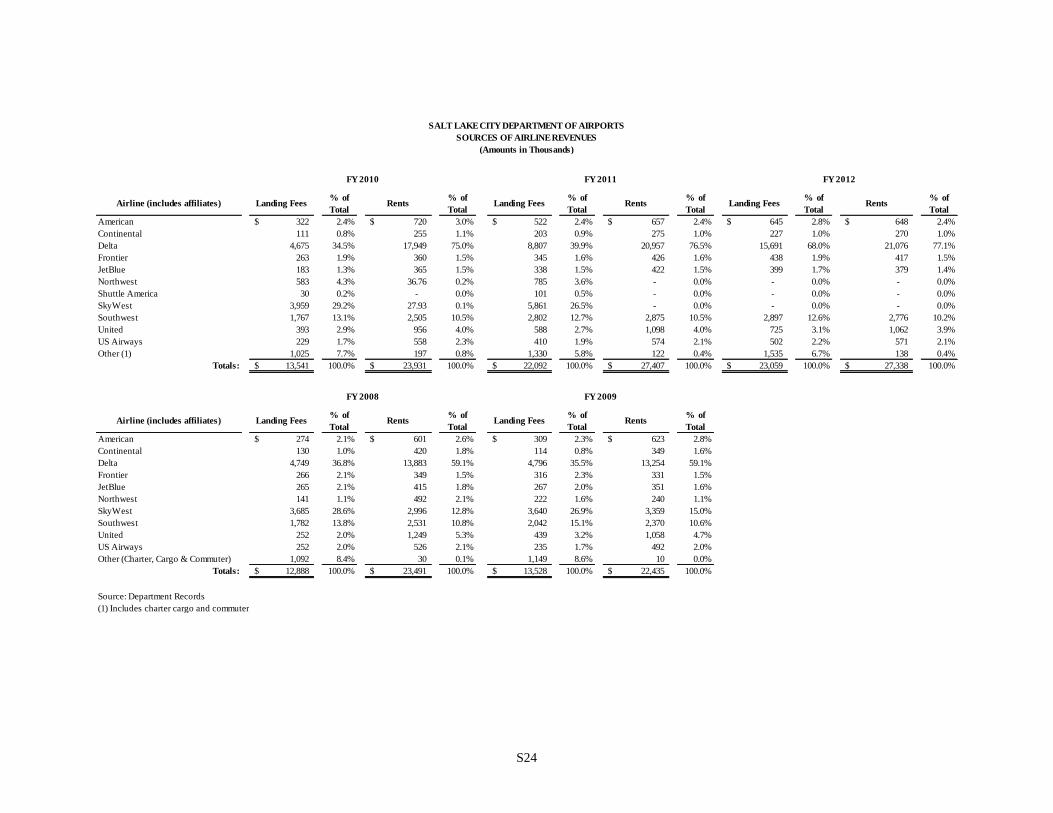
S24
Airline (includes affiliates) Landing Fees% of
TotalRents
% of
TotalLanding Fees
% of
TotalRents
% of
TotalLanding Fees
% of
TotalRents
% of
Total
American 322$ 2.4% 720$ 3.0% 522$ 2.4% 657$ 2.4% 645$ 2.8% 648$ 2.4%
Continental 111 0.8% 255 1.1% 203 0.9% 275 1.0% 227 1.0% 270 1.0%
Delta 4,675 34.5% 17,949 75.0% 8,807 39.9% 20,957 76.5% 15,691 68.0% 21,076 77.1%
Frontier 263 1.9% 360 1.5% 345 1.6% 426 1.6% 438 1.9% 417 1.5%
JetBlue 183 1.3% 365 1.5% 338 1.5% 422 1.5% 399 1.7% 379 1.4%
Northwest 583 4.3% 36.76 0.2% 785 3.6% - 0.0% - 0.0% - 0.0%
Shuttle America 30 0.2% - 0.0% 101 0.5% - 0.0% - 0.0% - 0.0%
SkyWest 3,959 29.2% 27.93 0.1% 5,861 26.5% - 0.0% - 0.0% - 0.0%
Southwest 1,767 13.1% 2,505 10.5% 2,802 12.7% 2,875 10.5% 2,897 12.6% 2,776 10.2%
United 393 2.9% 956 4.0% 588 2.7% 1,098 4.0% 725 3.1% 1,062 3.9%
US Airways 229 1.7% 558 2.3% 410 1.9% 574 2.1% 502 2.2% 571 2.1%
Other (1) 1,025 7.7% 197 0.8% 1,330 5.8% 122 0.4% 1,535 6.7% 138 0.4%
Totals: 13,541$ 100.0% 23,931$ 100.0% 22,092$ 100.0% 27,407$ 100.0% 23,059$ 100.0% 27,338$ 100.0%
Airline (includes affiliates) Landing Fees% of
TotalRents
% of
TotalLanding Fees
% of
TotalRents
% of
Total
American 274$ 2.1% 601$ 2.6% 309$ 2.3% 623$ 2.8%
Continental 130 1.0% 420 1.8% 114 0.8% 349 1.6%
Delta 4,749 36.8% 13,883 59.1% 4,796 35.5% 13,254 59.1%
Frontier 266 2.1% 349 1.5% 316 2.3% 331 1.5%
JetBlue 265 2.1% 415 1.8% 267 2.0% 351 1.6%
Northwest 141 1.1% 492 2.1% 222 1.6% 240 1.1%
SkyWest 3,685 28.6% 2,996 12.8% 3,640 26.9% 3,359 15.0%
Southwest 1,782 13.8% 2,531 10.8% 2,042 15.1% 2,370 10.6%
United 252 2.0% 1,249 5.3% 439 3.2% 1,058 4.7%
US Airways 252 2.0% 526 2.1% 235 1.7% 492 2.0%
Other (Charter, Cargo & Commuter) 1,092 8.4% 30 0.1% 1,149 8.6% 10 0.0%
Totals: 12,888$ 100.0% 23,491$ 100.0% 13,528$ 100.0% 22,435$ 100.0%
Source: Department Records
(1) Includes charter cargo and commuter
FY 2010
(Amounts in Thousands)
FY 2008 FY 2009
FY 2012FY 2011
SALT LAKE CITY DEPARTMENT OF AIRPORTS
SOURCES OF AIRLINE REVENUES

S25
2008 2009 2010 2011 2012 2013 2014 2015 2016 2017
Personnel Services 38,349$ 41,068$ 41,330$ 40,661$ 41,345$ 42,347$ 44,916$ 33,880$ 45,096$ 49,350$
Charges/Services/Fees 18,535 19,194 18,791 21,006 20,773 19,796 18,547 19,785 20,811 24,901
Operational Maintenance Supplies 8,374 8,405 7,692 9,376 8,999 11,118 10,755 9,487 10,940 11,725
Utilities 4,556 4,407 4,927 5,405 5,630 6,122 6,209 6,313 6,175 5,946
Fire Services 3,917 3,854 3,689 3,840 4,091 4,152 4,185 4,314 4,597 4,886
Salt Lake City Administration 3,371 3,674 3,581 3,829 3,721 3,935 3,003 2,430 2,446 2,651
Total Operating Expenses 77,102$ 80,602$ 80,010$ 84,117$ 84,559$ 87,470$ 87,615$ 76,209$ 90,065$ 99,459$
Source: Department Records
SALT LAKE CITY DEPARTMENT OF AIRPORTS
SUMMARY OF OPERATING EXPENSES
(Amounts in Thousands)
Fiscal Year Ended June 30,