salinity 10 costs - Office of Environment and Heritage Benefit-Cost Analysis of Salinity Management...
16
Transcript of salinity 10 costs - Office of Environment and Heritage Benefit-Cost Analysis of Salinity Management...

First published 2005 © Department of Infrastructure, Planning and Natural Resources
Costs of Urban SalinityLocal Government Salinity Initiative - Booklet No.10ISBN: 0 7347 5469 8
Contents
1. Introduction 1
2. Costs of Urban Salinity 2
2.1 Roads 4
2.2 Buildings 6
2.3 Water Supply 7
3. Urban Salinity Management 9
3.1 Engineering Options 10
3.2 Benefit-Cost Analysis of Salinity Management Strategies 10
4. Concluding Remarks 12
5. References 13
Department of Primary Industries

1
This booklet comprises a literature review and analysis of the existing information related to the economics of urban salinity. It has been developed to assist local government participation in the evaluation of the net benefit of remedial action for urban salinity problems. Other booklets in the Local Government Salinity Initiative series outline urban salinity indicators, investigations, processes, impacts and management.
A full evaluation of a proposed management strategy to address urban salinity would normally include determining any social, environmental and financial impact of the strategy. Identifying and valuing the costs of urban salinity is integral to evaluating the financial component of the proposed strategy.
Of the various methods of performing a financial evaluation, the most common is a benefit-cost analysis whereby the present value of all the financial benefits of undertaking the plan are compared to the present value of all the costs of implementing the plan. When the net present value of a plan is positive, the benefits are more than the costs of the plan and the plan adds economic value. When the net present value is negative, the costs are more than the benefits of the plan and the plan diminishes economic value.
Valuing the environmental and social consequences of changes in the natural environment is often difficult. There are several techniques for determining the value of these impacts. However, these methods are often costly, time consuming and require large amounts of data and statistical analysis. Further information on the various techniques available and details of previous studies can be found at www.epa.nsw.gov.au/envalue.
Although this booklet will focus only on the more easily costed urban salinity impacts, readers need to consider that there will be environmental and social outcomes in addition to the economic outcomes listed.
1. Introduction
Salt crystals on the soil surface. Photo: DIPNR
Road Construction can cause salinity problems. Photo: DIPNR
The impact of salt and water on brickwork.Photo: DIPNR
Damage caused to brickwork by salt and water. Photo: DIPNR

2
Where urban salinity impacts are experienced, costs are incurred by households, businesses, local government and state government agencies and utilities. Avoidance of these costs through the implementation of an urban salinity management strategy will result in benefits to these stakeholders and a reduction of offsite impacts. Valuation of these costs and the portion of the costs that will be avoided, is required to perform a financial evaluation of the strategy.
The presence of salty mains water supply can result in costs to water users. For households, these include increased pipe corrosion, shorter lifespan of hot water systems and increased consumption of bottled water, domestic filters, rainwater tanks and water softeners. Commercial water users may experience increased operating and maintenance costs for cooling towers, boiler operation and industrial water treatment, (Wilson 1999).
High saline watertables can result in costs in both urban and rural areas. For households and businesses, such costs arise from damage to, and shortened lifespan, of buildings and other concrete structures (retaining walls, paths, and driveways) and from impact on lawns and gardens. Local government incurs additional costs in maintaining infrastructure, including roads and bridges, footpaths and concrete pavements, stormwater and sewerage systems, sports ovals, parks and gardens and council-owned buildings. State government agencies and utilities also incur additional costs in managing their infrastructure, including railways, roads and bridges, water storage facilities, concrete power poles and steel towers and underground gas and power supply lines (Wilson 1999).
A thorough investigation and valuation of all of the costs arising from urban salinity can be both difficult and expensive. Sample cost functions (see Table 1) give an indication of the cost borne by each stakeholder at different salinity severities. The severity represents the level of salinity determined by the presence and magnitude of observable salinity outbreaks.
The following sample cost functions in Table 1 are drawn from a detailed study of the impacts and costs of high saline watertables and saline water supplies which was conducted by Wilson Land Management Services Pty Ltd and Ivey ATP (Wilson 2003).
2. Costs of Urban Salinity
Bricks showing signs of salt and water damage. Photo: DIPNR
A sporting area showing the indicators of salinity impact. Photo: DIPNR
A headstone affected by salt and water. Photo: DIPNR
3
ABARE undertook a survey-based analysis of local councils and other bodies that owned infrastructure in the Murray-Darling Basin in 1996. The aim was to assess the impact of salinity and rising watertables, quantify how much these bodies spent on repair and maintenance (R&M) of structures damaged by salinity and on conducting salinity-related community education, research and extension activities during their previous accounting year. Results relied on respondent awareness of urban salinity issues and an ability to separate costs attributable to salinity from other causes such as poor construction materials and methods (Oliver et al., 1996).
Roads and bridges were by far the most important expenditure item identified for local councils. Of the total $8.2 million of R&M expenditure on infrastructure damaged by salinity or rising watertables over the twelve-month accounting period surveyed,
85% was attributed to R&M of roads and bridges. Table 13 on pages 41-44 of the report, titled “Council expenditure on R&M on selected items”, provides information on the total expenditure for R&M and the portion attributed to salinity for various forms of infrastructure (Oliver et al., 1996).
A model developed in 2000 by SGS Urban Economics & Planning to estimate the impact of salinity on the cost of infrastructure repair and replacement to local government defined cost impacts for three scenarios. These scenarios, as shown in Table 2, categorise the severity of salinity affecting infrastructure. In this instance, the severity was determined by groundwater depth, existing saline-affected areas and other evidence of salinity-induced degradation.
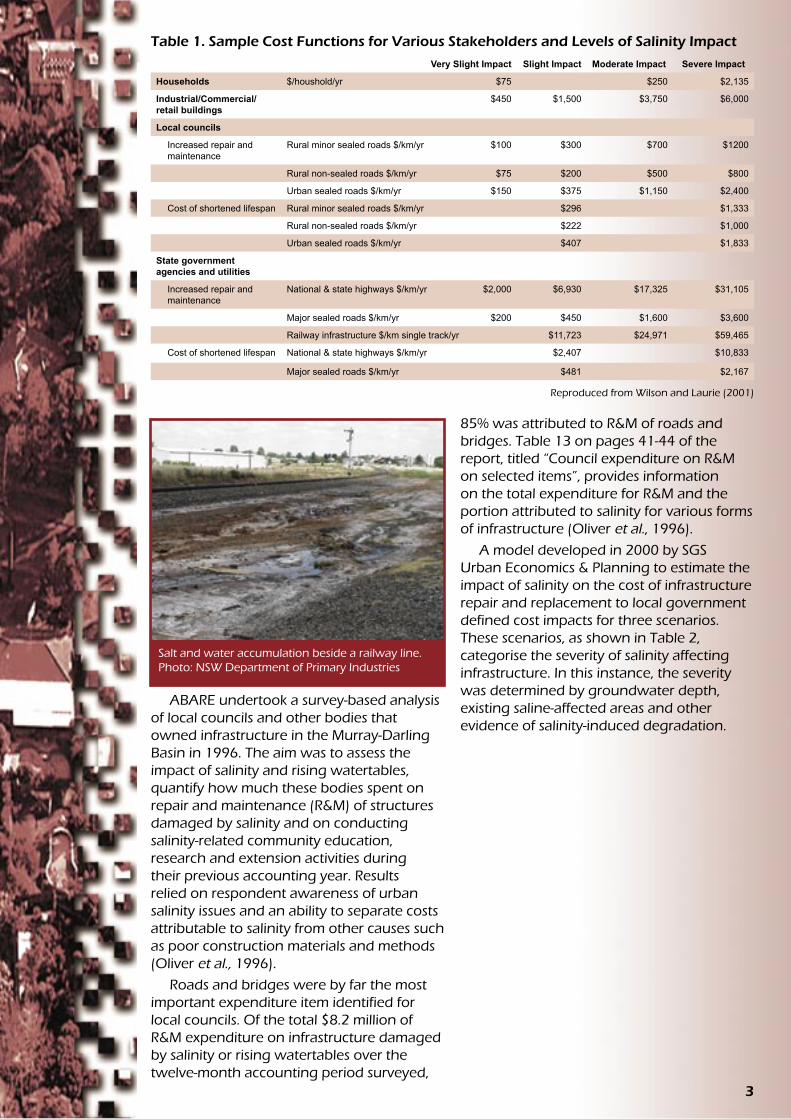
Table 1. Sample Cost Functions for Various Stakeholders and Levels of Salinity Impact
Very Slight Impact Slight Impact Moderate Impact Severe Impact
Households $/houshold/yr $75 $250 $2,135
Industrial/Commercial/retail buildings
$450 $1,500 $3,750 $6,000
Local councils
Increased repair and maintenance
Rural minor sealed roads $/km/yr $100 $300 $700 $1200
Rural non-sealed roads $/km/yr $75 $200 $500 $800
Urban sealed roads $/km/yr $150 $375 $1,150 $2,400
Cost of shortened lifespan Rural minor sealed roads $/km/yr $296 $1,333
Rural non-sealed roads $/km/yr $222 $1,000
Urban sealed roads $/km/yr $407 $1,833
State government agencies and utilities
Increased repair and maintenance
National & state highways $/km/yr $2,000 $6,930 $17,325 $31,105
Major sealed roads $/km/yr $200 $450 $1,600 $3,600
Railway infrastructure $/km single track/yr $11,723 $24,971 $59,465
Cost of shortened lifespan National & state highways $/km/yr $2,407 $10,833
Major sealed roads $/km/yr $481 $2,167
Reproduced from Wilson and Laurie (2001)
Salt and water accumulation beside a railway line. Photo: NSW Department of Primary Industries

4
The Local Government Salinity Management Handbook prepared by the Institute of Public Works Engineering Australia reviews previously published costs (eg. lifespan reductions of 75% for sealed roads) and covers tracking lifespan changes and increased R&M through an Asset Management Program (IPWEA 2001).
A major study undertaken by the National Dryland Salinity Program was the Costs Project by Wilson Land Management Services Pty Ltd and Ivey ATP. The report outlines the impacts of dryland salinity and how to value them. The purpose was to help catchment communities answer the question “What are the impacts of dryland salinity in our catchment and how do we value them?”. The report also demonstrates how obtaining this information fits into the local action planning and cost-sharing process.
Other studies and reports provide information on specific types of costs. The following sections summarise a selection of urban salinity economic studies to date, grouping the information under themes or cost areas.
2.1 RoadsThe Murray-Darling Basin Commission ordered a report in 1994 on the benefit to roads and other infrastructure of providing drainage in the irrigated areas of the Murray-Darling Basin. This was one of the first attempts to quantify the benefits (costs that would be avoided) of undertaking either surface or subsurface drainage.
Table 2.
Estimated Infrastructure Life Expectancy and Annual Percentage Increase in Maintenance/Renewal CostsUnaffected/low Moderate Severe
Infrastructure Type Life span (yrs) Increase pa Life span (yrs) Increase pa Life span (yrs) Increase pa
Roads sealed/unsealed (average) 20 5% 15 8% 10 13%
Bridges timber 50 3% 40 4% 30 5%
Bridges steel 60 10% 45 12% 30 15%
Bridges concrete (<$100,000) 60 6% 45 9% 30 12%
Bridges concrete (>$100,000) 100 6% 75 9% 50 12%
Drainage pipes 50 10% 35 12% 25 15%
Drainage pits 50 10% 25 12% 10 15%
Retention basins 50 8% 50 10% 50 12%
Swimming pools 50 10% 40 12% 25 15%
Buildings 50-100 5% 40-80 10% 25-50 15%
Airports 50-100 6% 20-30 10% 10-20 15%
Cemetaries 50-100 10% 25-50 20% 0 30%
Street trees 10-100 10% 0 100% 0 100%
Recreation reserves 10-100 10% 0 100% 0 100%
Open space 10-100 10% 0 100% 0 100%
Reproduced from SGS (2000)
Salt accumulation in a road culvert. Photo: Department of Primary Industries

5
Road maintenance costs in Victoria were found to be higher ($200/km/yr for gravelled roads and $400/km/yr for main sealed roads) in irrigation areas than in dryland areas. Amortised construction costs in NSW at a discount rate of 5% were also higher in irrigation areas relative to dryland areas ($980/km/yr for gravelled roads and $6,500/km/yr for highways). However, the impact of salinity on roads could not be completely mitigated by improved drainage. Estimates of the value of achievable benefits attainable in 1993 dollars per kilometre per year are summarised in Table 3.
ARRB Transport Research Ltd published a report (McRobert & Foley 1999) on the impacts of waterlogging and salinity on road assets in south western WA in 1999. The report reviews roads that were initially constructed on free-draining sites but are now affected by rising saline groundwater. It was commissioned by Main Roads WA to help make informed decisions about the optimal level of investment in remedial measures.
The report estimated that 230km of state main roads (plus more kilometres of local roads) were affected in 1999, with this expected to double over the next 20 years.
Methods of remediation are discussed, including highway reconstruction, pavement rehabilitation, improved drainage, groundwater pumping and revegetation. The estimated effectiveness of these methods was given along with an expected cost of $200,000 to $400,000 per km (McRobert
Table 3. Estimates of the Value of Benefits in 1993 Dollars/km/year
Main Sealed Roads Other Sealed Roads Gravelled RoadsBenefits of surface draining VIC $1,700 $900 $500
NSW $2,200 $1,000 $500Benefits of subsurface draining
VIC $1,900 $1,000 $350NSW $2,400 $1,100 $350
Source: MDBC (1994)
and Foley 1999). The report also discusses the risk of roads causing or exacerbating salinity outside the road reserve. In many cases this will be due to inadequate culvert capacities restricting overland flows and causing ponding of water along the upslope side of roads.
A later ARRB Transport Research Ltd report focuses on salinity impacts on local roads in Victoria. Road structure impacts, options for remediation and sample costs are covered. The effectiveness and cost of revegetation as a remediation option is discussed in detail. Site investigation and monitoring are particularly emphasised where revegetation is being considered (McRobert and Robinson 2000).
Although the report does not attempt to further quantify costs it concisely captures many of the issues relevant to road managers in areas of salinity. Where options are discussed there are approximate ‘rule of thumb’ costs to assist a manager in deciding whether an option warrants further investigation.
A road showing signs of salt and water impacts. Photo: NSW Department of Primary Industries
A road showing signs of salt and water impacts. Photo: DIPNR
Road construction can change natural drainage pat-terns. Photo: DIPNR

6
2.2 BuildingsNo studies conducted specifically to determine the actual costs of salinity on houses and other buildings were identified. However, in a 1995 report on the costs of urban salinity in the city of Wagga Wagga, an average figure of $15,000 for remedial works was used as a once off cost for residential housing that was experiencing severe effects of rising saline groundwater (Christiansen 1995). A later study in Wagga revised this figure to $10,000 based on information from ACTEW and local council advice (DLWC 1998).
In 2000, the Western Australian Department of Agriculture commissioned consultants URS Australia (formally Dames and Moore) to undertake a study on the economic impact of salinity on townsite infrastructure (Dames & Moore 2001). The study reported that the cost of damage to houses was relative to both the depth of the watertable and type of construction. It suggested that when watertable depth was 1.5 metres or greater, no costs were incurred. However, once watertable depth was within 0.5 of a metre, a brick house on ground was expected to require $2,000 in maintenance and a further $6,000 for drainage repair work three years later. For a house elevated on stumps the expected cost was only $1,000 every five years starting in the first year that watertable depth reached 0.5 metres.
Matching different construction types to the prevailing conditions minimises the impacts of salinity on buildings and of buildings on soil hydrology. A construction type that has less contact with the soil surface and that allows for normal evaporation, such as a house on stumps (bearer and joist construction), reduces the risk of damage to buildings. The ‘Best Practice Guidelines For Greener Subdivisions – Western Sydney’ (DLWC 2002) provides sample costing for different floor construction types (including earthworks costs). Ranked in order from the cheapest to the most expensive, the options are:
1. Waffle-pod slab on ground.
2. Raised particleboard floor on hardwood bearers with external brick.
3. Raised particleboard floor on steel bearers with external brick.
4. Conventional slab on ground.
5. Raised concrete floor on steel bearers with external brick (DLWC 2002).
No studies were found that compared the relative cost of different construction materials, such as exposure class bricks or vapour proof membranes, that might be used to reduce the effects of rising groundwater. For construction in saline environments the Building Code of Australia requires these more damage-resistant products to be used.
Bricks showing signs of salt and water impacts. Photo: DIPNR
Salt and water damage to a pier. Photo: DIPNR
Typical slab on ground construction. Photo: NSW Department of Primary Industries

7
2.3 Water SupplyA report to the Murray-Darling Basin Commission in 1999 by Gutteridge, Haskins and Davey (GHD 1999) provided cost functions for domestic water users, industrial water users and irrigators in the Murray-Darling Basin. The report was commissioned after increasing awareness of the costs to water users as a result of saline water supplies. The cost functions were used in a model of the Murray River system to assess the costs of various scenarios and associated impacts of salinity on the aquatic flora and fauna.
Quantification of the costs of saline water to stakeholders was the aim of a study by Wilson Land Management Services and Ivey ATP for the Murray-Darling Basin Commission in 2002 (Wilson & Laurie 2002). In this study, the methods applied by GHD and CSIRO were further developed and data were collected to validate previous estimates. Capital cost was amortised instead of being depreciated using the straight line method. Additional information from manufacturers was obtained and further surveys were done. The resulting new cost functions were then used to re-estimate the cost of saline town water supplies in all 26 catchments in the Murray-Darling Basin. A summary of these functions is provided in Table 4.
Slab on ground construction utilising waffle pods. Photo: DIPNR
Rusted pipe. Photo: NSW Department of Primary Industries
Rusted water tank. Photo: NSW Department of Primary Industries
Rusted piezometer. Photo: DIPNR

8
Table 4. Cost Functions for the Impacts of Saline Town Water Supplies
a. HouseholdsSoap & detergent use = No relationship Household plumbing:
Water pipes & fittings = $0.0923 T 1.25 per household per annum
Tap corrosion = $ 0.0731 T per household per annum
Cistern, ball valves etc = $ 0.0231 T per household per annum
Shower roses / arms = $ 0.0156 T per household per annum
Hot water systems = $ 0.253 T per household per annum
Bottled water = No relationship
Domestic water filters = No relationship (T < 72 mg/l)
$ 0.011 T per household per annum (T ≥ 72 mg/l)
Rainwater tanks = No relationship (T < 132 mg/l)
$ 0.13 T per household per annum (T ≥ 132 mg/l)
Domestic water softeners = No relationship (T < 123 mg/l)
$ 0.0145 T per household per annum (T ≥ 123 mg/l)
Where T = Total Dissolved Solids in mg/L
Source: Wilson and Laurie (2002)
b. Industrial Water UsersGeneral water use = 0.5 x $ 0.0003 T per kL per annum
Boiler feed = 0.23 x $ 0.0162 T per kL per annum
Cooling towers: = 0.13 x $ 0.0096 T per kL per annum
Process water = 0.14 x $ 0.003 T per kL per annum
Australian industrial = $0.00554 T per kL per annumsector as a whole
Where T = Total Dissolved Solids in mg/L
Source: Wilson and Laurie (2002)
c. Commercial Water UsersGeneral water use = $0.000245 T per kL per annum
Hot water / steam generation = $0.00097 T per kL per annum
Cooling towers = $0.0012 T per kL per annum
Process water = Nil
Australian commerce = $0.00242 T per kL per annumsector as a whole Where T = Total Dissolved Solids in mg/L
Source: Wilson and Laurie (2002)

9
Once the extent of the problem is ascertained and the cost to a local council or other stakeholders is estimated, then the level of response can be determined. The urban salinity management options that will be applicable in the situation will depend on the site-specific conditions and context. The following section outlines some possible strategies with a few examples.
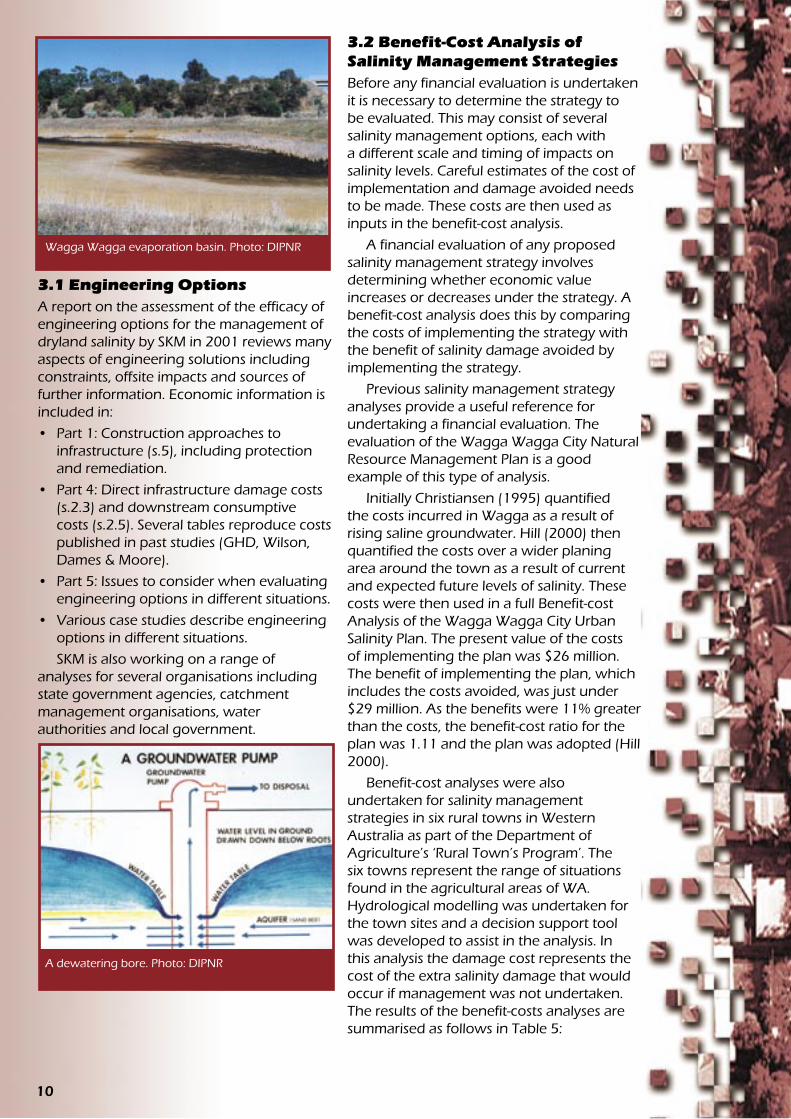
1. Actively lowering the watertable:
• Broad scale recharge control with vegetation, although there may be a long lag time before this becomes effective.
• Strategic revegetation around discharge areas designed to protect specific assets.
• Engineering methods including groundwater pumping, sub-surface drains and deep open drains.
2. Onsite water management of imported or contained water:
• Prevention of over-watering of gardens and sports fields.
• Identification and repair of leaking water/sewer/stormwater pipes, or dams/wetlands/retention basins.
• Replacement of septic systems with piped sewer.
• Removal of runoff obstructions.
3. Protection of infrastructure through reconstruction using damage-resistant techniques:
• Options for roads include the addition of a drainage blanket, raising and compacting the road base.
• Options for buildings include the replacement of the damp proof course.
3. Urban Salinity Management
• Options for cement structures and pavements include the use of plastic membranes, additives and compaction techniques.
4. Supply of fresh mains water:
• Fresh water may be available to be piped from adjacent catchments or found in different aquifers through drilling.
• Distillation of drained or pumped groundwater may be feasible if feed water quality and quantity is uniform and demand for fresh water is high enough to cover the extra cost of this treatment.
5. Abandonment or relocation of infrastructure:
• Road or buildings demolished and reconstructed in non-discharge areas.
• Turf grass recreational areas relocated to an easier to maintain location.
• Sports fields on discharge sites may be converted to parklands.
If remediation costs are higher than damage costs then further justification is required before action is taken, for example:
• The environmental and/or social benefits may outweigh any negative financial benefits.
• Downstream water users who bear a higher cost may subsidise remediation.
Nature strip with salt crystals. Photo: NSW Department of Primary Industries
The installation of a damp proof-course. Photo: DIPNR
Wagga Wagga showground managed for salinity. Photo: DIPNR
10
3.1 Engineering OptionsA report on the assessment of the efficacy of engineering options for the management of dryland salinity by SKM in 2001 reviews many aspects of engineering solutions including constraints, offsite impacts and sources of further information. Economic information is included in:
• Part 1: Construction approaches to infrastructure (s.5), including protection and remediation.
• Part 4: Direct infrastructure damage costs (s.2.3) and downstream consumptive costs (s.2.5). Several tables reproduce costs published in past studies (GHD, Wilson, Dames & Moore).
• Part 5: Issues to consider when evaluating engineering options in different situations.
• Various case studies describe engineering options in different situations.
SKM is also working on a range of analyses for several organisations including state government agencies, catchment management organisations, water authorities and local government.
3.2 Benefit-Cost Analysis of Salinity Management StrategiesBefore any financial evaluation is undertaken it is necessary to determine the strategy to be evaluated. This may consist of several salinity management options, each with a different scale and timing of impacts on salinity levels. Careful estimates of the cost of implementation and damage avoided needs to be made. These costs are then used as inputs in the benefit-cost analysis.
A financial evaluation of any proposed salinity management strategy involves determining whether economic value increases or decreases under the strategy. A benefit-cost analysis does this by comparing the costs of implementing the strategy with the benefit of salinity damage avoided by implementing the strategy.
Previous salinity management strategy analyses provide a useful reference for undertaking a financial evaluation. The evaluation of the Wagga Wagga City Natural Resource Management Plan is a good example of this type of analysis.
Initially Christiansen (1995) quantified the costs incurred in Wagga as a result of rising saline groundwater. Hill (2000) then quantified the costs over a wider planing area around the town as a result of current and expected future levels of salinity. These costs were then used in a full Benefit-cost Analysis of the Wagga Wagga City Urban Salinity Plan. The present value of the costs of implementing the plan was $26 million. The benefit of implementing the plan, which includes the costs avoided, was just under $29 million. As the benefits were 11% greater than the costs, the benefit-cost ratio for the plan was 1.11 and the plan was adopted (Hill 2000).
Benefit-cost analyses were also undertaken for salinity management strategies in six rural towns in Western Australia as part of the Department of Agriculture’s ‘Rural Town’s Program’. The six towns represent the range of situations found in the agricultural areas of WA. Hydrological modelling was undertaken for the town sites and a decision support tool was developed to assist in the analysis. In this analysis the damage cost represents the cost of the extra salinity damage that would occur if management was not undertaken. The results of the benefit-costs analyses are summarised as follows in Table 5:
Wagga Wagga evaporation basin. Photo: DIPNR
A dewatering bore. Photo: DIPNR
11
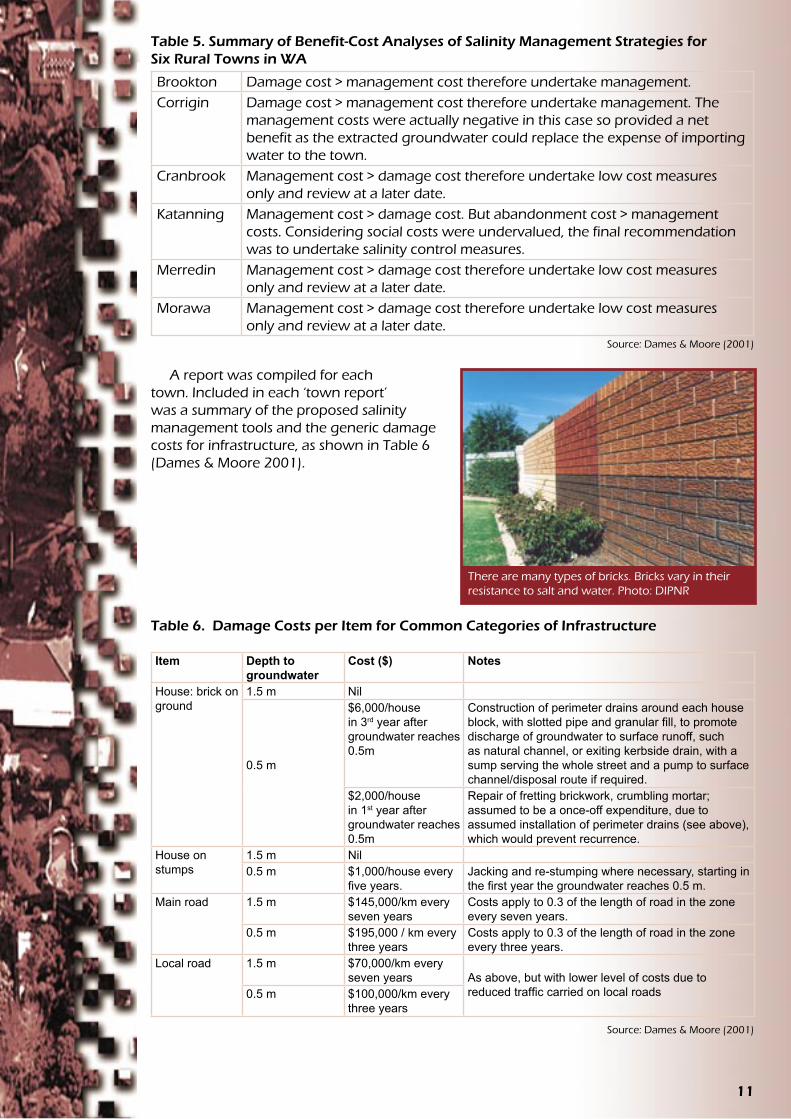
A report was compiled for each town. Included in each ‘town report’ was a summary of the proposed salinity management tools and the generic damage costs for infrastructure, as shown in Table 6 (Dames & Moore 2001).
Brookton Damage cost > management cost therefore undertake management.Corrigin Damage cost > management cost therefore undertake management. The
management costs were actually negative in this case so provided a net benefit as the extracted groundwater could replace the expense of importing water to the town.
Cranbrook Management cost > damage cost therefore undertake low cost measures only and review at a later date.
Katanning Management cost > damage cost. But abandonment cost > management costs. Considering social costs were undervalued, the final recommendation was to undertake salinity control measures.
Merredin Management cost > damage cost therefore undertake low cost measures only and review at a later date.
Morawa Management cost > damage cost therefore undertake low cost measures only and review at a later date.
Source: Dames & Moore (2001)
Table 6. Damage Costs per Item for Common Categories of Infrastructure
Item Depth to groundwater
Cost ($) Notes
House: brick on ground
1.5 m Nil
0.5 m
$6,000/house in 3rd year after groundwater reaches 0.5m
Construction of perimeter drains around each house block, with slotted pipe and granular fill, to promote discharge of groundwater to surface runoff, such as natural channel, or exiting kerbside drain, with a sump serving the whole street and a pump to surface channel/disposal route if required.
$2,000/house in 1st year after groundwater reaches 0.5m
Repair of fretting brickwork, crumbling mortar; assumed to be a once-off expenditure, due to assumed installation of perimeter drains (see above), which would prevent recurrence.
House on stumps
1.5 m Nil0.5 m $1,000/house every
five years.Jacking and re-stumping where necessary, starting in the first year the groundwater reaches 0.5 m.
Main road 1.5 m $145,000/km every seven years
Costs apply to 0.3 of the length of road in the zone every seven years.
0.5 m $195,000 / km every three years
Costs apply to 0.3 of the length of road in the zone every three years.
Local road 1.5 m $70,000/km every seven years As above, but with lower level of costs due to
reduced traffic carried on local roads0.5 m $100,000/km every three years
Source: Dames & Moore (2001)
There are many types of bricks. Bricks vary in their resistance to salt and water. Photo: DIPNR
Table 5. Summary of Benefit-Cost Analyses of Salinity Management Strategies for Six Rural Towns in WA

12
The increasing awareness of the impacts and costs of urban salinity has elevated the priority of the consideration of remediation. Thorough evaluation of any proposed action includes a financial investment appraisal. This booklet has collated information that will assist in such appraisals.
It is recognised that each situation is unique and requires separate research of the costs that are being incurred and remediation actions. A consideration of the findings of past studies, provides an insight into how to determine these costs and the order of magnitude of costs. Generic cost functions also enable the valuation of the costs being incurred in a more time-efficient manner, albeit with less accuracy.
4. Concluding Remarks
Salt and water impacts exacerbated by a discon-nected downpipe. Photo:NSW Department of Primary Industries

13
Christiansen, G. (1995) An Economic Report on the Costs of Urban Salinity in the City of Wagga Wagga. Department of Land and Water Conservation, Wagga Wagga, NSW.
Dames & Moore (2001) Economic impacts of salinity on townsite infrastructure, report for the Rural Towns Management Committee and Agriculture Western Australia. Prepared by Dames & Moore (now URS), Perth, WA.
DLWC (1998) Natural Resource Management Plan, Impact of urban salinity and waterlogging in Wagga Wagga – the no plan scenario – a Scoping Study. Resource Economics Centre for Natural Resources, Department of Land and Water Conservation, Parramatta, NSW.
DLWC (2002) Best Practice Guidelines for Greener Subdivisions – Western Sydney, An outcome of the ‘Keeping the soil on the site: GREENER SUBDIVISIONS PROJECT’, Department of Land and Water Conservation, Windsor, NSW.
GHD (1999) Salinity Impact Study, Final Report to the Murray-Darling Basin Commission by Gutteridge, Haskins and Davey, Melbourne, VIC.
Hill, C. (2000) The Wagga Wagga City Natural Resource Management Plan Urban Salinity Economic Study, Socio-economic Services Unit, Department of Land and Water Conservation, Sydney, NSW.
IPWEA (2001) The Local Government Salinity Management Handbook – A Resource Guide for the Public Works Professional [Draft] 2001. Prepared for the Institute of Public Works Engineering Australia by Albury City Council’s Asset Design Services Section. Available: http://www.ipwea.org.au/members/documents/#6.
McRobert, J. and Foley, G. (1999) The impacts of waterlogging and salinity on road assets: a Western Australian case study. ARRB Transport Research Ltd Special Report 57, Vermont South, VIC.
McRobert, J. and Robinson, P. (2000) Salinity Impacts on Local Roads, ARRB Transport Research Ltd Report RC 1420 to the Department of Natural Resources and Environment, Vermont South, VIC.
MDBC (1994) A study into the benefits to roads and other infrastructure of providing drainage in the irrigated areas of the Murray-Darling Basin, Drainage Program, Technical Report no. 1, Canberra, ACT.
Oliver, M., Wilson, S., Gombosso, J. and Muller, T. (1996) Costs of Salinity to Government Agencies and Public Utilities in the Murray-Darling Basin, Australian Bureau of Agricultural & Resource Economics Research Report 96.2, Canberra, ACT.
SGS (2000) Financial Costs to Local Government of Dryland Salinity, a Spiller Gibbon Swan Urban Economics & Planning and SMEC Report to the National Dryland Salinity Program “Enhancing the Capacity of Local Government to Contribute to the Management of Dryland Salinity”, Melbourne, VIC.
SKM (2001) Assessment of the Efficacy of Engineering Options for the Management of Dryland Salinity, Sinclair Knight Merz Research Report to the Land and Water Resources Research and Development Corporation, Malvern, VIC.
Wilson, S.M. (1999) Dryland Salinity: What are the impacts and how do you value them?, an Ivey ATP and Wilson Land Management Services report prepared for the Murray-Darling Basin Commission and the NDSP, Canberra, ACT.
Wilson, S.M. and Laurie, I. (2001) Assessing the full impacts and costs of dryland salinity, an Ivey ATP and Wilson Land Management Services report prepared for the Salinity Economics Workshop, 22-23 August 2001, Orange, NSW.
Wilson, S.M. and Laurie, I. (2002) Costs functions to assess the cost of saline town water supplies to households, commerce and industry, a Wilson Land Management Services and Ivey ATP report prepared for the Murray-Darling Basin Commission, Canberra, ACT.
Wilson, S.M. (2003) Determining the full costs of dryland salinity across the Murray-Darling Basin: Final Project Report, a Wilson Land Management Services report to the Murray-Darling Basin Commission and National Dryland Salinity Program.
5. References

Author David Buckland, NSW Department of Primary Industries Sian McGhie, DIPNR
AcknowledgmentsAndrew Bathgate, NSW Department of Primary IndustriesNational Action Plan for Salinity and Water QualitySuzanne Wilson, Wilson Land Management ServicesMelissa Ryan, formerly DIPNR