Salient Continuous Improvement Suite · algorithms at recognizing patterns and trends in graphical...
24
Salient Continuous Improvement Suite
Transcript of Salient Continuous Improvement Suite · algorithms at recognizing patterns and trends in graphical...
Salient
Continuous Improvement Suite
Drive Better Results
Salient Management Company introduces its latest super-
scalable, in-memory performance accounting and decision
support platform: the Continuous Improvement Suite (CIS).
CIS captures the whole story of value creation— activity, profit
and loss, quality, growth and potential. It draws from all sources
to capture the details of transactions and data that describe
the causes and constraints of the business environment. And
it allocates indirect or undocumented values added or lost by
business activity.
This information is immediately made actionable at the fingertips
of your decision makers, creating a performance feedback loop
that fuels the practice of continuous improvement throughout
your organization from the bottom up.
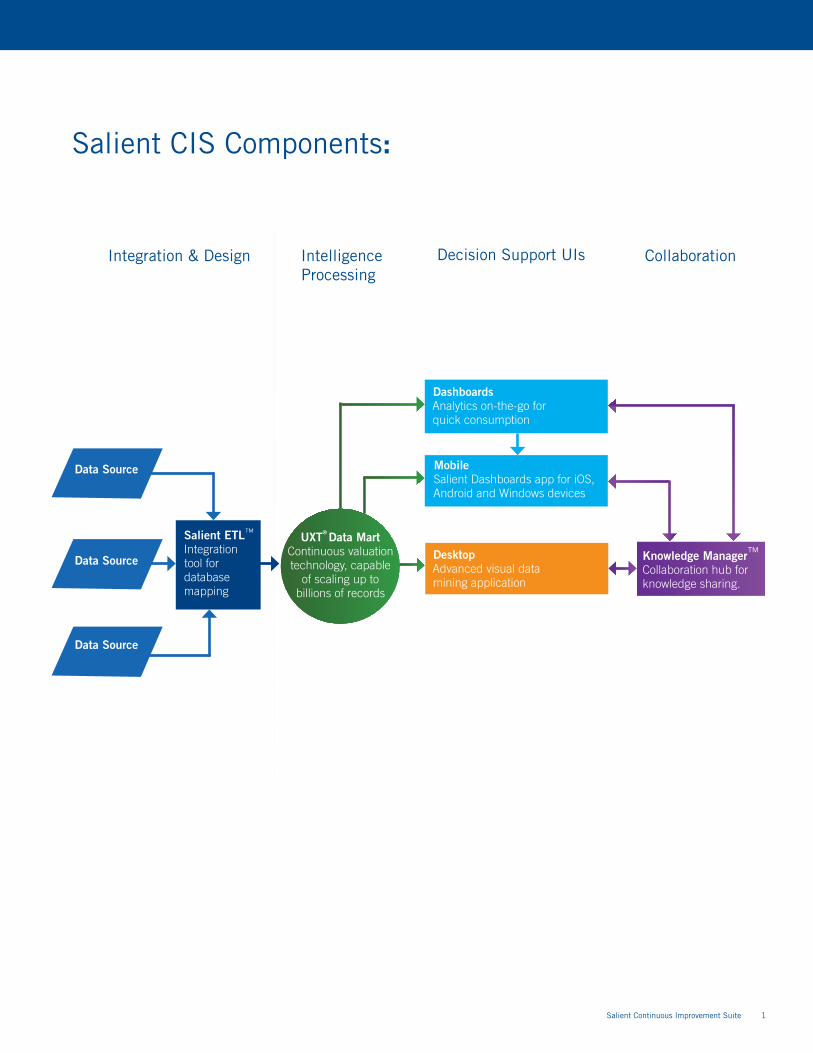
Data Source
Data Source
Data Source
Knowledge Manager™ Collaboration hub for knowledge sharing.
Dashboards Analytics on-the-go for quick consumption
UXT® Data Mart Continuous valuation technology, capable
of scaling up to billions of records
Desktop Advanced visual data mining application
Mobile Salient Dashboards app for iOS, Android and Windows devices
Salient ETL™ Integration tool for database mapping
Salient Continuous Improvement Suite 1
Salient CIS Components:
Integration & Design Intelligence Processing
CollaborationDecision Support UIs
2 Salient Continuous Improvement Suite
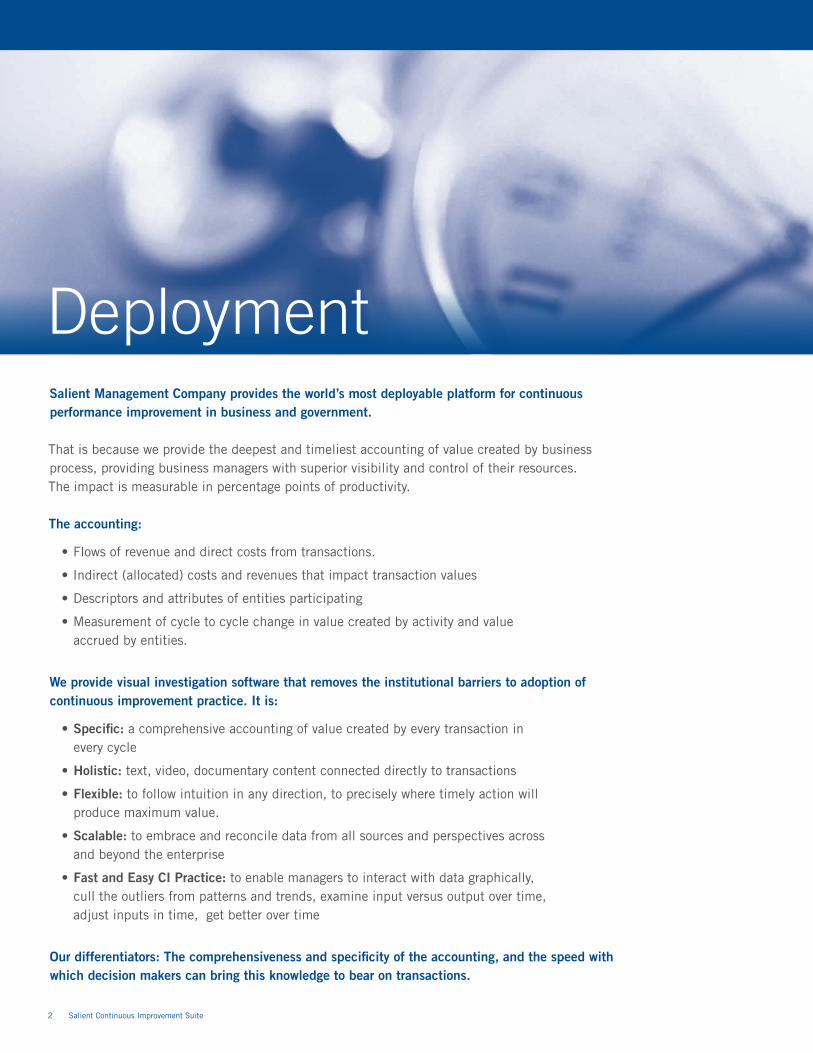
DeploymentSalient Management Company provides the world’s most deployable platform for continuous performance improvement in business and government. That is because we provide the deepest and timeliest accounting of value created by business process, providing business managers with superior visibility and control of their resources. The impact is measurable in percentage points of productivity. The accounting:
• Flows of revenue and direct costs from transactions.
• Indirect (allocated) costs and revenues that impact transaction values
• Descriptors and attributes of entities participating
• Measurement of cycle to cycle change in value created by activity and value accrued by entities.
We provide visual investigation software that removes the institutional barriers to adoption of continuous improvement practice. It is:
• Specific: a comprehensive accounting of value created by every transaction in every cycle
• Holistic: text, video, documentary content connected directly to transactions
• Flexible: to follow intuition in any direction, to precisely where timely action will produce maximum value.
• Scalable: to embrace and reconcile data from all sources and perspectives across and beyond the enterprise
• Fast and Easy CI Practice: to enable managers to interact with data graphically, cull the outliers from patterns and trends, examine input versus output over time, adjust inputs in time, get better over time
Our differentiators: The comprehensiveness and specificity of the accounting, and the speed with which decision makers can bring this knowledge to bear on transactions.

Customers
Partners
Vendors
Executives
Analysts
Managers
Dashboards
Desktop
Mobile
Salient Continuous Improvement Suite 3
CollaborationContent Management The content management engine of the CIS integrates contextual and multimedia information directly into Salient’s desktop and web analytics user interfaces. This capability enables users to document, socialize and share intelligence across a broad constituency of analysts, managers, executives and trading partners.
Dashboards & StoryboardsDashboards and storyboards help bridge the knowledge gaps between your levels of management—from strategic, down to execution. By leveraging easy-to-use multi-directional drill paths in convenient dashboard portals, and automated analytics that guide users from beginning to end in storyboards, power users, analysts and consultants can efficiently communicate actionable information with the broader user bases across the organization—from the executives at HQ, to the managers on the front lines.
“The democratization of informationis driving, empowering the peopleto make the right decision at the right point.” Marcus Franke, Director of Business Transformation CCEAG

4 Salient Collaborative Intelligence Suite
Technology
Salient Collaborative Intelligence Suite 5
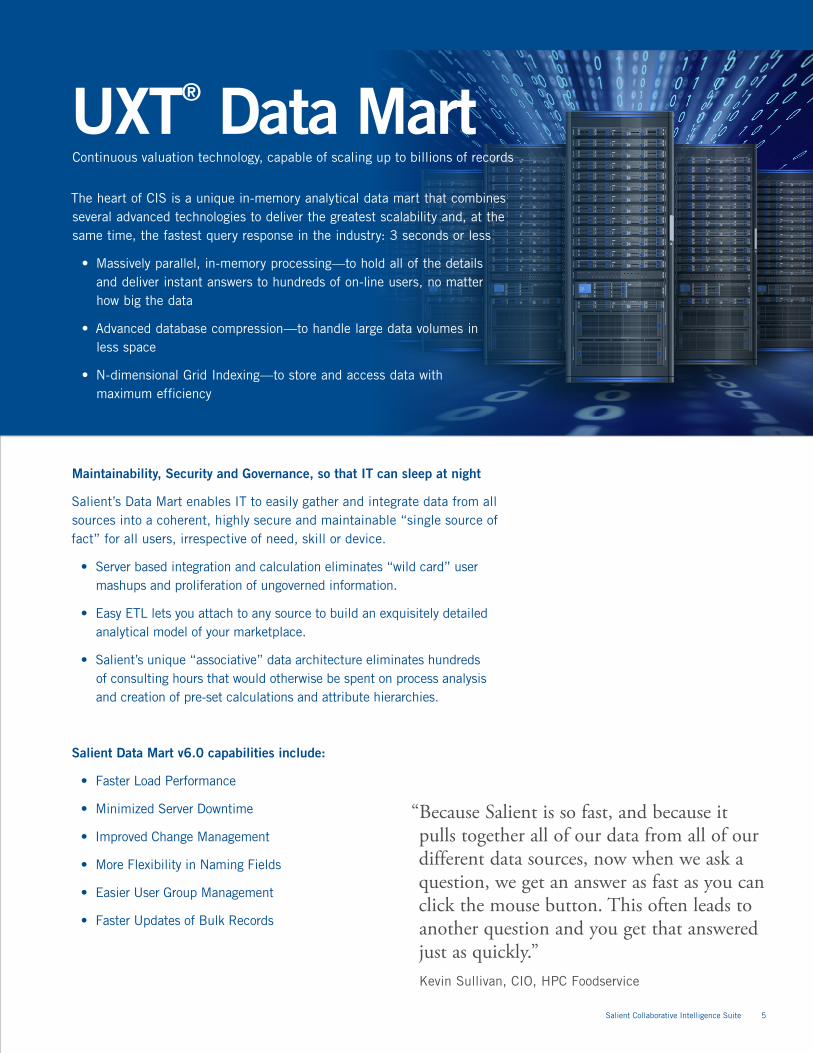
UXT® Data MartContinuous valuation technology, capable of scaling up to billions of records
The heart of CIS is a unique in-memory analytical data mart that combines several advanced technologies to deliver the greatest scalability and, at the same time, the fastest query response in the industry: 3 seconds or less
• Massively parallel, in-memory processing—to hold all of the details and deliver instant answers to hundreds of on-line users, no matter how big the data
• Advanced database compression—to handle large data volumes in less space
• N-dimensional Grid Indexing—to store and access data with maximum efficiency
Maintainability, Security and Governance, so that IT can sleep at night
Salient’s Data Mart enables IT to easily gather and integrate data from all sources into a coherent, highly secure and maintainable “single source of fact” for all users, irrespective of need, skill or device.
• Server based integration and calculation eliminates “wild card” user mashups and proliferation of ungoverned information.
• Easy ETL lets you attach to any source to build an exquisitely detailed analytical model of your marketplace.
• Salient’s unique “associative” data architecture eliminates hundreds of consulting hours that would otherwise be spent on process analysis and creation of pre-set calculations and attribute hierarchies.
Salient Data Mart v6.0 capabilities include:
• Faster Load Performance
• Minimized Server Downtime
• Improved Change Management
• More Flexibility in Naming Fields
• Easier User Group Management
• Faster Updates of Bulk Records
“Because Salient is so fast, and because it pulls together all of our data from all of our different data sources, now when we ask a question, we get an answer as fast as you can click the mouse button. This often leads to another question and you get that answered just as quickly.”Kevin Sullivan, CIO, HPC Foodservice
6 Salient Collaborative Intelligence Suite
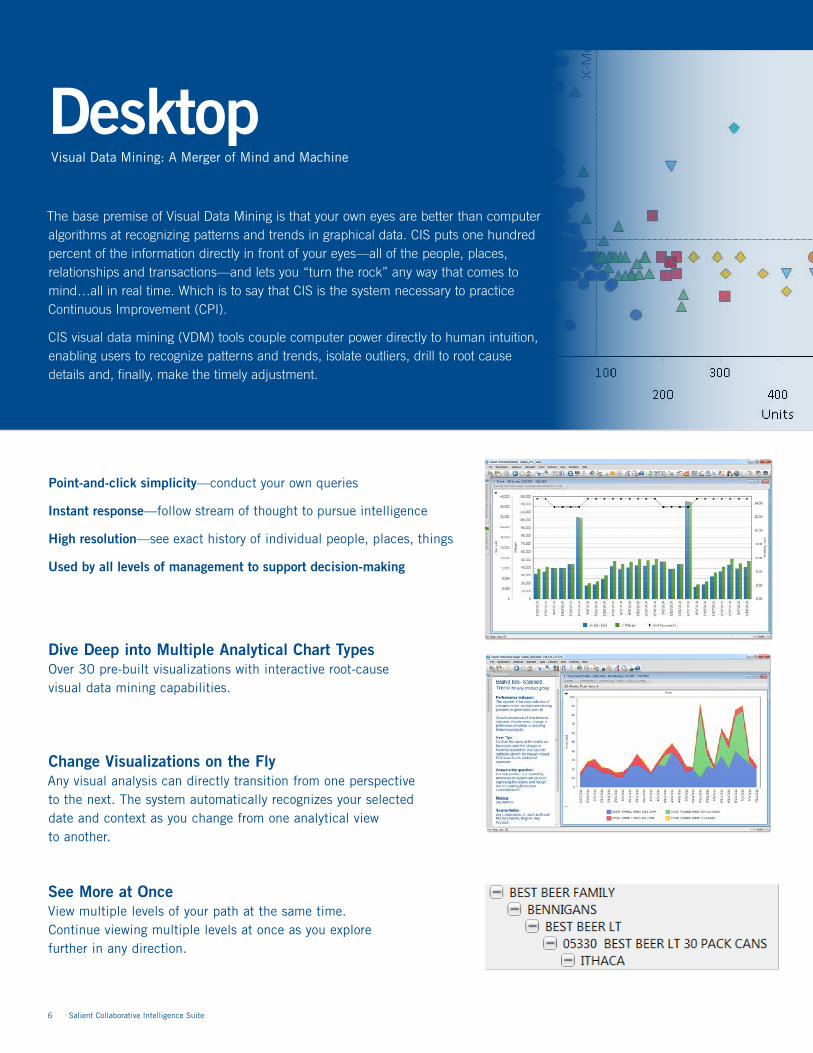
The base premise of Visual Data Mining is that your own eyes are better than computer algorithms at recognizing patterns and trends in graphical data. CIS puts one hundred percent of the information directly in front of your eyes—all of the people, places, relationships and transactions—and lets you “turn the rock” any way that comes to mind…all in real time. Which is to say that CIS is the system necessary to practice Continuous Improvement (CPI).
CIS visual data mining (VDM) tools couple computer power directly to human intuition, enabling users to recognize patterns and trends, isolate outliers, drill to root cause details and, finally, make the timely adjustment.
Point-and-click simplicity—conduct your own queries
Instant response—follow stream of thought to pursue intelligence
High resolution—see exact history of individual people, places, things
Used by all levels of management to support decision-making
Dive Deep into Multiple Analytical Chart TypesOver 30 pre-built visualizations with interactive root-cause visual data mining capabilities.
Change Visualizations on the Fly Any visual analysis can directly transition from one perspective to the next. The system automatically recognizes your selected date and context as you change from one analytical view to another.
See More at OnceView multiple levels of your path at the same time. Continue viewing multiple levels at once as you explore further in any direction.
Desktop Visual Data Mining: A Merger of Mind and Machine
Salient Collaborative Intelligence Suite 7
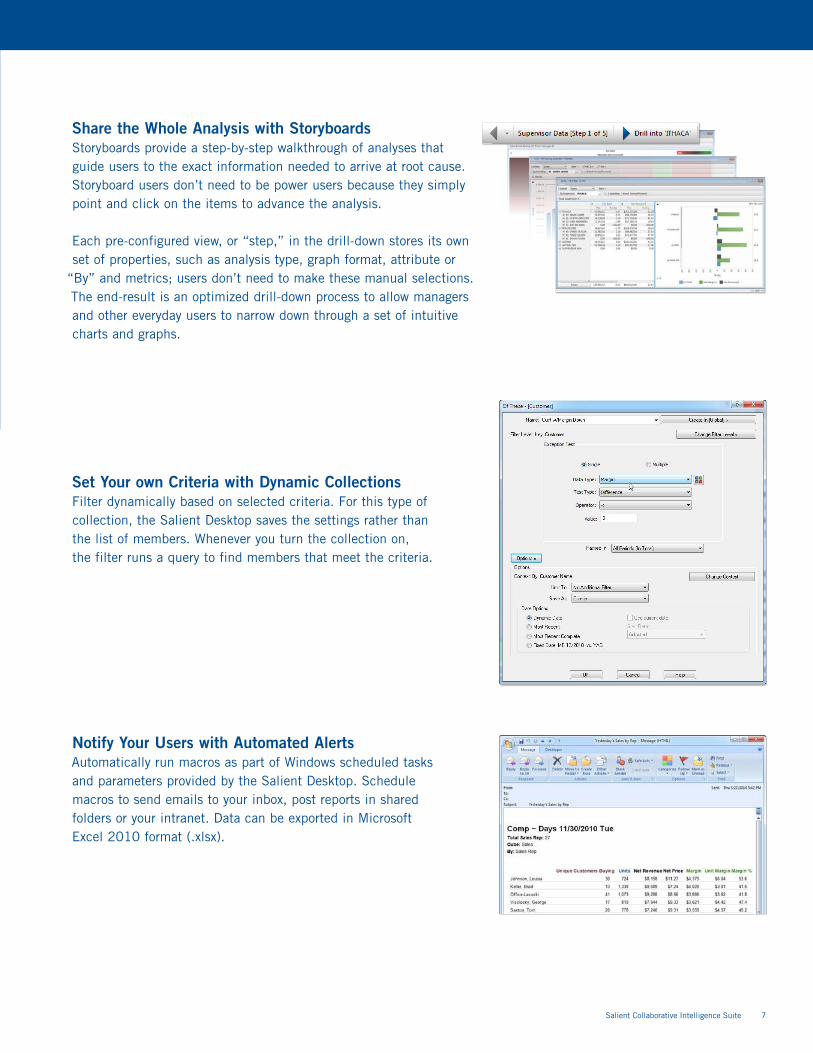
Share the Whole Analysis with StoryboardsStoryboards provide a step-by-step walkthrough of analyses that guide users to the exact information needed to arrive at root cause. Storyboard users don’t need to be power users because they simply point and click on the items to advance the analysis.
Each pre-configured view, or “step,” in the drill-down stores its own set of properties, such as analysis type, graph format, attribute or
“By” and metrics; users don’t need to make these manual selections. The end-result is an optimized drill-down process to allow managers and other everyday users to narrow down through a set of intuitive charts and graphs.
Set Your own Criteria with Dynamic CollectionsFilter dynamically based on selected criteria. For this type of collection, the Salient Desktop saves the settings rather than the list of members. Whenever you turn the collection on, the filter runs a query to find members that meet the criteria.
Notify Your Users with Automated Alerts Automatically run macros as part of Windows scheduled tasks and parameters provided by the Salient Desktop. Schedule macros to send emails to your inbox, post reports in shared folders or your intranet. Data can be exported in Microsoft Excel 2010 format (.xlsx).
8 Salient Collaborative Intelligence Suite
Compare & Analyze Custom Groupings Use custom groupings of members (collections by title) across the full spectrum of analyses—comparisons, distributions, exceptions and trends.
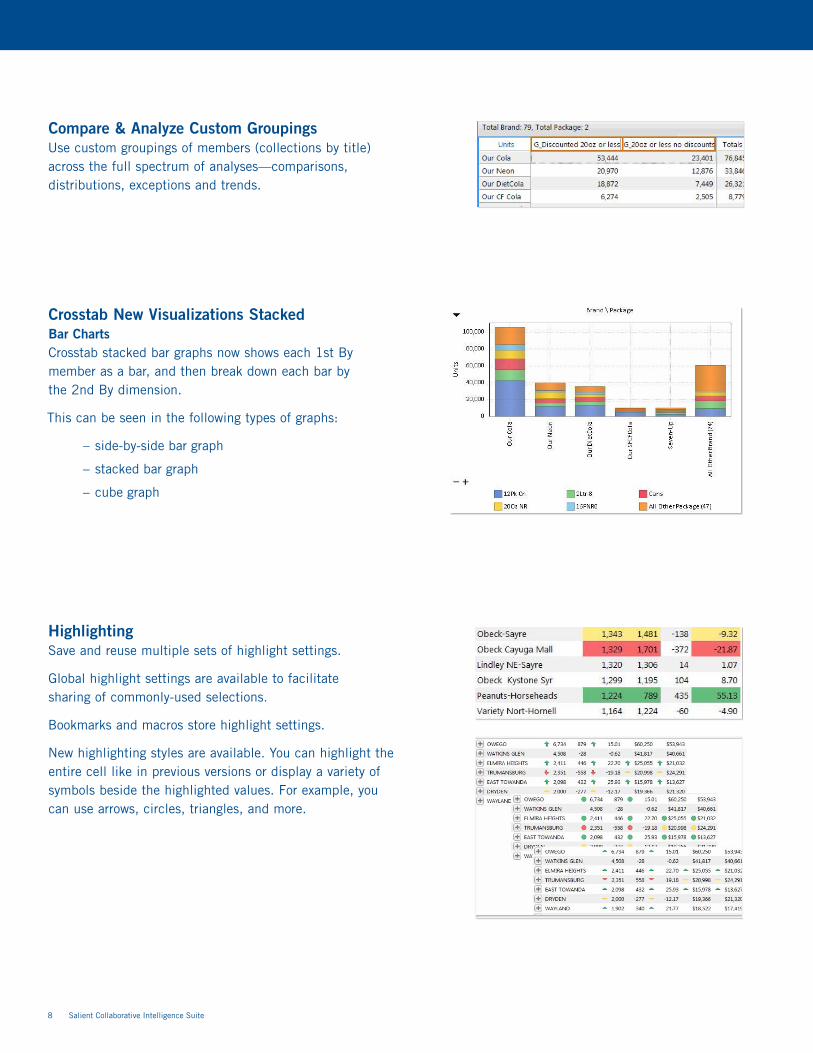
Crosstab New Visualizations Stacked Bar ChartsCrosstab stacked bar graphs now shows each 1st By member as a bar, and then break down each bar by the 2nd By dimension.
This can be seen in the following types of graphs:
– side-by-side bar graph
– stacked bar graph
– cube graph
HighlightingSave and reuse multiple sets of highlight settings.
Global highlight settings are available to facilitate sharing of commonly-used selections.
Bookmarks and macros store highlight settings.
New highlighting styles are available. You can highlight the entire cell like in previous versions or display a variety of symbols beside the highlighted values. For example, you can use arrows, circles, triangles, and more.
Salient Collaborative Intelligence Suite 9
Graph on Actual Value Difference Actual value graphs can now show the difference between two time periods, when comparing attribute members.
For example, see which channels had the most significant changes in volume and revenue.
This graph option is also available in Comparative Time Series line and bar/line graphs to show which dates had the most significant changes since the previous time period.
Compare Multiple Metrics More Easily
Plot metrics on separate axes even if they belong to the same group as other metrics in the graph.
Easily see performance that is much higher or lower than other metrics.
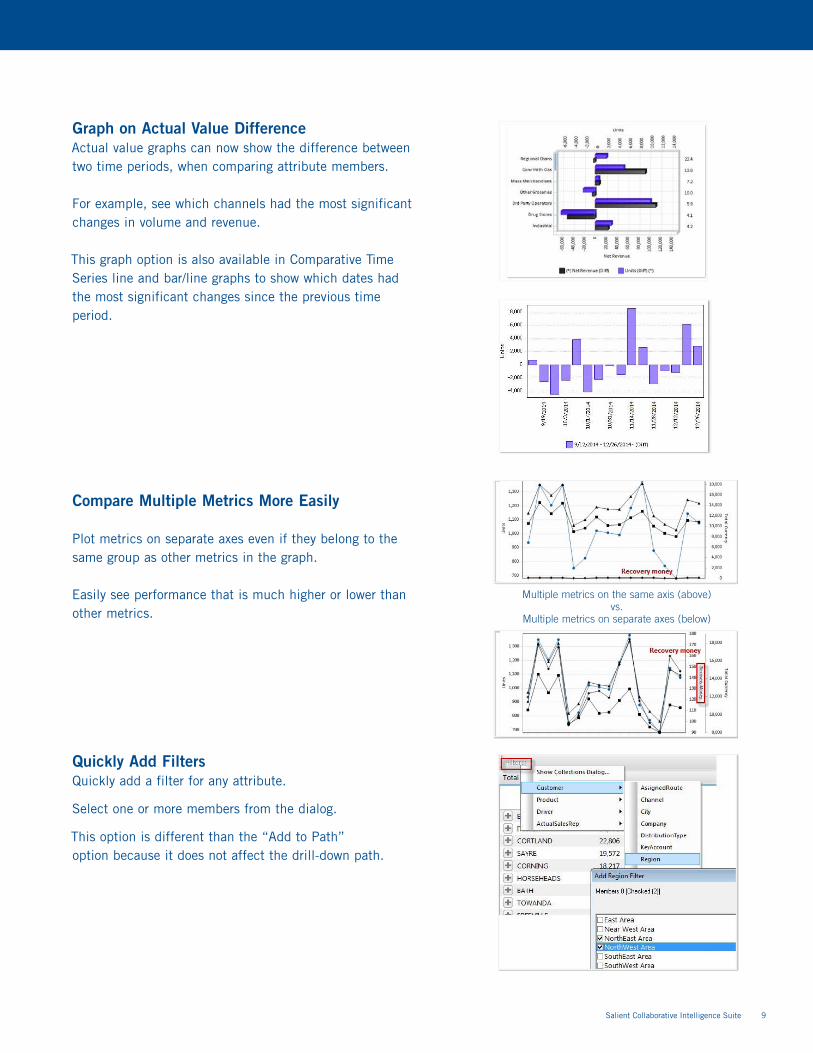
Quickly Add FiltersQuickly add a filter for any attribute.
Select one or more members from the dialog.
This option is different than the “Add to Path” option because it does not affect the drill-down path.
Multiple metrics on the same axis (above) vs.
Multiple metrics on separate axes (below)
10 Salient Collaborative Intelligence Suite
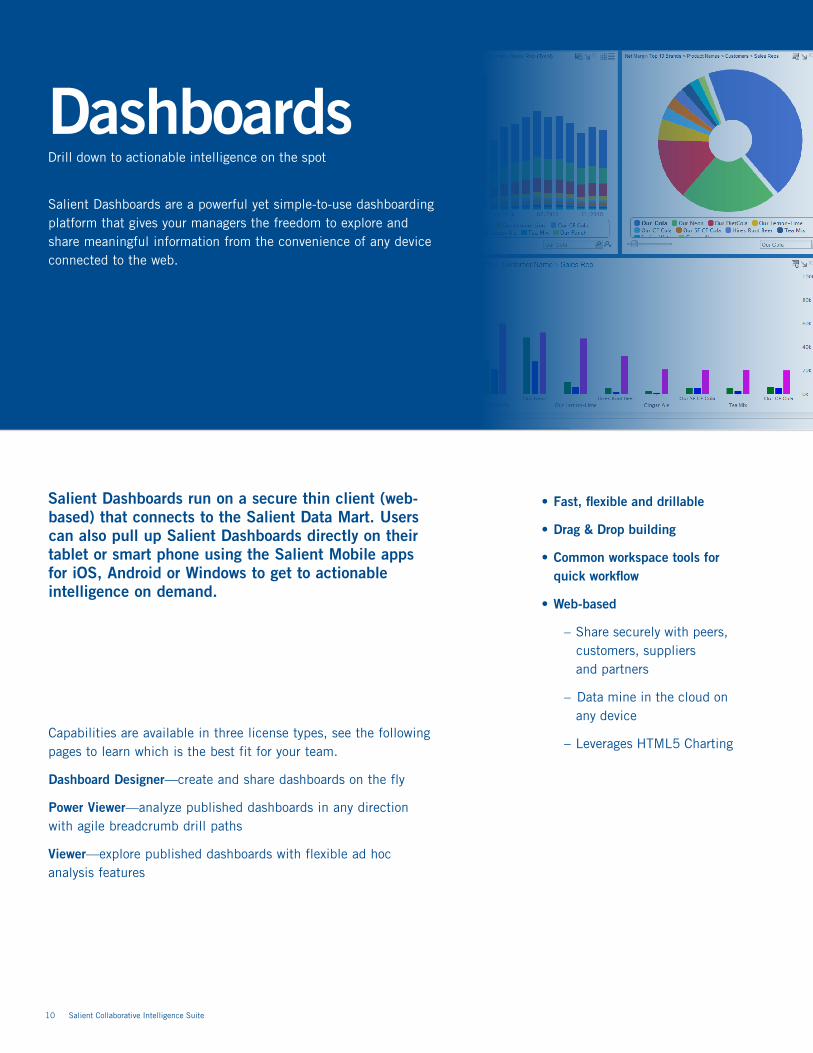
Salient Dashboards are a powerful yet simple-to-use dashboarding platform that gives your managers the freedom to explore and share meaningful information from the convenience of any device connected to the web.
• Fast, flexible and drillable
• Drag & Drop building
• Common workspace tools for quick workflow
• Web-based
– Share securely with peers, customers, suppliers and partners
– Data mine in the cloud on any device
– Leverages HTML5 Charting
Salient Dashboards run on a secure thin client (web-based) that connects to the Salient Data Mart. Users can also pull up Salient Dashboards directly on their tablet or smart phone using the Salient Mobile apps for iOS, Android or Windows to get to actionable intelligence on demand.
Capabilities are available in three license types, see the following pages to learn which is the best fit for your team.
Dashboard Designer—create and share dashboards on the fly
Power Viewer—analyze published dashboards in any direction with agile breadcrumb drill paths
Viewer—explore published dashboards with flexible ad hoc analysis features
DashboardsDrill down to actionable intelligence on the spot
Salient Collaborative Intelligence Suite 11
Salient Dashboard Designer enables your team to create actionable analytical reports for your organization to improve business performance. The easy building workflow uses drag-and-drop features throughout the Designer interface, which minimizes distraction on technical features and allows your team to focus on the analytics content.
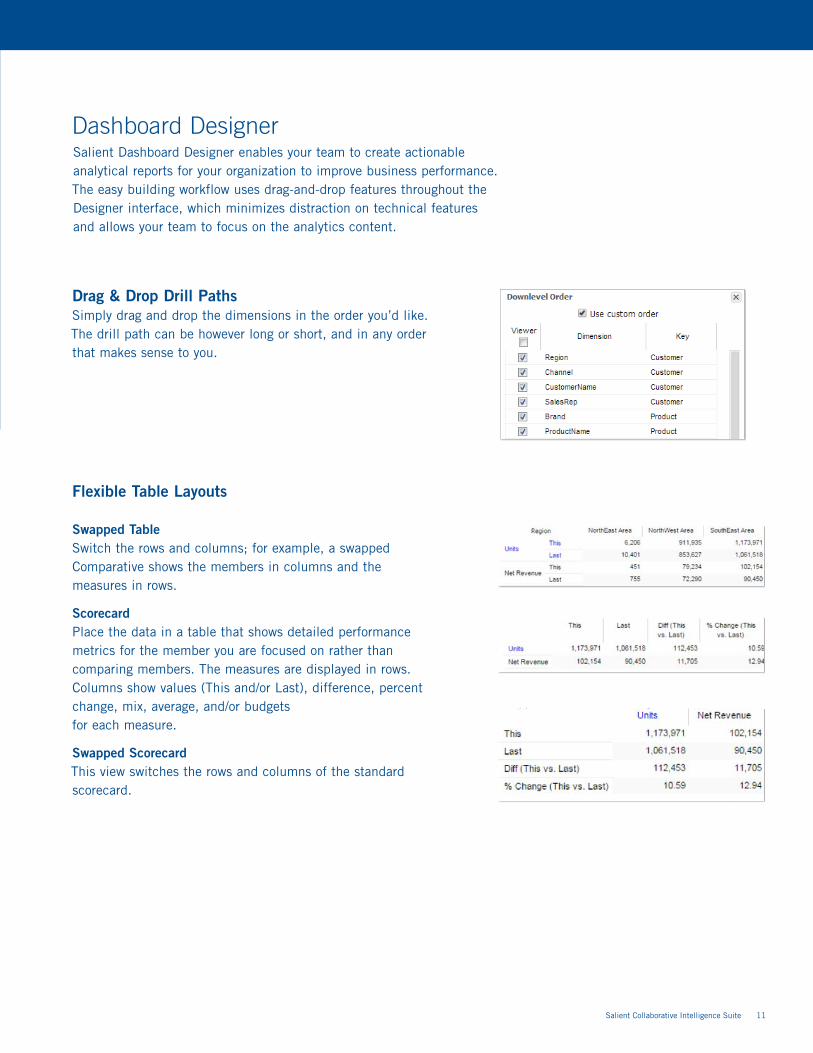
Drag & Drop Drill Paths Simply drag and drop the dimensions in the order you’d like. The drill path can be however long or short, and in any order that makes sense to you.
Flexible Table Layouts Swapped TableSwitch the rows and columns; for example, a swapped Comparative shows the members in columns and the measures in rows.
ScorecardPlace the data in a table that shows detailed performance metrics for the member you are focused on rather than comparing members. The measures are displayed in rows. Columns show values (This and/or Last), difference, percent change, mix, average, and/or budgets for each measure.
Swapped ScorecardThis view switches the rows and columns of the standard scorecard.
Dashboard Designer
12 Salient Collaborative Intelligence Suite
Salient Dashboards
Dashboard Designer (Continued)
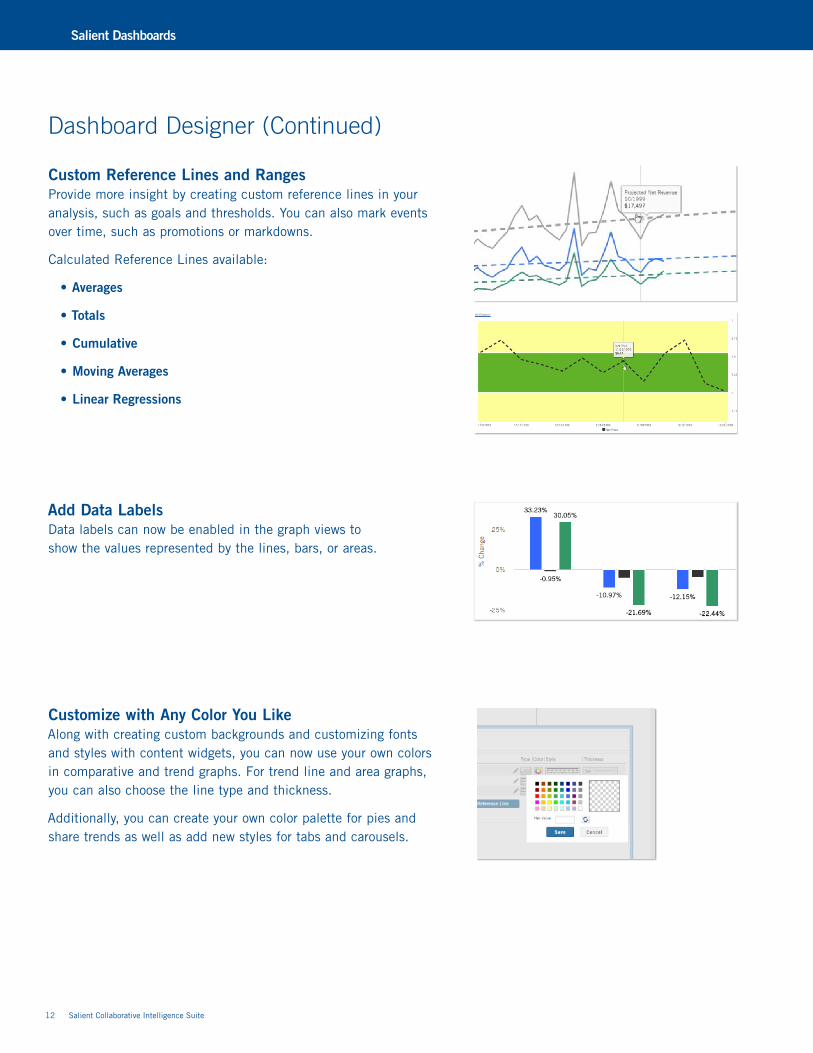
Custom Reference Lines and RangesProvide more insight by creating custom reference lines in your analysis, such as goals and thresholds. You can also mark events over time, such as promotions or markdowns.
Calculated Reference Lines available:
• Averages
• Totals
• Cumulative
• Moving Averages
• Linear Regressions
Add Data LabelsData labels can now be enabled in the graph views to show the values represented by the lines, bars, or areas.
Customize with Any Color You Like Along with creating custom backgrounds and customizing fonts and styles with content widgets, you can now use your own colors in comparative and trend graphs. For trend line and area graphs, you can also choose the line type and thickness.
Additionally, you can create your own color palette for pies and share trends as well as add new styles for tabs and carousels.
Salient Collaborative Intelligence Suite 13
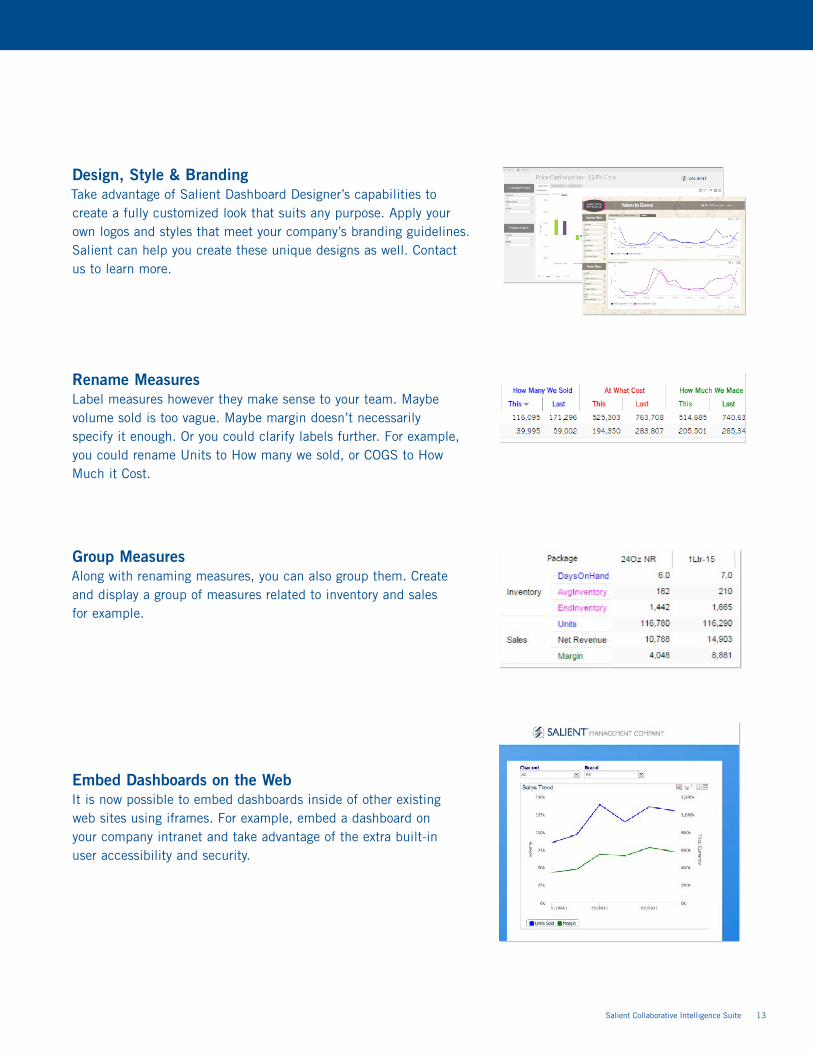
Design, Style & BrandingTake advantage of Salient Dashboard Designer’s capabilities to create a fully customized look that suits any purpose. Apply your own logos and styles that meet your company’s branding guidelines. Salient can help you create these unique designs as well. Contact us to learn more.
Rename MeasuresLabel measures however they make sense to your team. Maybe volume sold is too vague. Maybe margin doesn’t necessarily specify it enough. Or you could clarify labels further. For example, you could rename Units to How many we sold, or COGS to How Much it Cost.
Group MeasuresAlong with renaming measures, you can also group them. Create and display a group of measures related to inventory and sales for example.
Embed Dashboards on the WebIt is now possible to embed dashboards inside of other existing web sites using iframes. For example, embed a dashboard on your company intranet and take advantage of the extra built-in user accessibility and security.
Salient Dashboards
14 Salient Collaborative Intelligence Suite
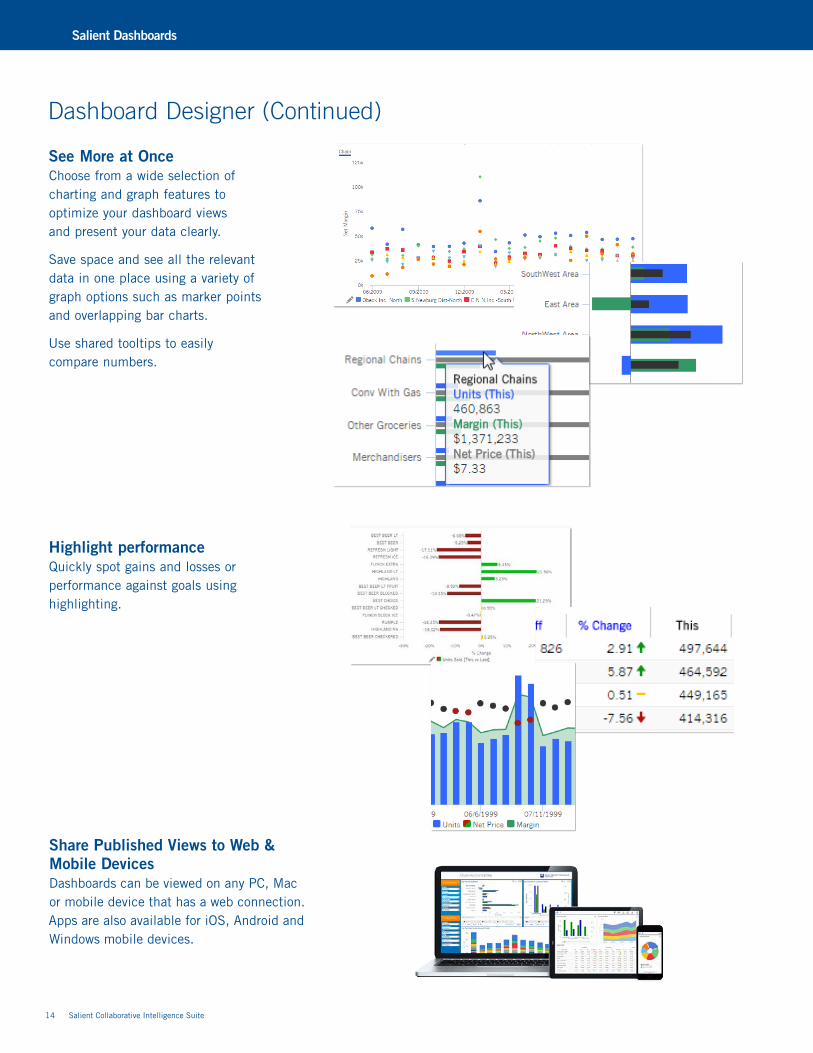
See More at OnceChoose from a wide selection of charting and graph features to optimize your dashboard views and present your data clearly.
Save space and see all the relevant data in one place using a variety of graph options such as marker points and overlapping bar charts.
Use shared tooltips to easily compare numbers.
Highlight performanceQuickly spot gains and losses or performance against goals using highlighting.
Share Published Views to Web & Mobile Devices Dashboards can be viewed on any PC, Mac or mobile device that has a web connection. Apps are also available for iOS, Android and Windows mobile devices.
Dashboard Designer (Continued)
Salient Collaborative Intelligence Suite 15
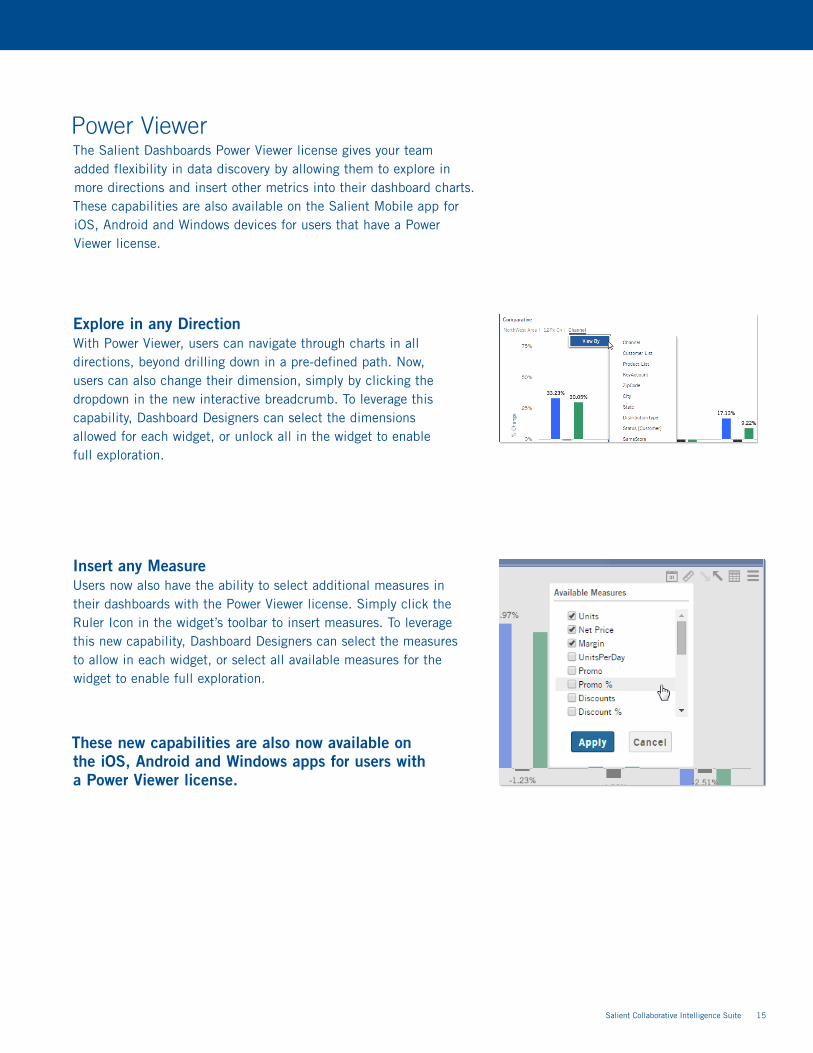
Explore in any DirectionWith Power Viewer, users can navigate through charts in all directions, beyond drilling down in a pre-defined path. Now, users can also change their dimension, simply by clicking the dropdown in the new interactive breadcrumb. To leverage this capability, Dashboard Designers can select the dimensions allowed for each widget, or unlock all in the widget to enable full exploration.
Insert any MeasureUsers now also have the ability to select additional measures in their dashboards with the Power Viewer license. Simply click the Ruler Icon in the widget’s toolbar to insert measures. To leverage this new capability, Dashboard Designers can select the measures to allow in each widget, or select all available measures for the widget to enable full exploration.
These new capabilities are also now available on the iOS, Android and Windows apps for users with a Power Viewer license.
Power ViewerThe Salient Dashboards Power Viewer license gives your team added flexibility in data discovery by allowing them to explore in more directions and insert other metrics into their dashboard charts. These capabilities are also available on the Salient Mobile app for iOS, Android and Windows devices for users that have a Power Viewer license.
16 Salient Collaborative Intelligence Suite
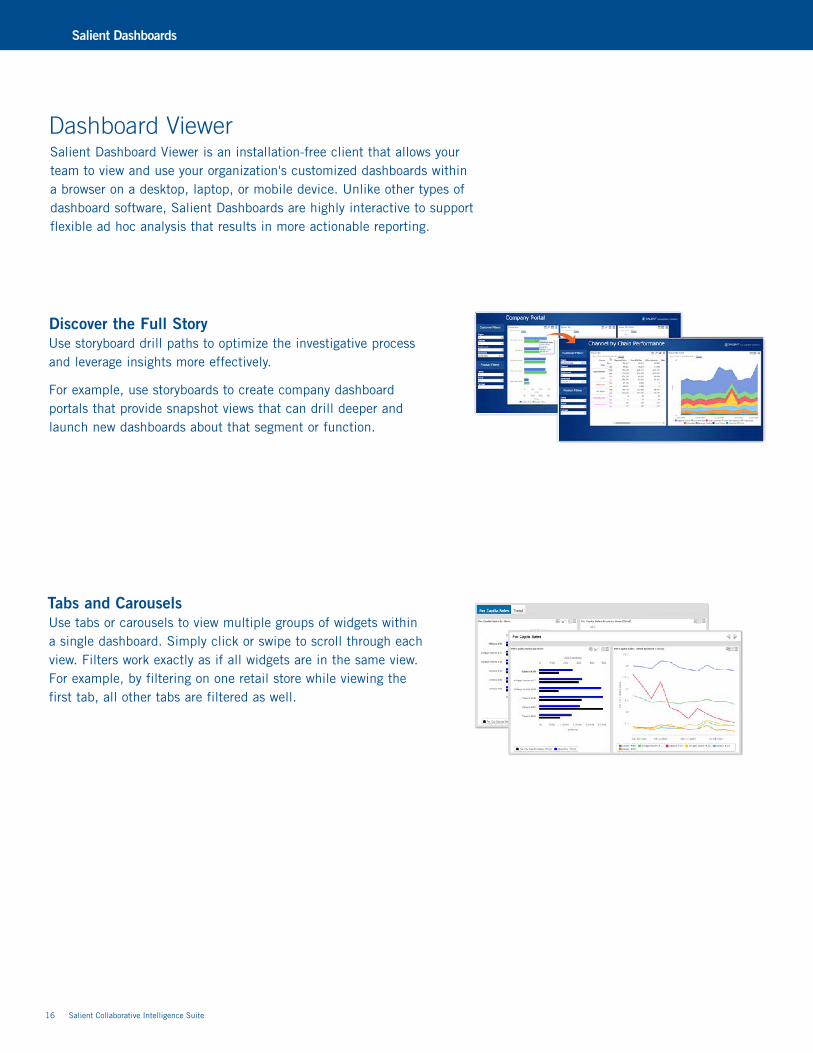
Discover the Full StoryUse storyboard drill paths to optimize the investigative process and leverage insights more effectively.
For example, use storyboards to create company dashboard portals that provide snapshot views that can drill deeper and launch new dashboards about that segment or function.
Tabs and Carousels Use tabs or carousels to view multiple groups of widgets within a single dashboard. Simply click or swipe to scroll through each view. Filters work exactly as if all widgets are in the same view. For example, by filtering on one retail store while viewing the first tab, all other tabs are filtered as well.
Dashboard ViewerSalient Dashboard Viewer is an installation-free client that allows your team to view and use your organization's customized dashboards within a browser on a desktop, laptop, or mobile device. Unlike other types of dashboard software, Salient Dashboards are highly interactive to support flexible ad hoc analysis that results in more actionable reporting.
Salient Dashboards
Salient Collaborative Intelligence Suite 17
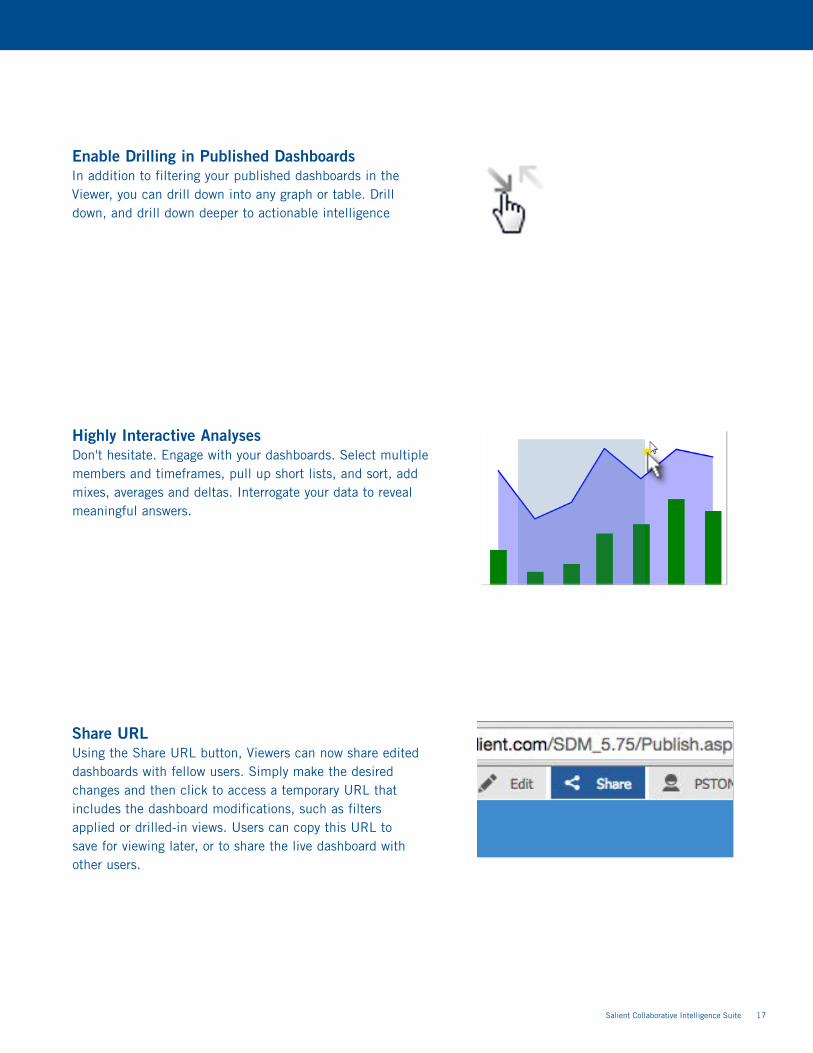
Enable Drilling in Published Dashboards In addition to filtering your published dashboards in the Viewer, you can drill down into any graph or table. Drill down, and drill down deeper to actionable intelligence
Highly Interactive AnalysesDon't hesitate. Engage with your dashboards. Select multiple members and timeframes, pull up short lists, and sort, add mixes, averages and deltas. Interrogate your data to reveal meaningful answers.
Share URLUsing the Share URL button, Viewers can now share edited dashboards with fellow users. Simply make the desired changes and then click to access a temporary URL that includes the dashboard modifications, such as filters applied or drilled-in views. Users can copy this URL to save for viewing later, or to share the live dashboard with other users.
18 Salient Collaborative Intelligence Suite
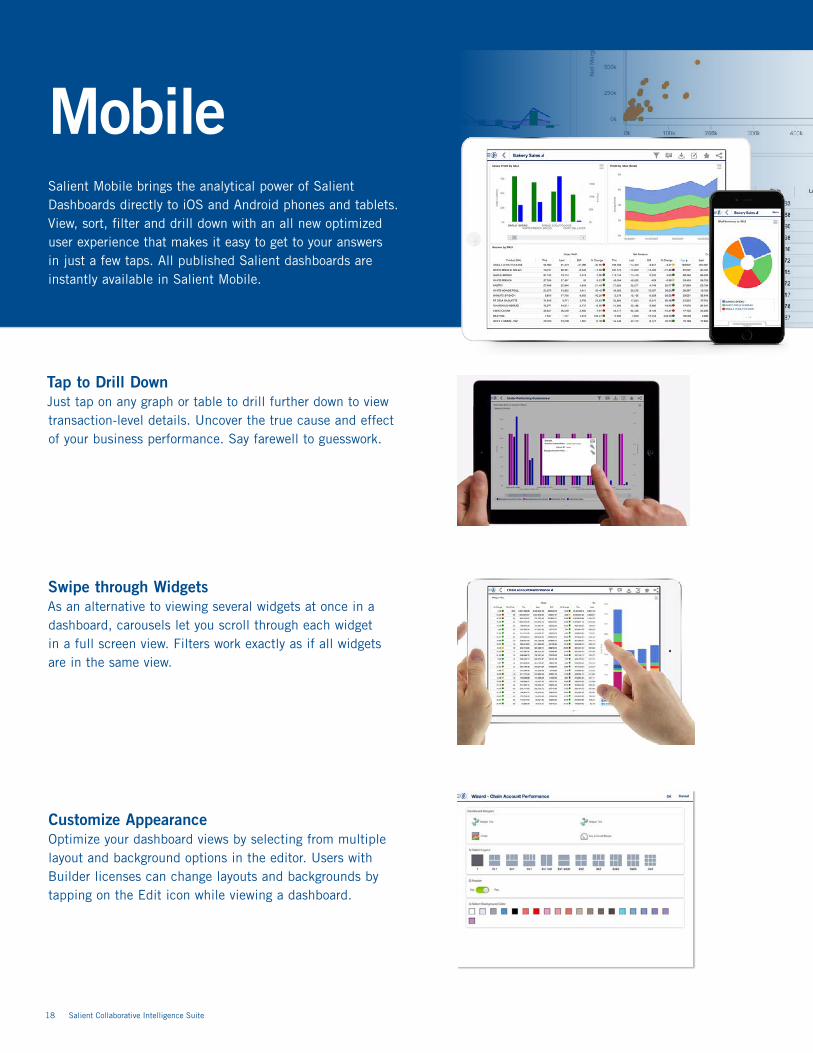
MobileSalient Mobile brings the analytical power of Salient Dashboards directly to iOS and Android phones and tablets. View, sort, filter and drill down with an all new optimized user experience that makes it easy to get to your answers in just a few taps. All published Salient dashboards are instantly available in Salient Mobile.
Tap to Drill DownJust tap on any graph or table to drill further down to view transaction-level details. Uncover the true cause and effect of your business performance. Say farewell to guesswork.
Swipe through WidgetsAs an alternative to viewing several widgets at once in a dashboard, carousels let you scroll through each widget in a full screen view. Filters work exactly as if all widgets are in the same view.
Customize AppearanceOptimize your dashboard views by selecting from multiple layout and background options in the editor. Users with Builder licenses can change layouts and backgrounds by tapping on the Edit icon while viewing a dashboard.
Salient Collaborative Intelligence Suite 19
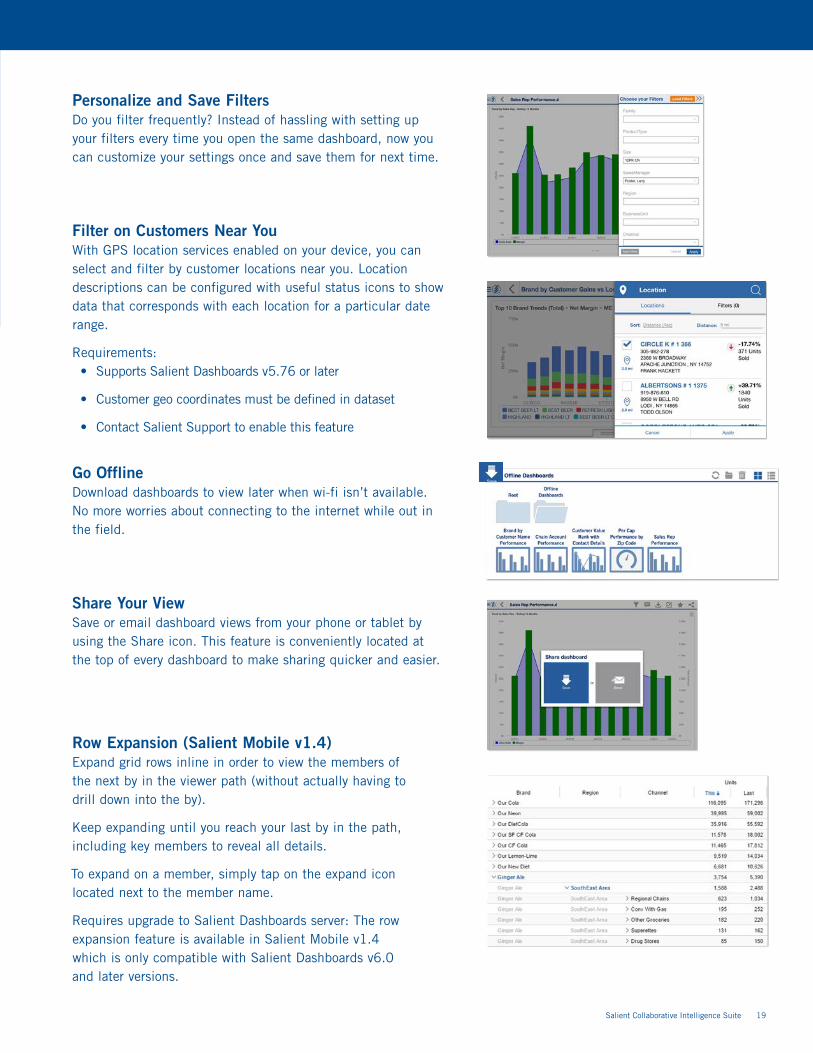
Personalize and Save Filters Do you filter frequently? Instead of hassling with setting up your filters every time you open the same dashboard, now you can customize your settings once and save them for next time.
Filter on Customers Near YouWith GPS location services enabled on your device, you can select and filter by customer locations near you. Location descriptions can be configured with useful status icons to show data that corresponds with each location for a particular date range.
Requirements:• Supports Salient Dashboards v5.76 or later
• Customer geo coordinates must be defined in dataset
• Contact Salient Support to enable this feature
Go OfflineDownload dashboards to view later when wi-fi isn’t available. No more worries about connecting to the internet while out in the field.
Share Your ViewSave or email dashboard views from your phone or tablet by using the Share icon. This feature is conveniently located at the top of every dashboard to make sharing quicker and easier.
Row Expansion (Salient Mobile v1.4) Expand grid rows inline in order to view the members of the next by in the viewer path (without actually having to drill down into the by).
Keep expanding until you reach your last by in the path, including key members to reveal all details.
To expand on a member, simply tap on the expand icon located next to the member name.
Requires upgrade to Salient Dashboards server: The row expansion feature is available in Salient Mobile v1.4 which is only compatible with Salient Dashboards v6.0 and later versions.
20 Salient Collaborative Intelligence Suite
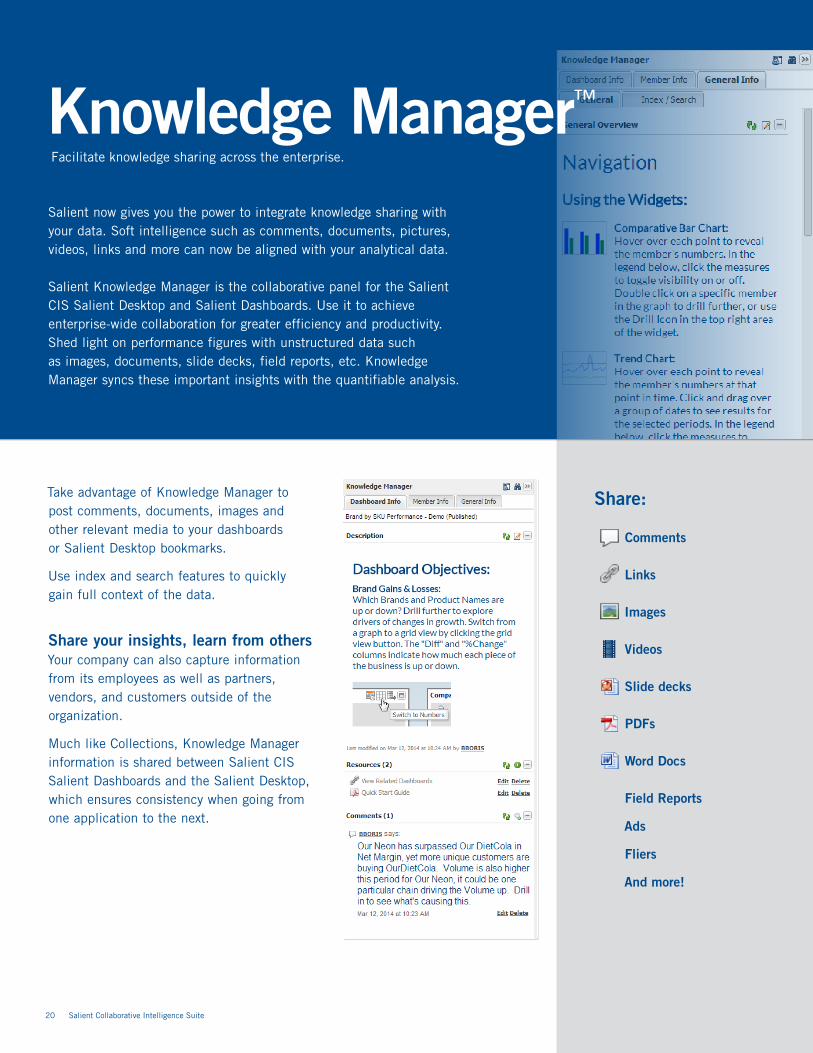
Knowledge Manager™ Facilitate knowledge sharing across the enterprise.
Salient now gives you the power to integrate knowledge sharing with your data. Soft intelligence such as comments, documents, pictures, videos, links and more can now be aligned with your analytical data.
Salient Knowledge Manager is the collaborative panel for the Salient CIS Salient Desktop and Salient Dashboards. Use it to achieve enterprise-wide collaboration for greater efficiency and productivity. Shed light on performance figures with unstructured data such as images, documents, slide decks, field reports, etc. Knowledge Manager syncs these important insights with the quantifiable analysis.
Take advantage of Knowledge Manager to post comments, documents, images and other relevant media to your dashboards or Salient Desktop bookmarks.
Use index and search features to quickly gain full context of the data.
Share your insights, learn from othersYour company can also capture information from its employees as well as partners, vendors, and customers outside of the organization.
Much like Collections, Knowledge Manager information is shared between Salient CIS Salient Dashboards and the Salient Desktop, which ensures consistency when going from one application to the next.
Share:
Comments
Links
Images
Videos
Slide decks
PDFs
Word Docs
Field Reports
Ads
Fliers
And more!
Salient Collaborative Intelligence Suite 21
Salient ETL™
Data integration made easier, faster, and more efficient.
Salient ETL 6.0 makes database management workflows faster, easier and more efficient. Instead of having to deal with various files to make changes to the Salient Data Mart, you can better manage these tasks using Salient ETL 6.0.
Salient ETL has been upgraded to improve overall flow of designing, mapping and automation of the data interface, as well as integration with the Salient Data Mart. All modification to the database can now be done directly in Salient ETL, now which also allows you to see the changes you’ve made to your data model before you apply them.
From design to automation in 3 easy steps
Our Integration Strategy: 1. Design based on business objectives
2. Map source data to the logical design 3. Automate updates of data feeds
Salient ETL supports integration for a comprehensive perspective of multiple business processes (sales, inventory, marketing, financial and more) for a completely integrated enterprise management solution. Salient can connect to any data source—even concurrently to provide managers with a single source of comprehensive detailed intelligence.
“Salient has helped us become much smarter manufacturers.”Randy Bates, Executive Vice President of Sales and Marketing for Golden Flake
203 Colonial Drive, NY 14845 USA phone 800.447.1868 www.salient.com ©2016 Salient Corporation
About Salient
Salient Management Company offers business and government a new solution for efficient management. Drawing on diverse data from multiple sources, Salient technology measures how business activity creates value, quality, financial efficiency, and productivity, while the user interface eliminates barriers to using this knowledge for continuous process improvement.
Salient is a worldwide provider of advanced performance management and decision support systems for a wide range of industries and the public sector. Founded in 1986, Salient today serves more than 115,000 users in 61 countries.
For more information, visit www.salient.com.