Sales of veterinary antimicrobial agents in 31 European ... · antimicrobial agents in 31 European...
109
An agency of the European Union Sales of veterinary antimicrobial agents in 31 European countries in 2017 Trends from 2010 to 2017 Ninth ESVAC report
Transcript of Sales of veterinary antimicrobial agents in 31 European ... · antimicrobial agents in 31 European...

An agency of the European Union
Sales of veterinary antimicrobial agents in 31 European countries in 2017
Trends from 2010 to 2017Ninth ESVAC report

Mission statement
The mission of the European Medicines Agency is to foster scientific excellence in the evaluation and supervision of medicines, for the benefit of public and animal health.
Legal role
The European Medicines Agency (hereinafter ‘the Agency’ or EMA) is the European Union (EU) body responsible for coordinating the existing scientific resources put at its disposal by Member States for the evaluation, supervision and pharmacovigilance of medicinal products.
The Agency provides the Member States and the institutions of the EU and the European Economic Area (EEA) countries with the best-possible scientific advice on any questions relating to the evaluation of the quality, safety and efficacy of medicinal products for human or veterinary use referred to it in accordance with the provisions of EU legislation relating to medicinal products.
The founding legislation of the Agency is Regulation (EC) No 726/2004 of the European Parliament and the Council of 31 March 2004 laying down Community procedures for the authorisation and supervision of medicinal products for human and veterinary use and establishing a European Medicines Agency1.
Principal activities
Working with the Member States and the European Commission (EC) as partners in a European medicines network, the Agency:
• Provides independent, science-based recommendations on the quality, safety and efficacy of medicines, and on more general issues relevant to public and animal health that involve medicines;
• Applies efficient and transparent evaluation procedures to help bring new medicines to the market by means of a single, EU-wide marketing authorisation granted by the EC;
• Implements measures for continuously supervising the quality, safety and efficacy of authorised medicines to ensure that their benefits outweigh their risks;
• Provides scientific advice and incentives to stimulate the development and improve the availability of innovative new medicines;
• Recommends safe limits for residues of veterinary medicines used in food-producing animals, for the establishment of maximum residue limits by the EC;
1 OJ L 136, 30.4.2004, p. 1
• Involves representatives of patients, healthcare professionals and other stakeholders in its work, to facilitate dialogue on issues of common interest;
• Publishes impartial and comprehensible information about medicines and their use;
• Develops best practice for medicines evaluation and supervision in Europe and contributes alongside the Member States and the EC to the harmonisation of regulatory standards at the international level.
Guiding principles
• We are strongly committed to public and animal health.
• We make independent recommendations based on scientific evidence, using state-of-the-art knowledge and expertise in our field.
• We support research and innovation to stimulate the development of better medicines.
• We value the contribution of our partners and stakeholders to our work.
• We assure continual improvement of our processes and procedures, in accordance with recognised quality standards.
• We adhere to high standards of professional and personal integrity.
• We communicate in an open, transparent manner with all of our partners, stakeholders and colleagues.
• We promote the well-being, motivation and ongoing professional development of every member of the Agency.

Sales of veterinary antimicrobial agents in 31 European countries in 2017
Trends from 2010 to 2017Ninth ESVAC report
15 October 2019EMA/294674/2019Veterinary Medicines Division
Acknowledgements
The members and observers of the ESVAC sales advisory expert group — Kari Grave (chair), Christina Greko, Katariina Kivilahti-Mäntylä, Laura Mie Jensen, Gérard Moulin and Lucie Pokludová — are acknowledged for providing valuable comments and scientific advice during the production of this report.
Furthermore, Reinhard Fuchs, Klemens Fuchs, Bart Hoet, Ivaylo Ivanov, Iva Gruden Zdunić, Jana Wojtylová, Marios Genakritis, Marju Sammul, Anne Chevance, Christoph Bode, Spyridon Farlopoulos, Xanthi Skampardoni, Zsófia Fűrész, Jóhann M. Lenharðsson, Jeremiah Gabriel Beechinor, Gavin Ryan, Angelica Maggio, Dagnija Brensone, Sigitas Siriukaitis, Marcel Bruch, Bernard Soler, Bart van den Assum, Inge van Geijlswijk, Kari Olli Helgesen, Dorota Zaboklicka-Bodzioch, Marek Kukier, Inês Martins de Almeida, João Pedro Duarte da Silva, Camelia Voicu, Anton Svetlin, Rinaldo Zidar, Judita Hederová, Iveta Sincaková, Cristina Muñoz Madero, Sara Sacristán Álvarez, Kinfe Girma, Cedric Mϋntener, Ana Vidal and Alexandra Pickering are all acknowledged for providing data and valuable comments for the report.
European Medicines Agency staff members Kristine Ignate, Zoltan Kunsagi and Barbara Freischem are gratefully acknowledged for the preparation of the report.
Citation
Suggested citation: European Medicines Agency, European Surveillance of Veterinary Antimicrobial Consumption, 2019. ‘Sales of veterinary antimicrobial agents in 31 European countries in 2017’. (EMA/294674/2019)
Correspondence
Any correspondence relating to this report should be sent by e-mail to: [email protected]
DISCLAIMERThe views and positions expressed in this report do not necessarily represent in legal terms the official position of the European Medicines Agency. The European Medicines Agency assumes no responsibility or liability for any errors or inaccuracies that may appear in the report.

About the European Medicines AgencyThe European Medicines Agency (EMA) is a decentralised body of the EU, located in Amsterdam. Its main responsibility is the protection and promotion of public and animal health, through the evaluation and supervision of medicines for human and veterinary use.
The Agency is responsible for the scientific evaluation of applications for European marketing authorisations for both human and veterinary medicines (centralised procedure). Under the centralised procedure, companies submit a single marketing authorisation application to the Agency. Once granted by the EC, a centralised marketing authorisation is valid in all EU Member States and, after implementation at national level, in the EEA-EFTA states (Iceland, Liechtenstein and Norway).1
The Agency, with the help of its Committee for Medicinal Products for Veterinary Use (CVMP), and its Antimicrobials Working Party (AWP), has produced a strong body of scientific advice2 in relation to the use of antimicrobials and the risk of antimicrobial resistance (AMR), with the intention of promoting the continued availability of effective antimicrobials for use in animals while, at the same time, acting to minimise risks to animals or humans arising from their use.
The European Surveillance of Veterinary Antimicrobial Consumption (ESVAC) project was launched by the Agency in September 2009, following a request from the EC to develop a harmonised approach to the collection and reporting of data on the use of antimicrobial agents in animals from the Member States.
About the reportThe ninth ESVAC report presents data on the sales of veterinary antimicrobial agents from 31 European countries in 2017, provided at package level according to a standardised protocol and template. In addition, it includes a chapter describing changes in consumption of veterinary antimicrobials for the years 2010-2017 (Chapter 2.7).
Of note is that compared to previous editions, this report does not present changes across years by country (chapter 2.8.2 in previous reports).
The report emphasises certain classes or subclasses of antimicrobials included in Category 2 of the categorisation made by the EMA Antimicrobial Advice ad hoc Expert Group (AMEG) in 2014 (see selection criteria in Annex 5). The AMEG categories consider the World Health Organization (WHO) categorisation of antimicrobials, the consumption of those antimicrobials in veterinary medicine, the hazards of zoonotic relevance in Europe and the risk of resistance transfer to humans. The AMEG classification is published on the EMA webpage3.
Category 2 of the AMEG categorisation includes those veterinary antimicrobials where the risk for public health is estimated to be higher than other classes of antimicrobials; fluoroquinolones, 3rd- and 4th-generation cephalosporins and polymyxins are included in this category. Macrolides are currently not included in Category 2 of the AMEG categorisation4.
1
Available from the European Medicines Agency website (www.ema.europa.eu) via Home > Veterinary regulatory > Overview > Antimicrobial resistance
2 Available on the European Medicines Agency website (www.ema.europa.eu) via Home > Veterinary regulatory > Overview > Antimicrobial resistance
3 EMA/AMEG: Answer to the second request from the EC (ranking of antibiotics) (EMA/381884/2014): https://www.ema.europa.eu/en/documents/other/answers-requests-scientific-advice-impact-public-health-animal-health-use-antibiotics-animals_en.pdf
4 Although macrolides are not included in Category 2, the CVMP has made recommendations indicating that, amongst others, the responsible use of antimicrobials (macrolides) should be strongly promoted, and that although acknowledging that macrolides are first-line treatment against a number of animal diseases, there is a need to avoid unnecessary use.
Aminoglycosides and certain penicillins (aminopenicillins, i.e. amoxicillin, ampicillin and metampicillin) have been revised by the CVMP without suggesting a category for those groups of antimicrobials5. The classification of antimicrobial classes by AMEG is currently being revised and the updated scientific advice of AMEG on the categorisation of antimicrobials is expected to be finalised by the end of 20196.
In 2017, the European Centre for Disease Prevention and Control (ECDC), the European Food Safety Authority (EFSA) and EMA published the second joint report on the integrated analysis of the consumption of antimicrobial agents and occurrence of AMR in bacteria from humans and food-producing animals (JIACRA II report)7. Whilst recognising the complexity of evaluating the association between the sales of antimicrobials and occurrence of AMR in animals and humans, the report confirms that a reduction in the sales of antimicrobials is desirable objective in order to contain AMR.
ECDC, EFSA and EMA have also jointly established a list of harmonised outcome indicators8 to assist EU Member States in assessing their progress in reducing the use of antimicrobials and occurrence of AMR in both humans and food-producing animals. For food-producing animals, the proposed indicators for antimicrobial consumption include: overall sales of veterinary antimicrobials; sales of 3rd- and 4th-generation cephalosporins; sales of quinolones (specifying the proportion of fluoroquinolones); and sales of polymyxins, measured in mg/PCU.
This ninth ESVAC report places the emphasis on food-producing animals.
The data and information included in this report has been reviewed and approved by the ESVAC National Contact Points (NCs) or their alternates.
Advice on how to read this report:
It is generally agreed that it usually takes at least three to four years to establish a valid baseline for the data on sales of veterinary antimicrobial agents. Consequently, the data from countries that have collected such data for the first or second time should be interpreted with due caution.
It should be emphasised that the data presented in this report should not be used alone as a basis for setting management priorities, additional data on the production of animals per country and animal demography, available veterinary medicinal products and other factors should also be considered.
It is also recommended not to use data presented in this report to directly compare countries, as more detailed insight and analysis may be needed.
5 See the EMA website (www.ema.europa.eu): via Home> Veterinary regulatory> Research and development > Safety and residues: antimicrobials (https://www.ema.europa.eu/en/veterinary-regulatory/research-development/scientific-guidelines/safety-residues/safety-residues-antimicrobials)
6 EC request for updated advice on the impact on public health and animal health of the use of antibiotics in animals: https://www.ema.europa.eu/en/documents/other/mandate-antimicrobial-advice-ad-hoc-expert-group-ameg_en.pdf
7 Available on the EMA webpage (www.ema.europa.eu) via: Home > Veterinary regulatory > Overview > Antimicrobial resistance > Analysis of consumption and resistance (JIACRA): https://www.ema.europa.eu/en/documents/report/ecdc/efsa/ema-second-joint-report-integrated-analysis-consumption-antimicrobial-agents-occurrence_en.pdf
8 Available on the EMA webpage (www.ema.europa.eu) via Home > Veterinary regulatory > Overview > Antimicrobial resistance > Analysis of consumption and resistance (JIACRA) > Outcome indicators (https://www.ema.europa.eu/en/documents/report/ecdc-efsa-ema-joint-scientific-opinion-list-outcome-indicators-regards-surveillance-antimicrobial_en.pdf)

Table of contents
Summary ................................................................................................................... 11
Introduction .............................................................................................................. 13
1. Technical notes .................................................................................................... 151.1. Antimicrobial veterinary medicinal products included in the data sets .....................................151.2. Variables reported for each antimicrobial veterinary medicinal product ....................................151.3. Collection and calculation of sales data ...............................................................................161.4. Denominator: population correction unit (PCU) ....................................................................161.4.1. Calculation of PCU ........................................................................................................161.4.2. Animal species and categories included in the PCU; selection of data sources ........................171.5. Correction of historical data ..............................................................................................171.5.1. Sales data ...................................................................................................................171.5.2. PCU data .....................................................................................................................171.6. Quality check and validation of the sales and PCU data .........................................................171.7. Analysis and reporting of the data .....................................................................................181.8. Summary of included data sources/types, by country ...........................................................18
2. Results ................................................................................................................. 232.1. Overall sales (tonnes) of antimicrobial agents for veterinary use ............................................232.2. Population-adjusted sales for food-producing animals, including horses, by antimicrobial class ...242.3. Population-adjusted sales for food-producing animals, including horses, by pharmaceutical form ..282.4. Distribution of sales for food-producing animals – overall and by antimicrobial class and pharmaceutical form ..............................................................................................................312.4.1. Distribution of sales of antimicrobials for food-producing animals, by country .......................312.4.1.1. 3rd- and 4th-generation cephalosporins ........................................................................322.4.1.2. Fluoroquinolones .......................................................................................................332.4.1.3. Other quinolones .......................................................................................................342.4.1.4. Polymyxins ...............................................................................................................352.5. Distribution of the population correction unit (PCU) by species and country .............................362.6. Distribution of single- and multiple-ingredient products of veterinary antimicrobial agents ...............................................................................................................392.7. Changes over time ..........................................................................................................392.7.1. Overall changes in the ESVAC participating countries ........................................................402.7.1.1. Changes in sales of tonnes of active ingredients, by country ............................................402.7.1.2. Changes in overall sales in mg/PCU, by country .............................................................412.7.1.3. Changes in sales by antimicrobial class in mg/PCU, by country .........................................472.7.1.4. Changes in the denominator (PCU) by country ...............................................................59

3. Discussion ............................................................................................................. 60
4. Concluding remarks ............................................................................................... 62
Annex 1 Additional tables and charts ........................................................................ 63
Annex 2. Variables to be reported or used for calculation of active ingredient for each antimicrobial veterinary medicinal product; standardisation of the data ....................................................................................... 74
Annex 3. Population correction unit (PCU) ................................................................ 77
Annex 4. List of antimicrobial classes/active ingredients reported in the ESVAC....... 79
Annex 5. Selection of antimicrobial classes of WHO CIAs and AMEG Category 2 highlighted in the report .......................................................................................... 82
Annex 6. Distribution of veterinary medicines; legal framework and data sources by country .................................................................................................... 83
Annex 7. References to national reports .................................................................... 97
Annex 8. Country and affiliation of the ESVAC national contact points/alternates ...................................................................................................... 99
Annex 9. ESVAC sales advisory expert group members and observers .................... 105
List of figures
Figure 1. Organisation of the ESVAC ............................................................................................14Figure 2. Sales for food-producing species, in mg/PCU, of the various veterinary
antimicrobial classes, for 31 European countries, in 2017 ..................................................26Figure 3. Proportion of the total sales of the different veterinary antimicrobial classes,
in mg/PCU, in the 31 European countries, for 2017 ...........................................................26Figure 4. Sales of antimicrobial agents by antimicrobial class as percentage of the total sales for
food-producing species, in mg/PCU, aggregated by 31 European countries, for 2017 .............27Figure 5. Distribution of the sales, in mg/PCU, of penicillins by subclass for food-producing species,
in 31 European countries, for 2017 .................................................................................27Figure 6. Proportion of the total sales of 3rd- and 4th-generation cephalosporins, fluoroquinolones,
other quinolones and polymyxins for food-producing species, in mg/PCU, for 31 European countries, in 2017 ........................................................................................................28
Figure 7. Distribution of sales of veterinary antimicrobial agents for food-producing animals, in mg of active substance per population correction unit (mg/PCU), by pharmaceutical form, in 31 European countries, for 2017 ........................................................................29
Figure 8. Oral solutions, oral powders and premixes as percentages of total sales, in mg per population correction unit (mg/PCU), of veterinary antimicrobial agents for food-producing animals, in 31 European countries, for 2017 ..............................................29
Figure 9. Distribution of sales, in mg/PCU, of the various pharmaceutical forms of veterinary antimicrobial agents for food-producing animals, aggregated by the 31 European countries, for 2017 .......................................................................................................30
Figure 10. Spatial distribution of overall sales of all antimicrobials for food-producing animals, in mg/PCU, for 31 countries, for 2017 ............................................................................31
Figure 11. Spatial distribution of sales of 3rd- and 4th-generation cephalosporins for veterinary use, in mg/PCU, by country, for 2017 .............................................................................32
Figure 12. Distribution of sales of 3rd- and 4th-generation cephalosporins for veterinary use by pharmaceutical form, in mg/PCU, by country, for 2017 .................................................32
Figure 13. Spatial distribution of sales of fluoroquinolones for veterinary use, in mg/PCU, by country, for 2017 ....................................................................................................33
Figure 14. Distribution of sales of fluoroquinolones for veterinary use by pharmaceutical form, in mg/PCU, by country, for 2017 ...................................................................................33
Figure 15. Spatial distribution of sales of other quinolones for veterinary use, in mg/PCU, by country, for 2017 ....................................................................................................34
Figure 16. Distribution of sales of other quinolones for veterinary use by pharmaceutical form, in mg/PCU, by country, for 2017 ...................................................................................34
Figure 17. Spatial distribution of sales of polymyxins for veterinary use, in mg/PCU, by country, for 2017 ....................................................................................................35
Figure 18. Distribution of sales of polymyxins for veterinary use by pharmaceutical form, in mg/PCU, by country, for 2017 ...................................................................................35
Figure 19. The denominator (PCU) and its distribution by the food-producing animal species (1 PCU = 1 kg), by country, in 2017 ..............................................................................37
Figure 20. Distribution of the denominator (PCU) in weight by food-producing animal species, including horses, by country, in 2017 .............................................................................37
Figure 21. Percentage of sales for veterinary use, in tonnes of active ingredient, of premixes, oral powders and oral solutions containing 1, 2, 3 and 4 antimicrobial agents, in 2017 .........39
Figure 22. Sales, in tonnes of active ingredients, of veterinary antimicrobials for food-producing animals, by country, between 2010 to 2017 .............................................40

Figure 23. Total sales of veterinary antimicrobials for food-producing species, in mg/PCU, by country, from 2010 to 2017 .................................................................................... 41
Figure 24. Changes in aggregated overall sales, as well as sales of fluoroquinolones, other quinolones, 3rd- and 4th-generation cephalosporins and polymyxins, for 25 EU/EEA countries1, from 2011 to 2017 (note the differences in the scales of the Y axes) ......................................................................................... 45
Figure 25. Changes in aggregated sales (mg/PCU) by antimicrobial class in 25 EU/EEA countries, from 2011 to 2017 ..................................................................................... 46
Figure 26. Changes in sales of tetracyclines for food-producing species, in mg/PCU, by country, from 2010 to 2017 .................................................................................... 47
Figure 27. Changes in sales of doxycycline for food-producing species, in mg/PCU, by country, from 2010 to 2017 .................................................................................... 48
Figure 28. Changes in sales of penicillins for food-producing species, in mg/PCU, by country, from 2010 to 2017 .................................................................................... 51
Figure 29. Changes in sales of sulfonamides for food-producing species, in mg/PCU, by country, from 2010 to 2017 .................................................................................... 50
Figure 30. Changes in sales of quinolones (fluoroquinolones and other quinolones) for food-producing species, in mg/PCU, by country, from 2010 to 2017 ............................ 55
Figure 31. Changes in sales of macrolides for food-producing species, in mg/PCU, by country, from 2010 to 2017 .................................................................................... 58
Figure 32. Changes in the denominator (PCU) for food-producing animals, in 1,000 tonnes, by country, between 2010 to 2017 .............................................................................. 59

Table 1. Categories and ATCvet codes of antimicrobial VMPs included in the data ............................. 15Table 2. Summary of information on years of collecting data, legal basis for collecting
data at national level, national data providers, sources for ESVAC data and characteristics of data, by country, for 2017 .................................................................... 19
Table 3. Overall sales, in tonnes of active ingredient, split by tablets (used mainly in companion animals) and all other pharmaceutical forms (used mainly in food-producing animals), by country, in 2017 ............................................................... 23
Table 4. Sales, in tonnes of active ingredient, of veterinary antimicrobial agents marketed mainly for food-producing animals, PCU and sales in mg/PCU, by country, for 2017 ............. 24
Table 5. Sales for food-producing animals, in mg per population correction unit (mg/PCU), of the various veterinary antimicrobial classes in the 31 European countries in 2017 ............. 25
Table 6. Estimated PCU (in 1,000 tonnes) of the population of food-producing species by country, for 2017 ..................................................................................................... 36
Table 7. PCU domestic, net export and net import (1,000 tonnes) of animals for fattening or slaughter, respectively, to or from another Member State and PCU (net balance) in 2017 ................................................................................................... 38
Table 8. Annual sales of veterinary antimicrobial agents for food-producing species, in mg/PCU, by country, from 2010 to 2017 ...................................................................... 42
Table 9. Changes in sales of 3rd- and 4th-generation cephalosporins for food-producing species, in mg/PCU, by country, from 2010 to 2017. Note that the scale differs between countries. ...................................................................................................... 51
Table 10. Changes in sales of fluoroquinolones for food-producing species, in mg/PCU, by country, from 2010 to 2017. Note that the scale differs between countries. ..................... 53
Table 11. Changes in sales of polymyxins for food-producing species, in mg/PCU, by country, from 2010 to 2017. Note that the scale differs between countries. ..................... 56
List of tables

Tables and charts in Annexes 1-9
Table A1. Sales, in tonnes of active ingredient, of veterinary antimicrobial agents applicable mainly for food-producing animals by antimicrobial class (presented according to the ATCvet hierarchical system), by country, for 2017 (tablets not included) ................... 63
Table A2. Distribution of sales, in mg/PCU, of veterinary antimicrobial agents applicable mainly for food-producing animals, by administration route/form and country, for 2017 ...................... 64
Table A3. Percentage of sales, in mg/PCU, of premixes by veterinary antimicrobial class (according to ATCvet system), by country, for 2017 ........................................................ 65
Table A4. Percentages of sales, in mg/PCU, of oral powders by antimicrobial class (according to ATCvet system), by country, for 2017 ....................................................... 66
Table A5. Percentage of sales, in mg/PCU, of oral solutions by antimicrobial class (according to ATCvet system), by country, for 2017 ........................................................ 67
Table A6. Percentage of sales, in mg/PCU, of injection preparations by antimicrobial class (according to ATCvet system), by country, for 2017 ........................................................ 68
Table A7. Number of product presentations (product name, form, strength and pack size) containing 1, 2 and 3 antimicrobial agents sold, by country, for 2017 (tablets excluded from the data) ................................................................................... 69
Table A8. Number of product presentations (product name, form, strength and pack size) of premixes, oral powders and oral solutions sold containing 1, 2 and 3 antimicrobial agents sold, by country, for 2017 .................................................................................. 70
Table A9. Sales, in tonnes of active ingredient, of antimicrobial agents sold as premixes, oral powders and oral solutions containing 1, 2 and 3 active ingredients, by country, for 2017 ................................................................................................... 71
Table A10. Variables reported to the ESVAC for each antimicrobial veterinary medicinal product, for 2017 ....................................................................................................... 74
Table A11. Conversion factors used to convert from international units (IU) to weight (mg) of active ingredient, based on WHO International Standards for Antibiotics ........................ 76
Table A12. Conversion factors used to convert from prodrug content to content of active ingredient .........76Table A13. Animal categories included in the calculation of the population correction unit (PCU)
and data types to be reported ......................................................................................77Table A14. Weights used to calculate the population correction unit (PCU) ......................................... 78Table A15. List of substances reported sold in the ESVAC 2010-2017 ................................................ 79Table A16. Antimicrobial classes highlighted in the report and their classification................................ 82Table A17. List of ESVAC national contact points/alternates 2019 ..................................................... 99Table A18. List of ESVAC sales advisory expert group members ......................................................105Table A19. List of ESVAC sales advisory expert group observers from the European Commission,
ECDC and EFSA ........................................................................................................106
Figure A1. Distribution of sales of tetracyclines for food-producing animals, in mg/PCU, by the major pharmaceutical forms sold, aggregated by the 31 European countries, for 2017 ....................................................................................................................72
Figure A2. Distribution of sales of penicillins for food-producing animals, in mg/PCU, by the major pharmaceutical forms sold, aggregated by the 31 European countries, for 2017 ....................................................................................................................72
Figure A3. Distribution of sales of sulfonamides for food-producing animals, in mg/PCU, by the major pharmaceutical forms sold, aggregated by the 31 European countries, for 2017 ....................................................................................................................72
Figure A4. Distribution of sales of 3rd- and 4th-generation cephalosporins for food-producing animals, in mg/PCU, by the major pharmaceutical forms sold, aggregated by the 31 European countries, for 2017 .........................................................73
Figure A5. Distribution of sales of quinolones for food-producing animals, in mg/PCU, by the major pharmaceutical forms sold, aggregated by the 31 European countries, for 2017 ......................................................................................................73
Figure A6. Distribution of sales of polymyxins for food-producing animals, in mg/PCU, by the major pharmaceutical forms sold, aggregated by the 31 European countries, for 2017 ....................................................................................................................73
Figure A7. Distribution of sales of macrolides for food-producing animals, in mg/PCU, by the major pharmaceutical forms sold, aggregated by the 31 European countries, for 2017 ........................................................................................................................... 73

Sales of veterinary antimicrobial agents in 31 European countries in 2017Ninth ESVAC report11
Summary
A total of 31 European countries – 30 EU/EEA countries and Switzerland – submitted data on sales or prescriptions (two countries) of antimicrobial veterinary medicinal products (VMPs) to the European Medicines Agency for 2017.
A population correction unit (PCU) is applied as a proxy for the size of the food-producing animal population (including all horses). The main indicator used in the current report to express the sales is milligrams of active ingredient sold per population correction unit – mg/PCU.
A large difference in the sales for 2017, expressed as mg/PCU, was observed between the countries with the highest and lowest sales (range 3.1 to 423.1 mg/PCU); total aggregated sales linked to aggregated PCU for all 31 countries which delivered data in 2017 was 107.0 mg/PCU, while the median was 61.9 mg/PCU.
Of the overall sales of antimicrobials in the 31 countries in 2017, the largest amounts, expressed as mg/PCU, were accounted for by tetracyclines (30.4 %), penicillins (26.9 %) and sulfonamides (9.2 %). Overall, these three classes accounted for 66.5 % of total sales in the 31 countries.
The prescribing patterns of the various antimicrobial classes, expressed as mg/PCU, varied substantially between the 31 countries. In 2017, notable variations in the proportion of antimicrobial classes included in the EMA AMEG Category 2 were observed between countries, i.e. 3rd- and 4th-generation cephalosporins, fluoroquinolones and polymyxins – with sales (mg/PCU) ranging from <0.01 to 0.8 mg/PCU, <0.01 to 14.3 mg/PCU and 0 to 14.9 mg/PCU, respectively (Table 5). For these classes, sales (mg/PCU) for food-producing animals in the 31 countries accounted for 0.2 %, 2.2 % and 3.4 % of total sales, respectively. In addition to the antimicrobial classes belonging to AMEG Category 2, WHO has classified macrolides and other quinolones as critically important antimicrobials (CIAs) with the highest priority for human medicine. Macrolides accounted for 7.4 % of the total sales of antimicrobials for food-producing animals in the 31 countries in 2017, while the corresponding figure for other quinolones was 0.4 %.
When aggregated across the 31 countries, sales (mg/PCU) of pharmaceutical forms suitable for group treatment accounted for 89.4 % of the total sales: premixes accounted for 28.8 %; oral powders for 9.9 %; and oral solutions for 50.7 % (Figure 9). The proportion accounted for by pharmaceutical forms applicable for group treatment varied substantially between countries, ranging from 3 % to 96 % (Figure 8). Of the pharmaceutical forms intended for treatment of individual animals (10.6 % of total sales across all countries), 9.7 % of the sales were accounted for by injectable preparations, 0.5 % by intramammary preparations and 0.4 % by oral pastes, boluses and intrauterine preparations (Figure 9).
In 2017, across the 31 countries, the proportion of the total sales of antimicrobial veterinary medicinal products (VMP) suitable for group treatment (oral powder, oral solution and premix) containing one active ingredient was 87 %; 13 % contained two or more active ingredients.
For the 25 countries which provided sales for all years between 2011 and 2017, an overall decline in sales (mg/PCU) of 32.5 % was observed. Overall sales fell from 162.0 mg/PCU in 2011 to 109.3 mg/PCU in 2017 (Figure 24). A fall in sales (mg/PCU) of more than 5 % was observed in 19 of these countries (ranging from -7.7 % to -57.9 %), whilst there was an increase of more than 5 % in three countries during the reference period (ranging from 29.8 % to 42.9 %) (Table 8).
Among these 25 countries, a noticeable decrease in sales (mg/PCU) was identified for some of the highest-selling countries, which has had a significant impact on the overall sales reduction by 32.5 % observed during this period.
Sales of veterinary antimicrobial agents in 31 European countries in 2017Ninth ESVAC report12
The total sales of the AMEG Category 2 antimicrobials in these 25 countries showed a decreasing trend, which contributed to the overall decrease. Between 2011 and 2017, sales of 3rd- and 4th-generation cephalosporins decreased by 20.9 %, polymyxins decreased by 66.4 % and fluoroquinolones decreased by 10.3 % in those 25 countries that provided data during this period.
Variations between the 31 countries in reported sales (mg/PCU) and in sales patterns are likely to be partly due to differences in the occurrence of bacterial diseases, in the composition of the animal population and in production systems. Furthermore, there are considerable variations in terms of the daily doses used for the various antimicrobial agents and pharmaceutical forms, as well as in the duration of treatment. However, these factors can only partly explain the differences in the sales observed between the 31 countries; therefore, other factors must also be considered. Some countries have changed their national data collection systems over the years (e.g. Slovenia in 2013, Spain in 2014 and 2017 and Romania 2015) or have identified under-reporting for some of the years (e.g. Bulgaria 2014, Spain 2014), which may also have an impact on the data. Overall, this emphasises that data presented in this report should not be used for direct comparison between countries without considering the differences between them, and that changes observed over time for certain countries should be interpreted with caution.

Sales of veterinary antimicrobial agents in 31 European countries in 2017Ninth ESVAC report13
IntroductionTerms of reference from the European CommissionIn 2008, the Council of the European Union adopted the Council Conclusions on Antimicrobial Resistance (AMR)9, calling upon the European Commission (EC) and the Member States to strengthen surveillance systems and improve data quality on antimicrobial resistance and the consumption of antimicrobial agents within both the human and veterinary sectors. In response to the Council Conclusions, the EC requested the Agency to take the lead in the collection of data on sales of veterinary antimicrobial agents in the Member States. To guarantee an integrated approach, the EMA was requested to consult the ECDC, the EFSA and the EU Reference Laboratory for Antimicrobial Resistance (EURL-AR).
The European Surveillance of Veterinary Antimicrobial Consumption (ESVAC) project was launched in September 2009, following a request to develop an approach for the harmonised collection and reporting of data on the use of antimicrobial agents in animals in the Member States (SANCO/E2/KDS/rz D(2008) 520915). Through the EC terms of reference, the EMA was requested, among other activities:
• to identify the existing data/surveillance systems established for collection of sales and use of antibacterial drugs in the Member States;
• to develop a harmonised approach for the collection and reporting of data based on national sales figures, combined with estimations of usage in at least major groups of species;
• to collect the data from Member States and manage the database;
• to draft and publish a summary annual report presenting the data from Member States.
Regarding data collection:
• comparability with the sale/use of antimicrobials in humans should be ensured.
About ESVAC activityThrough the ESVAC exercise, data are collected on sales of antimicrobial VMPs at package level from the EU Member States, EEA countries and Switzerland. Furthermore, in 2016, ESVAC established defined daily doses for animals (DDDvet) and defined course doses for animals (DCDvet) (EMA/224954/201610). To prepare for the collection of data by animal species, in 2018, ESVAC published guidance on the collection of harmonised and standardised data from Member States on the use of antimicrobials by species11. The ESVAC Vision and Strategy 2016-2020, published on the EMA’s website, details the intended future development of ESVAC activity12.
The organisation of the ESVAC project is illustrated in Figure 1.
The core of the ESVAC activity related to the collection of sales data is the ESVAC network of main NCs and alternates, nominated by the national competent authorities in the participating countries. Country and affiliation of the ESVAC main NCs and alternates can be found in Annex 8 of this report. The tasks of the ESVAC main NCs are: to provide sales data to the ESVAC team at the EMA in response to annual data calls; to revise the data in terms of quality and validity, following requests from the ESVAC team; to validate the data applied to calculate the PCU; and to provide comments on the annual ESVAC report.
9 http://www.consilium.europa.eu/ueDocs/cms_Data/docs/pressData/en/lsa/101035.pdf10 Available on the EMA website (www.ema.europa.eu) via: Home > Veterinary regulatory > Antimicrobial resistance > European
Surveillance of Veterinary Antimicrobial Consumption > Units of measurement 11 Available on the EMA website (www.ema.europa.eu) via Home > Veterinary regulatory > Antimicrobial resistance > European
Surveillance of Veterinary Antimicrobial Consumption (ESVAC) > Reporting data by animal species: http://www.ema.europa.eu/ema/doc_index.jsp?curl=pages/includes/document/document_detail.jsp?webContentId=WC500224492&murl=menus/document_library/document_library.jsp&mid=0b01ac058009a3dc
12 Available on the EMA website (www.ema.europa.eu) via: Home > Veterinary regulatory > Antimicrobial resistance > European Surveillance of Veterinary Antimicrobial Consumption (http://www.ema.europa.eu/docs/en_GB/document_library/Regulatory_and_procedural_guideline/2016/04/WC500204522.pdf)
Sales of veterinary antimicrobial agents in 31 European countries in 2017Ninth ESVAC report14
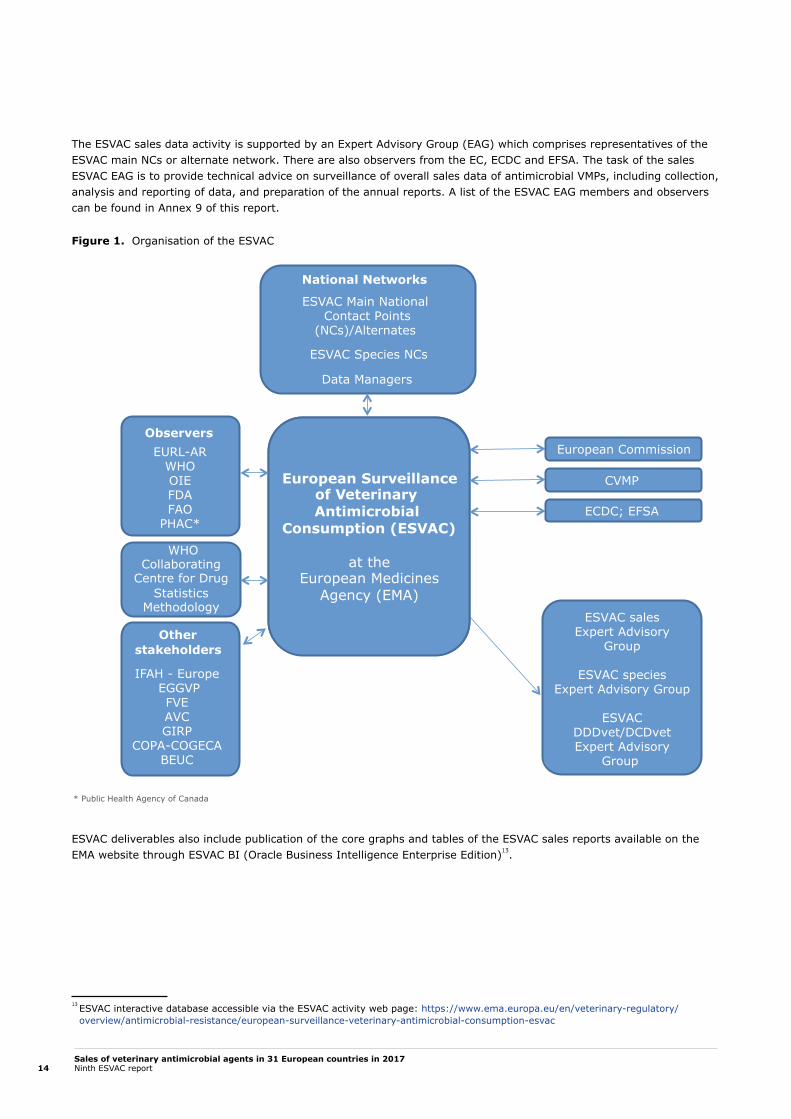
The ESVAC sales data activity is supported by an Expert Advisory Group (EAG) which comprises representatives of the ESVAC main NCs or alternate network. There are also observers from the EC, ECDC and EFSA. The task of the sales ESVAC EAG is to provide technical advice on surveillance of overall sales data of antimicrobial VMPs, including collection, analysis and reporting of data, and preparation of the annual reports. A list of the ESVAC EAG members and observers can be found in Annex 9 of this report.
Figure 1. Organisation of the ESVAC
ESVAC deliverables also include publication of the core graphs and tables of the ESVAC sales reports available on the EMA website through ESVAC BI (Oracle Business Intelligence Enterprise Edition)13.
13 ESVAC interactive database accessible via the ESVAC activity web page: https://www.ema.europa.eu/en/veterinary-regulatory/overview/antimicrobial-resistance/european-surveillance-veterinary-antimicrobial-consumption-esvac
National Networks ESVAC Main National
Contact Points(NCs)/Alternates
ESVAC Species NCs
Data Managers
ESVAC salesExpert Advisory
Group
ESVAC speciesExpert Advisory Group
ESVACDDDvet/DCDvetExpert Advisory
Group
European Surveillance of Veterinary Antimicrobial
Consumption (ESVAC)
at the European Medicines
Agency (EMA)
WHO Collaborating
Centre for Drug Statistics
Methodology
Other stakeholders
IFAH - Europe EGGVP
FVEAVCGIRP
COPA-COGECABEUC
Observers EURL-AR
WHOOIEFDAFAO
PHAC*
European Commission
CVMP
ECDC; EFSA
* Public Health Agency of Canada
Sales of veterinary antimicrobial agents in 31 European countries in 2017Ninth ESVAC report15
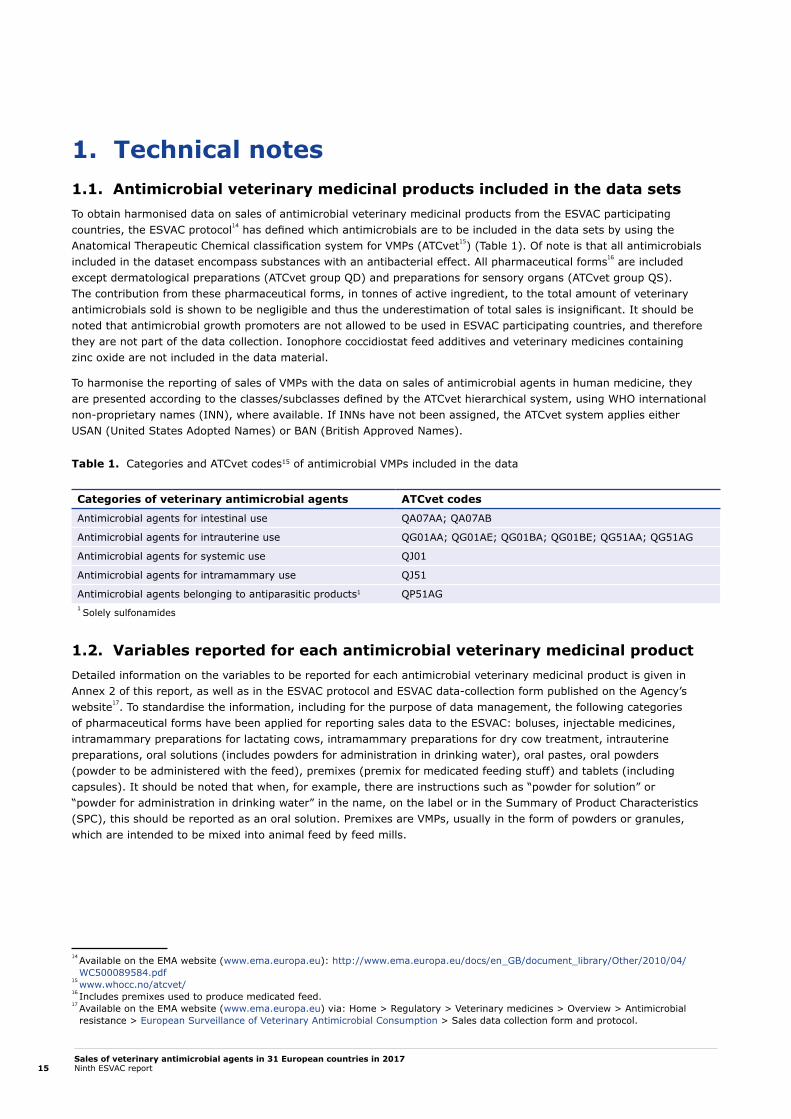
1. Technical notes1.1. Antimicrobial veterinary medicinal products included in the data setsTo obtain harmonised data on sales of antimicrobial veterinary medicinal products from the ESVAC participating countries, the ESVAC protocol14 has defined which antimicrobials are to be included in the data sets by using the Anatomical Therapeutic Chemical classification system for VMPs (ATCvet15) (Table 1). Of note is that all antimicrobials included in the dataset encompass substances with an antibacterial effect. All pharmaceutical forms16 are included except dermatological preparations (ATCvet group QD) and preparations for sensory organs (ATCvet group QS). The contribution from these pharmaceutical forms, in tonnes of active ingredient, to the total amount of veterinary antimicrobials sold is shown to be negligible and thus the underestimation of total sales is insignificant. It should be noted that antimicrobial growth promoters are not allowed to be used in ESVAC participating countries, and therefore they are not part of the data collection. Ionophore coccidiostat feed additives and veterinary medicines containing zinc oxide are not included in the data material.
To harmonise the reporting of sales of VMPs with the data on sales of antimicrobial agents in human medicine, they are presented according to the classes/subclasses defined by the ATCvet hierarchical system, using WHO international non-proprietary names (INN), where available. If INNs have not been assigned, the ATCvet system applies either USAN (United States Adopted Names) or BAN (British Approved Names).
Table 1. Categories and ATCvet codes15 of antimicrobial VMPs included in the data
1.2. Variables reported for each antimicrobial veterinary medicinal productDetailed information on the variables to be reported for each antimicrobial veterinary medicinal product is given in Annex 2 of this report, as well as in the ESVAC protocol and ESVAC data-collection form published on the Agency’s website17. To standardise the information, including for the purpose of data management, the following categories of pharmaceutical forms have been applied for reporting sales data to the ESVAC: boluses, injectable medicines, intramammary preparations for lactating cows, intramammary preparations for dry cow treatment, intrauterine preparations, oral solutions (includes powders for administration in drinking water), oral pastes, oral powders (powder to be administered with the feed), premixes (premix for medicated feeding stuff) and tablets (including capsules). It should be noted that when, for example, there are instructions such as “powder for solution” or “powder for administration in drinking water” in the name, on the label or in the Summary of Product Characteristics (SPC), this should be reported as an oral solution. Premixes are VMPs, usually in the form of powders or granules, which are intended to be mixed into animal feed by feed mills.
14 Available on the EMA website (www.ema.europa.eu): http://www.ema.europa.eu/docs/en_GB/document_library/Other/2010/04/WC500089584.pdf
15 www.whocc.no/atcvet/ 16 Includes premixes used to produce medicated feed.17 Available on the EMA website (www.ema.europa.eu) via: Home > Regulatory > Veterinary medicines > Overview > Antimicrobial
resistance > European Surveillance of Veterinary Antimicrobial Consumption > Sales data collection form and protocol.
Categories of veterinary antimicrobial agents ATCvet codes
Antimicrobial agents for intestinal use QA07AA; QA07AB
Antimicrobial agents for intrauterine use QG01AA; QG01AE; QG01BA; QG01BE; QG51AA; QG51AG
Antimicrobial agents for systemic use QJ01
Antimicrobial agents for intramammary use QJ51
Antimicrobial agents belonging to antiparasitic products1 QP51AG1 Solely sulfonamides

Sales of veterinary antimicrobial agents in 31 European countries in 2017Ninth ESVAC report16
1.3. Collection and calculation of sales dataThe ESVAC participating countries provided the number of packages sold for each product presentation – i.e. name of VMP, pharmaceutical form, strength and pack size. Data were directly uploaded into the ESVAC database by the reporting countries using a web-based application. The sales (in weight of active substance) for each product presentation were calculated by multiplying the number of packages sold by the amount of active ingredient (strength) in each package; for combination preparations, the amount sold is calculated for all ingredients. Tonnes sold for each product presentation were automatically calculated in a standardised and harmonised manner. This implies application of standard conversion factors to calculate from international units (IU) to mg when the strength was given in IU (Table A11) and when prodrug standard conversion factors are used to convert to mg active ingredient (Table A12). For combination preparations, the amount sold was calculated for each ingredient separately.
1.4. Denominator: population correction unit (PCU)The amounts of veterinary antimicrobial agents sold in the different countries are normalised by the animal population at risk of being treated with antimicrobials in each country. The PCU has been established as a denominator for the sales data. The data sources used and the methodology for the calculation of the PCU are comprehensively described in Appendix 2 of the Agency’s report ‘Trends in the sales of veterinary antimicrobial agents in nine European countries: 2005-2009’ (EMA/238630/2011)18. Animal categories included in the calculation of the PCU and the weights used to calculate the PCU are described in Annex 3 of this report. It must be emphasised that the PCU is purely a surrogate for the animal population at risk.
1.4.1. Calculation of PCUThe PCU for each animal category is calculated by multiplying numbers of livestock animals (dairy cows, sheep, sows and horses) and slaughtered animals (cattle, goats, pigs, sheep, poultry, rabbits and turkeys) by the theoretical weight at the most likely time for treatment. However, due to the limited availability of living goat data in Eurostat, this category was not included when the PCU methodology was established for the first ESVAC report19. For countries with a relatively high number of goats compared to other food-producing animals, this results in an underestimation of the PCU. For animals exported or imported for fattening or slaughter (cattle, goats, pigs, sheep and poultry), the PCU was calculated by multiplying the number of animals by a standardised weight.
For farmed fish, Eurostat data are given only as live-weight slaughtered rather than numbers slaughtered; thus, for fish biomass, live-weight slaughtered is used to calculate the total PCU. The PCU of the animals exported for fattening or slaughter to another Member State – i.e. cattle, pigs, poultry, goats and sheep – was added to the PCU of livestock and slaughter animals in the country of origin because young animals are typically treated more frequently than other age classes. The PCU for animals imported for fattening or slaughter from another Member State was subtracted from the total PCU of livestock and slaughter animals of the importing country, to avoid double counting (counting by both the exporting and importing country) and since it is included in the data on slaughter animals (Eurostat data).
The PCU is calculated for each species, weight class and/or production type, as follows:
PCU domestic
• Number of animals slaughtered × estimated weight at treatment
• Number of livestock × estimated weight at treatment
PCU export
• Number of animals transported to another country for fattening or slaughter × estimated weight at treatment
PCU import
• Number of animals imported from another country for fattening or slaughter × estimated weight at treatment
Total PCU is calculated as follows: PCU = total PCUDomestic + total PCUExport – total PCUImport
The total PCU by country is calculated according to the above data.
1 PCU = 1 kg of animal biomass.
18 Available on the EMA website (www.ema.europa.eu) via: Home > Veterinary regulatory > Overview > Antimicrobial resistance > European Surveillance of Veterinary Antimicrobial Consumption
19 Trends in the sale of veterinary antimicrobial agents in nine European countries (http://www.ema.europa.eu/docs/en_GB/document_library/Report/2011/09/WC500112309.pdf)

Sales of veterinary antimicrobial agents in 31 European countries in 2017Ninth ESVAC report17
1.4.2. Animal species and categories included in the PCU; selection of data sourcesEurostat, the Statistical Office of the EU, covers data on numbers of food-producing animals slaughtered, as well as numbers of livestock animals. Therefore, the Eurostat database20 was selected as the source for these data. If data were not available via Eurostat (e.g. for rabbits and fish), national statistics were applied. In addition, national statistics on animal categories were applied for non-EU countries: Iceland, Norway and Switzerland, as data for these countries are not available from Eurostat. For horses (food-producing species according to EU legislation), national statistics provided by the ESVAC NCs were used. Data on dogs and cats are not available in all participating countries. Therefore, these species were not included in the PCU in order to have comparable data. As tablets are typically approved only for companion animals, they were excluded from the data sets prior to the normalisation of sales by PCU.
The Eurostat data on numbers of cattle, pigs, poultry, sheep and goats exported or imported for fattening or slaughter might not be complete, as exports and imports are only reported above a certain amount. Therefore, data were obtained from TRACES (TRAde Control and Expert System run by the EC’s DG SANTE), as these are based on health certificates, which are obligatory for all animals crossing any border, and thus the data are complete.
In cases where the deviation between the Eurostat data and/or TRACES data and national statistics was more than 5 %, countries could provide national statistics for calculating the PCU.
1.5. Correction of historical dataNote that subsequent to the correction of historical data, the updated values were published in the ESVAC Interactive Database as soon as they had been validated and approved by Member States.
1.5.1. Sales dataRevisions were made to the 2016 sales data for two countries. The United Kingdom identified one Marketing Authorisation Holder had over-reported the number of packages for several VMPs reported for 2016. Other updates to the United Kingdom database have also resulted in minor changes to the calculation of total tonnes and mg/PCU for 2014 and 2015. Iceland identified inconsistencies in strength reported for a minor number of presentations for 2010-2016 datasets. The above-mentioned updates are included in the ESVAC database and in the results of this report.
1.5.2. PCU dataUpdates were made to the PCU data, compared to the values used for the ESVAC 2016 report. For Croatia, the data for biomass of fish produced were revised for 2014, 2015 and 2016. For Switzerland, the data on slaughtered turkeys were updated for previous years, i.e. 2014-2016. While, the difference in mg/PCU following the updates was apparent, it was not extensive.
1.6. Quality check and validation of the sales and PCU dataThe countries participating in ESVAC upload sales data directly using a web-based submission tool (ESVAC web application) designed for data collection. To ensure the consistency of variables submitted automated warning and error messages are displayed instantaneously when any of the figures uploaded do not meet standardisation requirements. When data are uploaded, various summary reports can be created using the ESVAC BI application and can be used for validation. Each country is responsible for the quality of the sales delivered to the ESVAC. The ESVAC secretariat assists with data validation, including the identification of outliers, mainly by comparison with available data from previous years. Possible outliers are cross-checked and addressed with each ESVAC NC until final agreement is reached.
Development of suitable quality control measures, including assessment of data coverage and accuracy, are defined and set up by each country individually, taking into account the distinctive aspects of each country’s data collection.
Reference data for the denominator (PCU) gathered by the Agency from the Eurostat database and TRACES are uploaded into the ESVAC web application. The data are subsequently validated by ESVAC participating countries. To ensure data quality and validity, the PCU data are displayed in the ESVAC BI reports in a way that allows for comparison with values per animal category and the overall PCU approved for previous years. Possible outliers are cross-checked and addressed with each ESVAC NC until final agreement is reached.
20 https://ec.europa.eu/eurostat/data/database

Sales of veterinary antimicrobial agents in 31 European countries in 2017Ninth ESVAC report18
1.7. Analysis and reporting of the dataBased on the assumption that tablets are almost solely used for companion animals (boluses in food-producing animals), tablets are excluded from the dataset used to report sales for food-producing animals. All other pharmaceutical forms except tablets are reported as sold for use in food-producing animals, including horses. Of note is that some of the sales allocated to food-producing animals could be for non-food-producing animals such as fur animals. In the current report, the term ‘group treatment’ is used for medication given via feed or water; intramammary preparations for lactating cows and for dry cow treatment are reported aggregated.
The main indicator applied in this report to express the consumption of veterinary antimicrobials is mg of active ingredient normalised by the population correction unit (mg/PCU):
Amount sold in tonnes × 10^9
PCU in kg
In this report, the term food-producing species includes horses. The data are presented according to the classes or subclasses defined in the ATCvet hierarchical system. For combination preparations, sales of each active ingredient are reported according to the ATCvet class or subclass name for each single substance in question. Maps of the spatial consumption of the various veterinary antimicrobial agents were created using Adobe Illustrator CC 2015.
It should be noted that data presented in this report are calculated using the exact sales figures for each product (five decimals), but in the tables and graphs the numbers are aggregated and rounded. Therefore, the total sales of tables, for example, may differ slightly from the more detailed data presented in this report.
All data presented in this report reflect the datasets available on 29 August 2019; any updates made to the data at a later stage are not included in the data analyses.
Data on sales, including tablets used for treatment of companion animals, are available in the ESVAC Interactive Database.
1.8. Summary of included data sources/types, by countryInformation concerning the years of collecting data, legal basis for the data collection at national level, systems for distribution of antimicrobial VMPs, sources from which the data were obtained, type of data, and the data included by country are shown in Table 2.

Sales of veterinary antimicrobial agents in 31 European countries in 2017Ninth ESVAC report19
Tab
le 2
. S
umm
ary
of in
form
atio
n on
yea
rs o
f co
llect
ing
data
, le
gal b
asis
for
col
lect
ing
data
at
natio
nal l
evel
, na
tiona
l dat
a pr
ovid
ers,
sou
rces
for
ESVA
C d
ata
and
char
acte
rist
ics
of d
ata,
by
coun
try,
for
201
7
Cou
ntr
yY
ears
co
llect
ing
d
ata
Leg
al b
asis
Nat
ion
al d
ata
pro
vid
er t
o ES
VA
CS
ourc
es f
or
ESV
AC
dat
a (a
pp
rox.
n
um
ber
)
Sal
es d
ata,
p
resc
rip
tion
dat
a or
p
urc
has
e d
ata1
Sal
es b
etw
een
w
hol
esal
ers
and
/or
MA
Hs2
ex
clu
ded
(Y
es/
No)
Pro
du
cts
sold
on
sp
ecia
l lic
ence
in
clu
ded
(Y
es/
No)
Aus
tria
>5
year
sM
anda
tory
to
repo
rtAus
tria
n Age
ncy
for
Hea
lth a
nd F
ood
Saf
ety
MAH
s (n
=9)
;W
hole
sale
rs
(n=
10)
Sal
es t
o ph
arm
acie
sYe
sN
o
Bel
gium
>5
year
sM
anda
tory
to
repo
rtFe
dera
l Age
ncy
for
Med
icin
es a
nd H
ealth
Pr
oduc
ts
Who
lesa
lers
(n
=23
);Fe
ed m
ills
(n=
51)
Sal
es t
o ve
terina
rian
s an
d ph
arm
acie
s; S
ales
by
fee
d m
ills
to f
arm
ers
Yes
Yes
Bul
garia
>5
year
sN
ot m
anda
tory
Bul
garian
Foo
d Saf
ety
Age
ncy
Who
lesa
lers
(n
=36
)Sal
es t
o ve
terina
rian
s,
farm
ers
and
ph
arm
acie
s
Yes
No
Cro
atia
4 ye
ars
Man
dato
ry t
o re
port
Min
istr
y of
Agr
icul
ture
, Ve
terina
ry D
irec
tora
teW
hole
sale
rs
(n=
16)
Sal
es t
o ph
arm
acie
s an
d ve
terina
rian
sYe
sN
o
Cyp
rus
>5
year
sM
anda
tory
to
repo
rt
Min
istr
y of
Agr
icul
ture
, N
atur
al R
esou
rces
and
En
viro
nmen
t –
Ve
terin
ary
Serv
ices
Who
lesa
lers
(n
=23
);Fe
ed m
ills
(n=
29)
Sal
es t
o ve
terina
rian
s,
phar
mac
ies
and
farm
ers
Yes
Yes
(15
%)
Cze
chia
>5
year
sM
anda
tory
to
repo
rtIn
stitu
te for
Sta
te C
ontr
ol
of V
eter
inar
y Bio
logi
cals
an
d M
edic
ines
Who
lesa
lers
(n
=95
);Fe
ed m
ills
(n=
38)
Sal
es t
o ve
terina
rian
s,
phar
mac
ies
and
fa
rmer
s; S
ales
by
feed
m
ills
to f
arm
ers
Yes
Yes
(<0.
1 %
)
Den
mar
k>
5 ye
ars
Man
dato
ry t
o re
port
Dan
ish
Vete
rina
ry a
nd
Food
Adm
inis
trat
ion
VetS
tat
(n=
1)
obta
inin
g da
ta
from
pha
rmac
ies
(n=
523)
, ve
terina
-rian
s (n
=15
0),
feed
m
ills
(n=
3)
Pres
crip
tions
dat
a
from
pha
rmac
ies,
ve
terin
aria
ns, d
istr
ibut
ors
and
feed
mill
s
Yes
Yes
(0.1
%)
Esto
nia
>5
year
s M
anda
tory
to
repo
rtSta
te A
genc
y of
M
edic
ines
Who
lesa
lers
(n=
7)Sal
es t
o ve
terina
rian
s an
d ph
arm
acie
sYe
sYe
s
Finl
and
>5
year
sM
anda
tory
to
repo
rtFi
nnis
h M
edic
ines
Age
ncy
Who
lesa
lers
(n=
1);
Feed
mill
s (n
=1)
;Im
port
ers
of m
edi-
cate
d fe
ed (
n=1)
Sal
es t
o ph
arm
acie
s an
d ve
terina
rian
sYe
sYe
s
Fran
ce>
5 ye
ars
Man
dato
ry t
o re
port
Nat
iona
l Age
ncy
for
Vete
-rina
ry M
edic
inal
Pro
duct
s (A
nses
-AN
MV)
MAH
s (n
=52
)Sal
es t
o ve
terina
rian
s,
phar
mac
ies,
who
lesa
-le
rs a
nd f
eed
mill
s
Yes
No

Sales of veterinary antimicrobial agents in 31 European countries in 2017Ninth ESVAC report20
Cou
ntr
yY
ears
co
llect
ing
d
ata
Leg
al b
asis
Nat
ion
al d
ata
pro
vid
er t
o ES
VA
CS
ourc
es f
or
ESV
AC
dat
a (a
pp
rox.
n
um
ber
)
Sal
es d
ata,
p
resc
rip
tion
dat
a or
p
urc
has
e d
ata1
Sal
es b
etw
een
w
hol
esal
ers
and
/or
MA
Hs2
ex
clu
ded
(Y
es/
No)
Pro
du
cts
sold
on
sp
ecia
l lic
ence
in
clu
ded
(Y
es/
No)
Ger
man
y>
5 ye
ars
Man
dato
ry t
o re
port
Fede
ral O
ffice
of
Con
sum
er P
rote
ctio
n an
d Fo
od S
afet
y
MAH
s (n
=30
);W
hole
sale
rs
(n=
15);
PSU
Rs3
dat
a fo
r pr
emix
Sal
es t
o ve
terina
rian
sYe
sN
o
Gre
ece
3 ye
ars
Man
dato
ry t
o re
port
Gre
ek N
atio
nal
Org
anis
atio
n fo
r M
edic
ines
MAH
s (n
=81
)4Sal
es t
o ph
arm
acie
s an
d ve
terina
rian
sYe
sN
o
Hun
gary
>5
year
sN
ot m
anda
tory
Nat
iona
l Foo
d Cha
in
Safe
ty O
ffice
Direc
tora
te o
f Ve
terina
ry
Med
icin
al P
rodu
cts
Who
lesa
lers
(n
=34
)Sal
es t
o ve
terina
rian
s,
feed
mill
s, f
arm
ers
and
reta
ilers
Yes
No
Icel
and
>5
year
s M
anda
tory
to
repo
rtIc
elan
dic
Med
icin
es
Age
ncy
Who
lesa
lers
(n=
2)Sal
es b
y w
hole
sale
rs
to v
eter
inar
ians
and
ph
arm
acie
s
Yes
Yes
Irel
and
>5
year
sM
anda
tory
to
repo
rtH
ealth
Pro
duct
s Re
gula
tory
Aut
hority
MAH
s (n
=68
)Sal
es t
o ph
arm
acie
s,
vete
rina
rian
s, f
arm
ers
and
who
lesa
lers
with
in
the
coun
try
Yes
No
Ital
y>
5 ye
ars
Man
dato
ry t
o re
port
Ital
ian
Min
istr
y of
Hea
lthM
AH
s (n
=47
)Sal
es t
o w
hole
sale
rs,
phar
mac
ies,
fee
d m
ills,
an
d fa
rms
auth
oris
ed t
o pr
oduc
e m
edic
ated
fee
d fo
r se
lf-co
nsum
ptio
n
Yes
No
Latv
ia>
5 ye
ars
Man
dato
ry t
o re
port
Food
and
Vet
erin
ary
Ser
vice
Who
lesa
lers
(n
=23
)Sal
es t
o ph
arm
acie
s,
vete
rina
rian
s, v
eter
ina-
ry c
linic
s an
d fa
rmer
s
Yes
No
Lith
uani
a>
5 ye
ars
Man
dato
ry t
o re
port
Sta
te F
ood
and
Vete
rina
ry S
ervi
ceW
hole
sale
rs
(n=
46)
Sal
es t
o ph
arm
acie
s,
vete
rina
rian
s an
d fa
rmer
s
Yes
No
Luxe
mbo
urg
>5
year
sM
anda
tory
to
repo
rtM
inis
try
of H
ealth
Who
lesa
lers
(n=
3)Sal
es t
o ph
arm
acie
s,
vete
rina
rian
sYe
sN
o
Mal
ta1
year
Not
man
dato
ryM
inis
try
for
the
En
viro
nmen
t, S
usta
inab
le
Dev
elop
men
t an
d Clim
ate
Cha
nge
Who
lesa
lers
(n
=14
)Sal
es d
ata
to p
har-
mac
ies
and
vete
rina
ry
clin
ics
Yes
Yes

Sales of veterinary antimicrobial agents in 31 European countries in 2017Ninth ESVAC report21
Cou
ntr
yY
ears
co
llect
ing
d
ata
Leg
al b
asis
Nat
ion
al d
ata
pro
vid
er t
o ES
VA
CS
ourc
es f
or
ESV
AC
dat
a (a
pp
rox.
n
um
ber
)
Sal
es d
ata,
p
resc
rip
tion
dat
a or
p
urc
has
e d
ata1
Sal
es b
etw
een
w
hol
esal
ers
and
/or
MA
Hs2
ex
clu
ded
(Y
es/
No)
Pro
du
cts
sold
on
sp
ecia
l lic
ence
in
clu
ded
(Y
es/
No)
Net
herlan
ds>
5 ye
ars
Not
man
dato
ryFe
dera
tion
of t
he D
utch
Ve
terina
ry P
harm
aceu
tical
In
dust
ry (
FID
IN)
MAH
s (n
=17
)Sal
es t
o w
hole
sale
rs
and
vete
rina
rian
s Ye
sN
o
Nor
way
>5
year
sM
anda
tory
to
repo
rtN
orw
egia
n Ve
terina
ry
Inst
itute
Who
lesa
lers
(n=
5)Fe
ed m
ills
(n=
2)Sa
les
to p
harm
acie
s, v
e-te
rinar
ians
and
pre
scrip
-tio
ns b
y fe
ed m
ills
(fee
d m
ills
deliv
er V
MPs
onl
y)
to fi
sh fa
rmer
s
Yes
Yes
(0.7
%)
Pola
nd>
5 ye
ars
Man
dato
ry t
o re
port
Min
istr
y of
Agr
icul
ture
an
d Rur
al D
evel
opm
ent
Who
lesa
lers
(n
=12
5)Sal
es t
o ve
terina
rian
sYe
sN
o
Port
ugal
>5
year
sM
anda
tory
to
repo
rt
Gen
eral
Direc
tora
te f
or
Food
and
Vet
erin
ary
Aff
airs
Who
lesa
lers
(n
=69
)5Sal
es t
o re
taile
rs,
ve
terina
rian
s,
farm
ers,
pro
duce
r or
-ga
nisa
tions
, ve
terina
ry
clin
ics
and
feed
mill
s
Yes
No
Rom
ania
4 ye
ars
Man
dato
ry t
o re
port
Inst
itute
for
Con
trol
of
Bio
logi
cal P
rodu
cts
and
Vete
rina
ry M
edic
ines
MAH
s (n
=70
)6Sal
es t
o ph
arm
acie
s,
vete
rina
rian
s an
d fa
rmer
s
Yes
No
Slo
vaki
a>
5 ye
ars
Man
dato
ry t
o re
port
Inst
itute
for
Sta
te C
ontr
ol
of V
eter
inar
y Bio
logi
cals
an
d M
edic
amen
ts
Who
lesa
lers
(n
=46
)Sal
es t
o ve
terina
rian
s,
phar
mac
ies,
med
icat
ed
feed
mill
s an
d fa
rmer
s
Yes
No
Slo
veni
a>
5 ye
ars
Man
dato
ry t
o re
port
Adm
inis
trat
ion
of t
he
Repu
blic
of
Slo
veni
a fo
r Fo
od S
afet
y, V
eter
inar
y Sec
tor
and
Plan
t
Prot
ectio
n (A
FSVSPP
)
Who
lesa
lers
(n
=11
)Sal
es t
o ph
arm
acie
s,
feed
mill
s an
d
vete
rina
rian
s
Yes
Yes
(7 %
)
Spa
in>
5 ye
ars
Not
man
dato
rySpa
nish
Age
ncy
for
Med
icin
es a
nd H
ealth
Pr
oduc
ts
Reta
ilers
(n=
869)
7Sal
es t
o ve
terina
rian
s an
d ve
terina
ry
orga
nisa
tions
Yes
No

Sales of veterinary antimicrobial agents in 31 European countries in 2017Ninth ESVAC report22
Cou
ntr
yY
ears
co
llect
ing
d
ata
Leg
al b
asis
Nat
ion
al d
ata
pro
vid
er t
o ES
VA
CS
ourc
es f
or
ESV
AC
dat
a (a
pp
rox.
n
um
ber
)
Sal
es d
ata,
p
resc
rip
tion
dat
a or
p
urc
has
e d
ata1
Sal
es b
etw
een
w
hol
esal
ers
and
/or
MA
Hs2
ex
clu
ded
(Y
es/
No)
Pro
du
cts
sold
on
sp
ecia
l lic
ence
in
clu
ded
(Y
es/
No)
Swed
en>
5 ye
ars
Man
dato
ry t
o re
port
Nat
iona
l Vet
erin
ary
Ins-
titut
e an
d Sw
edis
h Boa
rd
of A
gric
ultu
re
The
Swed
ish
eHea
lth A
genc
y (n
=1)
obt
aini
ng
data
fro
m
phar
mac
ies
Dis
pens
ed
pres
crip
tions
Yes
Yes
Switz
erla
nd>
5 ye
ars
Man
dato
ry t
o re
port
Fede
ral F
ood
Saf
ety
and
Vete
rina
ry O
ffice
M
AH
s (n
=16
)Sal
es t
o ve
terina
rian
s,
phar
mac
ies,
m
edic
ated
fee
d m
ills
No
No
Uni
ted
Kin
gdom
>5
year
sM
anda
tory
to
repo
rtVe
terina
ry M
edic
ines
D
irec
tora
teM
AH
s (n
=57
)Sal
es t
o w
hole
sale
rs,
vete
rina
rian
s, f
arm
ers
and
vete
rina
ry
phar
mac
ies
Yes
No
1 Pu
rcha
se/i
mpo
rt d
ata
from
e.g
. ph
arm
aceu
tical
indu
stry
and
/or
from
who
lesa
lers
in o
ther
cou
ntries
. 2
MAH
s =
mar
ketin
g au
thor
isat
ion
hold
ers.
3
PSU
Rs
= p
erio
dic
safe
ty u
pdat
e re
port
s.
4 N
eglig
ible
sal
es f
rom
a f
ew M
AH
s w
ith a
ver
y sm
all m
arke
t sh
are,
and
whi
ch d
o no
t ha
ve lo
cal i
n G
reec
e, a
re n
ot in
clud
ed in
the
dat
aset
.5
Sal
es o
f pr
emix
es c
an r
epre
sent
und
er r
epor
ting
in 2
017
sale
s da
tase
t su
bmitt
ed for
Por
tuga
l.6
Sin
ce 2
015,
dat
a ha
ve b
een
colle
cted
fro
m M
AH
s, w
hile
for
201
4 th
e da
ta w
ere
obta
ined
fro
m M
AH
s an
d w
hole
sale
rs.
7 Sin
ce 2
017
data
hav
e be
en c
olle
cted
fro
m r
etai
lers
.

Sales of veterinary antimicrobial agents in 31 European countries in 2017Ninth ESVAC report23
2. Results2.1. Overall sales (tonnes) of antimicrobial agents for veterinary useThe overall national sales data cover sales of antimicrobial VMPs for use in food-producing animals, including horses, plus sales of tablets that are used almost solely in companion animals. Injectable veterinary antimicrobial agents are also used in companion animals. As injectable presentations are frequently marketed for both food-producing and companion animals and their use in companion animals is minor in terms of weight of active ingredient, such sales are included in the statistics for food-producing animals. Sales of tablets, and therefore use in companion animals, accounted for a minor proportion of the total sales of antimicrobial veterinary medicinal products in 2017, except in Finland, Iceland, Luxembourg, Malta, Norway, Slovenia, Sweden and the United Kingdom, where they represented 11.0 %, 7.1 %, 4.9 %, 12.1 %, 7.3 %, 6.1 %, 7.7 % and 5.8 % of the total sales, respectively (Table 3). Overall, sales of tablets in the 31 countries represented 1.0 % of the total sales in tonnes.
Table 3. Overall sales, in tonnes of active ingredient, split by tablets (used mainly in companion animals) and all other pharmaceutical forms (used mainly in food-producing animals), by country, in 2017
Country Tablets, tonnes Tablets, %
All other forms, tonnes
% of other forms Total tonnes
Austria 0.6 1.4 % 44.6 98.6 % 45.2Belgium 1.9 0.8 % 221.0 99.2 % 222.8Bulgaria 0.2 0.3 % 49.6 99.7 % 49.7Croatia 0.1 0.5 % 21.1 99.5 % 21.2Cyprus 0.05 0.1 % 45.4 99.9 % 45.5Czechia 1.0 2.3 % 44.1 97.7 % 45.1Denmark 0.8 0.9 % 94.4 99.1 % 95.2Estonia 0.1 2.1 % 6.3 97.9 % 6.4Finland 1.2 11.0 % 9.8 89.0 % 11.0France 15.2 3.0 % 482.9 97.0 % 498.1Germany 8.6 1.1 % 766.6 98.9 % 775.2Greece 0.1 0.1 % 116.7 99.9 % 116.8Hungary 0.3 0.2 % 147.2 99.8 % 147.5Iceland 0.04 7.1 % 0.6 92.9 % 0,6Ireland 1.2 1.2 % 98.5 98.8 % 99.7Italy 9.9 0.9 % 1,057.8 99.1 % 1,067.7Latvia 0.1 1.7 % 5.9 98.3 % 6.0Lithuania 0.1 0.8 % 11.6 99.2 % 11.7Luxembourg 0.1 4.9 % 1.9 95.1 % 2.0Malta 0.2 12.1 % 1.8 87.9 % 2.0Netherlands 2.8 1.5 % 188.0 98.5 % 190.9Norway 0.5 7.3 % 5.7 92.7 % 6.2Poland 1.9 0.3 % 749.6 99.7 % 751.6Portugal 0.8 0,6 % 135.1 99.4 % 135.9
Romania 3.3 1.2 % 262.9 98.8 % 266.1Slovakia 0.2 1.7 % 13.9 98.3 % 14.1Slovenia 0.4 6.1 % 6.7 93.9 % 7.2Spain 0.9 0.1 % 1,769.5 99.9 % 1,770.4Sweden 0.8 7.7 % 9.5 92.3 % 10.3Switzerland 0.7 2.2 % 31.9 97.8 % 32.6United Kingdom 14.3 5.8 % 233.9 94.2 % 248.2Total 31 countries 68.6 1.0 % 6,634.4 99.0 % 6,703.0

Sales of veterinary antimicrobial agents in 31 European countries in 2017Ninth ESVAC report24
2.2. Population-adjusted sales for food-producing animals, including horses, by antimicrobial classThe sales of veterinary antimicrobial agents, expressed as mg sold per population correction unit (PCU), ranged from 3.1 mg/PCU to 423.1 mg/PCU across the 31 countries (Table 4). The sales patterns of the antimicrobial classes also varied substantially between the countries (Table 5).
Table 4. Sales, in tonnes of active ingredient, of veterinary antimicrobial agents marketed mainly for food-producing animals1, PCU and sales in mg/PCU, by country, for 2017
Country Sales (tonnes) for food-producing animals
PCU (1,000 Tonnes) Sales in mg/PCU
Austria 44.6 953.9 46.8
Belgium 221.0 1,683.1 131.3
Bulgaria 49.6 374.7 132.3
Croatia 21.1 295.6 71.5
Cyprus 45.4 107.4 423.1
Czechia 44.1 693.1 63.6
Denmark 94.4 2,397.6 39.4
Estonia 6.3 110.9 56.7
Finland 9.8 507.5 19.3
France 482.9 7,038.6 68.6
Germany 766.6 8,608.8 89.0
Greece 116.7 1,242.8 93.9
Hungary 147.2 770.9 191.0
Iceland 0.6 125.1 4.6
Ireland 98.5 2,114.1 46.6
Italy 1,057.8 3,863.8 273.8
Latvia 5.9 176.3 33.3
Lithuania 11.6 333.0 34.8
Luxembourg 1.9 54.7 35.0
Malta 1.8 14.6 121.0
Netherlands 188.0 3,340.7 56.3
Norway 5.7 1,861.2 3.1
Poland 749.6 4,539.0 165.2
Portugal 135.1 1,002.1 134.8
Romania 262.9 2,916.2 90.1
Slovakia 13.9 224.7 61.9
Slovenia 6.7 183.9 36.5
Spain 1,769.5 7,684.5 230.3
Sweden 9.5 804.1 11.8
Switzerland 31.9 795.9 40.1
United Kingdom 233.9 7,202.1 32.5
Total 31 countries 6,634.4 62,020.7 107.0*
1 Tablets excluded as used almost solely in companion animals; injectable antimicrobial VMPs can also be used in companion animals; a few other products may solely be used in companion animals, but as their proportional use is minor, these are included in the sales for food-producing animals.* Total mg/PCU for 31 countries represents aggregated sales (tonnes) for food-producing animals normalised by the aggregated PCU (1,000 tonnes).

Sales of veterinary antimicrobial agents in 31 European countries in 2017Ninth ESVAC report25
Cou
ntr
y
Tetracyclines
Amphenicols
Penicillins
1st- and 2nd-gen. cephalosporins
3rd- and 4th-gen. cephalosporins
Sulfonamides
Trimethoprim
Macrolides
Lincosamides
Fluoroquinolones
Other quinolones
Aminoglycosides
Polymyxins
Pleuromutilins
Others*
Total, mg/PCU
Aus
tria
26.1
0.4
8.6
0.05
0.2
3.5
0.7
3.2
0.1
0.5
01.
31.
70.
30.
246
.8Bel
gium
33.6
1.8
49.4
0.2
0.1
21.9
4.4
8.1
3.0
0.2
0.1
0.6
2.1
0.5
5.3
131.
3Bul
garia
45.6
8.1
24.7
0.02
0.1
7.9
1.1
19.1
7.1
5.7
0.5
6.1
3.0
2.2
1.1
132.
3Cro
atia
23.7
1.8
22.3
0.2
0.2
6.0
0.9
6.7
0.1
1.9
0.7
3.3
3.2
0.3
0.2
71.5
Cyp
rus
173.
516
.881
.10.
030.
431
.46.
116
.254
.22.
40.
44.
210
.423
.42.
542
3.1
Cze
chia
18.8
1.4
17.3
0.3
0.5
10.9
1.2
3.5
0.1
1.9
0.01
2.6
0.6
4.3
0.4
63.6
Den
mar
k7.
90.
611
.90.
02<
0.01
3.8
0.7
5.7
0.9
<0.
010.
32.
20.
23.
71.
339
.4Es
toni
a14
.00.
521
.70.
20.
83.
00.
62.
10.
51.
30
3.3
1.1
6.2
1.2
56.7
Finl
and
4.5
0.2
8.8
0.03
<0.
013.
60.
70.
80.
50.
10
0.1
00.
00
19.3
Fran
ce26
.80.
89.
30.
20.
0212
.82.
34.
70.
40.
20.
57.
12.
20.
60.
868
.6G
erm
any
23.1
0.6
34.5
0.1
0.4
7.1
0.9
6.4
1.3
1.1
01.
98.
51.
91.
489
.0G
reec
e47
.70.
718
.6<
0.01
0.1
8.3
1.3
3.3
0.3
2.7
3.9
4.3
1.3
0.9
0.5
93.9
Hun
gary
77.7
3.9
46.7
0.1
0.5
7.0
1.4
7.8
3.6
8.8
0.1
3.0
14.9
15.0
0.4
191.
0Ic
elan
d0.
30
3.3
0<
0.01
0.3
0.05
00
<0.
010
0.6
00
04.
6Ir
elan
d219
.61.
49.
70.
30.
17.
90.
63.
40.
10.
40
2.5
0.5
46.6
Ital
y78
.96.
070
.30.
20.
433
.94.
122
.020
.83.
02.
811
.15.
29.
25.
827
3.8
Latv
ia8.
30.
18.
50.
20.
31.
10.
23.
40.
11.
10.
013.
51.
34.
80.
433
.3Li
thua
nia
5.0
0.3
13.6
0.1
0.2
7.1
1.6
1.5
0.6
0.8
<0.
011.
60.
70.
80.
934
.8Lu
xem
bour
g13
.60.
86.
80.
10.
65.
71.
10.
90.
40.
70
1.0
1.0
0.2
2.0
35.0
Mal
ta3
12.5
1.4
12.1
0.1
0.2
11.5
1.5
12.0
0.4
15.3
5.7
4.6
27.9
15.6
121.
0N
ethe
rlan
ds22
.31.
412
.60.
04<
0.01
8.6
1.6
7.5
0.05
0.1
0.9
0.5
0.3
0.3
0.2
56.3
Nor
way
0.1
0.2
1.6
0<
0.01
0.7
0.1
<0.
01<
0.01
<0.
010.
20.
20
0.02
<0.
013.
1Po
land
47.9
1.8
54.1
0.1
0.2
7.1
1.4
18.1
1.5
11.1
0.01
4.7
7.5
8.4
1.2
165.
2Po
rtug
al44
.91.
035
.10.
10.
65.
81.
217
.83.
03.
6<
0.01
2.7
10.9
6.3
1.7
134.
8Ro
man
ia25
.13.
918
.2<
0.01
0.2
2.7
0.6
8.3
6.3
4.3
0.2
10.9
4.1
4.8
0.6
90.2
Slo
vaki
a18
.50.
511
.40.
40.
46.
00.
79.
90.
33.
40.
021.
91.
75.
31.
561
.9Slo
veni
a4.
30.
722
.20.
10.
22.
40.
60.
20.
12.
90
2.2
0.1
0.3
0.2
36.5
Spa
in63
.16.
258
.50.
030.
214
.82.
510
.144
.44.
90.
312
.24.
47.
41.
323
0.3
Swed
en4
0.6
7.7
<0.
01<
0.01
2.0
0.4
0.5
0.01
0.02
00.
30.
211
.8Sw
itzer
land
58.
70.
411
.20.
10.
212
.80.
72.
00.
30
3.1
0.4
0.2
40.1
Uni
ted
Kin
gdom
13.2
0.6
7.5
0.1
0.1
2.7
0.5
3.2
0.3
0.2
02.
0<
0.01
1.5
0.4
32.5
Tota
l sal
es6 f
or 3
1 c
oun
trie
s (m
g/P
CU
)3
2.6
2.1
28
.80
.10
.29
.81
.57
.97
.82
.40
.44
.93
.63
.51
.31
07
.0
Med
ian
7 o
f 3
1 c
oun
trie
s (m
g/
PC
U)
19
.60
.81
3.6
0.1
0.2
7.0
0.9
4.7
0.4
1.1
0.0
22
.61
.31
.50
.66
1.9
* O
ther
ant
ibac
teria
ls (
baci
trac
in, f
osfo
myc
in, f
ural
tado
ne, m
etro
nida
zole
, nov
obio
cin,
par
omom
ycin
, rifa
xim
in a
nd s
pect
inom
ycin
, cla
ssifi
ed a
s ‘o
ther
ant
ibac
teria
ls’ i
n th
e AT
Cvet
sys
tem
).
1 Fo
r th
e co
untr
ies
whe
re the
inje
ctab
le 3
rd-
and
4th-
gen.
cep
halo
spor
ins
are
alm
ost so
lely
mar
kete
d fo
r do
gs a
nd c
ats,
the
dat
a pr
ovid
es a
con
side
rabl
e ov
eres
timat
e fo
r fo
od-p
rodu
cing
ani
mal
s.2 Po
lym
yxin
s an
d pl
euro
mut
ilins
are
agg
rega
ted
with
‘oth
ers’
for
reas
ons
of c
omm
erci
al c
onfid
entia
lity.
3 Fo
r co
nfide
ntia
lity
reas
ons,
fluo
roqu
inol
ones
and
oth
er q
uino
lone
s ar
e ag
greg
ated
.4 Am
phen
icol
s, p
olym
yxin
s an
d pl
euro
mut
ilins
agg
rega
ted
with
‘oth
ers’
for
reas
ons
of c
omm
erci
al c
onfid
entia
lity.
5 Fo
r co
nfide
ntia
lity
reas
ons,
ple
urom
utili
ns a
re g
roup
ed w
ith o
ther
s an
d lin
cosa
mid
es a
re g
roup
ed w
ith m
acro
lides
.6 To
tal s
ales
exp
ress
ed in
mg/
PCU
con
sist
of t
otal
am
ount
of a
ntim
icro
bial
age
nts
sold
(m
g) d
ivid
ed b
y to
tal P
CU (
kg)
for
31 c
ount
ries.
7 M
edia
n sh
ows
the
16th v
alue
ran
ked
from
sm
alle
st to
larg
est pe
r ea
ch v
aria
ble
of 3
1 ob
serv
atio
ns.
Tabl
e 5.
Sal
es fo
r fo
od-p
rodu
cing
ani
mal
s, in
mg
per
popu
latio
n co
rrec
tion
unit
(mg/
PCU
), o
f the
var
ious
vet
erin
ary
antim
icro
bial
cla
sses
in the
31
Euro
pean
cou
ntrie
s in
201
71

Sales of veterinary antimicrobial agents in 31 European countries in 2017Ninth ESVAC report26
Figure 2. Sales for food-producing species, in mg/PCU, of the various veterinary antimicrobial classes, for 31 European countries, in 20171
* Amphenicols, cephalosporins, other quinolones and other antibacterials (classified as such in the ATCvet system).1 Differences between countries can be partly explained by differences in animal demographics, in the selection of antimicrobial agents, in dosage regimes, in the type of data sources, and veterinarians’ prescribing habits.
Figure 3. Proportion of the total sales of the different veterinary antimicrobial classes, in mg/PCU, in the 31 European countries, for 2017
* Amphenicols, cephalosporins, other quinolones and other antibacterials (classified as such in the ATCvet system).
0
50
100
150
200
250
300
350
400
450
Aus
tria
Bel
gium
Bul
garia
Cro
atia
Cyp
rus
Cze
chia
Den
mar
kEs
toni
aFi
nlan
dFr
ance
Ger
man
yG
reec
eH
unga
ryIc
elan
dIr
elan
dIt
aly
Latv
iaLi
thua
nia
Luxe
mbo
urg
Mla
taN
ethe
rlan
dsN
orw
ayPo
land
Port
ugal
Rom
ania
Slo
vaki
aSlo
veni
aSpa
inSw
eden
Switz
erla
ndU
nite
d Kin
gdom
Others*
Fluoroquinolones
Pleuromutilins
Aminoglycosides
Polymyxins
Lincosamides
Macrolides
Trimethoprim
Sulfonamides
Penicillins
Tetracyclines
mg/
PCU
0%
10%
20%
30%
40%
50%
60%
70%
80%
90%
100%
Aust
ria
Belg
ium
Bulg
aria
Cro
atia
Cyp
rus
Cze
chia
Den
mar
kEs
toni
aFi
nlan
dFr
ance
Ger
man
yG
reec
eH
unga
ryIc
elan
dIr
elan
dIt
aly
Latv
iaLi
thua
nia
Luxe
mbo
urg
Mal
taN
ethe
rlan
dsN
orw
ayPo
land
Port
ugal
Rom
ania
Slov
akia
Slov
enia
Spai
nSw
eden
Switz
erla
ndU
nite
d Ki
ngdo
m
Others*
Fluoroquinolones
Pleuromutilins
Aminoglycosides
Polymyxins
Lincosamides
Macrolides
Trimethoprim
Sulfonamides
Penicillins
Tetracyclines

Sales of veterinary antimicrobial agents in 31 European countries in 2017Ninth ESVAC report27
Figure 4. Sales of antimicrobial agents by antimicrobial class as percentage of the total sales for food-producing species, in mg/PCU, aggregated by 31 European countries, for 2017
* Amphenicols, cephalosporins, other quinolones and other antibacterials (classified as such in the ATCvet system).
Across all 31 countries, the sales of tetracyclines, penicillins and sulfonamides, in mg/PCU, accounted for 66.5 % of the total sales in 2017 (Figure 4). Of the overall sales in the 31 countries, 0.1 % was accounted for by 1st- and 2nd-generation cephalosporins, 0.2 % were for 3rd- and 4th-generation cephalosporins, 1.9 % were for amphenicols, and 0.4 % for other quinolones.
The percentage of sales of penicillins attributed to the various subclasses differed substantially between the 31 countries (Figure 5). In the Nordic countries, where the proportion of sales of penicillin is typically high, beta-lactamase-sensitive penicillins21 accounted for the majority of penicillins sold (range: 54 % to 96 % of total penicillins sold). For countries other than the Nordics, penicillins with an extended spectrum (mainly represented by amoxicillin) accounted for the major proportion of penicillin sales.
Figure 5. Distribution of the sales, in mg/PCU, of penicillins by subclass for food-producing species, in 31 European countries, for 2017
* In the ATCvet system, they are classified as combinations of penicillins that include beta-lactamase inhibitors.
21 Beta-lactamase-sensitive penicillins belong to ATCvet code QJ01CE. Procaine benzylpenicillin, penethamate hydriodide and phenoxymethylpenicillin accounted for the majority of sales of these penicillins.
Tetracyclines
Penicillins
Sulfonamides
Trimethoprim
Macrolides
Lincosamides
Polymyxins
Aminoglycosides
Pleuromutilins
Fluoroquinolones
Others*
30.4%
26.9%
9.2%
1.4%
7.4%
7.3%
3.4%
4.6%
3.3%2.2% 3.8%
0%
10%
20%
30%
40%
50%
60%
70%
80%
90%
100%
Beta-lactamase sensitive penicillins
Penicillins with extended spectrum
Beta-lactamase resistant penicillins
Penicillins + beta-lactamase-inhib.*
Aus
tria
Bel
gium
Bul
garia
Cro
atia
Cyp
rus
Cze
chia
Den
mar
kEs
toni
aFi
nlan
dFr
ance
Ger
man
yG
reec
eH
unga
ryIc
elan
dIr
elan
dIt
aly
Latv
iaLi
thua
nia
Luxe
mbo
urg
Mal
taN
ethe
rlan
dsN
orw
ayPo
land
Port
ugal
Rom
ania
Slo
vaki
aSlo
veni
aSpa
inSw
eden
Switz
erla
ndU
nite
d Kin
gdom
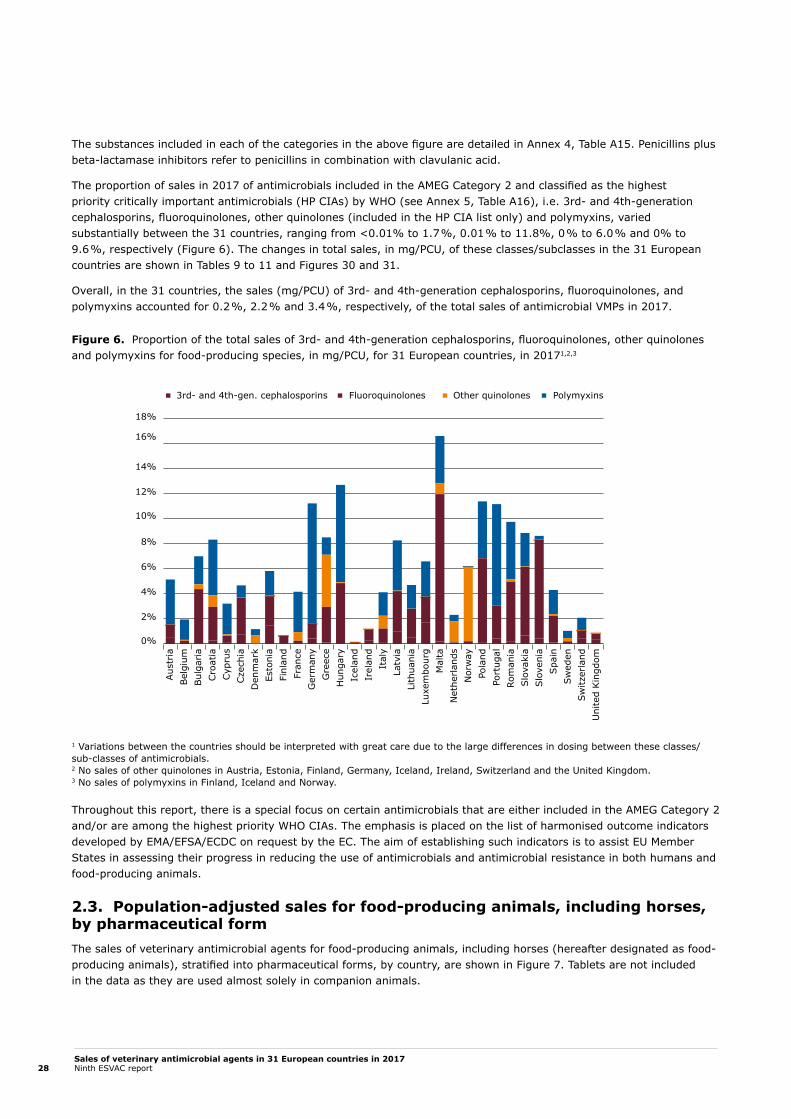
Sales of veterinary antimicrobial agents in 31 European countries in 2017Ninth ESVAC report28
The substances included in each of the categories in the above figure are detailed in Annex 4, Table A15. Penicillins plus beta-lactamase inhibitors refer to penicillins in combination with clavulanic acid.
The proportion of sales in 2017 of antimicrobials included in the AMEG Category 2 and classified as the highest priority critically important antimicrobials (HP CIAs) by WHO (see Annex 5, Table A16), i.e. 3rd- and 4th-generation cephalosporins, fluoroquinolones, other quinolones (included in the HP CIA list only) and polymyxins, varied substantially between the 31 countries, ranging from <0.01% to 1.7 %, 0.01 % to 11.8%, 0 % to 6.0 % and 0% to 9.6 %, respectively (Figure 6). The changes in total sales, in mg/PCU, of these classes/subclasses in the 31 European countries are shown in Tables 9 to 11 and Figures 30 and 31.
Overall, in the 31 countries, the sales (mg/PCU) of 3rd- and 4th-generation cephalosporins, fluoroquinolones, and polymyxins accounted for 0.2 %, 2.2 % and 3.4 %, respectively, of the total sales of antimicrobial VMPs in 2017.
Figure 6. Proportion of the total sales of 3rd- and 4th-generation cephalosporins, fluoroquinolones, other quinolones and polymyxins for food-producing species, in mg/PCU, for 31 European countries, in 20171,2,3
1 Variations between the countries should be interpreted with great care due to the large differences in dosing between these classes/sub-classes of antimicrobials.2 No sales of other quinolones in Austria, Estonia, Finland, Germany, Iceland, Ireland, Switzerland and the United Kingdom.3 No sales of polymyxins in Finland, Iceland and Norway.
Throughout this report, there is a special focus on certain antimicrobials that are either included in the AMEG Category 2 and/or are among the highest priority WHO CIAs. The emphasis is placed on the list of harmonised outcome indicators developed by EMA/EFSA/ECDC on request by the EC. The aim of establishing such indicators is to assist EU Member States in assessing their progress in reducing the use of antimicrobials and antimicrobial resistance in both humans and food-producing animals.
2.3. Population-adjusted sales for food-producing animals, including horses, by pharmaceutical formThe sales of veterinary antimicrobial agents for food-producing animals, including horses (hereafter designated as food-producing animals), stratified into pharmaceutical forms, by country, are shown in Figure 7. Tablets are not included in the data as they are used almost solely in companion animals.
0%
2%
4%
6%
8%
10%
12%
14%
16%
18%
3rd- and 4th-gen. cephalosporins Other quinolonesFluoroquinolones Polymyxins
Aus
tria
Bel
gium
Bul
garia
Cro
atia
Cyp
rus
Cze
chia
Den
mar
kEs
toni
aFi
nlan
dFr
ance
Ger
man
yG
reec
eH
unga
ryIc
elan
dIr
elan
dIt
aly
Latv
iaLi
thua
nia
Luxe
mbo
urg
Mal
taN
ethe
rlan
dsN
orw
ayPo
land
Port
ugal
Rom
ania
Slo
vaki
aSlo
veni
aSpa
inSw
eden
Switz
erla
ndU
nite
d Kin
gdom

Sales of veterinary antimicrobial agents in 31 European countries in 2017Ninth ESVAC report29
Figure 7. Distribution of sales of veterinary antimicrobial agents for food-producing animals, in mg of active substance per population correction unit (mg/PCU), by pharmaceutical form, in 31 European countries, for 2017
Figure 8. Oral solutions, oral powders and premixes as percentages of total sales, in mg per population correction unit (mg/PCU), of veterinary antimicrobial agents for food-producing animals, in 31 European countries, for 2017
Aust
ria
Bel
gium
Bul
garia
Cro
atia
Cyp
rus
Cze
chia
Den
mar
kEs
toni
aFi
nlan
dFr
ance
Ger
man
yG
reec
eH
unga
ryIc
elan
dIr
elan
dIt
aly
Latv
iaLi
thua
nia
Luxe
mbo
urg
Mal
taN
ethe
rlan
dsN
orw
ayPo
land
Port
ugal
Rom
ania
Slo
vaki
aSlo
veni
aSpa
inSw
eden
Switz
erla
ndU
nite
d Kin
gdom
0%
10%
20%
30%
40%
50%
60%
70%
80%
90%
100%
Premix Oral powder Oral solution Injectable prep. Oral paste Bolus Intramammary prep. Intrauterine prep.
Aust
ria
Bel
gium
Bul
garia
Cro
atia
Cyp
rus
Cze
chia
Den
mar
kEs
toni
aFi
nlan
dFr
ance
Ger
man
yG
reec
eH
unga
ryIc
elan
dIr
elan
dIt
aly
Latv
iaLi
thua
nia
Luxe
mbo
urg
Mal
taN
ethe
rlan
dsN
orw
ayPo
land
Port
ugal
Rom
ania
Slo
vaki
aSlo
veni
aSpa
inSw
eden
Switz
erla
ndU
nite
d Kin
gdom
0%
10%
20%
30%
40%
50%
60%
70%
80%
90%
100%Premix Oral solutionOral powder

Sales of veterinary antimicrobial agents in 31 European countries in 2017Ninth ESVAC report30
The proportions accounted for by premixes and oral powders vary considerably between the countries, which may be attributed to whether or not the farmers in the country administer medicated feed prepared by a feed mill from premixes, or whether group treatment is carried out by the application of oral powder as, for example, top dressing on the feed at the farm. It may also be influenced by the distribution of animal species, as group medication is used mainly in poultry and pigs, and less, for example, in sheep or goats. The products available as well as national policies for in-feed medication can also influence the sales patterns in terms of pharmaceutical form.
As shown in Figure 9, aggregated by the 31 countries, sales (mg/PCU) of premixes accounted for 28.8 % of the overall sales, 9.9 % were oral powders and 50.7 % were oral solutions, i.e. 89.4 % were for group treatment; 9.7 % were injectable preparations, 0.5 % were intramammary preparations and 0.4 % were oral pastes, boluses and intrauterine preparations.
Figure 9. Distribution of sales, in mg/PCU, of the various pharmaceutical forms of veterinary antimicrobial agents for food-producing animals, aggregated by the 31 European countries, for 2017
* Oral pastes, boluses and intrauterine preparations.
Although a small proportion of oral powders and oral solutions are suitable for treatment of single animals or a very limited number of animals, the overall sales figures for these pharmaceutical forms provide a reasonable estimate of sales for group treatment, including groups in one pen/farm.
Additional graphs showing the distribution of sales for the most-selling antimicrobial classes and the highest priority CIAs by pharmaceutical form, aggregated by the 31 European countries, can be found in Annex 1, Figures A4-A7.
Premix
Oral powder
Oral solution
Injectable prep.
Intramammary prep.
Others*
0.4%
28.8%
50.7%
9.7%
9.9%
0.5%

Sales of veterinary antimicrobial agents in 31 European countries in 2017Ninth ESVAC report31
2.4. Distribution of sales for food-producing animals – overall and by antimicrobial class and pharmaceutical form
2.4.1. Distribution of sales of antimicrobials for food-producing animals, by country
Figure 10. Spatial distribution of overall sales of all antimicrobials for food-producing animals, in mg/PCU, for 31 countries, for 2017
Russia
R u s s i a
Bosniaand
Herz.
Andorra
Lebanon
Israel
T u r k e y
Croatia
Serbia
Montenegro
Albania
Macedonia
Moldova
U k r a i n e
B e l a r u s
N o r w a y
I c e l a n d
SwitzerlandLiech.
P o l a n d
G e r m a n y
S w e d e n
F i n l a n d
U n i t e d K i n g d o m
Ireland
D e n mark
Netherlands
Luxembourg
Belgium
F r a n c e
S p a i n
Po r t u g a l
I t a l y
M a l t a
C y p r u s
Greece
A u s t r i a
Slovenia
H u n g a r y
C z e c h i a
Lithuania
Latvia
Estonia
Slovakia
B u l g a r i a
R o m a n i a
mg/PCU≥ 3.1
≤ 423.1No dataavailable

Sales of veterinary antimicrobial agents in 31 European countries in 2017Ninth ESVAC report32
2.4.1.1. 3rd- and 4th-generation cephalosporins
Figure 11. Spatial distribution of sales of 3rd- and 4th-generation cephalosporins for veterinary use, in mg/PCU, by country, for 2017
Figure 12. Distribution of sales of 3rd- and 4th-generation cephalosporins for veterinary use by pharmaceutical form, in mg/PCU, by country, for 20171,2
1 Sales <1 kg in Finland, Iceland, Netherlands and Norway.2 For countries where the injectable 3rd- and 4th-generation cephalosporins are almost solely marketed for dogs and cats, the data provide a considerable overestimate for food-producing animals.
Aus
tria
Bel
gium
Bul
garia
Cro
atia
Cyp
rus
Cze
chia
Den
mar
kEs
toni
aFi
nlan
dFr
ance
Ger
man
yG
reec
eH
unga
ryIc
elan
dIr
elan
dIt
aly
Latv
iaLi
thua
nia
Luxe
mbo
urg
Mal
taN
ethe
rlan
dsN
orw
ayPo
land
Port
ugal
Rom
ania
Slo
vaki
aSlo
veni
aSpa
inSw
eden
Switz
erla
ndU
nite
d Kin
gdom
Injectable prep. Intramammary prep.
0%
10%
20%
30%
40%
50%
60%
70%
80%
90%
100%
Russia
R u s s i a
Bosniaand
Herz.
Andorra
Lebanon
Israel
T u r k e y
Croatia
Serbia
Montenegro
Albania
Macedonia
Moldova
U k r a i n e
B e l a r u s
N o r w a y
I c e l a n d
SwitzerlandLiech.
P o l a n d
G e r m a n y
S w e d e n
F i n l a n d
U n i t e d K i n g d o m
Ireland
D e n mark
Netherlands
Luxembourg
Belgium
F r a n c e
S p a i n
Po r t u g a l
I t a l y
M a l t a
C y p r u s
Greece
A u s t r i a
Slovenia
H u n g a r y
C z e c h i a
Lithuania
Latvia
Estonia
Slovakia
B u l g a r i a
R o m a n i a
mg/PCU≥ 0.01
≤ 0.8No dataavailable

Sales of veterinary antimicrobial agents in 31 European countries in 2017Ninth ESVAC report33
2.4.1.2. Fluoroquinolones
Figure 13. Spatial distribution of sales of fluoroquinolones for veterinary use, in mg/PCU, by country, for 2017
Figure 14. Distribution of sales of fluoroquinolones for veterinary use by pharmaceutical form, in mg/PCU, by country, for 20171
1 In Iceland, sales of fluoroquinolones were <1kg.* Other forms include negligible amounts sold as boluses, premixes and/or intrauterine preparations in some countries.
Russia
R u s s i a
Bosniaand
Herz.
Andorra
Lebanon
Israel
T u r k e y
Croatia
Serbia
Montenegro
Albania
Macedonia
Moldova
U k r a i n e
B e l a r u s
N o r w a y
I c e l a n d
SwitzerlandLiech.
P o l a n d
G e r m a n y
S w e d e n
F i n l a n d
U n i t e d K i n g d o m
Ireland
D e n mark
Netherlands
Luxembourg
Belgium
F r a n c e
S p a i n
Po r t u g a l
I t a l y
M a l t a
C y p r u s
Greece
A u s t r i a
Slovenia
H u n g a r y
C z e c h i a
Lithuania
Latvia
Estonia
Slovakia
B u l g a r i a
R o m a n i a
mg/PCU≥ 0.01
≤ 14.3No dataavailable
Aus
tria
Bel
gium
Bul
garia
Cro
atia
Cyp
rus
Cze
chia
Den
mar
kEs
toni
aFi
nlan
dFr
ance
Ger
man
yG
reec
eH
unga
ryIc
elan
dIr
elan
dIt
aly
Latv
iaLi
thua
nia
Luxe
mbo
urg
Mal
taN
ethe
rlan
dsN
orw
ayPo
land
Port
ugal
Rom
ania
Slo
vaki
aSlo
veni
aSpa
inSw
eden
Switz
erla
ndU
nite
d Kin
gdom
0%
10%
20%
30%
40%
50%
60%
70%
80%
90%
100%
Oral solution Injectable prep. Other forms*Oral powder

Sales of veterinary antimicrobial agents in 31 European countries in 2017Ninth ESVAC report34
2.4.1.3. Other quinolones
Figure 15. Spatial distribution of sales of other quinolones for veterinary use, in mg/PCU, by country, for 20171
1 No sales in Austria, Estonia, Finland, Germany, Iceland, Ireland, Luxembourg, Slovenia, Sweden, Switzerland and the United Kingdom.
Figure 16. Distribution of sales of other quinolones for veterinary use by pharmaceutical form, in mg/PCU, by country, for 20171
1 No sales of other quinolones in Austria, Estonia, Finland, Germany, Iceland, Ireland, Luxembourg, Slovenia, Sweden, Switzerland and the United Kingdom; and sales of other quinolones <1kg were observed in Portugal.* Other forms include negligible amounts sold as boluses and/or oral pastes in some countries.
Russia
R u s s i a
Bosniaand
Herz.
Andorra
Lebanon
Israel
T u r k e y
Croatia
Serbia
Montenegro
Albania
Macedonia
Moldova
U k r a i n e
B e l a r u s
N o r w a y
I c e l a n d
SwitzerlandLiech.
P o l a n d
G e r m a n y
S w e d e n
F i n l a n d
U n i t e d K i n g d o m
Ireland
D e n mark
Netherlands
Luxembourg
Belgium
F r a n c e
S p a i n
Po r t u g a l
I t a l y
M a l t a
C y p r u s
Greece
A u s t r i a
Slovenia
H u n g a r y
C z e c h i a
Lithuania
Latvia
Estonia
Slovakia
B u l g a r i a
R o m a n i a
mg/PCU
> 0
≤ 3.9No dataavailable
= 0
Bel
gium
Bul
garia
Cro
atia
Cyp
rus
Cze
chia
Den
mar
k
Fran
ce
Gre
ece
Hun
gary
Ital
y
Latv
ia
Lith
uani
a
Mal
ta
Net
herlan
ds
Nor
way
Pola
nd
Port
ugal
Rom
ania
Slo
vaki
a
Spa
in
Swed
en
0%
10%
20%
30%
40%
50%
60%
70%
80%
90%
100%
Oral solutionPremix Oral powder Other forms*Injectable prep.

Sales of veterinary antimicrobial agents in 31 European countries in 2017Ninth ESVAC report35
2.4.1.4. Polymyxins
Figure 17. Spatial distribution of sales of polymyxins for veterinary use, in mg/PCU, by country, for 20171
1 No sales in Finland, Iceland and Norway.
Figure 18. Distribution of sales of polymyxins for veterinary use by pharmaceutical form, in mg/PCU, by country, for 20171
1 No sales in Finland, Iceland and Norway. * Other forms include negligible amounts sold as boluses, oral pastes and/or intramammary preparations in some countries.
Russia
R u s s i a
Bosniaand
Herz.
Andorra
Lebanon
Israel
T u r k e y
Croatia
Serbia
Montenegro
Albania
Macedonia
Moldova
U k r a i n e
B e l a r u s
N o r w a y
I c e l a n d
SwitzerlandLiech.
P o l a n d
G e r m a n y
S w e d e n
F i n l a n d
U n i t e d K i n g d o m
Ireland
D e n mark
Netherlands
Luxembourg
Belgium
F r a n c e
S p a i n
Po r t u g a l
I t a l y
M a l t a
C y p r u s
Greece
A u s t r i a
Slovenia
H u n g a r y
C z e c h i a
Lithuania
Latvia
Estonia
Slovakia
B u l g a r i a
R o m a n i a
mg/PCU
> 0
≤ 14.9No dataavailable
= 0
Aus
tria
Bel
gium
Bul
garia
Cro
atia
Cyp
rus
Cze
chia
Den
mar
k
Esto
nia
Fran
ce
Ger
man
y
Gre
ece
Hun
gary
Irel
and
Ital
y
Latv
ia
Lith
uani
a
Luxe
mbo
urg
Mal
ta
Net
herlan
ds
Pola
nd
Port
ugal
Rom
ania
Slo
vaki
a
Slo
veni
a
Spa
in
Swed
en
Switz
erla
nd
Uni
ted
Kin
gdom
Oral solutionPremix Oral powder Injectable prep.
0%
10%
20%
30%
40%
50%
60%
70%
80%
90%
100%Other forms*
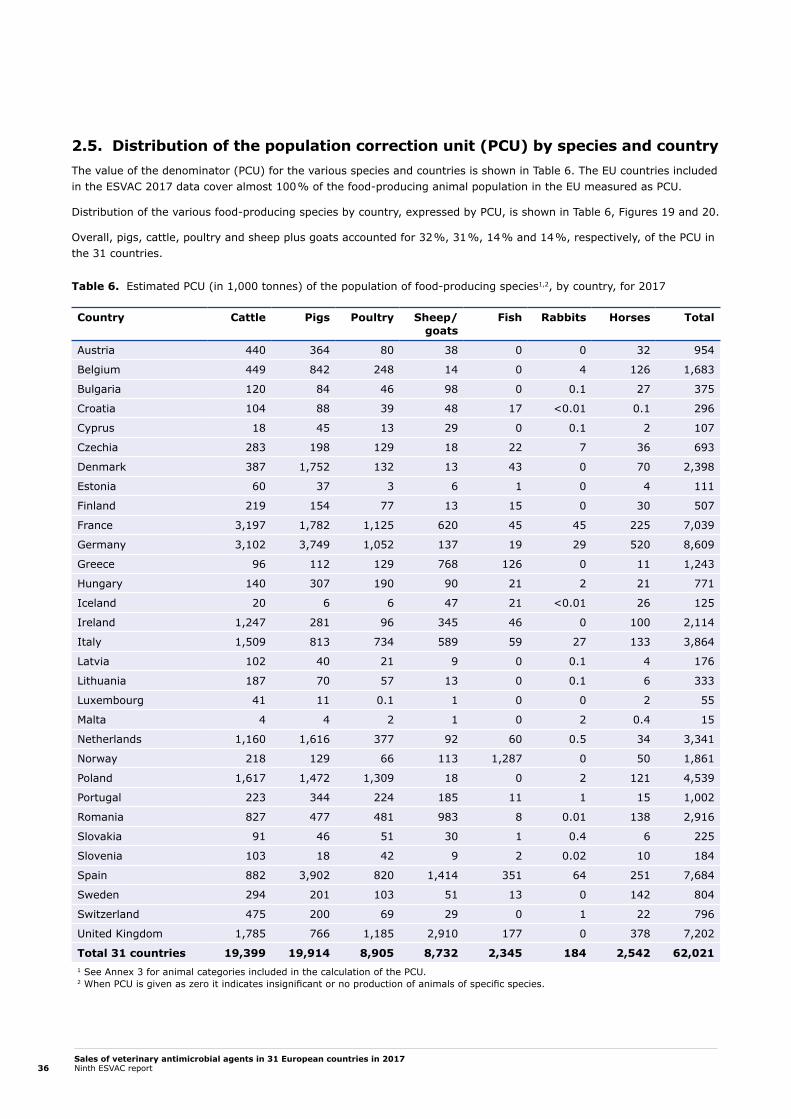
Sales of veterinary antimicrobial agents in 31 European countries in 2017Ninth ESVAC report36
2.5. Distribution of the population correction unit (PCU) by species and countryThe value of the denominator (PCU) for the various species and countries is shown in Table 6. The EU countries included in the ESVAC 2017 data cover almost 100 % of the food-producing animal population in the EU measured as PCU.
Distribution of the various food-producing species by country, expressed by PCU, is shown in Table 6, Figures 19 and 20.
Overall, pigs, cattle, poultry and sheep plus goats accounted for 32 %, 31 %, 14 % and 14 %, respectively, of the PCU in the 31 countries.
Table 6. Estimated PCU (in 1,000 tonnes) of the population of food-producing species1,2, by country, for 2017
Country Cattle Pigs Poultry Sheep/ goats
Fish Rabbits Horses Total
Austria 440 364 80 38 0 0 32 954
Belgium 449 842 248 14 0 4 126 1,683
Bulgaria 120 84 46 98 0 0.1 27 375
Croatia 104 88 39 48 17 <0.01 0.1 296
Cyprus 18 45 13 29 0 0.1 2 107
Czechia 283 198 129 18 22 7 36 693
Denmark 387 1,752 132 13 43 0 70 2,398
Estonia 60 37 3 6 1 0 4 111
Finland 219 154 77 13 15 0 30 507
France 3,197 1,782 1,125 620 45 45 225 7,039
Germany 3,102 3,749 1,052 137 19 29 520 8,609
Greece 96 112 129 768 126 0 11 1,243
Hungary 140 307 190 90 21 2 21 771
Iceland 20 6 6 47 21 <0.01 26 125
Ireland 1,247 281 96 345 46 0 100 2,114
Italy 1,509 813 734 589 59 27 133 3,864
Latvia 102 40 21 9 0 0.1 4 176
Lithuania 187 70 57 13 0 0.1 6 333
Luxembourg 41 11 0.1 1 0 0 2 55
Malta 4 4 2 1 0 2 0.4 15
Netherlands 1,160 1,616 377 92 60 0.5 34 3,341
Norway 218 129 66 113 1,287 0 50 1,861
Poland 1,617 1,472 1,309 18 0 2 121 4,539
Portugal 223 344 224 185 11 1 15 1,002
Romania 827 477 481 983 8 0.01 138 2,916
Slovakia 91 46 51 30 1 0.4 6 225
Slovenia 103 18 42 9 2 0.02 10 184
Spain 882 3,902 820 1,414 351 64 251 7,684
Sweden 294 201 103 51 13 0 142 804
Switzerland 475 200 69 29 0 1 22 796
United Kingdom 1,785 766 1,185 2,910 177 0 378 7,202
Total 31 countries 19,399 19,914 8,905 8,732 2,345 184 2,542 62,0211 See Annex 3 for animal categories included in the calculation of the PCU.2 When PCU is given as zero it indicates insignificant or no production of animals of specific species.

Sales of veterinary antimicrobial agents in 31 European countries in 2017Ninth ESVAC report37
Figure 19. The denominator (PCU) and its distribution by the food-producing animal species (1 PCU = 1 kg), by country, in 2017
* Others include horses and, for some countries, fish and/or rabbits.
Figure 20. Distribution of the denominator (PCU) in weight by food-producing animal species, including horses, by country, in 2017
* Includes horses and, for some countries, fish and/or rabbits.
Aus
tria
Bel
gium
Bul
garia
Cro
atia
Cyp
rus
Cze
chia
Den
mar
kEs
toni
aFi
nlan
dFr
ance
Ger
man
yG
reec
eH
unga
ryIc
elan
dIr
elan
dIt
aly
Latv
iaLi
thua
nia
Luxe
mbo
urg
Mal
taN
ethe
rlan
dsN
orw
ayPo
land
Port
ugal
Rom
ania
Slo
vaki
aSlo
veni
aSpa
inSw
eden
Switz
erla
ndU
nite
d Kin
gdom
PoultryCattle Pigs Sheep and goats
0
1,000
2,000
3,000
4,000
5,000
6,000
7,000
8,000
9,000
10,000Others*
PCU
(1,
000
tonn
es)
Aus
tria
Bel
gium
Bul
garia
Cro
atia
Cyp
rus
Cze
chia
Den
mar
kEs
toni
aFi
nlan
dFr
ance
Ger
man
yG
reec
eH
unga
ryIc
elan
dIr
elan
dIt
aly
Latv
iaLi
thua
nia
Luxe
mbo
urg
Mal
taN
ethe
rlan
dsN
orw
ayPo
land
Port
ugal
Rom
ania
Slo
vaki
aSlo
veni
aSpa
inSw
eden
Switz
erla
ndU
nite
d Kin
gdom
PoultryCattle Pigs Sheep and goats
0%
10%
20%
30%
40%
50%
60%
70%
80%
90%
100%Others*

Sales of veterinary antimicrobial agents in 31 European countries in 2017Ninth ESVAC report38
In 2017, of the 31 countries, 14 had a net export of animals for slaughter or fattening to other Member States which accounted for ≥5 % of the total denominator (PCU), whilst 11 countries had a net import accounting for ≥5 % of the total denominator.
Table 7. PCU domestic, net export and net import (1000 tonnes) of animals for fattening or slaughter, respectively, to or from another Member State and PCU (net balance) in 2017
Country PCU Domestic
PCU Export Proportion, export
PCU Import Proportion, import
PCU
Austria 1,031 15 2 % 92 10 % 954
Belgium 1,761 159 9 % 237 14 % 1,683
Bulgaria 376 0.4 0.1 % 2 1 % 375
Croatia 313 18 6 % 35 12 % 296
Cyprus 108 0 0 % 0,1 0.1 % 107
Czechia 626 77 11 % 10 1 % 693
Denmark 2,003 395 16 % 0 0 % 2,398
Estonia 103 11 10 % 3 2 % 111
Finland 505 3 1 % 0 0 % 507
France 6,737 325 5 % 23 0.3 % 7,039
Germany 8,802 444 5 % 637 7 % 8,609
Greece 1,254 0.03 <0.01 % 11 1 % 1,243
Hungary 817 35 5 % 81 11 % 771
Iceland 125 0 0 % 0 0 % 125
Ireland 2,079 52 2 % 17 1 % 2,114
Italy 4,106 3 0.1 % 245 6 % 3,864
Latvia 160 22 12 % 5 3 % 176
Lithuania 313 31 9 % 11 3 % 333
Luxembourg 46 13 24 % 4 8 % 55
Malta 15 0.08 1 % 0,01 0.1 % 15
Netherlands 3,240 543 16 % 443 13 % 3,341
Norway 1,861 0 0 % 0 0 % 1,861
Poland 4,777 20 0.4 % 259 6 % 4,539
Portugal 1,058 28 3 % 84 8 % 1,002
Romania 2,900 45 2 % 29 1 % 2,916
Slovakia 178 66 29 % 19 8 % 225
Slovenia 171 20 11 % 7 4 % 184
Spain 7,728 104 1 % 147 2 % 7,684
Sweden 804 <0.001 <0.01 % 0.01 <0.01 % 804
Switzerland 796 2 0.2 % 1 0.2 % 796
United Kingdom 7,223 14 0.2 % 34 0.5 % 7,202

Sales of veterinary antimicrobial agents in 31 European countries in 2017Ninth ESVAC report39
2.6. Distribution of single- and multiple-ingredient products of veterinary antimicrobial agentsOf the 9,387 product presentations (tablets excluded) for which sales were reported, 82.7 % (n=7,759) contained only one active ingredient, 14.9 % (n=1,401) contained two active ingredients, and 2.2 % (n=203) contained three active ingredients (Annex 1, Table A7). In addition, 0.3 % (n=24) of the product presentations contained four active ingredients. Sales of products with three active ingredients were accounted for almost exclusively by products for individual treatment (injections, intramammary and intrauterine preparations).
For all 31 countries, 44.2 % of the product presentations of antimicrobial VMPs were for group treatment, i.e. premixes, oral powders and oral solutions. Of these, 86.4 % contained one active ingredient, 12.4 % two active ingredients, and 1.1 % contained three active ingredients (Annex 1, Table A8).
Across the 31 countries, of the total sales of premixes, oral powders and oral solutions, in tonnes of active ingredient, 86.65 %, 12.85 % and 0.48 % were accounted for by products containing 1, 2 and 3 active ingredients, respectively (Figure 21).
Figure 21. Percentage of sales for veterinary use, in tonnes of active ingredient, of premixes, oral powders and oral solutions containing 1, 2, 3 and 4 antimicrobial agents, in 2017
2.7. Changes over timeThroughout the report, there is a special focus on those antimicrobials that either belong to the high-selling classes or are among those considered of the highest importance in the AMEG categorisation, or are included in the WHO list of the highest priority CIAs (see Annex 5). Following the list of harmonised outcome indicators to assist EU Member States in assessing their progress in reducing the use of antimicrobials and antimicrobial resistance in both humans and food-producing animals, jointly established by ECDC, EFSA and EMA, the emphasis on food-producing animals lies on overall sales (mg/PCU) of antimicrobials (primary indicator) and sales of 3rd- and 4th-generation cephalosporins, quinolones (specifying the proportion of fluoroquinolones) and polymyxins (secondary indicators) for veterinary use.
Chapter 2.7 presents the changes over time for all participating countries for the most-sold classes (tetracyclines, penicillins and sulfonamides), the antimicrobials belonging to AMEG Category 2 – i.e. 3rd- and 4th-generation cephalosporins, fluoroquinolones and polymyxins, as well as those additional classes classified by the WHO as the highest priority CIAs for human medicine – i.e. macrolides and other quinolones (glycopeptides, belonging to the list of HP CIAs, are not authorised for use in food-producing animals in the countries participating in ESVAC) (Table A16).
86.65%
0.02%0.48%
12.85%
1 ingredient
2 ingredients
3 ingredients
4 ingredients

Sales of veterinary antimicrobial agents in 31 European countries in 2017Ninth ESVAC report40
2.7.1. Overall changes in the ESVAC participating countries
2.7.1.1. Changes in sales of tonnes of active ingredients, by country
Figure 22. Sales, in tonnes of active ingredients, of veterinary antimicrobials for food-producing animals, by country, between 2010 to 20171-9
1 Corrections to sales data published in the ESVAC 2016 report are described in Chapter 1.5.2 Under-reported for Bulgaria for 2011, 2012 and 2014 as several wholesalers failed to report data. 3 Strength reported as the base for most VMPs for 2011-2012 for Czechia; for 2013-2017, strength reported as in the VMPs’ label. 4 Strength reported as the base for some VMPs for 2011-2012 for the Netherlands; for 2013-2017, strength reported as in the label of the VMPs. 5 For Portugal, under-reporting has been identified for 2010-2014 and 2017.6 For Romania, 2014 data were updated, as wholesalers initially failed to deliver all sales data.7 For Slovakia, for 2011 and 2012, the data only represents antimicrobial VMPs imported by wholesalers; from 2013, data represents all sales from wholesalers to end-users (veterinarians, pharmacies, producers of medicated feeding stuffs and farmers, obtained by import and from national manufacturers).8 For Spain, under-reporting has been identified for 2010 to 2013 (underestimates) and sales data providers for 2017 changed from MAHs to retailers. 9 For the UK, high sales of certain products containing tetracyclines late in 2010 were probably used in 2011 and thus their use has been underestimated for 2011.
AustriaBelgiumBulgariaCroatiaCyprusCzechia
DenmarkEstoniaFinlandFrance
GermanyGreece
HungaryIcelandIreland
ItalyLatvia
LithuaniaLuxembourg
MaltaNetherlands
NorwayPoland
PortugalRomaniaSlovakiaSlovenia
SpainSweden
SwitzerlandUnited Kingdom
2010 2011 2012 2013 2014 2015
Tonnes
2016
0 500 1,000 1,500 2,000 2,500 3,000 3,500
2017

Sales of veterinary antimicrobial agents in 31 European countries in 2017Ninth ESVAC report41
2.7.1.2. Changes in overall sales in mg/PCU, by country
Figure 23. Total sales of veterinary antimicrobials for food-producing species, in mg/PCU, by country, from 2010 to 20171-9
1 Corrections to sales data and/or PCU data published in the ESVAC 2016 report are described in Chapter 1.5.2 Under-reported for Bulgaria for 2011, 2012 and 2014 as several wholesalers failed to report data. 3 Strength reported as the base for most VMPs for 2011-2012 for Czechia; for 2013-2017, strength reported as in the label of the VMPs.4 Strength reported as the base for some VMPs for 2011-2012 for the Netherlands; for 2013-2017, strength reported as in the VMPs’ label.5 For Portugal, under-reporting has been identified for 2010-2014 and 2017.6 For Romania, 2014 data were updated, as wholesalers initially failed to deliver all sales data.7 For Slovakia, for 2011 and 2012, the data represent antimicrobial VMPs imported by wholesalers; from 2013, data represent all sales from wholesalers to end-users (veterinarians, pharmacies, producers of medicated feeding stuffs and farmers, obtained by import and from national manufacturers).8 For Spain, under-reporting for the years 2010 to 2013 has been identified (underestimated) and the data provider for 2017 data was changed from MAHs to retailers. 9 For the UK, high sales of certain tetracycline-containing products late in 2010 were probably used in 2011 and thus their use has been underestimated for 2011.
0 50 100 150 200 250 300 350 400 450 500
mg/PCU
2010 2011 2012 2013 2014 2015 2016 2017
AustriaBelgiumBulgariaCroatiaCyprusCzechia
DenmarkEstoniaFinlandFrance
GermanyGreece
HungaryIcelandIreland
ItalyLatvia
LithuaniaLuxembourg
MaltaNetherlands
NorwayPoland
PortugalRomaniaSlovakiaSlovenia
SpainSweden
SwitzerlandUnited Kingdom
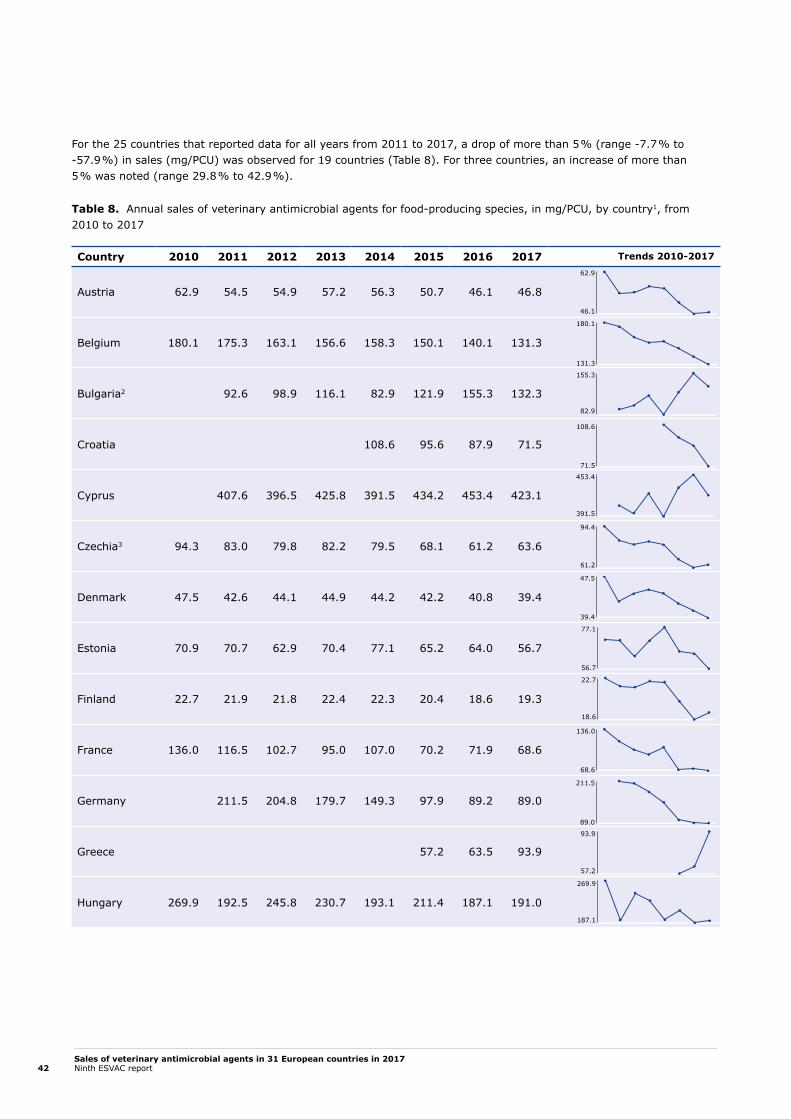
Sales of veterinary antimicrobial agents in 31 European countries in 2017Ninth ESVAC report42
For the 25 countries that reported data for all years from 2011 to 2017, a drop of more than 5 % (range -7.7 % to -57.9 %) in sales (mg/PCU) was observed for 19 countries (Table 8). For three countries, an increase of more than 5 % was noted (range 29.8 % to 42.9 %).
Table 8. Annual sales of veterinary antimicrobial agents for food-producing species, in mg/PCU, by country1, from 2010 to 2017
Country 2010 2011 2012 2013 2014 2015 2016 2017 Trends 2010-2017
Austria 62.9 54.5 54.9 57.2 56.3 50.7 46.1 46.8
Belgium 180.1 175.3 163.1 156.6 158.3 150.1 140.1 131.3
Bulgaria2 92.6 98.9 116.1 82.9 121.9 155.3 132.3
Croatia 108.6 95.6 87.9 71.5
Cyprus 407.6 396.5 425.8 391.5 434.2 453.4 423.1
Czechia3 94.3 83.0 79.8 82.2 79.5 68.1 61.2 63.6
Denmark 47.5 42.6 44.1 44.9 44.2 42.2 40.8 39.4
Estonia 70.9 70.7 62.9 70.4 77.1 65.2 64.0 56.7
Finland 22.7 21.9 21.8 22.4 22.3 20.4 18.6 19.3
France 136.0 116.5 102.7 95.0 107.0 70.2 71.9 68.6
Germany 211.5 204.8 179.7 149.3 97.9 89.2 89.0
Greece 57.2 63.5 93.9
Hungary 269.9 192.5 245.8 230.7 193.1 211.4 187.1 191.0
46.1
62.9
131.3
180.1
82.9
155.3
71.5
108.6
391.5
453.4
61.2
94.4
39.4
47.5
56.7
77.1
18.6
22.7
68.6
136.0
89.0
211.5
57.2
93.9
187.1
269.9
4.6
7.0
46.5
55.9
273.8
421.1
29.9
41.5
29.1
48.2
34.6
52.1
52.7
146.1
2.9
4.0
127.3
165.2
134.8
208.0
85.2
109.0
43.3
65.9
22.4
46.9
230.3
418.8
11.5
15.2
40.1
56.7
32.5
67.9
120
121

Sales of veterinary antimicrobial agents in 31 European countries in 2017Ninth ESVAC report43
Country 2010 2011 2012 2013 2014 2015 2016 2017 Trends 2010-2017
Iceland 7.0 6.2 5.5 5.1 4.9 4.9 4.7 4.6
Ireland 51.5 46.5 55.0 55.9 47.6 51.0 52.1 46.6
Italy 421.1 371.0 341.0 301.6 332.4 322.0 294.8 273.8
Latvia 39.5 36.7 41.5 37.7 36.7 37.6 29.9 33.3
Lithuania 48.2 41.3 39.2 29.1 35.5 35.1 37.7 34.8
Luxembourg 43.2 52.1 40.9 34.6 35.5 35.0
Malta 121.0
Netherlands4 146.1 113.8 74.9 69.9 68.4 64.4 52.7 56.3
Norway 4.0 3.6 3.8 3.6 3.1 2.9 2.9 3.1
Poland 127.3 135.2 151.5 140.8 138.9 129.4 165.2
Portugal5 177.9 161.8 156.9 187.2 201.6 170.2 208.0 134.8
Romania6 109.0 100.5 85.2 90.1
Slovakia7 43.7 43.3 59.3 65.9 51.0 50.4 61.9
Slovenia 46.9 46.1 37.0 22.4 33.4 26.4 30.3 36.5
Spain8 259.5 335.8 302.4 317.1 418.8 402.0 362.5 230.3
Sweden9 15.2 13.6 13.5 12.7 11.5 11.8 12.1 11.8
46.1
62.9
131.3
180.1
82.9
155.3
71.5
108.6
391.5
453.4
61.2
94.4
39.4
47.5
56.7
77.1
18.6
22.7
68.6
136.0
89.0
211.5
57.2
93.9
187.1
269.9
4.6
7.0
46.5
55.9
273.8
421.1
29.9
41.5
29.1
48.2
34.6
52.1
52.7
146.1
2.9
4.0
127.3
165.2
134.8
208.0
85.2
109.0
43.3
65.9
22.4
46.9
230.3
418.8
11.5
15.2
40.1
56.7
32.5
67.9
120
121

Sales of veterinary antimicrobial agents in 31 European countries in 2017Ninth ESVAC report44
Country 2010 2011 2012 2013 2014 2015 2016 2017 Trends 2010-2017
Switzerland 56.7 50.6 46.6 40.1
United Kingdom10 67.9 51.1 66.3 62.1 62.5 56.8 39.3 32.5
1 Corrections to sales data and/or PCU data published in the ESVAC 2016 report are described in Chapter 1.5. 2 Under-reported for Bulgaria for 2011, 2012 and 2014 as several wholesalers failed to report data.3 Strength reported as the base for most VMPs for 2011-2012 for Czechia; for 2013-2017, strength reported as in the label of the VMPs. 4 Strength reported as base for some VMPs for 2011-2012 for the Netherlands; for 2013-2017, strength reported as in the label of the VMPs.5 For Portugal, under-reporting has been identified for the years 2010-2014 and 2017.6 For Romania, 2014 data were updated as wholesalers initially failed to deliver all sales data.7 For Slovakia, the data for 2011 and 2012 represent only imported antimicrobial VMPs by wholesalers; from 2013, data represent all sales from wholesalers to end-users (veterinarians, pharmacies, producers of medicated feeding stuffs and farmers, obtained by import and from national manufacturers).8 For Spain, under-reporting has been identified for the years 2010 to 2013 and the data provider for 2017 data was changed from MAHs to retailers.9 For Sweden, underreporting of sales for use in farmed fish in 2017.10 For the UK, high sales of certain tetracycline-containing products late in 2010 were probably used in 2011 and thus their use has been underestimated for 2011.
46.1
62.9
131.3
180.1
82.9
155.3
71.5
108.6
391.5
453.4
61.2
94.4
39.4
47.5
56.7
77.1
18.6
22.7
68.6
136.0
89.0
211.5
57.2
93.9
187.1
269.9
4.6
7.0
46.5
55.9
273.8
421.1
29.9
41.5
29.1
48.2
34.6
52.1
52.7
146.1
2.9
4.0
127.3
165.2
134.8
208.0
85.2
109.0
43.3
65.9
22.4
46.9
230.3
418.8
11.5
15.2
40.1
56.7
32.5
67.9
120
121
Spain changed its system for collecting sales data in 2014 and in 2017, and it was noted that some of the highest-selling VMPs in 2014 had not been reported by MAHs between 2011 and 2013, even though these VMPs had been marketed during that period. Thus, sales data for Spain for 2011 to 2013 are most likely underestimated. Consumption of veterinary antimicrobials in Spain is one of the highest among the countries participating in ESVAC and the biomass of animals (PCU) is among the largest. Therefore, the observed changes in sales for these 25 countries from 2011 to 2017 should be interpreted with this in mind.

Sales of veterinary antimicrobial agents in 31 European countries in 2017Ninth ESVAC report45
Changes in sales (mg/PCU) across 2011-2016 aggregated by 25 countries
For the 25 countries reporting sales data to the ESVAC for each year from 2011 to 2017, an overall decrease of 32.5 % in sales (mg/PCU) was observed (Figure 24).
For the period 2011 to 2017, a drop in sales (in mg/PCU) of more than 5 % was observed for 19 of the 25 countries. For the same period, there was an increase in sales of over 5 % in three of the 25 countries (Table 8).
During 2011-2017, the sales (mg/PCU) of 3rd- and 4th-generation cephalosporins decreased by 20.9 %, sales of polymyxins decreased by 66.4 %, and sales of fluoroquinolones declined by 10.3 % and sales of other quinolones by 64.7%.
Figure 24. Changes in aggregated overall sales, as well as sales of fluoroquinolones, other quinolones, 3rd- and 4th-generation cephalosporins and polymyxins, for 25 EU/EEA countries1, from 2011 to 2017 (note the differences in the scales of the Y axes)
1 Austria, Belgium, Bulgaria, Cyprus, Czechia, Denmark, Estonia, Finland, France, Germany, Hungary, Iceland, Ireland, Italy, Latvia, Lithuania, Netherlands, Norway, Poland, Portugal, Slovakia, Slovenia, Spain, Sweden and United Kingdom.
0
2
4
6
8
10
12
14
16
18
0
20
40
60
80
100
120
140
160
180
80
100
120
140
160
180
2011 2012 2013 2014 2015
0.25
11.01
1.07
0.26
10.40
2.88
0.25
9.03
2.75
0.26
10.60
2.99
0.24
9.58
2.76
162.0
152.4
146.9156.2 140.8
Changes by 25 EU/EEA countries, 2011-2017
mg/
PCU
mg/
PCU
128.7
0.21
2.70
6.62
2016 2017
3rd- and 4th-gen. cephalosporins Polymyxins
Fluoroquinolones
Total salesin mg/PCU
Other quinolones
2.54
0.90 0.67 0.64 0.53 0.42 0.380.19
2.28
3.70
109.3

Sales of veterinary antimicrobial agents in 31 European countries in 2017Ninth ESVAC report46
For those 25 countries delivering data from 2011 to 2017, a decrease in sales of all antimicrobial classes has been observed, with the exception of amphenicols and lincosamides (Figure 25). During the period 2011 to 2017, the decline in three most-selling antimicrobial classes – tetracyclines, penicillins and sulfonamides – was 44 %, 18 % and 46 %, respectively.
Figure 25. Changes in aggregated sales (mg/PCU) by antimicrobial class in 25 EU/EEA countries1, from 2011 to 2017
1 Austria, Belgium, Bulgaria, Cyprus, Czechia, Denmark, Estonia, Finland, France, Germany, Hungary, Iceland, Ireland, Italy, Latvia, Lithuania, Netherlands, Norway, Poland, Portugal, Slovakia, Slovenia, Spain, Sweden and United Kingdom.*Other antibacterials (classified as such in the ATCvet system).
Tetracyclines
Amphenicols
Penicillins
1st- and 2nd-gen.cephalosporins
3rd- and 4th-gen.cephalosporins
Sulfonamides
Trimethoprim
Macrolides
Lincosamides
Fluoroquinolones
Other quinolones
Aminoglycosides
Polymyxins
Pleuromutilins
Others*
mg/PCU
0 10 20 30 40 50 60
2011 2012 2013 2014 2015 2016 2017

Sales of veterinary antimicrobial agents in 31 European countries in 2017Ninth ESVAC report47
2.7.1.3. Changes in sales by antimicrobial class in mg/PCU, by country
Sales of tetracyclines, a class of antimicrobials with a high volume of sales for veterinary use, are shown in Figure 26. The sales of doxycycline are also presented separately (Figure 27) because of the lower dosing used in the treatment of animals compared to other tetracyclines. Therefore, an increase in the sales of doxycycline could be associated with a reduction in total sales of tetracyclines.
Figure 26. Changes in sales of tetracyclines for food-producing species, in mg/PCU, by country, from 2010 to 20171
1 Sales in Iceland, Norway and Sweden ≤1 mg/PCU in any of the years.
AustriaBelgiumBulgariaCroatiaCyprusCzechia
DenmarkEstoniaFinlandFrance
GermanyGreece
HungaryIcelandIreland
ItalyLatvia
LithuaniaLuxembourg
MaltaNetherlands
NorwayPoland
PortugalRomaniaSlovakiaSlovenia
SpainSweden
SwitzerlandUnited Kingdom
0 20 40 60 80 100 120 140 160 180 200
mg/PCUTetracyclines
2010 2011 2012 2013 2014 2015 2016 2017
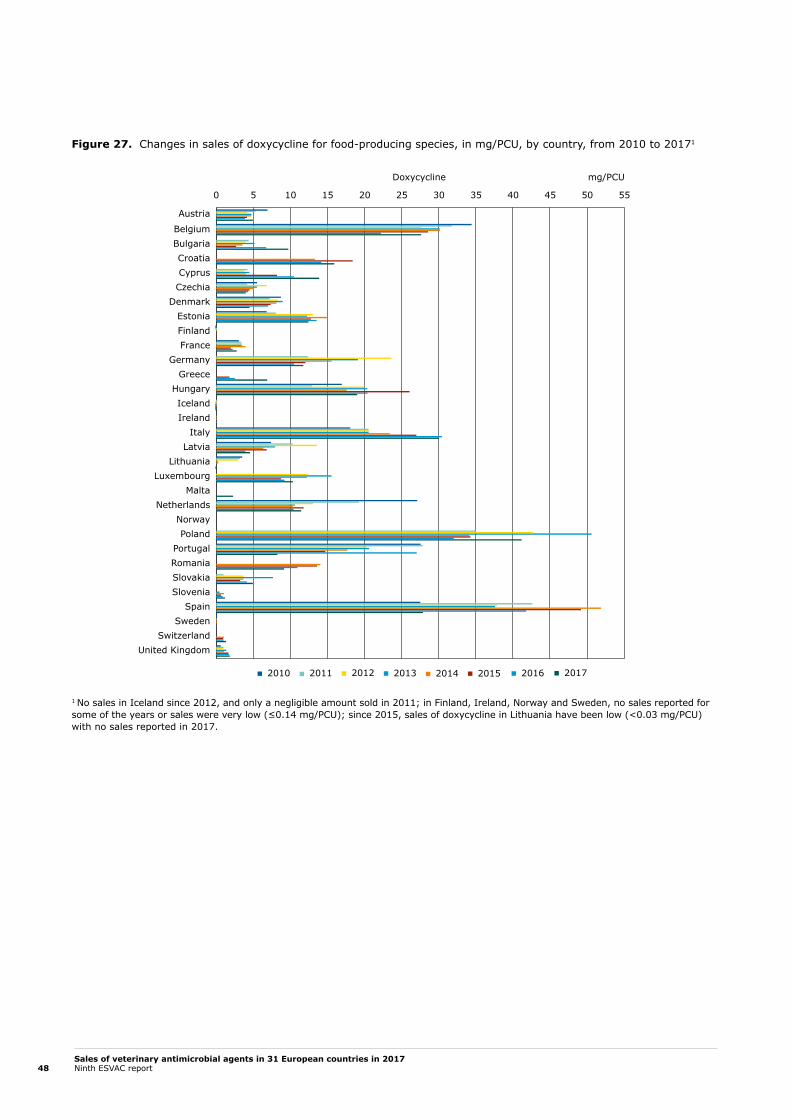
Sales of veterinary antimicrobial agents in 31 European countries in 2017Ninth ESVAC report48
Figure 27. Changes in sales of doxycycline for food-producing species, in mg/PCU, by country, from 2010 to 20171
1 No sales in Iceland since 2012, and only a negligible amount sold in 2011; in Finland, Ireland, Norway and Sweden, no sales reported for some of the years or sales were very low (≤0.14 mg/PCU); since 2015, sales of doxycycline in Lithuania have been low (<0.03 mg/PCU) with no sales reported in 2017.
0 5 10 15 20 25 30 35 40 45 50 55
mg/PCUDoxycycline
Austria
BelgiumBulgariaCroatiaCyprusCzechia
DenmarkEstoniaFinlandFrance
GermanyGreece
HungaryIcelandIreland
ItalyLatvia
LithuaniaLuxembourg
MaltaNetherlands
NorwayPoland
PortugalRomaniaSlovakiaSlovenia
SpainSweden
SwitzerlandUnited Kingdom
2010 2011 2012 2013 2014 2015 2016 2017

Sales of veterinary antimicrobial agents in 31 European countries in 2017Ninth ESVAC report49
Figure 28. Changes in sales of penicillins for food-producing species, in mg/PCU, by country, from 2010 to 2017
0 20 40 60 80 100
mg/PCUPenicillins
Austria
BelgiumBulgariaCroatiaCyprusCzechia
DenmarkEstoniaFinlandFrance
GermanyGreece
HungaryIcelandIreland
ItalyLatvia
LithuaniaLuxembourg
MaltaNetherlands
NorwayPoland
PortugalRomaniaSlovakiaSlovenia
SpainSweden
SwitzerlandUnited Kingdom
2010 2011 2012 2013 2014 2015 2016 2017

Sales of veterinary antimicrobial agents in 31 European countries in 2017Ninth ESVAC report50
Figure 29. Changes in sales of sulfonamides for food-producing species, in mg/PCU, by country, from 2010 to 20171
1 Negligible sales in Iceland and Norway (<1mg/PCU) in any of the years.
Tables 9 to 11 and Figures 30 and 31 highlight critically important antimicrobials with the highest priority for humans, as defined by WHO, and antimicrobial classes belonging to the AMEG Category 2. More details on the selection of antimicrobial classes of WHO HP CIAs and AMEG Category 2 are provided in Annex 5, Table A16.
0 20 40 60 80 100
mg/PCUSulfonamides
Austria
BelgiumBulgariaCroatiaCyprusCzechia
DenmarkEstoniaFinlandFrance
GermanyGreece
HungaryIcelandIreland
ItalyLatvia
LithuaniaLuxembourg
MaltaNetherlands
NorwayPoland
PortugalRomaniaSlovakiaSlovenia
SpainSweden
SwitzerlandUnited Kingdom
2010 2011 2012 2013 2014 2015 2016 2017

Sales of veterinary antimicrobial agents in 31 European countries in 2017Ninth ESVAC report51
Table 9. Changes in sales of 3rd- and 4th-generation cephalosporins for food-producing species, in mg/PCU, by country, from 2010 to 20171. Note that the scale differs between countries.
Country 2010 2011 2012 2013 2014 2015 2016 2017 Trends 2010-2017
Austria 0.3 0.3 0.3 0.3 0.2 0.2 0.2 0.2
Belgium 0.5 0.5 0.5 0.5 0.5 0.4 0.3 0.1
Bulgaria 0.05 0.03 0.1 0.1 0.2 0.1 0.1
Croatia 0.1 0.2 0.2 0.2
Cyprus 0.2 0.5 0.5 0.8 0.3 0.7 0.4
Czechia 0.4 0.3 0.3 0.4 0.4 0.4 0.4 0.5
Denmark 0.05 0.03 0.03 0.02 0.02 <0.01 <0.01 <0.01
Estonia 0.4 0.5 0.6 0.7 0.6 0.6 0.7 0.8
Finland <0.01 0.02 0.03 0.02 0.02 0.01 <0.01 <0.01
France 0.3 0.3 0.3 0.3 0.3 0.2 0.1 0.02
Germany 0.4 0.4 0.4 0.4 0.4 0.4 0.4
Greece 0.1 0.1 0.1
Hungary 0.3 0.1 0.3 0.3 0.2 0.4 0.4 0.5
Iceland <0.01 0.01 <0.01 <0.01 <0.01 <0.01 <0.01 <0.01
Ireland 0.1 0.1 0.1 0.1 0.1 0.1 0.1 0.1
0.180
0.348
0.10000
0.50651
0.03000
0.19937
0.1274
0.2100
0.17000
0.78842
0.28000
0.46696
0.00692
0.05000
0.36000
0.82546
0.00103
0.02892
0.01557
0.31373
0.38000
0.44363
0.09000
0.10955
0.14000
0.45056
0.00125
0.01039
0.05973
0.14000
0.35108
0.40148
0.21567
0.40071
0.02191
0.17741
0.59358
0.73252
0.00030
0.00066
0.09114
0.24241
0.24023
0.57443
0.03920
0.16084
0.34533
0.65319
0.08589
0.16809
0.23394
0.67404
0.00274
0.01918
0.15649
0.21878
0.10805
0.21372
0.24054
0.24054
0.00031
0.23021
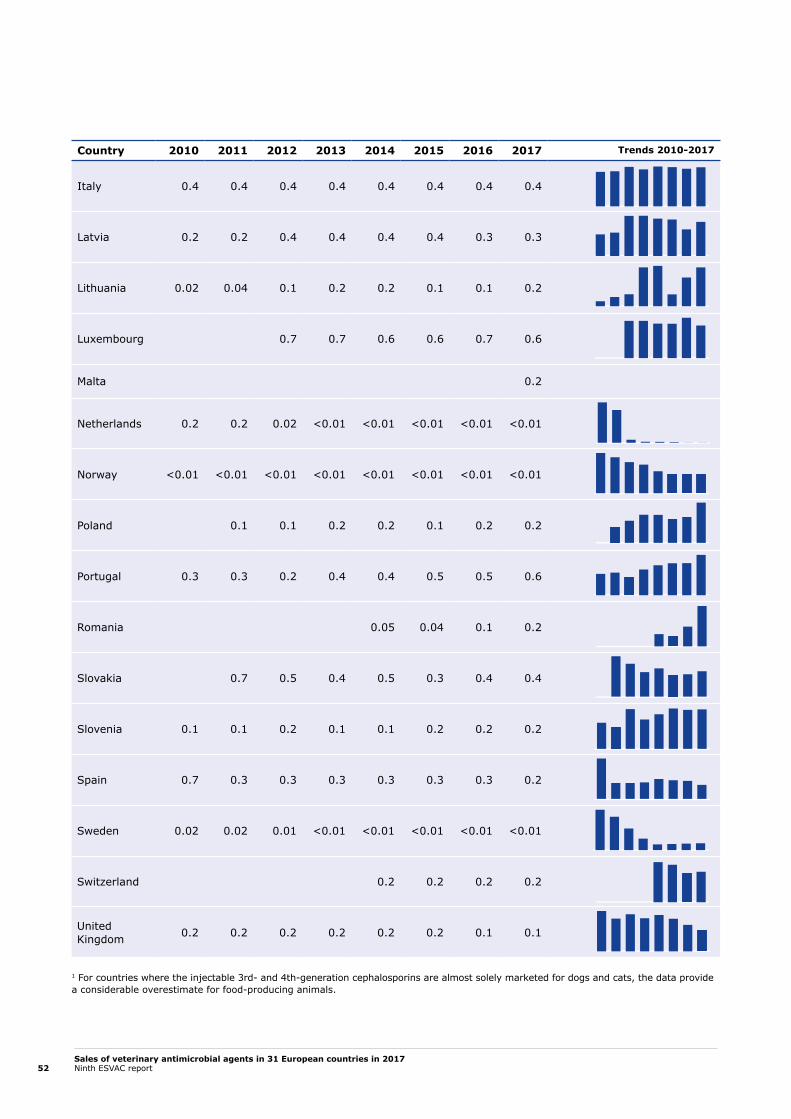
Sales of veterinary antimicrobial agents in 31 European countries in 2017Ninth ESVAC report52
Country 2010 2011 2012 2013 2014 2015 2016 2017 Trends 2010-2017
Italy 0.4 0.4 0.4 0.4 0.4 0.4 0.4 0.4
Latvia 0.2 0.2 0.4 0.4 0.4 0.4 0.3 0.3
Lithuania 0.02 0.04 0.1 0.2 0.2 0.1 0.1 0.2
Luxembourg 0.7 0.7 0.6 0.6 0.7 0.6
Malta 0.2
Netherlands 0.2 0.2 0.02 <0.01 <0.01 <0.01 <0.01 <0.01
Norway <0.01 <0.01 <0.01 <0.01 <0.01 <0.01 <0.01 <0.01
Poland 0.1 0.1 0.2 0.2 0.1 0.2 0.2
Portugal 0.3 0.3 0.2 0.4 0.4 0.5 0.5 0.6
Romania 0.05 0.04 0.1 0.2
Slovakia 0.7 0.5 0.4 0.5 0.3 0.4 0.4
Slovenia 0.1 0.1 0.2 0.1 0.1 0.2 0.2 0.2
Spain 0.7 0.3 0.3 0.3 0.3 0.3 0.3 0.2
Sweden 0.02 0.02 0.01 <0.01 <0.01 <0.01 <0.01 <0.01
Switzerland 0.2 0.2 0.2 0.2
United Kingdom 0.2 0.2 0.2 0.2 0.2 0.2 0.1 0.1
1 For countries where the injectable 3rd- and 4th-generation cephalosporins are almost solely marketed for dogs and cats, the data provide a considerable overestimate for food-producing animals.
0.180
0.348
0.10000
0.50651
0.03000
0.19937
0.1274
0.2100
0.17000
0.78842
0.28000
0.46696
0.00692
0.05000
0.36000
0.82546
0.00103
0.02892
0.01557
0.31373
0.38000
0.44363
0.09000
0.10955
0.14000
0.45056
0.00125
0.01039
0.05973
0.14000
0.35108
0.40148
0.21567
0.40071
0.02191
0.17741
0.59358
0.73252
0.00030
0.00066
0.09114
0.24241
0.24023
0.57443
0.03920
0.16084
0.34533
0.65319
0.08589
0.16809
0.23394
0.67404
0.00274
0.01918
0.15649
0.21878
0.10805
0.21372
0.24054
0.24054
0.00031
0.23021
0.180
0.348
0.10000
0.50651
0.03000
0.19937
0.1274
0.2100
0.17000
0.78842
0.28000
0.46696
0.00692
0.05000
0.36000
0.82546
0.00103
0.02892
0.01557
0.31373
0.38000
0.44363
0.09000
0.10955
0.14000
0.45056
0.00125
0.01039
0.05973
0.14000
0.35108
0.40148
0.21567
0.40071
0.02191
0.17741
0.59358
0.73252
0.00030
0.00066
0.09114
0.24241
0.24023
0.57443
0.03920
0.16084
0.34533
0.65319
0.08589
0.16809
0.23394
0.67404
0.00274
0.01918
0.15649
0.21878
0.10805
0.21372
0.24054
0.24054
0.00031
0.230210.180
0.348
0.10000
0.50651
0.03000
0.19937
0.1274
0.2100
0.17000
0.78842
0.28000
0.46696
0.00692
0.05000
0.36000
0.82546
0.00103
0.02892
0.01557
0.31373
0.38000
0.44363
0.09000
0.10955
0.14000
0.45056
0.00125
0.01039
0.05973
0.14000
0.35108
0.40148
0.21567
0.40071
0.02191
0.17741
0.59358
0.73252
0.00030
0.00066
0.09114
0.24241
0.24023
0.57443
0.03920
0.16084
0.34533
0.65319
0.08589
0.16809
0.23394
0.67404
0.00274
0.01918
0.15649
0.21878
0.10805
0.21372
0.24054
0.24054
0.00031
0.23021
0.180
0.348
0.10000
0.50651
0.03000
0.19937
0.1274
0.2100
0.17000
0.78842
0.28000
0.46696
0.00692
0.05000
0.36000
0.82546
0.00103
0.02892
0.01557
0.31373
0.38000
0.44363
0.09000
0.10955
0.14000
0.45056
0.00125
0.01039
0.05973
0.14000
0.35108
0.40148
0.21567
0.40071
0.02191
0.17741
0.59358
0.73252
0.00030
0.00066
0.09114
0.24241
0.24023
0.57443
0.03920
0.16084
0.34533
0.65319
0.08589
0.16809
0.23394
0.67404
0.00274
0.01918
0.15649
0.21878
0.10805
0.21372
0.24054
0.24054
0.00031
0.23021

Sales of veterinary antimicrobial agents in 31 European countries in 2017Ninth ESVAC report53
Country 2010 2011 2012 2013 2014 2015 2016 2017 Trends 2010-2017
Austria 0.6 0.6 0.5 0.6 0.5 0.5 0.5 0.5
Belgium 0.7 0.8 0.9 1.0 1.1 1.0 0.6 0.2
Bulgaria 5.0 6.1 6.8 1.8 5.3 4.9 5.7
Croatia 3.5 3.3 2.6 1.9
Cyprus 0.5 0.8 0.9 0.9 1.1 1.6 2.4
Czechia 1.3 1.5 1.8 1.8 1.8 1.7 1.7 1.9
Denmark <0.01 <0.01 <0.01 <0.01 <0.01 <0.01 <0.01 <0.01
Estonia 2.5 2.3 1.1 1.7 1.6 1.8 1.3 1.3
Finland 0.2 0.2 0.2 0.2 0.2 0.1 0.1 0.1
France 0.7 0.6 0.6 0.6 0.6 0.3 0.2 0.2
Germany 0.9 1.2 1.4 1.4 1.1 1.0 1.1
Greece 1.7 2.2 2.7
Hungary 8.8 6.7 11.0 9.2 9.1 9.5 9.6 8.8
Iceland <0.01 <0.01 <0.01 <0.01 <0.01 <0.01 <0.01 <0.01
Ireland 0.4 0.4 0.6 0.5 0.4 0.4 0.5 0.4
0.000
0.602
0.000
1.106
0.000
6.781
0.00
3.52
0.000
2.395
0.000
1.895
0.000
0.008
0.000
2.545
0.000
0.178
0.00000
0.65565
0.0
1.4
0.0
2.7
0
11
0.0000
0.0078
0.00000
0.57185
0.00000
3.09789
0.00000
4.11682
0.000
3.145
0.00000
0.81266
0.0000
0.0116
0.0000
11.0786
0
0.000
6.138
0.0000
4.2032
0.0000
5.9388
0.0000
10.2314
0.000
0.133
0.0000
0.4715
0.0000
0.3582
0.00000
14.25794
0.0000
0.5456
0.000
0.602
0.000
1.106
0.000
6.781
0.00
3.52
0.000
2.395
0.000
1.895
0.000
0.008
0.000
2.545
0.000
0.178
0.00000
0.65565
0.0
1.4
0.0
2.7
0
11
0.0000
0.0078
0.00000
0.57185
0.00000
3.09789
0.00000
4.11682
0.000
3.145
0.00000
0.81266
0.0000
0.0116
0.0000
11.0786
0
0.000
6.138
0.0000
4.2032
0.0000
5.9388
0.0000
10.2314
0.000
0.133
0.0000
0.4715
0.0000
0.3582
0.00000
14.25794
0.0000
0.5456
Table 10. Changes in sales of fluoroquinolones for food-producing species, in mg/PCU, by country, from 2010 to 2017. Note that the scale differs between countries.

Sales of veterinary antimicrobial agents in 31 European countries in 2017Ninth ESVAC report54
Country 2010 2011 2012 2013 2014 2015 2016 2017 Trends 2010-2017
Italy 1.7 2.2 2.5 2.3 3.1 2.9 2.3 3.0
Latvia 4.1 2.2 1.7 2.1 1.6 1.1 0.8 1.1
Lithuania 0.7 0.4 0.6 0.8 3.1 1.7 1.0 0.8
Luxembourg 0.7 0.8 0.7 0.7 0.8 0.7
Malta 14.3
Netherlands 0.5 0.5 0.2 0.1 0.1 0.1 0.1 0.1
Norway 0.01 0.01 <0.01 <0.01 <0.01 <0.01 <0.01 <0.01
Poland 7.2 8.2 8.8 9.0 8.6 9.7 11.1
Portugal 5.6 8.4 9.3 8.2 11.4 8.8 8.9 3.6
Romania 5.3 6.1 3.3 4.3
Slovakia 3.0 3.2 2.8 4.2 2.9 3.6 3.4
Slovenia 2.6 5.9 4.1 1.8 4.0 3.0 2.9 2.9
Spain 8.8 9.2 10.2 9.3 9.9 9.0 8.5 4.9
Sweden 0.1 0.1 0.1 0.04 0.03 0.02 0.02 0.02
Switzerland 0.5 0.5 0.3 0.3
United Kingdom 0.3 0.3 0.3 0.4 0.4 0.3 0.2 0.2
0.000
0.602
0.000
1.106
0.000
6.781
0.00
3.52
0.000
2.395
0.000
1.895
0.000
0.008
0.000
2.545
0.000
0.178
0.00000
0.65565
0.0
1.4
0.0
2.7
0
11
0.0000
0.0078
0.00000
0.57185
0.00000
3.09789
0.00000
4.11682
0.000
3.145
0.00000
0.81266
0.0000
0.0116
0.0000
11.0786
0
0.000
6.138
0.0000
4.2032
0.0000
5.9388
0.0000
10.2314
0.000
0.133
0.0000
0.4715
0.0000
0.3582
0.00000
14.25794
0.0000
0.5456
0.000
0.602
0.000
1.106
0.000
6.781
0.00
3.52
0.000
2.395
0.000
1.895
0.000
0.008
0.000
2.545
0.000
0.178
0.00000
0.65565
0.0
1.4
0.0
2.7
0
11
0.0000
0.0078
0.00000
0.57185
0.00000
3.09789
0.00000
4.11682
0.000
3.145
0.00000
0.81266
0.0000
0.0116
0.0000
11.0786
0
0.000
6.138
0.0000
4.2032
0.0000
5.9388
0.0000
10.2314
0.000
0.133
0.0000
0.4715
0.0000
0.3582
0.00000
14.25794
0.0000
0.5456

Sales of veterinary antimicrobial agents in 31 European countries in 2017Ninth ESVAC report55
Figure 30. Changes in sales of quinolones (fluoroquinolones and other quinolones) for food-producing species, in mg/PCU, by country, from 2010 to 20171
1 In Austria, Denmark, Finland, Iceland, Ireland, Norway, Sweden, Switzerland and United Kingdom, combined sales of fluoroquinolones and other quinolones were <1mg/PCU in any of the years.
0 2 4 6 8 10 12 14 16
mg/PCUQuinolones
Austria
BelgiumBulgariaCroatiaCyprusCzechia
DenmarkEstoniaFinlandFrance
GermanyGreece
HungaryIcelandIreland
ItalyLatvia
LithuaniaLuxembourg
MaltaNetherlands
NorwayPoland
PortugalRomaniaSlovakiaSlovenia
SpainSweden
SwitzerlandUnited Kingdom
2010 2011 2012 2013 2014 2015 2016 2017
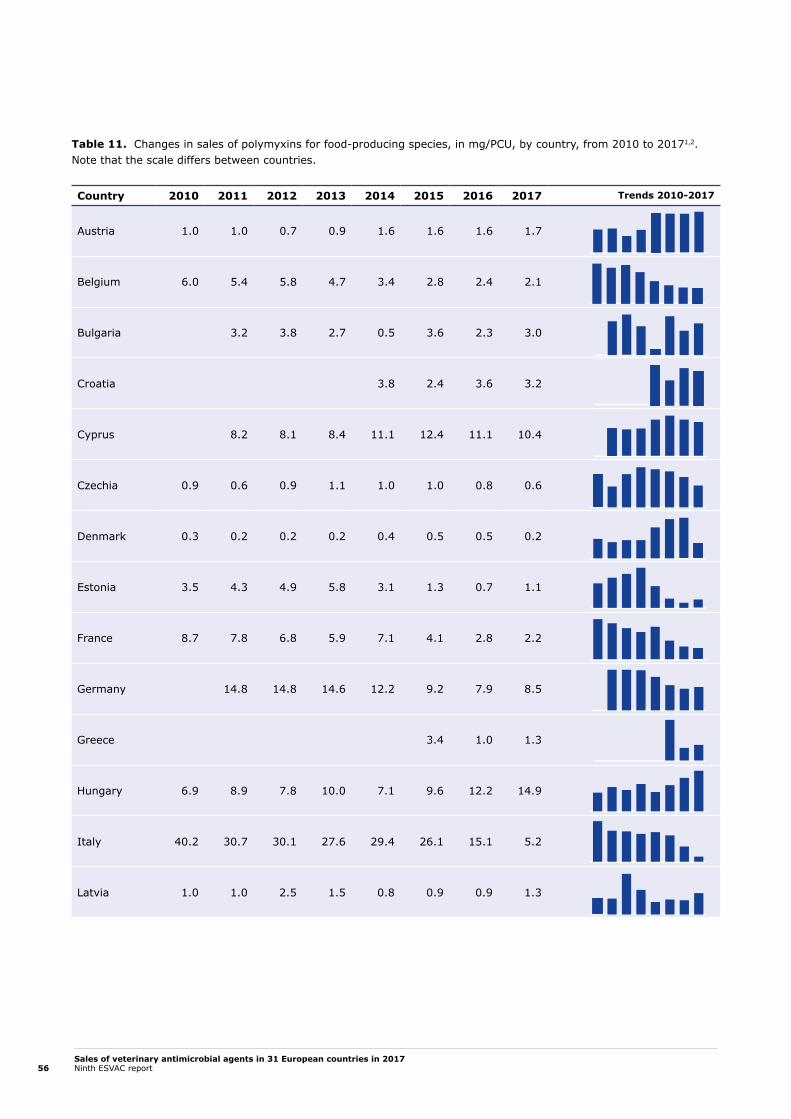
Sales of veterinary antimicrobial agents in 31 European countries in 2017Ninth ESVAC report56
Country 2010 2011 2012 2013 2014 2015 2016 2017 Trends 2010-2017
Austria 1.0 1.0 0.7 0.9 1.6 1.6 1.6 1.7
Belgium 6.0 5.4 5.8 4.7 3.4 2.8 2.4 2.1
Bulgaria 3.2 3.8 2.7 0.5 3.6 2.3 3.0
Croatia 3.8 2.4 3.6 3.2
Cyprus 8.2 8.1 8.4 11.1 12.4 11.1 10.4
Czechia 0.9 0.6 0.9 1.1 1.0 1.0 0.8 0.6
Denmark 0.3 0.2 0.2 0.2 0.4 0.5 0.5 0.2
Estonia 3.5 4.3 4.9 5.8 3.1 1.3 0.7 1.1
France 8.7 7.8 6.8 5.9 7.1 4.1 2.8 2.2
Germany 14.8 14.8 14.6 12.2 9.2 7.9 8.5
Greece 3.4 1.0 1.3
Hungary 6.9 8.9 7.8 10.0 7.1 9.6 12.2 14.9
Italy 40.2 30.7 30.1 27.6 29.4 26.1 15.1 5.2
Latvia 1.0 1.0 2.5 1.5 0.8 0.9 0.9 1.3
0.000
1.693
0.000
5.972
0.0000
3.7514
0.000
3.808
0.000
12.372
0.0000
1.1041
0.000
0.541
0.000
0.541
0.0000
5.7515
0.0000
8.7161
0.0000
14.8377
0.0000
3.3668
0.,0000
14.8758
0.0000
40.1755
0.0000
2.5481
0.0000
1.7421
0.0000
3.1201
0.0000
7.4811
0.0000
18.9943
0.0000
7.4394
0.0000
2.1301
0.0000
0.1439
0.0000
36.1013
0,0000
0,9491
0,000
0,125
0.0000
4.5984
0.000
2.289
0.000
1.693
0.000
5.972
0.0000
3.7514
0.000
3.808
0.000
12.372
0.0000
1.1041
0.000
0.541
0.000
0.541
0.0000
5.7515
0.0000
8.7161
0.0000
14.8377
0.0000
3.3668
0.,0000
14.8758
0.0000
40.1755
0.0000
2.5481
0.0000
1.7421
0.0000
3.1201
0.0000
7.4811
0.0000
18.9943
0.0000
7.4394
0.0000
2.1301
0.0000
0.1439
0.0000
36.1013
0,0000
0,9491
0,000
0,125
0.0000
4.5984
0.000
2.289
Table 11. Changes in sales of polymyxins for food-producing species, in mg/PCU, by country, from 2010 to 20171,2. Note that the scale differs between countries.

Sales of veterinary antimicrobial agents in 31 European countries in 2017Ninth ESVAC report57
Country 2010 2011 2012 2013 2014 2015 2016 2017 Trends 2010-2017
Lithuania 1.7 1.4 1.3 0.1 0.1 0.6 1.0 0.7
Luxembourg 1.7 3.1 2.4 1.5 1.0 1.0
Malta 4.6
Netherlands 2.3 1.6 1.0 0.6 0.5 0.5 0.3 0.3
Poland 4.2 4.0 4.4 5.0 5.9 5.6 7.5
Portugal 15.1 7.9 18.6 19.0 17.6 14.6 13.5 10.9
Romania 6.5 7.4 5.6 4.1
Slovakia 1.2 2.1 1.1 1.5 1.1 1.2 1.7
Slovenia 0.1 0.1 0.1 0.04 0.1 0.1 0.1 0.1
Spain 33.0 33.5 29.4 21.5 36.1 34.9 22.0 4.4
Switzerland 0.9 0.6 0.5 0.4
United Kingdom 0.1 0.1 0.1 0.1 0.1 0.1 0.02 <0.01
1 No sales of polymyxins in Finland, Iceland and Norway for any of the years.2 For reasons of commercial confidentiality, sales of polymyxins in Ireland and Sweden (≤0.1 mg/PCU in any of the years) are not included in this table.
0.000
1.693
0.000
5.972
0.0000
3.7514
0.000
3.808
0.000
12.372
0.0000
1.1041
0.000
0.541
0.000
0.541
0.0000
5.7515
0.0000
8.7161
0.0000
14.8377
0.0000
3.3668
0.,0000
14.8758
0.0000
40.1755
0.0000
2.5481
0.0000
1.7421
0.0000
3.1201
0.0000
7.4811
0.0000
18.9943
0.0000
7.4394
0.0000
2.1301
0.0000
0.1439
0.0000
36.1013
0,0000
0,9491
0,000
0,125
0.0000
4.5984
0.000
2.289
0.000
1.693
0.000
5.972
0.0000
3.7514
0.000
3.808
0.000
12.372
0.0000
1.1041
0.000
0.541
0.000
0.541
0.0000
5.7515
0.0000
8.7161
0.0000
14.8377
0.0000
3.3668
0.,0000
14.8758
0.0000
40.1755
0.0000
2.5481
0.0000
1.7421
0.0000
3.1201
0.0000
7.4811
0.0000
18.9943
0.0000
7.4394
0.0000
2.1301
0.0000
0.1439
0.0000
36.1013
0,0000
0,9491
0,000
0,125
0.0000
4.5984
0.000
2.289
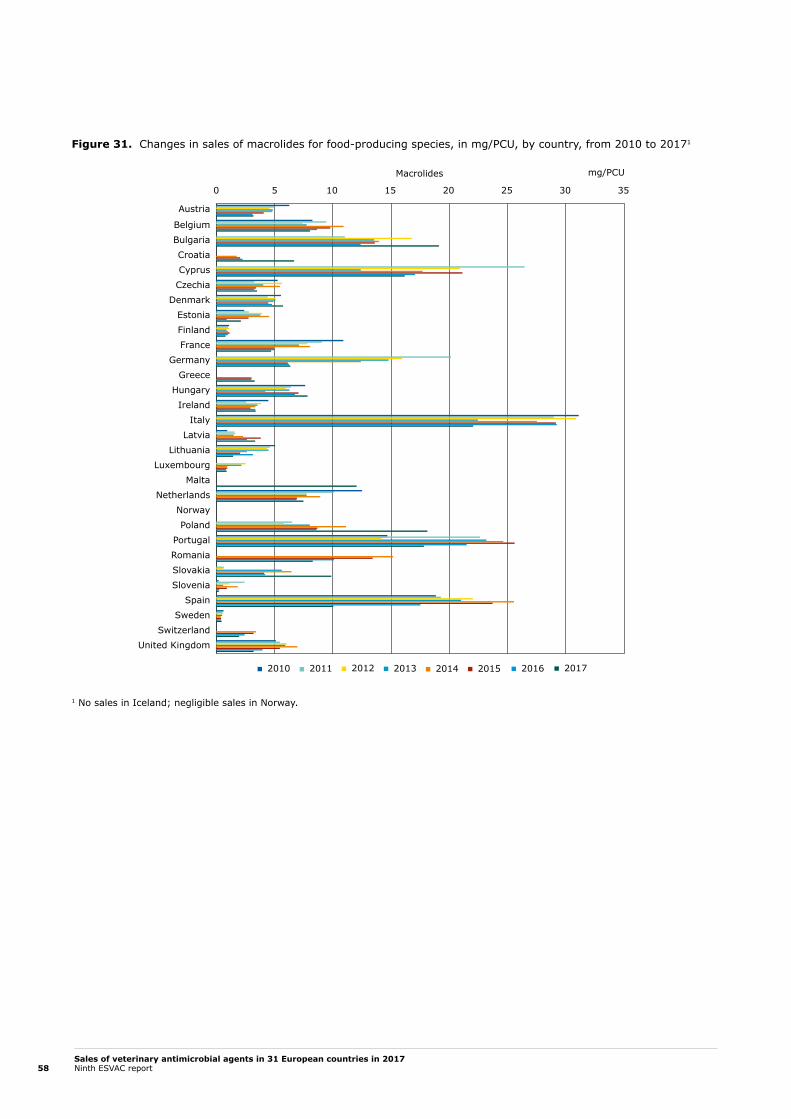
Sales of veterinary antimicrobial agents in 31 European countries in 2017Ninth ESVAC report58
0 5 10 15 20 25 30 35
mg/PCUMacrolides
Austria
BelgiumBulgariaCroatiaCyprusCzechia
DenmarkEstoniaFinlandFrance
GermanyGreece
HungaryIreland
ItalyLatvia
LithuaniaLuxembourg
MaltaNetherlands
NorwayPoland
PortugalRomaniaSlovakiaSlovenia
SpainSweden
SwitzerlandUnited Kingdom
2010 2011 2012 2013 2014 2015 2016 2017
Figure 31. Changes in sales of macrolides for food-producing species, in mg/PCU, by country, from 2010 to 20171
1 No sales in Iceland; negligible sales in Norway.

Sales of veterinary antimicrobial agents in 31 European countries in 2017Ninth ESVAC report59
0 1,000 2,000 3,000 4,000 5,000 6,000 7,000 8,000 9,000
PCU (1,000 tonnes)
Austria
BelgiumBulgariaCroatiaCyprusCzechia
DenmarkEstoniaFinlandFrance
GermanyGreece
HungaryIcelandIreland
ItalyLatvia
LithuaniaLuxembourg
MaltaNetherlands
NorwayPoland
PortugalRomaniaSlovakiaSlovenia
SpainSweden
SwitzerlandUnited Kingdom
2010 2011 2012 2013 2014 2015 2016 2017
2.7.1.4. Changes in the denominator (PCU) by country
From 2010 to 2017, the PCU (estimated weight at treatment of livestock and slaughtered animals) was relatively stable for most countries (Figure 32).
For three of the 25 countries (Iceland, Ireland and Poland) that provided data for at least five years, an increase of more than 10 % was observed in the PCU, while a decrease of more than 10 % was seen in Cyprus and Italy.
Figure 32. Changes in the denominator (PCU) for food-producing animals, in 1,000 tonnes, by country, between 2010 to 2017

Sales of veterinary antimicrobial agents in 31 European countries in 2017Ninth ESVAC report60
3. DiscussionIn the EU, the use of antimicrobials for growth promotion has been banned since 2006, therefore the data sets provided to ESVAC represent exclusively sales of antimicrobial agents sold as veterinary medicinal products.
Depending on the source of the data, countries requested data on sales to end-users or asked the national data providers to exclude sales among data sources (for example, between wholesalers). Consequently, it is assumed that double reporting has been avoided.
In 2017, all countries provided sales data except Denmark and Sweden, which submitted prescription data.
It should be noted that in all the participating countries, antimicrobial agents have a ‘prescription only’ status.
According to Directive 2001/82/EC of the European Parliament and of the Council of 6 November 2001 on the Community code relating to veterinary medicinal products22, all veterinary medicinal products, including veterinary antimicrobial agents, must be sold through distributors authorised by the competent authority in each country. This enabled all participating countries to identify all distributors of antimicrobial VMPs in their country, allowing for 100 % data-source coverage. Thus, it is reasonable to assume that the data presented in this report provide a good overview of the total sales of antimicrobial agents in the 31 participating countries.
The national sales data (numerator) cover all food-producing species, including horses, which are considered as food-producing species according to EU legislation. Thus, the animal population ‘at risk’ of being treated with antimicrobial agents (denominator) includes all food-producing species. However, as the use of antimicrobial agents in the various animal species varies considerably, interpretation of the data should take into account distribution of the PCU value between the species in the various countries. It should also be emphasised that the PCU represents a technical unit of measurement only and is not a real value for the animal population that could potentially be treated with antimicrobial agents.
In the current report, data presented on sales of veterinary antimicrobial agents for companion animals are based solely on the sales of tablets. For countries with a relatively low number of dogs and cats, the market for antimicrobial VMPs in the form of tablets is typically low. It is anticipated that in such countries, the proportion of human antimicrobial agents used under the ‘cascade’ could account for a higher proportion of antimicrobials used in companion animals than in countries with a high number of dogs and cats. Furthermore, injectable antimicrobial VMPs are used in both food-producing animals (including horses) and companion animals. Therefore, the data on sales of veterinary antimicrobial agents for companion animals presented in this report are likely to represent an underestimate, while data on sales for food-producing animals are likely to be slightly overestimated.
Dosing of the various antimicrobial agents varies substantially between and within classes, as well as between animal species, sometimes by several orders of magnitute, as reflected by the DDDvet and DCDvet values published by EMA in 201623. For example, the dose for a whole treatment (DCDvet) with an oral fluoroquinolone VMP may vary between 10 and 40 mg/kg, differing between cattle, pigs and poultry, while for an oral tetracycline VMP this may vary between 110 and 280 mg/kg. This implies that a given amount of active ingredient of fluoroquinolone can be used to treat several times as many animals as the same amount of active ingredient of a tetracycline. Furthermore, within an antimicrobial class there may be different doses for different substances; for example, the dose of doxycycline is about one-quarter that of oxytetracycline. The daily dose can also vary between oral and parenteral forms. Another consideration is that the dosage may differ significantly according to species; for fish, a typical tetracycline dosage for a complete treatment is 800 mg/kg, nearly six times higher than for terrestrial animals. Since the data in this report cover all food-producing animals together, it was not possible to take into account differences in dosing when reporting the data. Considering the above-mentioned factors, it is evident that sales data do not reflect exposure of animals and frequency of treatment. Since sales patterns and animal demographics vary substantially between countries, comparison of sales data across the countries should be done with great care.
22 OJ L 311, 28.11.2001, p. 1. (https://eur-lex.europa.eu/legal-content/EN/TXT/PDF/?uri=OJ:L:2001:311:FULL&from=EN) 23 Available on the European Medicines Agency website (www.ema.europa.eu) via Home > Veterinary regulatory >Antimicrobial resistance
(https://www.ema.europa.eu/en/veterinary-regulatory/overview/antimicrobial-resistance/european-surveillance-veterinary-antimicrobial-consumption/standardised-units-measurement-veterinary-antimicrobials)

Sales of veterinary antimicrobial agents in 31 European countries in 2017Ninth ESVAC report61
The proportion of sales of small packages of oral powders and oral solutions, sufficient for treatment of only a single or a few animals, is very low compared to those suitable for group treatment; oral solutions and oral powders are typically used for group treatment. Thus, the data presented in this report on sales of oral powder and oral solutions are considered to be a reasonable estimate of sales of these forms for group treatment.
In Member States, antimicrobial medicinal products not authorised for veterinary administration may be used in companion and food-producing animals, based on the cascade principle described in Article 11 of Directive 2001/82/EC24, in the future according to Articles 107, 113 and 114 of Regulation (EC) 2019/625. Legislation includes provisions which, when no suitable authorised product is available and under exceptional circumstances, allow a veterinarian to use a veterinary medicinal product outside of its authorised conditions of use, or to use an unauthorised medicine, according to given criteria. Such sales are not included in this report.
Dermatological preparations (ATCvet group QD) and preparations for sensory organs (ATCvet group QS) were not included in the data collection. In 2016, these pharmaceutical forms represented, for example, only 0.2 % in Denmark, (L. Mie Jensen, unpublished data), 0.4 % in the Czechia (L.Pokludová, unpublished data), 0.52 % in France (A. Chevance, unpublished data), 0.002 % in Norway (https://www.vetinst.no/en/surveillance-programmes/norm-norm-vet-report) and 0.7 % in the United Kingdom (S. Brown, unpublished data) of the total tonnes sold. As the annual contribution from these groups of antimicrobial agents, in tonnes of active ingredients, to the total amounts is thought to be minimal, the effect of the deviation is considered negligible.
Injectable antimicrobial agents are used both in food-producing and companion animals. With the exception of some long-acting products, injection of antimicrobial agents in companion animals is generally limited to hospitalised animals or perioperative treatments. Data from Denmark and France for 2016 showed that approximately 1.1 % and 0.8 % of the injectable antimicrobial VMPs sold were used for dogs and cats, respectively (L. Mie Jensen and A. Chevance, unpublished data). Therefore, in this report, sales of injectable antimicrobials are assumed to be for use in food-producing species. For countries where injectable 3rd- and 4th-generation cephalosporins are almost solely marketed for dogs and cats, data provide a considerable overestimate of use in food-producing animals.
For 2017, 11 countries (Table 2) included veterinary antimicrobial agents obtained on special licence (use under exemption from marketing authorisation, i.e. obtained from another Member State and permitted to be marketed for specific animal species, although this type of procedure might differ among Member States) in the data sets. All these countries have a comparatively low number of antimicrobial veterinary medicinal products on the market (Annex 1, Table A7). Five of them – Cyprus, Czechia, Denmark, Norway and Slovenia – reported that the proportion of sales of antimicrobial VMPs on special licence accounted for approximately 15 %, <0.01 %, 0.1 %, 0.7 % and 7 % of the total sales, respectively.
It is important to note that the results presented in this report may differ from those presented in national reports because of differences, for example, in inclusion criteria for VMPs or in the reporting of data in the national surveillance systems. For instance, concentration of an antimicrobial ingredients may be reported as the moiety of a chemical compound in the national database, while for the ESVAC the strength of an ingredient is reported as given in the summary of product characteristics or labelling of the VMP, which typically is the salt (see references to national reports in Annex 7).
Despite the different factors noted above, ESVAC sales data can be considered as valid and important from the perspective of following trends in individual countries, especially in those with well-established and stable data-collection systems.
24 OJ L 311, 28.11.2001, p. 1 25 OJ L 4, 7.1.2019, p 43-167

Sales of veterinary antimicrobial agents in 31 European countries in 2017Ninth ESVAC report62
4. Concluding remarksVariations in reported sales (mg/PCU) and in sales patterns for 2017 between the 31 countries are likely to be due in part to differences in the composition of the animal population and in the production systems in various countries. Considerable variations also exist in terms of daily dose used for the various antimicrobial agents and the various pharmaceutical forms, as well as in terms of duration of treatment. In addition, differences in the selection of sales-data providers among countries may have an impact, although such an impact is thought to be minor. However, since these factors can only partly explain the differences in sales observed among the 31 countries, other factors must also be considered.
Since the sales data (numerator) for antimicrobial agents cover all food-producing species (including horses), the animal population ‘at risk’ of being treated with antimicrobial agents (denominator) includes most of the food-producing species. However, the use of antimicrobial agents in the various animal species varies considerably: for example, their use in extensive production systems is generally relatively low. Therefore, interpretation of the data should take into account the distribution of the PCU value between the species in the various countries.
Tentative explanations provided by some countries for the decline in sales include, among others, the implementation of responsible use campaigns, restrictions on use, increased awareness of the threat of antimicrobial resistance, and setting antimicrobial sales or use reduction targets or changes in animal demographics. Reduced sales of veterinary antimicrobials in some countries indicate the potential for a reduction in other countries, too.

Sales of veterinary antimicrobial agents in 31 European countries in 2017Ninth ESVAC report63
An
nex
1.
Ad
dit
ion
al t
able
s an
d c
har
ts
Cou
ntr
y
Tetracyclines
Amphenicols
Penicillins
1st- and 2nd-gen. cephalosporins
3rd- and 4th-gen. cephalosporins1
Sulfonamides
Trimethoprim
Macrolides
Lincosamides
Fluoroquinolones
Other quinolones
Aminoglycosides
Polymyxins
Pleuromutilins
Others2
Total tonnes
Aus
tria
24.9
0.4
8.2
0.05
0.2
3.4
0.7
3.1
0.1
0.5
01.
21.
60.
30.
244
.6
Bel
gium
56.5
3.1
83.2
0.4
0.2
36.9
7.4
13.6
5.0
0.4
0.2
1.0
3.6
0.9
8.8
221.
0
Bul
garia
17.1
3.0
9.2
<0.
010.
033.
00.
47.
22.
72.
10.
22.
31.
10.
80.
449
.6
Cro
atia
7.0
0.5
6.6
0.1
0.1
1.8
0.3
2.0
0.04
0.6
0.2
1.0
0.9
0.1
0.1
21.1
Cyp
rus
18.6
1.8
8.7
<0.
010.
043.
40.
71.
75.
80.
30.
050.
51.
12.
50.
345
.4
Cze
chia
13.0
0.9
12.0
0.2
0.3
7.5
0.8
2.4
0.1
1.3
<0.
011.
80.
43.
00.
244
.1
Den
mar
k19
.01.
528
.40.
10.
029.
21.
813
.82.
3<
0.01
0.6
5.2
0.5
8.8
3.2
94.4
Esto
nia
1.6
0.1
2.4
0.02
0.1
0.3
0.1
0.2
0.1
0.1
00.
40.
10.
70.
16.
3
Finl
and
2.3
0.1
4.5
0.01
<0.
011.
80.
40.
40.
30.
10
0.03
00.
010
9.8
Fran
ce18
8.5
5.4
65.7
1.4
0.1
90.2
16.0
33.2
2.6
1.1
3.3
49.8
15.6
4.2
5.7
482.
9
Ger
man
y19
8.7
5.4
296.
70.
53.
361
.07.
754
.710
.99.
30
16.4
73.5
16.4
12.0
766.
6
Gre
ece
59.2
0.8
23.1
<0.
010.
110
.31.
64.
10.
43.
34.
95.
41.
61.
20.
611
6.7
Hun
gary
59.9
3.0
36.0
0.1
0.3
5.4
1.1
6.0
2.8
6.8
0.1
2.3
11.5
11.5
0.3
147.
2
Icel
and
0.04
00.
40
<0.
010.
04<
0.01
00
<0.
010
0.1
00
00.
6
Irel
and3
41.5
3.0
20.5
0.6
0.3
16.8
1.2
7.2
0.3
0.8
05.
31.
098
.5
Ital
y30
4.8
23.1
271.
60.
71.
513
1.0
15.9
85.2
80.3
11.4
10.8
43.1
20.0
35.7
22.5
1,05
7.8
Latv
ia1.
50.
011.
50.
030.
10.
20.
040.
60.
020.
2<
0.01
0.6
0.2
0.8
0.1
5.9
Lith
uani
a1.
70.
14.
50.
020.
12.
40.
50.
50.
20.
3<
0.01
0.5
0.2
0.3
0.3
11.6
Luxe
mbo
urg
0.7
0.04
0.4
<0.
010.
030.
30.
10.
050.
020.
040
0.1
0.1
0.01
0.1
1.9
Mal
ta4
0.2
0.02
0.2
<0.
01<
0.01
0.2
0.02
0.2
<0.
010.
20.
10.
10.
40.
21.
8
Net
herlan
ds74
.44.
742
.10.
1<
0.01
28.8
5.3
25.0
0.2
0.2
3.2
1.6
1.0
0.9
0.5
188.
0
Nor
way
0.1
0.3
3.0
0<
0.01
1.4
0.3
<0.
01<
0.01
0.01
0.3
0.3
00.
04<
0.01
5.7
Pola
nd21
7.2
8.1
245.
60.
61.
132
.36.
582
.36.
750
.30.
121
.534
.038
.15.
374
9.6
Port
ugal
45.0
1.0
35.2
0.1
0.6
5.8
1.2
17.9
3.0
3.6
<0.
012.
711
.06.
31.
713
5.1
Rom
ania
73.2
11.5
52.9
0.02
0.5
7.9
1.6
24.2
18.3
12.6
0.6
31.8
12.0
14.1
1.7
262.
9
Slo
vaki
a4.
20.
12.
60.
10.
11.
40.
12.
20.
10.
8<
0.01
0.4
0.4
1.2
0.3
13.9
Slo
veni
a0.
80.
14.
10.
020.
030.
40.
10.
040.
020.
50
0.4
0.02
0.1
0.04
6.7
Spa
in48
5.2
47.8
449.
20.
21.
811
3.6
18.8
77.3
341.
037
.82.
693
.434
.157
.09.
71,
769.
5
Swed
en5
0.5
6.2
<0.
01<
0.01
1.6
0.3
0.4
<0.
010.
020.
020.
30.
29.
5
Switz
erla
nd6
6.9
0.4
8.9
0.1
0.1
10.2
0.6
1.6
0.2
02.
40.
30.
231
.9
Uni
ted
Kin
gdom
95.3
4.4
53.9
0.5
0.8
19.8
3.9
23.2
2.5
1.1
014
.6<
0.01
10.8
3.1
233.
9
Tota
l sal
es f
or
31
cou
ntr
ies
(mg
/PC
U)
2,0
19
.61
30
.91
,78
7.4
6.0
11
.86
08
.39
5.5
49
0.0
48
5.5
14
6.0
27
.13
06
.52
25
.02
16
.87
8.0
6,6
34
.4
1 Fo
r th
e co
untr
ies
whe
re in
ject
able
3rd
- an
d 4t
h-ge
n. c
epha
losp
orin
s ar
e al
mos
t so
lely
mar
kete
d fo
r do
gs a
nd c
ats,
the
dat
a pr
ovid
es a
con
side
rabl
e ov
eres
timat
e fo
r fo
od-p
rodu
cing
ani
mal
s.2 Ba
citr
acin
, fos
fom
ycin
, fur
alta
done
, met
roni
dazo
le, n
ovob
ioci
n, p
arom
omyc
in, r
ifaxi
min
and
spe
ctin
omyc
in (
clas
sifie
d as
‘Oth
er a
ntib
acte
rials
’ in
the
ATCve
t sy
stem
).
3 Po
lym
yxin
s an
d pl
euro
mut
ilins
are
agg
rega
ted
with
‘Oth
ers’
for
com
mer
cial
con
fiden
tialit
y re
ason
s.4 Fl
uoro
quin
olon
es a
nd o
ther
qui
nolo
nes
are
aggr
egat
ed fo
r co
mm
erci
al c
onfid
entia
lity
reas
ons.
5 Am
phen
icol
s, p
olym
yxin
s an
d pl
euro
mut
ilins
are
agg
rega
ted
with
‘Oth
ers’
for
com
mer
cial
con
fiden
tialit
y re
ason
s.6 Fo
r re
ason
s of
com
mer
cial
con
fiden
tialit
y, p
leur
omut
ilins
are
gro
uped
with
oth
ers
and
linco
sam
ides
are
gro
uped
with
mac
rolid
es.
Tab
le A
1. Sal
es,
in t
onne
s of
act
ive
ingr
edie
nt,
of v
eter
inar
y an
timic
robi
al a
gent
s ap
plic
able
mai
nly
for
food
-pro
duci
ng a
nim
als
by a
ntim
icro
bial
cla
ss (
pres
ente
d ac
cord
ing
to t
he A
TCve
t hi
erar
chic
al s
yste
m),
by
coun
try,
for
201
7 (t
able
ts n
ot in
clud
ed)

Sales of veterinary antimicrobial agents in 31 European countries in 2017Ninth ESVAC report64
Table A2. Distribution of sales, in mg/PCU, of veterinary antimicrobial agents applicable mainly for food-producing animals1, by administration route/form and country, for 2017
Cou
ntr
y
Pre
mix
Ora
l pow
der
Ora
l sol
uti
on
Inje
ctab
le
pre
p.
Ora
l pas
te
Bol
us
Intr
amam
-m
ary
pre
p.
Intr
aute
rin
e p
rep
.
Tota
l mg
/P
CU
Austria 1.4 32.4 5.4 6.0 0.1 0.2 1.1 0.1 46.8
Belgium 11.5 21.5 84.2 13.4 0.04 0.1 0.4 0.2 131.3
Bulgaria 43.5 15.2 58.7 14.1 0 0 0.7 0.1 132.3
Croatia 4.8 13.9 29.6 21.4 0 0.8 0.6 0.3 71.5
Cyprus 377.9 2.7 24.7 17.2 0.1 0.2 0.3 <0.01 423.1
Czechia 9.2 12.5 28.6 11.2 0.1 0.1 1.4 0.6 63.6
Denmark 0.4 3.7 19.5 15.0 0.6 <0.01 0.2 0.1 39.4
Estonia 0 2.8 33.2 18.8 0.04 0 1.7 0.2 56.7
Finland 3.1 4.4 <0.01 10.3 1.1 0 0.5 0 19.3
France 23.0 1.4 30.3 12.8 0.1 0.1 0.9 0.1 68.6
Germany 0.1 47.2 33.8 6.6 0.1 0.01 0.7 0.5 89.0
Greece 49.9 4.4 30.5 8.9 0 0 0.1 0.03 93.9
Hungary 97.2 3.7 81.4 7.5 0.02 0 0.5 0.6 191.0
Iceland 0.1 0.1 <0.01 4.0 0.1 0 0.3 0.1 4.6
Ireland 15.8 6.4 8.9 13.5 0.04 0.4 1.5 <0.01 46.6
Italy 104.1 0.7 145.2 22.9 0.2 <0.01 0.5 0.2 273.8
Latvia 0 4.4 15.3 11.3 <0.01 0 1.3 1.1 33.3
Lithuania 0.1 20.5 4.4 6.6 0 1.0 2.0 0.2 34.8
Luxembourg 0 17.4 6.0 10.3 0.1 0.04 0.8 0.3 35.0
Malta 48.8 6.6 47.9 13.8 1.4 0 2.1 0.5 121.0
Netherlands 0.4 2.6 44.1 8.2 0.3 0.02 0.5 0.1 56.3
Norway 0.3 0.1 0.1 1.8 0.7 0 0.1 0.05 3.1
Poland 4.0 17.2 134.3 8.9 0 0 0.6 0.2 165.2
Portugal 78.1 1.0 46.9 8.3 <0.01 <0.01 0.5 0.03 134.8
Romania 8.6 0.5 66.9 13.9 0 0 0.2 0.1 90.1
Slovakia 13.2 2.4 36.6 8.9 0.01 0 0.7 0.1 61.9
Slovenia 0.2 20.7 6.5 7.8 0 0 1.0 0.4 36.5
Spain 109.0 0 111.5 9.7 <0.01 <0.01 0.1 0.01 230.3
Sweden 0.2 0.05 0.7 9.3 1.5 0 0.2 <0.01 11.8
Switzerland 22.0 3.6 0.05 9.4 0.7 0.1 3.5 0.8 40.1
United Kingdom2 14.8 1.5 8.1 7.5 0.1 0.1 0.4 32.51 Injectable antimicrobial VMPs included are also used in companion animals; tablets not included.2 For commercial confidentiality reasons, intrauterine prep. are aggregated with intramammary prep.

Sales of veterinary antimicrobial agents in 31 European countries in 2017Ninth ESVAC report65
Tab
le A
3. Pe
rcen
tage
of sa
les,
in m
g/PC
U,
of p
rem
ixes
by
vete
rina
ry a
ntim
icro
bial
cla
ss (
acco
rdin
g to
ATC
vet
syst
em),
by
coun
try,
for
201
71,2
Cou
ntr
y
Tetracyclines
Amphenicols
Penicillins
Sulfonamides
Trimethoprim
Macrolides
Lincosamides
Quinolones
Aminoglycosides
Polymyxins
Pleuromutilins
Others3
Total mg/PCU premixes
Aus
tria
42%
0.2%
0%0%
0%56
%0%
0%0%
0%2%
0%1.
4Bel
gium
26%
1%59
%4%
1%5%
0.1%
0%0.
2%2%
1%0.
1%11
.5Bul
garia
52%
11%
0%3%
0%27
%0%
0%0.
02%
5%3%
0%43
.5Cro
atia
52%
2%0%
21%
0%3%
0.4%
12%
11%
0%0%
0%4.
8Cyp
rus
45%
4%17
%6%
1%4%
14%
0%0%
2%6%
0%37
7.9
Cze
chia
36%
0.1%
17%
16%
3%20
%0.
2%0%
0%1%
7%0.
2%9.
2
Den
mar
k0%
0%4%
63%
13%
0%0%
20%
0%0%
0%0%
0.4
Finl
and
59%
5%0%
1%0.
3%19
%15
%0%
0%0%
0%0%
3.1
Fran
ce51
%0%
5%24
%5%
4%0.
3%0.
1%8%
1%1%
0%23
.0G
erm
any
62%
0%13
%0%
0%9%
0%0%
0%1%
15%
0%0.
1G
reec
e73
%1%
9%10
%1%
1%0.
2%1%
0%1%
2%0.
01%
49.9
Hun
gary
59%
0.3%
12%
1%0.
3%3%
2%0%
0%13
%9%
0.1%
97.2
Icel
and
100%
0%0%
0%0%
0%0%
0%0%
0%0%
0%0.
1Ir
elan
d476
%0.
1%2%
9%2%
11%
0%0%
0.3%
1%15
.8It
aly
38%
1%23
%14
%1%
5%9%
1%1%
1%6%
1%10
4.1
Lith
uani
a0%
0%0%
0%0%
0%0%
0%0%
0%10
0%0%
0.1
Mal
ta8%
0%0%
0%0%
0%0%
0%0%
9%56
%28
%48
.8N
ethe
rlan
ds96
%0%
0%0.
1%0.
02%
4%0%
0%0%
0%0%
0%0.
4N
orw
ay0%
44%
0%0%
0%0%
0%56
%0%
0%0%
0%0.
3Po
land
20%
0.2%
18%
19%
4%30
%0%
0%0%
4%5%
0%4.
0Po
rtug
al42
%0.
1%14
%4%
1%18
%1%
0%1%
11%
7%1%
78.1
Rom
ania
29%
4%5%
2%0.
4%2%
1%1%
2%0%
51%
3%8.
6Slo
vaki
a74
%0.
2%4%
0%0%
1%0%
0%0%
1%20
%0%
13.2
Slo
veni
a0%
8%0%
0%0%
0%46
%1%
0%0%
0%46
%0.
2Spa
in35
%4%
28%
9%2%
5%5%
0.03
%6%
1%6%
0.1%
109.
0Sw
eden
50%
0%0%
0%75
%0%
16%
0%10
%0.
2
Switz
erla
nd6
31%
0%19
%37
%2%
8%0%
0%2%
1%22
.0U
nite
d Kin
gdom
55%
1%13
%9%
2%14
%0.
2%0%
1%0%
6%0.
1%14
.81
Neg
ligib
le a
mou
nt o
f flu
oroq
uino
lone
s is
incl
uded
in t
he t
able
tog
ethe
r w
ith o
ther
qui
nolo
nes.
2
No
sale
s of
pre
mix
es w
ere
repo
rted
in E
ston
ia,
Latv
ia a
nd L
uxem
bour
g.
3 Bac
itrac
in,
met
roni
dazo
le,
paro
mom
ycin
and
spe
ctin
omyc
in (
clas
sifie
d as
‘Oth
er a
ntib
acte
rial
s’ in
the
ATC
vet
syst
em).
4 Po
lym
yxin
s an
d pl
euro
mut
ilins
are
agg
rega
ted
with
‘Oth
ers’
for
com
mer
cial
con
fiden
tialit
y re
ason
s.5
Am
pehn
icol
s, p
olym
yxin
s an
d pl
euro
mut
ilins
are
agg
rega
ted
with
‘Oth
ers’
for
com
mer
cial
con
fiden
tialit
y re
ason
s.6
For
reas
ons
of c
onfid
entia
lity,
ple
urom
utili
ns a
re g
roup
ed w
ith o
ther
s an
d lin
cosa
mid
es a
re g
roup
ed w
ith m
acro
lides
.

Sales of veterinary antimicrobial agents in 31 European countries in 2017Ninth ESVAC report66
Tab
le A
4. Pe
rcen
tage
s of
sal
es,
in m
g/PC
U,
of o
ral p
owde
rs b
y an
timic
robi
al c
lass
(ac
cord
ing
to A
TCve
t sy
stem
), by
cou
ntry
, fo
r 20
171,
2
Cou
ntr
y
Tetracyclines
Amphenicols
Penicillins
Sulfonamides
Trimethoprim
Macrolides
Lincosamides
Quinolones
Aminoglycosides
Polymyxins
Pleuromutilins
Others3
Total mg/PCU oral powders
Aus
tria
71 %
0 %
12 %
7 %
1 %
3 %
0 %
0 %
0.3
%5
%1
%0
%32
.4Bel
gium
36 %
0 %
0 %
52 %
10 %
1 %
0 %
0.2
%0.
03 %
0 %
0.1
%0
%21
.5Bul
garia
44 %
0 %
36 %
8 %
0 %
0.2
%1
%7
%0
%2
%0.
1 %
2 %
15.2
Cro
atia
61 %
0 %
25 %
5 %
2 %
0 %
0 %
1 %
0 %
6 %
0 %
0 %
13.9
Cyp
rus
0 %
0 %
99 %
0 %
0 %
0 %
0.2
%0
%0
%0
%0
%0.
5 %
2.7
Cze
chia
69 %
0 %
2 %
13 %
2 %
2 %
0 %
0 %
4 %
0 %
7 %
1 %
12.5
Den
mar
k47
%1
%1
%18
%4
%14
%0
%5
%0.
4 %
0 %
11 %
0 %
3.7
Esto
nia
0 %
0 %
83 %
14 %
3 %
0 %
0 %
0 %
0 %
0 %
0 %
0 %
2.8
Finl
and
30 %
0 %
6 %
48 %
10 %
4 %
0 %
0 %
0 %
0 %
1 %
0.1
%4.
4Fr
ance
35 %
0 %
15 %
1 %
0 %
6 %
0 %
0 %
20 %
1 %
0 %
22 %
1.4
Ger
man
y19
%0.
03 %
47 %
11 %
1 %
1 %
0.4
%0
%1
%16
%3
%0.
01 %
47.2
Gre
ece
87 %
0 %
3 %
0 %
0 %
0 %
0 %
8 %
0 %
2 %
0 %
0 %
4.4
Hun
gary
53 %
0 %
46 %
0 %
0 %
1 %
0 %
0 %
0 %
0 %
0 %
0 %
3.7
Icel
and
0 %
0 %
69 %
0 %
0 %
0 %
0 %
0 %
31 %
0 %
0 %
0 %
0.1
Irel
and
67 %
0 %
9 %
22 %
1 %
0 %
1 %
0 %
0 %
0 %
0 %
0 %
6.4
Ital
y0
%9
%59
%0
%0
%7
%0
%0
%0
%0
%26
%0
%0.
7La
tvia
44 %
0 %
39 %
6 %
1 %
0 %
0 %
0 %
0 %
9 %
0 %
0 %
4.4
Lith
uani
a21
%0
%42
%22
%5
%0
%2
%0
%0
%3
%0.
2 %
4 %
20.5
Luxe
mbo
urg
66 %
0 %
8 %
16 %
3 %
0 %
0 %
0 %
0 %
5 %
1 %
0 %
17.4
Mal
ta15
%0
%30
%27
%4
%22
%0
%0
%1
%0
%0.
3 %
1 %
6.6
Net
herlan
ds30
%0
%34
%27
%6
%1
%1
%0
%0
%1
%0
%0
%2.
6N
orw
ay20
%0
%0
%66
%13
%0
%0
%0
%0
%0
%0
%0
%0.
1Po
land
29 %
0.01
%26
%1
%0.
1 %
6 %
2 %
0 %
2 %
23 %
11 %
0.2
%17
.2Po
rtug
al0
%0
%0
%76
%15
%2
%0
%0
%0
%0
%6
%0
%1.
0Ro
man
ia0
%0
%94
%0
%0
%0
%0
%0
%6
%0
%0
%0
%0.
5Slo
vaki
a45
%0
%1
%24
%0.
3 %
0 %
0 %
0 %
30 %
0 %
0 %
0 %
2.4
Slo
veni
a10
%0.
4 %
86 %
2 %
1 %
0 %
0 %
0 %
0 %
0 %
0 %
0 %
20.7
Swed
en16
%0
%0
%70
%14
%0
%0
%0
%0
%0
%0
%0
%0.
05Sw
itzer
land
0.1
%0
%0
%94
%3
%0
%0
%0
%3
%0
%0
%0
%3.
6U
nite
d Kin
gdom
36 %
0 %
8 %
46 %
9 %
2 %
0 %
0 %
0 %
0 %
0 %
0 %
1.5
1 N
eglig
ible
am
ount
of
1st-
and
2nd
-gen
. ce
phal
ospo
rins
sol
d is
incl
uded
with
oth
er a
ntib
acte
rial
s.
2 N
o sa
les
of o
ral p
owde
rs w
ere
repo
rted
in S
pain
. 3
Bac
itrac
in,
fura
ltado
ne,
met
roni
dazo
le,
paro
mom
ycin
and
spe
ctin
omyc
in (
clas
sifie
d as
‘Oth
er a
ntib
acte
rial
s’ in
the
ATC
vet
syst
em).
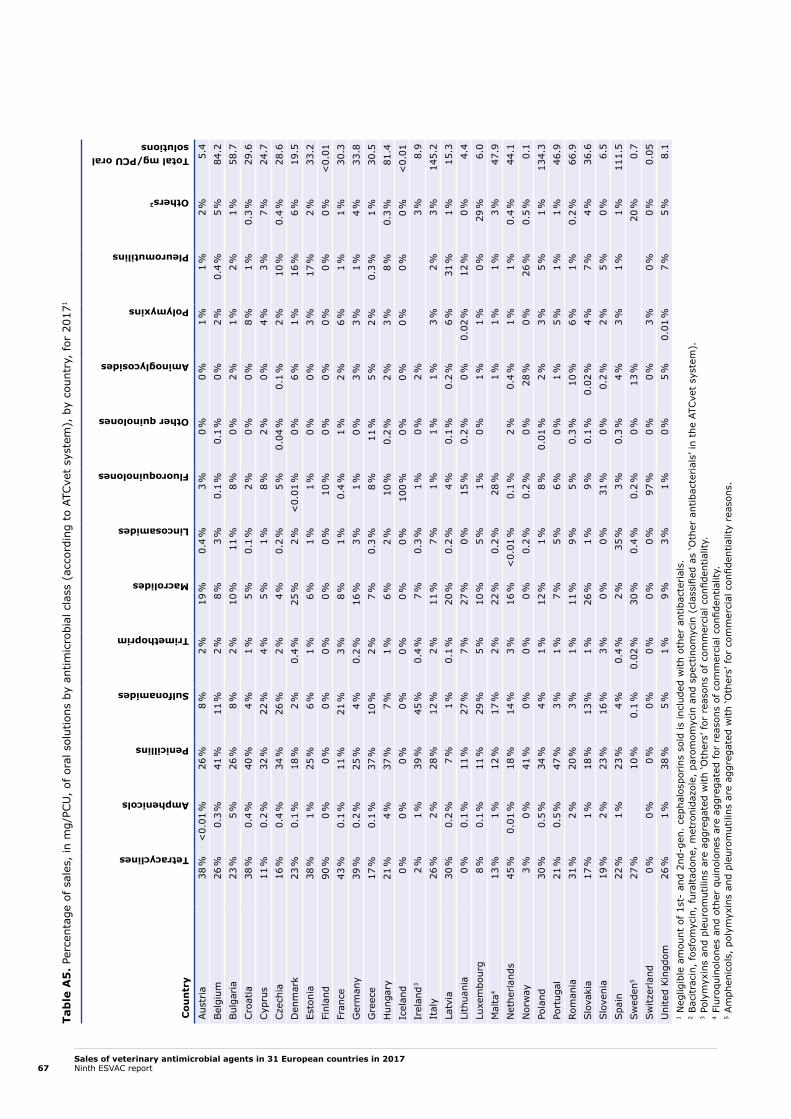
Sales of veterinary antimicrobial agents in 31 European countries in 2017Ninth ESVAC report67
Tab
le A
5. Pe
rcen
tage
of sa
les,
in m
g/PC
U,
of o
ral s
olut
ions
by
antim
icro
bial
cla
ss (
acco
rdin
g to
ATC
vet
syst
em),
by
coun
try,
for
201
71
Cou
ntr
y
Tetracyclines
Amphenicols
Penicillins
Sulfonamides
Trimethoprim
Macrolides
Lincosamides
Fluoroquinolones
Other quinolones
Aminoglycosides
Polymyxins
Pleuromutilins
Others2
Total mg/PCU oral solutions
Aus
tria
38 %
<0.
01 %
26 %
8 %
2 %
19 %
0.4
%3
%0
%0
%1
%1
%2
%5.
4Bel
gium
26 %
0.3
%41
%11
%2
%8
%3
%0.
1 %
0.1
%0
%2
%0.
4 %
5 %
84.2
Bul
garia
23 %
5 %
26 %
8 %
2 %
10 %
11 %
8 %
0 %
2 %
1 %
2 %
1 %
58.7
Cro
atia
38 %
0.4
%40
%4
%1
%5
%0.
1 %
2 %
0 %
0 %
8 %
1 %
0.3
%29
.6Cyp
rus
11 %
0.2
%32
%22
%4
%5
%1
%8
%2
%0
%4
%3
%7
%24
.7Cze
chia
16 %
0.4
%34
%26
%2
%4
%0.
2 %
5 %
0.04
%0.
1 %
2 %
10 %
0.4
%28
.6D
enm
ark
23 %
0.1
%18
%2
%0.
4 %
25 %
2 %
<0.
01 %
0 %
6 %
1 %
16 %
6 %
19.5
Esto
nia
38 %
1 %
25 %
6 %
1 %
6 %
1 %
1 %
0 %
0 %
3 %
17 %
2 %
33.2
Finl
and
90 %
0 %
0 %
0 %
0 %
0 %
0 %
10 %
0 %
0 %
0 %
0 %
0 %
<0.
01Fr
ance
43 %
0.1
%11
%21
%3
%8
%1
%0.
4 %
1 %
2 %
6 %
1 %
1 %
30.3
Ger
man
y39
%0.
2 %
25 %
4 %
0.2
%16
%3
%1
%0
%3
%3
%1
%4
%33
.8G
reec
e17
%0.
1 %
37 %
10 %
2 %
7 %
0.3
%8
%11
%5
%2
%0.
3 %
1 %
30.5
Hun
gary
21 %
4 %
37 %
7 %
1 %
6 %
2 %
10 %
0.2
%2
%3
%8
%0.
3 %
81.4
Icel
and
0 %
0 %
0 %
0 %
0 %
0 %
0 %
100
%0
%0
%0
%0
%0
%<
0.01
Irel
and3
2 %
1 %
39 %
45 %
0.4
%7
%0.
3 %
1 %
0 %
2 %
3 %
8.9
Ital
y26
%2
%28
%12
%2
%11
%7
%1
%1
%1
%3
%2
%3
%14
5.2
Latv
ia30
%0.
2 %
7 %
1 %
0.1
%20
%0.
2 %
4 %
0.1
%0.
2 %
6 %
31 %
1 %
15.3
Lith
uani
a0
%0.
1 %
11 %
27 %
7 %
27 %
0 %
15 %
0.2
%0
%0.
02 %
12 %
0 %
4.4
Luxe
mbo
urg
8 %
0.1
%11
%29
%5
%10
%5
%1
%0
%1
%1
%0
%29
%6.
0M
alta
413
%1
%12
%17
%2
%22
%0.
2 %
28 %
1 %
1 %
1 %
3 %
47.9
Net
herlan
ds45
%0.
01 %
18 %
14 %
3 %
16 %
<0.
01 %
0.1
%2
%0.
4 %
1 %
1 %
0.4
%44
.1N
orw
ay3
%0
%41
%0
%0
%0
%0.
2 %
0.2
%0
%28
%0
%26
%0.
5 %
0.1
Pola
nd30
%0.
5 %
34 %
4 %
1 %
12 %
1 %
8 %
0.01
%2
%3
%5
%1
%13
4.3
Port
ugal
21 %
0.5
%47
%3
%1
%7
%5
%6
%0
%1
%5
%1
%1
%46
.9Ro
man
ia31
%2
%20
%3
%1
%11
%9
%5
%0.
3 %
10 %
6 %
1 %
0.2
%66
.9Slo
vaki
a17
%1
%18
%13
%1
%26
%1
%9
%0.
1 %
0.02
%4
%7
%4
%36
.6Slo
veni
a19
%2
%23
%16
%3
%0
%0
%31
%0
%0.
2 %
2 %
5 %
0 %
6.5
Spa
in22
%1
%23
%4
%0.
4 %
2 %
35 %
3 %
0.3
%4
%3
%1
%1
%11
1.5
Swed
en5
27 %
10 %
0.1
%0.
02 %
30 %
0.4
%0.
2 %
0 %
13 %
20 %
0.7
Switz
erla
nd0
%0
%0
%0
%0
%0
%0
%97
%0
%0
%3
%0
%0
%0.
05U
nite
d Kin
gdom
26 %
1 %
38 %
5 %
1 %
9 %
3 %
1 %
0 %
5 %
0.01
%7
%5
%8.
11
Neg
ligib
le a
mou
nt o
f 1s
t- a
nd 2
nd-g
en.
ceph
alos
porins
sol
d is
incl
uded
with
oth
er a
ntib
acte
rial
s.
2 Bac
itrac
in,
fosf
omyc
in,
fura
ltado
ne,
met
roni
dazo
le,
paro
mom
ycin
and
spe
ctin
omyc
in (
clas
sifie
d as
‘Oth
er a
ntib
acte
rial
s’ in
the
ATC
vet
syst
em).
3
Poly
myx
ins
and
pleu
rom
utili
ns a
re a
ggre
gate
d w
ith ‘O
ther
s’ for
rea
sons
of co
mm
erci
al c
onfid
entia
lity.
4 Fl
uroq
uino
lone
s an
d ot
her
quin
olon
es a
re a
ggre
gate
d fo
r re
ason
s of
com
mer
cial
con
fiden
tialit
y.5
Am
phen
icol
s, p
olym
yxin
s an
d pl
euro
mut
ilins
are
agg
rega
ted
with
‘Oth
ers’
for
com
mer
cial
con
fiden
tialit
y re
ason
s.

Sales of veterinary antimicrobial agents in 31 European countries in 2017Ninth ESVAC report68
Tab
le A
6. Pe
rcen
tage
of sa
les,
in m
g/PC
U,
of in
ject
able
pre
para
tions
by
antim
icro
bial
cla
ss (
acco
rdin
g to
ATC
vet
syst
em),
by
coun
try,
for
201
7
Cou
ntr
y
Tetracyclines
Amphenicols
Penicillins
1st- and 2nd-gen. cephalosporins
3rd- and 4th-gen. cephalosporins1
Sulfonamides
Trimethoprim
Macrolides
Lincosamides
Quinolones2
Aminoglycosides
Polymyxins
Pleuromutilins
Others3
Total mg/PCU injectable prep.
Aus
tria
9 %
7 %
37 %
0.1
%3
%9
%2
%7
%1
%6
%19
%0
%0.
03 %
1 %
6.0
Bel
gium
5 %
11 %
57 %
1 %
0.4
%6
%1
%5
%3
%1
%4
%0.
2 %
0.03
%6
%13
.4Bul
garia
17 %
2 %
26 %
0.1
%1
%3
%1
%9
%2
%3
%34
%<
0.01
%1
%2
%14
.1Cro
atia
5 %
7 %
30 %
1 %
1 %
10 %
2 %
24 %
0.3
%6
%13
%0
%0.
02 %
1 %
21.4
Cyp
rus
14 %
6 %
36 %
0 %
2 %
7 %
1 %
1 %
2 %
3 %
24 %
0.1
%1
%3
%17
.2Cze
chia
16 %
11 %
41 %
2 %
4 %
4 %
1 %
2 %
0.2
%3
%16
%0
%1
%0.
04 %
11.2
Den
mar
k12
%4
%54
%0
%0.
04 %
13 %
3 %
2 %
3 %
<0.
01 %
7 %
0 %
1 %
1 %
15.0
Esto
nia
8 %
1 %
53 %
0.4
%4
%4
%1
%1
%1
%6
%17
%0
%3
%1
%18
.8Fi
nlan
d13
%0.
5 %
79 %
0 %
0.01
%5
%1
%0.
3 %
0.4
%1
%0,
2 %
0 %
0 %
0 %
10.3
Fran
ce11
%6
%33
%0.
1 %
0.1
%6
%1
%9
%1
%0.
2 %
32 %
1 %
0.03
%1
%12
.8G
erm
any
4 %
8 %
45 %
0 %
5 %
9 %
2 %
5 %
2 %
10 %
6 %
0.02
%1
%2
%6.
6G
reec
e25
%3
%27
%0
%1
%3
%1
%4
%1
%2
%31
%0.
03 %
0.1
%3
%8.
9H
unga
ry5
%10
%40
%0.
4 %
5 %
2 %
1 %
4 %
1 %
8 %
21 %
0.1
%1
%1
%7.
5Ic
elan
d7
%0
%76
%0
%0.
03 %
4 %
1 %
0 %
0 %
0.1
%13
%0
%0
%0
%4.
0Ir
elan
d424
%10
%32
%0.
1 %
1 %
6 %
1 %
8 %
0.2
%2
%15
%0.
4 %
13.5
Ital
y6
%7
%22
%0
%2
%7
%0.
4 %
5 %
2 %
4 %
37 %
0.2
%0.
4 %
5 %
22.9
Latv
ia7
%0.
4 %
44 %
1 %
3 %
7 %
1 %
3 %
0.4
%4
%28
%0
%0.
5 %
1 %
11.3
Lith
uani
a9
%5
%45
%0.
02 %
3 %
8 %
1 %
4 %
2 %
2 %
16 %
0 %
3 %
1 %
6.6
Luxe
mbo
urg
12 %
8 %
43 %
<0.
01 %
5 %
11 %
2 %
3 %
1 %
7 %
7 %
0.2
%0
%2
%10
.3M
alta
5 %
8 %
31 %
0 %
2 %
3 %
0.03
%0
%2
%14
%32
%0
%0
%4
%13
.8N
ethe
rlan
ds16
%17
%41
%0
%<
0.01
%17
%3
%2
%0
%0.
1 %
3 %
0.2
%0.
1 %
0 %
8.2
Nor
way
2 %
0.5
%85
%0
%0.
02 %
6 %
1 %
0.1
%0
%0.
3 %
5 %
0 %
0.2
%0
%1.
8Po
land
12 %
13 %
32 %
0.4
%3
%3
%0.
4 %
3 %
3 %
10 %
18 %
0.1
%1
%2
%8.
9Po
rtug
al22
%8
%21
%0.
3 %
4 %
4 %
1 %
7 %
1 %
6 %
22 %
0.03
%1
%2
%8.
3Ro
man
ia14
%15
%26
%0.
01 %
1 %
3 %
1 %
3 %
2 %
5 %
28 %
0.1
%0.
3 %
1 %
13.9
Slo
vaki
a15
%3
%45
%3
%4
%8
%2
%2
%0.
2 %
3 %
12 %
0 %
2 %
0.4
%8.
9Slo
veni
a6
%6
%34
%1
%2
%11
%3
%3
%0
%11
%25
%0.
04 %
0 %
0 %
7.8
Spa
in7
%16
%17
%0.
03 %
2 %
2 %
0.3
%17
%4
%20
%10
%0.
1 %
0.4
%5
%9.
7Sw
eden
55
%81
%0.
1 %
0.04
%8
%2
%1
%0.
1 %
0.2
%2
%0.
4 %
9.3
Switz
erla
nd6
11 %
5 %
43 %
0 %
2 %
8 %
1 %
2 %
2 %
26 %
<0.
01 %
1 %
9.4
Uni
ted
Kin
gdom
32 %
6 %
29 %
0.1
%1
%4
%1
%6
%0.
4 %
1 %
19 %
0 %
0.1
%0.
05 %
7.5
1 Fo
r th
e co
untr
ies
whe
re t
he in
ject
able
3rd
- an
d 4t
h-ge
n. c
epha
losp
orin
s ar
e al
mos
t so
lely
mar
kete
d fo
r do
gs a
nd c
ats
the
data
pro
vide
a c
onsi
dera
ble
over
estim
ate
for
food
-pro
duci
ng a
nim
als.
2 N
eglig
ible
am
ount
of o
ther
qui
nolo
nes
is in
clud
ed t
oget
her
with
fluo
roqu
inol
ones
.3 Sp
ectin
omyc
in (
clas
sifie
d as
‘Oth
er a
ntib
acte
rials
’ in
the
ATCve
t sy
stem
).4 Po
lym
yxin
s an
d pl
euro
mut
ilins
are
agg
rega
ted
with
‘Oth
ers’
for
reas
ons
of c
omm
erci
al c
onfid
entia
lity.
5 Am
phen
icol
s, p
olym
yxin
s an
d pl
euro
mut
ilins
are
agg
rega
ted
with
‘Oth
ers’
for
reas
ons
of c
omm
erci
al c
onfid
entia
lity.
6 Fo
r re
ason
s of
com
mer
cial
con
fiden
tialit
y, p
leur
omut
ilins
are
gro
uped
with
oth
ers
and
linco
sam
ides
are
gro
uped
with
mac
rolid
es.

Sales of veterinary antimicrobial agents in 31 European countries in 2017Ninth ESVAC report69
Table A7. Number of product presentations (product name, form, strength and pack size) containing 1, 2 and 3 antimicrobial agents sold, by country, for 2017 (tablets excluded from the data)
Country 1 ingredient 2 ingredients 3 ingredients Total number1
Austria 232 30 3 265
Belgium 309 45 6 360
Bulgaria 212 42 7 261
Croatia 126 21 3 155
Cyprus 112 23 3 138
Czechia 378 65 10 457
Denmark 196 46 7 249
Estonia 109 21 6 136
Finland 66 16 1 83
France 508 131 8 647
Germany 503 70 4 577
Greece 235 56 5 297
Hungary 322 45 7 375
Iceland 24 6 2 32
Ireland 247 48 6 302
Italy 578 100 12 691
Latvia 141 34 10 186
Lithuania 101 27 5 133
Luxembourg 186 44 7 237
Malta 85 46 6 139
Netherlands 183 45 3 231
Norway 47 16 2 65
Poland 532 63 11 607
Portugal 433 58 10 501
Romania 411 70 5 490
Slovakia 251 43 6 301
Slovenia 93 19 3 116
Spain 598 73 4 675
Sweden 93 21 1 115
Switzerland 139 41 35 215
United Kingdom 309 36 5 351
Total 31 countries 7,759 1,401 203 9,3871 In addition, 24 presentations contained 4 active ingredients (which are included in the total number), accounting for 0.3% of the product presentations in 31 countries.

Sales of veterinary antimicrobial agents in 31 European countries in 2017Ninth ESVAC report70
Table A8. Number of product presentations (product name, form, strength and pack size) of premixes, oral powders and oral solutions sold containing 1, 2 and 3 antimicrobial agents sold, by country, for 20171
Country 1 ingredient 2 ingredients 3 ingredients Total number of product
presentations for premixes, oral
powder and oral solution
Austria 85 9 94
Belgium 123 19 142
Bulgaria 122 16 138
Croatia 52 8 63
Cyprus 48 9 57
Czechia 184 35 2 221
Denmark 84 9 93
Estonia 28 4 32
Finland 21 3 24
France 279 60 339
Germany 222 32 254
Greece 120 21 141
Hungary 178 18 196
Iceland 4 4
Ireland 77 12 89
Italy 317 46 6 370
Latvia 37 5 42
Lithuania 37 5 42
Luxembourg 54 21 75
Malta 51 27 5 84
Netherlands 77 16 93
Norway 14 3 17
Poland 285 27 312
Portugal 170 19 189
Romania 244 18 1 265
Slovakia 103 18 2 123
Slovenia 29 8 37
Spain 337 17 354
Sweden 26 2 28
Switzerland 43 12 28 83
United Kingdom 134 15 149
Total 31 countries 3,585 514 44 4,1501 In addition, 7 preparations contained 4 active ingredients (which are included in the total number), accounting for 0.2% of the product presentations for premixes, oral powders and oral solutions in 31 countries.

Sales of veterinary antimicrobial agents in 31 European countries in 2017Ninth ESVAC report71
Table A9. Sales, in tonnes of active ingredient, of antimicrobial agents sold as premixes, oral powders and oral solutions containing 1, 2 and 3 active ingredients, by country, for 20171
Country 1 ingredient 2 ingredients 3 ingredients
Total tonnes for premixes,
oral powder
and oral solutionTonnes % Tonnes % Tonnes %
Austria 34.2 91 % 3.2 9 % 0 % 37.4Belgium 146.8 74 % 50.3 26 % 0 % 197.2Bulgaria 39.1 89 % 4.9 11 % 0 % 44.0Croatia 12.6 88 % 1.0 7 % 0 % 14.3Cyprus 38.2 88 % 5.3 12 % 0 % 43.5Czechia 28.2 81 % 6.0 17 % 0.7 2 % 34.8
Denmark 49.3 87 % 7.1 13 % 0 % 56.4Estonia 3.6 91 % 0.4 9 % 0 % 4.0Finland 2.5 65 % 1.3 35 % 0 % 3.8France 288.5 75 % 96.4 25 % 0 % 384.9Germany 643.9 92 % 54.0 8 % 0 % 697.8Greece 94.5 90 % 10.9 10 % 0 % 105.4Hungary 130.9 93 % 9.6 7 % 0 % 140.5Iceland 0.0 100 % 0 % 0 % 0.02Ireland 59.5 90 % 6.3 10 % 0 % 65.7Italy 699.3 72 % 249.7 26 % 16.6 2 % 965.9Latvia 3.4 97 % 0.1 3 % 0 % 3.5Lithuania 5.8 69 % 2.6 31 % 0 % 8.3Luxembourg 1.0 76 % 0.3 24 % 0 % 1.3Malta 1.3 89 % 0.1 9 % 0.04 2 % 1.5Netherlands 132.9 84 % 24.4 16 % 0 % 157.3Norway 0.8 88 % 0.1 12 % 0 % 0.9Poland 658.8 93 % 47.1 7 % 0 % 705.9Portugal 111.3 88 % 15.0 12 % 0 % 126.3Romania 211.2 95 % 9.7 4 % 0.8 0.3 % 221.7Slovakia 8.5 73 % 3.1 26 % 0.1 1 % 11.7Slovenia 4.6 92 % 0.4 8 % 0 % 5.0Spain 1,569.0 93 % 125.2 7 % 0 % 1,694.3Sweden 0.7 95 % 0.03 5 % 0 % 0.7Switzerland 5.7 28 % 4.7 23 % 10.0 49 % 20.4United Kingdom 152.0 87 % 23.3 13 % 0 % 175.3Total 31 countries 5,138.2 87 % 762.3 13 % 28.2 0.5 % 5,929.71 In addition, 0.02% of the total sales of premixes, oral powders and oral solutions preparations contained 4 active ingredients, accounting for 1.0 tonne (which is included in the total tonnes of premixes, oral powders and oral solutions).

Sales of veterinary antimicrobial agents in 31 European countries in 2017Ninth ESVAC report72
Figure A1. Distribution of sales of tetracyclines for food-producing animals, in mg/PCU, by the major pharmaceutical forms sold, aggregated by the 31 European countries, for 2017
* Other forms include boluses, oral pastes, intramammary and intrauterine preparations.
Figure A2. Distribution of sales of penicillins for food-producing animals, in mg/PCU, by the major pharmaceutical forms sold, aggregated by the 31 European countries, for 2017
* Other forms include boluses, oral pastes, intramammary and intrauterine preparations.
Figure A3. Distribution of sales of sulfonamides for food-producing animals, in mg/PCU, by the major pharmaceutical forms sold, aggregated by the 31 European countries, for 2017
* Other forms include boluses, oral pastes, intramammary and intrauterine preparations.
Tetracyclines
Premix
Oral powder
Oral solution
Injectable prep.
Other*
0.5%
39.0%
8.9%
47.7%
3.9%
Penicillins
Premix
Oral powder
Oral solution
Injectable prep.
Other*
1.3%
22.6%
13.3%
50.6%
12.1%
Sulfonamides
Premix
Oral powder
Oral solution
Injectable prep.
Other*
1.5%
34.2%
14.0%
43.5%
6.7%

Sales of veterinary antimicrobial agents in 31 European countries in 2017Ninth ESVAC report73
Figure A4. Distribution of sales of 3rd- and 4th-generation cephalosporins for food-producing animals, in mg/PCU, by the major pharmaceutical forms sold, aggregated by the 31 European countries, for 2017
Figure A5. Distribution of sales of quinolones for food-producing animals, in mg/PCU, by the major pharmaceutical forms sold, aggregated by the 31 European countries, for 2017
* Other forms include boluses, oral pastes and intrauterine preparations.
Figure A6. Distribution of sales of polymyxins for food-producing animals, in mg/PCU, by the major pharmaceutical forms sold, aggregated by the 31 European countries, for 2017
* Other forms include boluses and intramammary preparations.
Figure A7. Distribution of sales of macrolides for food-producing animals, in mg/PCU, by the major pharmaceutical forms sold, aggregated by the 31 European countries, for 2017
3rd- and 4th- generation cephalosporins
Injectable prep.
Intramammary prep.
87.4%
12.6%
Quinolones
Premix
Oral powder
Oral solution
Injectable prep.
Other*
2.7%0.1%
76.6%
19.9%0.8%
Polymyxins
Premix
Oral solution
Oral powder
Injectable prep.
Other*
0.1%
15.8%
38.4%
0.4%
45.3%
Macrolides
Premix
Oral powder
Oral solution
Injectable prep.
Intramammary prep.
0.02%
25.2%
63.3%
8.9%
2.6%

Sales of veterinary antimicrobial agents in 31 European countries in 2017Ninth ESVAC report74
Annex 2. Variables to be reported or used for calculation of active ingredient for each antimicrobial veterinary medicinal product; standardisation of the dataTable A10. Variables reported to the ESVAC for each antimicrobial veterinary medicinal product, for 2017
Variable Description of variable Justification
COUNTRY ISO code (http://www.iso.org/iso/country_codes) To identify place of collected sales data.
YEAR To identify time period for collected sales data.
MA Marketing authorisation number To allow for the unique identification of the veterinary medicinal product (VMP) and enable a link with other databases.To allow for market analysis if all the products are available.
PR
OD
UC
T IN
FOR
MA
TIO
N
ID Medicinal product package code valueDigit code is a unique identifier for each package size, strength and formulation of the VMP. Because it is a key variable in many databases, it must be stable over time, so that VMPs that are no longer available on the market or no longer registered can still be identified to enable the analysis of historical data.
To enable the analysis of historical data.To enable identification of duplicate reporting of sales.
NAME Medicinal product name (in national language)e.g. Harmony vet tablets 2 × 30; Harmony vet long-acting injection 10 ml.
For validation purposes.To allow, for example, for analysis of use of, for example, long-acting preparations and antimicrobial resistance.
FORM Pharmaceutical formBolus (BOLUS), Injection (INJ), Intramammary preparation (INTRAMAM), Intramammary preparation dry cow (INTRAMAM-DC), Oral solution (ORAL SOLU), Oral paste (ORAL PASTE), Oral powder (ORAL POWD), Premix (PREMIX), Capsules and Tablets, etc. (TABL), Intrauterine preparation (INTRAUT).
Important to avoid misinterpretation of pharmaceutical form if given in a language other than English.Allows for reporting of data as individual or group treatment.
LONG ACTING
Long-acting injectable preparationsThis refers to injectable preparations that, once injected, maintain their antimicrobial activity over a long period of time.
Optional.
PACKSIZE Content quantity in package: pack size (numerical only)e.g. 100 for 100 tablets or 100 intramammary prep.; 10 for 10 ml injection; package of 2 kg premix: 2; box of 10 blisters of 30 tablets: 300; box of 12 injectors: 12.
To enable calculation of the amount of active ingredient in each package/product.
PACKSIZEU Content unit of measuremente.g. ML, L, G, KG, PIECE (for example, for tablets, capsules, boluses and intramammary prep.).
To enable calculation of amount of active ingredient in each package/product.
ATCvet – 5th LEVEL
ATCvet: Anatomical Therapeutic Chemical (Classification) VeterinaryWHO ATCvet code last version to be used.
Generally, a classification system needs to have a common language when reporting use and analysing data with data on AMR, e.g. for 3rd- and 4th-generation cephalosporins. To have a common language for defining confidentiality of the data (can be converted into ATCvet 3rd level).

Sales of veterinary antimicrobial agents in 31 European countries in 2017Ninth ESVAC report75
Variable Description of variable Justification
SPECIES Animal speciesAll the animal species for which the VMP is approved, e.g. cattle (CA), poultry (POU).
Optional.
NO SOLD Number of packages sold/year/country To calculate weight of active ingredient sold.
ING
RED
IEN
T
INGR Active ingredient name (ATCvet name)In case of multi-ingredient VMP, the ATCvet names of all the ingredients must be given.
Important to avoid misinterpretation of ingredient name if given in a language other than English.Use of ATCvet names facilitates the identification of active ingredients as well as standardised reporting.
SALT Salt of active ingrediente.g. colistin sulfate and colistin methanesulfonate.
Only in cases when the strength is given in IU, IU/ML or IU/UNIT and when different salts exist, to allow for conversion to weight of active ingredient.
PRODRUG Prodrug name (ATCvet name)E.g. procaine penicillin which is the prodrug for benzylpenicillin.
Only in cases when a product contains a prodrug.
STRENGTH Quantity of the active ingredient in each unit as declared on SPC/label: strength (numerical only)e.g. 10 for 10 MG/TABLET, 10 IU/TABLET, 10 MG/ML, 10 IU/ML, 10 MG/PIECE or 10 IU/PIECE.In case of a multi-ingredient VMP, strength must be given for each ingredient separately.
To enable calculation of amount of active ingredient in each package/product and to validate INGR CONTENT.
STRENGTHU Unit of measurement for strengthe.g. IU, IU/G, IU/ML, IU/PIECE, G, G/KG, G/L, MG, MG/ML, MG/PIECE.In case of a multi-ingredient VMP, unit of measurement strength has to be given for each ingredient on a separate line.
To enable calculation of the amount of active ingredient in each package/product and to validate INGR CONTENT.
CONV FACT IU
Conversion factor IUWhen strength is given in IU, IU/ML or IU/PIECE.
When strength is only given as IU, IU/ML or IU/PIECE, to enable calculation of weight of the active ingredient in the package.
CONV FACT PRODR
Conversion factor prodrugUsed when strength is given for the prodrug and not for the active ingredient (e.g. procaine penicillin which is the prodrug for benzylpenicillin).
To enable calculation of the weight of the active ingredient in the package.
INGR CONTENT
Content of active ingredient in packageIn case of a multi-ingredient VMP, the content in the package has to be given separately for each ingredient on a separate line.
Optional: to enable validation of the ESVAC calculations.
CONT UNIT (G)
Unit of active ingredient in packageTo be given in grams (g) for all substances.In case of a multi-ingredient VMP, the content unit has to be given separately for each ingredient on a separate line.
Optional: to enable validation of the ESVAC calculations.
TONNES SOLD
Tonnes sold of active ingredient
For antimicrobial veterinary medicinal products containing more than one active ingredient, information on the active ingredient name, strength and strength unit must be given for each ingredient separately.

Sales of veterinary antimicrobial agents in 31 European countries in 2017Ninth ESVAC report76
Table A11. Conversion factors used to convert from international units (IU) to weight (mg) of active ingredient, based on WHO International Standards for Antibiotics1
Active ingredient IU/mg Conversion factor (mg/IU)
Bacitracin 74 0.01351
Benzylpenicillin (and prodrugs to benzylpenicillin)2 1,667 0.00060
Chlortetracycline3 900 0.00111
Colistin sulphate 20,500 0.00005
Colistin methane sulphonate4 12,700 0.00008
Dihydrostreptomycin 820 0.00122
Erythromycin 920 0.00109
Gentamicin 620 0.00161
Kanamycin 796 0.00126
Neomycin 755 0.00133
Framycetin 670 0.00149
Oxytetracycline 870 0.00115
Paromomycin3 675 0.00148
Polymyxin B 8,403 0.00012
Spiramycin 3,200 0.00031
Streptomycin 785 0.00127
Tetracycline 982 0.00102
Tobramycin 875 0.00114
Tylosin 1,000 0.001001 WHO International Standards for Antibiotics (ISA) – Reference Standards (https://crs.edqm.eu/db/4DCGI/search?vSelect-Name=4&vContains=1&vtUserName=ISA&OK=Search).2 Martindale (http://www.medicinescomplete.com/#/content/martindale/141-b).3 WHO Pharmacopoeia (http://apps.who.int/phint/en/p/docf/).4 WHO International Biological Reference Preparations (http://www.who.int/bloodproducts/catalogue/AntiJan10.pdf).
Table A12. Conversion factors used to convert from prodrug content to content of active ingredient1
Prodrug Conversion factor Active ingredient
Benethamine benzylpenicillin 0.65 Benzylpenicillin
Benzathine benzylpenicillin 0.74 Benzylpenicillin
Cefapirin benzathine 0.41 Cefapirin
Cefalexin benzathine 0.36 Cefalexin
Cloxacillin benzathine 0.43 Cloxacillin
Oxacillin benzathine 0.69 Oxacillin
Penethamate hydriodide 0.63 Benzylpenicillin
Procaine penicillin 0.61 Benzylpenicillin1 Martindale (http://www.medicinescomplete.com/#/content/martindale/141-b).

Sales of veterinary antimicrobial agents in 31 European countries in 2017Ninth ESVAC report77
Annex 3. Population correction unit (PCU)Table A13. Animal categories included in the calculation of the population correction unit (PCU) and data types to be reported
Animal category
Cattle (heads/number of animals)
Slaughtered cows
Slaughtered heifers
Slaughtered bullocks and bulls
Slaughtered calves and young cattle
Slaughtered bovine - Import
Slaughtered bovine - Export
Fattening bovine - Import
Fattening bovine - Export
Living dairy cows
Pigs (heads/number of animals)
Slaughtered pigs
Slaughtered pigs - Import
Slaughtered pigs - Export
Fattening pigs - Import
Fattening pigs - Export
Living sows
Poultry (heads/number of birds)
Slaughtered broilers
Slaughtered turkeys
Slaughtered poultry - Import
Slaughtered poultry - Export
Caprinae (heads/number of animals)
Slaughtered sheep and goats
Slaughtered sheep - Import
Slaughtered sheep - Export
Fattening sheep - Import
Fattening sheep - Export
Living sheep
Slaughtered goats - Import
Slaughtered goats - Export
Fattening goats - Import
Fattening goats - Export
Equidae (heads/number of animals)
Living horses
Rabbits (heads/number of animals)
Slaughtered rabbits
Fish (tonnes)
Biomass fish live weight of farmed fish produced

Sales of veterinary antimicrobial agents in 31 European countries in 2017Ninth ESVAC report78
Table A14. Weights used to calculate the population correction unit (PCU)
Animal category Weight in kg
Slaughtered or livestock (Eurostat)
Slaughtered cows 425
Slaughtered heifers 200
Slaughtered bullocks and bulls 425
Slaughtered calves and young cattle 140
Dairy cows 425
Slaughtered pigs 65
Living sows 240
Broilers 1
Turkeys 6.5
Slaughtered sheep and goats 20
Living sheep 75
Horses 400
Rabbits 1.4
Imported/exported for fattening or slaughter (TRACES data)
Slaughtered bovine 425
Fattening bovine 140
Slaughtered pigs 65
Fattening pigs 25
Slaughtered poultry 1
Slaughtered sheep 20
Fattening sheep 20
Slaughtered goats 20
Fattening goats 20

Sales of veterinary antimicrobial agents in 31 European countries in 2017Ninth ESVAC report79
Annex 4. List of antimicrobial classes/active ingredients reported in the ESVACTable A15 includes all the substances for which sales have been reported, divided by class or subclass. Note that in the ESVAC, sales are reported by classes/subclasses whether or not this refers to a single or a combination product – i.e. not by ATCvet classes. An exception to this is combinations of penicillins, including beta-lactamase inhibitors, which are included as the combination penicillins + beta-lactamase inhibitors reported as such in Figure 5.
Pharmacologically active substances that may be used in food-producing animals must be listed in Table 1 of the Annex to Commission Regulation (EU) No 37/2010. The table details, among others, the food-producing animal species for which those substances can be used. Table 2 of that annex contains substances that are prohibited for use in any food-producing species; some of these are included in Table A15 below because they are used in companion animals for which no maximum residue limits (MRLs) are required.
Table A15. List of substances reported sold in the ESVAC 2010-2017
Class/subclass Substances
Tetracyclines
Chlortetracycline Doxycycline Oxytetracycline
Tetracycline
Amphenicols
Chloramphenicol1 Florfenicol Thiamphenicol
Penicillins
Beta-lactamase-sensitive penicillins
Benzathine benzylpenicillin Benzathine phenoxymethylpenicillin
Benzylpenicillin
Penethamate hydriodide Phenoxymethylpenicillin Pheneticillin
Procaine benzylpenicillin
Beta-lactamase-resistant penicillins
Cloxacillin Dicloxacillin Nafcillin
Oxacillin
Penicillins with extended spectrum
Amoxicillin Ampicillin Metampicillin2
Combinations of penicillins with beta-lactamase inhibitors
Amoxicillin Ampicillin
Cephalosporins3
First-generation cephalosporins
Cefacetrile Cefadroxil2 Cefalexin
Cefalonium Cefapirin Cefazolin
Cefalotin

Sales of veterinary antimicrobial agents in 31 European countries in 2017Ninth ESVAC report80
Class/subclass Substances
Third-generation cephalosporins
Cefoperazone Cefovecin2 Ceftiofur
Fourth-generation cephalosporins
Cefquinome
Sulfonamides and trimethoprim
Sulfonamides
Formosulfathiazole Phthalylsulfathiazole Sulfacetamide
Sulfachlorpyridazine Sulfaclozine Sulfadiazine
Sulfamonomethoxine Sulfadimethoxine Sulfadimidine
Sulfadoxine Sulfafurazole Sulfaguanidine
Sulfalene Sulfamerazine Sulfamethizole
Sulfamethoxazole Sulfamethoxypyridazine Sulfanilamide
Sulfapyridine Sulfaquinoxaline Sulfathiazole
Sulfazuinoxaline
Trimethoprim and derivatives
Trimethoprim
Macrolides and lincosamides
Macrolides
Erythromycin Gamithromycin Oleandomycin
Spiramycin Tildipirosin Tilmicosin
Tulathromycin Tylosin Tylvalosin
Lincosamides
Clindamycin2 Lincomycin Pirlimycin
Aminoglycosides
Amikacin2 Apramycin Dihydrostreptomycin
Framycetin Gentamicin Kanamycin
Neomycin Streptomycin
Quinolones
Fluoroquinolones
Danofloxacin Difloxacin Enrofloxacin
Ibafloxacin2 Marbofloxacin Norfloxacin2
Orbifloxacin2 Pradofloxacin2
Other quinolones
Cinoxacin2 Flumequine Oxolinic acid
Imidazole derivatives
Metronidazole1

Sales of veterinary antimicrobial agents in 31 European countries in 2017Ninth ESVAC report81
Class/subclass Substances
Pleuromutilins
Tiamulin Valnemulin
Polymyxins
Colistin Polymyxin B2
Nitrofuran derivatives
Furazolidone1
Other antibacterials
Bacitracin Fosfomycin Furaltadone1
Natamycin Nitroxoline Novobiocin
Paromomycin Rifaximin Spectinomycin
1 Included in Table 2 (prohibited substances) of the Annex to Commission Regulation (EU) No 37/2010.2 MRLs not established for any food-producing species.3 MRLs not established for poultry (not allowed to be used).

Sales of veterinary antimicrobial agents in 31 European countries in 2017Ninth ESVAC report82
Annex 5. Selection of antimicrobial classes of WHO CIAs and AMEG Category 2 highlighted in the report The WHO list of critically important antimicrobials for human medicine26 and the list of antimicrobials categorised by the EU Antimicrobial Advice ad hoc Expert Group (AMEG)27,28 were used as a basis to select the classes of antimicrobials highlighted in this report. The classes/subclasses highlighted are those antimicrobials used in veterinary medicine that are categorised as highest priority in the WHO list of CIAs for human medicine and also belong to AMEG Category 1 or 2: 3rd- and 4th-generation cephalosporins, macrolides29, polymyxins and fluoroquinolones (Table A16).
Table A16. Antimicrobial classes highlighted in the report and their classification
Antimicrobial class AMEG classification WHO classification
3rd- and 4th-generation cephalosporins Category 2 Highest priority CIAs (3rd- and
higher-generation cephalosporins)
Fluoroquinolones and other quinolones
Category 2 (other quinolones not included) Highest priority CIAs
Macrolides Category 1 Highest priority CIAs
Polymyxins Category 2 Highest priority CIAs
AminoglycosidesProvisionally included in Category 2 (but no risk profiling has been provided)
CIAs
Certain penicillins (amoxicillin, ampicillin, metampicillin)
Provisionally included in Category 2 (but no risk profiling has been provided)
CIAs
Aminoglycosides and certain penicillins (aminopenicillins, i.e. amoxicillin, ampicillin and metampicillin) have been recently revised by the CVMP without suggesting a category for those groups of antimicrobials30. A revision of the classification of AMEG is currently ongoing and it is expected that updated scientific advice on AMEG on the categorisation of antimicrobials will be finalised by the end of 201931.
26 WHO Critically important antimicrobials for human medicine. 6th revision. (https://www.who.int/foodsafety/publications/antimicrobials-sixth/en/)
27 EMA/AMEG 2014. Answers to the request for scientific advice on the impact on public health and animal health of the use of antibiotics in animals (https://www.ema.europa.eu/en/documents/other/answers-requests-scientific-advice-impact-public-health-animal-health-use-antibiotics-animals_en.pdf)
28 EMA/AMEG 2016. Updated advice on the use of colistin products in animals within the European Union: development of resistance and possible impact on human and animal health (https://www.ema.europa.eu/en/documents/scientific-guideline/updated-advice-use-colistin-products-animals-within-european-union-development-resistance-possible_en-0.pdf)
29 According to the WHO classification, macrolides include also ketolides, which are not marketed in the EU/EEA countries for veterinary use.30 See the EMA website (www.ema.europa.eu): via Home> Veterinary regulatory> Research and development > Scientific guidelines >
Safety and residues > Antimicrobials (https://www.ema.europa.eu/en/veterinary-regulatory/research-development/scientific-guidelines/safety-residues/safety-residues-antimicrobials)
31 EC request for an update of the advice on the impact on public health and animal health of the use of antibiotics in animals: https://www.ema.europa.eu/en/documents/other/mandate-antimicrobial-advice-ad-hoc-expert-group-ameg_en.pdf

Sales of veterinary antimicrobial agents in 31 European countries in 2017Ninth ESVAC report83
Annex 6. Distribution of veterinary medicines; legal framework and data sources by countryAustria
Distribution of veterinary medicines
In Austria, all veterinary medicinal products (VMPs) are prescription-only medicines. They are dispensed by pharmaceutical companies or wholesalers to veterinarians. Only veterinarians are allowed to sell VMPs to farmers. Veterinarians must confirm the distribution of veterinary drugs to owners of food-producing animals and horses if used for food production. Distribution of VMPs to farmers is restricted to VMPs registered for topical or oral use. Distribution of VMPs for intramammary use or for systemic use (injection) and premixes is restricted to farms that are members of the Austrian Animal Health Service. Sales of VMPs by public pharmacies must be prescribed by a veterinarian; such sales are negligible for farm animals.
Legal basis for the monitoring of sales
The collection of sales data by pharmaceutical companies and wholesalers is based on the national law on animal drug control: BGBl. II Nr. 83/2014 Veterinär-Antibiotika-MengenströmeVO.
Data sources
Sales data have to be uploaded into the national database by those pharmaceutical companies either producing or importing VMPs, and by wholesalers assigned by the industry to distribute a product.
Belgium
Distribution of veterinary medicines
In Belgium, all VMPs containing antimicrobial agents are prescription-only medicines. This includes medicated premixes containing antimicrobial agents as pharmaceutically active substances.
VMPs (pharmaceutical formulation) are distributed through wholesaler-distributors to veterinarians and pharmacists; the wholesaler-distributor obtains the VMPs from a wholesaler or the authorised producer. Antimicrobial VMPs are only available to animal owners via delivery from a pharmacy, on veterinary prescription, or directly from the veterinarian.
Premixes are distributed through wholesalers or wholesaler-distributors directly to feed mills. Only farmers are receivers from feed mills. Medicated feed is always on veterinary prescription.
Note: since 1 June 2014, the Federal Agency of Medicines and Health Products (FAHMP) has imposed a fee per package, according to the active ingredient content, for all veterinary antibiotics on the Belgian market on behalf of the MAHs. A higher fee is imposed if it concerns critically important antibiotics such as cephalosporins, quinolones or macrolides. Since 1 April 2018, the fees have increased (+75%).
Legal basis for the monitoring of sales
The collection of sales data is based on the national law on medicines of 25 March 1964 (Art. 12) and on the Royal Decree of 14 December 2006 on medicines for human and veterinary use (Arts. 221 and 228). Wholesaler-distributors and feed mills are obliged to keep records of all sales and to deliver these records to the FAHMP on a yearly basis.
Data sources
To avoid double counting, all wholesaler-distributors are asked to provide sales data for the antimicrobial VMPs delivered to pharmacies and veterinarians, while sales data for antimicrobial premixes are provided by the Belgian feed mills licensed to produce medicated feed and to deliver it to Belgian farmers.

Sales of veterinary antimicrobial agents in 31 European countries in 2017Ninth ESVAC report84
Data collection for both concerned parties is organised via a secure web application with a login and password delivered by letter.
Import data on medicated feed produced in another EU country and delivered to Belgian farmers are not included in the material.
Bulgaria
Distribution of veterinary medicines
In Bulgaria, all VMPs containing antimicrobial agents are prescription-only medicines. This includes medicated premixes containing pharmaceutically active substances like antimicrobial agents. VMPs are distributed through wholesalers to veterinarians, farms and pharmacists; the wholesalers acquire the VMPs from another wholesaler or the authorised manufacturer. Antimicrobial VMPs are only available to animal owners by delivery from a pharmacy or wholesaler, on veterinary prescription, or directly from the veterinarian. Premixes are distributed through wholesalers directly to feed mills. Only farmers receive feed from feed mills. Medicated feed is always on veterinary prescription.
Legal basis for the monitoring of sales
The collection of sales data is based on the national law on veterinary activities, promulgated in the State Gazette (SG), Issue №7/25.01.2013. At the request of the Executive Director of Bulgarian Food Safety Agency (BFSA), in view of pharmacovigilance, the holder of a marketing authorisation for VMPs shall provide data on the volume of VMP sales. Wholesalers, pharmacies and farmers are obliged to keep records of all sales and purchases, and to deliver them to the BFSA on request.
Data sources
Sales data are collected from all manufacturers, importers and wholesalers, which are also either MAHs or official representatives of MAHs in Bulgaria (to avoid double counting, sales of other wholesalers are excluded). The data include the sales to veterinarians, farms and pharmacies.
Croatia
Distribution of veterinary medicines
In Croatia, all antimicrobial VMPs are prescription-only medicines. They are dispensed by pharmaceutical companies or wholesalers of VMPs to veterinary practices (surgery, station and hospital), veterinary pharmacies and feed mills. Animal owners can only buy antimicrobial VMPs on veterinary prescription in a veterinary pharmacy.
Large farms have authorised their own veterinary practices for their animals and can buy premixes on veterinary prescription from a veterinary pharmacy to use in feed mills. Feed mills should have a record of veterinary prescriptions covering each amount of antimicrobial VMP used.
Legal basis for the monitoring of sales
The collection of sales data by wholesalers is based on the national law, published in the Official Gazette of the Republic of Croatia, No: 84/08, 56/13, 94/13, 15/15 and 32/19.
Data sources
The veterinary antimicrobial agents’ sales data are obtained each year from the authorised wholesalers.

Sales of veterinary antimicrobial agents in 31 European countries in 2017Ninth ESVAC report85
Cyprus
Distribution of veterinary medicines
In Cyprus, all VMPs containing antimicrobials are prescription-only medicines. They are dispensed either by pharmacies or veterinary clinics. Veterinarians are only allowed to administer VMPs to those animals under their direct personal responsibility. The supply of VMPs to pharmacies and veterinary clinics is conducted by authorised wholesalers.
Medicated feeding stuffs containing antimicrobials are manufactured on a prescription basis, and only by authorised feed mills. Feeding stuffs manufactured in or imported into Cyprus are distributed by authorised suppliers and only administered on prescription by a veterinarian.
Legal basis for the monitoring of sales
The data are provided under legal requirements for the wholesaler/veterinarian/pharmacist to give any information requested.
Data sources
The data on sales of the veterinary antimicrobial agents included are collected each year from all authorised wholesalers and licensed feed mills in Cyprus.
Czechia
Distribution of veterinary medicines
In Czechia, all VMPs containing antimicrobial agents are prescription-only medicines. This includes medicated feeding stuffs manufactured from medicated premixes containing antimicrobials. There are five categories of receivers of antimicrobial VMPs from wholesalers: wholesalers (when selling to each other), veterinarians, pharmacies, farmers, and feed mills, while only farmers are receivers from feed mills. Medicated feed has to be prescribed by veterinarians and produced by feed mills authorised by the Institute for State Control of Veterinary Biologicals and Medicaments.
Legal basis for the monitoring of sales
The collection of sales data is based on a national law on pharmaceuticals, Act No. 378/2007 Coll.
Data sources
Sales data are collected from all wholesalers and feed mills licensed in Czechia.
Brief description of data collection
Manufacturers/wholesalers fill in the template with their quarterly sales data, divided into five categories (no data about customers); only sales for veterinarians, pharmacies and farmers are used to calculate consumption.
In the case of medicated premixes, the data reported by manufacturers of medicated feeding stuffs are used for calculation. Sales to wholesalers and manufacturers of medicated feeding stuffs are used for the verification of VMP sales.
Denmark
Distribution of veterinary medicines
In Denmark, all VMPs are prescription-only medicines and can only be dispensed either through pharmacies or via a small number of dispensing companies approved by the Danish Medicines Agency to dispense VMPs on the same legal terms as those to which the pharmacies are subject. Both pharmacies and dispensing companies are supplied by pharmaceutical companies and wholesalers. An exemption from the pharmacy/dispensing-company monopoly has been granted for medicated feeds, i.e. feeds into which VMPs formulated as premix are mixed prior to sale. Medicated feed must be prescribed by veterinarians and produced by feed mills authorised by the Danish Medicines Agency.

Sales of veterinary antimicrobial agents in 31 European countries in 2017Ninth ESVAC report86
Legal basis for the monitoring of sales
All sales of prescription medicines by pharmacies, dispensing companies and feed mills are mandated to be reported to the VetStat database, owned by the Ministry of Environment and Food of Denmark. The pharmacy/dispensing-company sales records include sales of all prescription medicines to animal owners, as well as medicines purchased by veterinary practitioners for use in their practice. Furthermore, it is mandatory for the veterinarians to report to the VetStat medicines used in their own practices for food-production animals. Antimicrobial sales for companion animals are gathered from sales reported by pharmacies to veterinarians.
Data sources
Data on sales of all prescription medicines at package level from pharmacies, dispensing companies, veterinarians and feed mills are retrieved from the VetStat database.
Estonia
Distribution of veterinary medicines
In Estonia, antimicrobial VMPs are prescription-only medicines. VMPs have to be dispensed through pharmacies (general and veterinary) and veterinarians, who are supplied by wholesalers.
Legal basis for the monitoring of sales
Wholesalers are obliged to report the sales of VMPs to the State Agency of Medicines under the Medicinal Products Act of 2005.
Data source
The State Agency of Medicines collects sales data at package level from wholesalers. Only sales to pharmacies (general and veterinary) and veterinarians are accounted for, to avoid double reporting by including sales to other wholesalers.
Finland
Distribution of veterinary medicines
In Finland, all VMPs that contain antimicrobials are prescription-only medicines, which are available either from pharmacies on veterinarian prescription or directly from veterinarians. Veterinarians are allowed to dispense medicines for the treatment of animals under their care but are not allowed to profit from the sales. Pharmacies and veterinarians are supplied by wholesalers. Medicated feeds may either be produced by feed mills or imported into Finland, but always require a prescription from a veterinarian.
Legal basis for the monitoring of sales
Wholesalers are obliged to provide information on the sales of VMPs to the Finnish Medicines Agency in accordance with the Medicines Act (375/1987). Production and imports of medicated feeds must be reported to the Finnish Food Safety Authority in accordance with the Decree on Medicated Feeds (10/EEO/2008).
Data source
The sales data are obtained at package level from wholesalers by the Finnish Medicines Agency, which monitors the sales of VMPs. Sales of antimicrobial agents in medicated feed are monitored by the Finnish Food Authority which collects data from feed mills and other importers.

Sales of veterinary antimicrobial agents in 31 European countries in 2017Ninth ESVAC report87
France
Distribution of veterinary medicines
In France, all VMPs are available on prescription only. VMPs are distributed mainly through wholesalers to veterinarians and pharmacists; wholesalers obtain the VMPs from marketing authorisation holders.
Legal basis for the monitoring of sales
A new law published at the end of 2014 makes the provision of data on antimicrobial sales to the competent authority mandatory.
Data sources
The sales data are collected from marketing authorisation holders at package level by Anses-ANMV (French Agency for Veterinary Medicinal Products), in collaboration with the French Veterinary Medicine Industry Association. Double reporting is avoided because the data are not provided by the wholesalers but directly by the MAHs which do not trade among one another.
Germany
Distribution of veterinary medicines
In Germany, all VMPs containing antimicrobial agents are prescription-only medicines. Veterinarians are allowed to dispense drugs directly to the farmer for the treatment of animals in their care. Veterinarians are supplied with VMPs directly from pharmaceutical companies or wholesalers. Very few animal owners acquire VMPs from pharmacies.
Premixes have to be prescribed by veterinarians and medicated feed is produced by officially authorised feed mills thereafter.
Legal basis for the monitoring of sales
The collection of sales data from pharmaceutical companies and wholesalers is based on German medicines law which is further specified in a specific regulation.
Data sources
Data on sales to veterinarians are collected by pharmaceutical companies and wholesalers which dispense antimicrobial agents to veterinarians located in Germany. In the case of premixes, sales data are taken from periodic safety update reports, because premixes are provided to feed mills on prescription and thus are not included in the data on sales to veterinarians.
Greece
Distribution of veterinary medicines
In Greece, all antimicrobial veterinary medicinal products are prescription-only medicines. MAHs or local representatives provide VMPs to wholesalers and retailers. Wholesalers can also provide VMPs to retailers. Only retailers can provide VMPs to the customer with a valid prescription.
Legal basis for the monitoring of sales
The collection of sales data by MAHs is based on the joint ministerial law: ΚΥΑ 282371/16-06-2006.
Data sources
In 2017, sales for veterinary antimicrobial agents were reported to the ESVAC for the third time. Data were provided by 81 marketing authorisation holders. Negligible sales from a few MAHs with a very small market share, and without local representatives in the country, were not included in the 2015, 2016 and 2017 datasets.

Sales of veterinary antimicrobial agents in 31 European countries in 2017Ninth ESVAC report88
Hungary
Distribution of veterinary medicines
In Hungary, all VMPs that contain antimicrobials are prescription-only medicines. All VMPs have to be dispensed through authorised retailers, which are only supplied by authorised wholesalers. Wholesalers are authorised by the county government office, and retailers are authorised by the district government office.
Antimicrobial VMPs can be bought from a wholesaler by other wholesalers, retailers, veterinarians, farmers or feed mills. The route of VMPs must be documented as it must be possible to control the journey of each batch from the manufacturer to the farmer.
According to EU rules, medicated feeds are classified as feed and not as VMPs. They have to be prescribed by veterinarians, and produced by feed mills authorised by the government office. Medicated feeds may be imported into Hungary, but require a prescription by a veterinarian, like other medicated feeds. Importation of medicated feeds is supervised by the office which authorises importers and distributors.
Legal basis for the monitoring of sales
There is no legal basis for mandatory reporting of sales data; monitoring of sales takes place voluntarily.
Data sources
Data are collected from wholesalers in Hungary. These wholesalers only submit data for those products they have sold to veterinarians, feed mills, farmers and retailers, but not to other wholesalers (i.e. there is no double reporting).
Iceland
Distribution of veterinary medicines
In Iceland, all antimicrobial VMPs and almost all other VMPs are prescription-only medicines. They must be dispensed to animal owners by veterinarians (or used by the veterinarians in their practices), or pharmacies, i.e. veterinarians are allowed to dispense VMPs in the same way as pharmacies. Veterinarians and pharmacies can only purchase VMPs from licensed wholesalers. No medicated feeding stuffs for livestock are produced by feed mills in Iceland.
Legal basis for the monitoring of sales
Wholesalers in Iceland are mandated to provide sales statistics for both human and veterinary medicinal products, as well as for medicated feeding stuffs, to the Icelandic Medicines Agency.
Data sources
The data on sales of the included veterinary antimicrobial agents at package level are provided by wholesalers in Iceland, of which there are only two.
Ireland
Distribution of veterinary medicines
In Ireland, antimicrobial veterinary medicinal products may only be supplied on prescription. The products are supplied to the trade by wholesalers authorised by the Department of Agriculture, Food and the Marine. In accordance with the prescription of the prescribing veterinarian, the prescribed products can be dispensed either by the veterinarian or by a pharmacist. By way of an exception to this rule, intramammary antimicrobial substances can also be dispensed by licensed agricultural merchants. Medicated feeds containing antimicrobials are prepared from authorised premixes, again under veterinary prescription. They are incorporated into the feed under a special authorisation granted by the Department of Agriculture, Food and the Marine. The licences for incorporation are granted either to feed mills or to farms that have the appropriate facilities for inclusion. It should be noted that the sale, supply or possession of any unauthorised veterinary medicine in Ireland is a criminal offence.

Sales of veterinary antimicrobial agents in 31 European countries in 2017Ninth ESVAC report89
Legal basis for the monitoring of sales
There is currently no legal basis requiring wholesalers to supply data relating to the volume of sales of authorised veterinary medicinal products. However, marketing authorisation holders are obliged to report sales data.
Data sources
Each year, the Health Products Regulatory Authority (HPRA) collects data from veterinary pharmaceutical manufacturers currently holding Irish marketing authorisations. These holders are requested by the HPRA to only report sales in Ireland. The HPRA checks the information provided against data collected for previous years. Fluctuations in the data from year to year are followed up with the individual company to guard against data errors. The importation of medicated feed is permitted. However, in practice, given the logistics involved, this is not seen as a major route of supply into the country.
Italy
Distribution of veterinary medicines
In Italy, antimicrobial agents for use in animals are prescription-only medicines. Therefore, their sale to the end-user can only take place upon presentation of a veterinary prescription. The sale of veterinary medicines (including antimicrobial agents) on Italian territory may take place as described below:
Wholesale of veterinary medicines
This type of sale includes all forms of business transaction except sales to the end-user. It can only be done on storage premises authorised for the purpose by the local competent authority.
Wholesale of veterinary medicinal products includes transactions between:
• marketing authorisation holders or their representatives and wholesalers;
• marketing authorisation holders or their representatives and pharmacies;
• wholesalers;
• wholesalers and pharmacies;
• wholesalers and feed mills authorised to produce medicated feeds (premixes for medicated feed).
Direct sale of veterinary medicinal products
Holders of authorised wholesale veterinary medicines storage premises may, as a result of further authorisation by the local competent authority, also make direct sales of such products to breeders, pet owners, veterinarians and veterinary care facilities. This type of transaction also includes the sale of premixes for medicated feed by wholesalers, pharmacies and manufacturers to farms authorised to produce medicated feed for self-consumption. Such sales may take place only in the presence of a pharmacist and, in the case of antimicrobial agents, only under veterinary prescription.
Retail veterinary medicinal products
The retail sale of veterinary medicinal products containing antibiotics can only take place at pharmacies, under veterinary prescription, and only in the presence of a pharmacist.
Farmers, veterinarians, breeding and healthcare facilities may, on request, be authorised by the local competent authority to hold stocks of veterinary medicinal products. Stocks of veterinary drugs, including antibiotics, can only be purchased under veterinary prescription. Farms cannot hold stocks of antibiotics in the form of medicated feed or veterinary drugs administered in feed, water or liquid feed. Only small quantities can be held, not exceeding a treatment period of seven days.
Veterinarians cannot sell veterinary drugs (including antibiotics). When required by professional intervention, veterinarians are allowed to deliver open packages of veterinary medicines from their stocks to the breeder or the animal owner to start the therapy. For companion animals, the veterinarian may also deliver unopened packages.

Sales of veterinary antimicrobial agents in 31 European countries in 2017Ninth ESVAC report90
Legal basis for the monitoring of sales
The collection of sales data by pharmaceutical companies is based on the national law 193/2006 (art. 32(3)) transposing EC Directive 2004/28.
Data sources
Sales data are collected from pharmaceutical companies producing or importing VMPs.
Latvia
Distribution of veterinary medicines
In Latvia, all VMPs containing antimicrobial agents are prescription-only medicines. This includes medicated feed manufactured from medicated premixes containing antimicrobial agents. VMPs are distributed through wholesalers to pharmacies, veterinarians and licensed farms. VMPs for licensed farms must have been ordered by the veterinarian contracted to provide routine healthcare services. Animal owners without the licence can only purchase VMPs containing antibiotics on veterinary prescription in pharmacies.
Legal basis for the monitoring of sales
Sales data are collected by the Food and Veterinary Service. This task is mandated by the Law of Pharmacy and the related Regulation of the Cabinet of Ministers.
Data sources
Sales data are collected from all wholesalers in Latvia at package level by the Food and Veterinary Service. Wholesalers are asked to report in detail what medicines are sold, to determine real consumption of VMPs, and to avoid double reporting or export of VMPs.
Lithuania
Distribution of veterinary medicines
In Lithuania, all VMPs that contain antimicrobial agents are prescription-only medicines. All VMPs must be dispensed to veterinarians or farmers through wholesalers or pharmacies. Medicated feed is also subject to prescription by a veterinarian.
Legal basis for the monitoring of sales
Wholesalers are obliged to provide information on sales of VMPs to the State Food and Veterinary Service of the Republic of Lithuania, in accordance with national law.
Data sources
Data on sales of antimicrobial VMPs at package level are obtained from wholesalers by the State Food and Veterinary Service of the Republic of Lithuania.
Luxembourg
Distribution of veterinary medicines
In Luxembourg, all veterinary medicinal products (VMPs) containing antimicrobial agents are prescription-only medicines. This includes medicated premixes containing pharmaceutical agents.
VMPs containing antimicrobial agents are distributed through wholesalers to pharmacies or to veterinarians (via pharmacies’ records). Veterinarians are allowed to keep VMPs in stock and to dispense them to farmers for the treatment of animals in their care.
Sales of veterinary antimicrobial agents in 31 European countries in 2017Ninth ESVAC report91
Legal basis for monitoring
Wholesalers, pharmacies, veterinarians and farmers are legally obliged to keep records of all sales. They are legally bound to provide any data or information requested of them.
Data sources
The data on sales of veterinary antimicrobial agents at package level are obtained from the authorised wholesalers on a yearly basis.
Malta
Distribution of veterinary medicines
In accordance with Regulation 60 of Subsidiary Legislation 437.47, a veterinary prescription is required for dispensing to the public veterinary medicinal products for food-producing animals. In all cases of medicated feed, a veterinary prescription is required in accordance with Subsidiary Legislation 437.73. All veterinary medicinal products that contain antimicrobials are registered as prescription-only medicines. In accordance with Regulation 58 of Subsidiary Legislation 437.47, distribution of veterinary medicinal products is subject to the holding of an authorisation. In the case of medicated feed, the authorised medicated feed mill or the authorised feed trader can also distribute the finished medicated feed directly to farms.
Legal basis for monitoring
There is no legal basis for reporting of veterinary antimicrobial sales data in Malta, and monitoring is done on a voluntarily basis by the Veterinary Medicines Section, which falls under the administration of the Ministry for the Environment, Sustainable Development and Climate Change.
Data sources
Once a year, the Veterinary Medicines Section collects sales data on antimicrobials from all authorised veterinary distributors, medicated feed mills and medicated feed traders.
Netherlands
Distribution of veterinary medicines
In the Netherlands, antimicrobial VMPs are available on prescription only. Veterinarians purchase approximately 40% of their VMPs directly from the manufacturers and approximately 60% through wholesalers. About 98% of the total volume of antimicrobial VMPs is dispensed by marketing authorisation holders who are either direct members of the Dutch federation of the veterinary pharmaceutical industry (FIDIN) or are represented by FIDIN members. An estimated 2% are sold by authorisation holders not associated with FIDIN. Veterinarians sell the products directly to animal owners. Pharmacies dispense only minor quantities of VMPs.
Legal basis for the monitoring of sales
Currently, there is no legal basis for mandatory reporting of sales data; monitoring of sales takes place voluntarily.
Data sourcesThe sales data are obtained at package level from the MAHs who are (represented by) members of FIDIN. Since sales data are obtained from marketing authorisation holders only, including both their sales to wholesalers and their direct sales to veterinarians, there is no double reporting of wholesalers’ sales.

Sales of veterinary antimicrobial agents in 31 European countries in 2017Ninth ESVAC report92
Norway
Distribution of veterinary medicines
In Norway, all VMPs are prescription-only medicines, which are generally dispensed through pharmacies supplied by drug wholesalers. Veterinarians, in general, are not allowed to dispense VMPs. Medicated feeds are not used for food-producing animals except for farmed fish; this is due to the small size of livestock herds compared to those in most other European countries. However, group/flock treatment of livestock with antimicrobial agents is possible, again subject to veterinary prescription, through drinking water or as top dressing on feed by using an oral solution or oral powder, respectively.
Legal basis for the monitoring of sales
Wholesalers and feed mills in Norway are mandated to provide sales statistics for both human and veterinary medicinal products, as well as for medicated feedstuffs, to the Norwegian Institute of Public Health (NIPH).
Data sources
Data on the sales of the veterinary antimicrobial agents included at package level are obtained from the NIPH, which collects its data from authorised wholesalers and feed mills (only relevant for aquaculture). To avoid double reporting by including sales among the wholesalers, the wholesalers and feed mills are asked by the NIPH to only report sales to pharmacies and animal owners in Norway.
Poland
Distribution of veterinary medicines
Most VMPs, including antimicrobial VMPs, are prescription-only medicines. VMPs are distributed by wholesalers to veterinarians. Antimicrobial VMPs are only available to animal owners if the veterinarian delivers them. Veterinarians and medicated-feed producers are allowed to buy medicated premixes from wholesalers. However, before purchase, medicated-feed producers must obtain confirmation from the district veterinary officer.
Legal basis for the monitoring of sales
In accordance with national pharmaceutical law, wholesalers are obliged to provide data on sales of VMPs.
Data sources
Sales data are collected from wholesalers who deliver VMPs directly to veterinarians. Wholesalers fill in the template with their quarterly sales data.
Portugal
Distribution of veterinary medicines
In Portugal, all VMPs containing antimicrobial agents are prescription-only medicines. This includes medicated premixes containing pharmaceutically active substances, like antimicrobial agents. VMPs containing antimicrobial agents are provided by wholesaler-distributors to retailers of veterinary medicinal products (both human and animal pharmacies), farmers, veterinarians, producers’ organisations, veterinary clinics and hospitals, and feed mills.
Wholesaler-distributors obtain the VMPs from a wholesaler or from the MAH/manufacturer. Antimicrobial VMPs are only available to animal owners/farmers by means of an official veterinary prescription. Veterinarians do not sell VMPs and can only charge for those they use to treat animals in their care. Premixes are distributed through wholesalers or wholesaler-distributors directly to feed mills. Only farmers are receivers from feed mills. Medicated feeds containing antimicrobial premixes also have to be prescribed by a veterinarian and can only be manufactured by officially authorised feed mills.

Sales of veterinary antimicrobial agents in 31 European countries in 2017Ninth ESVAC report93
Legal basis for the monitoring of sales
The collection of sales data is based on the national law no. 148/2008, dated 29 July (Art. 120), amended and reprinted by national law no. 314/2009, dated 28 October.
Data sources
Data are provided by wholesalers who are authorised to sell veterinary medicinal products containing antibiotics.
Romania
Distribution of veterinary medicines
In Romania, all VMPs containing antimicrobial agents are prescription-only medicines.
Wholesalers must supply medicinal products only to those authorised to provide retail activities or those who are legally allowed to purchase medicinal products from wholesalers. Retail distribution of the veterinary medicinal products is performed only by those authorised to carry out such operations in accordance with the national legislation.
Marketing of veterinary medicinal products is carried out according to the veterinary legislation in force, i.e. only through veterinary pharmaceutical establishments which are authorised by the National Sanitary Veterinary and Food Safety Directorate.
Legal basis for the monitoring of sales
The collection of sales data is based on the national law on veterinary activities – Order of the National Sanitary Veterinary and Food Safety President - promulgated in the Official Monitor from 15 October 2015.
The MAHs are obliged to report sales of the antimicrobials each year before 15 March, and to deliver these records to the Institute for Control of Biological Products and Veterinary Medicines, which reports the data to the ESVAC.
Data sources
For 2014, the sales data were collected from 37 wholesalers and those 11 MAHs which distributed their own products. The data include the sales to veterinarians, farmers and pharmacies. From 2015, according to the updated veterinary law, the sales data are collected from MAHs only.
Slovakia
Distribution of veterinary medicines
In Slovakia, all VMPs containing antimicrobial agents are prescription-only medicines, including medicated feeding stuffs manufactured from medicated premixes containing antimicrobial agents. There are four categories of receiver of antimicrobial VMPs from wholesalers to wholesalers (when selling to each other), veterinarians, pharmacies and feed mills, while only farmers are receivers from feed mills. Medicated feed has to be prescribed by veterinarians and produced by feed mills authorised by the Institute for State Control of Veterinary Biologicals and Medicaments Nitra.
Legal basis for the monitoring of sales
The collection of import data is based on a national law on pharmaceuticals, Act No. 362/2011 Coll.
Data sources
For 2011 and 2012, import data were collected from all wholesalers licensed in the Slovak Republic; from 2013, data represent sales from wholesalers to end-users.
Sales of veterinary antimicrobial agents in 31 European countries in 2017Ninth ESVAC report94
Brief description of data collection
Wholesalers send their quarterly import data (number of packs, pack size, name of the product, batch number, etc.) and manufacturers send their quarterly production data to the Institute for State Control of Veterinary Biologicals and Medicaments Nitra.
Slovenia
Distribution of veterinary medicines
In accordance with applicable legislation, antimicrobial VMPs are dispensed in the Republic of Slovenia on the basis of a veterinary prescription only. Wholesalers deliver antimicrobial VMPs to retailers, i.e. pharmacies and veterinary organisations, and to approved medicated-feed mills.
Legal basis for the monitoring of sales
Wholesalers are required by law to report to the competent authority on the turnover (sales) of all medicinal products.
Data sources
Data on sales of veterinary antimicrobial agents at package level were obtained from the wholesalers.
Spain
Distribution of veterinary medicines
In Spain, all VMPs containing antimicrobials are prescription-only medicines, so they can only be dispensed under veterinary prescription. All suppliers to final users of VMPs (wholesalers, retailers, pharmacies and farmers’ co-operatives) are authorised according to national law and have a mandatory pharmacist control service. Dispensing is most frequently done by retailers. Veterinarians in Spain are allowed to use VMPs in their daily practice, but they cannot sell VMPs to animal owners.
Medicated feeds containing antimicrobial premixes also have to be prescribed by a veterinarian and can only be manufactured by feed mills authorised by regional competent authorities according to specific legislation and to the feed hygiene regulation (Hazard Analysis and Critical Control Point principles).
Legal basis for the monitoring of sales
There is a legal basis for mandatory reporting of sales data from the distributors of such products, while monitoring sales from the MAHs takes place voluntarily.
Data sources
For 2017, the sales data are collected from retailers at package level by the Spanish Agency for Veterinary Medicinal Products (AEMPS), in collaboration with the Spanish veterinary medicine industry association (Veterindustria) and the Spanish business association of additives and premixes for animal health and nutrition (Adiprem).
Sweden
Distribution of veterinary medicines
In Sweden, antimicrobial VMPs may only be sold on prescription. VMPs must be dispensed through pharmacies, which are supplied by drug wholesalers or MAHs. Feed mills may only mix antimicrobial VMPs in feed if they are controlled and authorised by the Swedish Board of Agriculture. Sales of medicated feed to farmers are only allowed on prescription (i.e. the farmer presents the prescription to the feed mill). Mixing of antimicrobials in feed may also take place on farms, provided that the Swedish Board of Agriculture has controlled and authorised the establishment for this purpose. In such cases, the premix is purchased on prescription and dispensed by a pharmacy.

Sales of veterinary antimicrobial agents in 31 European countries in 2017Ninth ESVAC report95
Legal basis for the monitoring of sales
All pharmacies in Sweden are required to provide sales statistics on a daily basis to a central database. Until and including 2013, this was an infrastructure company owned by the state, Apotekens Service AB. Since 1 January 2014, all activities within that company have been transferred to the Swedish eHealth Agency. All feed mills and farms authorised to mix medicated feed are requested to report their purchases and sales on a yearly basis to the Swedish Board of Agriculture.
Data sources
Pharmacy data on dispensation of prescriptions to animal owners or requisitions by a veterinarian (e.g. sales from pharmacies to animal owners or to veterinarians for use in practice) at package level have been obtained from Apotekens Service AB/the Swedish eHealth Agency.
Switzerland
Distribution of veterinary medicines
In Switzerland, all VMPs are prescription-only medicines and have to be dispensed by either the treating veterinarian or a pharmacy. Medicated feeds for livestock (terrestrial animals) are either produced in feed mills using authorised premixes, or incorporated on-site following prescription and dispensing by veterinarians. Group treatment of livestock with antimicrobial agents is possible, subject to veterinary prescription and supervision, through medicated feed, drinking water or as top dressing.
Legal basis for the monitoring of sales
The legal basis for data collection is Art. 35 of the Federal Ordinance on Veterinary Medicines, enacted in September 2004. Art. 36 requests the Federal Office of Food Safety and Veterinary Affairs to “specifically establish a statistic about usage of veterinary antimicrobials for the purpose of monitoring resistances”. Sales of veterinary antimicrobials are published yearly in the ARCH-VET report covering sales and resistances to veterinary antimicrobials. Note that figures published in the national ARCH-VET report differ from figures in the present report since all ATCvet groups are included in the national report.
It must be highlighted that since 1 January 2019 the regulatory framework for data collection in Switzerland has been moved to a new legislative text.
Data sources
Data are obtained at package level from the MAHs. They are requested, processed and analysed by the Federal Food Safety and Veterinary Office.
Data coverage
Coverage is assumed to be nearly 100% for the sales of authorised antimicrobial agents. Since no prescription figures are currently available at national level, sales figures cannot be further validated. Veterinarians may import VMPs for companion and food-producing animals, including products containing antimicrobial agents, based on a single authorisation valid for one year and delivered by Swissmedic, the Swiss Agency for Therapeutic Products. As these products are not sold by marketing authorisation holders or wholesalers in Switzerland, and since these single authorisations are not delivered for a defined quantity, these products cannot be monitored and are therefore not included in the statistics.

Sales of veterinary antimicrobial agents in 31 European countries in 2017Ninth ESVAC report96
United Kingdom
Distribution of veterinary medicines
In the United Kingdom, antimicrobial veterinary medicinal products may only be supplied on prescription. The products can be dispensed either by the veterinarian or by a veterinary pharmacist and, in turn, can only be supplied by a wholesale dealer authorised by the United Kingdom Veterinary Medicines Directorate. Medicated feeds have to be prescribed by veterinarians and manufactured either by authorised feed mills or by authorised farms. Medicated feeds are used primarily for pig and poultry production.
Legal basis for the monitoring of sales
Manufacturers are legally required to supply data relating to the volume of sales of authorised veterinary medicinal products at the request of the Veterinary Medicines Directorate.
Data sources
The United Kingdom Veterinary Medicines Directorate collects data from those veterinary pharmaceutical manufacturers that hold current United Kingdom marketing authorisations.

Sales of veterinary antimicrobial agents in 31 European countries in 2017Ninth ESVAC report97
Annex 7. References to national reportsAustria. European Surveillance of Veterinary Antimicrobial Consumption (ESVAC) – the Austrian Results. Resistenzbericht Österreich – AURES 2017 (https://www.ages.at/download/0/0/b732a3fdd165ad3bc848806f199a21bfb51f9237/fileadmin/AGES2015/Themen/Arzneimittel_Medizinprodukte_Dateien/AURES/AURES_2017.pdf, pp.388-397, in German).
Belgium. Belgian Veterinary Surveillance of Antimicrobial Consumption. National Consumption Report 2017 (http://www.fagg-afmps.be/nl/DIERGENEESKUNDIG_gebruik/geneesmiddelen/geneesmiddelen/goed_gebruik/Antibiotica_0).
Czechia. Spotřeba Antimikrobik Ve Veterinární Medicíně V ČR: Detailní Komentované Srovnání Spotřeb Antimikrobik 2010 - 2017 (http://www.uskvbl.cz/cs/informace/tiskove-centrum/tiskprohl, in Czech).
Cyprus. Sales of veterinary antimicrobial products in Cyprus (http://www.moa.gov.cy/moa/vs/vs.nsf/vs74_gr/vs74_gr?OpenDocument).
Denmark. DANMAP 2017 – Use of antimicrobial agents and occurrence of antimicrobial resistance in bacteria from food animals, food and humans in Denmark. ISSN 1600-2032 (https://www.danmap.org/).
Estonia. An overview of the consumption of antibiotics for veterinary use 2006-2016 (http://www.ravimiamet.ee/sites/default/files/antibiootikumide_kasutamine_loomadel_2006-2016.pdf, in Estonian).
Finland. FINRES-Vet 2016-2017: Finnish Veterinary Antimicrobial Resistance Monitoring and Consumption of Antimicrobial Agents (https://helda.helsinki.fi//bitstream/handle/10138/298651/FINRES_Vet_evira_publications_5_2018.pdf?sequence=1).
France. Urban, D., Chevance, A., Moulin, G., 2018. Sales Survey of Veterinary Medicinal Products Containing Antimicrobials in France – 2017, November 2018, Anses-ANMV, Fougères (https://www.anses.fr/en/system/files/ANMV-Ra-Antibiotiques2017EN.pdf).
Germany. Wallmann, J., Bode, C., Bender, A., Heberer, T., Abgabemengenerfassung von Antibiotika in Deutschland 2017 (Sales data of antimicrobial substances in Germany in 2017), Deutsches Tierärzteblatt 2018; 66 (9); pp. 1238-1247 (https://www.deutsches-tieraerzteblatt.de/fileadmin/resources/Bilder/DTBL_09_2018/PDFs/DTBl_09_2018_Abgabemengenerfassung_von_Antibiotika.pdf, in German).
Greece. ΕΟΦ – Sales of veterinary medicinal products in Greece (presentation) (https://www.eof.gr/c/document_library/get_file?uuid=dd07bc3d-b6dd-4af8-9c74-c2192446cd64&groupId=12225, in Greek)
Iceland. Sýklalyfjanotkun og sýklalyfjanæmi baktería í mönnum og dýrum á Íslandi 2017 (https://www.landlaeknir.is/utgefid-efni/skjal/item35440/, in Icelandic).
Ireland. Health Products Regulatory Authority, 2018. Report on consumption of veterinary antibiotics in Ireland during 2017 (http://www.hpra.ie/docs/default-source/default-document-library/draft-report-on-consumption-of-veterinary-antibiotics-in-ireland-during-2017.pdf?sfvrsn=0).
Italy. Ministero della Salute. Politiche nazionali contro l’AMR. Dati di vendita dei medicinali veterinari contenenti agenti antimicrobici. Trend in Italia (http://www.salute.gov.it/portale/temi/p2_6.jsp?lingua=italiano&id=4636&area=veterinari&menu=antibiotici)

Sales of veterinary antimicrobial agents in 31 European countries in 2017Ninth ESVAC report98
Netherlands. Monitoring of Antimicrobial Resistance and Antibiotic Usage in Animals in the Netherlands in 2017, NETHMAP-MARAN 2018 (http://www.wur.nl/nl/Expertises-Dienstverlening/Onderzoeksinstituten/Bioveterinary-Research/Publicaties/MARAN-Rapporten.htm).
Netherlands. SDa, Veterinary Medicines Authority, Usage of antibiotics in agricultural livestock in the Netherlands in 2017 (http://www.autoriteitdiergeneesmiddelen.nl/en/publications).
Norway. NORM/NORM-VET, 2017. Usage of Antimicrobial Agents and Occurrence of Antimicrobial Resistance in Norway. ISSN 1502-2307/1890-9965 (http://www.vetinst.no/overvaking/antibiotikaresistens-norm-vet).
Romania. Raport privind consumul de produse medicinale veterinare antimicrobiene in Romania (http://www.icbmv.ro/ro/informatii-utile/raport-privind-consumul-de-produse-medicinale-veterinare-antimicrobiene, in Romanian).
Spain. News on veterinary medicines (http://www.resistenciaantibioticos.es/es).
Sweden. Swedres-Svarm 2017. Consumption of antibiotics and occurrence of antibiotic resistance in Sweden. Solna/Uppsala ISSN 1650-6332 (www.sva.se/en/Antibiotika/SVARM-reports/).
Switzerland. Federal Food Safety and Veterinary Office. 2017 ARCH-Vet: Report on sales of antibiotics in veterinary medicine in Switzerland, June 2018 (https://www.blv.admin.ch/dam/blv/de/dokumente/tiere/tierkrankheiten-und-arzneimittel/tierarzneimittel/arch-vet-bericht-2017.pdf.download.pdf/ARCH-Vet_Sales_2017%20D.pdf)
United Kingdom. UK-VARSS 2017. UK Veterinary Antibiotic Resistance and Sales Surveillance Report (https://www.gov.uk/government/publications/veterinary-antimicrobial-resistance-and-sales-surveillance-2017).
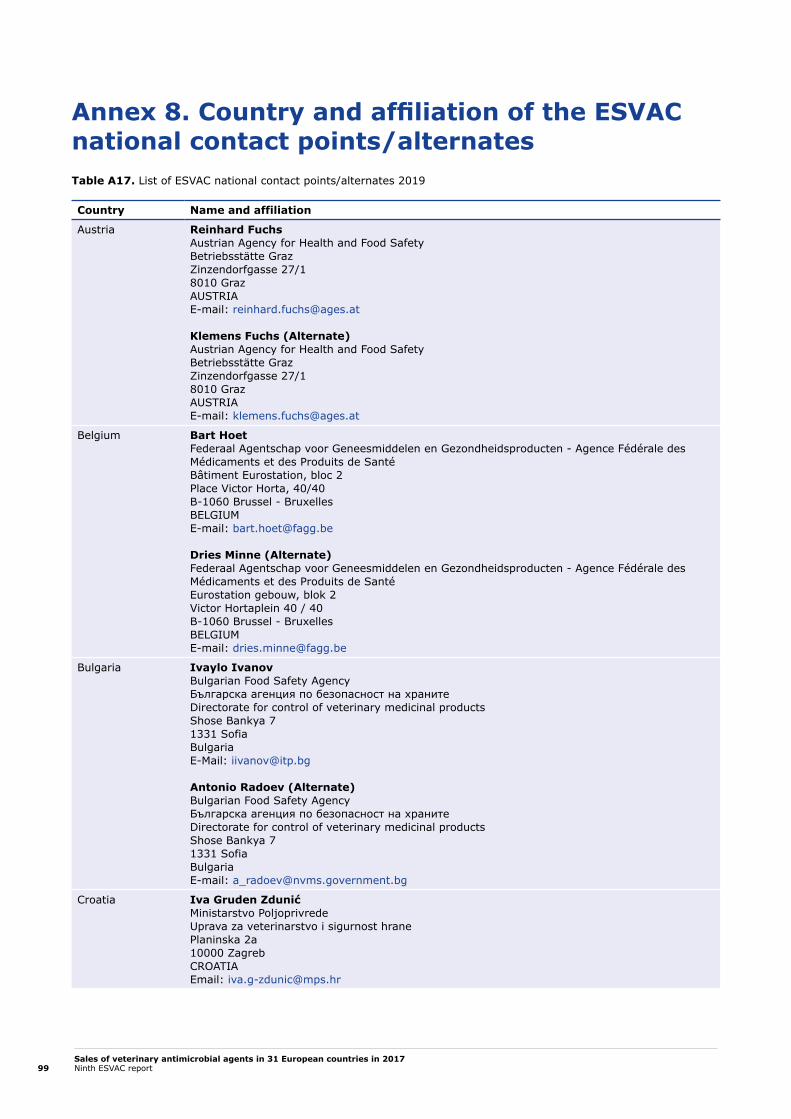
Sales of veterinary antimicrobial agents in 31 European countries in 2017Ninth ESVAC report99
Annex 8. Country and affiliation of the ESVAC national contact points/alternatesTable A17. List of ESVAC national contact points/alternates 2019
Country Name and affiliation
Austria Reinhard Fuchs Austrian Agency for Health and Food SafetyBetriebsstätte GrazZinzendorfgasse 27/18010 GrazAUSTRIAE-mail: [email protected]
Klemens Fuchs (Alternate)Austrian Agency for Health and Food SafetyBetriebsstätte GrazZinzendorfgasse 27/18010 GrazAUSTRIAE-mail: [email protected]
Belgium Bart HoetFederaal Agentschap voor Geneesmiddelen en Gezondheidsproducten - Agence Fédérale des Médicaments et des Produits de SantéBâtiment Eurostation, bloc 2Place Victor Horta, 40/40B-1060 Brussel - BruxellesBELGIUME-mail: [email protected]
Dries Minne (Alternate)Federaal Agentschap voor Geneesmiddelen en Gezondheidsproducten - Agence Fédérale des Médicaments et des Produits de SantéEurostation gebouw, blok 2Victor Hortaplein 40 / 40B-1060 Brussel - BruxellesBELGIUME-mail: [email protected]
Bulgaria Ivaylo IvanovBulgarian Food Safety AgencyБългарска агенция по безопасност на храните Directorate for control of veterinary medicinal productsShose Bankya 7 1331 SofiaBulgariaE-Mail: [email protected]
Antonio Radoev (Alternate)Bulgarian Food Safety AgencyБългарска агенция по безопасност на храните Directorate for control of veterinary medicinal productsShose Bankya 7 1331 SofiaBulgariaE-mail: [email protected]
Croatia Iva Gruden ZdunićMinistarstvo PoljoprivredeUprava za veterinarstvo i sigurnost hranePlaninska 2a10000 ZagrebCROATIAEmail: [email protected]

Sales of veterinary antimicrobial agents in 31 European countries in 2017Ninth ESVAC report100
Country Name and affiliation
Cyprus Marios GenakritisVeterinary Services1417 AthalassaNicosiaCYPRUSE-mail: [email protected]
Czechia Lucie PokludováÚstav pro státní kontrolu veterinárních biopreparátů a léčivHudcova 56a621 00 Brno - MedlánkyCZECHIAE-mail: [email protected]
Jana Wojtylová (Alternate)Ústav pro státní kontrolu veterinárních biopreparátů a léčivHudcova 56a621 00 Brno – MedlánkyCZECHIAE-mail: [email protected]
Denmark Laura Mie Jensen Danish Veterinary and Food AdministrationStationsparken 31-332600 GlostrupDENMARKE-mail: [email protected]
Estonia Marju SammulState Agency of Medicines1, Nooruse Street50411 TartuESTONIAE-mail: [email protected]
Finland Katariina Kivilahti-MäntyläFinnish Medicines AgencyMannerheimintie 103B00280 HelsinkiFINLANDE-mail: [email protected]
Henriette Helin-Soilevaara (Alternate)Animal Health and Medication UnitFinnish Food AuthorityMustialankatu 300790 HelsinkiFINLANDE-mail: [email protected]
France Gérard MoulinAgence Nationale du Médicament Vétérinaire – de l’environnement et du travailParc d’activité de la Grande MarcheCS 70611 Javené8 rue Claude BourgelatF-35306 Fougères CedexFRANCEE-mail: [email protected]
Claire Chauvin (Alternate)Agence Nationale de Sécurité Sanitaire de l’alimentationAnses - Laboratoire de Ploufragan-PlouzanéUnité d’épidémiologieBP 53 22440 PloufraganFRANCEE-mail: [email protected]

Sales of veterinary antimicrobial agents in 31 European countries in 2017Ninth ESVAC report101
Country Name and affiliation
Germany Christoph BodeBundesamt für Verbraucherschutz und LebensmittelsicherheitMauerstraße 39-4210117 BerlinGERMANYE-mail: [email protected]
Greece Farlopoulos Spyridon ΕΟΦ, Greek National Organisation for MedicinesVeterinary Medicines Assessment Section284, Mesogeion Ave.GR-155 62 Cholargos, Athens GREECEE-mail: [email protected]
Ioannis Malemis (Alternate)ΕΟΦ, Greek National Organisation for MedicinesVeterinary Medicines Assessment Section284, Mesogeion Ave.GR-155 62 Cholargos, AthensGREECEE-Mail: [email protected]
Hungary Zsófia FűrészNational Food Chain Safety OfficeDirectorate of Veterinary Medicinal ProductsSzállás utca 8H-1107 BudapestHUNGARYE-mail: [email protected]
Ernő Horváth (Alternate)National Food Chain Safety OfficeDirectorate of Veterinary Medicinal ProductsSzállás utca 8H-1107 BudapestHUNGARYE-mail: [email protected]
Iceland Jóhann M. LenharðssonEmbætti landlæknisRauðarárstígur 10IS-105 ReykjavíkICELANDE-mail: [email protected]
Ireland Jeremiah Gabriel BeechinorAn tÚdarás Rialála Táirgí SláinteKevin O’Malley HouseThe Earlsfort CentreEarlsfort TerraceDublin 2IRELANDE-mail: [email protected]
Gavin Ryan (Alternate)An tÚdarás Rialála Táirgí SláinteKevin O’Malley HouseThe Earlsfort CentreEarlsfort TerraceDublin 2IRELANDE-mail: [email protected]

Sales of veterinary antimicrobial agents in 31 European countries in 2017Ninth ESVAC report102
Country Name and affiliation
Italy Angelica MaggioMinistero della SaluteDirezione generale della sanità animale e dei farmaci veterinariViale Giorgio Ribotta, 500144 RomaITALYE-mail: [email protected]
Latvia Dagnija BrensonePārtikas un Veterinārais DienestsPeldu iela 30LV-1050 RīgaLATVIAE-mail: [email protected]
Lithuania Sigitas SiriukaitisAnimal Health and Welfare DepartmentValstybinė maisto ir veterinarijos tarnybaSiesiku str. 19LT-07170 VilniusLITHUANIAE-mail: [email protected]
Luxembourg Marcel BruchMinistère de la Santé - Direction de la SantéAllée MarconiL-2120 LuxembourgLUXEMBOURGE-mail: [email protected]
Malta Bernard SolerMinistry for the Environment, Sustainable Development and Climate ChangeAbattoir streetAlbert Town, Marsa MALTAE-mail: [email protected]
Netherlands Bart van den AssumMinistry of Agriculture, Nature and Food QualityDirectorate-General for Agro and NaturePostbus 204012500 EK Den HaagTHE NETHERLANDSE-mail: [email protected]
Inge van Geijlswijk (Alternate)On behalf of the Netherlands Veterinary Medicines Institute (SDa),Faculty of Veterinary Medicine, Utrecht UniversityPO Box 801553508 TD UtrechtThe NetherlandsE-mail: [email protected]
Norway Kari GraveNorwegian Veterinary InstituteP.O. Box 750 N-0106 OsloNORWAYE-mail: [email protected]
Kari Olli Helgesen (Alternate)Norwegian Veterinary InstituteP.O. Box 750 N-0106 OsloNORWAYE-mail: [email protected]

Sales of veterinary antimicrobial agents in 31 European countries in 2017Ninth ESVAC report103
Country Name and affiliation
Poland Dorota Żaboklicka-BodziochMinisterstwo Rolnictwa i Rozwoju Wsiul. Wspólna 3000-930 WarsawPOLANDE-mail: [email protected]
Katarzyna Szymanek (Alternate)PAŃSTWOWY INSTYTUT WETERYNARYJNYal. Partyzantow 5724-100 PulawyPOLANDE-mail: [email protected]
Portugal Ines Martins de AlmeidaDireção-Geral de Alimentação e VeterináriaCampo Grande, n.º 501700-093 LisboaPORTUGALE-mail: [email protected]
Joao Pedro Duarte de Silva (Alternate)Divisão de Gestão e Autorização de Medicamentos VeterináriosDireção-Geral de Alimentação e VeterináriaCampo Grande, n.º 501700-093 LisboaPORTUGALEmail: [email protected]
Romania Camelia VoicuInstitutul pentru Controlul Produselor Biologice si Medicamentelor de Uz Veterinar39 Dudului StreetSector 6060603 BucharestROMANIAE-mail: [email protected]
Slovakia Judita HederováInstitute for State Control of Veterinary Biologicals and Medicaments NitraÚstav štátnej kontroly veterinárnych biopreparátov a liečiv NitraBiovetská 34949 01 NitraSLOVAKIAE-mail: [email protected]
Martina Ihnátová (Alternate)State Veterinary and Food Administration of the Slovak RepublicŠtátna veterinárna a potravinová správa Slovenskej republikyBotanická 17842 13 BratislavaSLOVAKIAE-mail: [email protected]
Slovenia Anton SvetlinUprava Republike Slovenije za varno hrano, veterinarstvo in varstvo rastlinAdministration of the Republic of Slovenia for Food Safety, Veterinary Sector and Plant Protection (AFSVSPP)Dunajska 22SI-1000 LjubljanaSLOVENIAE-mail: [email protected]

Sales of veterinary antimicrobial agents in 31 European countries in 2017Ninth ESVAC report104
Country Name and affiliation
Spain Cristina Muñoz MaderoSpanish Agency of Medicines and Medical DevicesVeterinary DepartmentParque Empresarial Las MercedesEdificio 8C/ Campezo 128022 MadridSPAINE-mail: [email protected]
Sara Sacristán Álvarez (Alternate)Spanish Agency of Medicines and Medical DevicesVeterinary DepartmentParque Empresarial Las MercedesEdificio 8C/ Campezo 128022 MadridSPAINE-mail: [email protected]
Sweden Kinfe GirmaDepartment for Animal Welfare and HealthDivision for International Affairs and Animal Health Staff UnitSwedish Board of AgricultureSE-551 82 JönköpingSWEDENE-mail: [email protected]
Christina Greko (Alternate)Department of Animal Health and Antimicrobial Strategies, Strama VLStatens Veterinärmedicinska Anstalt, SVA (National Veterinary Institute)SE-751 89 UppsalaSWEDENE-mail: [email protected]
Switzerland Cedric MüntenerInstitute of veterinary pharmacology and toxicologyWinterthurerstrasse 2608057 ZürichSWITZERLANDE-mail: [email protected]
United Kingdom Ana VidalVeterinary Medicines DirectorateWoodham LaneNew Haw, AddlestoneKT15 3LS SurreyUNITED KINGDOME-mail: [email protected]
Alexandra Pickering (Alternate)Veterinary Medicines DirectorateWoodham LaneNew Haw, AddlestoneKT15 3LS SurreyUNITED KINGDOME-mail: [email protected]

Sales of veterinary antimicrobial agents in 31 European countries in 2017Ninth ESVAC report105
Annex 9. ESVAC sales advisory expert group members and observersTable A18. List of ESVAC sales advisory expert group members
Name Address Country
Kari Grave (chair) Norwegian Veterinary InstituteP.O. Box 750 N-0106 OsloNORWAYE-mail: [email protected]
Norway
Christina Greko Department of Animal Health and Antimicrobial Strategies, Strama VLStatens Veterinärmedicinska AnstaltSE-751 89 Uppsala SWEDENE-mail: [email protected]
Sweden
Katariina Kivilahti-Mäntylä Finnish Medicines AgencyMannerheimintie 103B00280 HelsinkiFINLANDE-mail: [email protected]
Finland
Laura Mie Jensen Danish Veterinary and Food AdministrationStationsparken 31-332600 GlostrupDENMARKE-mail: [email protected]
Denmark
Gérard Moulin Agence nationale de sécurité sanitaire de l’alimentation, de l’environnement et du travailParc d’activité de la Grande MarcheCS 70611 Javené8 rue Claude BourgelatF-35306 Fougères CedexFRANCEE-mail: [email protected]
France
Lucie Pokludová Ústav pro státní kontrolu veterinárních biopreparátů a léčivHudcova 56a621 00 Brno - MedlánkyCZECHIAE-mail: [email protected]
Czechia

Sales of veterinary antimicrobial agents in 31 European countries in 2017Ninth ESVAC report106
Table A19. List of ESVAC sales advisory expert group observers from the European Commission, ECDC and EFSA
Name Address Representing institution
Julie Sainz DG SANTE E5 – Animal nutrition, veterinary medicinesRue Breydel 41040 BrusselsBELGIUME-mail: [email protected]
European Commission
Klaus Weist European Centre for Disease Prevention and ControlTomtebodavägen 11 A171 83 StockholmSWEDENE-mail: [email protected]
European Centre for Disease Prevention and Control (ECDC)
Pierre-Alexandre Beloeil European Food Safety AuthorityLargo N. Palli 5/AI-43121 ParmaITALYE-mail: [email protected]
European Food Safety Authority (EFSA)

European Medicines Agency
Domenico Scarlattilaan 6 1083 HS Amsterdam The Netherlands
Telephone +31 (0)88 781 6000 Send a question www.ema.europa.eu/contact
www.ema.europa.eu
Sales of veterinary antimicrobial agents in 31 European countries in 2017Trends from 2010 to 2017Ninth ESVAC reportEMA/294674/2019
TC-AE-17-001-EN-N
© European Medicines Agency, 2019. Reproduction is authorised provided the source is acknowledged.