
SAITCHE S FOR OPTICAL C OMMUNICATION UTILIZ ING … · Puw Tadmedo kpsw FAST SWITCHES FOR OPTICAL...
77
AlU-AU9A 2b6 YALE UNIV NEW HAVEN1 C ONN DEPT OF ENGINEERING AND AP--ET C F/ q/3 FAST SAITCHE S FOR OPTICAL C OMMUNICATION UTILIZ ING OPTI CAL KERR _-ETC(U) MAR alI R K CHANG FAVAGA 78-C 0621 U C A S SIF E D R A D C -T R -8 0 -7 L
Transcript of SAITCHE S FOR OPTICAL C OMMUNICATION UTILIZ ING … · Puw Tadmedo kpsw FAST SWITCHES FOR OPTICAL...

AlU-AU9A 2b6 YALE UNIV NEW HAVEN1 C ONN DEPT OF ENGINEERING AND AP--ET C F/ q /3
FAST SAITCHE S FOR OPTICAL C OMMUNICATION UTILIZ ING OPTI CAL KERR _-ETC(U)
MAR alI R K CHANG FAVAGA 78-C 0621
U C A S S I F E D R A D C -T R -8 0 -7 L
3~ 2
DIH '*'2.0
IIIJIL 25 1.lI4 1111116
Ml ( ) ' ,) -. N l !l

T~O
ADCTRs..7Puw Tadmedo kpsw
FAST SWITCHES FOR OPTICALCOMMUNICATION UTIUZING OPTICAL
CC KERR OR ELLIPSE ROTATION EFFECTYale Univuslty
I*,&-- -1 Chq ,wo
APPUVW FOR PUBLIC ELEASE; DISTRIDTION UNUMITED
This research was supported by the Laboratory Director's Fund.
ROME AIR DEVELOPMENT CENTERM Air Force Systems Command
Griffiss Air Force Base, New York 13441
I709

This report has beem rew eed by the RAaC Public Affairs Of fice (PA) andis relessable to the National Teclical Information Service (NTIS). At NTISit will be relessable to the general public, Including foreign nations.
RADC-TR-80-87 has been reviewed and is approved for publication.
APPROVED:
BERNARD BENDOWProject Engineer
APPROVED: 64,,.s ~ ( A
CLARENCE D. TURNERActing DirectorSolid State Sciences Division
FOR THE CNADR
JOHN P. HUSSActing Chief, Plans Office
If your address has changed or if you wish to be removed from the RADCwailing list, or if the addressee is no longer employed by your organisation,please notify RADC (SO) Hanscom APB MA 01731. .This will asst us Inmaintaining a current miling list.
Do not return this copy. letain or destroy.
-. ° o

UNCLASS IFIEDsccuiitiy CLASSIFICATION Of THIS PAGE (Wetan DooEvoeld)
REPOT DCUMNTATON AGEREAD INSTRUCTIONS:_1E PORTD"UMNTATON PGE BEFORE COMPLEING FORM
1 4 GP a .OVT ACCESSION NO. 3. NECIPIENY*S CATALOG NUM9EN
*-"*k fe.&ANa&_S. TYPE 00 490ORT & PERIDO COVRLD
ST &W;TCHES FOR PTICAL QONMKUNICATION Final 7echnical ,ReiteLIZING PTICALTERR ORM~LPElc 77-3Se 9
Richard K./Chang I p,~{')F92-78-C70,21
Pt*FO*MO CRG AUIXA T ION N AME AN AOR -UUL 10. PROGRAM ELEMENT. PROJECT. T ASK
L Dept of Engineering and Applied Science -j -6UI
11 I. CONTROLLING OFFICE NAME ANO ADOWESS_ V-ZOTDE
SameUNCLASSI FIEDl5a. OIECL ASSI PIC ATIO00, OOWNGRADING
14. DISTRIBUTION STATEMENT tot this Aspenl)N/
Approved for public release; distribution unlimited.
I7. O#ST*,UuTION STATEMENT (te a. bstract entered in Oacke 20. it differsent from Reot)
Same
IS. SUPOLEM4ENrANY mores
RADC Project Engineer: Dr. Bernard Bendow (ESO)
This research was supported by the Laboratory Director's Fund.
IS. KEy WOqCS (Comese aen reverse aide of necoey and Idetifyp bl c Waeroe )
Nonlinear absorption Opticallv induced refractiveThird-order nonlinear optical effects index changes
N Bistability Fabry-Perot interferometerOptically activated light switches Photorefractive effect
ASTRACT (Conti.ean rarer"se ide i ,cecoess.r a"d Dde1fetr for block mineS,.)
Tis report summarizes the results of an investigation of severaldifferent types of optically activated light switches based on third-order nonlinear optical effects. Two optical switches utilizing thechange of refractive index induced in a nonlinear medium by an Intenselight beam are described: one utilizes a single-pass and the other amultiple-pass (Interferometric) geometry. Results of a search to findnew media with large nonl inearit les are given, and the possibilIity of - (t'-
IDO 1473 to, IT I o I'is IOnsolETE- UNCI.ASSIFIF.D ~/~ 9/SLCURIY CL ASSIFICATION OP THIS PAGE (W"e Dee. 90140940)
UNCLASSIFIED
r CUmITY CLASSIFCATIOM OF TWIS PAGC(tn DWO Enaftd)
increasing the nonlinearity of commonly used media by Raman-typeresonant enhancement is discussed. The theoretical and experimentalbehavior of a Fabry-Perot interferometer switch with a nonlinearlyabsorbing intracavity medium is also presented. In some cases, theswitch could be activated by anomalously low pump powers, and possiblemechanisms for this effect are discussed.
The results of a literature search on the photorefractive effect arepresented along with the results of an experimental effort to measure thephotorefractive effect in Ge:SiO 2.
UNCLASSIFIED
StCuRITY CLASSIVICAIOS O '-" WAGEfWhW DS t £ng.4)

TABLE OF CONTENTS
Page
I. Introduction 1
II. Optical Kerr Effect Switch 3
III. Fabry-Perot Interferometer Switch - Nonlinear Index 7
IV. Third-Order Nonlinear Susceptibility 14
A. X (3 ) in Liquids and Solids 14
B. Resonant Enhancement of X 19
V. Fabry-Perot Interferometer Switch - Nonlinear Absorption 24
A. Intracavity Excited-State Absorber 31
B. Intracavity Two-Photon Absorber 42
C. Discussion of Experimental Results - Induced
Index Change 49
VI. The Photorefractive Effect 55
References 58
Appendix A, Bibliography on the Photorefractive Effect 61
Accessicn For 7iI .
NTIS GPI&IPTIC T.4Unann o.rn -, vd DJust if leat tcil...
By - - -
Distribution/
Availability Codes
Avail and/orDict Special
iti
f i r....- _ 4&% '-.... ... n l

EVALUATION
ine report has been useful in indicating the possibility of optically
activated switching using semiconducting crystals in a Fabry-Perot
cavity. This design may eventually contribute to fast switching
components for C3 fiber optics systems related to TPO 3B.
/BERNR NOProject Engineer
iv

1. INTRODUCTION
The purpose of this work was to investigate the applicability of
third-order nonlinear optical effects to the problem of making light-
activated optical switches for fiber optics communications. The first
two sections of this report describe two optical switches based on the
change of refractive index induced in a nonlinear medium by an intense
light beam: in the first type of switch, the index change is probed
by a signal beam in a single-pass configuration; and in the second switch,
a resonant Fabry-Perot interferometer is used to enhance the signal
beam sensitivity to the induced index change.
An inherent difficulty with third-order nonlinear effects is that
they are generally observable only with relatively intense optical fields
which are incompatible with integrated and fiber optics. In the third
section of the report we therefore discuss our efforts toward finding
nonlinear liquid and solid media with large nonlinear susceptibilities
in an effort to reduce the pump beam power required in the switches
outlined above. The fourth section considers the possibility of enhanc-
ing the nonlinear susceptibility by tuning the pump and signal beams to
a Raman resonance of the nonlinear medium.
An interferometer can also be used to enhance the signal bean
sensitivity to nonlinear absorption induced by a pump beam, and in the
fifth section of the report we discuss the behavior of a Fabry-Perot
interferometer with intracavity excited-state or two-photon absorbers.
In our experimental investigation of such a device, using filter glass
as the excited-state absorber and CdS as the two-photon absorber, we
discovered that the interferometer switch could be activated by
anomalously low pump powers due to an induced index change in the
medium. Two possible mechanisms for this effect are discussed.
Finally, we present the results of our literature search to find
photorefractive materials and describe our experimental efforts to
observe the effect in a material reported to be photorefractive.
-2-

II. OPTICAL KERR EFFECT SWITCH
The optical Kerr effect' is a nonlinear optical effect Involving
(3)the third-order susceptibility x , in which a strong optical frequency
electric field induces optical birefringence in a normally isotropic
medium. This effect is usually observed experimentally by probing
the birefringence induced by the strong, linearly polarized pump bean at
frequency w pwith a weaker signal beam at frequency w slinearly polarized at
some angle y to the pump polarization. In the absence of the pump
beam, the signal beam is blocked by an analyzing polarizer, but when the
pump bean is present, the induced birefringence in the nonlinear medium
causes the signal beam to become elliptically polarized, thus allowing
some portion of it to pass through the analyzer (see Fig. 1). The
application of this effect as a switch is straightforward, as the signal
beam can be switched back and forth between the 'reject' and 'pass' parts
0 of the analyzer by turning the pump beam on and off.
For a linearly polarized pump beam, one defines two birefringent axes
parallel and perpendicular to the electric field of the pump. The signal
beam polarization is then resolved along these axes, and the difference
in refractive index A observed by the two polarization components is2
6= 6n1 6n
=21T X(3) JE 12
where n - linear refractive index of the medium, and 6ni, and 6n 1 refer
to induced index changes parallel and perpendicular to the pump polarization,
-3-

peReject
Pass
FIGURE 1. An optical Kerr effect shutter. In the absence of the strongpump (I ), the signal beam (Is) exits from the reject port of
the ana~yzer; when the pump beam is present, part of the signalbeam is switched to the pass port.
-4-
hhrn~rnrr[
respectively. The exact form of the nonlinear susceptibility X(3 )
depends on the symmetry of the medium and on the frequencies w and W .p s
The phase shift induced between the two polarization components of the
signal beam after traversing pathlength Z through the medium is
S
pump!
where X = wavelength of the signal beam and B = 2w X3) /ne, the opticalS s
Kerr coefficient. With the signal and pump polarizations at 45' to one
another (y = i/4), the transmission through the analyzer is
T = sin2 (4/2)
The pump intensity required to activate this switch can be calculated
using the known nonlinear susceptibilities of two highly nonlinear liquids,
CS2 and the nematic liquid crystal MBBA. Their optical Kerr coefficients
are3 ,4
B = 3.5 x 10 - cm 2 /ergCS2
BMBBA 2.9 x 10- 6 cm 2/erg (at 53C).
The pump intensities required to induce 75% transmission of the signal
beam for a 1 cm pathlength for each material are given in Table 1.

TABLE 1
2 2Liquid B(cm /erg) I(MC/em 2)
CS2 3.5 x 10- 7 368
MBBA 2.9 x 10⁶ 44
From these intensities it is clear that a device of this type would
not be a practical switch. MBBA is impractical because it must be kept
at a constant, elevated temperature (just above the nematic to isotropic
phase transition) and has a slow response time (' 50 nsec at 53'C)."
Although CS, has one of the largest nonlinear coefficients of any liquid,
the pump intensity required to induce T = 75% is so high that other non-
linear effects (e.g., self-focusing, stimulated Raman and Brillouin
scattering) will set in and obscure the desired Kerr effect. In the
following sections, we will discuss vari3us approaches we have taken in an
effort to obtain effective switching action with more manageable pump
powers.
-6-

wihi
III. FABRY-PEROT INTERFEROMETER SWITCH -NONLINEAR INDEX
A more efficient way to take advantage of the intensity dependent
refractive index of a nonlinear medium is to place the medium within
the cavity of a Fabry-Perot interferometer. When the signal beam is
tuned to resonance with the Fabry-Perot cavity it effectively makes many
passes through the intracavity medium, thus increasing the path length
Z, which results in a larger phase shift in the signal than would be
obtained in the single-vass Kerr switch due to a given induced index
change.
According to the simple plane wave theory of a Fabry-Perot inter-
ferometer having perfectly flat and exactly parallel mirrors, the
transmission is given by5
IT=21 + F sin 2 (kf)
where
F = 4R /(l - Rm m
R = mirror reflectivitym
k2. 2rnt/X s
A = wavelength of signal beams
= spacing between mirrors
For a lossless interferometer, the reflectivity of the etalon is just
R = I - T. If we allow the refractive index of the intracavity medium
to be intensity dependent, i.e., n - n + 6ni!, we have
-7-

27rn + 27in2 2o 2
s s
where
n2 6n1 l/)E 2
Thus, it is possible to change the transmission of the interferometer
2simply by varying the intracavity intensity (1Ej ). This device is
capable of operating in several different modes (bistable, transistor,
limiting) and is discussed in detail in Refs. 6 - 7.
Application of the nonlinear Fabry-Perot etalon as a switch requires
two light beams: (1) a weak signal beam (frequency , ) in near or exact
resonance (high transmission) with the Fabry-Perot cavity, and (2) a
strong pump beam (frequency w p) that irradiates the nonlinear medium
without interacting with the interferometer cavity (see Fig. 2) either
because it does not pass through the mirrors or because the mirrors do not
reflect light at frequency w . In one possible mode of operation, theP
cavity is initially tuned (by varying the mirror spacing, Q) so that
the weak signal beam is just off resonance, i.e., the transmission is
low, and the reflectivitv is high. The pump beam can then change the index
of refraction sufficiently to tune the cavity into resonance with the
signal beam, resulting in the signal beam switching from the reflected
to transmitted state. Similarly, one could initially tune the cavity
to high transmission at w and then have the pump beam switch the etalon
to high reflectivity at
-8-

r1
S Transmitted
b 7n state
Reflectedstate
R Rm m
p
FIGURE 2. The Fabry-Perot interferometer optical switch. The in-terferometer cavity is defined by the two mirrors ofreflectivity R. at uis with spacing Z. A pump inducedindex change in the nonlinear medium (n2) results inthe signal beam being switched between the transmittedand reflected states.
-9-

The induced refractive index change responsible for the nonlinear
behavior of the interferometer is identical to that responsible for the
optical Kerr effect; the only difference is in the way the index change is
probed by the signal beam. In the Kerr effect, the pump and signal beams are
polarized at 450 to one another, so that the signal sees both 6n and
6n and thus experiences a change in polarization state. In the non-
linear Fabry-Perot etalon, the signal and pump beam polarizations are
parallel to one another, so that the signal sees only a change in the
optical path length, due to the induced change in n. The relationship
between B and n2 is given here
2T (3)n
-Rc B.
The pump intensity required to switch the interferometer from the
reflecting to transmitting state (or vice versa) can be calculated from
the following expression using the known values of n2 for CS2 and MBBA.
T= 1
1 + F sin2(6 + v I )o pump
where 2ln Z
0 A os
27rn2 81 13 cm2
V x--1xl)v -- '-'- n c M1113
S 0
I = pump intensity (MW/cm 2pump
-J0-

Assume that the interferometer is tuned for an initial transmission of
T - 0.25 (R - 0.75) and we wish to switch to.T = 0.75 (R = 0.25),
assuming a mirror reflectivity of R = 0.80 (thus, the finesse § = 14).m
The required pump intensity is given by
V I = arsin(3/F) 12- arcsin(.33/F) 12
pump
I = .04Ir/vpump
.04A n C
16Trn x 10 M/cm .2
The pump intensities required for switching a nonlinear etalon with CS2
or MBBA as the intracavity medium, along with the n2 values of CS2 and
MBBA, are given in Table 2.
TABLE 2
material n2 (cm 3/erg) I pump(W/cm2
CS2 1.2 x 10⁻¹ 1 20.1
MBBA 9.0 x 10- 11 2.7
Comparison of Tables 1 and 2 shows that for the same nonlinear
material, the nonlinear Fabry-Perot interferometer makes a much more
efficient switch than the Kerr effect. This can be attributed directly
-1 1-
to the increased pathlength through the intracavity medium for the
signal beam due to the multipass nature of the resonant interferometer.
Although the finesse of a Fabry-Perot interferometer is defined as the
ratio of the frequency spacing of the transmission maxima to the
frequency bandwidth of a single transmission peak, it is also a fairly
direct measure of the number of round trip passes the signal beam makes
through the resonator. Thus, we see that for an etalon finesse of 14, hI,
the switching intensities required in the Kerr effect switch are about
17X greater than those required for the interferometer switch.
We have investigated this type of interferometer switch experimentally
using a HeNe signal beam (A - 632.8 nm) and a SHG of Nd:YAG pump beams
0 = 532.0 nm) with hoth CS2 and allo-ocimene (see next section) as the
nonlinear intracavity media. The interferometer mirror reflectivity was
R - 0.93, the mirror spacing was set to 1.6 cm, and an uncoated optical
cell (.Otical pathlength of 8 mm) containing the nonlinear medium w;as
placted in th. cavity, canted slightly off axis so that reflections from
the cell surfaces would not Interfere with the main signal beam. With
either liquid in the cell, the measured peak transmission of the inter-
ferom,.ter was about 20" and the finesse was measured to be % 20 (theoretical
finesse. for RM = .93 and pe-fect alignment is .= 43). The interferometer
was initially tuned to resonance (by piezoelectrically varying the
cavity spacing), so that the pump pulse should have caused a decrease in
transmission. We were unable to observe this predicted behavior, however,
and attribute our difficulty to thermal gradients induced in the nonlinear
-12-
liquids by the pump radiation. Thermal gradients cause index gradients
that distort the phase front of the signal beam in the cavity, thereby
degrading the interferometer's finesse and reducing the transmission of
the signal even when the cavity is tuned to resonance. In CS2, phase2'
22distortion occurred for pump intensities larger than 5 MW/cm 2 , well below
the calculated intensity (% 30 MW/cm 2 ) required to switch the etalon
from the transmitting to reflecting state; the behavior of the allo-
ocimene was comparable. In both cases, the interferometer finesse
and transmission recovered after the pump radiation was turned off with
a time constant of one or two seconds.
-13-

IV. THIRD-ORDER NONLINEAR SUSCEPTIBILITY
A. X (3 ) in Liquids and Solids
The two typesof switches outlined in the preceding sections would
both be feasible if materials with larger values of X(3 ) were available.
Unfortunately, CS2 seems to have the largest X(3)of any liquid reported
in the literature,8- 12 with the exception of some of the liquid crys-
tals,4 whose importance to this application can be discounted because
of their slow response and requirement of being kept at a constant,
elevated temperature.
In an effort to find liquids with larger nonlinear susceptibilities,
we have examined solutions of several linear conjugated molecules, a
class of organic molecules that has been reported 13 ,14 to show very large
(3)values of X The polarizability of the molecules in this class
increases nonlinearly with the length of the molecule due to the w electron
delocalization associated with the conjugated double bonds, resulting in
strong enhancement of the electronic contribution to nonlinear optical
properties with increasing chain length. We have measured the relative
magnitude of the optical Kerr coefficient B for several conjugated
molecules with respect to that of CS2 using the experimental arrangement
shown in Fig. 3, with X = 1.06 p (Nd:glass laser) and X = 632.8 nm
(HeNe laser). The results are given in Table 3. Only allo-ocimene has
a B value that is somewhat larger than that of CS This does not conflict
with Hermann's report1' of increasing nonlinearity with chain length
but merely reflects the fact that the saturation concentration of the
molecules in a solvent decreases with increasing chain length, partially
offsetting the concomitant increase in nonlinearity due to the reorienta-
-14-

PMT A SL
4
BS
C
L CL
P
FSL
P D _ _ _
L 2
FIGURE 3. Experimental arrangement for measuring relative magnitude
of (3 ) in conjugated molecules. The code is: LI, Q-switched
Nd:glass laser (1.06 w); L HeNe laser (.633 1,); DP, dielec-
tric polarizer at 1.06 P; BS, uncoated glass beamsplitter;
F, filters; PD1, photodiode detector to monitor 1.06 P radia-
tion; CL, cylindrical lens; SL, spherical lenses; P, calcite
polarizers; C, cell containing nonlinear liquid; M, mirror;
A, aperture; PMT, S-20 photomultiplIer detector.
-15-

tional and electronic contributions per molecule. Thus, the overall
nonlinear susceptibility of a pure liquid, like allo-ocimene21103
(N 3.6 x molecules/cm ) with few double bonds (3), is larger than
that of a much longer molecule like B-carotene (N = 1019 molecules/cm3
in benzene1 3). Our conclusion is that CS2 and allo-ocimene have the
largest optical nonlinearities of any liquids available to us for practical
device applications, and they are comparable.
Thus far we have considered only liquids as nonlinear media for
switch applications, primarily because the molecular densities of gases
are much too low to yield large macroscopic values of X3, and the use
of solids introduces several new problems, the most serious of which are
their low thresholds for optical damage and their poor optical quality.
The most highly nonlinear class of solids, with the fastest change in the
refractive index (all electronic), seems to be the semiconductors, many
of which are relatively soft and therefore difficult to polish. The
resulting small surface scratches and imperfections reduce even further
their threshold for laser intensity induced surface damage. A further
problem with solid media is that they often exhibit bulk strain induced
birefringence which can allow an undesirable amount of the signal beam
to leak through the analyzer in the Kerr effect switch, thus decreasing
its dynamic range. The Fabry-Perot interferometer type of switch requires
homogeneous intracavity media with flat surfaces for optimum performance,
since phase distortions in the wave front of the signal beam can severely
degrade the finesse of the interferometer (e.g., surfaces polished flat
-16-
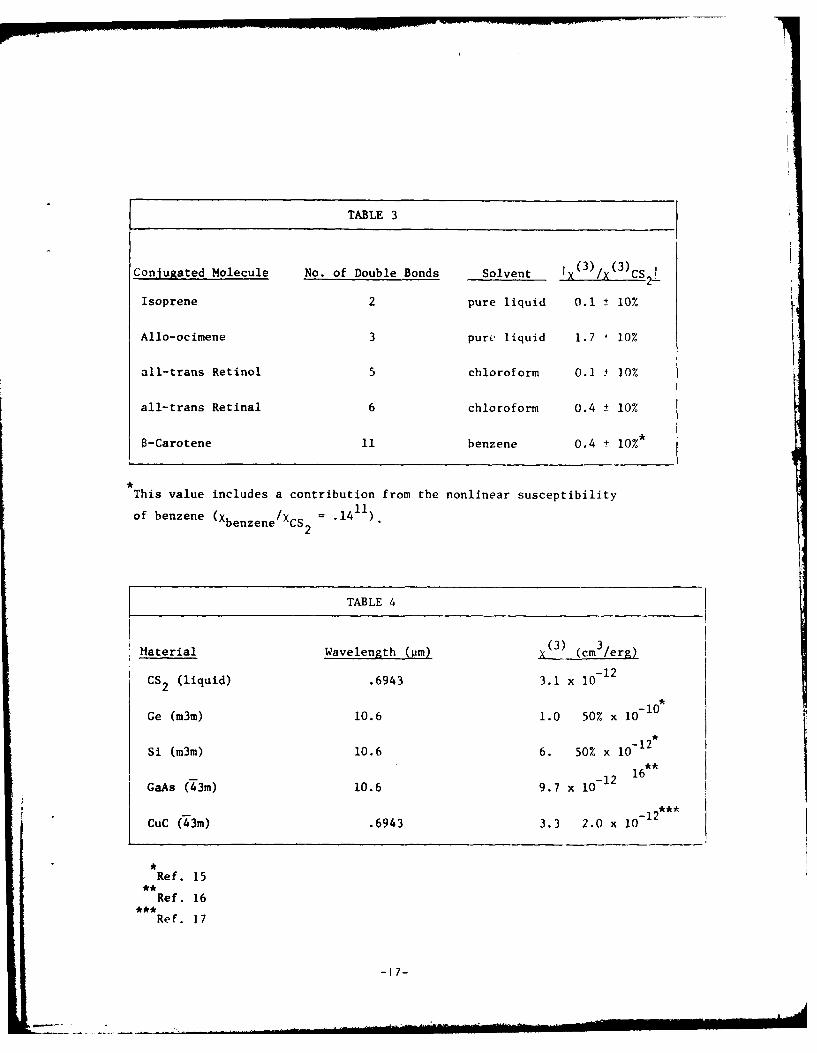
TABLE 3
Conjugated Molecule No. of Double Bonds Solvent 1x (3) /x (3)CS
Isoprene 2 pure liquid 0.1 ± 10%
Allo-ocimene 3 pure liquid 1.7 4 10%
all-trans Retinol 5 chloroform 0.1 i 10%
all-trans Retinal 6 chloroform 0.4 ± 10%
8-Carotene 11 benzene 0.4 + 10%
This value includes a contribution from the nonlinear susceptibility
of benzene (Xbenzene/Xcs2 1411)
TABLE 4
(3) 3Material Wavelength (pm) x (cm /erg)
CS2 (liquid) .6943 3.1 x I0- 12
Ge (m3m) 10.6 1.0 50% x I10- 0
Si (m3m) 10.6 6. 50% x 10- 12
GaAs (43m) 10.6 9.7 x 10⁻¹ 16
CuC (43m) .6943 3.3 2.0 x 10
Ref. 15
Ref. 16
Ref. 17
-17-
. . .. .... ," i* I I . . ... .. i, I I l lt I .. . . i ii . . ..... - - , ,Iie i[ "
. . . . . . . ... ...... .i I I. l.

to X/20 over the signal beam aperture will limit the cavity finesse to
10), thus decreasing the switch's sensitivity to the induced index change
(3)and lowering the maximum resonant transmission. The X values of only
a few semiconductors have been reported, and they are given in Table 4,
along with the corresponding value for CS2 used as a reference. As can
be seen, with the exception of Ge (which is opaque for wavelengths shorter
than 1.9 1j), semiconductors offer no significant increase in X (3) over
the liquids considered thus far, so in light of the other difficulties
associated with solids, we can conclude that they are not practical
media for use in the nonlinear switches described previously.
-18-
4. -
(3)
B. Resonant Enhancement of X
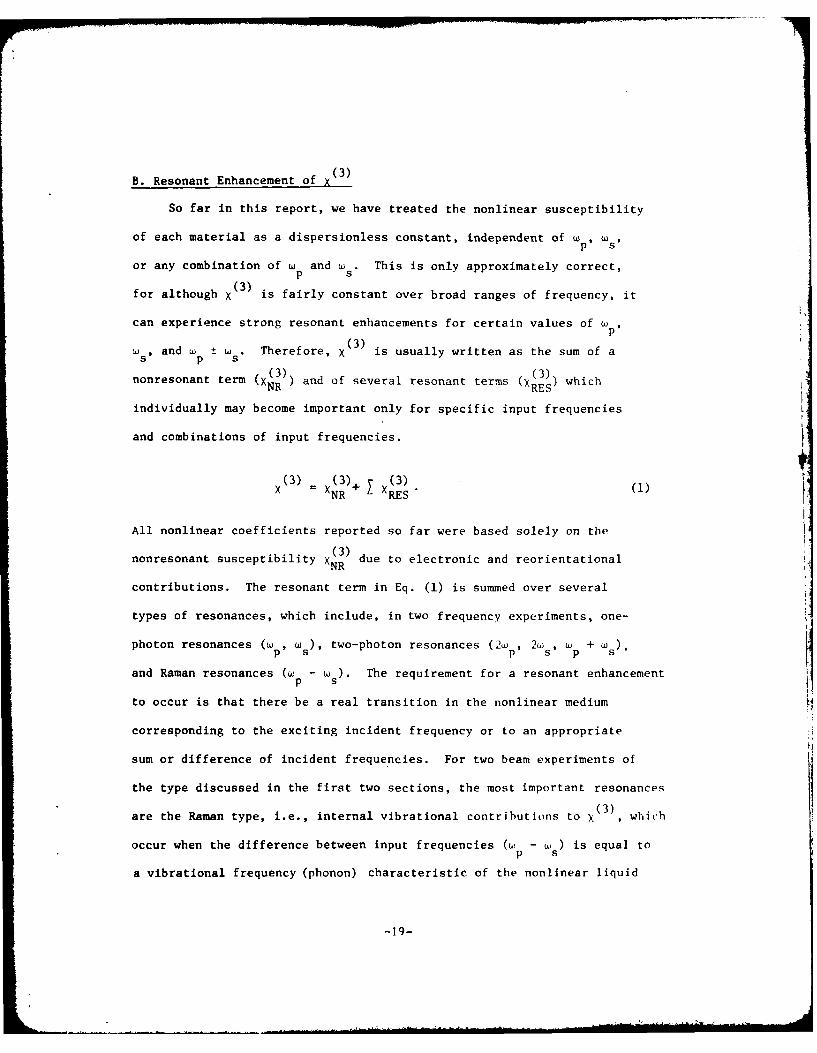
So far in this report, we have treated the nonlinear susceptibility
of each material as a dispersionless constant, independent of u p, ws ,
or any combination of w and w . This is only approximately correct,p s
can experience strong resonant enhancements for certain values of wp
(3), and w ± w . Therefore, X is usually written as the sum of a
s p snorsnn em"(3)(3
nonresonant term (XNR ) and of several resonant terms x (3)) whichNR RES )
individually may become important only for specific input frequencies
and combinations of input frequencies.
(3) .(3)+ (3)(i× NR RES"
All nonlinear coefficients reported so far were based solely on the
nonresonant susceptibility due to electronic and reorientationalnonesoantsuseptbilty NR
contributions. The resonant term in Eq. (1) is summed over several
types of resonances, which include, in two frequency experiments, one-
photon resonances (w p, w s), two-photon resonances (2w , 2ws , Wp + Ws ) ,
and Raman resonances (w - u). The requirement for a resonant enhancementp s
to occur is that there be a real transition in the nonlinear medium
corresponding to the exciting incident frequency or to an appropriate
sum or difference of incident frequencies. For two beam experiments of
the type discussed in the first two sections, the most important resonances
(3)are the Raman type, i.e., internal vibrational contributions to X , which
occur when the difference between input frequencies (G, - w ) is equal top s
a vibrational frequency (phonon) characteristic of the nonlinear liquid
-19-

(solid).16
In the vicinity of an isolated Raman resonance, the dominant term
(3)inq.()iin the sum over XRES in Eq. (1) is
(3) NO 12 /48hc
XRAMAN w R - (W - Ws) + i R (2)
where N = molecular density of medium
)2((III = diagonal Raman tensor element per molecule
wR = frequency of the Raman vibration
F = linewidth (HWHM) of the Raman vibration.R
This resonant susceptibility is proportional to the differential spontaneous
Raman scattering cross section per molecule (do/dQ) for the mode at wR
through the relationship
40 11 ) 2 C) do
S
From Eq. (2) we see that the amount of the enhancement in (3) when
- t, ) is .uned exactly to w is determined by F and do/d2. Thep R
inverse dependence on F is a common feature of X(3) due to non-Raman×RES
mechanisms as well and results in only modest enhancements when one- or
two-photons are resonant with a broad absorption band.
For both the Kerr switch and the Fabry-Perot interferometer switch,
the signal at the detector depends upon the square of the induced phase
-20-

change experienced upon traversing the medium, and therefore on the square
(3)of the magnitude of ×(3) Thus,
2a IX (3) + X(3) 2
s NR RAMAN
(3)V -w+ r]2 2[W R - 2W + AF] + 2
[R - Awl + r
where w = p - W., and we have defined a resonant enhancement parameter,
A, where
A2
48h (C:NR
Equation (3) is plotted in Fig. 4 as a function of the frequency difference
Aw tuned through wR' assuming an enhancement factor A = 2.0 and linewidthR9
r = 1.0 cm-. Note that the peak intensity depends solely on A; thus A
is an indicator of the amount of enhancement in XG3) obtained by tuning to
a Raman resonance. Values of A for several liquids have been reported
in a recent publication1 9 and are listed in Table 5 along with their
(3)corresponding values of XNR .Only exhibits significant resonant
enhancement, but its X (3) is so small that its overall X (3) on Raman×NR
(3)foCSresonance is still much smaller than XN for CS
-21-

6.
5.
4.
S
3.
2.
-8. -4. 0. 4. 8.
GR
FICURE 4. Plot of Eq. (3). Vertical axis is proportional to thesignal intensity (1,); horizontal axis is the mistuningof the difference between the signal and pump frequencies(w - o ) from the Raman mode ("'R). Values of the para-
meters in Eq. (3) are A = 2.0, 1' = 1.0 cm- 1 .
-22-

TABLE 5
Liquid WD. (cm )A ( 1 cm /cig)
C H 992 1.88 ± 0.08 4.23 + 0.196 6
CS2 656 1.02 ± 0.11 23.4 4 1.2
C6 H 5Ci 1002 0.73 ± 0.05 7.62 ± 0.53
C H N 991 1.07 ± 0.07 4.46 ± 0.36 5
C6 H 12802 4.15 ± 0.25 0.56 ± 0.04
-23-

V. FABRY-PEROT INTERFEROMETER SWITCH - NONLINEAR ABSORPTION
Because of its multipass nature, a resonant Fabry-Perot interferometer
is sensitive not only to induced index changes in the intracavity medium
but to induced absorption as well, so that a small change in absorption
within the cavity can have a large effect on the total transmission and
reflection of the etalon. In the following section, we will show that
it is possible to make an effective light activated switch by placing
a material whose absorption at w increases with the light intensity at
W (nonlinear absorber) within the interferometer cavity.p
The transmission (T) and reflectivity (R) of a Fabry-Perot inter-
ferometer with an absorbing intracavity medium are (in the plane wave
approximation, assuming perfectly flat and parallel mirrors)
U Re -at /( R e- a z(1 - R ) (1 R
T=m m
1 + F sin (k£)
-alO 2 2R 1-e -a ) + F sin 2(k)
-R em
I + F sin 2(k£)
where4R em2
F= m
ml2F (1 - R me -a)
a absorption coefficient of intracavity medium.
With the cavity tuned to resonance [sin(kZ) = 0], these expressions reduce to
-24-

R2 e-a2
m
R=R(tl2e(42
-l'
mm
is to be expected, since an opaque intracavity medium will prevent the
signal beam from reaching the second mirror of the interferometer, in
which case the problem reduces to simple reflection from a single mirror
of reflectivity Rm. In Fig.5 we have plotted T and R from Eqs. (4) and
(5) as functions of the absorption a for five values of finesse, assuming
t. = 1.0 cm. The F = 0 curves correspond to the case of single-pass
absorption of w S, i.e., no cavity is present. These curves show that the
use of a cavity of even modest finesse (1- 10) dramatically enhances the
sensitivity to a over the single-pass case.
The behavior of a switch based on this device can be deduced from
Fig. 5. The cavity is initially tuned to resonance at w s so the transmission
of the signal is high and the reflectivity is low. When the strong beam
at W is present, the induced absorption at w Swill destroy the finesse
of the cavity, thus causing the signal to be reflected rather than
transmitted. In a high finesse cavity, a relatively small increase in ai
will result in a large decrease in T with little energy loss in the absorbing
medium (in the limiting case, the loss =1 - R m). The advantages of
-25-

1.0-
T
0.5
(a)Y 0
0.0 ---
0.0 0.5 1.0 1.5 2.0
1.01
F = 40F = 30
F= 20
R F = 10
0.5
(b)
0.0 F=0
0.0 0.5 1.0 1.5 2.0
FIG;URE 5. 0:) Transmission of a, resonant Fabry-Perot interferometer as afunction of the intracavity absorption, LX. for different valuesof finesse (P = 0, 10, 20, 30, 40) [Eq. (4)]. (b) Reflectivityof the resonant interferometer for the same conditions as in(a) [Eq. (5)1.
-26-
placing the absorber in a resonant cavity are two-fold: (1) the switch
sensitivity to induced absorption is increased over the single-pass case;
and (2) much of the signal that is not transmitted is reflected by the
etalon, rather than simply lost to absorption, as occurs in the single-
pass case.
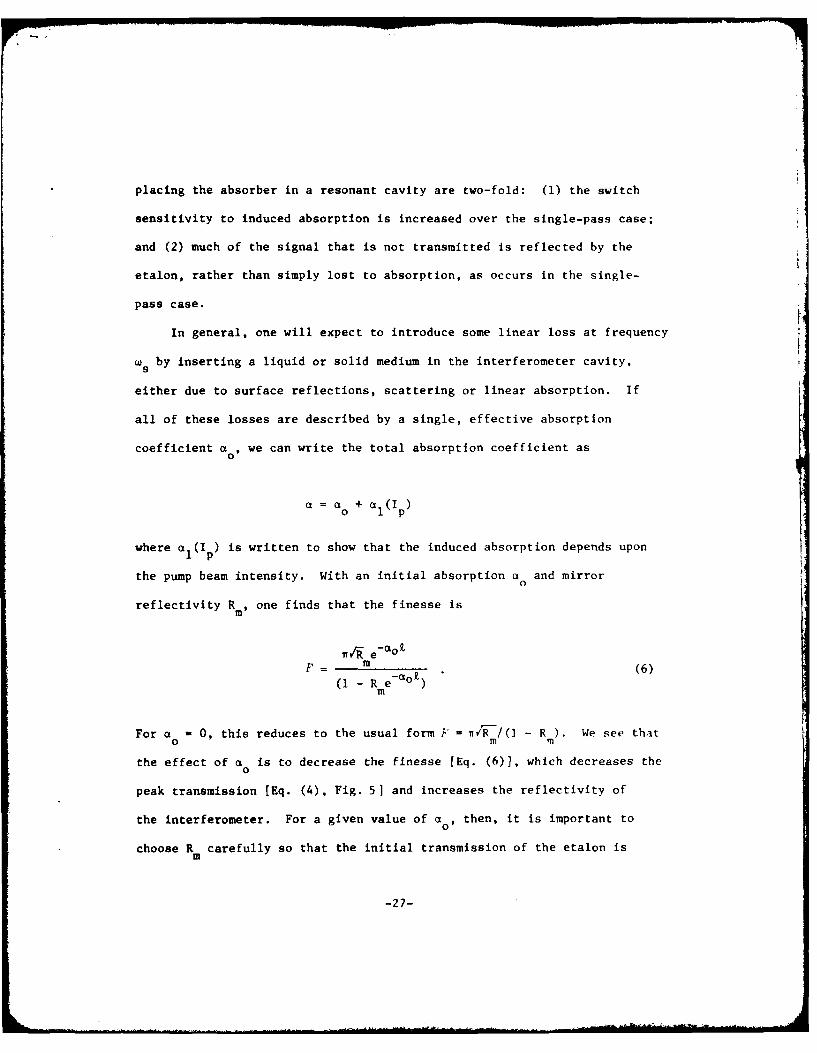
In general, one will expect to introduce some linear loss at frequency
w by inserting a liquid or solid medium in the interferometer cavity,s
either due to surface reflections, scattering or linear absorption. If
all of these losses are described by a single, effective absorption
coefficient a , we can write the total absorption coefficient as
a = a + aL(Ip)
where a (I p ) is written to show that the induced absorption depends upon
the pump beam intensity. With an initial absorption a0 and mirror
reflectivity Rm, one finds that the finesse is
wr e-aOi
F m (6)
(1 - R e - a ° t)m
For a - 0, this reduces to the usual form F = /r-/(I - R ). We see thatO m m
the effect of a is to decrease the finesse [Eq. (6)1, which decreases the0
peak transmission [Eq. (4), Fig. 5] and increases the reflectivity of
the interferometer. For a given value of ao, then, it is important to
choose R carefully so that the initial transmission of the etalon ism
-27-
_X_

sufficiently high, but the finesse is not too severely degraded. For
example, if a 0 = .05 and R m= 0.90, the finesse = 20.2 and T = .46, so
that although the finesse is high, the maximum transmission of the switch
is only 46% in the 'on' state, and the reflected component is 0.10
(ideally R = 0). A better choice of mirror reflectivity would be R m= .65,
which would result in a low finesse (F =6.5), but good transmission in
the 'on' state (T = .80, R = .08). In Fig. 6 we have plotted T, R, and
I - (T + R) (loss to absorption) for an etalon with a k = .02 (which
corresponds to a single-pass loss through medium of 2.0%) and R m= .85.
For these values, the interferometer has a finesse of 17.2. In the 'on'
state (a = a) the transmission is 79.2% and R = 1.2%. In the 'off'
state (in which we assume a = 1.0 cm- ), the reflectivity is 71.9% and
T = 1.8%. Thus, the net loss of the switch is nu 30%.
We have investigated this type of switch with media that owe their
nonlinear absorption properties to two different mechanisms: (1) excited-
state absorption, and (2) two-photon absorption. In an excited-state
absorber, the w pbeam is partially or fully absorbed in the medium, thus
exciting part of the ground state population into the absorbing state.
The beam at w ,which initially traversed the sample (in its ground state)
without any absorption, then excites transitions from the excited state
(populated by w ) to even higher lying levels. The sample thus absorbsp
radiation at w suntil the excited state population decays away (with time
constant T). This dependence of the absorption at wsupon a material
parameter (T) rather than upon the pump pulse duration is a disadvantage
-28-

1.0
.9
.8
.7
.6
.5
.4
.3(R+T
.2
.1
=.02 0.5 1.0 1 .5 2.0
FIGURE 6. Transmission CT), reflectivity (R), and absorptive loss
[1 - CR + T)] of a resonant Fabry-Perot interferometer as
a function of the intracavity absorption. The initialcavity characteristics arc: i 0' .02 and R m .8'),
yielding a finesse of 17.0
-29-

for fast switching applications because many relatively efficient excited
state absorbers have long excited state lifetimes and would thus limit
the duty cycle of the switch.
(3)Two-photon absorption is a r-nlinear optical [X effect in which
photons from each of the two input beams (ws , W p) are simultaneously
absorbed, although neither photon individually is energetic enough to
excite any transitions in the medium (i.e., the medium is transparent
to w ind w ). The transmission of the signal beam is described byp s
zI (z) = I (O)e P
s s
where I = two-photon absorption coefficient (frequently expressed in units of
cm/M and I is the pump beam intensity (M/cm2 ). Because there are noP
intermediate states to be populated, the duration of the absorption at
W is determiend by the pump beam duration, not by any material parameters.
Thus, unlike the case with many excited-state absorbers, it is possible
to induce nanosecond duration absorption at wc . The disadvantage of two-
photon absorption is that it is usually a weaker effect than excited state
absorpt ion.
- 10-

V.
A. Intracavity Excited-State Absorber
Our first experiments on the nonlinearly absorbing Fabry-Perot inter-
ferometer switch were done with glasses exhibiting strong excited-state
absorption as the nonlinear media. Glass media are attractive for this
application because they can be made with good optical quality and are
relatively hard, thus making it po6sible to cut and polish them to the
flatness required for intracavity use. We therefore searched through
30 glass color filters from Schott, Hoya and Corning in an effort to find
the sample with the largest absorption at 632.8 nm induced by a 10 ns
duration pump pulse at 532.0 nm (these laser wavelengths were chosen
because they were conveniently available in our lab). We found that the
best choice was Schott OG-530, an orange, sharp-cut, long wavelength pass
filter with its absorption edge near 532.0 nm (a532 1.5 cm The
characteristics of this material were measured using the experimental set-tip
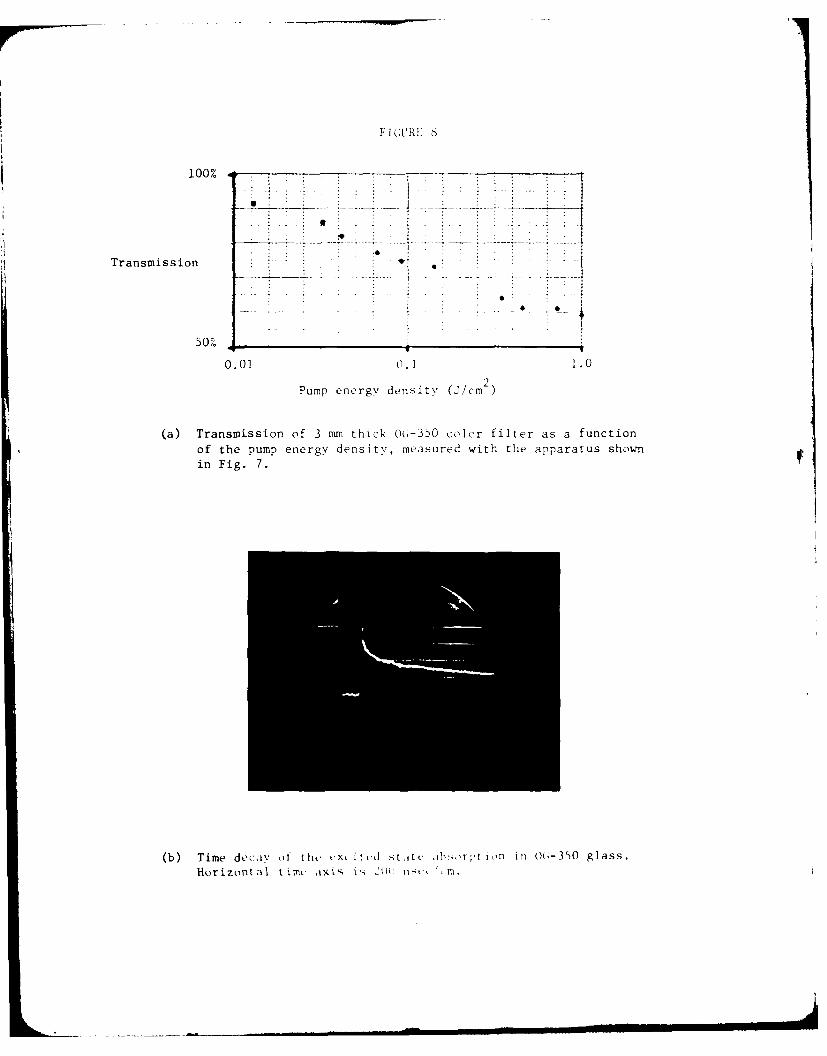
shown in Fig. 7, and the results are shown in Fig. 8. Figure 8(0) shows
the transmission through a 3 mm thick sample as a function of the pump
energy density (1.0 J/cm 2 corresponds to a 2.5 m.] pulse). Figure 8(b) is
a photograph of an oscilloscope trace showing the time decay of the
induced absorption of the signal beam. The relaxation time of the tail is
estimated to be . 40 ps. Although the optical quality of Schott filter
glass is not very good, we were able to obtain a special piece from Schott
with very low inhomogenelty (tn _ 2 x 10- and had It polished with two
opposite faces flat to \120. The measured transmission at Brewster's
angle was only about 887 at w , which implies an a = .14 cm (pathlengthSt 0
through the sample at Brewster's angle Is .89 cm). This is much higher

PD
6 32.8 nm (HeNe)F
P
A = 532 n (SHG Nd:YA )
~IBSND LP00!3
FIGURE 7. Expt-rimetital arrangement used to measure excited-state absorp-tion in filter glass OG-530. The code is: P, polarizers;M, mirrors; ND, neutral density filters; L 150 cm focal lengthlens; L, 36 cm focal length lens; BS, beam stop; F, 632.8 nminterterenct- filter; PM, prism; PD, photodiode detector. Thepump and signal beams cross in the sample at an angle of ",50 .
-32-
F I( CR 8
100%
Transmission __________
0.01 uJ1.0
Pump energy densitv (/cm2
(a) Transmission of 3 mm thick OG-350 color filter as a function
of the pump energy density, mea3sured with the apparatus shownin Fig. 7.
(b) Time decav of tilt' CX it 1 d staitc ibsorpt Ion in CW-3W0 glass.Horizo-,ntal tim.t a~i i IS2O jt) ;' ',- M,

-
_ _ _ _ _ _ _ - -_ _ _
--
than anticipated from measurements made on the original filter; the difference
is probably due to melt-to-melt variations in the glass production.
With this piece placed in the interferometer cavity (Rm = .93 at
632.8 m), we did observe the expected switching behavior with the
experimental arra.ngement shown in Fig. 9. Figure 10 shows the decrease
in transmission observed when the sample is within the cavity [Fig. 10(a)],
and when the cavity is removed [Fig. 10(b)], for the same pump intensity.
In this case, an induced single-pass absorption of 24% caused a decrease
of the interferometer transmission to %~ 24% of its initial value. Thus,
the effective 'gain' of the interferometer was about a factor 3. However,
the overall transmission of the interferometer was only 14% because of the
large linear absorption in the OG-530 glass. The calculated values of
the transmission, reflectivity and finesse of a cavity with a 0 = .14 cm1
k. .89 cm, and R - .93, are given in Table 6 along with the measured values.
TABLE 6
T R F
Calculated .14 .40 16
Measured .17 .57 14
For a cavity with finesse 14, an induced single-pass absorption of 24%, is
calculated to yield a transmission of 20%, which is in reasonable agreement
with the measured value of 24%.
-34-

FIGURE 9
(a) Photograph of experimental set-up used in investigation of the Fabry-Perotinterferometer optical switch.
-,PDI
Xs 632.8 nm
X=532 nm D
CF . -
CFT
ND > L
Li
I(b) Schematic diagram corresponding to photograph in (a). The code is: M, mirrors;A, apertures; Li, 50 cm focal length lens; L2, 25 cm focal length lens; ND, neutraldensity filters; CF, color filters to block 532 nm; P, pellicle beamsplitter;FP, Fabry-Perot interferometer; T, telescope; S, intracavity nonlinear absorber;PDl, photodiode monitoring transmitted signal; Pfl2, photodiode monitoring reflectedsignal.

(c) Close-up view of thk, intu.rieromiter cavity with the CdScrystal in place, at Brewst yr's angle.
- -
101.~ ) ns., T
Transmission (a)
Transmission (b)
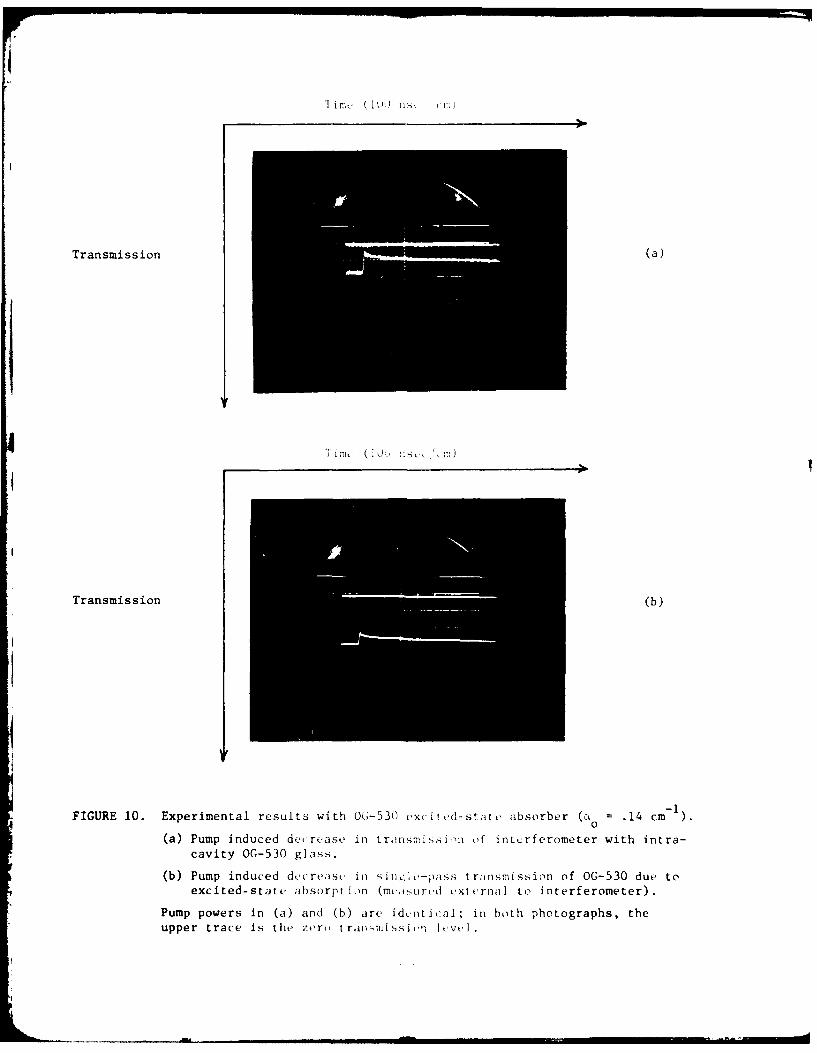
-1FIGURE 10. Experimental results with OG-530 excited-state absorber (a = .14 cm I
(a) Pump induced decrease in trinsmission of intcrferometer with intra-
cavity OG-530 glass.
(b) Pump induced dCcrease in ink, i-piss tr~insmission of OG-530 due toexcited-state absorption (me.isurud external to interferometer).
Pump powers in (a) and (b) are identical; in both photographs, theupper trace is the zero t ranMi Ssi -n I ,vI

In an effort to improve the transmission of the switch, we replaced
the special piece of OG-530 material with an ordinary OG-530 color filter
(3 mm thick). At Brewster's angle, the single-pass loss was < 1%, which
implies a 0< .03 cm .The measured transmission and finesse of the
cavity with and without the filter glass are given in Table 7.
TABLE 7
Empty Resonator OG-530 Filter
T 70 ±10% 50 ±10%
F30 14
For R = .93 and a 0 .03 cm -1, we calculate F =36; the low value of the
measured finesse is probably due to bulk inhomogeneities and nonflat surfaces
of the filter. The measured finesse of the empty cavity is also well
below the calculated finesse (F = 43), probably due to surface error in
the cavity mirrors (mirror surfaces are flat to X/20 over the entire
aperture; over the 1 to 2 mm diameter region probed by the HeNe laser,
the flatness should be better, but probably is not good enough to allow
a finesse of 43).
Figure 11 shows the induced change in transmission with the filter
glass in the cavity. In Fig. 11(a) and (b), the switch is initially in
the transmitting state and is switched to T t, 15% by a pump beam with energy
density of .02 3/cm 2(single pass T =93%). The only difference between
-38-

FIGURE 11
Time (100 nsec/cm)
Transmission (a)
Time (100 nsec/cm)
Transmission (b)

Time (100 nsec/cm)
Transmi ss ion (c)
FIGURE 11. Pump induced change in transmission of Fabry-Perot inter-ferometer with intrac-.vity OG-530 color filter. (a) and(b) differ only in the initial tuning of the cavity.(c) shows pump induced increase in transmission for differentinitial tuning and lower pump energy than in (a) or (b).

the conditions for (a) and (b) is the initial tuning of the cavity. In
Fig. 11(c), the etalon is initially partially transmitting, and the
2transmission is increased by a pump beam with energy density .007 J/cm
The behavior indicated by these three photographs is completely different
from that observed with the other OG-530 sample. In this case, the
induced change in transmission is due to an induced change in refractive
index, rather than to induced absorption. It is not possible for an
increase in absorption to cause an increase in transmission of the
interferometer. In addition, the induced absorption measured for the
conditions in Fig. 11 is too small to account for the large observed
changes in etalon transmissicn. For the conditions of Fig. 11(a), the
single-pass absorption was measured to be 7%, which would result in an
interferometer transmission of 60% (cavity finesse = 15). This is greater
than the observed value of 15%. We attribute this behavior to an
index change in the sample induced by the partially absorbed pump beam
and will discuss possible mechanisms for this effect later on in the
report.
-41-

B. Intracavity Two-Photon Absorber
The long relaxation time of the excited state in OG-530 filter glass
makes that material unacceptable for application in a fast optical switch.
Because all of the other glasses we examined had comparable relaxation
times, we decided to replace the excited-state absorber with a true
two-photon absorber in the interferometer cavity. For the pump pulses
of " 10 nsec duration used in this experiment, the turn on and turn off
times of the switch will then be largely determined by the pump pulse
duration, although for shorter pulses, the interferometer lifetime
( 1 ns for a I cm cavity) would become the limiting factor on the
switching speed.
Cadmium sulfide is known to be a good two7photon absorber and is
attractive in this applicaticn because it is transparent to the HeNe
signal laser and nearly transparent to the SHG Nd:YAG pump radiation
(a 532. .44 cm- . Although many measurements have been made of the
two-photon absorption coefficient ( ) for CdS, agreement among the
reported values is not good, and no determinations have been made for
the wavelengths used in our work. Therefore, we have made a rough
measurement of t using the 532.0 nm pump and 632.8 nm signal beams
(w + w = 4.29 eV) with an experimental arrangement identical to thatp s
2shown in Fig. 7. We find that P = .4 + .2 MW/cm , which is higher than
indicated by a recent series of measurements2 0 (W2-photon = 3.18, 3.56,
3.91 (V), hut may reflect an enhancement due to the nroximit\, of the
pump wavelength to the absorption edge of the crystal. We have also
-42-

measured the linear loss of our sample at Brewster's angle and find that
a .08 cm- for an optical path length of 0.54 cm. Thus, for a
cavity finesse of 15, we expect a 1 MW/cm 2pulse to cause the inter-
ferometer transmission to decrease to about 50% of its initial value.
At this intensity level there is little danger of causing optically
induced damage to the CdS crystal.
With the 5 mm thick CdS crystal in the interferometer cavity at
Brewster's angle, the measured transmission was .~ 10% and the finesse
was % 15. The linear absorption is too low to account for such poor
transmission, which we therefore attribute to phase distortion of the
signal beam due to the poor optical quality of the crystal (CdS is very
soft and therefore difficult to polish to flat, scratch-free surfaces).
Experimentally, we found that the UdS caused strong switching behavior
for input intensities that were much too low to induce significant true
two-photon absorption. In Fig. 12(a) the pump pulse has caused the
transmission to drop to 32% of its initial value for an input intensity
2of 2 MW/cm . Although we have estimated that this intensity should be
able to cause significant two-photon absorption, we find that the single-
pass loss induced for a pump intensity of 5.6 MW/cm 2is only - 7%, which
is much too low to account for large changes in transmission with the
cavity present. This apparent disagreement with our measured value of
6 is due to poor overlap of the pump and sigiril beams in the crystal
when it is in the cavity. Also noteworthy in Fig. 12(a) is the long
recovery time of the transmission. The pump pulse duration is only
-43-
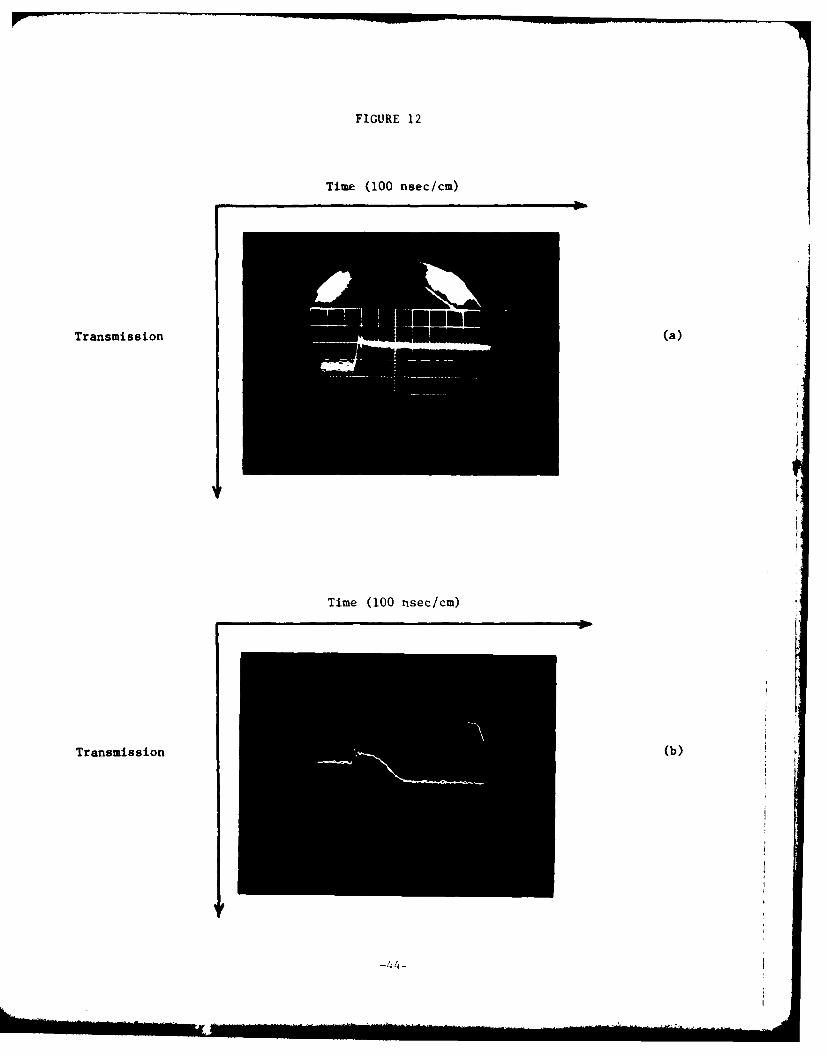
FIGURE 12
Time (100 nsec/cm)
Transmission (a)
Time (100 nsec/cm)
Transmission (b)

Time (100 nsekjcm)
Transmission()
FIGURE 12. Pump induced change in transmission of a Fabrv-Per'tinterferometer with intracavitv CdS crystal for differentpump energies and different initial cavity tuning. Pumpenergy densities are: (a) 11.0 mJ/cm2; (b) 39.8 mi/cm2;and (c) 95.5 mJ/cm2 .

10 nsec, but during the 70 nsec shown in the photograph following the
pulse, the transmission increases only slightly toward its original
level [although 100 ms later, when the next pump pulse is fired, the
transmission has fully recovered; note that many successive traces are
shown in Fig. 1'(a)]. Figures 12(b) and (c) show the etalon trans-
mission for higher pump powers and different initial cavity tuning. In
both cases, the cavity is Initially tuned for partial transmission, and
the pump pulse induces a sharp decrease in T. During the relaxation
period after the pulse, the transmission increases to the fully 'on'
state in (h), and then cvcles through the fully transmitting state back
down to the initial transmission in (c). In both cases, the trans-
mission full\ recovers to its initial value before the next pump
pulse (100 i . Simply by changing the initial cavity tuning, it is
possible to obtain waveforms similar to any of those shown in Fig. 12,
as well as waveform, that ;how an initial, sharp increase in transmission.
Fhi, behavior tin ht. ntderst ood sith the aid of Fig. I i, in which the
interierometer transmission is plotted as a function of the optical
length within the cavity (whith can be varied by changing the cavity
spacing , or the crystal index of refraction n). In Fig. 13 (a) the
process responsible tor the behavior shown in Fig. 12(a) is indicated.
The cavity is initi alIy tuned to point A bv piezoelectrically varying
the cavity spacing .) lti pump pulse then causes a rapid index change
(step function proportional to the laser energy) which tunes the cavity
to point B, a transmission minimum. As the index slowly recovers

A
C B *
C
Transmissijon
A (b)
B
A
c c
BB
Cavity tuning (nc)
FIGURE 13. Explanation of the interferometer transmission behavior observedin Fig. 12 due to pump induced index change in intracavity CdScrystal. (a), (b), and (c) correspond to 12(a), 12(b), and 12(c),respectively. In all cases, A is the tuning of the cavity priorto the pump oulse, B is the tuning immediately after the pulse,and C is the tuning at the end ,. t,' traces shown in Fig. 12( 70 nsec after the pump pulse,
-47-

toward its initial value, the transmission does not increase until the
cavity tuning recovers past point C, which requires a longer tine than
16 shown in Fig. 12(a). Figure 13(b) explains the behavior observed in
Fig. 12(b). The cavity is manually tuned to point A, and the pump induced
index change retunes the cavity to point B. As the index recovers
toward its initial value, the transmission moves along the tuning
curve to a maximum at point C [this is the situation at the end of the
oscilloscope trace shown in Fig. 12(b)]. When the pump pulse initially
induces the index change, the transmission must also follow the tuning
curve on its way from A to B, but no transmission peak is observed
because the response of our oscilloscope is inadequate to resolve the
peak produced by tuning from A through C to B in 10 ns. Figure 13(c)
corresponds to Fig. 12 (c) and is interpreted as in (a) and (b) above;
the only difference is that the initial index change is greater because
the pump energy is greater in this case. As before, point A represents
the cavity tuning before the pump pulse, B represents the tuning immedi-
ately after the pulse, and C is the tuning at the end of the trace shown in
the photograph (x70 ns after the pulse).
-48-

C. Discussion of Experimental Results - Induced Index Change
Although the experimental results shown so far for the intracavitv
filter glass and CdS crystal unambiguously indicate that the pump
induced transmission change is due to a change in index rather than in
absorption, the mechanism for this index change remains unresolved.
The two most plausible mechanisms are that: (1) the index change is
thermally induced by the 532.0 nm light absorbed by the sample; and
(2) the index change is due to the population of excited electronic
states by the absorbed pump radiation. We have verified that the
mechanism is dependent on the absorption of the pump radiation by shift-
ing the pump wavelength to the red where neither OC-530 glass or CdS
is strongly absorbing (recall that 532.0 nm is near the absorption edge
of OG-530 and CdS). The results of this experiment are given in Table 8,
where the parameter n is defined as the ratio of pump energy density
(mJ/cm 2 ) to induced change in Interferometer transmission (7 of maximum
transmission). The increase in n for the two material' as moves to
longer wavelengths indicates that higher input Energy densities are
required to induce a given transmission change as the linear absorption
at w decreases.p
TABIE 8
(nr) = '32. 565. 600. 620.p
OG-530 n(mJ/cm) = 29. 62 361 1100
** 2CdS n(mJ/cm ) = 26. 91
*for OG-530, finesse "', 20
for CdS, finesse 1, 10
-4 9 -)

We have made estimates of the magnitude of the index changes for
which each of the two mechanisms may account and compared these numbers
with the estimated index change required for the effects we observe.
The transmission of an interferometer as a function of the index
tuning away from resonance (6n) is:
1T(6n) =
1 + F sin2( 2r 6n9
This is solved to yield
n 1 1/2
2,n/ arcsin{-(---1)
From this we find that for an interferometer of finesse 15, a reduction
of the transmission to 337 of its initial value requires an index change
of dn/n = 2.0 x 10⁶.
The thermally induced index change can be calculated from the known
absorption of the material at 532.0 nm, its density, heat capacity, and
its value of )n/,T. These values are known in the case of CdS and are
listed in Table 9.21
TABLE 9
-iIinvar absorption, 532 .44 cm
Heat capacity, C .080 cal/gm- 'Kp
Density, i, = 4.82 gm/cm3
Refractive index change with temperature, ,n/:,T = 1.0 x 10⁻⁴ /K

In Fig. 12(a) the switch transmission is reduced to % 32% of its initial
2value by a pump pulse of energy density 11.0 mJ/cm . Of the 80% of the
energy transmitted by the crystal surface, 20% is absorbed over the 5 mm
thickness of the crystal, causing a temperature increase in the illuminated
region of 2.1 x 10- 3 K. This temperature increase causes an index change of
6n/n = 8.7 x 10- 8 , a factor of 20 times smaller than that estimated to be
necessary to produce a transmission of 33%.
The magnitude of the index change produced by the population redistribu-
tion mechanism can be crudely estimated from a free electron model in
which the dielectric constant at w is written ass
C(Ws bound + 1 - (Wp /Ws)2
where (Ebound + 1) is the contribution due to bound electrons and free
space, and - (W s)2 is the contribution due to the free carriers created
by the absorbed pump photons. The plasma frequency, p,, is given by
2 4i'Ne2p! *
m
where N = density of photo-induced free carriers
m = effective mass of the free carriers.
If we assume that initially N = 0, the index change is simply due to the
free carriers created by the pump, and
-5M-

6n =27vNe2
n *22mnws
2Again for an incident energy density of 11.0 mJ/cm 2, we find that
15 -3 -6N = 9.3 x 10 cm , which results in 6n/n = 1.3 x 10 Although this
index change is very close to the index change estimated necessary to cause
T = 33,, it is almost certainly an overestimate, since this simple
free electron model has ignored the effect of trapped states which will
tend to decrease the number of free carriers.
We have also estimated the relaxation time of a thermal or free
carrier induced change in the refractive index of CdS. From three-photon
induced conductivity experiments, Jayaraman and Lee 2 2 have found that the
conductivity decay in CdS exhibits three distinct regions: (1) fast re-
laxation on the order of I wsec due to free carrier recombination and
trap filling; (2) intermediate relaxation on the order of 35 isec due to
the release of electrons from traps; and (3) a very slow (%seconds) re-
laxation due to the emptying of low lying traps close to the equilibrium
Fermi level. These relaxation times are not inconsistent with our results
on CdS; however, we are unable to establish quantitative agreement because
the apparent relaxation of the induced index change observed with CdS in
the interferometer depends strongly on the initial cavity tuning. We are
therefore unable to make an accurate measurement of the true relaxation
time of the induced index change.
The relaxation timL of a thermally induced index change can be roughly
estimated by considering the simple problem of transient heat flow in an
-52-

infinite solid in one dimension. Assume that the pump laser induces a
Gaussian-distributed high temperature region described by
x22/A 2
T(x,t = 0) = T e0
where T = maximum initial temperature (at x = 0), and A = radius of the
heated spot. By solving the transient heat flow equation in one dimension,
one can show that the time behavior of the temperature at the spot center
is
AT(x = 0, t) = T 2 A (7)
0 (A2 + 4dt)1/2L
where
a = thermal diffusivity =k/cp
k = thermal conductivity
p = density
c = heat capacity.p
From Eq. (7) we find that the temperature decays away to one-half of its
initial value after time t1 1 2 , where
3A2
1/2 4a
21 2For CdS, k = .2 watts/cm-K, which yields .13 cm /sec. Thus we find
that for CdS, t = 58 msec. Although this calculation was based on a1/2
one-dimensional model, this value of t1/2 is probably correct to within
an order of magnitude and does appear to be too long to account for the
effects we have observed in CdS. However, our inability to accurately
determine the index relaxation time makes it difficult to conclusively
exclude the thermal mechanism from consideration.

In conclusion, we have observed strong switching of a Fabry-Perot
interferometer with intracavity CdS and OG-530 glass for anomalously
low pump intensities. Order of magnitude estimates of the required
pump energies and of the relaxation time of the induced index change
for two different mechanisms suggest that the index change is due to
electronic rather than to thermal effects, but we are unable to con-
clusively identify the mechanism at this time.
-54-

VII. THE PHOTOREFRACTIVE EFFECT
We have conducted a computer-aided literature search in an effort
to find materials that exhibit photo-induced changes in their refractive
indices and are suitable for use in making photo-induced waveguides.
(Appendix A contains a list of the pertinent papers uncovered in this
search.) The criteria that a material must satisfy in order to be useful
are that: (1) the induced index change must be positive; (2) the index
change must be long-lived; (3) the index change must be sufficiently
large; and (4) the refractive index of the material must approximately
match the index of glass core fibers. The only attractive candidate
material we have found is Ge-doped silica glass, which has been used in
the core of optical fibers to construct Bragg reflectors.'-
The Ge-doped silica sample that we obtained from Bell Labs exhibits
a striated structure that badly distorts the spatial distribution of
transmitted light. We were unable to remove the structure by annealing
the glass and therefore attempted to cut the sample so that light could
be transmitted parallel to the striae without distortion. This was only
partly successful, for although we were able to pass a laser beam through
the sample, much of the light was scattered out of the central core of
the beam.
We attempted to measure the photorefractive effect in Ge:SiO 2 by
using a strong laser beam (Ar ion laser, X - 514.5 nm) to induce a wave-
guide directly into the bulk of the sample. A second, weaker beam (HeNe
laser, A - 632.8 nm) is then used to probe for the existence of the in-
duced channel. Initially, the two beams are crossed at an angle 4, in
-55-

the homogeneous sample (see Fig. 14). If the strong beam does cause
an index change, Sn, the weak beam will be guided if 6 (b 900 - ()
oxceeds the critical angle determined by the index change, thus result-
ing in an angular deflection of the weak beam. For a small index change
5n, the critical angle ,i isC
0 = arcsin(l - n/n).C
An induced index change of only 0.1% implies a critical angle 0 - 87.40,c
thus allowing an angular separation of the strong and weak beams of as
much as 2.6*.
in our experiment, the two laser beams were crossed at an angle of
0.5' in the sample and were then projected onto a screen 60 cm away,
where their separation was 0.5 cm; thus any angular deflection of the
HeNe beam could easily be observed. The laser spot diameters at the
sample were measured with a linear diode array to be 140 o and 210
for th strong and weak beams, respectively. No permanent deviation
of thi weak beam was observed after a 100 sec exposure with a strong
2beam power ot 1.5 Watts (9.7 kW/cm ), although there was a very small
temporary shift (.1) when the strong beam was present, probably due
to thermal effects. For a crossing angle of .50, we would expect
the probe beam to be2 guided for an index change of only 6n/n = 4 x 10 - .
Our inability to observe a deviation suggests that the poor optical
quality of our samplc may have inhibited the photorefractive effect,
since this technique, which makes use of the total internal reflection
between the illuminated core and the surrounding medium, should be quite
sensitive.
-56-

Strong 545n
Weak
FIGURE 14. Experimental arrangement for measuring photorefractive effect.

REFERENCES
I. G. Mayer and F. Gires, "Action of an Intense Light Beam on the
Refractive Index of Liquids," C.R. Acad. Sci. (France) 258, 2039
(1964).
2. P.D. Maker and R.W. Terhune, "Study of Optical Effects Due to an
Induced Polarization Third Order in the Electric Field Strength,"
Phys. Rev. 137, 801 (1965).
3. A. Owyoung, R.W. Hellwarth, and N. George, "Intensity-Induced
Changes in Optical Polarizations in Glasses," Phys. Rev. B 5, 628
(1972).
4. G.K.L. Wong and Y.R. Shen, "Optical-Field-Induced Ordering in the
Isotropic Phase of a Nematic Liquid Crystal," Phys. Rev. Lett. 30,
895 (1973).
5. M. Born and E. Wolf, Principles of Optics, 5th ed. (Pergamon Press,
1975), p. 325.
6. F.S. Felber and J.H. Marburger, "Theory of Nonresonant Multistable
Optical Devices," Appi. Phys. Lett. 28, 731 (1976); J.H. Marburger and
F.S. Felber, "Theory of a Lossless Nonlinear Fabry-Perot Interferometer,"
Phys. Rev. A 17, 335 (1978).
7. T. Bischofberger and Y.R. Shen, "Nonlinear Fabry-Perot Filled with
CS9 and Nitrobenzenc," Opt. Lett. 4, 40 (1979).
8. P.D. Maker, R.W. Terhune, and C.M. Savage, "Intensity-Dependent
Changes in the Refractive Index of Liquids," Phys. Rev. Lett. 12,
507 (1964).
-58-

9. P.D. McWane and D.A. Sealer, "New Measurements of Intensity-Dependent
Changes in thp Refractive Index of Liquids," Appl. Phvs. L.ett. 8,
278 (1966).
10. F.B. Martin arid J.R. Lalanne, "Agreement between Depolarized Rayleigh
Scattering and Optical Kerr Effect Induced by Q-Switched Laser Waves
in Some Liquids," Phys. Rev. A 4, 1275 (1971).
11. H.J. Coles and B.R. Jennings, "Laser-Induced Birefringence in Pure
Liquids," Philos. Mag. (CB) 32, 1051 (1975).
12. J.F. Giuliani and J. Van Laak, "Laser-Induced Birefringence in Polar
Liquids," J. Opt. Soc. Am. 66, 372 (1976).
13. J.P. Hermann, D. Ricard, and J. Ducuing, "Optical Nonlinearities in
Conjugated Systems: B-Carotene," Appl. Phys. Lett. 23, 178 (1973).
14. J.P. Hermann and J. Ducuing, "Third-Order Polarizabilities of Long-
Chain Molecules," J. Appl. Phys. 45, 5100 (1974).
15. J.J. Wynne and G.D. Boyd, "Study of Optical Difference Mixing in Ge
and Si Using a CO 2 Gas Laser," Appl. Phys. Lett. ]2, 191 (1968).
16. E. Yablonovitch, C. Flytzanis, and N. Bloembergen, "Anisotropic
Interference of Three-Wave and Double Two-Wave Frequency Mixing in
GaAs," Phys. Rev. Lett. 29, 865 (1972).
17. S.D. Kramer, F.G. Parsons, and N. Bloembergen, "Interference of
Third-Order Light Mixing and Second-Harmonic Exciton Generation in
CuCZ," Phys. Rev. B 9, 18S3 (1974).
18. D. Heiman, R.W. Hellwarth, M.D. Levenson, and C. Martin, "Raman-
Induced Kerr Effect," Phys. Rev. Lett. 36, 189 (1976).

19. I.J. Song and M.D. Levenson, "Electronic and Orientational Contributions
to the Optical Kerr Constant Determined by Coherent Raman Techniques,"
.;. Appl. Phys. 48, 3496 (1977).
20. C. B. de Araujo and fl. Lotem, "New Measurements of the Two-Photon,
Absorption in GaP, (CdS, and ZnSe Relative to Raman Cross Sections,"
Phvs. Rev. B IX, 30 (1978).
21. Linear absorption, rt32., measured in this work. Other material
constants from N. Neuberger, -1_-VI Semiconductin ,Compounds 1)ata Tables,
Electionic l'ropertics information Center (1969).
22. S. Jayaraman and C.H. Lee, "Observation of Three-Photon Conductivity
in CdS with Mode-L.ocked Nd:glass Laser Pulses," .J. Appl. Phys. 44,
5480 (1973).
23. K.O. Hill, Y. Fujil, ).C. Johnson, and B.S. Kawasaki, "Photosensitivity
in Optical Fiber Waveguides: Application to Reflection Filter
Fabrication," Appl. Phys. Lett. 32, 647 (1978); B.S. Kawasaki, K.O. Hill,
D.C. Johnson, and Y. Fujii, "Narrow-dand Bragg Reflectors in Optical
Fibers," Opt. Lett. 3, 66 (1978).
-60-

APPENDIX A
BIBLIOGRAPHY ON THE PHOTOREFRACTIVE EFFECT
;ENERAL
I. J.J. Amodei, W. Phillips, and D.L. Staebler, "Improved Electrooptic
Materials and Fixing Techniques for Holographic Recording," Appl.
Opt. 11, 390 (1972).
2. A.M. Glass, "The Photorefractive Effect," Opt. Eng. 17, 470 (1978).
3. F. Micheron, "Sensitivity of the Photorefractive Processes,"
Ferroelectrics 18, 153 (1978).
4. D. von der Linde and A.M. Glass, "Photorefractive Effects for
Reversible Holographic Storage of Information," Appl. Phys. 8, 85
(1975).
POTASSIUM TAINTALATE NIOBATE (KTN)
1. F.S. Chen, "A Laser-Induced lnhomogeneity of Refractive Indices
in KTN," J. Appl. Phys. 38, 3418 (1967).
2. D. von der Linde, A.M. (;lass, and K.F. Rodgers, "High-Sensitivity
Optical Recording in KTN by Two-Photon Absorption," Appi. Phys.
Lett. 26, 22 (1975).
CADMIUM SULFIDE (CdS)
1. A. Ashkin, B. Tell, and J.M. Dzied-ic, "Laser Induced Refractive Index
Inhomogeneities and Absorption Saturation Effects in CdS," IEEE .,
Ouantum Electron. 0F-3, 400 (1967)
-6 1 -
BISMUTH TITANATE (BiT i 30 12) AND BARIUM TITANATE (BaTiO 3 )
1. L.H. Lin, "Holographic Measurements of Optically Induced Refractive
Index Inhomogeneities in Bismuth Titanate," Proc. IEEF 57, 252 (1969).
2. F. Micheron and G. Bismuth, "Electrical Control of Fixation and
Erasure of Holographic Patterns in Ferroelectric Materials,"
Appl. Phys. Lett. 20, 79 (1972).
3. R.1. Townsend and I.T. LaMacchia, "Optically Induced Refractive
Index Changes in BaTiO , .I. Appl. Phys. 41, 5188 (170).
SIONTII' \' 1I ': NliOBATV' SUN) AND BARIUM SODIUM NIOBAT (Ba NaN1 ,]
1. 3.1. Amodei and D.1. Staebler, "Holographic Pattern Fixing in
Electro-optic Crystals," Appl. Phys. I.ett. 18, 540 (1971).
2. ,1.. Amodei, D.L. Staebler, and A.W. Stephens, "Holographic Storage
in Doped Barium Sodium Niobate (BaNaNh () )," Appl. Phys. Lett. 18,
307 1971).
.. ..V. ui K.D. Kochev, Yu. S. Kusminov, and T.R. Volk, "The
ihotoferroe Lectric Mechanism of the .ffert of 'Optical Damage' in
.dt r(,nrim; K~li lum Nioh;ite' (rv'stals," t'hv. . Stit. Sol]. (,1) 2(), 300
(I1975) .
J .IB. Thaxtvr , "FI elc r i ( Control of Holorah i c St orage in
1tronti uni-Bar ium Niobate," Appl. Plhvs. Lett. 1), 210 (19(()
. . . Thaxter and M. Kest i ian, "Unique Properties of SBN and Their
Use in a Lavered ()pt ical Memory," Appl. OYt. 13, 911 (1l474).
-62-

CHAICOCENIDE CLASS (As-Se-S-Ce)
1. T. Igo and Y. Toyoshima, "A Reversible Optical Change in the As-Se-
Ge Class," J. Non-Crvst. Solids 11, 304 (1973).
2. 0. Mikami, J. Noda, S. Zembutsu, and S. Fukunishi, "Phase Tuning in
Optical Directional Coupler by Photostriuctural Effect of Chalcogenide
Glass Film," Appl. Phys. Lett. 31, 376 (1977).
3. S. Zembutsu and S. Fukunishi, "Waveguiding Properties of (Se,S)-based
Chalcogenide Class Films and Sore Applications to Optical W'aveguide
Devices," Appl. Opt. 18, 393 (1979).
4. S. Zembutsu, Y. Toyoshima, T. Igo, and H. Nagai, "Properties of
(Se,S)-based Chalcogenide Glass Films, and an Application to ,
Holographic Supermicrofiche," Appl. Opt. 14, 3073 (1975).
LEAD-LANTHANI2.! TITANO-ZIRCONATE CERAMICS (PLT)
1. .. W. Burgess, R.J. Hurditch, C.J. Kirkby, and G'.E. Scrivener,
"Holographic Storage and Photoconductivitv in PLZT Ceramic Materials,
Appl. Opt. 15, 1550 (1976).
2. F. Micheron, (. Mayeux, and T.C. Trotier, "Electrical Control in
Photoferroelectric Materials for Optical Storage," Appl. Opt.
13, 784 (1974).
BISUL'TH SILICATE ANI) BJSMITH GERMANATE (BSO ANT) BCC
1. J.P. Huignard and J.P. Herriau, "Real-time Douhle-exposure Inter-
ferometrv with Bi 2Si) 2Crvtals in c'raxcrse Flctrooptic
Configuration," Appl. Opt. 16, 1807 (1977).
-63-

2. 1..P. Huignard and F. iicheron, "High-sensitivity Read-Write Volume
Holographic Storage in Bi SIC) and Bi GeO Crystals," Appl. Phys.12~ 20 12 20
Lett. 29, 591 (1976).
3. M. Peltier and F. Micheron, "Volume Hologram Recording and Charge
Transfer Process in Bi1 2 Sio 2 0 and Bi12GeO2 0," J. Appl. Phys. 48,
3683 (1977).
(e-)( )PE) SILICA (LASS
1. K.O. Hill, Y. Fujii, D.C. Johnson, and B.S. Kawasaki, "Photosensitivity
in Optical Fiber Waveguides: Application to Reflection Filter
Fabrication," Appl. I'hvs. Lett. 32, 647 (1978).
2. K.O. Hill, B.S. Kawasaki, D.C. Johnson, and Y. Fujii, "Nonlinear
Effects in Optical Fibers: Application to the Fabrication of Active
and Passive Devices" (to be published).
3. B.S. Kawasaki, K.O. Hill, D.C. Johnso,, and Y. Fujii, "Narrow-band
bragsg Reflectors in Optical Fibers." Opt. Lett. 3, 66 (1978).
II IHI7 1 TANTAI.ATE (IAiTao 3) AND LITHIUM NIOBATE (liNbO 3
1. A. Ashkin, (;.D. Boyd, J.M. Dziedzic, R.C. Smith, A.A. Ballman,
.1.J. Levinstein, and K. Nassau, "Opticallv-Induced Refractive
Index Inhomogeneitite- in 1,iNbO 3 and LiTaO 3 ,"' Appl. Phys. Lett. 9,
72 (196h).
2. C-T Chen, D.M. Kin, and D. von der Linde, "Efficient Hologram
Recording in LINbO Fe Using Optical Pulses," Appl. Phys. Lett. 34,
321 (1979).
-64-

3. F.S. Chen, "Optically Induced Change of Refractive Indices in LiNbO3
and LiTaO 3" J. Appl. Phys. 40, 3389 (1969).
4. F.S. Chen, J.T. LaMacchia, and D.B. Fraser, "Holographic Storage
in Lithium Niobate," Appl. Phys. Lett. 13, 223 (1968).
5. M.G. Clark, F.J. DiSalvo, A.M. Class, and G.E. Peterson, "Electronic
Structure and Optical Index Damage of Iron-Doped Lithium Niobate,"
J. Chem. Phys. 59, 6209 (1973).
6. W.D. Cornish and L. Young, "Influence of Multiple Internal Reflections
and Thermal Expansion on the Effective Diffraction Efficiency of
Holograms Stored in Lithium Niobate," J. Appl. Phvs. 46, 1252 (1975).
7. W.D. Cornish, M.G. Moharam, and L. Young, "Effects of Applied
Voltage on Hologram Writing in Lithium Niobate," T. Appi. Phys. 47,
1479 (1976).
8. B. Dischler, J.R. Herrington, A. R~uber, and H. Kurz, "Correlation of
the Photorefractive Sensitivity in Doped LINbO 3 with Chemically
Induced Changes in the Optical Absorption Spectra, " Solid State
Commun. 14, 1233 (1974).
9. A.M. Glass, D. von der Linde, and T.3. Negran, "High-voltage Bulk
Photovoltaic Effect and the Photorefractive Process in LiNbO3,
Appl. Phys. Lett. 25, 233 (1974).
10. A. Ishida, 0. Mikami, S. Miyazawa, and M. Stimi, "Elh-doped liNbO 33
as an Improved New Material for Reversible Holographic Storage,"
Appl. Phys. Lett. 21, 192 (1972).
11. W.D. Johnston, Jr., "Optical Indrx Damage in LiNbO3 and Other
Pyroclectric Insulators," .1. Appl. Phvs. 41, 32714 (1970).
-65-

12. H. Kurz, E. Krdtzig, W. Keune, H. Engelmann, U. Gonser, B. Dischler,
and A. Rduber, "Photorefractive Centers in LiNbO 3 , Studied by Ontical-,
M6ssbauer- and EPR-Methods," Appl. Phys. 12, 355 (1977).
13. J. Noda, S. Zembutsu, S. Fukunishi, and N. Uchida, "Strip-loaded
Waveguide Formed in a Graded-index LiNbO Planar Waveguide,"3
Appl. Opt. 17, 1953 (1978).
14. G.E. Peterson, A.M. Glass, and T.J. Negran, "Control of the
Susceptibility of Lithium Niobate to Laser-Induced Refractive
Index Changes," Appl. Phys. Lett. 19, 130 (1971).
15. W. Phillips, J.J. Amodei, and D.L. Staebler, "Optical and Holographic
Storage Properties of Transition Metal Doped Lithium Niobate,"
RCA Rev. 33, 94 (1972).
16. J.M. Spinhirne, D. Ang, C.S. Joiner, and T.L. Estle, "Simultaneous
Holographic and Photocurrent Studies of the Photorefractive Effect
in LiTaO 3 and LiNbO V9 Appl. Phys. Lett. 30, 89 (1977).
17. D.L. Staebler, W.J. Burke, W. Phillips, and J.J. Amodei, "Multiple
Storage and Erasure of Fixed Holograms in Fe-doped LiNbO3 ," Appl.
Phys. Lett. 26, 182 (1975).
18. D.L. Stacbler and W. Phillips, "Fe-doped LiNbO 3 for Read-Write
Applications," Appl. Opt. 13, 788 (1974).
19. H. Tsuya, "Optical Damage in Transition-Metal-Doped LiTaO 3 ,"
J. Appl. Phys. 46, 4323 (1975).
20. C.M. Verber, N.F. Hartman, and A.M. Glass, "Formation of Integrated
Optics Components by Multiphoton Photorefractive Processes,"
Appl. Phys. Lett. 30, 272 (1977).
-66-

21. D. von der Linde, A.M. Class, and K.F. Rodgers, "Multiphoton Photo-
refractive Processes for Optical Storage in LiNbO 3" Appl. Phys.
Lett. 25, 155 (1974).
22. D. von der Linde, A.M. Glass, and K.F. Rodgers, "Optical Storage
Using Refractive Index Changes Induced by Two-step Excitation,"
J. Appl. Phys. 47, 217 (1976).
23. D. von der Linde, O.F. Schirmer, and H. Kurz, "Intrinsic Photo-
refractive Effect of LiNbO3 ," Appl. Phys. 15, 153 (1978).
24. V.E. Wood, N.F. Hartman, C.M. Verber, and P.P. Kenan, "Holo ,raphic
Formation of Gratings in Optical Waveguiding Layers," J. Appl. Phys.
46, 1214 (1975).
25. L. Young, W.K.Y. Wong, M.L.W. Thewalt, and W.D. Cornish, "Theory of
Formation of Phase Holograms in Lithium Niobate," Appl. Phys.
Lett. 24, 264 (1974).
-67-

MISSIONOf
Rom Air Development CenterRAVC ptan,6 and execute6 4te~eatch, devetopment, te~t and6etected acqui6Ztion p~og'tom6 in 6uppoLt oj Command, ContAotCommunication6 and Inte2%Zgence (C31) activitiea. Technicatand enginee~ing 4uppoxt witin a~ea6 o6 technicat competence4A6 pi'ovided -to ESO Pxo09Mm O6Zce6 WPO) and otheL ESVetementA. The p4ZncipatL technteat mri~ion aAea6 aAecommrun4.attAon6, etectomagnetc guidance and contiwt, .wz.-vedtance o6 gtound and aew 6 pace object6, intettigence datacottection and handting, in~oAmation .6y~tem technotogq,ionohpheAic pftopagation, Aotid .6tate 6c4.enceA, ictou.uephq,6ic6 and etect'wnic tetiabitit, maintainabitiy andcompa-tibiU.L-
Printed byUnited States Air ForceHanscom APR, Mass. 01731

r
pm p
IL
I I


![WELCOME []...1. WELCOME Thank you for registering for the Parkinson’s Unity Walk (PUW), the largest single day grass-roots fundraiser for Parkinson’s disease (PD) in the U.S. You](https://static.fdocuments.in/doc/165x107/5ecc7fc5ac7c3e404d01d31b/welcome-1-welcome-thank-you-for-registering-for-the-parkinsonas-unity.jpg)


