SAIL Financial Analysis
12
Transcript of SAIL Financial Analysis


The financial data given in the statement should be re-organized and rearranged.
A relationship is established among financial statements with the help of tools and technique of analysis such as ratio, trend, common size, fund flow etc.
The information is interpreted in a simple and understanding way.
The conclusion drawn from interpretation and presented to the management in the form of report.

The analysis and interpretation of financial statements is used to determine the financial position and the results of operation as well. A number of methods or devices are used to study the relationship between different statements. An effort is made to use those devices which clearly analyze the position of the enterprise.
The following methods of analysis are generally used:
Comparative statement.
Trend analysis.
Common size statement.
Cash flow analysis.
Ratio analysis.

Statement Of P&L
Net sales include sales to government
agencies recognized on provisional
contract prices during the year ended 31st
March 2016, `. 3376.11cr (P.Y `. 2907.36
cr) and cumulatively up to 31st March
2016 `.13074.67 cr (P.Y `. 9750.99 cr).

Interpretation of Revenues:
Operating revenue: During F.Y 2015-16 the company had
registered a growth of 4% in sales volume from 11.8MT in
2014-15 to 12.2MT in 2015-16, Despite of registering the
growth in sales volume the company’s revenue has been
declined by 14.12% due to the oversupply scenario
globally. Thereby, unprecedented imports which forced
significant price cuts by the steel producers leading to a
squeeze in margin.
To support the domestic steel industry, the government has
imposed restriction on import of steel by fixing Minimum
Import Price (MIP) with effect from 5th Feb 2016, which
lead to an increase in price of steel.
-6,000.00
4,000.00
14,000.00
24,000.00
34,000.00
44,000.00
54,000.00
31-Mar-16 31-Mar-15 31-Mar-14
Income
Revenue From Operations Less: Excise duty
Other Income Total Revenue

Interpretation of Expenses: Raw materials: During the F.Y 15-16 the company
has consumed 24.83 million tons of captive iron and
0.98MT of Dolomite, 1.28 metric tons of lime stone
compared to 23.18 million tons of captive of iron and
1.11 million tons of lime stone and 0.97 million tons of
dolomite. Even though there’s an increase in
consumption, due to the reduction of input prices the
cost of material consumed has decreased.
Finance costs: Finance costs had tremendously
increased over the previous year by 40%
(Rs.590.52crores) which is due to the increase in the
borrowings from Rs.29898 crores in F.Y 14-15 to
33217 crores in F.Y 2015-16.
0.00
5,000.00
10,000.00
15,000.00
20,000.00
31-Mar-16 31-Mar-15 31-Mar-14
Expenses
Cost Of Materials Consumed Finance Costs

Employee costs: During the year, the Employees'
Remuneration & Benefits have increased mainly due to increase
in travel concession from `.32.54 crores to `.251.34 crores and
welfare expenses from `.481.18 crores to `.502.96 crores.
R&D Expenditure:
The R&D expenditure has an significant increase from
`.262 Crores in 2014-15 to `.277 Crores in 2015-16 and the R&D
expenditure as percentage of turnover (net of excise) has
increased from 0.58% in 2014-15 to 0.64 % in 2015-16.
Expenses: In the same way analyse all related costs and
expenses like employee cost, Depreciation and other expenses.
Eg: The increase in other expenses was on account
of increase in the cost of stores & spares, power & fuel,
repairs & maintenance, freight outward, handling expenses,
conversion expenses, security expenses, royalty & cess, etc.

Equity and Liabilities: Changes in Shareholders Funds:
Share capital- No change as there is no issue of Equity shares.
Reserves& Surplus- Due to loss of `. 4137.26 crores in current year the R&S has been decreased by 10%.
Changes in Non Current Liabilities:
Long term Borrowings: Increase in long term borrowings by 14% was due to issue of non-convertible bonds.
Long term Provisions: The decrease in long term provisions by `.62 crore was mainly on account of decrease in the Gratuity and others.
0.00
5,000.00
10,000.00
15,000.00
20,000.00
25,000.00
30,000.00
35,000.00
40,000.00
31-Mar-16 31-Mar-15 31-Mar-14
Shareholders Funds
a) Share Capital b) Reserves and Surplus
0.00
4,200.00
8,400.00
12,600.00
16,800.00
31-Mar-16 31-Mar-15 31-Mar-14
Non-Current Liabilities
Longterm borrowings Deferred Tax Liabilities
other Long term liabilities Long term provisions
Changes in current Liabilities:
Short term Borrowings: The short term borrowings increased by `.1,335 crore on account of raising of loans from banks.
Other Current liabilities: There was an increase in other current liabilities from `.14016.53 crores to `.15,805.56 crores, due to increase in advances from customers.
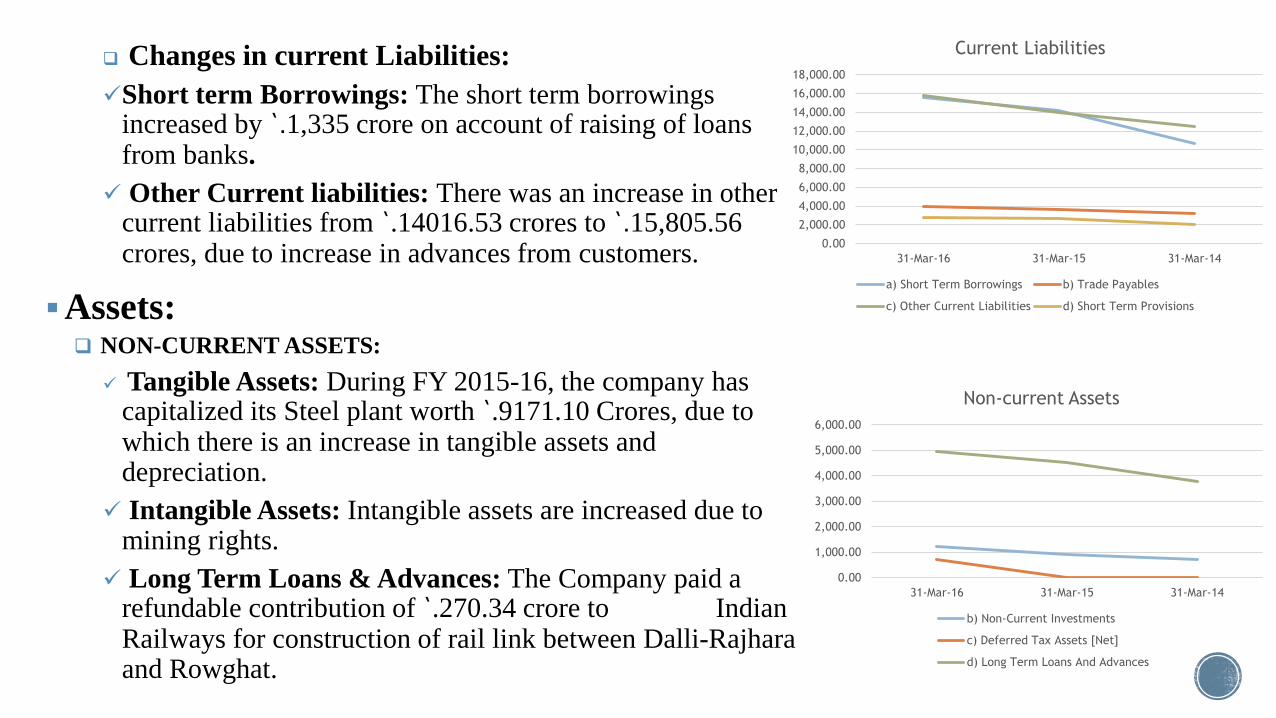
Assets: NON-CURRENT ASSETS:
Tangible Assets: During FY 2015-16, the company has capitalized its Steel plant worth `.9171.10 Crores, due to which there is an increase in tangible assets and depreciation.
Intangible Assets: Intangible assets are increased due to mining rights.
Long Term Loans & Advances: The Company paid a refundable contribution of `.270.34 crore to Indian Railways for construction of rail link between Dalli-Rajharaand Rowghat.
0.00
2,000.00
4,000.00
6,000.00
8,000.00
10,000.00
12,000.00
14,000.00
16,000.00
18,000.00
31-Mar-16 31-Mar-15 31-Mar-14
Current Liabilities
a) Short Term Borrowings b) Trade Payables
c) Other Current Liabilities d) Short Term Provisions
0.00
1,000.00
2,000.00
3,000.00
4,000.00
5,000.00
6,000.00
31-Mar-16 31-Mar-15 31-Mar-14
Non-current Assets
b) Non-Current Investments
c) Deferred Tax Assets [Net]
d) Long Term Loans And Advances

Capital work in progress: During FY 2015-16 CWIP has
decreased by `.4300 crores due to the capitalization of steel
plant as a result there is an increase in tangible asset.
CURRENT ASSETS:
Inventories: The inventories decreased by `.2,600 crore
mainly on account of decrease in raw materials inventory by
`.1,590 crore, finished/semi-finished products inventory by
`.674 crore and stores & spares inventory by `.336 crore.
Trade receivables: Decrease in trade receivables was by
`.359 crore mainly on account of reduction in debtors.
• The cash & bank balances decreased by `.2,008 crore.
0.00
2,000.00
4,000.00
6,000.00
8,000.00
10,000.00
12,000.00
14,000.00
16,000.00
18,000.00
20,000.00
31-Mar-16 31-Mar-15 31-Mar-14
Current Asset
a) Inventories
b) Trade Receivables
c) Cash And Cash Equivalents
d) Short Term Loans And Advances
e) OtherCurrentAssets

Key Point:
The company had pending court case in SC, have been disclosed as Contingent liabilities.
Adverse outcome of the following cases results in huge decrease in value of Assets.
Due to not recognizing the ab