Saikat.iip Report
445
INSTITUTE FOR TECHNOLOGY AND MANAGEMENT INDUSTRIAL INTERNSHIP PROGRAM REPORT A STUDY ON “EQUITY AND DERIVATIVES- OPTIONS & FUTURES” Submitted in partial fulfillment of
-
Upload
saikat-das -
Category
Documents
-
view
11 -
download
4
description
great report. helpful!
Transcript of Saikat.iip Report

INSTITUTE FOR TECHNOLOGY AND
MANAGEMENT
INDUSTRIAL INTERNSHIP PROGRAM REPORT
A STUDY
ON
“EQUITY AND DERIVATIVES- OPTIONS & FUTURES”
Submitted in partial fulfillment of
POST GRADUATE DIPLOMA IN MANAGEMENT (PGDM-
FINANCE)

Submitted by
Saikat Das
PGDM 1720
Academic Year (2013-2015)
Under the guidance of
Dr. Latha Sreeram Mr. Abhishek Kumar Consultant – Finance Department Deputy Manager
Institute for Technology and Management, Kharghar Karvy
Stock Broking Limited, Vashi

DECLARATION
This project entitiled “A study on Equity and Derivatives (options & futures)” in Karvy Stock Broking Limited, is a benefited work done by me in partial fulfillment of my PGDM Finance course Management from Institute for Technology and Management, Kharghar.
I further state that this report entirely stand original in its

concepts ideology and genuine in its presentation.
I declare that this report has not been submitted to any other University/Institute for the award of any Degree/Diploma.
Saikat Das
PGDM Finance – 2013-15

Institute for Technology and Management
Kharghar.
CERTIFICATE OF APPROVAL
This is to certify that the

Summer Internship Project “A study on
Equity and Derivatives (options & futures)” submitted by Saikat
Das, a student of Institute for Technology and Management, as a
part of the curriculum of PGDM – Finance has
been approved.
___________________ ________________
Faculty Guide Dean
Dr. Latha Sreeram Prof. AS Adhikari

Consultant ITM BS Kharghar
Finance Department
ITM BS Kharghar
Shop no. A 43/44, Vashi Plaza
Sector-17, Vashi, Navi Mumbai-400703
CERTIFICATE
This is to certify that the project titled “Study on equity and Derivatives- options and
futures” is a bonafide research work carried out by Mr.
Saikat Das (PGDM 1720) under our guidance. This
dissertation has not formed the basis for the award previously
of any Degree/Diploma, or any other similar titles of any
Institution/University.
Mr. Abhishek Kumar
Deputy Manager
Karvy Stock Broking Ltd
Vashi Branch
Navi Mumbai
ACKNOWLEDGEMENT
I take this opportunity to thank all, whose able guidance and kind co-operation helped me complete my internship & study On “A study on Equity and Derivatives (options &

futures)” successfully.
I am particularly indebted to Karvy Stock Broking Ltd, for providing me the opportunity to complete my project successfully. Employees of Karvy always extended their cooperation and provided me with valuable information regarding the organization in spite of their busy schedule.
I would like to thank and express my gratitude towards Mr. Abhishek Kumar (deputy Manager) my project guide, who has been a constant source of inspiration and encouragement for me during this project.
I extend my gratitude to ITM Business School for giving me this opportunity.
I extend my sincere gratitude to my Head of the Institute Dr. Ganesh
Raja, for giving me the privilege to do the Summer Internship Program. I am greatly obliged to my Faculty Guide Dr. Latha Sreeram (Chief consultant, Finance Department) for her complete guidance and also for his valuable insights on the project.
Last but not the least, I would extend a special word of thanks to all my well-wishers for giving me a helping hand whenever needed and for making the project a success.
Place: Kharghar, Navi Mumbai
Signature:
Date:
Saikat Das

EXECUTIVE SUMMARY:-
The Summer Project at “KARVY STOCK BROKING LIMITED” has given an exposure into the investment scenario in India. The project while working at “KARVY STOCK BROKING LIMITED” includes advisory services i.e. educating the existing and potential investors about stock market as an alternative source to investment. This involves catering to the
queries of the investors about the concept of stock market, the various options that an investor can invest his money into, funds management of investors.
This internship report consists of overall experience of working as a part of KARVY STOCK BROKING LTD. This experience helped me to understand the functioning of a stock broking company. My training consisted of observing how the trading is done in live financial market and also learning about the various sectors of investment like shares, futures, options, etc. Analyzing the investors’ behavior includes understanding the concerns a person has towards Stock Market, his stages in life and wealth cycle, the effect of the investments made by the peer groups, effect of the profession he/she is in, education

qualification, importance of tax benefits, the most preferred saving tool etc. and this all is analyzed with the help of a schedule prepared. Understanding the significance of Equity and Derivatives market, types of instruments present in the Indian Stock Market such as Shares, Futures, Options and Forwards. The various techniques used to identify the trend of the market and analysing the scrip before investing.
Through the systematic investment plan invest a specific amount for a continuous period, at regular intervals. By doing this, the investor get the advantage of rupee cost averaging which means that by investing the same amount at regular intervals, the average cost per unit remains lower than the average market price.
During my internship, I also came to know the various tactics and strategies of trading in the financial markets. I started from the very basics of stock market and earned a very good knowledge by observing the portfolios of different investors which indicated their investing behaviors in various sectors and various segments. The study is limited to Equity and derivatives, with special reference to Futures and Options in Indian context. The study can’t be said as totally perfect. The study has only made a humble attempt to compare between equity and derivatives market in respect to its risk and return to investors, only in Indian context.
CONTENT
1. OBJECTIVES OF THE STUDY
2. MODUS OPERANDI3. INDUSTRY PROFILE4. COMPANY PROFILE5. INTRODUCTION TO
STOCK MARKET.6. INTRODUCTION TO BSE7. INTRODUCTION TO NSE8. FUNDAMENTAL
ANALYSIS9. TECHNICAL ANALYSIS10. INTRODUCTION TO

DERIVATIVES11. STRATEGIES IN
OPTIONS12. OPTION GREEKS13. PORTFOLIO
MANAGEMENT SERVICE AND CREATION
14. TRANSMISSION AND TRANSPOSITION OF SHARE CERTIFICATE.
15. LEARNINGS16. SUGGESTIONS17. CONCLUSIONS18. BIBLIOGRAPHY

Objectives of the Study
To study the movements in stocks in equity market.
To understand the Indian stock market and its various concepts.
To study in detail the role of futures and options market.
To study the role of derivatives in the Indian financial
market.
To study the various strategies in derivative market.
To study the product in equity market and derivative market (options & Future)
Modus Operandi of the project
With the help of our company
guide, we were given knowlwdge
about equity and derivative market
in depth and its mechanism. I have
also read some other similar reports
online to get some knowledge.
Moreover we are given individual
PCs to work on getting more

knowledge about fundamentals and
technicals of market.
The next task was given to keep an
eye on the daily changes that occurs
in Stock market with respect to
economic conditions as well as due
to changes in government policies
To complete this report, there is
more use of secondry source of
information i.e. moneycontrol,
calloptionputoption, nse.com and
some more and further primary
source as well i.e. clients of Karvy
stoc broking ltd. Information will
be taken with the help of
questionnaire method as well as

telephonic survey technique (only
to Active Karvy Clients). This data
will be mainly used to check their
investment patterns in equity and
derivative market. Moreover since
the title is on comparative analysis
of equity and derivative, it will also
help in understanding investor's
why they choose equity over
options and future and vice versa. I
have already started the survey
method over phone by calling
clients of Karvy. Moreover the
clients who visit the office are also
my part in achieving my goals in
the report. Finally meeting the
prospective clients helps a lot in

finding more information.
INDUSTRY PROFILE
INTRODUCTION
Stock exchanges to some extent play an important role as indicators, reflecting the performance of the country’s economic state of health. Stock market is a place where securities are bought and sold. It is exposed to a high degree of volatility; prices fluctuate within minutes and are determined by the demand and supply of stocks at a given time. Stock brokers are the ones who buy and sell securities on behalf of individuals and institutions for some commission.

The Securities and Exchange Board of India (SEBI) is the authorized body, which regulates the operations of stock exchanges, banks and other financial institutions. The past performances in the capital markets especially the securities scam by ‘Harshad Mehta’ has led to tightening of the operations by SEBI. In addition the international trading and investment exposure has made it imperative to better operational efficiency. With the view to improve, discipline and bring greater transparency in this sector, constant efforts are being made and to a certain extent improvements have been made.
HISTORY OF THE STOCK BROKING INDUSTRY
Indian Stock Markets are one of the oldest in Asia. Its history dates back

to nearly200 years ago. The earliest records of security dealings in India are meager and obscure. By 1830's business on corporate stocks and shares in Bank and Cotton presses took place in Bombay. Though the trading list was broader in 1839, there were only half a dozen brokers recognized by banks and merchants during 1840 and 1850. The1850's witnessed a rapid development of commercial enterprise and brokerage business attracted many men into the field and by 1860 the number of brokers increased into 60.In 1860-61 the American Civil War broke out and cotton supply from United States of Europe was stopped; thus, the 'Share Mania' in India begun. The number of brokers increased to about 200 to 250. However, at the end of the American Civil War, in1865, a disastrous slump began (for

example, Bank of Bombay Share which had touched Rs 2850 could only be sold at Rs. 87). At the end of the American CivilWar, the brokers who thrived out of Civil War in 1874, found a place in a street (nowappropriately called as Dalal Street) where they would conveniently assemble andtransact business.In 1887, they formally established in Bombay, the "Native Share and Stock Brokers'Association" (which is alternatively known as "The Stock Exchange"). In 1895, theStock Exchange acquired a premise in the same street and it was inaugurated in1899. Thus, the Stock Exchange at Bombay was consolidated.Thus in the same way, gradually with the passage of time number of exchangeswere increased and at currently it reached to the figure of 24 stock exchanges.
Development
An important early event in the development of the stock market in India was the formation of the Native Share and Stock Brokers’ Association at Bombay in 1875, the precursor of the present-day Bombay Stock Exchange. This was followed by the formation of associations /exchanges in Ahmedabad (1894), Calcutta (1908) and Madras (1937). In addition, a large number of ephemeral exchanges emerged mainly in buoyant periods to recede into oblivion during depressing times subsequently. In order to check such aberrations and promote a more orderly development of the stock market, the central government introduced a legislation called the Securities Contracts (Regulation) Act, 1956. Under this legislation, it

is mandatory on the part of a stock exchanges to seek government recognition. As of January 2002 there were 23 stock exchanges recognized by the central Government. They are located at Ahemdabad, Bangalore, Baroda, Bhubaneshwar, Calcutta, Chenni,(the Madrasstock Exchanges ), Cochin, Coimbatore, Delhi, Guwahati, Hyderbad, Indore, Jaipur,Kanpur, Ludhiana, Mangalore, Mumbai(the National Stock Exchange or NSE),Mumbai (The Stock Exchange), papularly called the Bombay Stock Exchange,Mumbai (OTC Exchange of India), Mumbai (The Inter-connected Stock Exchange of India), Patna, Pune, and Rajkot. Of course, the principle courses are the National Stock Exchange and The Bombay Stock Exchange , accounting for the bulk of the business done on the Indian stock market. While the recognized

stock exchanges have been accorded a privileged position,they are subject to governmental supervision and control. The rules of a recognized stock exchanges relating to the managerial powers of the governing body, admission, suspension, expulsion, and re-admission of its members, appointment of authorized representatives and clerks, so on and so forth have to be approved by the government. These rules can be amended, varied or rescinded only with the prior approval of the government
COMPANY PROFILE
KARVY Stock Broking Limited
KARVY Stock Broking Limited, one of the cornerstones of the KARVY edifice, flows freely towards attaining diverse goals of the customer through varied

services. It creates a plethora of opportunities for the customer by opening up investment vistas backed by research-based advisory services. Here, growth knows no limits and success recognizes no boundaries. Helping the customer create waves in his portfolio and empowering the investor completely is the ultimate goal. KARVY Stock Broking Limited is a member of:
National Stock Exchange (NSE)
Bombay Stock Exchange (BSE)
Hyderabad Stock Exchange (HSE)
Karvy Investor Services Limited
Deepening of the Financial Markets and an ever-increasing sophistication in corporate transactions, has made the role of Investment Bankers indispensable to organizations seeking

professional expertise and counselling, in raising financial resources through capital market apart from Capital and Corporate Restructuring, Mergers & Acquisitions, Project Advisory and the entire gamut of Financial Market activities.
Our quality professional team and our work-oriented dedication have propelled us to offer value-added corporate financial services and act as a professional navigator for long term growth of our clients, who include leading corporates, State Governments, Foreign Institutional Investors, public and private sector companies and banks, in Indian and global markets. We have also emerged as a trailblazer in the arena of relationships, both at the customer and trade levels because of our unshakable integrity, seamless service and innovative solutions that are tuned to meet
varied needs. Our team of committed industry specialists, having extensive experience in capital markets, further nurtures this relationship.
Credentials
• Emerging as a leading Investment Banker with a strong support from its Group entities in Research, Stock Broking, Institutional Sales and Retail Distribution.
• Strong team of more than 25 qualified professionals operating from six cities; Hyderabad, Mumbai, Delhi, Kolkata, Chennai, and Bangalore apart from two overseas offices at New York (USA) and Dubai.
• One of the largest retail distribution networks with over 584 branches in over 389 cities/towns.
• Excellent Institutional Sales Division.
MISSION STATEMENT
“To Bring Industry, Finance and People together.”
VISION STATEMENT
“To be pioneering financial services company. And continue to grow at a healthy pace, year after year, decade after decade.”
VALUES
Trust
Integrity
Dedication
Commitment

Transparency
Enterprise
Hard work and team play
Learning & innovation
Empathy and humility
REGLATORY BODIES
MINISTRY OF FINANCE
a) SEBI (Stock Brokers, R & T Agent, Mtual Fund)
b) RBI (Commercial Banks, NBFCs)
c) Department of IT (PAN, TAN, e-TDS)
INVESTOR SERVICE - KEY FACTS
IPO’s handled - 720
financial transaction processed - 100 mn
number of investor accounts services - 16 mn
corporate clents as r&t agents - 300
asset mgmt,companies services - 11
mutual fund scheme services – 72
KARVY STOCK BROKING OFFERS
Personalized Service
Professional Advice
Long Term Relationship
Access to Research Report
Transparency and confidentiality

SERVICES
1.Stock broking
2. Demat services
3. Investment product distribution
4. Investment advisory services
5. Corporate finance & Merchant banking
6. Insurance
7. Mutual fund services
8. IT enabled services
9. Registrars & Transfer agents
10. Loans
Competitive Advantage - KARVY
Market Power
Brand Preference
Customer Value
SWOT ANALYSIS

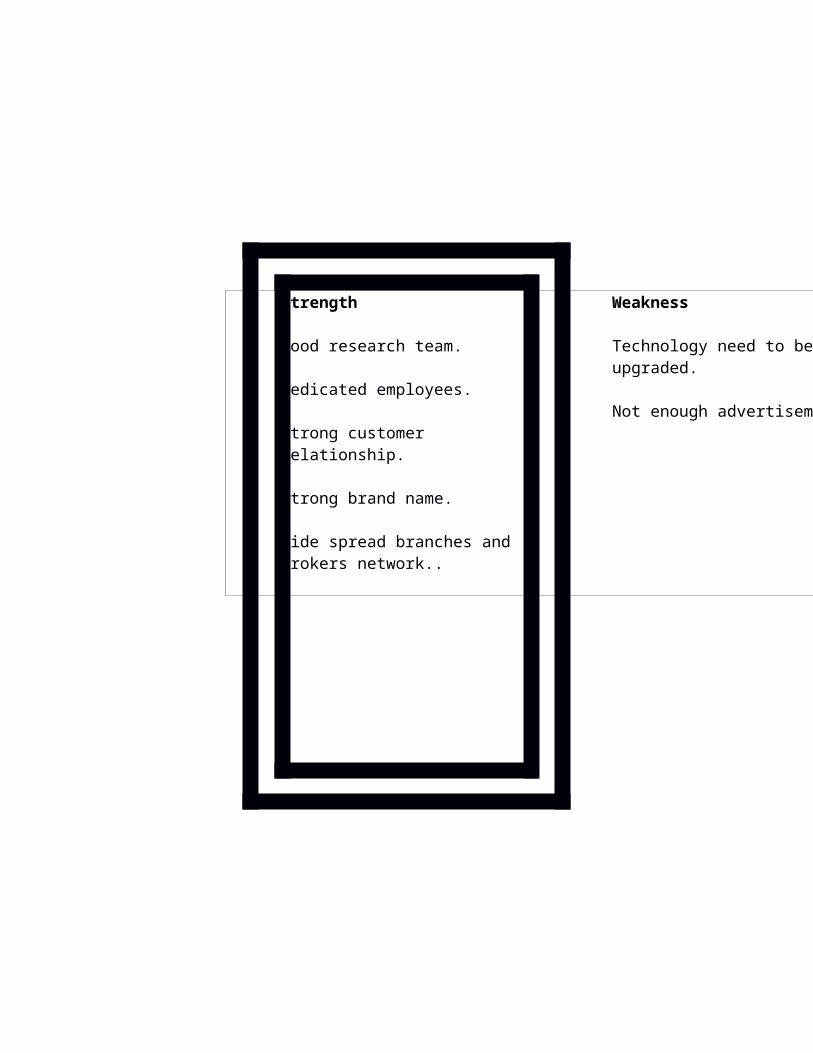
Strength
Good research team.
Dedicated employees.
Strong customer relationship.
Strong brand name.
Wide spread branches and brokers network..
Weakness
Technology need to be upgraded.
Not enough advertisement
Opportunity
Growing IPO issues.
Positive outlook of people towards financial products.
Growing consumer awareness about equity related product.
Threat
Market uncertainty.
Galloping competition.
Broad economic factors like inflation etc
OBJECTIVES
Market Positioning
Market positioning statements of Karvy are “At Karvy we give you single window service” and “We

also ensure your comfort”. So, Karvy focus on the consumers who prefer almost all investment activities at same place by providing number of various financial services. At Karvy a person can purchase or sell shares, debentures etc. and at the same place also demat it. Karvy also provides other investment option to the same person at same place like Mutual Fund, Insurance, Fixed Deposit, and Bonds etc. and help the person in designing his portfolio. By this way Karvy provides comfort to its customers. Karvy is also positioned according to Ries and Trout. Karvy is promoted as a no. 1 investment product distributor and R & T agent of India.
Target Market
Karvy uses demographic segmentation strategy and segment people based on their occupation. Karvy uses selective specialization strategy for market targeting. Target person for the Karvy Stock Broking and Karvy Investment Service are persons who can work as sub-broker for the companies. Companies focus on Advisors of Insurance and post office, Tax consultants and CAs for making sub-broker.
Marketing channel System
Karvy uses one level marketing channel for investment product distribution. Sub-brokers work as intermediary between consumer and company. Company has both forward and backward flow of activity through channel. Company
distributes stationery, brokerage, and information forward to its sub-broker. The sub-brokers send filled forms, queries, amount of investment etc. back to the company.
Training Channel Members
Karvy provides training to the sub-brokers because they will be viewed as the company by the investors. The executives of Karvy explain various new schemes of investment to the sub-brokers with its objective, risk factors and expected return. Company also periodically arrange seminar to guide sub-brokers.
Advertising and Promotion:
The objective of advertising of Karvy is to create awareness about
services of Karvy among investors and sub-brokers and increase sub-brokers of Karvy. Company doesn’t give advertisement in media like TV, Newspapers, and Magazines etc. Karvy’s advertisement is made indirectly by the companies associate with it. Karvy is R & T agent of around 700 companies. They publish name, address and logo of Karvy on their annual report.Karvy also publish its weekly Stock Market Newsletter ‘Karvy Bazaar Baatein’ and monthly magazine ‘The Finapolis’ to guide investors and sub-brokers about market.
STRATEGIES
Karvy believes that foremost ingredient for success in the has been the co-operation ability to continously evolve both

organizational strcture and product offerings, thereby remaining on the cutting financial services. Karvy believes taht three capital viz., financial, human and technology, would drive the financial services sector in the future and draw the boundaries for achieving leadership. Karvy believes that the customized solutions are now the key drivers for market share and profit margins.
ACHIEVEMENTS1. Among the top 9 stock
brokers in India (4% of NSE volumes)
2. India's No. 1 Registrar & Securities Transfer Agents
3. Every 20th trade is done by KARVY Stock Broking Ltd.
4. Among the top 3 Depository Participants
5. Largest Network of Branches & Business

Associates6. ISO 9002 certified
operations by DNV7. Among top 10 Investment
bankers8. Largest Distributor of
Financial Products9. Adjudged as one of the top
50 IT uses in India by MIS Asia
10. Full Fledged IT driven operations trade is done by KARVY Stock Broking Ltd.
INTRODUCTION TO STOCK MARKET
What is a stock ?
A stock is a partial ownership in a
company or an industry, with rights to share in its profits. When an investor buys a stock of a company, he is called a shareholder or a stockholder of that company. The benefit of buying a share is that when the company profits, the shareholders also profit. The company distributes the profit among its shareholders, which is called the ‘dividend‘.
How do you make profits with stocks ?
But many traders make real profit in stocks using the market price of the stocks. Stocks are traded in the stock markets. The face value is the nominal value of the stock that is determined by the issuer of the stock. ‘Market price‘ of a stock is the price at which currently a stock is traded in the market. This price may be at premium or lesser than the ‘face value’ of the stock,
depending on the company’s performance and prospects, investors’ interests in the company and a lot of other factors.
Market price of a stock keeps varying as traders trade the stock in the market. Traders often make money using these variations in the market price of the stock. Stocks are bought at lower market prices and sold at higher prices later. This is referred to as ‘long‘ positions in market terms. Similarly stocks can be sold at a higher market price and bought at a lower price later. Thiis is referred to as ‘short‘ positions in market terms. In these cases, the difference in the market prices at the time of buying and selling will be seen as profit by the traders.
What is the Demat Account ?
Like opening a bank account for doing your personal financial

transactions, you have to open a Demat account to trade in the stock market. Demat account refers to Dematerialized account. This account helps you to buy and sell stocks without the need for physical paper shares.
A Demat Account is a must for trading the stocks these days. To open a demat account, you should select a Depository Participant (DP). These days most of the banks are also DPs. So you can contact any of the DPs with your identity, address proof and PAN documents for opening a demat account for a prescribed fee by the DP. The registered DPs are also listed in NSDL and CDSL.
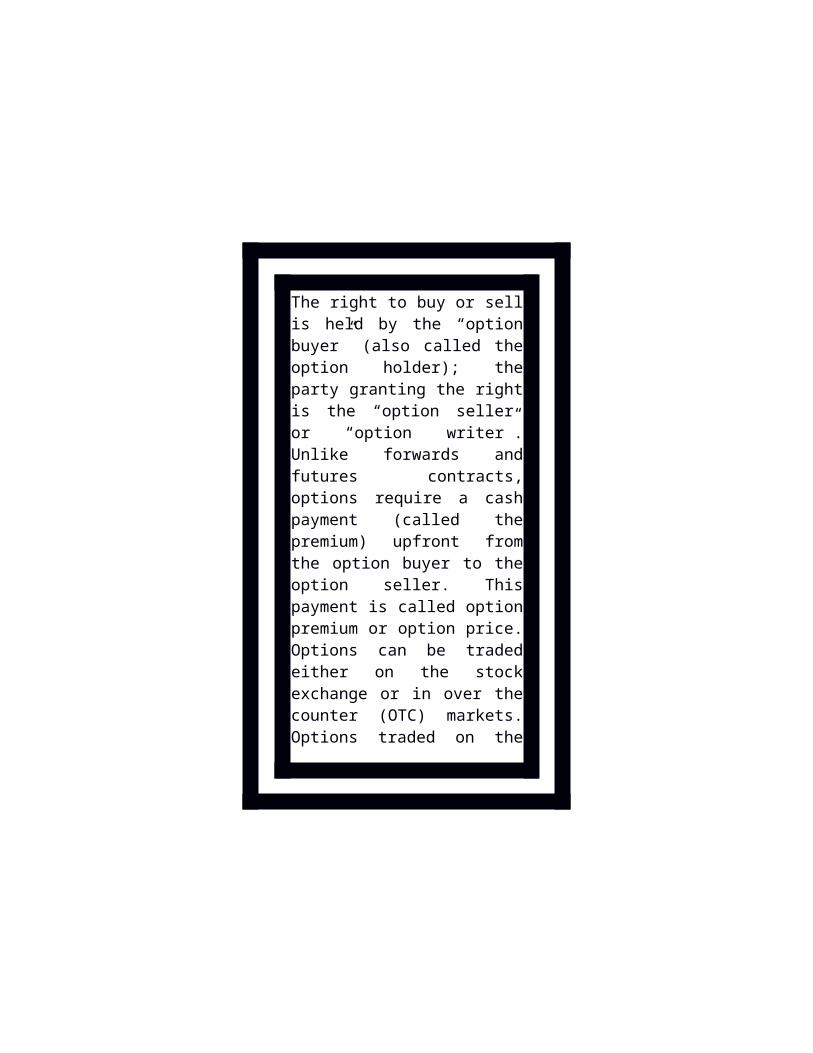
Who is the Stock Broker ?

Stock Brokers are members of the Stock Exchanges. Only these members can conduct transactions in the exchange on behalf of the individuals and companies. So if you want to buy or sell shares in the exchange, you have to contact a stock broker for doing so. This normally requires the individuals to open an account with the Stock Broker. So the individual becomes a client for the stock broker.
Once the client wishes to buy a stock, the broker would place the order in the stock exchange on behalf of the client. When the transaction is done, the broker places the price to the client. The client pays for the stocks he bought and the broker transfers the stocks into the demat account of the client by following the transaction and settlement procedures.

Stock Markets:
Stock Market is a market where the trading of company stock, both listed securities and unlisted takes place. It is different from stock exchange because it includes all the national stock exchanges of the country. For example, we use the term, "the stock market was up today" or "the stock market bubble."
Stock Market Conditions
There are two ways to describe the general conditions of the stock market:
1)BULL MARKET
2)BEAR

MARKET
Bull Market
A Bull Market indicates the constant upward movement of the stock market. A particular stock that seems to be increasing in value is described to be bullish.
Bear Market
A bear market indicates the continuous downward movement of the stock market. stock that seems to be decreasing in value is described to be bearish.
Stock Exchanges:
Stock Exchanges are an organized marketplace, either corporation or

mutual organization, where members of the organization gather to trade company stocks or other securities. The members may act either as agents for their customers, or as principals for their own accounts.
Stock exchanges also facilitates for the issue and redemption of securities and other financial instruments including the payment of income and dividends. The record keeping is central but trade is linked to such physical place because modern markets are computerized. The trade on an exchange is only by members and stock broker do have a seat on the exchange.
History of Indian Stock Market:
Indian stock market marks to be
one of the oldest stock market in Asia. It dates back to the close of 18th century when the East India Company used to transact loan securities. In the 1830s, trading on corporate stocks and shares in Bank and Cotton presses took place in Bombay. Though the trading was broad but the brokers were hardly half dozen during 1840 and 1850.
An informal group of 22 stockbrokers began trading under a banyan tree opposite the Town Hall of Bombay from the mid-1850s, each investing a (then) princely amount of Rupee 1. This banyan tree still stands in the Horniman Circle Park, Mumbai. In 1860, the exchange flourished with 60 brokers. In fact the 'Share Mania' in India began with the American Civil War broke and the cotton supply from the US to Europe stopped. Further the brokers
increased to 250. The informal group of stockbrokers organized themselves as the The Native Share and Stockbrokers Association which, in 1875, was formally organized as the Bombay Stock Exchange (BSE).
BSE was shifted to an old building near the Town Hall. In 1928, the plot of land on which the BSE building now stands (at the intersection of Dalal Street, Bombay Samachar Marg and Hammam Street in downtown Mumbai) was acquired, and a building was constructed and occupied in 1930.Premchand Roychand was a leading stockbroker of that time, and he assisted in setting out traditions, conventions, and procedures for the trading of stocks at Bombay Stock Exchange and they are still being followed.
The following is the list of some of the initial members of the exchange, and who are still running their respective business:
D.S. Prabhudas & Company (now known as DSP, and a joint venture partner with Merrill Lynch)
Jamnadas Morarjee (now known as JM)
Champaklal Devidas (now called Cifco Finance)
Brijmohan Laxminarayan
In 1956, the Government of India recognized the Bombay Stock Exchange as the first stock exchange in the country under the Securities Contracts (Regulation) Act.
The most decisive period in the

history of the BSE took place after 1992. In the aftermath of a major scandal with market manipulation involving a BSE member named Harshad Mehta, BSE responded to calls for reform with intransigence. The foot-dragging by the BSE helped radicalise the position of the government, which encouraged the creation of the National Stock Exchange (NSE), which created an electronic marketplace. NSE started trading on 4 November 1994. Within less than a year, NSE turnover exceeded the BSE. BSE rapidly automated, but it never caught up with NSE spot market turnover. The second strategic failure at BSE came in the following two years. NSE embarked on the launch of equity derivatives trading. BSE responded by political effort, with a friendly SEBI chairman (D. R. Mehta) aimed at blocking equity derivatives

trading. The BSE and D. R. Mehta succeeded in delaying the onset of equity derivatives trading by roughly five years. But this trading, and the accompanying shift of the spot market to rolling settlement, did come along in 2000 and 2001 - helped by another major scandal at BSE involving the then President Mr. Anand Rathi. NSE scored nearly 100% market share in the runaway success of equity derivatives trading, thus consigning BSE into clearly second place. Today, NSE has roughly 66% of equity spot turnover and roughly 100% of equity derivatives turnover.

Capital Market: The capital market is divided into two segments viz:

Primary Market
Secondary Market
Primary Market:
Most companies are usually started privately by their promoters. However the promoters‘ capital and the borrowed capital from banks or financial institutions might not be sufficient for running the business over the long term. That is when corporate and the government looks at the primary market to raise long term funds by issuing securities such as debt or equity.

These securities may be issued at face value, at premium or at discount. Let us understand the meaning of these terms:

Face Value: Face value is the original cost of the security as shown in the certificate/instrument. Most equity shares have a face value of Rs. 1, Rs. 5, Rs. 10 or Rs. 100 and do not have much bearing on the actual market price of the stock. When issuing securities, they may be offered at a discount or at a premium.
Premium: When the security is offered at a price higher than the face value it is called a premium
Discount: When the security is offered at a price lower than the face value it is called a discount.
Secondary Market :
The secondary market provides liquidity to the investors in the primary market. Today we would not invest in any instrument if there was no medium to liquidate our position. The secondary markets provide an efficient platform for trading of those securities initially offered in the primary market. Also those investors who have applied for shares in an IPO may or may not get allotment. If they don‘t then they can always buy the shares (sometimes at a discount or at a premium) in the secondary market.
Trading in the secondary market is done through stock exchange. The Stock exchange is a place where the buyers and sellers meet to trade in shares in an organized manner. The stock exchange performs the

following functions:
Provide trading platform to investors and provide liquidity
Facilitate Listing of securities
Registers members - Stock Brokers, sub brokers
Make and enforce by-laws
Manage risk in securities transactions
Provides Indices
There are two leading stock exchanges in India which help us trade are:

National Stock Exchange: National Stock Exchange incorporated in the year 1992 provides trading in the equity as well as debt market. Maximum volumes take place on NSE and hence enjoy leadership position in the country today
Bombay Stock Exchange: BSE on the other hand was set up in the year 1875 and is the oldest stock exchange in Asia. It has evolved in to its present status as the premier stock exchange.
INTRODUCTION TO BSE:
As we read in the history of Indian stock exchange; the stock exchange, Mumbai, popularly known as

"BSE". BSE was established in 1875 as "The Native Share and Stock Brokers Association". It is the oldest one in Asia, even older than the Tokyo Stock Exchange, which was established in 1878. It is a voluntary non-profit making Association of Persons (AOP) and has converted itself into demutualised and corporate entity. It has evolved over the years into its present status as the Premier Stock Exchange in the country. It is the first Stock Exchange in the Country to have obtained permanent recognition in 1956 from the Govt. of India under the Securities Contracts (Regulation) Act, 1956.
The Exchange, while providing an efficient and transparent market for trading in securities, debt and derivatives upholds the interests of the investors and ensures redressal of their grievances whether against
the companies or its own member-brokers. It also strives to educate and enlighten the investors by conducting investor education programmes and making available to them necessary informative inputs.
A Governing Board having 20 directors is the apex body, which decides the policies and regulates the affairs of the Exchange. The Governing Board consists of 9 elected directors, who are from the broking community (one third of them retire every year by rotation), three SEBI nominees, six public representatives and an Executive Director & Chief Executive Officer and a Chief Operating Officer.
The Executive Director as the Chief Executive Officer is responsible for the day-to-day administration of the Exchange and he is assisted by the Chief Operating Officer and other
Heads of Department
INTRODUCTION TO NSE :
The National Stock Exchange (NSE) is India's leading stock exchange covering 364 cities and towns across the country. NSE was set up by leading institutions to provide a modern, fully automated screen-based trading system with national reach. The Exchange has brought about unparalleled transparency, speed & efficiency, safety and market integrity. It has set up facilities that serve as a model for the securities industry in terms of systems, practices and procedures. NSE has played a catalytic role in reforming the Indian securities market in terms of microstructure, market practices and trading volumes. The market today uses state-of-art information
technology to provide an efficient and transparent trading, clearing and settlement mechanism, and has witnessed several innovations in products & services viz. demutualisation of stock exchange governance, screen based trading, compression of settlement cycles, dematerialisation and electronic transfer of securities, securities lending and borrowing, professionalisation of trading members, fine-tuned risk management systems, emergence of clearing corporations to assume counterparty risks, market of debt and derivative instruments and intensive use of information technology.
The National Stock Exchange of India Limited has genesis in the report of the High Powered Study Group on Establishment of New Stock Exchanges, which

recommended promotion of a National Stock Exchange by financial institutions (FIs) to provide access to investors from all across the country on an equal footing. Based on the recommendations, NSE was promoted by leading Financial Institutions at the behest of the Government of India and was incorporated in November 1992 as a tax-paying company unlike other stock exchanges in the country. On its recognition as a stock exchange under the Securities Contracts (Regulation) Act, 1956 in April 1993, NSE commenced operations in the Wholesale Debt Market (WDM) segment in June 1994. The Capital Market (Equities) segment commenced operations in November 1994 and operations in Derivatives segment commenced in June 2000.
NSE's mission is setting the agenda for change in the securities markets in India. The NSE was set-up with the following objectives:
1 establishing a nation-wide trading facility for equities, debt instruments and hybrids,
2 ensuring equal access to investors all over the country through an appropriate communication network,
3 providing a fair, efficient and transparent securities market to investors using electronic trading systems,
4 enabling shorter settlement cycles and book entry settlements systems, and
5 meeting the current international standards of

securities markets.
One of the objectives of NSE was to provide a nationwide trading facility and to enable investors spread all over the country to have an equal access to NSE. NSE has made it possible for an investor to access the same market and order book, irrespective of location, at the same price and at the same cost. NSE has been promoted by leading financial institutions, banks, insurance companies and other financial intermediaries
Trading schedule
Trading on the equities segment takes place on all days of the week (except Saturdays and Sundays and holidays declared by the Exchange
in advance). The market timings of the equities segment are:
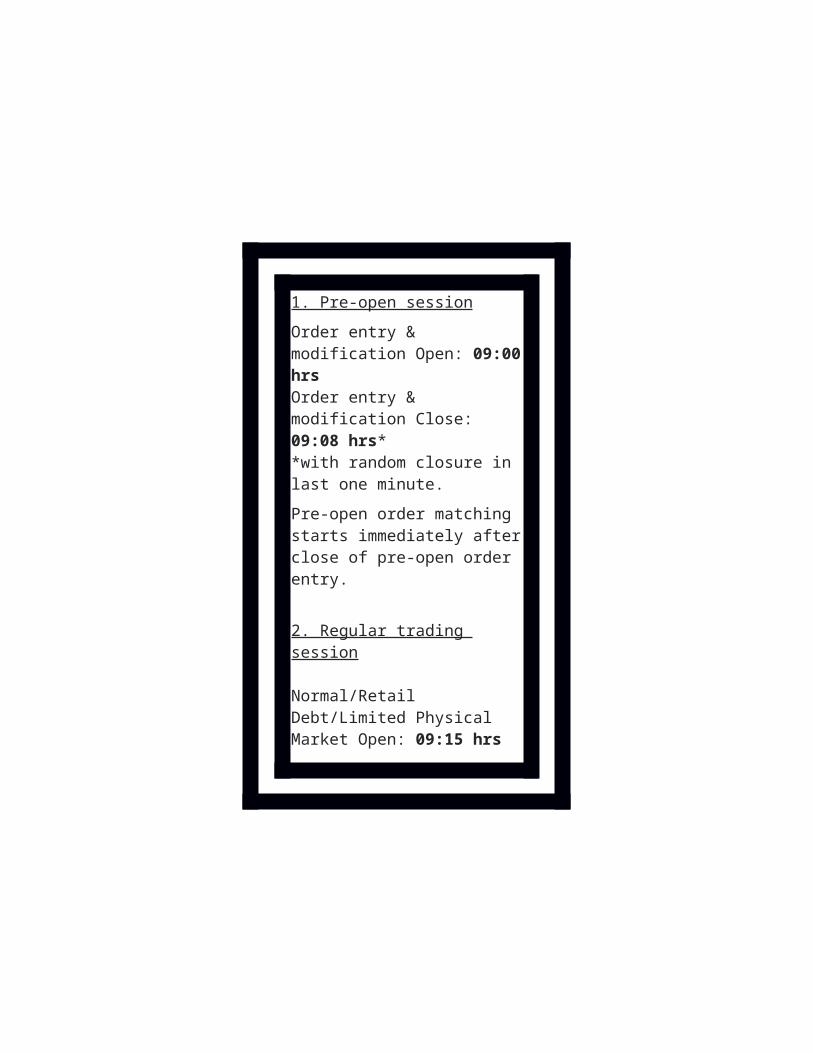
1. Pre-open session
Order entry & modification Open: 09:00 hrsOrder entry & modification Close: 09:08 hrs**with random closure in last one minute.
Pre-open order matching starts immediately after close of pre-open order entry.
2. Regular trading session
Normal/Retail Debt/Limited Physical Market Open: 09:15 hrsNormal/Retail Debt/Limited Physical Market Close: 15:30 hrsBlock deal session is held between 09:15 hrs and 09:50 hrs.
3. The Closing Session is held
between 15.40 hrs and 16.00 hrs.
The Exchange may however close the market on days other than the above schedule holidays or may open the market on days originally declared as holidays. The Exchange may also extend, advance or reduce trading hours when it deems fit and necessary.
SENSEX
An abbreviation of the Bombay Exchange Sensitive Index (Sensex) - the benchmark index of the Bombay Stock Exchange (BSE). It is composed of 30 of the largest and most actively-traded stocks on the BSE. Initially compiled in 1986, the Sensex is the oldest stock index in India.

Method for Calculation of Sensex
The method adopted for calculating Sensex is the market capitalization weighted method in which weights are assigned according to the size of the company. Larger the size, higher the weight age.
The base year chosen for calculation of sensex is 1978-79 and the base index value is set to 100 for this period.
The total value of shares in the market at the time of index construction is assumed to be ’100′ in terms of ‘points’. This is for the purpose of ease of calculation and to logically represent the change in terms of percentage. So, next day, if the market capitalization moves up 10%, the index also moves 10% to 110.
The stocks are selected based on a lot of qualitative and quantitative criteria’s.
The construction technique of index is quite easy to understand if we assume that there is only one stock in the market. In that case, the base value is set to 100 and let’s assumes that the stock is currently trading at 200. Tomorrow the price hits 260 (30% increase in price) so, the index will move from 100 to 130 to indicate that 30% growth. Now let’s assume that on day 3, the stock finishes at 208. That’s a 20% fall from 260. So, to indicate that fall, the Sensex will be corrected from 130 to 104(20%fall).
CNX NIFTY
CNX stands for the Credit Rating Information Services of India

Limited (CRISIL) and the National Stock Exchange of India (NSE). These two bodies own and manage the index within a joint venture called the India Index Services and Products Ltd. (IISL). Without the additional abbreviation to S&P CNX, the index name would be S&P CRISIL NSE Index.
Quick Clearing and Settlement
NSE has introduced a full range of clearing house facilities; a pan of securities is processed at the regional clearing centers (Delhi, Chennai and Calcutta). The inter region clearing facility provided at present, reduced that risk of the members because of not getting timely delivery of shares or loss of shares in transit. The facility is also expected to boost delivery based trading.
So the nifty index is a bit broader than the Sensex which is constructed using 30 actively traded stocks in the BSE.
Nifty is calculated using the same methodology adopted by the BSE in calculating the Sensex – but with three differences. They are:
The base year is taken as 1995 The base value is set to 1000 Nifty is calculated on 50 stocks actively traded in the NSE 50 top stocks are selected from 23 sectors.The selection criteria for the 50 stocks are also similar to the methodology adopted by the Bombay stock exchange.

IPO PROCESS
Conditions
1. Net Asset of Rs. 3 crore in each preceding year.
2. Distribution Profit at least 3 out of 5 preceding year.
3. Networth of 1 crore in preceding 3 years.
4. Issue size less than 5 times of pre issue.
The IPO process in India consists of the following steps: -
1) Appointment of merchant banker and other intermediaries
2) Registration of offer
document
3) Marketing of the issue
4) Post- issue activities
5) Appointment of Merchant Banker and Other Intermediaries
One of the crucial steps for successful implementation of the IPO is the appointment of a merchant banker. A merchant banker should have a valid SEBI registration to be eligible for appointment.
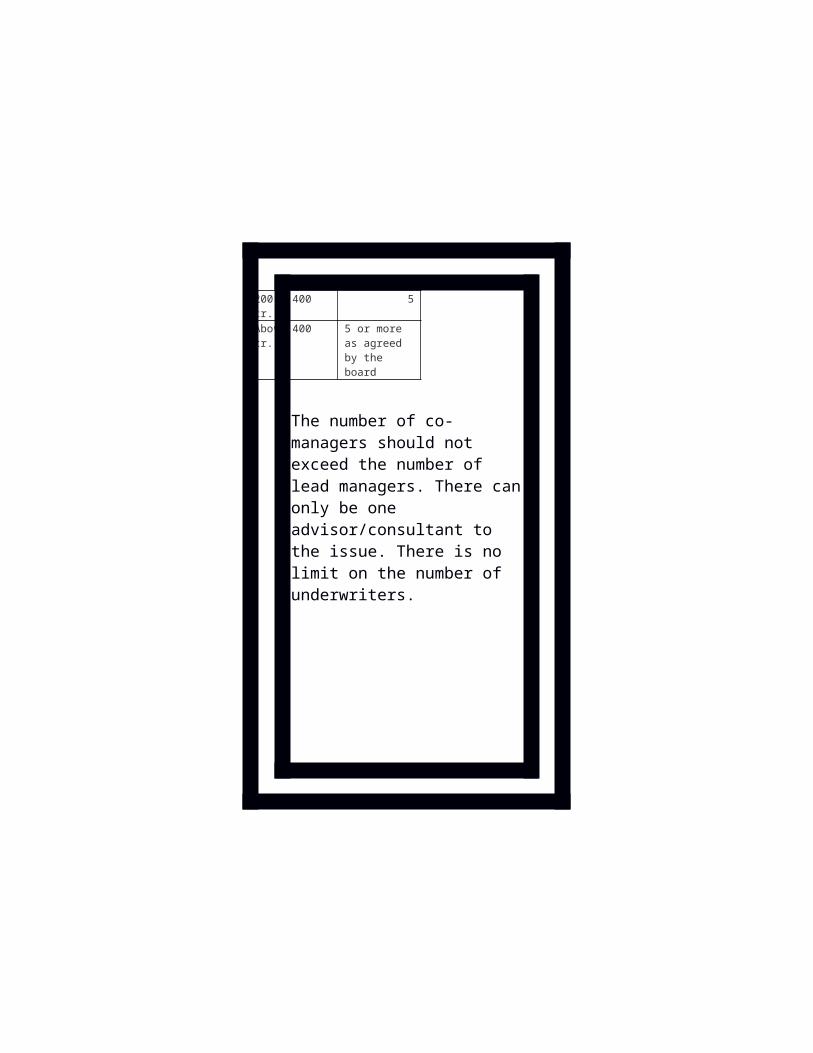
A merchant banker can be any of the following – lead manager, co-manager, underwriter or advisor to the issue. Certain guidelines are laid down in Section 30 of the SEBI Act, 1992 on the maximum limits of intermediaries associated with the issue:
Size of the Is-sue
No. Of lead Managers
50 cr. 2
50 – 100 cr. 3
100 – 200 cr. 4
200 - 400 cr. 5
Above 400 cr. 5 or more as agreed by the board
The number of co- managers should not exceed the number of lead managers. There can only be one advisor/consultant to the issue. There is no limit on the number of underwriters.

Other Intermediaries
Registrar to the Issue:
Registration with SEBI is mandatory to take on responsibilities as a registrar and share transfer agent. The registrar provides administrative support to the issue process. The registrar of the issue assists in everything from helping the lead manager in the selection of Bankers to the Issue and the Collection Centres to preparing the allotment and application forms, collection of application and allotment money, reconciliation of bank accounts with application money, listing of issues and grievance handling.
Bankers to the Issue:
Any scheduled bank registered with SEBI can be appointed as the banker to the issue. There are no

restrictions on the number of bankers to the issue. The main functions of bankers involve collection of application forms with money, maintaining a daily report , transferring the proceeds to the share application money account maintained by the controlling branch, and forwarding the money collected with the application forms to the registrar.
Underwriters to the Issue:
Underwriting involves a commitment from the underwriter to subscribe to the shares of a particular company to the extent it is under subscribed by the public or existing shareholders of the corporate. An underwriter should have a minimum net worth of 20 lakhs, and his total obligation at any time should not exceed 20 times the underwriter’s net worth. A

commission is paid to the writers on the issue price for undertaking the risk of under subscription.
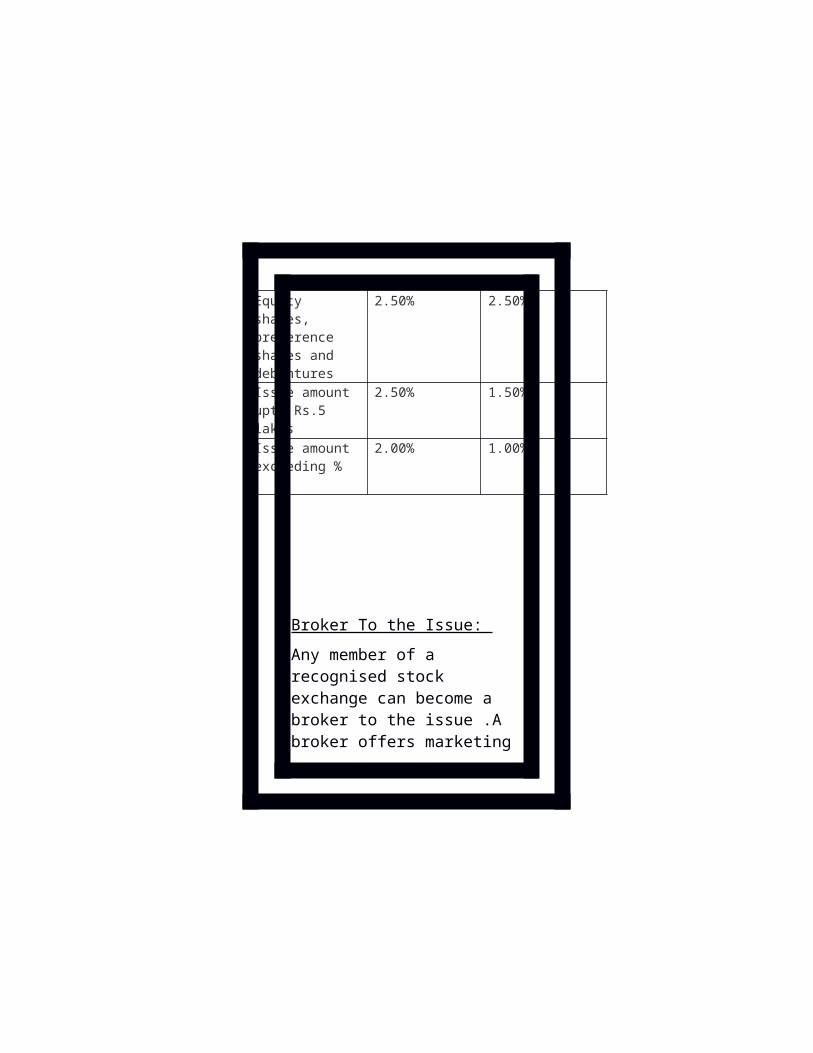
The maximum rate of underwriting commission paid is as follows:
Nature of Issue On amount Devolving On Underwriters
On amounts subscribed by public
Equity shares, preference shares and debentures
2.50% 2.50%
Issue amount upto Rs.5 lakhs
2.50% 1.50%
Issue amount exceeding %
2.00% 1.00%

Broker To the Issue:
Any member of a recognised stock exchange can become a broker to the issue .A broker offers marketing support, underwriting support, disseminates information to investors about the issue and distributes issue stationery at retail investor level.
Registration Of The Offer Document
For registration,10 copies of the draft prospectus should be filed with SEBI. The draft prospectus filed is treated as a public document. The lead manger also files the document with all listed stock exchanges. Similarly, SEBI uploads the document on its website www.sebi.com. Any amendments to be made in the prospectus should be done within 21days of filing the
offer document. Thereafter the offer document is deemed to have been cleared by SEBI.
Promoters Contribution:
In the public issue of an unlisted company, the promoters shall contribute not less than 20% of the post issue capital as given in Chapter- IV of the SEBI Act, 1992.The entire contribution should have been made before theopening of the issue.
Lock-in Requirement
The minimum promoters contribution will be locked in for a period of 3 years. The lock-in period commences from the date of allotment or from the date of commencement of commercial production, whichever is earlier.

Marketing of the Issue
• Timing of the Issue
• Retail distribution
• Reservation of the Issue
• Advertising Campaign
Timing of the Issue
An appropriate decision regarding the timing of the IPO should be made, keeping in mind the general sentiments prevailing in the investor market. For example, if recession is prevailing in the economy (the investors are pessimistic in their approach), then the firm will not be able to get a good pricing for its IPO, as investors may not be willing to put their money in stocks.

Retail distribution:
Retail distribution is the process through which an attempt is made to increase the subscription. Normally, a network of brokers undertakes retail distribution. The issuer company organises road shows in which conferences are held, which are attended by high networth investors, brokers and sub-brokers. The company makes presentations and solves queries raised by participants. This is one of the best ways to raise subscription.
Reservation in the Issue
Sometimes reservations are tailored to a specific class of investors. This reduces the amount to be issued to the general public. The following are the classes of investors for whom reservations are made:
• Mutual Funds

• Banks and Financial Institutions; Non-resident Indians (NRI) and Overseas Corporate Bodies (OCB) The total reservation for NRI/OCB should not exceed 10% of the post-issue capital, and individually it should not exceed 5% of the post issue capital.
• Foreign Institutional Investors (FII): The total reservation for FII cannot exceed 10% of the post-issue capital, and individually it should not exceed 5% of the post issue capital.
• Employees: Reservation under this category should not exceed 10% of the post issue capital.
• Group Shareholders: Reservation in this category should not exceed 10% of the post issue capital. The net offer made to the public should not be less then the 25% of the total issue at any point of time.

Post-Issue Activities
• Principles of Allotment: After the closure of the subscription list, the merchant banker should inform, within 3 days of the closure, whether 90% of the amount has been subscribed or not. If it is not subscribed up to 90%, then the underwriters should bring the shortfall amount within 60 days. In case of over subscription, the shares should be allotted on a pro-rata basis, and the excess amount should be refunded with interest to the shares holders within 30 days from the date of closure.
• Formalities Associated With Listing:
The SEBI lists certain rules and regulations to be followed by the issuing company. These rules and
regulations are laid down to protect the interests of investors. The issuing company should disclose to the public its profit and loss account, balance sheet, information relating to bonus and rights issue and any other relevant information.
SEBI
Securities Exchange Board of India (SEBI) was set up in 1988 to regulate the functions of securities market. SEBI promotes orderly and healthy development in the stock market but initially SEBI was not able to exercise complete control over the stock market transactions. It was left as a watch dog to observe

the activities but was found ineffective in regulating and controlling them. As a result in May 1992, SEBI was granted legal status. SEBI is a body corporate having a separate legal existence and perpetual succession.
Reasons for Establishment of SEBI:
With the growth in the dealings of stock markets, lot of malpractices also started in stock markets such as price rigging, ‘unofficial premium on new issue, and delay in delivery of shares, violation of rules and regulations of stock exchange and listing requirements. Due to these malpractices the customers started losing confidence and faith in the stock exchange. So government of India decided to set up an agency or
regulatory body known as Securities Exchange Board of India (SEBI).
Purpose and Role of SEBI:
SEBI was set up with the main purpose of keeping a check on malpractices and protect the interest of investors. It was set up to meet the needs of three groups.
1. Issuers:
For issuers it provides a market place in which they can raise finance fairly and easily.
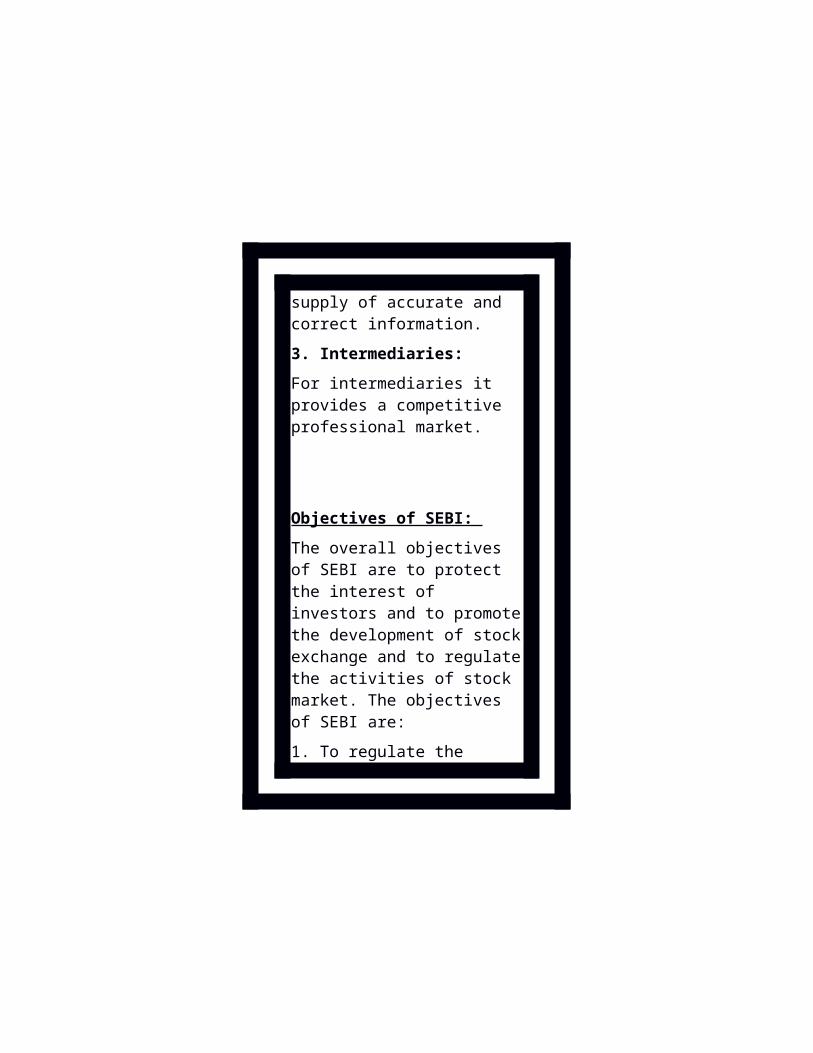
2. Investors:
For investors it provides protection and supply of accurate and correct information.
3. Intermediaries:
For intermediaries it provides a
competitive professional market.
Objectives of SEBI:
The overall objectives of SEBI are to protect the interest of investors and to promote the development of stock exchange and to regulate the activities of stock market. The objectives of SEBI are:
1. To regulate the activities of stock exchange.
2. To protect the rights of investors and ensuring safety to their investment.
3. To prevent fraudulent and malpractices by having balance between self regulation of business and its statutory regulations.
4. To regulate and develop a code of conduct for intermediaries such as
brokers, underwriters, etc.
P/E Ratio
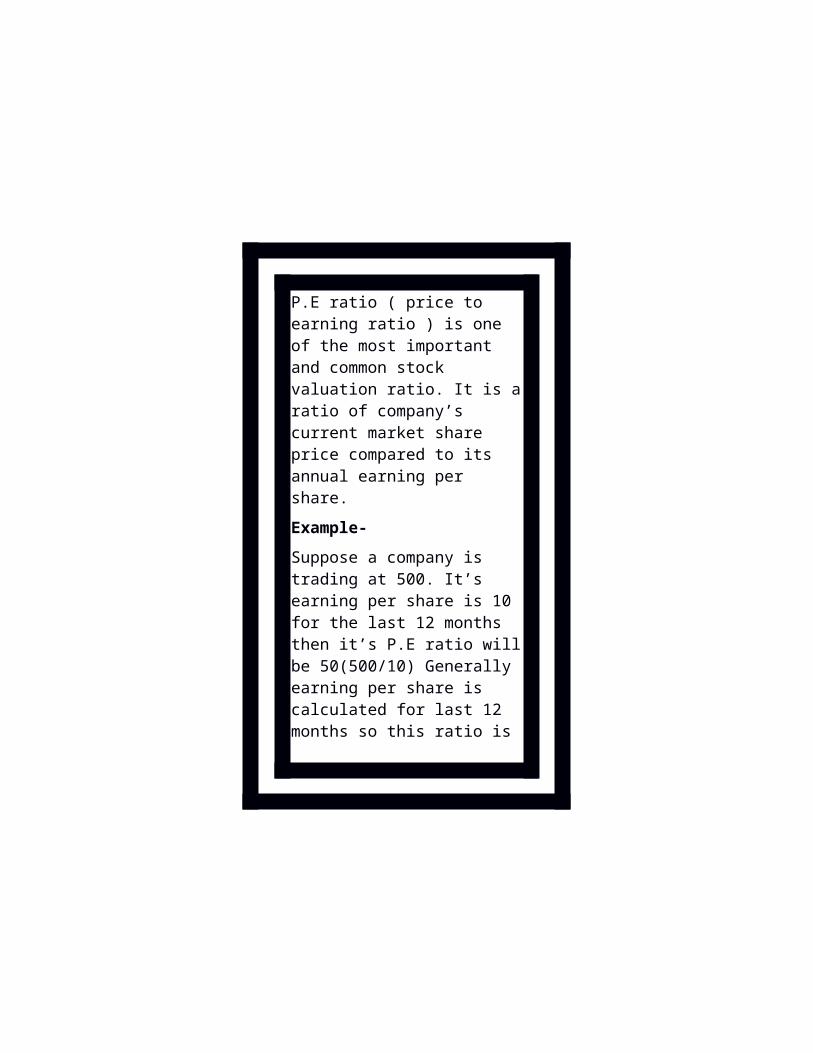
P.E ratio ( price to earning ratio ) is one of the most important and common stock valuation ratio. It is a ratio of company’s current market share price compared to its annual earning per share.
Example-
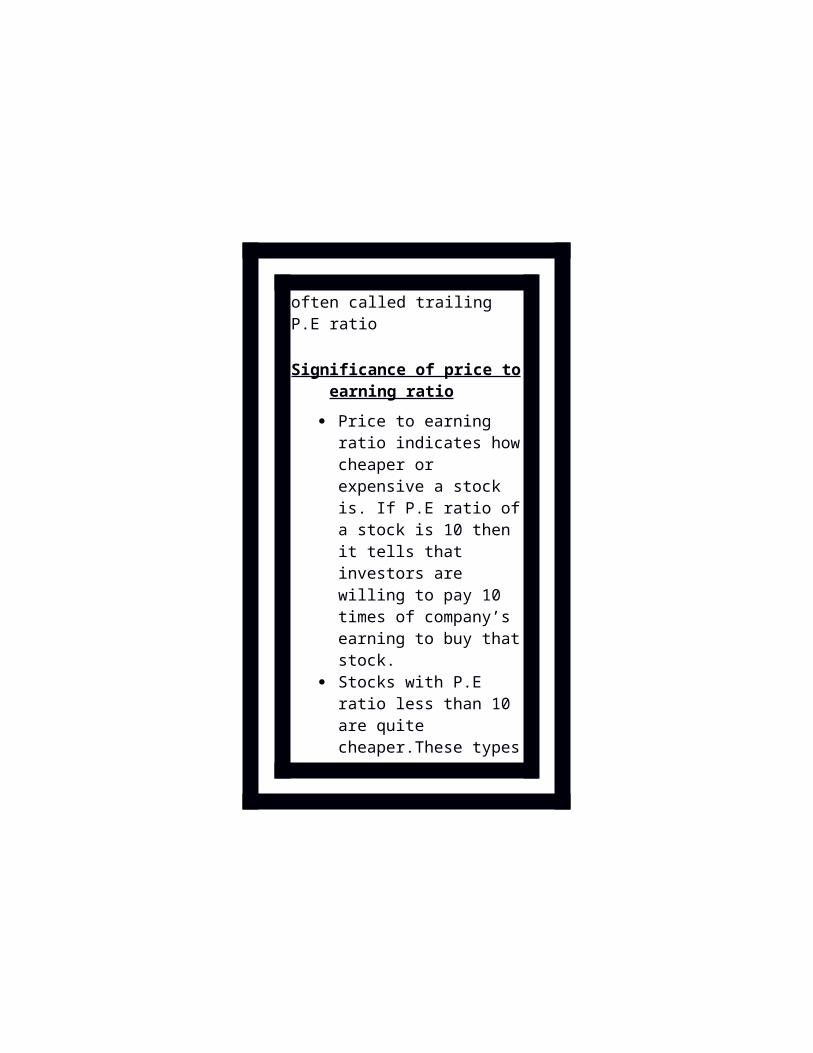
Suppose a company is trading at 500. It’s earning per share is 10 for the last 12 months then it’s P.E ratio will be 50(500/10) Generally earning per share is calculated for last 12 months so this ratio is often called trailing P.E ratio
Significance of price to earning ratio
Price to earning ratio indicates how cheaper or expensive a stock is. If P.E ratio of a stock is 10 then it

tells that investors are willing to pay 10 times of company’s earning to buy that stock.
Stocks with P.E ratio less than 10 are quite cheaper.These types of stocks often provide a good opportunity for buying. High Price to earning ratio indicates that investors are expecting high earning growth in future. But while investing don’t consider P.E ratio as a standalone parameter.
If all other things remain same then a 500 stock with P.E ratio 12 is cheaper than a 20 stock with P.E ratio 18.
FACTORS TO LOOK FOR BEFORE BUYING STOCK

Management
Project Undertaken
Goodwill
Past Performance
Debt Level
Dividend Declared
P/E Ratio
Volume Traded/Deliverable Quantity
Reasons For or Advantages in Investing In equity
High Intraday Margin
High Return
High Liquidity
Direct Investment

Charges (easy)
Tax Benefits
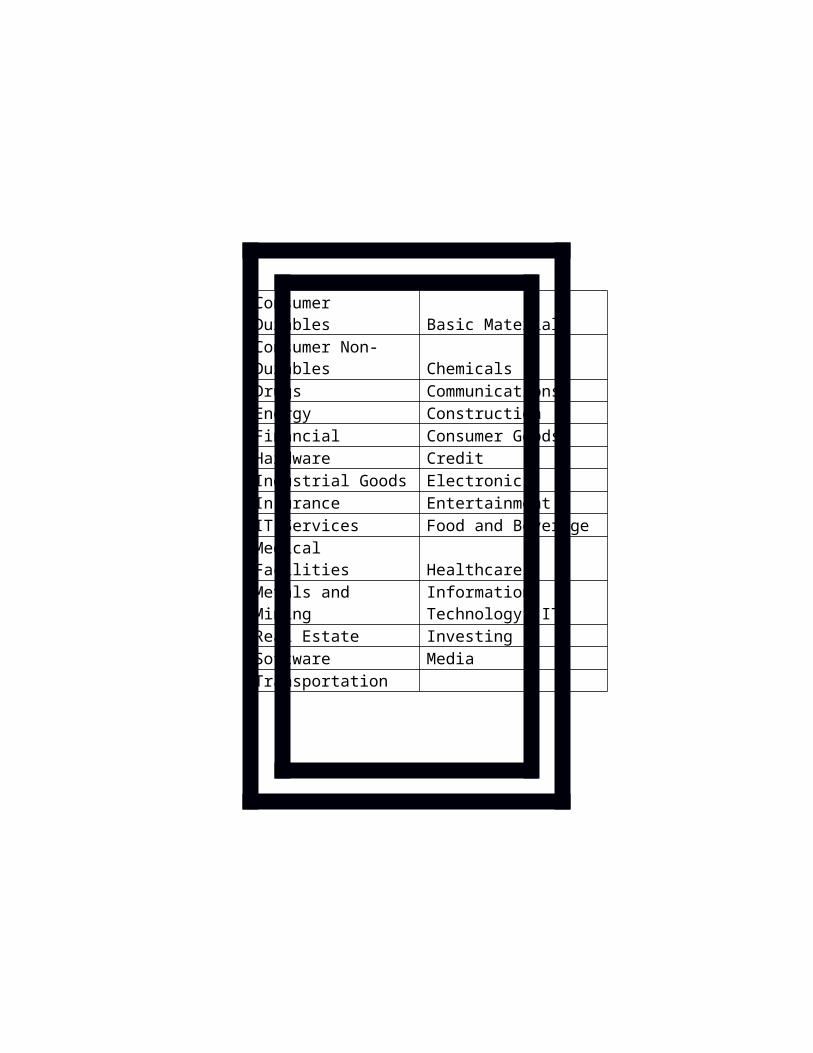
Sectors
Banking ServicesCapital Goods TechnologyClothing UtilitiesConglomerates AgricultureConsumer Durables Basic MaterialsConsumer Non-Durables ChemicalsDrugs CommunicationsEnergy ConstructionFinancial Consumer GoodsHardware CreditIndustrial Goods ElectronicsInsurance EntertainmentIT Services Food and BeverageMedical Facilities Healthcare

Metals and MiningInformation Technology (IT)
Real Estate InvestingSoftware MediaTransportation
FUNDAMENTAL ANALYSIS
Fundamental analysis is the examination of the underlying forces that affect the well being of the economy, industry groups and companies. As with most analysis, the goal is to develop a forecast of future price movement and profit from it. At the company level, fundamental analysis may involve examination of financial data, management, business concept and competition. At the industry level, there might be an examination of supply and demand forces of the

products.
Some of the Fundamental factors that should be kept in mind while analyzing the company that will help in deciding whether to invest in that company or not, are as follows:-
Market overview Market capitalization Goodwill Past performance Future prospect Management Dividend distribution Attrition rate
THREE PHASES OF FUNDAMENTAL ANALYSIS
1) Understanding of the macro-economic environment and developments (Economic

Analysis)
2) Analyzing the prospects of the industry to which the firm belongs (Industry Analysis)
3) Assessing the projected performance of the company (Company Analysis)
This three phase examination of fundamental analysis is also called EIC(Economy-Industry-Company Analysis) framework or a top-down approach.
Here the financial analyst first makes forecasts for the economy, then for industries and finally for companies. The industry forecasts are based on the forecasts for the economy and in turn, the company forecasts are based on the forecasts for both the industry and the economy. Also in this approach, industry groups are compared

against other industry groups and companies against other companies. Usually, companies are compared with others in the same group.For example, a telecom operator (Spice) would be compared to another telecom operator not to an oil company.
TECHNICAL ANALYSIS
Technical analysis takes a completely different approach; it doesn't care one bit about the "value" of a company or a commodity.
Technicians are only interested in the price movements in the market. Technical Analysis is the forecasting of future financial price movements based on an examination of past price movements.

Following are some technical factors that should be studied:-
Charts Ratio Resistance & Support
ASSUMPTIONS OF TECHNICAL ANALYSIS
The market value of a security is solely determined by the interaction of demand and supply factors operating in the market.
The demand and supply factors of a security are surrounded by numerous factors; these factors are

both rational as well as irrational.
The security prices move in trends or waves which can be both upward or downward depending upon the sentiments, psychology and emotions of operators or traders.
The present trends are influenced by the past trends and the projection of future trends is possible by an analysis of past price trends.
Except minor variations, stock prices tend to move in trends which continue to persist for an appreciable length of time.
Changes in trends in stock prices are caused whenever there is a shift in the demand and supply factors.
TOOLS IN TECHNICAL ANALYSIS

Line charts
Point and Figure Chart
Bar Graph
Candle Stick Chart
Line Chart with Volume
Moving Average
Line Chart
A chart that shows a security’s price over a period of time, such as a day, a month, or a year. A linechart is con-structed by placing points representing the price at different points in time, and then connecting the pointswith lines. It is useful in showing a security's trend over time. However, it does nothing to indicate the security's high, low,open, or close.
Point And Figure Chart
A chart pattern, peculiar to securities, in which only the significant value changes of a security, a futures contract, or a market average are recorded. The vertical axis represents price, but, unlike nearly all other charts, no variable, including time, is plotted on the horizontal axis. Entries on a point-and figure chart are made onlywhen a variable changes by a predetermined amount, for example, by one point or twopoints. A period of days may pass before an entry is recorded. Point and figure (P&F) is a charting technique used in technical analysis. Point and figure charting is unique in that it does not plot price against time as all other techniques do. Instead it plots price against changes in direction by

plotting a column of Xs as the price rises and a column of Os as the price falls.
Bar Chart
A style of chart used by
some technical analysts, on which, as illustrated below, the top of the vertical line indicates the highest price a security traded at during the day, and the bottom represents the lowest price. The closing price is displayed on the right side of the bar, and the opening price is shown on the left side of the bar. A single bar like the one below represents one day of trading.
Candle Stick Chart
A chart that displays the
high, low, opening and closing prices for a security for a single day. The wide part of the candlestick is called the "real body" and tells investors whether the closing price was higher or lower than the opening price (black/red if the stock closed lower, white/green if the stock closed higher). The candlestick's shadows show the day's high and lows and how they compare to the open and close. A candlestick's shape varies based on the relationship between the day's high, low, opening and closing prices.
Line Chart With Volume
There are many different types of stock charts: line, bar, OHLC (open-high-low-close), candlestick, mountain, point-and-figure, and others, which are viewable in different time frames: most commonly, daily, weekly, monthly, and intraday charts. Each style and time frame has its advantages and disadvantages, but they all reveal valuable price and volume information that you can use to
make profitable investing decisions
Moving Average
Moving averages are plotted on stock charts to help smooth out volatility and point out the direction a stock may be trending. It may also help provide context for the price or volume movements during a given period as it makes it easier to spot divergences from an established price trend. The red line cutting through the price bars is the 50-day moving average. It represents the average price over the previous 50 trading sessions and is calculated by summing the closing price over the last 50 trading sessions and dividing by 50. The black line is the 200-day moving average. It represents the average price over the previous 200 trading sessions and is calculated by summing the closing price over the
last 200 trading sessions and divid-ing by 200.
MARKET CAPITALIZATION
When understanding how to allocate funds for investing in equities, it is important to understand both your expectation of return and also your risk appetite. Once you are clear on these, it will be a lot easier for you to allocate money between the various categories of stocks.
There are three main classifications when it comes to stocks -
Large Cap stocks;
Mid Cap stocks; and
Small Cap stocks.
Here, the term 'cap' simply refers to the 'market capitalisation' of the stock.
And what is market capitalisation?
It is the value of the stock that you arrive at by multiplying the stock price by the company's outstanding number of equity shares.
Market Capitalisation = Current Stock Price x Number of Shares outstanding
For a better understanding, let us see an example:
Company XYZ has 10,000,000 shares outstanding and its current share price is Rs 8. Based on the above formula, we can calculate that Company XYZ's market

capitalisation is Rs 8 crore, or 1,00,00,000 shares x Rs 8 per share.
Market capitalization is the aggregate valuation of the company based on its current share price and the total number of outstanding stocks.
Definition: Market capitalization is the aggregate valuation of the company based on its current share price and the total number of outstanding stocks. It is calculated by multiplying the current market price of the company's share with the total outstanding shares of the company.
Description: Market capitalization is one of the most important characteristics that helps the investor determine the returns and the risk in the share. It also helps
the investors choose the stock that can meet their risk and diversification criterion.
For instance, a company has 2 crore outstanding shares and the current market price of each share is Rs100. Market capitalization of this company will be 200,00,000 x 100=Rs 200 crore.
Stocks of companies are of three types. The stocks with a market cap of Rs 10,000 crore or more are large cap stocks. Company stocks with a market cap between Rs 2 crore and 10 crore are mid cap stocks and those less than Rs 2 crore market cap are small cap stocks.
STOCK, SECTOR, SENSEX MOVEMENT

Movement In Stocks
Movement of a particular stock depends upon the following things:
Weightage of that particular company in its sector.
P/E Ratio of that company Any good/bad news relating
that company or its sector Good financial results of a
particular company. Movement of other
companies’ stocks in that sector.
Fundamental factors of that company.
Sector movement
Sector movements can be caused when
Stocks ( for eg. I.T stocks) can move the sector I.e internal.
External factors
economy
government laws
currency depreciation (exchange rate fluctuations)
If P.E ratio is less than 10 then it can move the market. Companies with high demand of shares their P.E ratio will also be high.
An another reason for sector movements is that when FII
's invest money into the market it causes sector movements and on the vice versa when they withdraw their money from the market like in the month of July when it is their year end the markets becomes slow.
FII's cause more sector movements than the DII's.
The major sectors in SENSEX are I.T sector, Banking sector, Oil and Gas sector, Steel sector, FMCG sector. When exchange rate changes it affects two sectors namely oil and gas and the I.T sector. Each sector has certain weightage or impact on the SENSEX. There can be certain external factors that can affect only 1 sector solely.

Bank and finance sectors have the highest weightage in SENSEX, so when the external factor that is when RBI changes its interest rates (repo and reverse repo rates) it can pull down the finance or bank sector which can affect the sector movements and in turn result in the fall of NIFTY or SENSEX.
Movement in SENSEX
Movement of SENSEX depends upon the following factors:
External factors affecting two or more sectors and their weightage in SENSEX
Movement of one sector
having a high weightage can move other sectors with it, which in turn will cause the movement of the SENSEX
CIRCUIT:-
Circuit is the maximum percentage change allowed in the share price in a particular day. The circuit is a upper and lower limit beyond which the trading is not allowed. Different stocks have different circuit limits. Usually they are 5%, 10% and 20%.
There are two types of circuits: 1. Buyer Circuit or Upper Circuits and 2. Seller circuit or lower circuit.
The purpose of circuit is to regulate the price and prevent any malpractise by traders or brokers/oprators. If the shares are traded in the options market also then there will not be any restrictions like the circuit breakers for the shares.
WHAT HAPPENS TO ORDERS DURING CIRCUIT LIMITS?
If the market hits the upper or lower circuits, trading is halted and you cannot place orders until the market re-opensIf you have pending orders with the broker at the time of circuit break, such orders can be modified or cancelled only once the trading re-opens.
If SENSEX or Nifty breaks the Circuit:
Movement in Indices
Time Close period
10 per cent Before 1.00 pm 1 hour

1.00 pm to 2.30 pm ½ hour
After 2.30 pm Does not close
15 per cent Before 1.00 pm 2 hour
1.00 pm to 2.30 pm 1 hour
After 2.30 pm Close for the rest of the day

20 per cent Any time Close for the rest of the day
RESISTANCE & SUPPORT:-Support and resistance is a concept in technical analysis that the movement of the price of a security will tend to stop and reverse at certain predetermined price levels.
A support level is a price level where the price tends to find support as it is going down. This means the price is more likely to "bounce" off this level rather than break through it. However, once the price has passed this level, by an
amount exceeding some noise, it is likely to continue dropping until it finds another support level.A resistance level is the opposite of a support level. It is where the price tends to find resistance as it is going up. This means the price is more likely to "bounce" off this level rather than break through it. However, once the price has passed this level, by an amount exceeding some noise, it is likely that it will continue rising until it finds another resistance level.Support and resistance levels can be identified by trend lines (technical analysis). Some traders believe in using pivot point calculations.The more often a support/resistance level is "tested" (touched and bounced off by price), the more significance given to that specific level.
If a price breaks past a support level, that support level often
becomes a new resistance level. The opposite is true as well, if price breaks a resistance level, it will often find support at that level in the future.
The Importance of Support and Resistance
Support and resistance analysis is an important part of trends because it can be used to make trading decisions and identify when a trend is reversing. For example, if a trader identifies an important level of resistance that has been tested several times but never broken, he or she may decide to take profits as the security moves toward this point because it is unlikely that it will move past this level.
Support and resistance levels both test and confirm trends and need to be monitored by anyone who uses
technical analysis. As long as the price of the share remains between these levels of support and resistance, the trend is likely to continue. It is important to note, however, that a break beyond a level of support or resistance does not always have to be a reversal. For example, if prices moved above the resistance levels of an upward trending channel, the trend has accelerated, not reversed. This means that the price appreciation is expected to be faster than it was in the channel.
Being aware of these important support and resistance points should affect the way that you trade a stock. Traders should avoid placing orders at these major points, as the area around them is usually marked by a lot of volatility. If you feel confident about making a trade near a support or resistance level, it is
important that you follow this simple rule: do not place orders directly at the support or resistance level. This is because in many cases, the price never actually reaches the whole number, but flirts with it instead. So if you're bullish on a stock that is moving toward an important support level, do not place the trade at the support level. Instead, place it above the support level, but within a few points. On the other hand, if you are placing stops or short selling, set up your trade price at or below the level of support.
INTRADAY AND DELIVERY TRADING:-
Intraday

Intraday trading refers to the practice of buying and selling financial instruments within the same trading day such that all positions will usually but not necessarily always be closed before the market close of the trading day that is from 9.15am to 3.07pm.
If an intraday trader is suffering loss and he feels tomorrow that particular stock will give him profit than if he can convert thr trade in T+5 days upto the money he has in his account. And if he has no cash in his account than company allows/gives margins upto 2 times to settle in 5 days.
In Intraday Trading,

company provides the trader with some amount of margin in addition to his initial margin to trade in the market
Intraday Trading involves taking a position in the markets with a view of squaring that position before the end of that day.
A day trader typically trades several times a day looking for fractions of a point to a few points per trade, but who close out all their positions by day's end.
The goal of a day trader is to capitalize on price movement within one trading day.
Unlike investors, a day
trader may hold positions for only a few seconds or minutes, and never overnight
This Intraday margin differs with the company. Karvy provides a trader with 10 times of his initial margin. For example, a trader has initial margin of Rs.50, 000, Karvy will allow him to take position for stock of worth Rs.5,00,000 for trading in Intraday.
The brokerage charged by Karvy in Intraday trading is 0.05% which is very low as compared to the delivery brokerage rates.

Why was Intraday Trading Introduced?
Intraday trading was introduced to increase the volume in the market.
Because where a trader was buying 100 stocks due to his limited margin, now he will be able to buy 1000 stocks because of his new margin (which is 10 times of his initial margin). Also the Brokerage amount is less in Intraday Trading as there is no procedure to hold the stocks for more than a day.
Increase the risk appetite of customers
Benefit to brokers as they will now receive brokerage on sale of 1000 shares
instead of 100 shares
Encourages the customers to trade as it serves as extra income apart from the income from business or salaried jobs.
Advantages Of Intraday Trading
In day trading you can buy stocks without paying for the full price of the stocks. The market makers allow you pay only a part of the price to hold the shares. So, you can gain more by investing less.
In day trading you can always short sell the stocks that means you can always sell the stocks before buying

them and then buy the stocks before the closing of the market. This is one benefit that can give you profit even when the price of the stock is sure to fall.
The brokerage of the intraday trading is always lower than the delivery trading.
In day trading you are getting the profit on the very day. So, you investment is for a few hours only. Therefore, even if the stock price rises, a little your profit percentage is significant.
You get back the money each day after the market closes and hence you can

always start afresh the next morning.
Disadvantages Of Intraday Trading:-
The biggest disadvantage of intraday trading is the time frame. You have to sell the stocks within a day. So, if the stock loses price you are sure to lose money.
Short Sell:-
Short selling is the selling of a stock that the seller doesn't own. More specifically, a short sale is the sale of a security that isn't owned by
the seller, but that is promised to be delivered.
The short seller was introduced because investor were not willing to invest in bearish market. First they used to wait for the market/stock price to come down and then they bought shares which reduced the volume of shares being traded. So this helped in motivating investors to earn even when the market is bearish.
For example, if a person A wants to buy 100 stocks of XYZ ltd, and B knows that the price of this stock will go down, then he will sell these 100 stocks to A virtually and after selling the stocks he must buy the

stocks from another seller in the market and for this, he will look for a seller who is ready to sell the same quantity of stocks at a lower price. If B is able to find a seller who will sell the stocks at a lower price, then B will gain profit and if not then he will have to buy the stocks from the seller who might sell at a higher price, to complete the contract but he will incur loss.
PROFIT BOOKING (Short)
Buying back borrowed securities in order to close an open short position. Profit Booking refers to the purchase of the exact same
security at a lower price that was initially sold short. So the short-sale process involved borrowing the security and selling it in the market and thus book profit in market. This will bring the market down as cash is being etracted out of the market by booking profit.
From the above example, we can understand the concept of short covering. When B short 100 stocks at the rate of Rs.20 to A and he finds a seller at Rs.17 in the market for same quantity of stocks, then B will buy these stocks and deliver it to A to complete the contract and he will gain the profit of Re.3 per share, this is called Profit Booking.
For instance - let's say that a trader decided to short 1,000

shares of XYZ at Rs.30. The stock has weakened considerably since then, and is now trading for just Rs.25 per share. The trader decides to take his Rs.5,000 profit (5 points x Rs.1,000 per point). To do this, he must close out his position by purchasing 1,000 shares of XYZ shares in order to exit his short position. By purchasing the 1,000 shares of XYZ, the trader returns the borrowed shares and is now out of the position.
SHORT COVERING
This concept is more or less same as profut booking under short sell but there investors do not earn profit. In short they fail in their strategy badly and thus to avoid much loss, they start buying at higher rates and thus faces loss. This concept makes the maket bullish or to go higher as people's money or losses enter into the market.
DELIVERY TRADING
Delivery based trading is the most common form share trading done by most of the stock market investors throughout the world. In this type of trading the investors have to pay the full price of the stock and the stocks are

deposited in their Demat account. There is no predefined time limit in case of the delivery based trading for selling the stocks.
The brokerage charged by Karvy for trading in Delivery is 0.50%.
The brokerage charged in Delivery is more than that of Intraday because in Delivery you have to hold the stocks in Demat account, whereas in Intraday, you get the stocks virtually.
The settlement in Delivery trading is done on T+2 basis .i.e. when you buy or sell the stocks, then the settlement is done on the second day after the trade has been done.
When an investor buys a stock in Intraday, he can convert that stock in Delivery before the closure of the Intraday market which is at 3.07pm. If the stock is converted to Delivery from Intraday then the investor can hold the stock for T+5 days.
In Karvy, when the investor trades in Delivery, he is allowed to take the position of twice of its initial margin. For example, if the initial margin of a person is Rs.50,000 then he is allowed to take position of Rs.1,00,000 for trading in Delivery.
This additional margin provided by the company differs in various companies.
Advantages Of Delivery Trading
The biggest advantage of delivery based trading is that you are not bound with time for selling the stock. You can hold the stocks for as long as you want. So, you can always hold a stock until you are getting a significant profit from the investment. Therefore, with delivery based trading you can always take your time to take a decision and reduce the risk of losses.
When you are making a long term investment with delivery based trading, you can also benefit from other

things like dividends, split of stocks, bonus shares and so on. These are benefits that the companies offer to their shareholders from time to time and you can make significant profit from these offers if you are holding the stocks for long period.
In delivery trading, the ownership of the share lies with the person who has purchased the share because he purchases the share with his own money.
Disadvantages of Delivery Trading
The biggest disadvantage of delivery based trading is the higher brokerage rate. The

brokerage rate for delivery based trading is relatively higher than the intraday trading.
You have to pay the full price of the stock for delivery based trading, whereas; in case of intraday trading you can buy stocks by paying only a part of the stock price. So, in case of intraday trading you can buy more stocks by investing less.
In delivery based trading you can never benefit from short selling. That means you have to hold the shares before you actually sell them.
These are the benefits and

disadvantages of delivery based trading. Whether you invest through delivery based trading or not solely depends on your financial capacity and willingness to take risks.
Brokerage Charges Of Different Broking Firms:-
Company Intraday charges Delivery charges
Types Of Charges Incurred In Intraday & Delivery Trading
ProductTransaction
RateService Tax
Effective Rate
Charged on
Securities Transaction Tax (STT)
Equity Delivery
Purchase 0.100% - 0.100% Turnover
Sell 0.100% - 0.100% Turnover
Equity Intra-day
Purchase - - -
Sell 0.025% - 0.025% TurnoverTransaction Charges
Equity Delivery
Purchase 0.0031% 12.36% 0.00348% Turnover
Sell 0.0031% 12.36% 0.00348% Turnover
Equity Intra-day
Purchase 0.0031% 12.36% 0.00348% TurnoverSell 0.0031% 12.36% 0.00348% Turnover
SEBI Turnover Charges
Equity Purchase 0.0001% 12.36% 0.00011% Turnover

Delivery Sell 0.0001% 12.36% 0.00011% Turnover
Equity Intra-day
Purchase 0.0001% 12.36% 0.00011% Turnover
Sell 0.0001% 12.36% 0.00011% Turnover
Stamp duty
Equity Delivery
Purchase 0.0100% 12.36% 0.0112%Turnover, in 5000 multiple
Sell 0.0100% 12.36% 0.0112%Turnover, in 5000 multiple
Equity Intra-day
Purchase 0.0020% 12.36% 0.0022%Turnover, in 5000 multiple
Sell 0.0020% 12.36% 0.0022%Turnover, in 5000 multiple
MARKET DEPTH

This is a market depth chart for 3IINFOTECH stock traded in NSE. Under this chart, buyers side for seller and sellers side is for buyer. Buyers BID to purchase from sellers and Sellers ASK for price from buyers We can see total no of buyers and sellers as well as top 5 HIGH Bidder and 5 lowest price (ASK) sellers. Buyers side shows highest price to lowest price, for example in above chart 2 different buyers have quoted highest bid at
Rs. 74.55. So this price will execute first if any seller wants to sell this share at market price. And then remaining buyers prices will execute after highest price total quantity gets fully executed i.e. 7800. Just the opposite happens for seller's side. Here lowest ask price is shown first i.e in ascending order (above chart – 74.65 to 74.85). This is one the useful tool to predict a stock's price movement for a day specially for intraday traders. Lets identify the indicators to predict the price -
a. Check if buyers are more than sellers, if yes the price will rise as there is more demand for that stock.
b. More sellers indicative that there is a selling pressure as people are booking profit and hence prices will come down.
c. for the both above a and b
case buyers and sellers should be at-least double.
In the above case sellers are just more than buyers it means there are more number short selling as people expect price to go down and book profit.
Security Measures and Operational Features of BSE and NSE:
Automated Trading System: Today our country has an advanced trading system which is a fully automated screen based trading system. This system adopts the principle of an order driven market as opposed to a quote driven system.
NSE operates on the 'National Exchange for Automated Trading'

(NEAT) system.
BSE operates on the BSEs Online Trading (BOLT) system.
Order Management in Automated Trading System: The trading system provides complete flexibility to members in the kinds of orders that can be placed by them. Orders are first numbered and time-stamped on receipt and then immediately processed for potential match.
Every order has a distinctive order number and a unique time stamp on it. If a match is not found, then the orders are stored in different 'books'. Orders are stored in price-time priority in various books in the following sequence:
Best Price, Within Price, by time priority .
Price priority means that if two orders are entered into the system, the order having the best price gets the higher priority. Time priority means if two orders having the same price are entered, the order that is entered first gets the higher priority.
Order Matching Rules in Automated trading system: The best buy order is matched with the best sell order. An order may match partially with another order resulting in multiple trades. For order matching, the best buy order is the one with the highest price and the best sell order is the one with the lowest price. This is because the system views all buy orders available from the point of view of
a seller and all sell orders from the point of view of the buyers in the market. So, of all buy orders available in the market at any point of time, a seller would obviously like to sell at the highest possible buy price that is offered. Hence, the best buy order is the order with the highest price and the best sell order is the order with the lowest price.

Members can proactively enter orders in the system, which will be displayed in the system till the full quantity is matched by one or more of counter-orders and result into trade(s) or is cancelled by the member. Alternatively, members may be reactive and put in orders that match with existing orders in the system. Orders lying unmatched in the system are 'passive' orders and orders that come in to match the existing orders are called 'active' orders. Orders are always matched at the passive order price. This ensures that the earlier orders get priority over the orders that come in later.
Order Conditions in Automated

Trading System: A Trading Member can enter various types of orders depending upon his/her requirements. These conditions are broadly classified into three categories:
Time Related Condition
Price Related Condition
Quantity Related Condition
TimeConditions
Day Order - A Day order, as the name suggests, is an order which is valid for the day on which it is entered. If the order is not matched during the day, the order gets cancelled automatically at the end of the trading day.
GTC Order - Good Till Cancelled (GTC) order is an order that
remains in the system until it is cancelled by the Trading Member. It will therefore be able to span trading days if it does not get matched. The maximum number of days a GTC order can remain in the system is notified by the Exchange from time to time.
GTD - A Good Till Days/Date (GTD) order allows the Trading Member to specify the days/date up to which the order should stay in the system. At the end of this period the order will get flushed from the system. Each day/date counted is a calendar day and inclusive of holidays. The days/date counted are inclusive of the day/date on which the order is placed. The maximum number of days a GTD order can remain in the system is notified by the Exchange from time to time.
IOC - An Immediate or Cancel (IOC) order allows a Trading
Member to buy or sell a security as soon as the order is released into the market, failing which the order will be removed from the market. Partial match is possible for the order, and the unmatched portion of the order is cancelled immediately.
Price Conditions
Limit Price/Order – An order that allows the price to be specified while entering the order into the system.
Market Price/Order – An order to buy or sell securities at the best price obtainable at the time of entering the order.
Stop Loss (SL) Price/Order – The one that allows the Trading Member to place an order which gets activated only when the market price of the relevant security

reaches or crosses a threshold price. Until then the order does not enter the market. A sell order in the Stop Loss book gets triggered when the last traded price in the normal market reaches or falls below the trigger price of the order. A buy order in the Stop Loss book gets triggered when the last traded price in the normal market reaches or exceeds the trigger price of the order.
E.g. If for stop loss buy order, the trigger is 93.00, the limit price is 95.00 and the market (last traded) price is 90.00, then this order is released into the system once the market price reaches or exceeds 93.00. This order is added to the regular lot book with time of triggering as the time stamp, as a limit order of 95.00

Quantity Conditions:
Disclosed Quantity (DQ)- An order with a DQ condition allows the Trading Member to disclose only a part of the order quantity to the market. For example, an order of 1000 with a disclosed quantity condition of 200 will mean that 200 is displayed to the market at a time. After this is traded, another 200 is automatically released and so on till the full order is executed. The Exchange may set a minimum disclosed quantity criteria from time to time.
MF - Minimum Fill (MF) orders allow the Trading Member to specify the minimum quantity by which an order should be filled. For example, an order of 1000 units with minimum fill 200 will require that each trade be for at least 200 units. In other words there will be a maximum of 5 trades of 200 each or

a single trade of 1000. The Exchange may lay down norms of MF from time to time.
AON - All or None orders allow a Trading Member to impose the condition that only the full order should be matched against. This may be by way of multiple trades. If the full order is not matched it will stay in the books till matched or cancelled.
Note: Currently, AON and MF orders are not available on the system as per SEBI directives.

INTRODUCTION TO DERIVATIVES
The origin of derivatives can be traced back to the need of farmers to protect themselvesagainst fluctuations in the price of their crop. From the time it was sown to the time itwas ready for harvest, farmers would face price uncertainty. Through the use of simplederivative products, it was possible

for the farmer to partially or fully transfer price risks by locking-in asset prices. These were simple contracts developed to meet the needs of farmers and were basically a means of reducing risk.A farmer who sowed his crop in June faced uncertainty over the price he wouldrece ive fo r h i s ha rve s t i n Sep t embe r. I n yea r s o f s ca r c i t y, he wou ld p robab ly ob t a in attractive prices. However, during times of oversupply, he would have to dispose off hisha rve s t a t a ve ry l ow p r i c e . C l ea r l y t h i s mean t t ha t t he f a rmer and h i s f ami ly we re exposed to a high risk of price uncertainty.
On the other hand, a merchant with an ongoing requirement of grains too wouldface a price risk that of having to pay exorbitant prices during dearth, although favorable prices could be obtained during periods of oversupply. Under such circumstances, itc l e a r l y made s ense fo r t he f a rmer and t he

merchan t t o come t oge the r and en t e r i n to contract whereby the price of the grain to be delivered in September could be decidedearlier. What they would then negotiate happened to be futures-type contract, whichwould enable both parties to eliminate the price risk.In 1848, the Chicago Board Of Trade, or CBOT, was established to bring farmersand merchan t s t oge the r. A g roup o f t r ade r s go t t oge the r and c r ea t ed t he ‘ t o - a r r i ve ’ contract that permitted farmers to lock into price upfront and deliver the grain later.These to-arrive contracts proved useful as a device for hedging and speculation on pricecharges. These were eventually standardized, and in 1925 the first futures clearing housecame into existence.
Today derivatives contracts exist on variety of commodities such as corn, pepper,cotton, wheat, silver etc. Besides

commodities, derivatives contracts also exist on a lot of financial underlying like stocks, interest rate, exchange rate, etc.
DERIVATIVES DEFINED
A d e r i v a t i v e i s a p r o d u c t w h o s e v a l u e i s d e r i v e d f r o m t h e v a l u e o f o n e o r m o r e unde r ly ing va r i ab l e s o r a s se t s i n a con t r ac tua l manne r. The unde r ly ing a s se t c an be equity, forex, commodity or any other asset. In our earlier discussion, we saw that wheat farmers may wish to sell their harvest at a future date to eliminate the risk of change in price by that date. Such a transaction is an example of a derivative. The price of this derivative is driven by the spot price of wheat which is the “underlying” in this case.
The Forwards Contracts (Regulation) Act, 1952, regulates the

forward/futures contracts in commodities all over India. As per this the Forward Markets Commission (FMC) continues to have jurisdiction over commodity futures contracts. However when de r i va t i ve s t r ad ing i n s ecu r i t i e s was i n t roduced i n 2001 , t he t e rm “ secu r i t y” i n t he Securities Contracts (Regulation) Act, 1956 (SCRA), was amended to include derivative contracts in securities. Consequently, regulation of derivatives came under the purview of Securities Exchange Board of India (SEBI). We thus have separate regulatory authorities for securities and commodity derivative markets. Derivatives are securities under the SCRA and hence the trading of derivatives is gove rned by t he r egu l a to ry f r amework unde r t he SCRA. The Secu r i t i e s Con t r ac t s (Regulation) Act, 1956 defines “derivative” to include-A security derived from a debt instrument, share, loan whether secured or unsecured, risk instrument or

contract differences or any other form of security.
TYPES OF DERIVATIVES MARKET
1. Exchange Traded Derivatives
a. National Stock Exchange b.Bombay Stock Exchange
Index Future
Index option
Stock option
Stock future
Interest Rate Futures
c. National Commodity & Derivative exchange

2. Over The Counter Derivatives
Derivatives in India
In India, derivatives markets have been functioning since the nineteenth century, withorganized trading in cotton through the establishment of the Cotton Trade Association in 1875.Derivatives, as exchange traded financial instruments were introduced in India in June 2000.The National Stock Exchange (NSE) is the largest exchange in India in derivatives, trading in various derivatives contracts. The first contract to be launched on NSE was the Nifty 50 index futures contract. In a span of one and a half years after the introduction of index

futures, index options, stock options and stock futures were also introduced in the derivatives segment for trading. NSE’s equity derivatives segment is called the Futures & Options Segment or F&O Segment. NSE also trades in Currency and Interest Rate Futures contracts under a separate segment.
A series of reforms in the financial markets paved way for the development of exchange-traded equity derivatives markets in India. In 1993, the NSE was established as an electronic, national exchange and it started operations in 1994. It improved the efficiency and transparency of the stock markets by offering a fully automated screen-based trading system with real-time price dissemination. A report on exchange traded derivatives, by the L.C. Gupta Committee, set up by the Securities
and Exchange Board of India (SEBI), recommended a phased introduction of derivatives instruments with bi-level regulation (i.e., self-regulation by exchanges, with SEBI providing the overall regulatory and supervisory role). Another report, by the J.R. Varma Committee in 1998, worked out the various operational details such as margining and risk management systems for these instruments. In 1999, the Securities Contracts (Regulation) Act of 1956, or SC(R)A, was amended so that derivatives could be declared as “securities”. This allowed the regulatory framework for trading securities, to be extended to derivatives. The Act considers derivatives on equities to be legal and valid, but only if they are traded on exchanges.
Milestones in the development of Indian Derivative Market
November 18, 1996 L.C. Gupta Committee set up to draft a policy framework for introducing derivatives
May 11, 1998 L.C. Gupta committee submits its report on the policy Framework
May 25, 2000 SEBI allows exchanges to trade in index futures
June 12, 2000 Trading on Nifty futures commences on the NSE
June 4, 2001 Trading for Nifty options commences on the NSE
July 2, 2001 Trading on Stock options commences on the NSE
November 9, 2001 Trading on Stock futures commences on the NSE
August 29, 2008 Currency derivatives trading commences on the NSE
August 31, 2009 Interest rate derivatives trading commences on the NSE
February 2010 Launch of Currency Futures on additional currency pairs
October 28, 2010 Introduction of European style Stock Options
October 29, 2010 Introduction of Currency Options
Two important terms
Before discussing derivatives, it would be useful to be familiar with two terminologies relating to the underlying markets. These are as follows:
Spot Market

In the context of securities, the spot market or cash market is a securities market in which securities are sold for cash and delivered immediately. The delivery happens after the settlement period. Let us describe this in the context of India. The NSE’s cash market segment is known as the Capital Market (CM) Segment. In this market, shares of SBI, Reliance, Infosys, ICICI Bank, and other public listed companies are traded.
The settlement period in this market is on a T+2 basis i.e., the buyer of the shares receives the shares two working days after trade date and the seller of the shares receives the money two working days after the trade date.
Index

An index is a basket of identified stocks, and its value is computed by taking the weighted average of the prices of the constituent stocks of the index. A market index for example consists of a group of top stocks traded in the market and its value changes as the prices of its constituent stocks change. In India, Nifty Index is the most popular stock index and it is based on the top 50 stocks traded in the market. Just as derivatives on stocks are called stock derivatives, derivatives on indices such as Nifty are called index derivatives.
Definitions of Basic Derivatives
There are various types of derivatives traded on exchanges across the world. They range from the very simple to the most

complex products. The following are the three basic forms of derivatives, which are the building blocks for many complex derivatives instruments (the latter are beyond the scope of this book):
ForwardsFuturesOptionsSwaps
Forwards
A forward contract or simply aforward is a contract between two parties to buy or sell an asset at a certain future date for a certain

price that is pre-decided on the date of the contract. The future date is referred to as expiry date and the pre-decided price is referred to as Forward Price. It may be noted that Forwards are private contracts and their terms are determined by the parties involved.
A forward is thus an agreement between two parties in which one party, the buyer, enters into an agreement with the other party, the seller that he would buy from the seller an underlying asset on the expiry date at the forward price. Therefore, it is a commitment by both the parties to engage in a transaction at a later date with the price set in advance. This is different from a spot market contract, which involves immediate payment and immediate transfer of asset. The party that agrees to buy the asset on a future date is referred

to as a long investor and is said to have a long position. Similarly the party that agrees to sell the asset in a future date is referred to as a short investor and is said to have a short position. The price agreed upon is called the delivery price or the Forward Price.
Forward contracts are traded only in Over the Counter (OTC) market and not in stockexchanges. OTC market is a private market where individuals/institutions can trade through negotiations on a one to one basis.
Futures
Like a forward contract, a futures contract is an agreement between two parties in which the buyer agrees to buy an underlying asset

from the seller, at a future date at a price that is agreed upon today. However, unlike a forward contract, a futures contract is not a private transaction but gets traded on a recognized stock exchange. In addition, a futures contract is standardized by the exchange. All the terms, other than the price, are set by the stock exchange (rather than by individual parties as in the case of a forward contract). Als o, both buyer and seller of the futures contracts are protected against the counter party risk by an entity called the Clearing Corporation. The Clearing Corporation provides this guarantee to ensure that the buyer or the seller of a futures contract does not suffer as a result of the counter party defaulting on its obligation. In case one of the parties defaults, the Clearing Corporation steps in to fulfill the obligation of this party, so that the
other party does not suffer due to non-fulfillment of the contract. To be able to guarantee the fulfillment of the obligations under the contract, the Clearing Corporation holds an amount as a security from both the parties. This amount is called the Margin money and can be in the form of cash or other financial assets. Also, since the futures contracts are traded on the stock exchanges, the parties have the flexibility of closing out the contract prior to the maturity by squaring off the transactions in the market.
The basic flow of a transaction between three parties, namely Buyer, Seller and Clearing Corporation is depicted in the diagram below:

Factors For Fluctuation of Future PricesInterest RateVolatilityTime DecencyOpen Interest

AdvantageBrokerageMarginRolloverTaxAmount InvestedBreakeven
Options
Like forwards and futures, options are derivative instruments that provide the opportunity to buy or sell an underlying asset on a future date.An option is a derivative contract between a buyer and a seller, where one party (say First Party) gives to the other (say Second Party) the right, but not the obligation, to buy from (or sell to) the First Party the underlying asset on or before a specific day at an agreed-upon price. In return for granting the
option, the party granting the option collects a payment from the other party. This payment collected is called the “premium” or price of the option.
The right to buy or sell is held by the “option buyer” (also called the option holder); the party granting the right is the “option seller” or “option writer”. Unlike forwards and futures contracts, options require a cash payment (called the premium) upfront from the option buyer to the option seller. This payment is called option premium or option price. Options can be traded either on the stock exchange or in over the counter (OTC) markets. Options traded on the exchanges are backed by the Clearing Corporation thereby minimizing the risk arising due to default by the counter parties involved. Options traded in the

OTC market however are not backed by the Clearing Corporation.There are two types of options—call options and put options—which are explained below.
Call option
A call option is an option granting the right to the buyer of the option to buy the underlying asset on a specific day at an agreed upon price, but not the obligation to do so. It is the seller who grants this right to the buyer of the option. It may be noted that the person who has the right to buy the underlying asset is known as the “buyer of the call option”. The price at which the buyer has the right to buy the asset is agreed upon at the time of entering the contract. This price is known as the

strike price of the contract (call option strike price in this case).
Since the buyer of the call option has the right (but no obligation) to buy the underlying asset, he will exercise his right to buy the underlying asset if and only if the price of the underlying asset in the market is more than the strike price on or before the expiry date of the contract. The buyer of the call option does not have an obligation to buy if he does not want to.
Put option
A put option is a contract granting the right to the buyer of the option to sell the underlying asset on or before a specific day at an agreed upon price, but not the obligation to do so. It is the seller who grants this right to the buyer of the option.
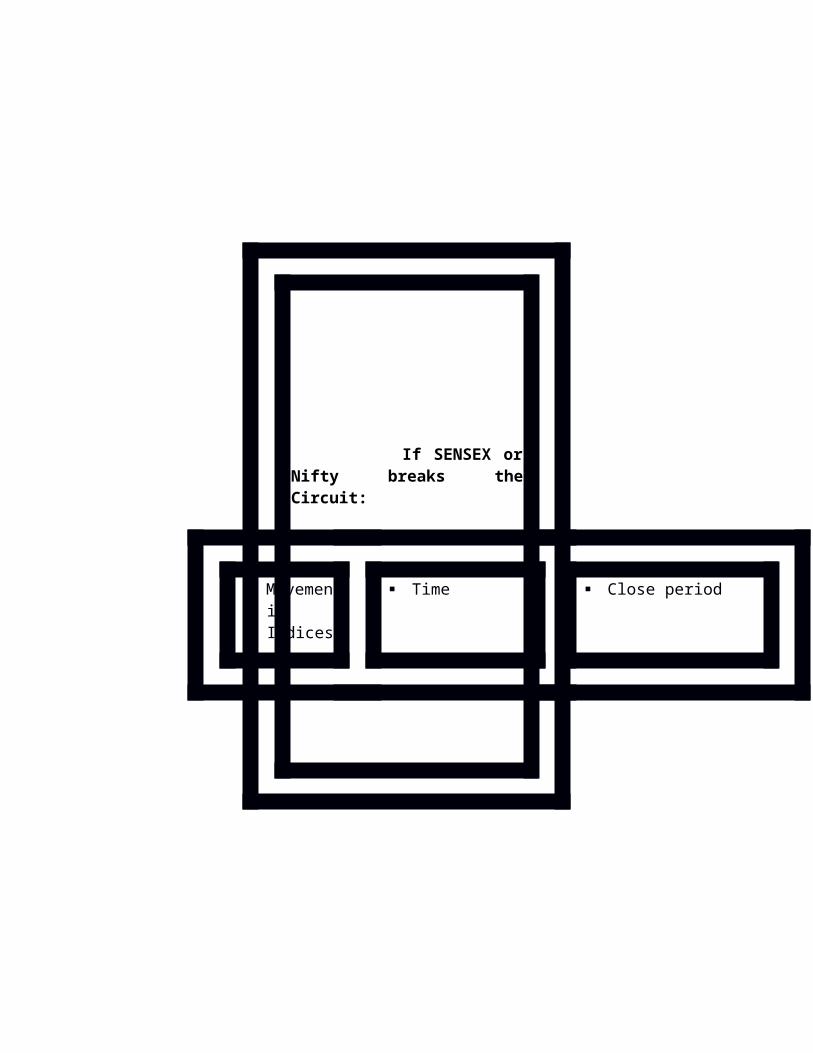
The person who has the right to sell the underlying asset is known as the “buyer of the put option”. The price at which the buyer has the right to sell the asset is agreed upon at the time of entering the contract. This price is known as the strike price of the contract (put option strike price in this case).
Since the buyer of the put option has the right (but not the obligation) to sell the underlying asset, he will exercise his right to sell the underlying asset if and only if the price of the underlying asset in the market is less than the strike price on or before the expiry date of the contract. The buyer of the put option does not have the obligation to sell if he does not want to.
Terminology of Derivatives
Spot price (ST)

Spot price of an underlying asset is the price that is quoted for immediate delivery of the asset. For example, at the NSE, the spot price of Reliance Ltd. at any given time is the price at which Reliance Ltd. shares are being traded at that time in the Cash Market Segment of the NSE. Spot price is also referred to as cash price sometimes.
Forward price or futures price (F)
Forward price or futures price is the price that is agreed upon at the date of the contract for the delivery of an asset at a specific future date. These prices are dependent on the spot price, the prevailing interest rate and the expiry date of the contract.
Strike price (K)

The price at which t he buyer of an option can buy the stock (in the case of a call option) or sell the stock (in the case of a put option) on or before the expiry date of option contracts is called strike price. It is the price at which the stock will be bought or sold when the option is exercised. Strike price is used in the case of options only; it is not used for futures or forwards.
Expiration date (T)
In the case of Futures, Forwards, Index and Stock Options, Expiration Date is the date on which settlement takes place. It is also called the final settlement date.
Types of Options
Options can be divided into two different categories depending upon the primary exercise styles associated with options. These categories are:
European Options: European options are options that can be exercised only on the expiration date.
American options: American options are options that can be exercised on any day on or before the expiry date. They can be exercised by the buyer on any day on or before the final settlement date or the expiry date.
Contract size
As futures and options are standardized contracts traded on an exchange, they have a fixed contract size. One contract of a
derivatives instrument represents a certain number of shares of the underlying asset. For example, if one contract of SBI consists of 125 shares of SBI, then if one buys one futures contract of SBI, then for every Re 1 increase in SBI’s futures price, the buyer will make a profit of 125 X 1 = Rs 125 and for every Re 1 fall in BHEL’s futures price, he will lose Rs 125.
Contract ValueContract value is notional value of the transaction in case one contract is bought or sold. It is the contract size multiplied but the price of the futures. Contract value is used to calculate margins etc. for contracts. In the example above if SBI futures are trading at Rs. 2600 the contract value would be Rs. 2000 x 125 = Rs. 2.5 lakhs.

Margins
In the spot market, the buyer of a stock has to pay the entire transaction amount (forpurchasing the stock) to the seller. For example, if Infosys is trading at Rs. 2000 a share and an investor wants to buy 100 Infosys shares, then he has to pay Rs. 2000 X 100 = Rs.2,00,000 to the seller. The settlement will take place on T+2 basis; that is, two days after the transaction date. In a derivatives contract, a person enters into a trade today (buy or sell) but the settlement happens on a future date. Because of this, there is a high possibility of default by any of the parties.
Futures and option contracts are traded through exchanges and the

counter party risk is taken care of by the clearing corporation. In order to prevent any of the parties from defaulting on his trade commitment, the clearing corporation levies a margin on the buyer as well as seller of the futures and option contracts. This margin is a percentage (approximately 20%) of the total contract value. Thus, for the aforementioned example, if a person wants to buy 100 Infosys futures, then he will have to pay 20% of the contract value of Rs 2,00,000 = Rs 40,000 as a margin to the clearing corporation. This margin is applicable to both, the buyer and the seller of a futures contract.
Moneyness of an Option
“Moneyness” of an option indicates whether an option is worth exercising or not i.e. if the option is
exercised by the buyer of the option whether he will receive money or not.The following three terms are used to define the moneyness of an option.
In-the-money option
An option is said to be in-the-money if on exercising the option, it would produce a cash inflow for the buyer. Thus, Call Options are in-the-money when the value of spot price of the underlying exceeds the strike price. On the other hand, Put Options are in-the- money when the spot price of the underlying is lower than the strike price. Moneyness of an option should not be confused with the profit and loss arising from holding an option contract. It should be noted that while moneyness of an option does not
depend on the premium paid, profit/loss do. Thus a holder of an in-the-money option need not always make profit as the profitability also depends on the premium paid.
Out-of-the-money option
An out-of-the-money option is an opposite of an in-the-money option. An option-holder will not exercise the option when it is out-of-the-money. A Call option is out-of-the-money when its strike price is greater than the spot price of the underlying and a Put option is out-of-the money when the spot price of the underlying is greater than the option’s strike price.
At-the-money option

An at-the-money-option is one in which the spot price of the underlying is equal to the strike price. It is at the stage where with any movement in the spot price of the underlying, the option will either become in-the-money or out-of-the-money.Applications of DerivativesFocusing on participants in the derivatives markets and how they usederivatives contracts.
Participants in the Derivatives Market
As equity markets developed, different categories of investors started participating in the market. In India, equity market participants currently include retail investors, corporate investors, mutual funds, banks, foreign institutional investors etc. Each of these investor
categories uses the derivatives market to as a part of risk management, investment strategy or speculation. Based on the applications that derivatives are put to, these investors can be broadly classified into three groups:· Hedgers· Speculators, and· Arbitrageurs
Hedgers
These investors have a position (i.e., have bought stocks) in the underlying market but are worried about a potential loss arising out of a change in the asset price in the future. Hedgers participate in the derivatives market to lock the prices at which they will be able to transact in the future. Thus, they try to avoid price risk through holding a position in the derivatives market. Different hedgers take different
positions in the derivatives market based on their exposure in the underlying market. A hedger normally takes an opposite position in the derivatives market to what he has in the underlying market.
Speculators
A Speculator is one who bets on the derivatives market based on his views on the potential movement of the underlying stock price. Speculators take large, calculated risks as they trade based on anticipated future price movements. They hope to make quick, large gains; but may not always be successful. They normally have shorter holding time for their positions as compared to hedgers. If the price of the underlying moves as per their expectation they can make large profits. However, if the price moves in the opposite

direction of their assessment, the losses can also be enormous.
Arbitrageurs
Arbitrageurs attempt to profit from pricing inefficiencies in the market by making simultaneous trades that offset each other and capture a risk-free profit. An arbitrageur may also seek to make profit in case there is price discrepancy between the stock price in the cash and the derivatives markets.
Uses of Derivatives
Risk management
The most important purpose of the derivatives market is risk management. Risk management for
an investor comprises of the following three processes:Identifying the desired level of risk that the investor is willing to take on his investments;Identifying and measuring the actual level of risk that the investor is carrying; andMaking arrangements which may include trading (buying/selling) of derivatives contracts that allow him to match the actual and desired levels of risk.
Market efficiency
Efficient markets are fair and competitive and do not allow an investor to make risk free profits. Derivatives assist in improving the efficiency of the markets, by providing a self-correcting mechanism. Arbitrageurs are one section of market participants who trade whenever there is an

opportunity to make risk free profits till the opportunity ceases to exist. Risk free profits are not easy to make in more efficient markets. When trading occurs, there is a possibility that some amount of mispricing might occur in the markets. The arbitrageurs step in to take advantage of this mispricing by buying from the cheaper market and selling in the higher market. Their actions quickly narrow the prices and thereby reducing the inefficiencies.
Price discovery
One of the primary functions of derivatives markets is price discovery. They provide valuable information about the prices and expected price fluctuations of the underlying assets in two ways:
First, many of these assets are traded in markets in different geographical locations. Because of this, assets may be traded at different prices in different markets. In derivatives markets, the price of the contract often serves as a proxy for the price of the underlying asset. For example, gold may trade at different prices in Mumbai and Delhi but a derivatives contract on gold would have one value and so traders in Mumbai and Delhi can validate the prices of spot markets in their respective location to see if it is cheap or expensive and trade accordingly.
Second, the prices of the futures contracts serve as prices that can be used to get a sense of the market expectation of future prices. For example, say there is a company that produces sugar and expects that the production of sugar

will take two months from today. As sugar prices fluctuate daily, the company does not know if after two months the price of sugar will be higher or lower than it is today. How does it predict where the price of sugar will be in future? It can do this by monitoring prices of derivatives contract on sugar (say a Sugar Forward contract). If the forward price of sugar is trading higher than the spot price that means that the market is expecting the sugar spot price to go up in future. If there were no derivatives price, it would have to wait for two months before knowing the market price of sugar on that day.
Settlement of Derivatives
Settlement refers to the process through which trades are cleared by the payment/receipt of currency, securities or cash flows on periodic
payment dates and on the date of the final settlement. The settlement process is somewhat elaborate for derivatives instruments which are exchange traded. At the NSE, the National Securities Clearing Corporation Limited (NSCCL) undertakes the clearing and settlement of all trades executed on the F&O segment of NSE. It also acts as a legal counterparty to all trades on the F&O segment and guarantees their financial settlement. There are two clearing entities in the settlement process: Clearing Members and Clearing Banks.
Clearing members
A Clearing member (CM) is the member of the clearing corporation i.e., NSCCL. These are the members who have the authority to
clear the trades executed in the F&O segment in the exchange.
Settlement of Futures
When two parties trade a futures contract, both have to deposit margin money which is called the initial margin. Futures contracts have two types of settlement: (i) the mark-to-market (MTM) settlement which happens on a continuous basis at the end of each day, and (ii) the final settlement which happens on the last trading day of the futures contract i.e., the last Thursday of the expiry month.
Mark to market settlement
To cover for the risk of default by the counterparty for the clearing corporation, the futures contracts are marked-to-market on a daily basis by the exchange. Mark to

market settlement is the process of adjusting the margin balance in a futures account each day for the change in the value of the contract from the previous day, based on the daily settlement price of the futures contracts (Please refer to the Tables given below.). This process helps the clearing corporation in managing the counterparty risk of the future contracts by requiring the party incurring a loss due to adverse price movements to part with the loss amount on a daily basis. Simply put, the party in the loss position pays the clearing corporation the margin money to cover for the shortfall in cash. In extraordinary times, the Exchange can require a mark to market more frequently (than daily). To ensure a fair mark-to-market process, the clearing corporation computes and declares the official price for determining daily gains and losses.

This price is called the “settlement price” and represents the closing price of the futures contract. The closing price for any contract of any given day is the weighted average trading price of the contract in the last half hour of trading.
Final settlement for futures
After the close of trading hours on the expiry day of the futures contracts, NSCCL marks all positions of clearing members to the final settlement price and the resulting profit/loss is settled in cash. Final settlement loss is debited and final settlement profit is credited to the relevant clearing bank accounts on the day following the expiry date of the contract. Suppose the above contract closes on day 6 (that is, it expires) at a price of Rs. 1040, then on the day of expiry, Rs. 100 would be debited

from the seller (short position holder) and would be transferred to the buyer (long position holder).
Settlement of Options
In an options trade, the buyer of the option pays the option price or the option premium. The options seller has to deposit an initial margin with the clearing member as he is exposed to unlimited losses. There are basically two types of settlement in stock option contracts: daily premium settlement and final exercise settlement. Options being European style, they cannot be exercised before expiry.
Daily premium settlement
Buyer of an option is obligated to pay the premium towards the options purchased by him. Similarly, the seller of an option is

entitled to receive the premium for the options sold by him. The same person may sell some contracts and buy some contracts as well. The premium payable and the premium receivable are netted to compute the net premium payable or receivable for each client for each options contract at the time of settlement.
Exercise settlement
Normally most option buyers and sellers close out their option positions by an offsetting closing transaction but a better understanding of the exercise settlement process can help in making better judgment in this regard. Stock and index options can be exercised only at the end of the contract.
CALL OPTIONA call option is an option contract in which the holder (buyer) has the right (but not the obligation) to buy a specified quantity of a security at a specified price (strike price) within a fixed period of time (until its expiration).For the writer (seller) of a call option, it represents an obligation to sell the underlying security at the strike price if the option is exercised. The call option writer is paid a premium for taking on the risk associated with the obligation.For stock options, each contract covers 100 shares.A call option is defined by the following 4 characteristics:
There is an underlying stock or index
There is

an expiration date of the call option
There is a strike price of the call option
The option is the right to BUY the underlying stock or index. This contracts to a put option, which is the right to sell the underlying stock
A call option is called a "call" because the owner has the right to "call the stock away" from the seller. It is also called an "option" because the owner of the call option has the "right", but not the "obligation", to buy the stock at the

strike price. In other words, the owner of the call option (also known as "long a call") does not have to exercise the option and buy the stock--if buying the stock at the strike price is unprofitable, the owner of the call can just let the option expire worthless.The most attractive characteristic of owning call options is that your profit is technically unlimited. And your loss is limited to the amount that you paid for the option.
Selling Call Options
Instead of purchasing call options, one can also sell (write) them for a profit. Call option writers, also known as sellers, sell call options with the hope that they expire worthless so that they can pocket
the premiums. Selling calls, or short call, involves more risk but can also be very profitable when done properly. One can sell covered calls or naked (uncovered) calls.
Covered Calls
The short call is covered if the call option writer owns the obligated quantity of the underlying security. The covered call is a popular option strategy that enables the stock owner to generate additional income from their stock holdings through periodic selling of call options.
It's an options strategy whereby an investor holds a long position in an asset and writes (sells) call options on
that same asset in an attempt to generate increased income from the asset. This is often employed when an investor has a short-term neutral view on the asset and for this reason hold the asset long and simultaneously have a short position via the option to generate income from the option premium.
For Eg:-For example, let's say that you own shares of the TCS and like its long-term prospects as well as its share price but feel in the shorter term the stock will likely trade relatively flat, perhaps within a few Rupees of its current price of, say, Rs2,270. If you sell a call option on TCS for Rs.2,280 , you earn the premium from the option sale but cap your upside. One of three scenarios is

going to play out:
a) TCS shares trade flat (below the Rs.2,280 strike price) - the option will expire worthless and you keep the premium from the option. In this case, by using the buy-write strategy you have successfully outperformed the stock.
b) TCS shares fall - the option expires worthless, you keep the premium, and again you outperform the stock.
c) TCS shares rise above Rs.2,280 - the option is exercised, and your upside is capped at Rs.2,280 , plus the option premium. In this case, if the stock price goes higher than Rs.2,280 , plus the premium, your buy-write strategy has underperformed the TCS shares.

When to Buy Call Options
If you think a stock price is going to go up, then there are 3 trades that you can make to profit from a rising stock price: you can buy the stock you can buy call options on the stock, or you can write put options on the stock
PUT OPTION:-
A put option is an option contract in which the holder (buyer) has the right (but not the obligation) to sell a specified quantity of a security at a specified price (strike price) within a fixed period of time (until its expiration).
For the writer (seller) of a put option, it represents an obligation to buy the underlying security at the strike price if the option is exercised. The put option writer is paid a premium for taking on the risk associated with the obligation.For stock options, each contract covers 100 shares.
A put option, like a call option, is defined by the following 4 characteristics:
There is an underlying stock or index to which the option relates There is an expiration date of the put option There is a strike price of the put option The put option is the right to SELL the underlying stock or index at the strike

price. This contrasts with a call option which is the right to BUY the underlying stock or index at the strike price.
It is called an "put" because it gives you the right to "put", or sell, the stock or index to someone else. A put option differs from a call option in that a call is the right to buy the stock.Since put options are the right to sell, owning a put option allows you to lock in a minimum price for selling a stock. It is a "minimum selling price" because if the market price is higher than your strike price, then you would just sell the stock at the higher market price and not exercise it.
When to Buy a Put
If we think a stock or index price is going to go down, then there are 3 ways you can profit from a falling stock price:can short the stock or indexcan write a call option on the stock, orcan buy a put option on the stock.
Expiration Cycles:-
Options contracts have a maximum of 3-month trading cycle - the near month (one), the next month (two) and the far month (three). On expiry of the near month contract, new contracts are introduced at new strike prices for both call and put options, on the trading day following the expiry of the near month contract. The new contracts are introduced for three month duration
August Options Current monthSeptember Options Near monthOctober Options Far month
OPTION STRATEGIES:-

Long Call Buying a call in a bullish
market hoping that the market will go up.
The profit is unlimited and the loss is limited to the premium paid.
For the Fig 1, Sriram Transport Finance, STRIKE PRICE : 1000 CE AND PREMIUM : 40
profit 1000
0 loss 1040 X
-40
Here 1040 is the breakeven

point ie no profit no loss and beyond 1040 we stand to earn profit and below 1040 we incur loss.
Suppose Spot price of Nifty is at 1200 then we stand to earn profit of 160(1200 – 1040) and if Nifty is at Spot price 900 we incur loss of 140
Short Call
When an investor takes a short call position, the security’s price must fall in order for the strategy to be profitable. Not only must the price fall, it must fall by at least the price of the call option. The farther the fall, the greater the profit.
Conversely, should the investor’s hence fail and the

security’s price thus rise, the strategy loses money for the investor. As there is no boundary for how high the price can rise, the potential losses are unlimited.
Limited profit and unlimited loss
For example, SBI 2000 CE and premium = 50
50
Profit (limited) X
2000 2050
Unlimited Loss
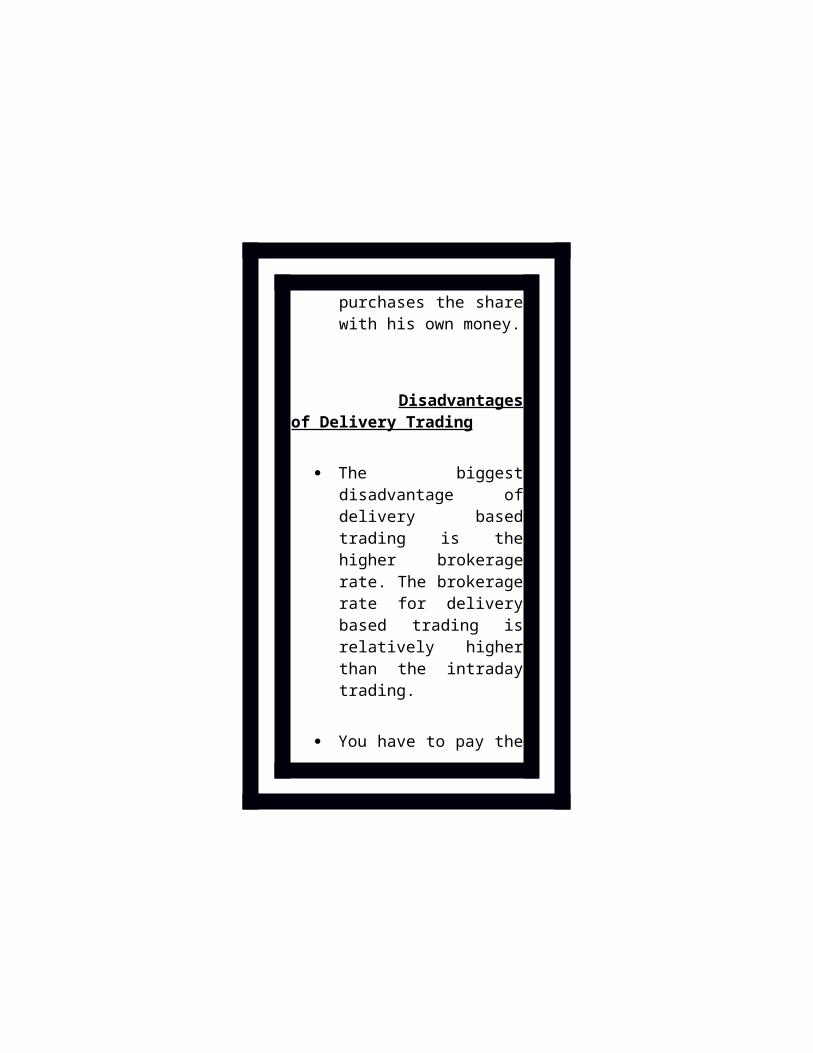
Here we stand to earn only limited profit. Suppose if the Spot price is 1800 then we stand to earn a profit of 50 and if our spot price is 2150 we incur a loss of 100 since 2050 is our break even point.
Long Put
A put option is a security that you buy through

your stock and option broker when you think the price of a stock or index is going to go down.
A put option is the right to sell shares of a stock or an index at a certain price by a certain date. That "certain price" is known as the strike price, and that "certain date" is known as the expiry or expiration date.
A put becomes more valuable as the price of the underlying stock depreciates relative to the strike price.
Relaince, Buy 1200 PE at premium 100
Profit
1200 X 1100 Limited Loss
Here, Suppose our spot price is 950, then we earn a profit of 150 and if the spot price is 1300 then we incur a loss of 100 since the market is at high and the put won’t get excecuted and thus limited loss above 1200.
Short put
A short put is simply the

sale of a put option. Maximum Loss: Unlimited
in a falling market. Maximum Gain: Limited to
the premium received for selling the put option.
We can use short put option when the market direction is bullish and bearish on market volatility.
Example TCS, Strike Price= 2500, Premium= 60
Profit
0 2440 2500
Loss
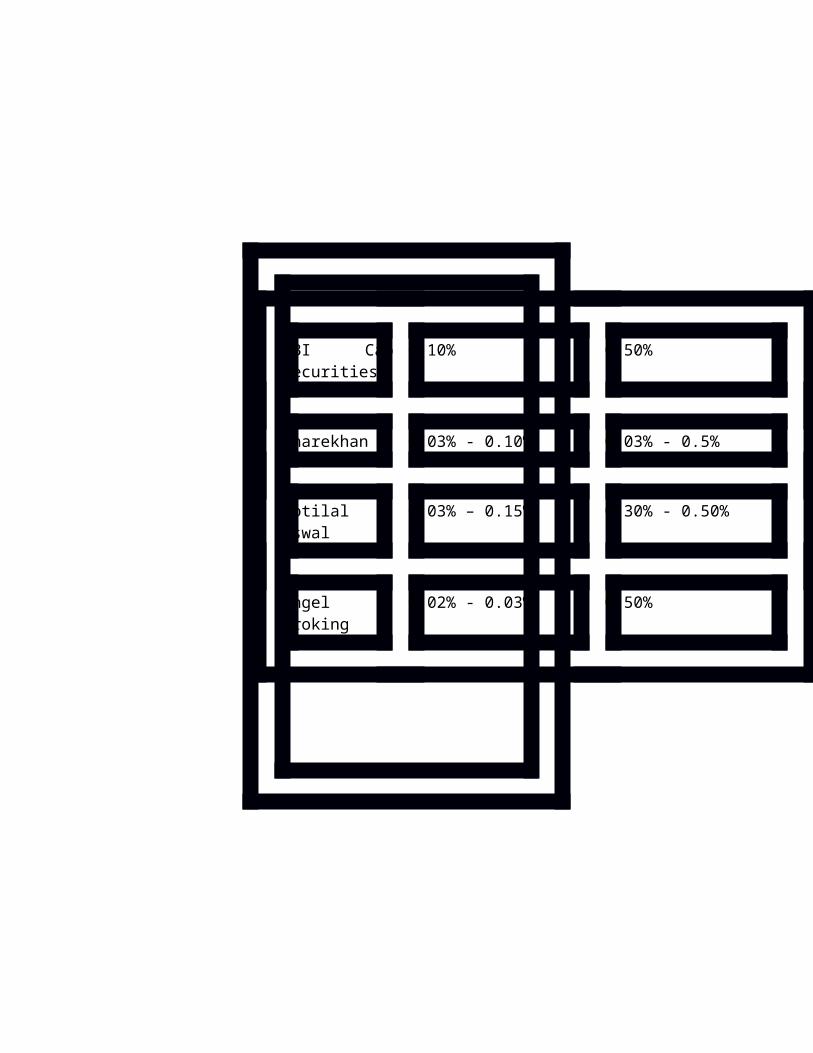
Here, Suppose the spot price is 2200 then we incur loss of 240 and if the spot price is 2600 we earn a profit of 60 since the put will get executed when the market is down as seller receives premium.
Long Straddle
A strategy of trading Options whereby the trader
will purchase a long call and a long put with the same underlying asset, expiration date and strike price.
The strike price will usually be at the money market price of the underlying

security. Long straddle options are
unlimited profit, limited risk options trading strategies that are used when the options trader thinks that the underlying securities will experience significant volatility in the near term.
By having long positions in both call and put options, straddles can achieve large profits no matter which way the underlying stock price heads, provided the move is strong enough.
Payoff Table:-
SBI Strike price – 3000 Buy 1 CALL @ 110 Buy 1 PUT @ 90
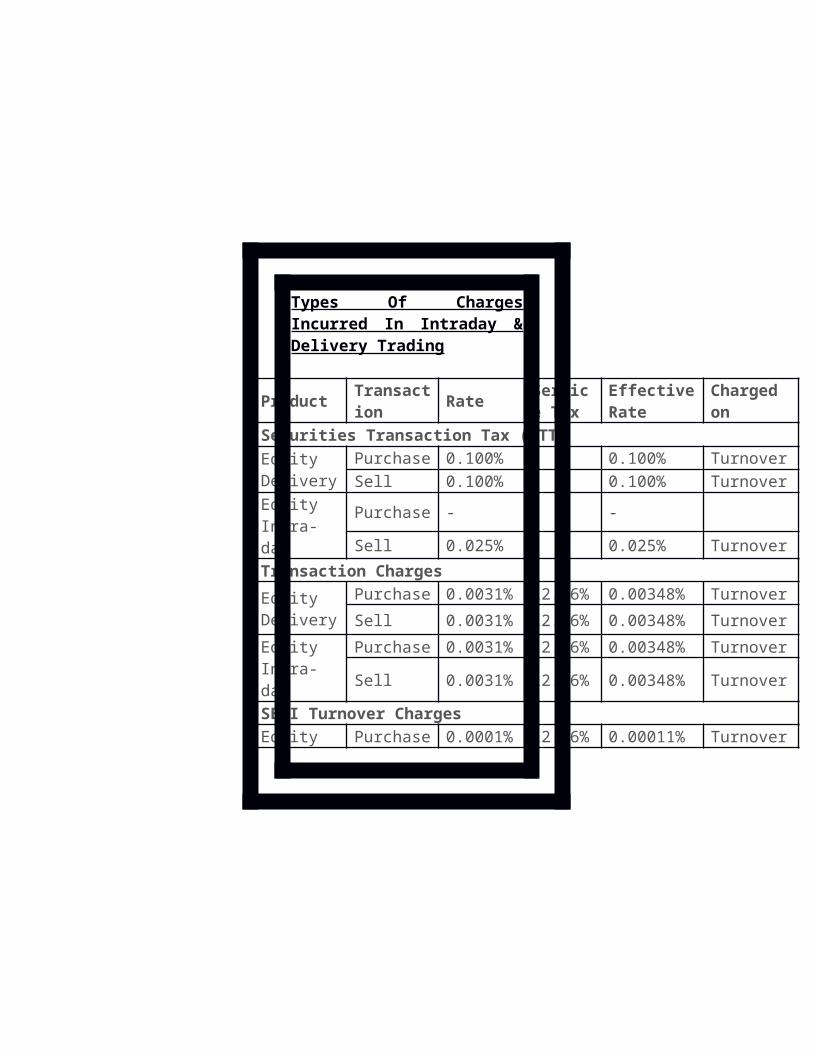
STRIKE PRICE
+ CE +PE PREMIUM TOTAL PROFIT
S<3000 ---- 3000-S -200 2800-S
S=3000 0 0 -200 -200
S>3000 S-3000 ---- -200 S-3200
Break Even Points- 2800-S = 0, S-3200=0, So two break even points are 2800, 3200. Therefore Spot between 2800 to 3200 will not give any profit, only below 2800 and above 3200 will give profits.
PROFIT PROFIT
0 2800 2910 3000 3110 3200 X

-90
-110
Loss
If Spot is at 2900, then there would be a loss of rs. 100. If spot is at 2500 or 3500, then profit would be 300.
Short Straddle
The short straddle is a neutral options strategy that involve the simultaneous selling of a put and a call of the same underlying stock, striking price and expiration date.
In short straddle we sell 1 ATM call and sell 1 ATM put. Short straddles are limited profit, unlimited risk
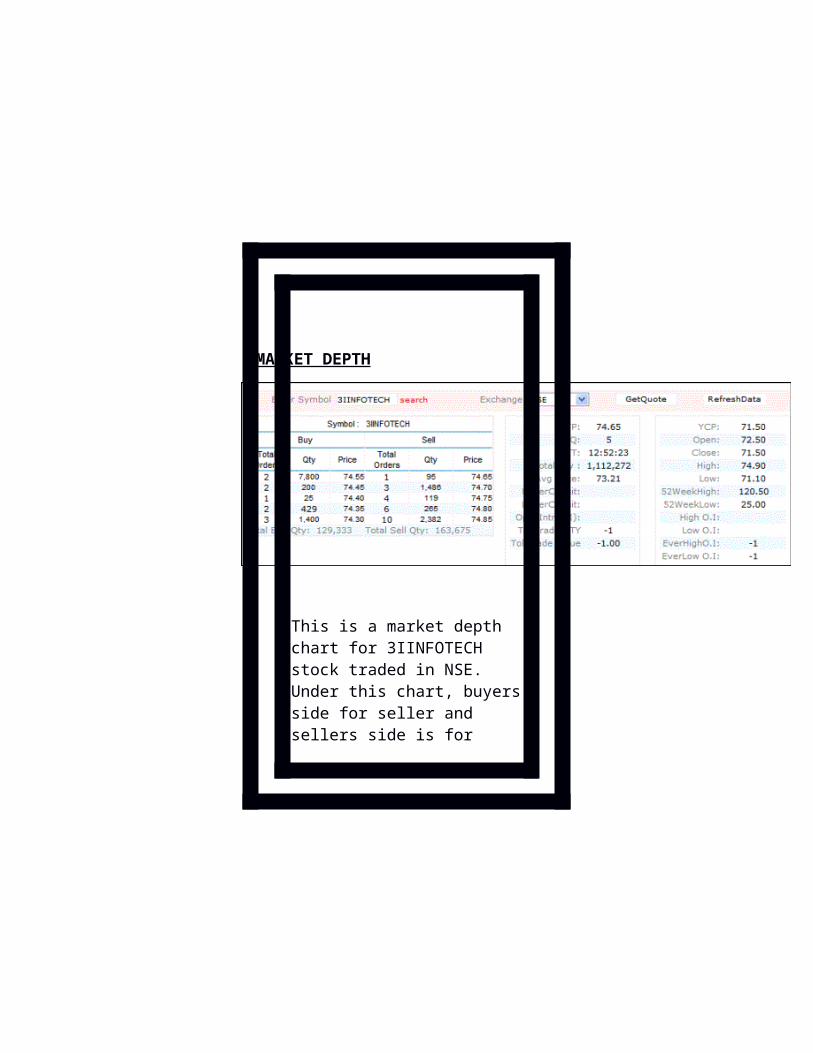
options. Maximum profit for the
short straddle is achieved when the underlying stock price on expiration date is trading at the strike price of the options sold.
Large losses for the short straddle can be incurred when the underlying stock price makes a strong move either upwards or downwards at expiration, causing the short call or the short put to expire deep in the money.
Payoff Table:- SBI Strike Price – 3000 Sell 1 CALL @ 90 Sell 1 PUT @ 110
STRIKE PRICE
-CE -PE PREMIUM TOTAL PROFIT

S<3000 --- -(3000-S) 200 -2800+S
S=3000 0 0 200 200
S>3000 -(S-3000) --------- 200 -S+3200
PROFIT
110
90
0 2800 2890 3000 3090 3200
LOSS LOSS
If Spot is at 3100, there would be a
profit of Rs. 100,{-(3100-3000)+200}
If Spot is at 3400, Then there will a loss of Rs. 200, {-(3400-3000)+200}
Long Strangle
The long strangle is a neutral strategy in options trading that involve the simultaneous buying of a slightly out-of-the-money put and a slightly out-of-the-money call of the same underlying stock and expiration date.
The long options strangle is an unlimited profit, limited risk strategy.
Large gains for the long strangle option strategy is attainable when the underlying stock price makes a very strong move either upwards or downwards at expiration.
Maximum loss for the long strangle options strategy is hit when the underlying stock price on expiration date is trading between the strike prices of the options bought. At this price, both options expire worthless and the options trader loses the entire initial debit taken to enter the trade.
Usually this strategy is used when there is a huge volatility in market, rather change in series helps earning a client’s strategy.
Payoff Table:-

Example- Tech Mahindra Spot at 2100
Buy 1 PUT NIFTY 2000 @ 50
Buy 1 CALL NIFTY 2200 @ 60
STRIKE PRICE
+ CE(2200)
S-X
+PE(2000)
X-S
PREMIUM TOTAL PROFIT
S<2000 ---- 2000-S -110 1890-S
S=2000 ----- ------ -110 -110
2000<S<2200 ----- ------- -110 -110
S=2200 ---- ------- -110 -110
S>2200 S-2200 ---- -110 S-2310
Break Even Points = 1890 Lower Side, 2310 Upper SideAt 2000, 2100 and 2200, there would be a loss of Rs. 1100. Below 2000 and beyond 2200 there would be

unlimited profit.
PROFIT PROFIT
0 1950 2000 2200 2260 -50-60 LOSS-110
Short Strangle
The short strangle, also known as sell strangle, is a neutral strategy in options trading that involve the simultaneous selling of a slightly and a slightly out-

of-the-money call of the same underlying stock and expiration date.
The short strangle option strategy is a limited profit, unlimited risk options. Maximum profit for the short strangle occurs when the underlying stock price on expiration date is trading between the strike prices of the options sold.
At this price, both options expire worthless and the options trader gets to keep the entire initial credit taken as profit. Large losses for the short strangle can be experienced when the underlying stock price makes a strong move either upwards or downwards at expiration.
Payoff Table:-
Example – Infosys Spot at 2500.
Sell 1 CALL NIFTY 2700 @ 80
Sell 1 PUT NIFTY 2300 @ 40
STRIKE PRICE
-CE -PE PREMIUM TOTAL PROFIT
S<2300 ---- -(2300-S) 120 -2180+S
2300<S<2700 0 0 120 120
S>2700 -(S-2700) ---- 120 -S+2820
Breakeven Points, 2180 and 2820, If Spot is between this range then there would be a change a profit of 120(limited) and beyond 2820 and below 2180 there would be unlimited loss.

120
PROFIT
80
40
0 2180 2260 2300 2700 2780 2820
LOSS LOSS
At Spot – 2200, His Profit/Loss would be {-(2300-2200)+120} = profit 20
Bull Call Spread
The bull call spread option

trading strategy is employed when the options trader thinks that the price of the underlying asset will go up moderately in the near term.
Bull call spreads can be implemented by buying an at-the-money call option while simultaneously writing a higher striking out-of-the-money call option of the same underlying security and the same expiration month.Payoff Table:-
Spot Price OF TCS 2100 Buy 1 CALL OF 2000 @
150 (ITM) Sell 1 CALL OF 2200 @ 70
(OTM)
STRIKE PRICE + CE 2000 -CE 2200 PREMIUM TOTAL PROFIT

S<2000 ---- ---- -80 -80
S=2000 0 0 -80 -80
2000<S<2200 S-2000 ---- -80 S-2080
S=2200 200 0 -80 120
S>2200 S-2000 -S-2200 -80 120
Limited Profit(120)
2000 2080 2150 2200 2270
Limited Loss (80)
Spot at 2000 and below 2000 will give a limited loss of 80 and spot at 2200 and beyond 220 there would be limited profit of 120. Breakeven point is at 2080.
Bull Put Spread
The bull put spread option trading strategy is employed when the options trader thinks that the price of the underlying asset will go up moderately in the near term.
Bull put spreads can be implemented by selling a higher striking in-the-money put option and buying a lower striking out-of-the-

money put option on the same underlying stock with the same expiration date.
If the stock price closes above the higher strike price on expiration date, both options expire worthless and the bull put spread option strategy earns the maximum profit which is equal to the credit taken in when entering the position.
If the stock price drops below the lower strike price on expiration date, then the bull put spread strategy incurs a maximum loss equal to the difference between the strike prices of the two puts minus the net credit received when putting on the trade.
Payoff Table:-

Spot Price = TCS 2100 Buy 1 PUT 2000 @ 80 Sell 1 PUT 2200 @ 150
STRIKE PRICE
+ PE 2000 -PE 2200 PREMIUM TOTAL PROFIT
S<2000 2000-S -(2200-S) 70 -130
S=2000 0 -(2200-2000) 70 -130
2000<S<2200 -(2200-S) 70 S-2130
S=2200 0 70 70
S>2200 70 70
PROFIT
0

1920 2000 2050 2200
80 2130
LOSS
Strap
The strap is a modified, more bullish version of the common straddle. It involves buying a number of at-the-money puts and twice the number of calls of the same underlying stock, striking price and expiration date.
Straps are unlimited profit, limited risk options trading strategies that are used when the options trader thinks that the underlying stock price

will experience significant volatility in the near term.
Large profit is attainable with the strap strategy when the underlying stock price makes a strong move either upwards or downwards at expiration, with greater gains to be made with an upward move.
Maximum loss for the strap occurs when the underlying stock price on expiration date is trading at the strike price of the call and put options purchased.
Payoff Table:-TCS
STRIKE PRICE 2000 Buy 2 CALL @ premium 50 BUY 1 PUT @ premium 40

STRIKE PRICE
+2 CE +PE PREMIUM TOTAL PROFIT
S<2000 ---- 2000-S -140 1860-S
S=2000 0 0 -140 -140
S>2000 2(S-2000) ---- -140 S-2070
PROFIT PROFIT
0 1860 1960 2000 2050 2070
LOSS

-140
Strip
The strip is a modified, more bearish version of the common straddle. It involves buying a number of at-the-money calls and twice the number of puts of the sameunderlying stock, striking price and expiration date.
Strips are unlimited profit, limited risk options trading strategies. Large profit is attainable with the strip strategy when the underlying stock price makes a strong move either upwards or downwards at

expiration, with greater gains to be made with a downward move.
Maximum loss for the strip occurs when the underlying stock price on expiration date is trading at the strike price of the call and put options purchased. At this price, all the options expire worthless and the options trader loses the entire initial debit taken to enter the trade.
Payoff Table:-
TATA STEEL Strike price 600 Buy 2 PE @ 40 premium Buy 1 CALL @ 60 premium
STRIKE PRICE
+ 1CE +2PE PREMIUM TOTAL PROFIT
S<600 ---- 2(600-S) -140 530-S

S=600 0 0 -140 -140
S>600 S-600 ---- -140 S-740
Breakeven Points are 530 Lower side and 740 upper side. At 600. Loss of 140.
Profit Profit
0 530 560 600 660 740
LOSS
Spot at 500, profit will be 60 {2(600-500)-140}
Spot at 800 profit will be 60 {(800-600)-140}
BUTTERFLY
CONDITION :Premium (X1+X3 >= 2X2)
Long Butterfly
Long butterfly spreads are entered when the investor thinks that the underlying stock will not rise or fall much by expiration.
Using calls, the long butterfly can be constructed by buying one lower striking in-the-money call,
two at-the-money calls and buying one higher striking out-of-the-money call.
Maximum profit for the long butterfly spread is attained when the underlying stock price remains unchanged at expiration. At this price, only the lower striking call expires in the money.
Maximum loss for the long butterfly spread is limited to the initial debit taken to enter the trade plus commissions.
Payoff Table:-
X1 X2 X3
ITM ATM OTM
1800 2000 2200
1 CE Buy 2 CE Sell 1 CE Buy
200(Premium) 150(Premium) 120(Premium)
CONDITION +1CE 1800
-2CE 2000 +1CE 2200
PREMIUM PROFIT/LOSS
S<1800 - - - -20 -20
S=1800 0 - - -20 -20
1800<S<2000
S-1800 0 - -20 S-1820
S=2000 200 0 - -20 180
2000<S<2200
S-1800 -2(S-2000) - -20 -S+2180
S=2200 400 -400 0 -20 -20
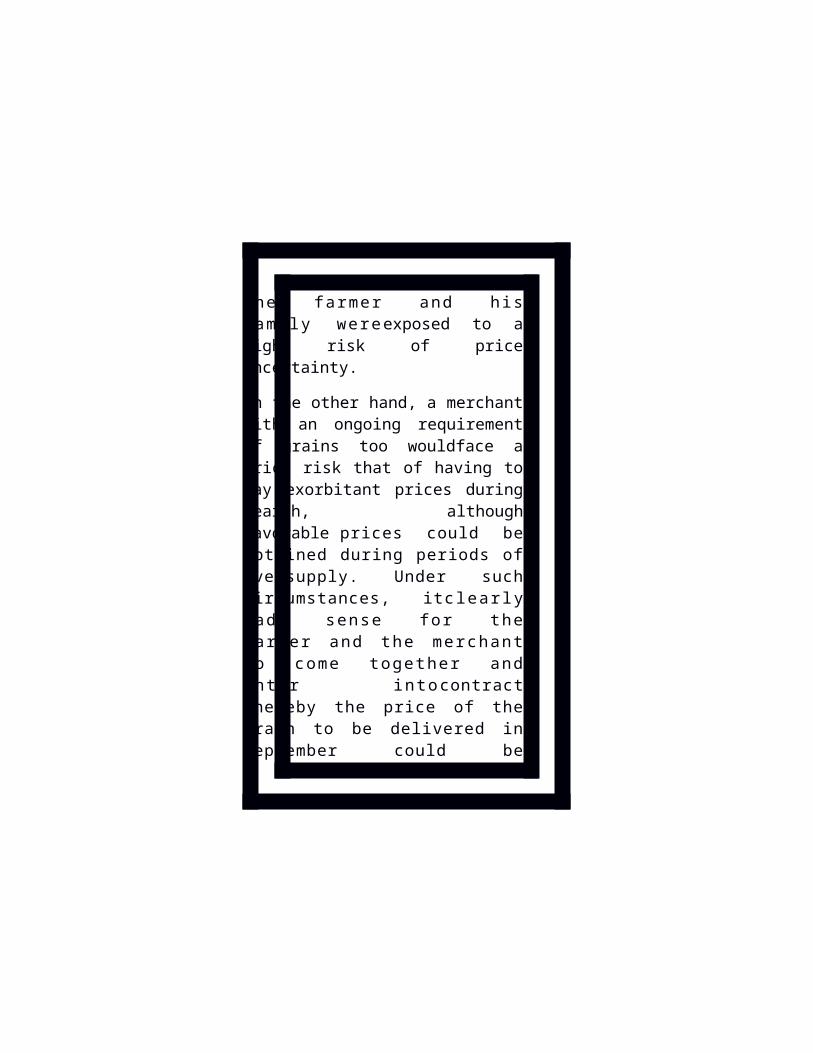
S>2200 S-1800 -2(S-2000) S-2200 -20 -20
180
PROFIT
-20 1820 2000 2180
-150
-200
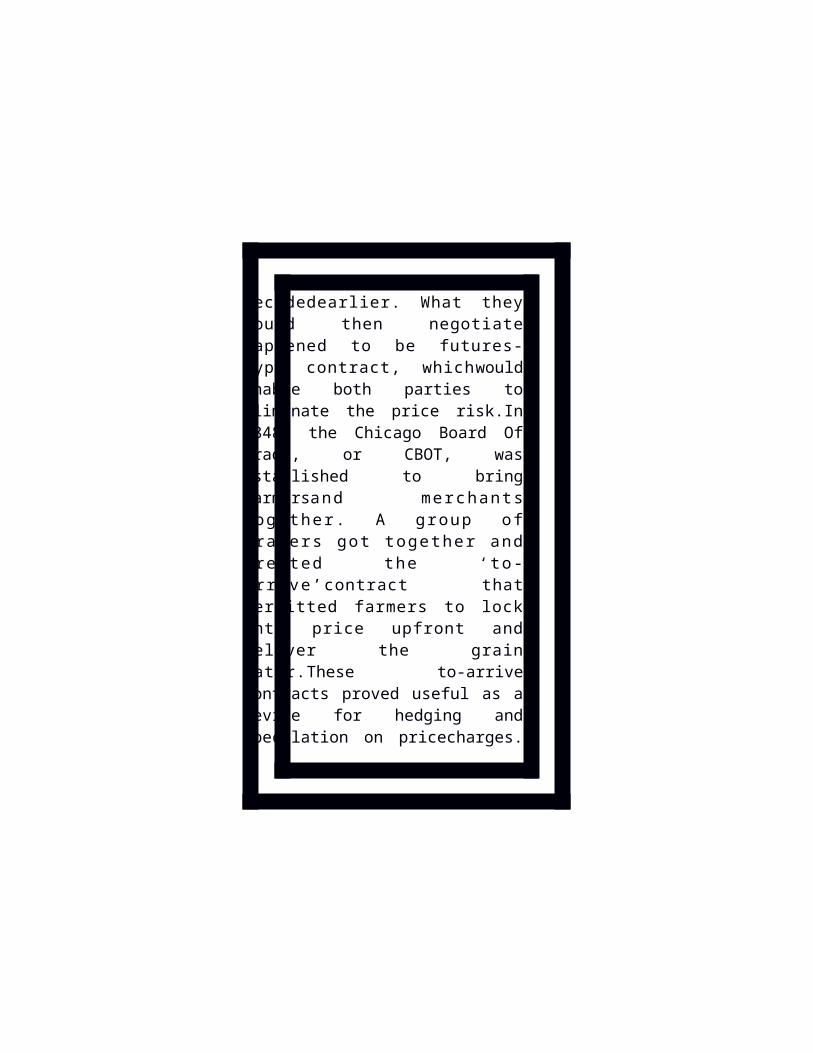
Breakeven Points are 1820 and 2180, Below 1820 and above 2180 there would be a limited loss of 20. At 2000, Profit will be 180. When Spot is at 1950, profit would be 130.
Short Butterfly
The short butterfly is a neutral strategy and bullish on volatility. Using calls, the short butterfly can be constructed by selling one lower strike price in-the-money call, buying two at-the-money calls and selling one higher strike price out-of-the-money call, giving the trader a net credit to enter the position.
Maximum profit for the short butterfly is obtained when the underlying stock
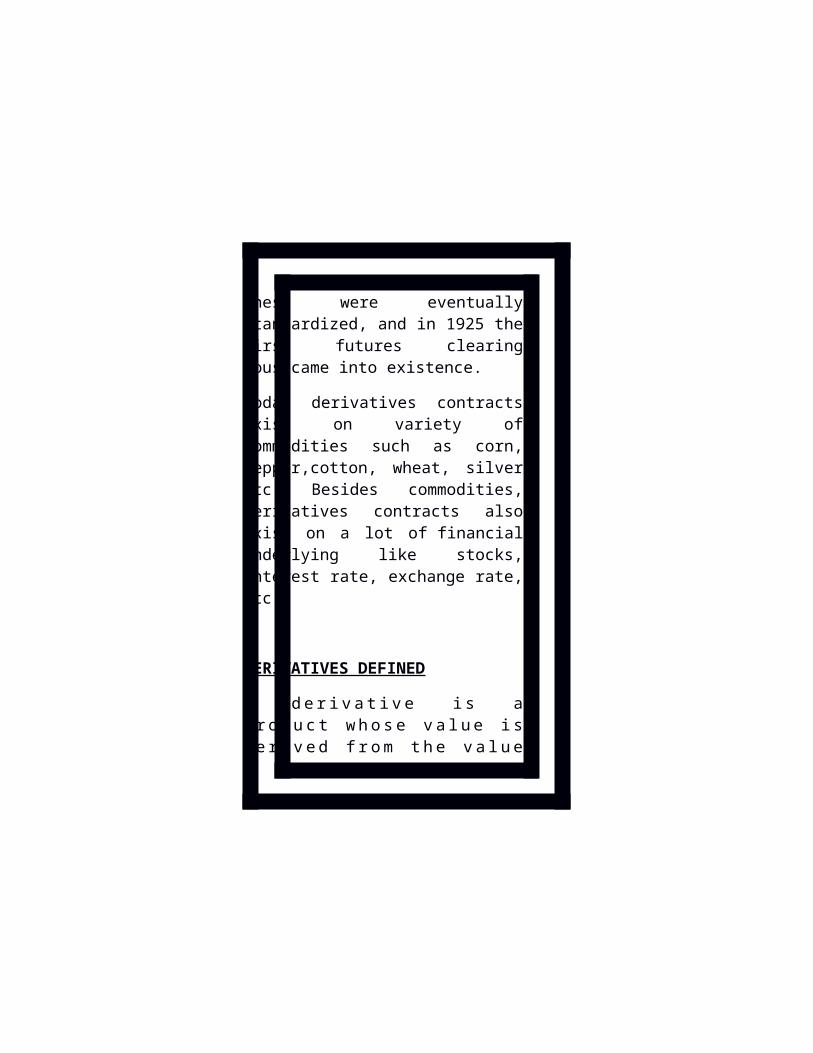
price rally pass the higher strike price or drops below the lower strike price at expiration.
If the stock ends up at the lower striking price, all the options expire worthless and the short butterfly trader keeps the initial credit taken when entering the position.
However, if the stock price at expiry is equal to the higher strike price, the higher striking call expires worthless while the "profits" of the two long calls owned is canceled out by the "loss" incurred from shorting the lower striking call. Hence, the maximum profit is still only the initial credit taken.
Maximum loss for the short butterfly is incurred when the stock price of the underlying stock remains
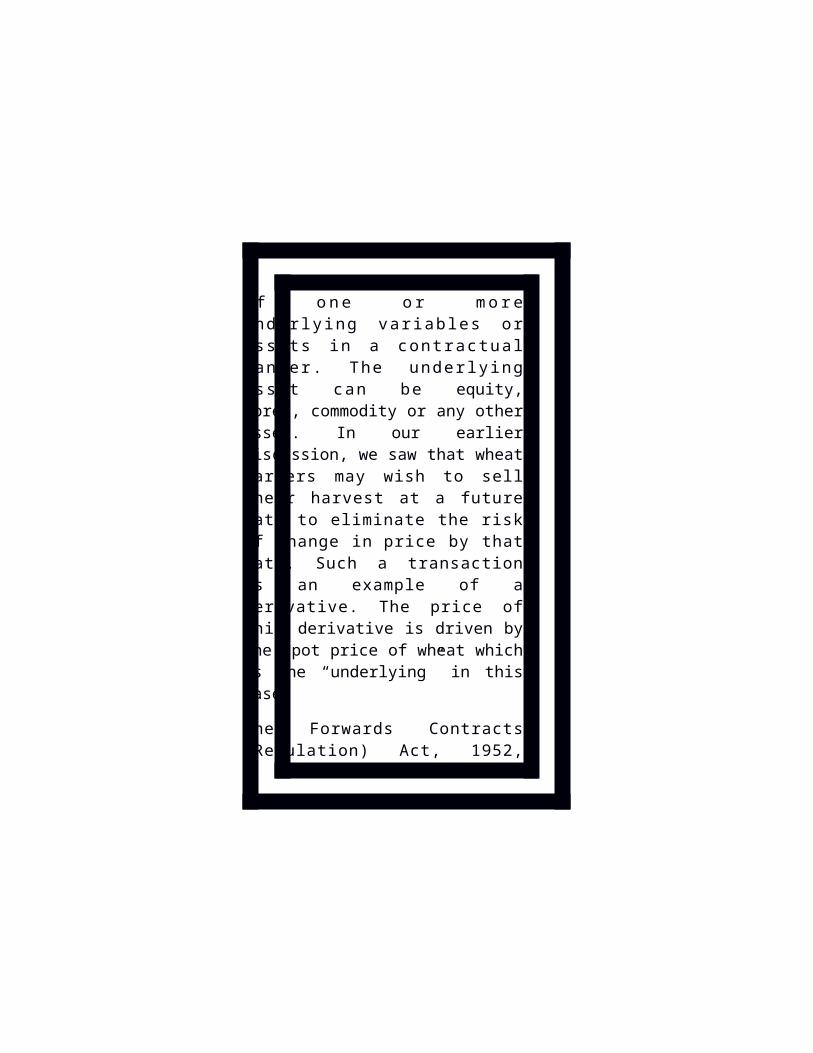
unchanged at expiration. At this price, only the lower striking call which was shorted expires in-the-money. The trader will have to buy back the call at its intrinsic value.
Example- Mahindra & Mahindra
Payoff Table:-
X1 X2 X3
ITM ATM OTM
2200 2500 2800
1 CE Sell 2 CE Buy 1 CE Sell
250(Premium) 150(Premium) 100(Premium)
CONDITION -1CE 2200 2CE 2500 -1CE 2800 PREMIUM PROFIT/LOSS
S<2000 - - - 50 50
S=2000 0 - - 50 50
2200<S<2500
-(S-2200) 0 - 50 -S+2250
S=2500 -300 0 - 50 -250
2500<S<2800
-(S-2200) 2(S-2500) - 50 S-2750
S=2800 -600 600 0 50 50
S>2800 -(S-2200) 2(S-2500) -(S-2800) 50 50
PROFIT 2250 2750 PROFIT
0 2200 2500 2800
LOSS
OPTION GREEKS
DELTA
Delta is the amount an option price is expected to move based on a Rupee 1 change in the underlying stock. As a general rule, in-the-money options will

move more than out-of-the-money options, and short-term options will react more than longer-term options to the same price change in the stock.As an option gets further in-the-money, the probability it will be in-the-money at expiration increases as well. So the option’s delta will increase. As an option gets further out-of-the-money, the probability it will be in-the-money at expiration decreases. So the option’s delta will decrease.
GAMMA
Gamma is the rate that delta will change based on a 1 rupee change in the stock price. So if delta is the “speed” at which option prices change, you can think of gamma
as the “acceleration.” Options with the highest gamma are the most responsive to changes in the price of the underlying stock.If you’re an option buyer, high gamma is good as long as your forecast is correct and if you’re an option seller and your forecast is incorrect, high gamma is the enemy.
THETA
Theta is the amount the price of calls and puts will decrease (at least in theory) for a one-day change in the time to expiration
VEGA.

Vega is the amount call and put prices will change, in theory, for a corresponding one-point change in implied volatility. Vega does not have any effect on the intrinsic value of options; it only affects the “time value” of an option’s price. Typically, as implied volatility increases, the value of options will increase. That’s because an increase in implied volatility suggests an increased range of potential movement for the stock.
RHO
The amount an option value will change in theory based on a one percentage-point change in interest rates.

PRODUCTS UNDER PORTFOLIO CREATION
STOCK
DEBT
REAL ESTATE
GOLD
STOCK
Equity, Mutual Funds, Portfolio Management, GOLD ETF, ULIP

DEBT FUND
Treasury Bills
Bonds
NCDs
Fixed Deposits
GOLD
Invest in commodities, gold is the best instrument to invest for long term.
REAL ESTATE

PORTFOLIO MANAGEMENT
The art and science of making
decisions about investment mix and
policy, matching investments to
objectives, asset allocation for
individuals and institutions, and
balancing risk against performance.
Portfolio management is all about
strengths, weaknesses,
opportunities and threats in the
choice of debt vs. equity, domestic
vs. international, growth vs. safety,
and many other tradeoffs
encountered in the attempt to

maximize return at a given appetite
for risk.
PORTFOLIO MANAGEMENT SERVICE
Portfolio Management Service is a tailor made professional service offered to cater the investments objective of different investor classes. The Investment solutions provided by PMS cater to a niche segment of clients. The clients can be Individuals or Institutions entities with high net worth. In simple words, a portfolio management service provides professional management of your investments to create wealth.

Customer Interaction During PMS
Why are we there for.
Since we are professionals in PMS, therefore it would be a risk if client creates his portfolio.
Ask his source of income
Goals
Liability
Expenses
PORTFOLIO CREATION
After interacting with the client about his goals , liability and expenses, our job is to make them aware all the future risks they can potentially face in future. Moreover, after analyzing their future requirements and liablitilies,

portfolio must be created. Portfolio must cover all the risk of a person in present as well as for future.
If a client’s age is 35, it is better to invest 100-35 i.e 65% in equity out of total money (delivery-for long term), 10% in debt instruments especially in government bonds on infrastructure, for meeting family requirements it is better to invest 10% in buying a land or house because real estate value always appreciates and 5% in gold. Rest should be saved for day to day expenses. For more better futures it is advisable to invest small proportion of savings in Public Providend Fund which is for 15 years and gives handsome returns.
RISK AND MANAGEMENT SERVICE

Average
Exist
Hold
Better your portfolio (new portfolio creation)
Before investing and creating portfolio, it is very important to know the risk ability of a client.
TRANSMISSION AND TRANSPOSITION OF SHARE CERTIFICATE.
Physical Certificate
Earlier when there were no such demat accounts, shares were in the form of certificate. So for any rectification and errors or for change in it takes a lot of time.
Transmission of shares mean
transfer of shares to the beneficiary of a deceased person who is holding certificates in his/her name. If the deceased person has a nominee or second holder, the shares will directly transfer to their names after they follow the process. If there is no beneficiary, then the court will put a notice for 6 months period and if any person claims it with proper documents showing relative to the deceased person then it will be transferred to them. If None, then amount will be transferred to government’s education fund.
Documents Required for Transmission of Shares
Letter to the transfer agent(company)
Notary Death Certificate
Original share certificate
Succession certificate
Transfer Deed – Physical Transfer of shares, Green in colour, valid for one year and charges @ .25% of marker capital.
For transfer of shares in demat form, one needs a DELIVERY INSTRUCTION SLIP
Transposition
Arrangement of shares in logical form. Suppose there are three accounts ABC, CAB and BCA, these three can be made into one single account in demat form as ABC.
TERMINAL GOTX of KARVY STOCK BROKING LIMITED
Main Headings in terminal are as follows
Script Price ChangeExchange % ChangeLTP (last trade price) Opening PriceBuy Price High PriceBuy Quantity Low PriceSelling Price VolumeSelling quantity 52 Week HighLTQ (last traded quan-tity) 52 Week Low
Main Shortcut keys for trading
F1 Buy OrderF2 Sell OrderF3 Order BookF4 Add ScripF5 SaveF6 Market DepthF7 Trade PositionF8 Trade Book (exe-

cuted)F9 Market StatisticsF11 CalculatorESC Cancel
LEARNINGS FROM KARVY STOCK BROKING LTD
Trading in Equity market and Derivatives market

should be done carefully.
Intraday Trading in Equity market can help the trader to gain maximum profit but it is very risky as the trader has to be continuously updated about the current price of that stock in the market .i.e. the trader has to be very active if he wants to trade in Intraday. By investing a small amount of money, a person can gain a satisfying amount of profit if he knows all the tactics of the Intraday Trading.
Intraday Trading attracts majority of customers as the brokerage charged in this is very less as compared to Delivery Trading. And also as the Profit that can be gained is more as compared
to the initial investment.
Delivery Trading on the other hand is very useful for profit making mostly in the long run.
The most important thing required to trade in Delivery is ‘Patience’. The Investor need to be very patient while dealing in this type of trading as he has no time limitation and he can recover his loss or gain profit in the long run.
If the price of a particular stock fluctuates to a very great extent in a day, SEBI puts circuit on that particular stock to stop its trading in the market for some time. This is the main
advantage of trading in Equity market, where the profits as well as the losses are restricted or limited.
Derivatives market can make a person rich in a day and also can affect him a lot with the losses incurred due to it. There is no circuit system in Derivatives market.
Option Premium Decreases with time due to time decency.
So the value of the stock can become from Rs.1,00,000 to Rs.100. This shows that the profit as well as the loss is unlimited in Derivative market.
If the movements of stocks

are studied thoroughly, investing in stock market is actually a very profitable as well risky investment.
But as a safety measure, only the people having sufficient savings i.e. people who are willing to take more risk, should invest in this market according to me.
Trading in Derivatives market is a very risky as well as profitable thing to do, but the earning profit in this market requires a lot of study and experience and hence people with low risk appetite should strictly avoid trading in this market.
Work Culture- Don’t over commit and dependency on others.

Customer Interaction is essential in any field of work.
Understanding Customer’s Need and requirements before making decision.
First Learn and then earn in stock market.


SUGGESTIONS
Return on Investment is must but the risk also should be minimizing at the same time.
No one loves to lose his hard earned money therefore it should be invested in safer place.
Services are must for them and therefore the company must also concentrate on this aspect.
Good advisory services, secrecy of the data given to the company as well as every people must treated as
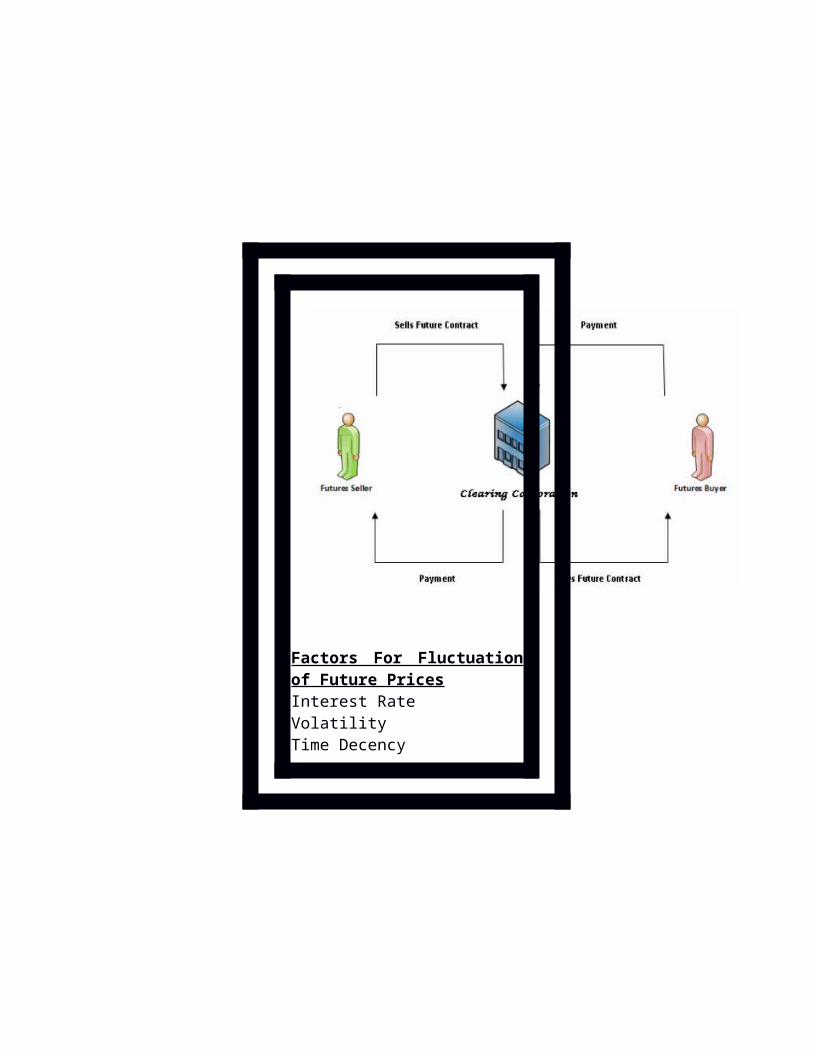
they all are equal i.e. no biasness.
Charges of the services provided to them should be reasonable and viable.
CONCLUSIONS
Karvy has enough number of branches all over India and therefore it is agreat advantage for the company and the company also planning toexpand its network.
Karvy also provides the facility of trading in almost all the exchangesand therefore whatever the customer demands the company has in itspackage.
The company also has a very good research team at its Head Office and this is meant for the better working as well as for the customer of Karvyonly.
The company also has the advantage of the existing customers where their level of faith and their view about the company to the outside world will be a helping hand for the company to expand its business.

BIBLIOGRAPHY
Books
Derivatives and Risk Management by Rajiv Shrivastav

Websites
www.calloptionputoption.com
www.nseindia.com
www.slideshare.net
www.investopedia.com
www.optionsguide.com
Newspapers & Journals
Economic Times