Challenges in the Frozen Foods Industry - Shehla Riza Arifeen

LSHTM Research Online
Saha, KK; Frongillo, EA; Alam, DS; Arifeen, SE; Persson, LA; Rasmussen, KM; (2008) Householdfood security is associated with infant feeding practices in rural Bangladesh. The Journal of nutrition,138 (7). pp. 1383-90. ISSN 0022-3166 http://researchonline.lshtm.ac.uk/id/eprint/3601365
Downloaded from: http://researchonline.lshtm.ac.uk/3601365/
DOI:
Usage Guidlines:
Please refer to usage guidelines at http://researchonline.lshtm.ac.uk/policies.html or alternativelycontact [email protected].
Available under license: Copyright the publishers
https://researchonline.lshtm.ac.uk

Household Food Security Is Associated with Infant FeedingPractices in Rural Bangladesh,1,2
Kuntal K. Saha3,*, Edward A. Frongillo4, Dewan S. Alam3, Shams E. Arifeen3, Lars ÅkePersson5, and Kathleen M. Rasmussen6
3 ICDDR,B, Dhaka 1000, Bangladesh
4 Department of Health Promotion, Education, and Behavior, University of South Carolina, Columbia, SC29208
5 Department of Women’s and Children’s Health, Uppsala University, SE-751 85 Uppsala, Sweden
6 Division of Nutritional Sciences, Cornell University, Ithaca, NY 14853
AbstractAlthough household food security (HHFS) has been shown to affect diet, nutrition, and health ofadults and also learning in children, no study has examined associations with infant feeding practices(IFP). We studied 1343 infants born between May 2002 and December 2003 in the Maternal andInfant Nutrition Intervention in Matlab study to investigate the effect of HHFS on IFP in ruralBangladesh. We measured HHFS using a previously developed 11-item scale. Cumulative andcurrent infant feeding scales were created from monthly infant feeding data for the age groups of 1–3, 1–6, 1–9, and 1–12 mo based on comparison to infant feeding recommendations. We used lagged,dynamic, and difference longitudinal regression models adjusting for various infant and maternalvariables to examine the association between HHFS and changes in IFP, and Cox proportionalhazards models to examine the influence of HHFS on the duration of breast-feeding and the time ofintroduction of complementary foods. Better HHFS status was associated with poor IFP during 3–6mo but was associated with better IFP during 6–9 and 9–12 mo of age. Although better HHFS wasnot associated with the time of introduction of complementary foods, it was associated with the typeof complementary foods given to the infants. Intervention programs to support proper IFP shouldtarget mothers in food-secure households when their babies are 3–6 mo old and also mothers in food-insecure households during the 2nd half of infancy. Our results provide strong evidence that HHFSinfluences IFP in rural Bangladesh.
IntroductionHousehold food insecurity (HHFI)7 causes hunger and malnutrition in most countries in theworld (1). The nutrition and health consequences of HHFI have been documented among adultsand children even in rich countries such as the US (2–6), Canada (7,8), and Australia (9). HHFIwas negatively associated with dietary intake (2–4,7), health, and nutritional status (4–6,8,9)of adults in those countries and in developing countries such as Trinidad (10), Tanzania (11),and South Africa (12).
1Supported by the Fogarty-National Institutes of Health Training grant (5 D 43 TW 001271) to K.M.R.2Author disclosures: K. K. Saha, E. A. Frongillo, D. S. Alam, S. E. Arifeen, L. Å. Persson, and K. M. Rasmussen, no conflicts of interest.* To whom correspondence should be addressed. E-mail: [email protected] used: ABF, any breast-feeding; EBF, exclusive breast-feeding; HHFI, household food insecurity; HHFS, household foodsecurity; MINIMat, Maternal and Infant Nutrition Intervention in Matlab; SES, socioeconomic status.
NIH Public AccessAuthor ManuscriptJ Nutr. Author manuscript; available in PMC 2009 July 1.
Published in final edited form as:J Nutr. 2008 July ; 138(7): 1383–1390.
NIH
-PA Author Manuscript
NIH
-PA Author Manuscript
NIH
-PA Author Manuscript

HHFI also influences health and nutritional status of children. In the US, children in food-insecure households had more frequent cough, stomachaches, headaches, iron deficiency(13), compromised psychological functioning (6), higher rate of hospitalization (14), and lowerBMI (15) than their food-secure counterparts. The reported effects of HHFI on dietary intakeof children in the US have been mixed. For example, children in low-income, food-insecurehouseholds had significant decreases in energy intake and meat consumption (15) andconsumed fewer carbohydrates and fruits and less total energy (16) than children in food-securehouseholds. In contrast, HHFI had no significant influence on food intake of preschool children(3,15), although it was associated with decreased household food supplies (15) and decreasedmean food intake for rest of the household members (3). In Korea, HHFI was strongly andnegatively associated with dietary intake and anthropometric status of children (17).
In Bangladesh, approximately one-half of the population is food insecure (18). Hunger andchildhood malnutrition in Bangladesh are among the highest in the world (19). Approximately31% of the rural population in Bangladesh suffers from “chronic poverty,” which ischaracterized by low consumption, lack of access to basic health services, and undernutrition(20). About 19% of rural households cannot have “3 full meals” a day and ~10% survive on 2meals or less for a number of months every year.
The profound influence of household food security (HHFS) on dietary intake and health andnutritional status of adults and children is supported by a substantial body of research. Theassociation between HHFS and infant feeding practices (IFP), however, has rarely beenstudied, either in developed or developing countries. Proper IFP are essential for growth anddevelopment during infancy, childhood, and beyond. Therefore, it is important to examinewhether household food availability makes any significant change in IFP. In this study, weinvestigated the association between HHFS and IFP in rural Bangladesh using longitudinaldata and appropriate statistical techniques for longitudinal data analysis. We proposed thathouseholds that were food secure would differ significantly in IFP from households that werenot. Specifically, we proposed that mothers in food-insecure households would introducecomplementary feeding later than mothers in food-secure households.
Subjects and MethodsData
We used data from the Maternal and Infant Nutrition Intervention in Matlab (MINIMat) study,a large intervention trial in which infants were followed from birth until 12 mo of age andbeyond. We selected all infants who were born between May 2002 and December 2003 andhad completed their 12-mo follow-up in December 2004 (n = 1343). MINIMat was carried outin Matlab, a rural subdistrict in Bangladesh.
The mothers of these infants were followed during pregnancy when data on HHFS andsocioeconomic status (SES) were collected. Feeding history and morbidity of infants werecollected every month during the first 12 mo of life. Data on early feeding practices werecollected at 7–10 d postpartum. The mothers of these infants had been randomly assigned toreceive a food supplement starting at ~17 wk of gestation and also received health educationmessages either with or without random assignment to intensive breast-feeding counselingduring pregnancy and after delivery. In addition, mothers of these infants were randomlyassigned to receive a daily pill that contained 1 of 3 different combinations of micronutrientsstarting at ~14 wk of gestation.
Saha et al. Page 2
J Nutr. Author manuscript; available in PMC 2009 July 1.
NIH
-PA Author Manuscript
NIH
-PA Author Manuscript
NIH
-PA Author Manuscript

Data collection and quality control of dataAll data were collected at women’s homes by trained interviewers and paramedics. Structuredquestionnaires with precoded and open-ended questions were used for data collection. Allquestionnaires were pre-tested and revised accordingly. The questionnaires were first preparedin English and then translated into Bangla. All birth weights were measured by electronic orbeam scales, which were precise to 10 g (UNICEF Uniscale, SECA). Maternal weights weremeasured by electronic scales (Uniscale), which were precise to 100 g. All measuring scaleswere standardized daily.
Written consent was obtained from women about participation in the study. The study wasapproved by the Research Review Committee and Ethical Review Committee of ICDDR,Band the University Committee on Human Subjects at Cornell University.
MeasurementsHousehold food security—We created a HHFS scale from an 11-item foodsecuritymeasure (21). The items covered frequency of food purchased (rice and perishablefood, e.g. vegetables, fish, and meat), frequency of cooking, borrowing or lending (food andmoney), and whether there was ready access to adequate meals and snacks. This informationwas collected during the household visits at 8 and 30 wk of pregnancy.
We assigned scores to each item according to the classification of households and theirexperiences as previously described (21). Higher scores were assigned to those experiencesthat indicated better food security status. For example, for frequency of purchasing rice, a scoreof 1 was assigned to those who purchased rice 4–5 times a week, which indicated that thehousehold had a little or no store of rice and had to buy rice almost every day to meet theirneed. A score of 5 was assigned to those who had not purchased rice in the last 30 d, whichindicated the household had an adequate store of rice and did not need to buy rice for a longtime.
We computed food security scales at 8 and 30 wk by adding all scores that were allocated todifferent items, weighting for the number of categories of responses. The mean food securityscale at 30 wk was greater by 0.96 than the mean food security scale at 8 wk. Therefore, wefurther computed the food security scale at 30 wk with an offset by subtracting this value fromthe food security scale at 30 wk. This was done to minimize any systematic effect that mightincrease mean food security from 8 to 30 wk. We used the mean of food security scales at 8and 30 wk as the food security measure.
The mean of food security scales at 8 and 30 wk was 38.6 ± 3.6 (Table 1). A higher scoreindicated better HHFS. The reliability (e.g. Cronbach’s α) of the sum of the food security scalesat 8 and 30 wk was 0.78. We used this scale both as a continuous variable and categoricalvariable. For categorical variable, households were divided into quartiles: quartile 1 (extremelyfood insecure), 2 (moderately food insecure), 3 (occasionally food insecure), and 4 (foodsecure).
Infant feeding—We created infant feeding scales using data collected monthly until 12 moof age. Mothers were asked to recall the general feeding pattern in last month, i.e. whether thebaby was still breast-fed, feeding of plain water, water containing sugar/glucose/jaggery(unrefined brown sugar made from the sap of the date palm or sugar), fruit juice, cow milk,and semisolid (mostly soft rice, occasionally with lentils and oil) and solid foods. We usedfeeding data that were collected at 7–10 d postpartum to create the early feeding scale. Thesedata included the first food given to the baby, timing of breast-feeding initiation, anything given
Saha et al. Page 3
J Nutr. Author manuscript; available in PMC 2009 July 1.
NIH
-PA Author Manuscript
NIH
-PA Author Manuscript
NIH
-PA Author Manuscript

to the baby before giving breast milk, colostrum rejection, number of times the baby was breast-fed during the day and night, and use of bottle with a nipple to feed the baby.
The response for most items was “yes” or “no.” We scored each item depending on whetheror not a practice was good based on the current infant feeding recommendations of the WHO/UNICEF (22,23). For example, a practice that was appropriate for a specific age group receiveda score of 1 and a practice that was potentially detrimental to infant health received a 0. Practicesthat were considered particularly beneficial for a given age received a score of 2. For example,breast-feeding received a score of 2 for infants from 0–12 mo. A score of 0 was given to non-breast-fed infants. We assigned 0 to semisolid food if given before 6 mo but assigned 2 if givenat and after 6 mo of age.
We created cumulative infant feeding scales, which were specific for different age groups, e.g.3, 6, 9, and 12 mo, because the nature of the practices required for different age groups aredifferent. We created the feeding scale for early as well as current feeding practices. The earlyfeeding scale included the practices that were followed immediately and during the first fewdays after birth (data collected at 7–10 d postpartum). For the current feeding scale, weconsidered the practices that were followed subsequently and information that was collectedevery month. First, we created an early feeding scale and a feeding scale for each month from1–12 mo. We then computed cumulative feeding scales for different age groups by adding allthe monthly feeding scales of those particular age groups with the feeding scales of thepreceding months. For example, we computed a cumulative feeding scale at 3 mo by addingindividual feeding scales from 1–3 mo (feeding scale at 3 mo = feeding scale at mo 1 + … +feeding scale at mo 3). We followed the same strategy to create cumulative feeding scales at6, 9, and 12 mo. We excluded the early feeding scale from computations of feeding scales at3, 6, 9, and 12 mo for 2 reasons. First, the number of missing values for the variables on earlyfeeding practices was very high (~40%). Second, the distribution of the early feeding scalelacked variability; > 90% of the subjects had the highest 2 scores of the scale.
We examined whether the infants who were missing data for early feeding practices differedfrom those who were not missing these data. We compared these 2 groups for their birth weight,HHFS, and other key baseline SES variables. For the continuous variables, we used a t test forequality of means and, for the categorical variables, we used Pearson chi-square tests.
We standardized the feeding scales by converting the original scores into percentages of themaximum total scores of the theoretical scales (descriptive statistics of the standardized feedingscales are presented in Table 1). A higher score in the feeding scales indicated better IFP. Thefeeding scales were used as continuous variables in the analyses. The reliability (Cronbach’sα) of these feeding scales was 0.6–0.8.
Morbidity—We created morbidity scales based on the presence or absence of the illnesses inthe last 7 d, signs and symptoms of the illnesses and their severity, and healthcare seeking. Thevariables included in the morbidity scales were fever, cough/difficult breathing, diarrhea, anyother illness, and treatment received in last 1 mo. Absence of any of these illnesses received ascore of 1 and presence of this received 2. We used available information that was collectedalong with diarrhea (blood in stool, associated vomiting, etc.) and cough (difficult breathingand rapid breathing/chest indrawing) to indicate severity of the illnesses. We also includedinformation on whether or not any healthcare was sought for the infant in the last month thatreflects the severity of illness.
We created monthly morbidity scales of 1–12 mo by adding the scores assigned on 12 itemsof the morbidity scale. We used the mean of the morbidity scales of preceding periods for themorbidity scale of that particular age. For example, we used the mean of morbidity scales at
Saha et al. Page 4
J Nutr. Author manuscript; available in PMC 2009 July 1.
NIH
-PA Author Manuscript
NIH
-PA Author Manuscript
NIH
-PA Author Manuscript

1, 2, and 3 mo for the morbidity scale at 3 mo. We followed the same strategy for computingmorbidity scales at 6, 9, and 12 mo (descriptive statistics of the morbidity scales are presentedin Table 1). A higher score in the morbidity scale indicated a worse state of illness of the infant.The reliability of each morbidity scale was high (Cronbach’s α was 0.7).
SES—We used wealth index as a measure of SES that was created by the MINIMat teamusing information on household assets. Variables included were land (homestead, land undercultivation, fallow land, pond/ditch, and family land), construction materials of the walls ofthe house, ownership of household assets (clock/watch, chair/table, cupboard, bicycle, radio,television, electric fan, cows, goats, and chicken/ducks), “sarees” (a traditional garment wornby women in Bangladesh or from the Indian subcontinent), or “shalwar-kameez” (a pair ofloose-fitting pleated trousers tapering to the ankle, worn by women, usually under a long tunicowned for ceremonial use), and pair of shoes or sandals owned.
Total land was computed by adding homestead land, land under cultivation, and fallow land.Total land was categorized into groups of 0, > 0–5, > 5–25, > 25–90, and > 90 decimals[approximately equal to 1/100 acre (0.00004 km2)]. The categories for pond/ditch and familyland were either “yes” or “no.” The categories for construction materials of the walls of thehouse were brick/cement, tin, bamboo, and other. For household assets, categories for eachitem were “owned” or “not owned” by the household. Total number of clothes was obtainedby adding sarees and shalwar-kameez, which were categorized into 0–3, 4–9, 10–17, and >18.The categories for shoes or sandals were 0, 1, 2, and >2.
Principal component analysis was used to create the wealth index. A weight was attached toeach item from the first principal component. The households were classified into SES quintilesbased on the wealth index: quintile 1 (poor), 2 (lower middle), 3 (middle), 4 (upper middle),and 5 (rich).
Statistical models—Changes in IFP over time were assessed by using lagged, dynamic, anddifference models for longitudinal data analysis (24–26). The lagged model was used to assesswhether lagged independent variables (Mt) and lagged outcome (IFPt) related to subsequentchange of outcomes:
where IFPt = IFP at time t, Δ IFP = IFPt+3 – IFPt, Mt = morbidity of infant at time t, t = 3, 6,9 mo, β0 and β1 = regression coefficients, and ε = error term.
The dynamic model was used to assess whether the change in outcome related to laggedindependent variables (Mt) and lagged outcome (IFPt) as well as changes of the independentvariables in 2 time points (ΔM):
The difference model was used to assess whether changes in independent variables in 2 pointsin time (Δ M) related to subsequent change of outcomes:
Each of these models has advantages and disadvantages. The lagged model establishes thedirection of effect and distinguishes it from reverse causality by using lagged independentvariables to examine the effects of earlier status of independent variables (24). This modelcannot control the unobserved heterogeneity that may affect the outcomes and that are alsocorrelated with independent variables. Therefore, the estimated effect of independent variableson the outcomes may be biased. The dynamic model includes the changes in independentvariables but cannot deal with the problem of unobserved heterogeneity that may affect the
Saha et al. Page 5
J Nutr. Author manuscript; available in PMC 2009 July 1.
NIH
-PA Author Manuscript
NIH
-PA Author Manuscript
NIH
-PA Author Manuscript

outcomes and that are correlated with independent variables. The difference model eliminatesthe effects of unobserved heterogeneity by using differences within the same person (25). Thismodel cannot account for the problem of reverse causality and does not capture the possibledependence of the change in the outcome on the baseline status of outcome.
Statistical analysis—All statistical analyses were conducted with SPSS 14.0 for Windows.Our outcome variables were the changes in IFP (ΔIFP) from 3–6, 6–9, and 9–12 mo of age.The independent variables were HHFS, sex, birth weight, and morbidity of infants, andmaternal age, weight, education, and wealth index. We used general linear models to test theassociation between HHFS and ΔIFP from 3–6, 6–9, and 9–12 mo of age. These models werealso used to test whether the magnitude and significance of the association between HHFS andΔIFP remained after adjusting for other infant (sex, birth weight, and morbidity) and maternal(age, weight, and education) variables and wealth index.
We used Cox proportional hazards regression models to predict the duration of breast-feedingand the time of introducing complementary feeding at different ages of infants. We used theKaplan-Meier method and the log-rank test to assess whether the duration of breast-feeding orthe time of introduction of complementary feeding differed among the 4 quartiles of HHFS.We used Pearson chi-square tests to examine whether the proportions of infants in 4 groups ofhouseholds, who were given different types of food at different ages, were statistically differentfrom one another. An α of 0.05 was considered significant.
ResultsApproximately 570 of 1343 infants were missing data on early feeding practices. Infants whowere missing data on early feeding practices did not differ from infants who were not missingthese data for some baseline variables, such as birth weight; HHFS status; maternal age, weight,and education; father’s education; and other key SES variables, including wealth index (datanot shown).
Infant feeding patternsColostrum and prelacteal feeding—Approximately 92% of mothers gave colostrum totheir babies and only 8% of them gave some food or drink to their babies before giving breastmilk. For the prelacteal foods, 3.2% of mothers gave honey, 1.3% gave mustard oil, 2.8% gavesugar/glucose/jaggery water, and ~1% gave either plain water or other milk.
Breast-feeding: types and duration—Almost all infants in this sample (99.4%) werebreast-fed at 1 mo and 92% of them continued up to 12 mo. The proportion of infants whowere exclusively breast-fed decreased from 78.3% at 1 mo to 10.7% at 6 mo. At 4 mo, 56%of infants were exclusively breast-fed. The median duration of exclusive breast-feeding (EBF)was ~121 d and did not differ among the 4 HHFS groups. The median duration of any breast-feeding (ABF) was 365 d in y 1 of life in all 4 groups of households. The mean duration ofABF, however, differed (P < 0.05) among the 4 groups of households. In the Cox regressionmodel, HHFS was not significantly associated with the duration of EBF or ABF (data notshown).
Introduction of complementary foodsThe median age at introduction of complementary foods was 124, 122, 121, and 119 d forextremely food-insecure, moderately food-insecure, occasional food-insecure, and food-securehouseholds, respectively.
Saha et al. Page 6
J Nutr. Author manuscript; available in PMC 2009 July 1.
NIH
-PA Author Manuscript
NIH
-PA Author Manuscript
NIH
-PA Author Manuscript

Plain water, fruit juice, and other liquids—Overall, 3.7% of infants were given plainwater at 1 mo. Proportions of infants given plain water were 15.9% until 4 mo of age. At 6 mo,about three-fourths (76.0%) of infants were given plain water that increased to 97.2% at 9 mo.The proportions of infants who were given plain water during infancy did not differsignificantly among the infants in 4 groups of HHFS status.
The infants who were given fruit juice were between 6.7% at 1 mo and 22.9% at 5 mo. At 6mo, 37% of infants were given fruit juice and 48.5% received it at mo 9. Higher proportionsof infants in the more food-secure (food-secure and occasional food-insecure) households weregiven fruit juice than their counterparts in the more food-insecure (extremely food-insecureand moderately food-insecure) households (Fig. 1A). The proportions of infants who weregiven fruit juice did not differ significantly among the 4 groups of households during the first3 mo of age. At 4 mo and thereafter until 12 mo of age, the proportions of infants who weregiven fruit juice were higher (P < 0.05) among the more food-secure households than amongthe food-insecure households.
The feeding of other liquids (such as sugar/glucose/jaggery water) was low and increased withage of infants (Fig. 1B). Overall, a maximum of 12% of infants was given other liquids at 12mo of age. The proportions of infants who were given other liquids were higher (P < 0.05)among the food-secure households than those among the food-insecure households at 3 mo,from 5 to 9 mo, and at 11 mo.
Cow milk—The median age of introducing complementary foods in this sample was 4 mo.Overall, 8.7 and 13.3% of infants were given cow milk at 1 and 2 mo, respectively. At 3 mo,approximately one-fifth (19.7%) of infants were given cow milk; at 6 mo, 41.0% received cowmilk. At 10 mo, a maximum of 48.1% of infants was given cow milk.
Higher proportions of infants in more food-secure households were given cow milk throughouttheir first year of life than their counterparts in the food-insecure households (Fig. 1C). Theproportions of infants who were given cow milk differed (P < 0.05) among the 4 groups ofhouseholds when the infants were 3–12 mo of age.
Semisolid and solid foods—Only 2.2% of infants were given semisolid foods at 1 mo.The proportions of infants who were given semisolid foods increased as the infants got older:5.3% at 2 mo, 10.1% at 3 mo, 18.1% at 4 mo, and 30% at 5 mo. At 6 mo, about half (49.6%)of the infants were given semisolid foods that reached to 66.4% at 9 mo. The proportions ofinfants who were given semisolid foods differed (P < 0.05) among the 4 groups of householdsat 6 mo and thereafter until 12 mo of age (Fig. 1D). Higher proportions of infants in more food-secure households were given semisolid foods than their counterparts in food-insecurehouseholds during the 2nd half of infancy.
Only 4 infants (0.4%) were given solid foods during first 2 mo of age. The proportions ofinfants who were given solid foods were 1.4% at 3 mo, 4% at 4 mo, and 13.2% at 5 mo. At 6mo, 43.9% of infants were given solid foods; this figure increased to 94.1% at 10 mo of age.At the end of the first year of life, ~92% of the infants were being given solid food in additionto breast milk. The proportion of infants who were given solid foods was higher (P < 0.05)among the food-secure households than the proportions among the food-insecure householdsat 3, 6, and 7 mo (data not shown).
Lagged model effect of HHFS on IFP—HHFS was associated (P < 0.001) with worsefeeding practices of infants during 3–6 mo of life (Table 2). In contrast, HHFS was associated(P < 0.001) with better IFP during 6–9 and 9–12 mo. These associations between HHFS andchange in IFP at their various ages sustained when the models were adjusted for other infant
Saha et al. Page 7
J Nutr. Author manuscript; available in PMC 2009 July 1.
NIH
-PA Author Manuscript
NIH
-PA Author Manuscript
NIH
-PA Author Manuscript

variables, such as sex, lagged morbidity, lagged IFP, and birth weight. Moreover, we observedsimilar associations between HHFS and change in IFP when we adjusted the models for otherinfant variables as well as maternal variables, such as age, weight, education, and wealth index.The dynamic and difference models provided similar results of the associations between HHFSand IFP (Table 3).
Among the other infant, maternal, and household factors, better prior feeding practices, infant’smale sex, mother’s higher education, and higher wealth index were associated (P < 0.005) withchange in IFP from 3–6 mo, 6–9 mo, and 9–12 mo in all 3 models (Table 3).
DiscussionTo our knowledge, this study is one of the first in which the relationship between HHFS andIFP in a low-income country has been investigated. Despite the strong association betweenHHFS and dietary intake and nutritional status of children and adults in several countries, theassociation between HHFS and IFP has not been studied either in developed or developingcountries to our knowledge. We used longitudinal data on IFP and appropriate statisticaltechniques for longitudinal data analysis to investigate the effects of HHFS on IFP in a low-income country. Our results provide strong evidence of the association between HHFS and IFPin rural Bangladesh.
Association between HHFS and IFPOur aim in this study was to investigate the effects of HHFS on IFP in the first 12 mo of life.Greater HHFS was associated with better IFP during 6–12 mo but poorer IFP during 3–6 mo.These periods are important nutrition transitions in an infant’s life, because infants continueto grow rapidly and improper feeding practices during infancy can cause poor health, growth,and development. HHFS, thus, is essential for better feeding practices, particularly during the2nd half of infancy. However, our finding of a negative association between HHFS and IFPduring the first half of infancy should be treated with caution.
The negative association between HHFS and IFP at 3–6 mo can be explained in the followingway. First, contrary to the recommendations, more infants in food-secure households weregiven cow milk, fruit juice, and other liquids in early months than the infants in food-insecurehouseholds. Therefore, the infants in food-secure households had lower scores in the feedingscales than the infants in food-insecure households. Second, the infants in food-insecurehouseholds had a higher rate of morbidity than the infants in food-secure households. Morbidityduring infancy was associated (P < 0.05) with the duration of EBF. As a result, the feedingscores of infants in food-insecure households were higher than those of infants in food-securehouseholds during the first half of infancy.
The duration of EBF in this cohort did not differ from the results of earlier studies in Bangladesh(27,28). In this study, HHFS was not associated with the duration of EBF and ABF, but themean duration of ABF during the first year of life differed (P < 0.05) among the 4 groups ofhouseholds. One of the caveats of this study was that we measured the duration of ABF (median365 d) only during the first year of life. Therefore, this was an underestimate of the actualduration of ABF. As a result, it was not possible to determine whether the duration of ABF inthe first 2 y of life differed among the children in 4 categories of HHFS.
In this study, more infants were given cow milk than the infants in an earlier study inBangladesh (27). Cow milk (or any nonhuman animal milk) is not recommended during thefirst year of life for 3 main reasons: cow milk is low in iron, it can cause occult blood loss fromthe gastrointestinal tract, and it has a high renal solute load (29). In Bangladesh, however,giving cow milk to infants beginning in early months is a widespread practice, particularly in
Saha et al. Page 8
J Nutr. Author manuscript; available in PMC 2009 July 1.
NIH
-PA Author Manuscript
NIH
-PA Author Manuscript
NIH
-PA Author Manuscript

the 2nd half of infancy. In the MINIMat cohort, infants in more food-secure households weregiven cow milk earlier and in higher proportions than the infants in food-insecure households.This practice has been reported by others (30) as more common among the better-off families.Providing cow milk in the early months of life may be significant if the beneficial effects ofcow milk (a good source of protein, calcium, and other nutrients) outweigh its adverse effects.This trade-off is equally applicable to the early introduction of fruit juice and other liquids andsemisolid foods if these foods cause higher morbidity from contamination with pathogens(30,31). In the future, it will be important to examine the growth and morbidity of the infantsin the first 2 y of life who were given cow milk, fruit juice, and other liquids and semisolidfoods in early months of infancy.
In this study, fewer infants were fed semisolid foods in their first 3 mo and more infants weregiven semisolid foods when they were 4–6 mo old than in a previous study in Bangladesh(27). Giving more semisolid foods to infants when they were 6 mo of age and older wasobserved particularly among the food-secure households. Thus, HHFS seems to play a key rolefor better feeding practices of infants as far as semisolid food is concerned.
Mothers of these infants received micronutrient supplements and health education messageseither with or without randomly assigned intensive breast-feeding counseling during pregnancyand after delivery. Therefore, we adjusted our models with these interventions. The effect ofHHFS on IFP, however, remained significant in the adjusted models.
Measurement scalesThe food security scale that we used in this study was developed from a qualitative study thatprovided an in-depth understanding of the experience of food security in rural Bangladesh(21). Locally developed food security measures based on the experience of household memberson their practices have been demonstrated to be valid (32,33). In Burkina Faso, an experience-based measure of HHFS was valid within and across seasons (34). The 9 themes of the foodsecurity scale of the present study were similar to those suggested from another study conductedin Bangladesh (35) in which there was a high degree of agreement between the items of foodsecurity measure identified by qualitative and quantitative methods. This agreement betweenmethods lends validity in their assessment of HHFS and technical quality and similarity ofitems across the population in Bangladesh. In the food security scales developed from bothstudies in Bangladesh (21,35), all items were related to 1 of 4 domains: uncertainty and worry,inadequate quantity, insufficient quality, and social unacceptability, which are the basis ofHHFS measures in most countries of the world (36).
One limitation of this study was that HHFS was measured only when the mothers of theseinfants were pregnant. We assumed that HHFS in this population was relatively static and thatHHFS measured during pregnancy was a valid proxy of HHFS during the postpartum period.February to March and October to November are the 2 lean seasons, the latter being thepreharvest period with low employment opportunities in agriculture (37). However, ouranalysis of HHFS during the 2 y of the study demonstrated that there was no seasonal pattern(data not shown). This finding is consistent with informal knowledge that HHFS in the studyarea does not differ during the calendar year. It is also consistent with the lack of seasonalpatterns in other indicators of well-being in this population. Furthermore, although we do nothave a measure of food security postpartum, our understanding of food security in the studyarea is that it is not likely to change substantially within households over a period as short asa year.
We employed a novel approach to construct cumulative infant feeding scales using longitudinaldata on IFP to capture the monthly feeding dynamics during infancy and to obtain a bettermeasure of IFP than the conventional infant feeding scales developed from cross-sectional data
Saha et al. Page 9
J Nutr. Author manuscript; available in PMC 2009 July 1.
NIH
-PA Author Manuscript
NIH
-PA Author Manuscript
NIH
-PA Author Manuscript

(38,39). Our infant feeding scales were based on the observed IFP and relative to the currentinfant feeding recommendations. These infant feeding scales were not measures of actual foodconsumption but rather were measures of maternal behaviors relative to the recommendedbehaviors. Therefore, our results suggest the importance of HHFS for following recommendedIFP, particularly during the 2nd half of infancy. This is a significant test of translation of theinfant feeding policy into maternal practices regarding infant feeding and the importance ofHHFS in this translation of policy into practice.
Statistical approachThe statistical models for longitudinal data analysis that we used in this study were usedpreviously to examine the effects of HHFS on academic performance, social skills, and weightgain of school children (25). These models were also used to examine the impact of obesityon wages in which more consistent estimates were generated than previous studies on the sametopic (26). In this study, similar results from all 3 types of adjusted models indicated robustnessof the association between HHFS and IFP.
HHFS is a determinant of IFP even in a place where breast-feeding is practiced universallyand for a long duration. Mothers living in food-secure households did not meet the currentfeeding recommendations when their babies were 3–6 mo old. In contrast, mothers living infood-insecure households did not meet these recommendations when their babies were 6–12mo old. Therefore, efforts should be made by all mothers in food-secure and food-insecurehouseholds to support recommended IFP in this population.
Acknowledgements
We thank Dr. Purnima Menon at the Division of Nutritional Sciences, Cornell University for her thoughtful commentson the formulation of the infant feeding scales.
Literature Cited1. FAO. The state of food insecurity in the world 2005. Rome: FAO, United Nations; 2005.2. Kendall A, Olson CM, Frongillo EA. Relationship of hunger and food insecurity to food availability
and consumption. J Am Diet Assoc 1996;96:1019–24. [PubMed: 8841164]3. Rose D. Economic determinants and dietary consequences of food insecurity in the United States. J
Nutr 1999;129:S517–20.4. Lee JS, Frongillo EA. Nutritional and health consequences are associated with food insecurity among
U.S. elderly persons. J Nutr 2001;131:1503–9. [PubMed: 11340107]5. Stuff JE, Casey PH, Szeto KL, Gossett JM, Robbins JM, Simpson PM, Connell C, Bogle ML.
Household food insecurity is associated with adult health status. J Nutr 2004;134:2330–5. [PubMed:15333724]
6. Olson C. Nutrition and health outcomes associated with food insecurity and hunger. J Nutr1999;129:S521–4.
7. Tarasuk VS, Beaton GH. Women’s dietary intakes in the context of household food insecurity. J Nutr1999;129:672–9. [PubMed: 10082773]
8. Vozoris NT, Tarasuk VS. Household food insufficiency is associated with poorer health. J Nutr2003;133:120–6. [PubMed: 12514278]
9. Quine S, Morrell S. Food insecurity in community-dwelling older Australians. Public Health Nutr2006;9:219–24. [PubMed: 16571176]
10. Gulliford MC, Mahabir D, Rocke B. Food security, food choice, and body mass index in adults:nutrition transition in Trinidad and Tobago. Int J Epidemiol 2003;32:508–16. [PubMed: 12913020]
11. Hadley C, Patil C. Food insecurity in rural Tanzania is associated with maternal anxiety anddepression. Am J Hum Biol 2006;18:359–68. [PubMed: 16634017]
Saha et al. Page 10
J Nutr. Author manuscript; available in PMC 2009 July 1.
NIH
-PA Author Manuscript
NIH
-PA Author Manuscript
NIH
-PA Author Manuscript

12. Oldewage-Theron WH, Dicks EG, Napier CE. Poverty, household food insecurity and nutrition:coping strategies in an informal settlement in the Vaal Triangle, South Africa. Public Health2006;120:795–804. [PubMed: 16824562]
13. Alaimo K, Olson CM, Frongillo EA. Food insufficiency, family income, and health in US preschooland school-aged children. Am J Public Health 2001;91:781–6. [PubMed: 11344887]
14. Cook JT, Frank DA, Berkowitz C, Black MM, Casey PH, Cutts DB, Meyers AF, Zaidivar N, SkalickyA, et al. Food insecurity is associated with adverse health outcomes among human infants andtoddlers. J Nutr 2004;134:1432–8. [PubMed: 15173408]
15. Matheson DM, Varady J, Varady A, Killen JD. Household food insecurity and nutritional status ofHispanic children in the fifth grade. Am J Clin Nutr 2002;76:210–7. [PubMed: 12081837]
16. Casey PH, Szeto K, Lensing S, Bogle M, Weber J. Children in food-insufficient, low-income families:prevalence, health, and nutrition status. Arch Pediatr Adolesc Med 2001;155:508–14. [PubMed:11296080]
17. Oh S-Y, Hong MJ. Food insecurity is associated with dietary intake and body size of Korean childrenfrom low-income families in urban areas. Eur J Clin Nutr 2003;57:1598–604. [PubMed: 14647225]
18. United States Agency for International Development. Current conditions: food security. Dhaka(Bangladesh): United States Agency for International Development; [cited 2006 April]. Availablefrom: http://www.usaid.gov/bd/food_sec.html
19. UNICEF. The state of the world’s children 2006: excluded and invisible. New York: UNICEF; 2006.20. Sen, B.; Hulme, D. Chronic poverty in Bangladesh: tales of ascent, descent, marginality and
persistence. Dhaka (Bangladesh): Bangladesh Institute of Development Studies; Manchester (UK):Chronic Poverty Research Centre (CPRC), Institute for Development Policy and Management,University of Manchester; 2004.
21. Frongillo EA, Chowdhury N, Ekström EC, Naved RT. Understanding the experience of householdfood insecurity in rural Bangladesh leads to a measure different from that used in other countries. JNutr 2003;133:4158–62. [PubMed: 14652365]
22. WHO. Global strategy for infant and young child feeding. Geneva: WHO; 2003.23. Pan American Health Organization. Guiding principles for complementary feeding of the breastfed
child. Washington (DC): Pan American Health Organization, WHO. Division of Health Promotionand Protection, Food and Nutrition Program; 2001.
24. Frongillo, EA.; Rowe, EM. Challenges and solutions in using and analyzing longitudinal growth data.In: Johnston, FE.; Eveleth, P.; Zemel, B., editors. Human growth in context. London: Smith-Gordon;1999. p. 51-64.
25. Jyoti DF, Frongillo EA, Jones SJ. Food insecurity affects school children’s academic performance,weight gain, and social skills. J Nutr 2005;135:2831–9. [PubMed: 16317128]
26. Cawley J. The impact of obesity on wages. J Hum Resour 2004;39:451–75.27. Khan M. Infant feeding practices in rural Meheran, Comilla, Bangladesh. Am J Clin Nutr
1980;33:2356–64. [PubMed: 7435416]28. Giashuddin MS, Kabir M, Hannan MA. Exclusive breastfeeding and nutritional status in Bangladesh.
Indian J Pediatr 2003;70:471–5. [PubMed: 12921314]29. Dewey KG, Cohen RJ, Rollins NC. Feeding of nonbreastfed children from 6 to 24 months of age in
developing countries. Food Nutr Bull 2004;25:377–401. [PubMed: 15646315]30. Clemens JD, Sack DA, Harris JR, Khan MR, Chakraborty J, Chowdhury S, Rao MR, van Loon FP,
Stanton BF, et al. Breast feeding and the risk of severe cholera in rural Bangladeshi children. Am JEpidemiol 1990;131:400–11. [PubMed: 2301350]
31. Ahmed F, Clemens JD, Rao MR, Khan MR, Haque E. Initiation of food supplements and stoppingof breast-feeding as determinants of weanling shigellosis. Bull World Health Organ 1993;71:571–8.[PubMed: 8261560]
32. Frongillo EA, Rauschenbach BS, Olson CM, Kendall A, Colmenares AG. Questionnaire-basedmeasures are valid for the identification of rural households with hunger and food insecurity. J Nutr1997;127:699–705. [PubMed: 9164989]
33. Coates, J. Experience and expression of food insecurity across cultures: practical implications forvalid measurement. Washington, DC: Food and Nutrition Technical Assistance Project, Academyfor Educational Development; 2004.
Saha et al. Page 11
J Nutr. Author manuscript; available in PMC 2009 July 1.
NIH
-PA Author Manuscript
NIH
-PA Author Manuscript
NIH
-PA Author Manuscript

34. Frongillo EA, Nanama S. Development and validation of an experience-based measure of householdfood insecurity within and across seasons in Northern Burkina Faso. J Nutr 2006;136:S1409–19.
35. Coates J, Wilde PE, Webb P, Rogers BL, Houser RF. Comparison of a qualitative and quantitativeapproach to developing a household food insecurity scale for Bangladesh. J Nutr 2006;136:S1420–30.
36. Coates, J.; Swindale, A.; Bilinsky, P. Household food insecurity access scale (HFIAS) formeasurement of food access: indicator guide (v. 3). Washington, DC: Food and Nutrition TechnicalAssistance Project, Academy for Educational Development; 2007.
37. Tetens I, Hels O, Khan NI, Thilsted SH, Hassan N. Rice-based diets in rural Bangladesh: how dodifferent age and sex groups adapt to seasonal changes in energy intake. Am J Clin Nutr 2003;78:406–13. [PubMed: 12936922]
38. Ruel MT, Menon P. Child feeding practices are associated with child nutritional status in LatinAmerica: innovative uses of the demographic and health surveys. J Nutr 2002;132:1180–7. [PubMed:12042431]
39. Sawadogo PS, Martin-Prevel Y, Savy M, Kameli Y, Traissac P, Traore AS, Delpeuch F. An infantand child feeding index is associated with the nutritional status of 6- to 23-month-old children inrural Burkina Faso. J Nutr 2006;136:656–63. [PubMed: 16484539]
Saha et al. Page 12
J Nutr. Author manuscript; available in PMC 2009 July 1.
NIH
-PA Author Manuscript
NIH
-PA Author Manuscript
NIH
-PA Author Manuscript

FIGURE 1.Proportions of infants, n = 1242, who were given fruit juice (A), other liquids (jaggery/sugar/glucose water) (B), cow milk (C), or semisolid foods (D) at various ages by HHFS status.
Saha et al. Page 13
J Nutr. Author manuscript; available in PMC 2009 July 1.
NIH
-PA Author Manuscript
NIH
-PA Author Manuscript
NIH
-PA Author Manuscript

NIH
-PA Author Manuscript
NIH
-PA Author Manuscript
NIH
-PA Author Manuscript
Saha et al. Page 14
TABLE 1Descriptive statistics of HHFS, morbidity, and feeding practices of infants at different ages
n Theoretical rangeof scales
Mean ± SD (min.–max.)
Standardized1 mean ± SD(min–max.)
Food security scale 1201 10–44 38.7 ± 3.5 (22.5–46.9) —Feeding scale at 3 mo 1327 0–27 24.1 ± 2.3 (12–27) 89.4 ± 8.4 (44.4–100.0)Feeding scale at 6 mo 1322 0–54 44.3 ± 5.4 (20–54) 82.1 ± 10.0 (37.0–100.0)Feeding scale at 9 mo 1308 0–84 62.8 ± 5.8 (36–78) 74.8 ± 6.9 (42.9–92.9)Feeding scale at 12 mo 1242 0–114 83.9 ± 7.8 (50–105) 73.6 ± 6.9 (43.9–92.1)Morbidity scale at 3 mo 1326 12–24 14.0 ± 1.3 (12.0–21.0) —Morbidity scale at 6 mo 1340 12–24 14.2 ± 1.1 (12.0–19.0) —Morbidity scale at 9 mo 1341 12–24 14.2 ± 1.0 (12.0–17.9) —Morbidity scale at 12 mo 1341 12–24 14.1 ± 1.0 (12.0–18.5) —
1Only infant feeding scales were standardized and expressed as a percentage of the value of the upper range of theoretical scales.
J Nutr. Author manuscript; available in PMC 2009 July 1.

NIH
-PA Author Manuscript
NIH
-PA Author Manuscript
NIH
-PA Author Manuscript
Saha et al. Page 15
TABLE 2Lagged model effects of HHFS and other infant, maternal, and household factors on the changes in IFP from 3–6, 6–9, and 9–12 mo of age
Outcomes Effect of HHFS Effect of HHFS after controllingfor other infant variables1
Effect of HHFS after controllingfor other infant and maternal
variables1,2
β (P-value) β (P-value) β (P-value)Δ IFP 3–6 mo − 0.288 (<0.001) n = 1182 − 0.302 (<0.001) n = 1086 − 0.091 (0.141) n = 919Δ IFP 6–9 mo 0.372 (<0.001) n = 1170 0.245 (<0.001) n = 1085 0.146 (<0.001) n = 911Δ IFP 9–12 mo 0.166 (<0.001) n = 1107 0.171 (<0.001) n = 1031 0.067 (0.045) n = 866
1Lagged morbidity, lagged feeding, birth weight, and sex of infants.
2Lagged morbidity, lagged IFP, birth weight, and sex of infants, and maternal age, weight, education, and wealth index.
J Nutr. Author manuscript; available in PMC 2009 July 1.
NIH
-PA Author Manuscript
NIH
-PA Author Manuscript
NIH
-PA Author Manuscript
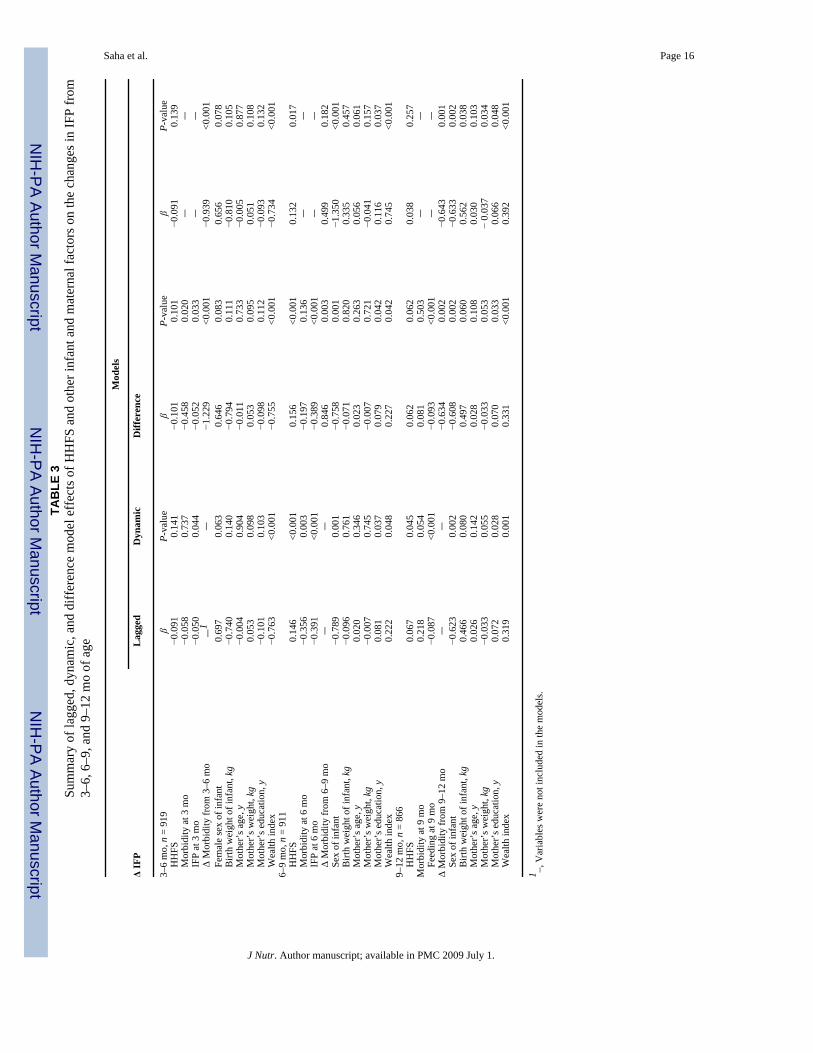
Saha et al. Page 16TA
BLE
3Su
mm
ary
of la
gged
, dyn
amic
, and
diff
eren
ce m
odel
eff
ects
of H
HFS
and
oth
er in
fant
and
mat
erna
l fac
tors
on
the
chan
ges i
n IF
P fr
om3–
6, 6
–9, a
nd 9
–12
mo
of a
ge
Mod
els
Δ IF
PL
agge
dD
ynam
icD
iffer
ence
3–6
mo,
n =
919
βP-
valu
eβ
P-va
lue
βP-
valu
e
HH
FS−0
.091
0.14
1−0
.101
0.10
1−0
.091
0.13
9
Mor
bidi
ty a
t 3 m
o−0
.058
0.73
7−0
.458
0.02
0–
–
IFP
at 3
mo
−0.0
500.
044
−0.0
520.
033
––
Δ
Mor
bidi
ty fr
om 3
–6 m
o–
1–
−1.2
29<0
.001
−0.9
39<0
.001
Fe
mal
e se
x of
infa
nt0.
697
0.06
30.
646
0.08
30.
656
0.07
8
Birt
h w
eigh
t of i
nfan
t, kg
−0.7
400.
140
−0.7
940.
111
−0.8
100.
105
M
othe
r’s a
ge, y
−0.0
040.
904
−0.0
110.
733
−0.0
050.
877
M
othe
r’s w
eigh
t, kg
0.05
30.
098
0.05
30.
095
0.05
10.
108
M
othe
r’s e
duca
tion,
y−0
.101
0.10
3−0
.098
0.11
2−0
.093
0.13
2
Wea
lth in
dex
−0.7
63<0
.001
−0.7
55<0
.001
−0.7
34<0
.001
6–9
mo,
n =
911
H
HFS
0.14
6<0
.001
0.15
6<0
.001
0.13
20.
017
M
orbi
dity
at 6
mo
−0.3
560.
003
−0.1
970.
136
––
IF
P at
6 m
o−0
.391
<0.0
01−0
.389
<0.0
01–
– Δ
Mor
bidi
ty fr
om 6
–9 m
o–
–0.
846
0.00
30.
499
0.18
2
Sex
of in
fant
−0.7
890.
001
−0.7
580.
001
−1.3
50<0
.001
B
irth
wei
ght o
f inf
ant,
kg−0
.096
0.76
1−0
.071
0.82
00.
335
0.45
7
Mot
her’
s age
, y0.
020
0.34
60.
023
0.26
30.
056
0.06
1
Mot
her’
s wei
ght,
kg−0
.007
0.74
5−0
.007
0.72
1−0
.041
0.15
7
Mot
her’
s edu
catio
n, y
0.08
10.
037
0.07
90.
042
0.11
60.
037
W
ealth
inde
x0.
222
0.04
80.
227
0.04
20.
745
<0.0
019–
12 m
o, n
= 8
66
HH
FS0.
067
0.04
50.
062
0.06
20.
038
0.25
7M
orbi
dity
at 9
mo
0.21
80.
054
0.08
10.
503
––
Fe
edin
g at
9 m
o−0
.087
<0.0
01−0
.093
<0.0
01–
–Δ
Mor
bidi
ty fr
om 9
–12
mo
––
−0.6
340.
002
−0.6
430.
001
Se
x of
infa
nt−0
.623
0.00
2−0
.608
0.00
2−0
.633
0.00
2
Birt
h w
eigh
t of i
nfan
t, kg
0.46
60.
080
0.49
70.
060
0.56
20.
038
M
othe
r’s a
ge, y
0.02
60.
142
0.02
80.
108
0.03
00.
103
M
othe
r’s w
eigh
t, kg
−0.0
330.
055
−0.0
330.
053
− 0.
037
0.03
4
Mot
her’
s edu
catio
n, y
0.07
20.
028
0.07
00.
033
0.06
60.
048
W
ealth
inde
x0.
319
0.00
10.
331
<0.0
010.
392
<0.0
01
1 –, V
aria
bles
wer
e no
t inc
lude
d in
the
mod
els.
J Nutr. Author manuscript; available in PMC 2009 July 1.


![Aromataseinhibitorsfortreatmentofadvancedbreastcancer ...researchonline.lshtm.ac.uk/4668/1/Gibson_et_al... · [Intervention Review] Aromatase inhibitors for treatment of advanced](https://static.fdocuments.in/doc/165x107/606bd20ad618f10fde1d84e4/aromataseinhibitorsfortreatmentofadvancedbreastcancer-intervention-review.jpg)