SAFM CMYK (+) - ASX · 2013. 10. 28. · SAFM AT A GLANCE South American Ferro Metals Limited (ASX:...
88
FOCUSED Annual Report 2013 For personal use only
Transcript of SAFM CMYK (+) - ASX · 2013. 10. 28. · SAFM AT A GLANCE South American Ferro Metals Limited (ASX:...

FOCUSEDAnnual Report 2013
For
per
sona
l use
onl
y

SAFM AT A GLANCE South American Ferro Metals Limited (ASX: SFZ or “SAFM”) owns 100% of the mineral rights and property of the Ponto Verde Iron Ore Project in Brazil. Ponto Verde is located in the heart of the Iron Ore Quadrilateral, 55 kilometres from the town of Belo Horizonte in the state of Minas Gerais. The Iron Ore Quadrilateral is a prolific iron ore mining area, and the Project is located proximate to established mining operations, iron and steel plants and existing infrastructure.
SAFM currently sells three iron ore products from its Ponto Verde mine
to local steel producers in Brazil. The Company is currently completing its Bankable Feasibility Study (“BFS”) to expand Ponto Verde to a capacity of 8 Mtpa ROM throughput, from its current 1.5 Mtpa licenced capacity by the end of 2015 and then 16 Mtpa by 31 December 2017.
SAFM has a JORC Resource at Ponto Verde of 301.06 million tonnes (Mt) at 40.65% Fe (which includes a Measured Resource of 72.75 Mt at 41.06% Fe, an Indicated Resource of 101.96 Mt at 40.68% Fe and an Inferred Resource of 126.34 Mt at 40.45% Fe).
ANNUAL GENERAL MEETING
The Annual General Meeting (“Meeting”) of South American Ferro Metals Limited will be held
at 10:00am (Sydney time) on 27 November 2013 at Level 27, AMP Centre, 50 Bridge Street,
Sydney, NSW 2000.
South American Ferro Metals Ltd ACN 128 806 977
02 Milestones Achieved
03Chairman’s Report
04Managing
Director’s Report
06 Bankable
Feasibility Study
08Operations Report
10Ponto Verde
Mine Geology
12Health, Safety
& Environment
14 Board of Directors
15 Key Management
16 Corporate Governance
Statement
21 Directors’ Report
40 Financial Statements
85 Corporate Directory
For
per
sona
l use
onl
y

FOCUSED ON EXPANSION
01
Mine expansion feasibility study progressing with design criteria and fl ow chart completed. Plant layout and equipment selection currently being addressed.
Memorandum of Understanding executed with rail corporation, MRS Logistics SA, to develop a rail based logistics solution for port delivery, to allow for export of SAFM’s production.
Update of mineralised resources within the extended pit outline completed.
Feasibility for the power supply completed.
Application for the environmental and installation licences submitted.
Acquisition of waste and tailing properties executed.
Discussions currently being held with port operators for all port services including the provision of warehouses and stockyards.
ntald
y fm
or l
ased
yoeto
Appns
on ex
ecl
ou
Acqpe
sp
vicw
EXPANSION
For
per
sona
l use
onl
y

SAFM ANNUAL REPORT 201302
MILESTONES ACHIEVED
SEPTEMBER 2010Acquisition of 100% of the issued capital of SAFM in a reverse takeover by Riviera Resources Limited. The company was renamed South American Ferro Metals Limited and listed on the ASX in November 2010.
NOVEMBER 2010Commencement of production from Ponto Verde under SAFM ownership.
FEBRUARY 2011Refurbishment of benefi ciation plant and facilities completed and commissioning commenced.
MAY 2011Move to two production shifts per day.
SEPTEMBER 2011Move to three shifts per day, fi ve days a week facilitating an increase in ROM production from Ponto Verde to licenced capacity of 1.5 Mtpa.
DECEMBER 2011JORC Resource estimate of 230.6 Mt at 44.52% Fe announced (including Indicated Resource of 60.6 Mt at 41.61% Fe and an Inferred Resource of 170 Mt at 45.55% Fe).
FEBRUARY 2012Phase II of Resource Defi nition Programme commenced and Bankable Feasibility Study announced to expand Ponto Verde to capacity of 8 Mtpa ROM throughput, by the end of 2015 and 16 Mtpa ROM throughput by end of 2017.
JUNE 2012Successful commissioning of the fi rst stage of the concentrator at Ponto Verde and installation of cone crusher.
NOVEMBER 2012Announcement of updated JORC Resource statement to 262.4 Mt including an increase in the size of the Measured and Indicated components of the Resource from 60.6 Mt at 41.61% Fe to 167.5 Mt of 41.54% Fe.
APRIL 2013Announcement of updated JORC Resource statement which increased the size of the Resource to 301.06 Mt at 40.65% Fe.
Execution of Memorandum of Understanding with rail corporation MRS Logistica SA to develop a rail based logistic solution for the port delivery for export of SAFM’s future production.
On-site laboratory completed.
JUNE 2013Successful commissioning of the Concentrator Two targeting additional concentrate production of between 20,000 and 24,000 tonnes per month at a grade of approximately 65% Fe.
JULY 2013Securing of a US$15 million, two year loan facility with Deutsche Bank providing the Company with the requisite funds to complete the BFS.
OCTOBER 2013Acquisition of waste and tailing properties which is suffi cient in size to hold waste and tailings material for the expanded mine life.F
or p
erso
nal u
se o
nly

FOCUSED ON EXPANSION
03
BUILDING ON A STRONG FOUNDATIONCHAIRMAN’S REPORT In the twelve months covered by this report, South American Ferro Metals has made signifi cant progress towards its expansion to an 8 Mtpa ROM iron ore producer. It has strengthened its experienced management team and its profi table operational performance over the year to establish a robust and technically sound basis for completion of the Bankable Feasibility Study (“BFS”) for its expansion.
During the year, SAFM experienced intermittent operational setbacks due in part to disruption to its water reticulation system. Over the page the Managing Director will discuss the factors affecting business performance in more detail, as well as the outlook for the current year.
Reviewing FY 2013, the Company increased benefi ciated production to 626,134 tonnes (FY 2012: 506,632 tonnes). EBITDA amounted to $3.09 million and the profi t before income tax for the year was $2.5 million.
The BFS for the increase to an 8 Mtpa mining operation with a plant producing just over 5 Mtpa of 66% Fe concentrate is scheduled to be completed by April 2014.
The increase in costs of sales to $20.52 per tonne (FY 2012: $18.12) represented the adverse impact of the water reticulation disruption. Management has rectifi ed this problem and the company is on track to achieve signifi cant cost reductions throughout the current year which is refl ected in record production volumes being achieved in August 2013.
Health and safety performance, as well as high standards of environmental performance, are of pre-eminent importance to the Board. It has been pleasing that key measures of health and safety performance remain well in advance of industry averages. During the year, there was one minor lost-time-injury.
Governance matters, such as compliance, risk and remuneration, consume a part of the attention of Directors. The Board is confi dent that the company’s remuneration policies and practices remain consistent with the attraction and retention of a high calibre workforce, as well as refl ecting the early development stages which our mine and plant are at. The short and long term incentive arrangements remain aligned to the delivery of growth objectives and shareholder interests. The Remuneration section of the Annual Report provides a detailed explanation of FY 2013 remuneration practices and outcomes.
Returns to shareholders, in terms of share price performance are central given the company’s principal focus: to create and deliver value for shareholders. The Company’s share price performance in FY 2013 was disappointing both in absolute and relative terms. I am confi dent that the increasing profi tability of the Company, and the soon to be completed BFS for expansion of its production, will soon be recognised by the investment community.
Mr Stephen Turner and Mr Alan Doyle, founding non-executive directors have moved to executive roles in the company, with Mr Turner taking over as Managing Director with effect from 1 March 2013.
The Board of SAFM was also strengthened since the year end with Mr Rogerio Caporali joining the Board as a non-executive director. Mr Caporali has extensive experience in the management of large mines in Brazil, and has held numerous senior management positions with VALE Group over a period of 25 years.
SAFM’s management team will plan with confi dence the future activities and production targets for Ponto Verde. We expect to further enhance future growth and value with expansion opportunities that are now available due to the company’s solid platform, growth, operational and management performance.
I would like to acknowledge and thank my fellow Directors for their professionalism and contribution during FY 2013. I would like to acknowledge our management team for their efforts during the year, as well as the wider employee workforce for their commitment and efforts.
The Directors acknowledge and appreciate the continuing support of shareholders in what has clearly been a diffi cult year for them.
Yours faithfully
Terence WillsteedChairman
“We expect to further enhance future growth and value with expansion opportunities that
are now available due to the company’s solid platform, growth, operational
and management performance.”
For
per
sona
l use
onl
y
SAFM ANNUAL REPORT 201304
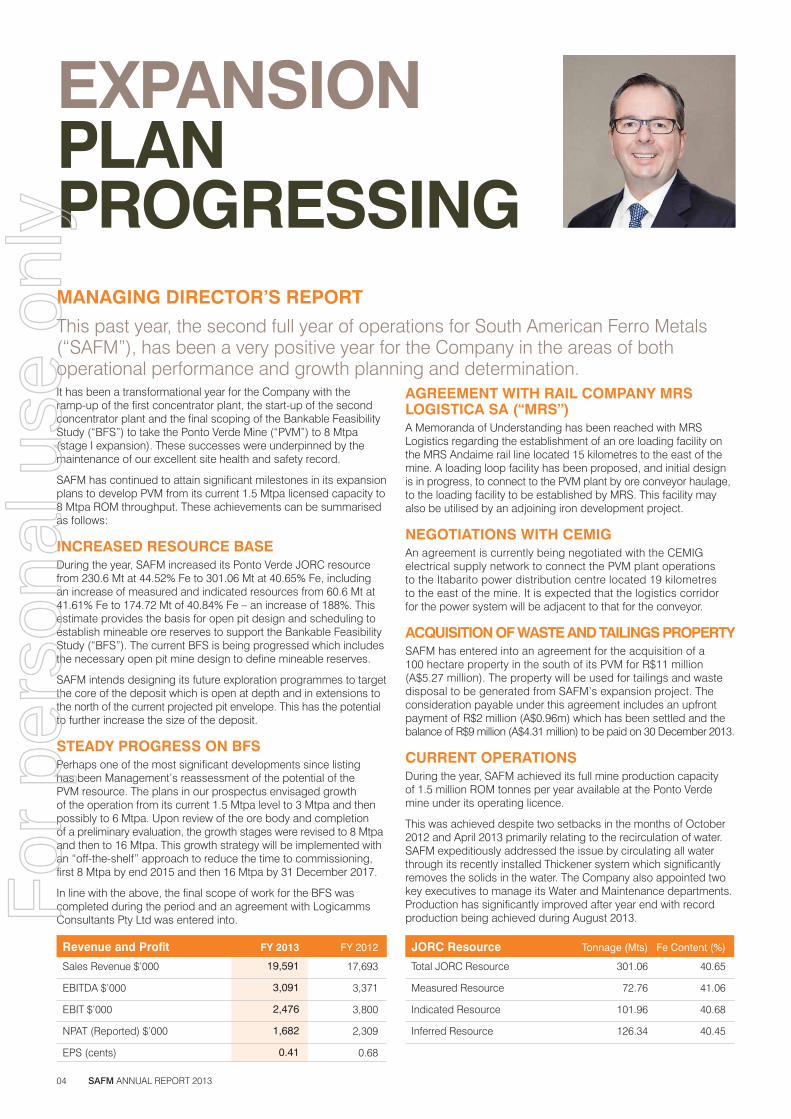
EXPANSION PLAN PROGRESSING
It has been a transformational year for the Company with the ramp-up of the fi rst concentrator plant, the start-up of the second concentrator plant and the fi nal scoping of the Bankable Feasibility Study (“BFS”) to take the Ponto Verde Mine (“PVM”) to 8 Mtpa (stage I expansion). These successes were underpinned by the maintenance of our excellent site health and safety record.
SAFM has continued to attain signifi cant milestones in its expansion plans to develop PVM from its current 1.5 Mtpa licensed capacity to 8 Mtpa ROM throughput. These achievements can be summarised as follows:
INCREASED RESOURCE BASEDuring the year, SAFM increased its Ponto Verde JORC resource from 230.6 Mt at 44.52% Fe to 301.06 Mt at 40.65% Fe, including an increase of measured and indicated resources from 60.6 Mt at 41.61% Fe to 174.72 Mt of 40.84% Fe – an increase of 188%. This estimate provides the basis for open pit design and scheduling to establish mineable ore reserves to support the Bankable Feasibility Study (“BFS”). The current BFS is being progressed which includes the necessary open pit mine design to defi ne mineable reserves.
SAFM intends designing its future exploration programmes to target the core of the deposit which is open at depth and in extensions to the north of the current projected pit envelope. This has the potential to further increase the size of the deposit.
STEADY PROGRESS ON BFSPerhaps one of the most signifi cant developments since listing has been Management’s reassessment of the potential of the PVM resource. The plans in our prospectus envisaged growth of the operation from its current 1.5 Mtpa level to 3 Mtpa and then possibly to 6 Mtpa. Upon review of the ore body and completion of a preliminary evaluation, the growth stages were revised to 8 Mtpa and then to 16 Mtpa. This growth strategy will be implemented with an “off-the-shelf” approach to reduce the time to commissioning, fi rst 8 Mtpa by end 2015 and then 16 Mtpa by 31 December 2017.
In line with the above, the fi nal scope of work for the BFS was completed during the period and an agreement with Logicamms Consultants Pty Ltd was entered into.
AGREEMENT WITH RAIL COMPANY MRS LOGISTICA SA (“MRS”)A Memoranda of Understanding has been reached with MRS Logistics regarding the establishment of an ore loading facility on the MRS Andaime rail line located 15 kilometres to the east of the mine. A loading loop facility has been proposed, and initial design is in progress, to connect to the PVM plant by ore conveyor haulage, to the loading facility to be established by MRS. This facility may also be utilised by an adjoining iron development project.
NEGOTIATIONS WITH CEMIGAn agreement is currently being negotiated with the CEMIG electrical supply network to connect the PVM plant operations to the Itabarito power distribution centre located 19 kilometres to the east of the mine. It is expected that the logistics corridor for the power system will be adjacent to that for the conveyor.
ACQUISITION OF WASTE AND TAILINGS PROPERTYSAFM has entered into an agreement for the acquisition of a 100 hectare property in the south of its PVM for R$11 million (A$5.27 million). The property will be used for tailings and waste disposal to be generated from SAFM’s expansion project. The consideration payable under this agreement includes an upfront payment of R$2 million (A$0.96m) which has been settled and the balance of R$9 million (A$4.31 million) to be paid on 30 December 2013.
CURRENT OPERATIONSDuring the year, SAFM achieved its full mine production capacity of 1.5 million ROM tonnes per year available at the Ponto Verde mine under its operating licence.
This was achieved despite two setbacks in the months of October 2012 and April 2013 primarily relating to the recirculation of water. SAFM expeditiously addressed the issue by circulating all water through its recently installed Thickener system which signifi cantly removes the solids in the water. The Company also appointed two key executives to manage its Water and Maintenance departments. Production has signifi cantly improved after year end with record production being achieved during August 2013.
Revenue and Profi t FY 2013 FY 2012
Sales Revenue $’000 19,591 17,693
EBITDA $’000 3,091 3,371
EBIT $’000 2,476 3,800
NPAT (Reported) $’000 1,682 2,309
EPS (cents) 0.41 0.68
JORC Resource Tonnage (Mts) Fe Content (%)
Total JORC Resource 301.06 40.65
Measured Resource 72.76 41.06
Indicated Resource 101.96 40.68
Inferred Resource 126.34 40.45
MANAGING DIRECTOR’S REPORT
This past year, the second full year of operations for South American Ferro Metals (“SAFM”), has been a very positive year for the Company in the areas of both operational performance and growth planning and determination.
For
per
sona
l use
onl
y

FOCUSED ON EXPANSION
05
“The introduction of additional high grade concentrate product from its Concentrator Two, which was completed in June 2013, has lifted overall
production capacity at the PVM by over 40%.”
The Concentrator One project was ramped up to full capacity within 2012. In addition, Concentrator Two was successfully completed during the year making good progress to steady state production, which was achieved after year end. The installation of these two plants has doubled the production capacity of the Company, but more importantly have added a high value product (65% Fe) to its product mix.
There continues to be a strong focus on sustainable operations at PVM. To promote site optimisation and ensure production reliability various site improvements were implemented over the past year. Some of the more material improvements included: installation of additional electrical power; installation of a Thickener to help remove particles from the water; commissioning of a weight bridge; construction of a ground water extraction borehole; completion of the assay lab; and installation of additional site infrastructure. This management focus on sustainable operations, and the site enhancements that have resulted, will help ensure safety is maintained on site whilst production targets are achieved.
FINANCIAL PERFORMANCESAFM’s reported net profi t before tax decreased from $3.78 million to $2.48 million for the year ended 30 June 2013. The decline in profi t was primarily attributable to a 4.7% decrease in weighted average net selling price, as well as unexpected disruption to production volumes during the last quarter which resulted in an increase of costs of sales from $18.12 per tonne to $20.52 per tonne. SAFM continued to generate cash fl ow of $2.24 million from its operating activities and reported EBITDA of $3.09 million for FY 2013.
Looking forward, the introduction of additional high grade concentrate product from its Concentrator Two, which was completed in June 2013, has lifted overall production capacity at the PVM by over 40%. More importantly, this additional sales volume will signifi cantly increase the weighted average selling price of SAFM’s product mix. With SAFM’s continued focus on higher production volumes and reduction of production costs, the company is forecasting to generate higher margins in FY 2014.
SAFETY AND ENVIRONMENTAL PERFORMANCEThe Company has continued its excellent safety industrial and environmental performance, with one minor incident being reported during the year. SAFM’s strong record on health and safety enhances relationships with the supervising authorities involved in the approval of future operations and infrastructure construction. Health, Safety and the Environment remains a key focus for SAFM and part of the Company’s core values.
FINANCINGThe Company has obtained a two year loan facility from Deutsche Bank. The facility provides expansion funding and strengthens SAFM’s working capital through the period to completion of its Bankable Feasibility Study for PVM. We look forward to working with Deutsche Bank as we expand our iron ore production.
STAFFThe Brazilian executive management under the leadership of Zeca Paixão and Jairo Leal has continued to implement progressive management systems, spearheading the expansion and strengthening of SAFM’s Leadership Team, and enhanced safety and industrial relations performance. The management team has achieved targeted goals, utilising the initial shareholders’ funds raised at listing, supplemented by operating cash fl ow.
I would like to commend the continuing efforts and enthusiasm of SAFM’s management, staff and directors and thank them for their efforts which have resulted in SAFM continuing its successful and strong performance as a growing iron ore producer.
Yours faithfully
Stephen TurnerManaging Director
Beneficiated Production (tonnes per month)
Throughput Rate (tonnes per hour)
Ben
efic
iate
d P
rodu
ctio
n (to
nnes
per
mon
th)
Thro
ughp
ut R
ate
(tonn
es p
er h
our)
40000
46000
52000
58000
64000
70000
Beneficiated Production and Throughput Rate
150
170
190
210
230
250
Sep-
13Au
g-13
Jul-1
3
Jun-
13M
ay-1
3Ap
r-13
Mar
-13
Feb-
13Ja
n-13
Dec
-12
Nov
-12
Oct
-12
Sep-
12
Aug-
12Ju
l-12
For
per
sona
l use
onl
y

SAFM ANNUAL REPORT 201306
BANKABLE FEASIBILITY STUDY
The BFS is progressing to the company’s satisfaction with further enhancements being considered based on the results of metallurgical test work recently completed. These enhancements are expected to improve the process route and reduce the necessary capital expenditure for the expansion.
The following provides an update of the BFS to date:
MINE PLANNINGThe ore body comprises mainly of friable Itabirite material. This iron deposit from the Itabira group appear in hematite rich itabirite layers in the Cauê and Gandarela formations, as well as in small superfi cial deposits of Itabiritic Colluviums, linked to these units. Mining will be conducted using proven open pit mining methods with the ore being crushed, screened and then magnetically separated to produce Concentrate. The study is based on proven non-blasting technology.
Coffey International Limited (“Coffey”) has completed a desk-top-study to determine the fundamental viability of expanding the Ponto Verde Mine (“PVM”) site and a mining supply assessment inclusive of budget quotations of the mining equipment required for production of ore and handling of waste.
Based on the above studies, a preliminary mine schedule has been formulated which includes the selection of mining methods and equipment and defi nition of the production rate. Further mining scheduling and design studies are scheduled for completion during the current calendar year.
PLANT & INFRASTRUCTURE DESIGNIt is anticipated that the process circuit will consist of crushing and screening, followed by grinding, magnetic separation, thickening and fi ltration processes.
SAFM is currently evaluating two logistical solutions from the mine to the rail terminal. Preliminary geotechnical investigations have been completed for the proposed process plant location.
CEMIG has completed the feasibility study for the power supply to the mine. The study proposes the layout of the intended transmission line together with estimated capital costs. Further discussions are currently underway to fi nalise agreements over the future power supply.
SAFM has entered into a memorandum of understanding with MRS1 to develop a logistics solution for the rail transportation of iron ore from SAFM’s PVM to the port terminals at Baia de Sepitiba in the state of Rio de Janeiro, approximately 400 km from Ponte Verde mine.
The PVM is located 15 km west of the Andaime branch line of the MRS system, which transports production from the Minas Itabiritos mines adjoining Ponto Verde.
The rail transportation of the product will utilise existing MRS infrastructure for the loading and unloading of iron ore products, but also incorporates the development of a new loading terminal. A potential location for the rail stockyard and terminal has been identifi ed and a company specialised in railway terminals is currently preparing a concept design of the terminal.
Discussions are currently being held with port operators. It is expected that the proposed port operator will be responsible for all port services including the provision of warehouses and stockyards.
INTEGRATED WASTE & TAILINGSOn 10 October 2013, SAFM announced that it had entered into an agreement for the acquisition of a 100 hectare property in the south of its PVM. In addition, SAFM has obtained an option to acquire an additional 100 hectares contiguous with the initial 100 hectares.
A technical and environmental study of the area and has been conducted by Consultoria e Empreendimentos de Recursos Naturais Ltda (“CERN”) confi rming that there are no restrictions regarding the deposition of waste and tailing on the two sites. Furthermore, there are no archaeological impediments discovered on the site which would limit its use.
In addition, a detailed study of the volume capacity ratio between waste and tailings was performed by engineering consulting fi rm, GeoGraphos Engenharia e Consultoria Ltda (“Geographos”). The study concluded that the total area covered by the two land acquisitions would be suffi cient in size to hold approximately 64 million cubic metres of waste and tailing material which would be suffi cient for the expanded mine life.
In February 2012, SAFM approved its Bankable Feasibility Study (“BFS”) for the expansion of the Ponto Verde Mine (“PVM”) to 8 Mtpa (“ROM”) by end of 2015 and 16 Mtpa by the end of 2017.
1MRS is one of the largest railway companies in Brazil. MRS operates the South-Eastern Federal Railroad Network, which connects the states of Minas Gerais, Rio de Janeiro, and São Paulo to three of the most important seaports of Brazil, being Rio de Janeiro, Itaguaí and Santos. Its railway network stretches 1,643 kilometres and transports approximately 65% of Brazil’s gross domestic product.
For
per
sona
l use
onl
y

FOCUSED ON EXPANSION
07
PERMITS & LEGAL SUPPORT, INCLUDING ENVIRONMENTAL LICENSESApplications for environmental and installation licenses were submitted to the relevant environmental and regulatory agencies in July 2013. SAFM expects these licenses to be granted at the beginning of the 2014 calendar year.
An archaeological fi eld survey was concluded on the mine site and the resulting fi nal report was lodged with the National Institute of Brazilian Artistic and Historical Heritage (“IPHAN”) in January 2013. SAFM has also completed the registration of landowners along the proposed logistics corridor for the expansion.
LOOKING AHEADProgress will continue and is expected to accelerate on a number of fronts of the BFS with emphasis on permits and environmental licenses, land tenure and preliminary fi eld investigations. Further metallurgical test work will take place and be completed and report issued within the next 5 months and the process route will be fi nalised based on a pellet feed product.
The development of the BFS engineering, which includes the mining study, will continue upon completion of the metallurgical test work program which will fi nalise the characteristics of the product.
Specialised Consultants such as Marketing and Financial Modeling experts have also been appointed to support the BFS.
CEMIG will be updating the previous completed feasibility study on the power supply options. This revision will recommend for SAFM consideration, a number of activities that should be addressed prior to project implementation in order to secure the power supply for the expansion start-up. These among others will be environmental licenses, land tenure and conceptual engineering.
Negotiations with MRS to develop a logistics solution for rail transportation of the product are continuing, as are discussions with port operators.
On completion of the metallurgical testwork, which is expected by mid-April 2014, a draft of the feasibility study report will be submitted to SAFM’s consideration, with the fi nal version due at the end of April 2014.
For
per
sona
l use
onl
y

SAFM ANNUAL REPORT 201308
INCREASINGPROFITABILITYAND RESOURCE
The year’s other highlights included the full ramp-up of the Concentrator One, being the Medium-intensity magnetic separator and the successful completion of the on-site assay laboratory.
The Company unfortunately suffered two setbacks in the months of October 2012 and April 2013 relating to the recirculation of water. Corrective steps were expeditiously implemented and production has signifi cantly improved after year end with record benefi ciated production being achieved during August 2013 (refer graph).
OPERATIONS OVERVIEWPVM operates under a processing license of 1.5 Mtpa of Run-Of-Mine (“ROM”). Mining activities are conducted during normal business hours, whilst processing plants run on a 24 hours, seven days a week basis. Mining is as a ‘free dig’ operation (ie it does not require drilling or blasting) and utilises four excavators that feed ore to a fl eet of 20 haul trucks. The strip ratios range between 0.22 and 0.46 (tonne of waste per ton of ore) and averaged 0.28 over the fi nancial year.
SAFM operates three fully integrated plants, comprising the Benefi ciation, Concentrator One and Concentrator Two plants.
The Benefi ciation Plant consists of a two-stage crushing circuit. Both stages include wet screening, which occurs in a closed circuit, to produce Lump (10mm – 28mm) and Sinter Feed (3mm –10mm).
Concentrator One produces a high grade product through the recovery of waste below 3mm in size. The waste is fed directly from the Benefi ciation plant into a two-drum medium-intensity wet magnetic separator. Additional feed is added via an external hopper and conveyor belt. During FY 2013, this plant produced over 180,000 tonnes of a 65% Fe high grade concentrate.
Concentrator Two was commissioned in June 2012, and processes the tailings from Concentrator One. With a higher recovering capacity, this plant processes at a rate of 35 tph to produce a high grade product, with similar characteristics to the Concentrate One product.
PRODUCTION DURING THE FINANCIAL YEARThe mine operated at its full licensed capacity of 1.5 Mtpa ROM throughout the fi nancial year.
Following the record benefi ciated production achieved in January 2013, SAFM experienced an unexpected dip in production from April 2013 to June 2013. The decrease in production was caused by a combination of factors including a late, prolonged and heavy rainy season that resulted in water reticulation problems, as well as poor water quality that impacted the performance of the Cone crusher. Furthermore, operation experienced longer than expected impediments to output of Concentrate during the commissioning of the Concentrator Two plant.
SAFM expeditiously addressed the issue of water reticulation by circulating all water through its recently installed thickener system which signifi cantly removed the solids in the water. The Company also appointed two key executives with requisite skills to manage its Water and Maintenance departments.
OPERATIONAL EXCELLENCE AND SUSTAINABILITYAs one of its main pillars, SAFM remained strongly focused on operational excellence and site sustainability throughout FY 2013.
During the year, there was a strong focus on site improvements. The following improvements were implemented during the year:
Construction and operation of an on-site assay laboratory.
Commissioning of the second weight bridge.
Replacement of screens in the Benefi ciation plant.
Expansion of offi ces and food service facilities.
Restructuring of the mining contract to be based on tonnes produced, rather than hours worked.
OPERATIONS REPORT
The second full year of production at SAFM’s Ponto Verde Mine (“PVM”), was marked by an increase in benefi ciated production to 626,134 tonnes (FY 2012: 498,215 tonnes). This was achieved through the successful commissioning of Concentrator One, being the Medium Intensity Magnetic Separator.
The following production was achieved during the year:
Tonnes
ROM mined 1,630,727
Lump produced 181,441
Sinter Feed produced 251,828
Concentrate produced 192,865
Ponto Verde Mine Product Range, Measurement and Product Size Quality comprise the following:
Product Measurement Quality
Lump 10mm – 28mm 58% – 60% Fe
Sinter Feed 3mm – 10mm 57% – 60% Fe
Concentrate < 3mm 64.5% – 65% Fe
For
per
sona
l use
onl
y
FOCUSED ON EXPANSION
09
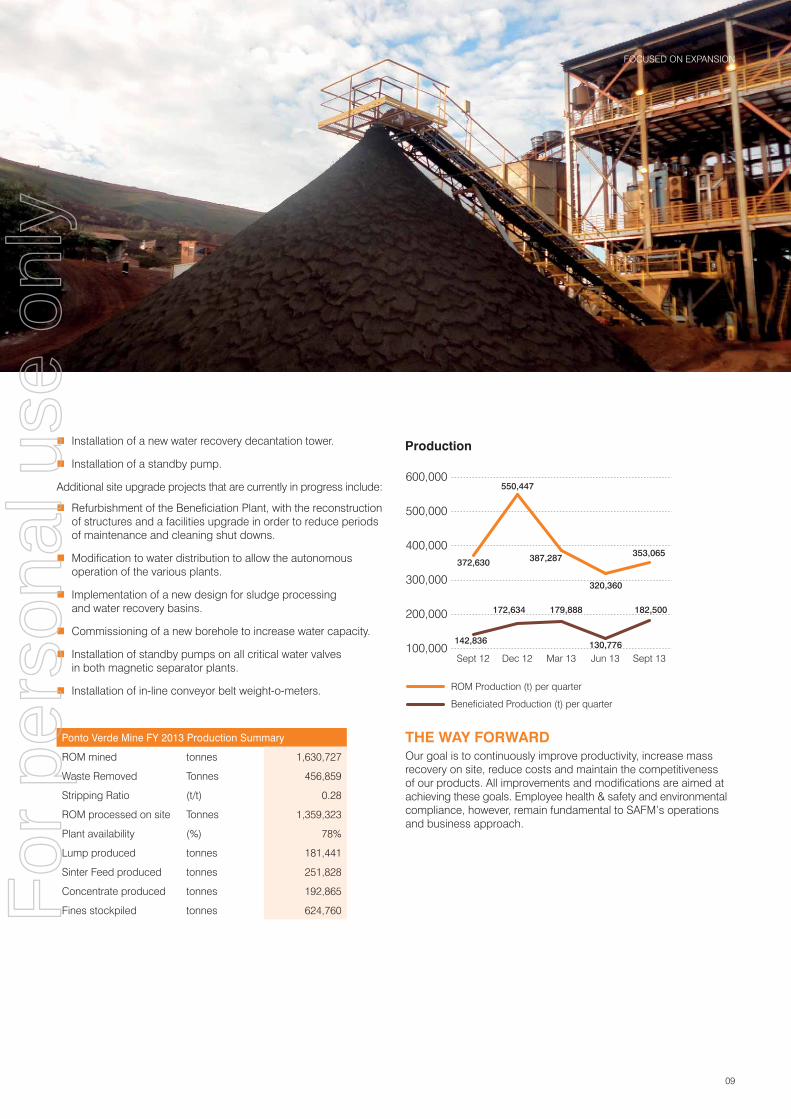
Installation of a new water recovery decantation tower.
Installation of a standby pump.
Additional site upgrade projects that are currently in progress include:
Refurbishment of the Benefi ciation Plant, with the reconstruction of structures and a facilities upgrade in order to reduce periods of maintenance and cleaning shut downs.
Modifi cation to water distribution to allow the autonomous operation of the various plants.
Implementation of a new design for sludge processing and water recovery basins.
Commissioning of a new borehole to increase water capacity.
Installation of standby pumps on all critical water valves in both magnetic separator plants.
Installation of in-line conveyor belt weight-o-meters.
THE WAY FORWARDOur goal is to continuously improve productivity, increase mass recovery on site, reduce costs and maintain the competitiveness of our products. All improvements and modifi cations are aimed at achieving these goals. Employee health & safety and environmental compliance, however, remain fundamental to SAFM’s operations and business approach.
Ponto Verde Mine FY 2013 Production Summary
ROM mined tonnes 1,630,727
Waste Removed Tonnes 456,859
Stripping Ratio (t/t) 0.28
ROM processed on site Tonnes 1,359,323
Plant availability (%) 78%
Lump produced tonnes 181,441
Sinter Feed produced tonnes 251,828
Concentrate produced tonnes 192,865
Fines stockpiled tonnes 624,760
Production
ROM Production (t) per quarter
Beneficiated Production (t) per quarter
100,000
200,000
300,000
400,000
500,000
600,000
Sept 13Jun 13Mar 13Dec 12Sept 12
172,634
142,836
179,888
130,776
182,500
320,360
372,630
550,447
387,287 353,065
FOCUSED ON EXPANSIONF
or p
erso
nal u
se o
nly

SAFM ANNUAL REPORT 201310
GEOLOGY AND RESOURCE
The mining concession area is on the inverted eastern fl ank of Sinclinal da Moeda, which demonstrates NE–SW structuring and has a dive ranging from medium to high (45°–80°).
The manganese and iron deposits from the area relate to the Gandarela and Cauê formations respectively, and both belong to the Itabira Group.
Geomorphologically, the mining concession area´s central and northern zones are characterized by rolling terrain with rounded shapes. Topographically lower portions appear to the west with the formation of a relatively closed valley.
The Ponto Verde ore body occurs continuously over more than 2km, from the southern boundary to the central part of the Project area. In this region, the Cauê formation is oriented towards 30ºN to 45ºE with thickness varying around 100m. Thickness variation is controlled by second-order internal folding, with folds axes oriented NE-SW. These folds produce strong variations in the dip of the layers, ranging from 20º to 85º to both the SE and NW.
EXPLORATION CONDUCTED DURING THE YEARDuring the fi nancial year, SAFM completed its Phase II Resource Defi nition Programme. During this phase, a total of 23 drill holes were completed, comprising a total of 3,456 metres of diamond
drilling, as well as an additional 159 metres auger drilling campaign that was performed on the defi nition and sampling of the surfi cial Colluvial deposit. Furthermore, the Company completed a full analysis of the complete mineralised envelope within an extended pit outline.
This phase of exploration increased the size of the Resource from 230.6 Mt at 44.52% Fe tonnes to 301.06 Mt at 40.65% Fe. More importantly, the Measured and Indicated components of the Resource signifi cantly increased from 60.6 Mt at 41.61% Fe to 174.72 Mt at 40.84% Fe, with the cut-off grade of 20% Fe applied.
This estimate provides the basis for open pit design and scheduling to establish mineable ore reserves, as well as supports the Bankable Feasibility Study increasing the level of confi dence of the Resource to support SAFM’s planned expansion strategy.
The updated resource has been calculated based on drilling results to an average depth of 70 metres below the surface. However, exploration drilling at depth has highlighted that mineralisation extends to over 400 metres depth. Based on this, SAFM’s Phase III Resource Defi nition Programme, to be carried out in the current year, will target the core of the deposit at depth and extensions to the north of the current projected pit envelope. This drilling is expected to further increase the size of the deposit.
COMPETENT PERSON’S STATEMENTInformation in this presentation that relates to the JORC resource at Ponto Verde is based on information compiled by Mr Bernardo Hurta de C Viana (Phase I) and Mr Porfi rio Cabaleiro (Phase II) both of Coffey Mining (Brazil). Both are Members of the Australasian Institute of Mining and Metallurgy. Mr Viana and Mr Cabaleiro have suffi cient
experience which is relevant to the style of mineralisation and type of deposit under consideration and to the activity which he has undertaken to qualify as a “Competent Person” as defi ned in the 2004 Edition of the Australasian Code for Reporting of Exploration Results, Mineral Resources and Ore reserves (the JORC Code).
PONTO VERDE MINE GEOLOGY
The Ponto Verde Mine (“PVM”) is situated on the southern edge of the São Francisco Craton, which is located within the Iron Quadrangle (a Brasiliano-age geotectonic unit surrounded by orogenic belts).
JORC resource
Ponto Verde Iron Ore Project
JORC Grade x Tonnage Table – Cut-off Grade Applied: 20% Fe
Mineral Resources – Block Model: 50, 25, 10 (25, 12.5, 5)
Resource Class Tonnes (Mt) Fe (%) SiO2 (%) Al2O3 (%) Mn (%)
Measured 72.76 41.06 32.86 2.18 1.530
Indicated 101.96 40.68 31.27 3.24 1.748
Measured + Indicated 174.72 40.84 31.93 2.80 1.657
Inferred 126.34 40.45 31.64 3.64 1.564
Total Resource 301.06 40.65 31.79 3.22 1.611
For
per
sona
l use
onl
y

FOCUSED ON EXPANSION
11
For
per
sona
l use
onl
y

SAFM ANNUAL REPORT 201312
CORE VALUE:HEALTH, SAFETY, & ENVIRONMENT
SAFETY FOCUSOur approach to site safety uses current safety knowledge to systematically advance our safety procedures in ways that all site workers can understand, accept and adopt.
Together with a focus on site housekeeping, effi cient site design and implementation of temporary facilities, the company has attempted to address all the procedural and behavioural aspectsof our ‘safety formula’. It also ensures that safety activities are fully embraced and are sustained over time.
Developments in SAFM’s safety approach this year included:
Holding weekly safety meetings and presentations with all mine based employees.
Continuing regular site risk assessment, inspections, documentation and follow up.
Installing new and improving existing road safety berms and signage.
Installation of new safety barriers to stop erosion of land mass into roads and walk paths.
Streamlining the mining contractor equipment safety inspection program.
Installing plants safety cock-pits for operators working near risk areas of plants.
Implementing new monthly health and safety KPIs and reports for Companywide communication.
The SAFM Management Team prioritises the well-being of our people through our Health, Safety and Environment (“HSE”) program. This remains our core value and our primary operational concern.
For
per
sona
l use
onl
y

FOCUSED ON EXPANSION
13
ENVIRONMENTAL STEWARDSHIPIn FY 2013, SAFM successfully completed the remaining environmental requirement outlined by the Environmental Ministry in association with the mining licence. These included:
Backfi lling three mining areas within the tenements south of the site.
Installing a 26km fence surrounding the adjacent environmental park.
The completion of these two projects confi rms SAFM’s full compliance to all of its environmental commitments made to the Environmental Ministry. These, along with previous, environmental projects attracted positive feedback from every environmental regulatory authority at their regular site visits.
In addition to the statutory commitments, the following environmental activities were implemented or improved:
Regular environmental training sessions with all mine staff.
A more sustainable garbage disposal recycling program to ensure minimal environmental footprint.
Continuous monitoring of the fl uvial streams and deposits for the early detection of any fl uid discharge.
New controls that guarantee green-house emissions are kept at the acceptable level.
Further rehabilitation and re-vegetating former mining areas near the PVM site.
These programs and policies are key to maintaining SAFM’s positive relationship with the Environmental Ministry and reputation with the local community.
LOOKING AHEADThe Company will continue to keep employee well-being at the centre of all safety and improvement efforts, and will endeavour to ensure that all employees embrace the continual improvements.
Safety procedures and standards are customised to our specifi c requirements and incorporated into mine operations on a priority basis with a ‘fi t for purpose’ approach.
Our environmental stewardship and performance guarantees the Company’s compliance with its mining licence requirements and ensures we will continue on seeking ways to improve our overall environmental focus, performance and outcomes year after year.
For
per
sona
l use
onl
y
SAFM ANNUAL REPORT 201314
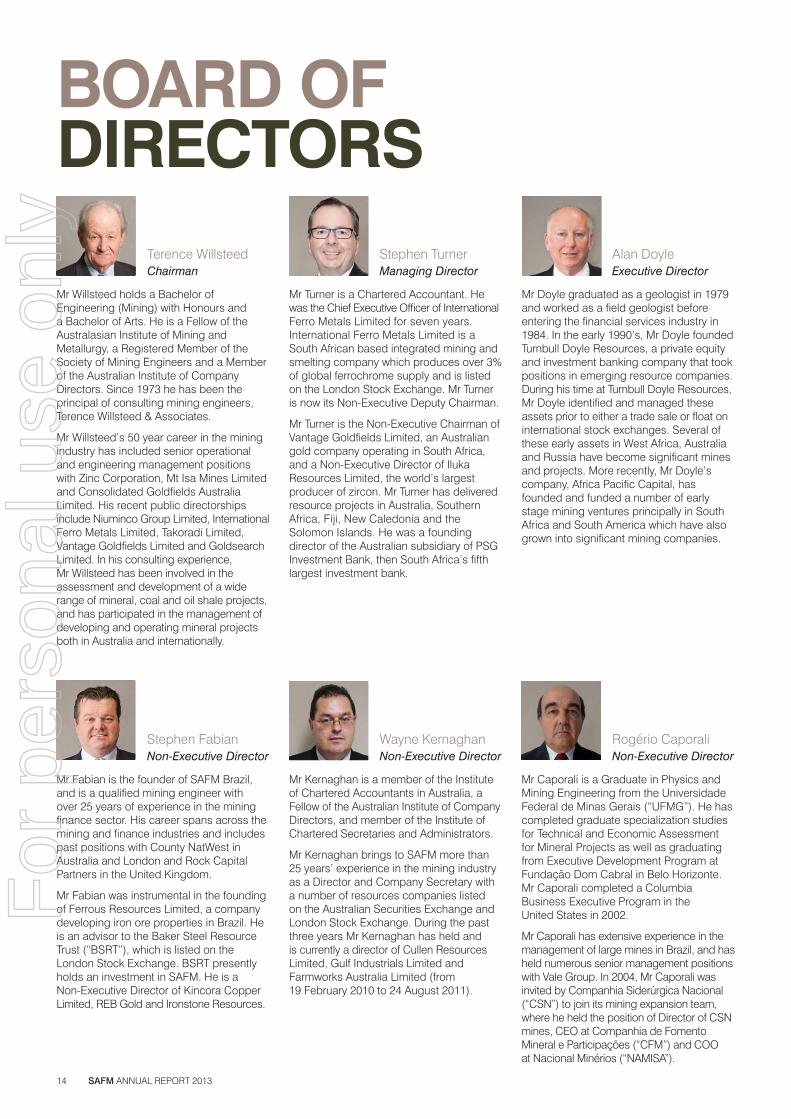
Terence WillsteedChairman
Mr Willsteed holds a Bachelor of Engineering (Mining) with Honours and a Bachelor of Arts. He is a Fellow of the Australasian Institute of Mining and Metallurgy, a Registered Member of the Society of Mining Engineers and a Member of the Australian Institute of Company Directors. Since 1973 he has been the principal of consulting mining engineers, Terence Willsteed & Associates.
Mr Willsteed’s 50 year career in the mining industry has included senior operational and engineering management positions with Zinc Corporation, Mt Isa Mines Limited and Consolidated Goldfi elds Australia Limited. His recent public directorships include Niuminco Group Limited, International Ferro Metals Limited, Takoradi Limited, Vantage Goldfi elds Limited and Goldsearch Limited. In his consulting experience, Mr Willsteed has been involved in the assessment and development of a wide range of mineral, coal and oil shale projects, and has participated in the management of developing and operating mineral projects both in Australia and internationally.
BOARD OFDIRECTORS
Wayne KernaghanNon-Executive Director
Mr Kernaghan is a member of the Institute of Chartered Accountants in Australia, a Fellow of the Australian Institute of Company Directors, and member of the Institute of Chartered Secretaries and Administrators.
Mr Kernaghan brings to SAFM more than 25 years’ experience in the mining industry as a Director and Company Secretary with a number of resources companies listed on the Australian Securities Exchange and London Stock Exchange. During the past three years Mr Kernaghan has held and is currently a director of Cullen Resources Limited, Gulf Industrials Limited and Farmworks Australia Limited (from 19 February 2010 to 24 August 2011).
Rogério CaporaliNon-Executive Director
Mr Caporali is a Graduate in Physics and Mining Engineering from the Universidade Federal de Minas Gerais (“UFMG”). He has completed graduate specialization studies for Technical and Economic Assessment for Mineral Projects as well as graduating from Executive Development Program at Fundação Dom Cabral in Belo Horizonte. Mr Caporali completed a Columbia Business Executive Program in the United States in 2002.
Mr Caporali has extensive experience in the management of large mines in Brazil, and has held numerous senior management positions with Vale Group. In 2004, Mr Caporali was invited by Companhia Siderúrgica Nacional (“CSN”) to join its mining expansion team, where he held the position of Director of CSN mines, CEO at Companhia de Fomento Mineral e Participações (“CFM”) and COO at Nacional Minérios (“NAMISA”).
Stephen TurnerManaging Director
Mr Turner is a Chartered Accountant. He was the Chief Executive Offi cer of International Ferro Metals Limited for seven years. International Ferro Metals Limited is a South African based integrated mining and smelting company which produces over 3% of global ferrochrome supply and is listed on the London Stock Exchange. Mr Turner is now its Non-Executive Deputy Chairman.
Mr Turner is the Non-Executive Chairman of Vantage Goldfi elds Limited, an Australian gold company operating in South Africa, and a Non-Executive Director of Iluka Resources Limited, the world’s largest producer of zircon. Mr Turner has delivered resource projects in Australia, Southern Africa, Fiji, New Caledonia and the Solomon Islands. He was a founding director of the Australian subsidiary of PSG Investment Bank, then South Africa’s fi fth largest investment bank.
Alan DoyleExecutive Director
Mr Doyle graduated as a geologist in 1979 and worked as a fi eld geologist before entering the fi nancial services industry in 1984. In the early 1990’s, Mr Doyle founded Turnbull Doyle Resources, a private equity and investment banking company that took positions in emerging resource companies. During his time at Turnbull Doyle Resources, Mr Doyle identifi ed and managed these assets prior to either a trade sale or fl oat on international stock exchanges. Several of these early assets in West Africa, Australia and Russia have become signifi cant mines and projects. More recently, Mr Doyle’s company, Africa Pacifi c Capital, has founded and funded a number of early stage mining ventures principally in South Africa and South America which have also grown into signifi cant mining companies.
Stephen FabianNon-Executive Director
Mr Fabian is the founder of SAFM Brazil, and is a qualifi ed mining engineer with over 25 years of experience in the mining fi nance sector. His career spans across the mining and fi nance industries and includes past positions with County NatWest in Australia and London and Rock Capital Partners in the United Kingdom.
Mr Fabian was instrumental in the founding of Ferrous Resources Limited, a company developing iron ore properties in Brazil. He is an advisor to the Baker Steel Resource Trust (“BSRT”), which is listed on the London Stock Exchange. BSRT presently holds an investment in SAFM. He is a Non-Executive Director of Kincora Copper Limited, REB Gold and Ironstone Resources.
For
per
sona
l use
onl
y

FOCUSED ON EXPANSION
15
KEY MANAGEMENT
Eduardo FreitasChief Commercial Offi cer
Mr Freitas holds a Bachelor of Economics degree from the University of Sao Joao del Rei. He worked at Companhia Siderugica Nacional (“CSN”), a major steel-maker in Brazil for over 8 years in the area of iron ore exportation. In 2009, he took on a role as economic specialist for NAMISA, a jointly controlled company of CSN.
Dion CohenChief Financial Offi cer and Company Secretary
After qualifying as a Chartered Accountant at Ernst & Young in 1995, Mr Cohen was involved in corporate fi nance and private equity. His experience ranges from mergers and acquisition structuring, to capital raisings and management of mining companies in private equity ownership. Mr Cohen held the position of Chief Financial Offi cer of International Ferro Metals Limited; a company listed on the Main Board of the London Stock Exchange and has held board positions in both listed and unlisted companies.
José Márcio PaixãoChief Development Offi cer
Mr Paixão holds a degree in Mining engineering from the University of Minas Gerais. He has an MSC in chemical engineering and a PhD in Metallurgy/Electrochemistry from Paris VI University in France. He has worked in mining and metallurgy for more than 26 years, including spending more than a decade with Vale, the world’s biggest iron ore producer. Most recently, he worked as Chief Operating Offi cer for Vancouver-based Earth XM Mining Corp.
Jairo LealChief Operating Offi cer
Mr Leal is a qualifi ed geologist and has specialising in geostatistics. He has completed a MBA and has over 25 years’ experience in the mining industry in Brazil. Mr Leal has worked with Namisa (“COO”), Kinross Gold (VP and General Manager) and Vale (General Manager Mining). He has extensive experience in operations, community relations, mine logistics and processing.
For
per
sona
l use
onl
y

SAFM ANNUAL REPORT 201316
CORPORATEGOVERNANCE STATEMENTThe Board of Directors are responsible for guiding and monitoring the Company on behalf of shareholders and are accountable to them for creating and delivering value through the effective governance of the business.
SAFM’s vision is to be a profitable, safe and growing iron ore producer that is the Company of choice for employees, investors, customers and the communities we work in. To achieve the Company’s vision the Board of Directors and Leadership Team will keep the effective collaboration between all employees, contractors and consultants as their main priority. The leadership of the Company will guide and support the maximisation of profitability while ensuring operations are sustainable and growth opportunities are captured in a timely and efficient manner. This will be performed under an umbrella of effective corporate governance standards.
This Corporate Governance Statement outlines the Company’s corporate governance systems, procedures and practices. As an Australian Securities Exchange (“ASX”) listed Company, the Corporate Governance Standards stipulated in the Corporations Act 2001 and the ASX Listing Rules and the recommendations provided by the Australian Securities Investments Commission (ASIC) policy and the ASX Corporate Governance Council’s Corporate Governance Principles and recommendations have been used as the basis to develop SAFM’s corporate governance systems, procedures and practices as applicable to the Company. The Board continues to assess these in line with the Company’s development and growth to ensure that SAFM continue to deliver value and remains accountable to its Shareholders.
1. BOARD OF DIRECTORS
1.1. Roles and ResponsibilitiesThe Board Charter outlines the Board’s authority and responsibilities to determine all matters relating to the strategic direction and the operation of the Company including establishing goals for management, policies and practices. The monitoring and ultimate control of the business of the Company is vested in the Board which is specifically responsible for the following:
■ Appointment, evaluation, rewarding and if necessary the removal of the Managing Director, Chief Financial Officer and the Company Secretary;
■ In conjunction with management, the development of corporate objectives, strategy and operational plans and approving and appropriately monitoring plans, new investments, major capital and operating expenditures, capital management, acquisitions, divestitures and major funding activities;
■ Establishing appropriate levels of delegation to the Managing Director to allow him to manage the business efficiently;
■ Monitoring actual performance against planned performance expectations and reviewing operating information at a requisite level, to understand at all times the financial and operating conditions of the Company;
■ Monitoring the performance of senior management including the implementation of strategy, and ensuring appropriate resources are available;
■ Via management, an appreciation of areas of significant business risk and ensuring that the Company is appropriately positioned to manage those risks;
■ Overseeing the management of safety, occupational health and environmental matters;
■ Satisfying itself that the financial statements of the Company fairly and accurately set out the financial position and financial performance of the Company for the period under review;
■ Satisfying itself that there are appropriate reporting systems and controls in place to assure the Board that proper operational, financial, compliance, and internal control processes are in place and functioning appropriately;
■ Ensuring that appropriate internal and external audit arrangements are in place and operating effectively;
■ Having a framework in place to help ensure that the Company acts legally and responsibly on all matters consistent with the code of conduct; and
■ Reporting to shareholders.
In conjunction with Management, the Board of Directors ensures that the Company acts legally and responsibly on all matters.
As determined by the Company’s Corporate Governance Policies, the role of the Chief Executive Officer and Managing Director will be performed by only one person given the Company’s current scope and present size. The responsibility for the day-to-day management and administration of the Company is delegated by the Board to the Managing Director.
The Board ensures that the Managing Director and the Management team is appropriately qualified and experienced to discharge their responsibilities effectively and periodically assess the performance of the Executive Management.
The following mechanisms are in place to ensure the alignment of Management’s objectives with the objectives of the Board:
■ Board approval and monitoring of a strategic plan.
■ Approval of annual and semi-annual budgets and monitoring actual performance against budget.
■ Presentations to the Board by financial, operations, exploration and marketing management.
In the spirit of transparency and trust, there will be regular reporting and open dialogue between the Managing Director and the Board.
1.2. MembershipThe Board currently comprises six members; three including the Chairman are independent Non-Executive Directors. Refer to section 1.8 for the factors to assess whether a director is independent.
On 1 March 2013, Mr Turner was appointed as Managing Director. On 5 March 2013, Mr Hopkins formerly Chief Executive Officer of the Company resigned from the Board. On 1 August 2013, Mr Caporali was appointed to the Board as a Non-Executive Director of the Company.
For
per
sona
l use
onl
y

FOCUSED ON EXPANSION
17
With the majority of the Board holding Non-Executive positions, the Board ensures it has extensive access to management and maintains a regular dialogue with the Senior Management team. In addition, the Managing Director and the Chief Financial Officer attend monthly Board meetings where they make presentations and participate in discussions.
This is not in compliance with Principle 2 of the ASX Corporate Governance Principles and Recommendations which states that the majority of the Board should be independent. This is something the Board continues to monitor on a regular basis, however at the present time the composition is the most appropriate for the current level of business operations.
1.3. Skills, Knowledge, Experience and Attributes of DirectorsThe Board considers that a diverse range of skills, experience and knowledge are fundamental to achieve its objectives. The Board ensures that, collectively, it has the appropriate mix of skills and experience necessary to properly fulfil its responsibilities, including:
■ Accounting and finance;
■ Business development and risk management;
■ Industry and public company experience; and
■ Depth of understanding of the role of and legal obligations of a director.
The current Board brings to SAFM a diverse range of skills and experience. The Board comprises of two chartered accountants, three mining engineers and a geologist each with considerable experience in the areas of mining, corporate advisory, financial management and accounting. The skills, experience and expertise relevant to the position of each Director who is in office at the date of the annual report and their term of office are detailed in the Directors’ report. Members of the Board are encouraged and endeavour to continually improve their skills and industry knowledge.
1.4. ChairmanThe role of the Chairman is to ensure that the Board operates in accordance with the Board Charter and ensures that the interests of the shareholders are maintained. The Chairman facilitates communication between the Board and the Managing Director, represents the Board to shareholders, initiates discussion and debates at Board meetings and plays a lead role in assessing the composition of skills and experience of the Board.
Mr Willsteed was appointed as Chairman to the Board of SAFM on 11 November 2010. Mr Willsteed is an independent Non-Executive Director. As Chairman, Mr Willsteed is committed to his role and has made sufficient time and resources available to serve the Company effectively.
1.5. Fiduciary DutiesAll directors have a fiduciary relationship with the shareholders of the Company. A director occupies a unique position of trust with shareholders, which makes it unlawful for directors to improperly use their position to gain advantage for themselves.
1.6. Duties of DirectorsEach director must endeavor to ensure that the Company is properly managed so as to protect and enhance the interests of all shareholders. To this end, directors need to devote sufficient time and effort to understand the Company’s operations. Directors should ensure that shareholders and the ASX are informed of all material matters which require disclosure and avoid or fully disclose conflicts of interest.
1.7. Conflict of InterestAt all times a director must be able to act in the interests of the Company. Where the interests of associates, the personal interest of a director or a director’s family may conflict with those of the Company, then the director must immediately disclose such conflict and either:
■ Eliminate the conflict; or
■ Abstain from participation in any discussion or decision making process in relation to the subject matter of the conflict.
Executive Directors must always be alert to the potential for a conflict of interest between their roles as executive managers and their fiduciary duty as Directors.
1.8. IndependenceThe names of the current independent Directors of the Company are:
Terence WillsteedWayne KernaghanRogério Caporali
The ASX Corporate Governance recommendations are used as a guideline to determine the independent status of a director. An independent director:
■ Is not a substantial shareholder of the Company;
■ Is not employed or has not been previously employed in an executive capacity by the Company or the Group in the last three years;
■ Has not been a principal or key employee or a material professional advisor or consultant to the Company or another group member within the last three years;
■ Is not and is not associated with any material customer or supplier or otherwise has a material contractual relationship with the Company or Group.
Mr Turner and Mr Doyle are not considered to be independent Directors as they are executive directors and hold significant shareholdings in SAFM. Mr Fabian is also not considered independent due to his significant shareholding in SAFM and because of his previous executive involvement in the Company.
1.9. Terms of AppointmentEach Director on the Board is bound by the terms and conditions of their Director contracts, these contracts clearly define their roles and responsibilities as Directors.
For
per
sona
l use
onl
y

CORPORATE GOVERNANCE STATEMENT (CONTINUED)
SAFM ANNUAL REPORT 201318
The Directors are required to perform their fiduciary duties with due care and skill and they are required to spend sufficient time in performance of these duties, as outlined in their contracts. The contracts require Directors to disclose any conflicts of interest or any changes in interest that would be perceived to affect their independence.
1.10. Independent AdviceThe Directors have the right to seek independent professional advice on matters relating to their position as Directors of the Company at the Company expense, subject to the prior approval of the Chairman, which shall not be reasonably withheld.
1.11. Remuneration PolicyThe Remuneration Policy governs the remuneration practices of the Company. The Remuneration Committee shall review and reassess the policy at least annually and obtain the approval of the Board.
Refer to the Remuneration Report for the details of the remuneration policies.
1.12. Security Trading PolicyThe Company has a Security Trading Policy which regulates dealings by Directors, officers and employees in securities of the Company. The policy restricts Directors and employees from acting on inside information until it has been released to the market and adequate time has been given for this to be reflected in the security’s price. All dealings in securities must be disclosed to the Company Secretary.
1.13. MeetingsThe Board holds monthly Board meetings.
Any Director may call a meeting of the Board of Directors by giving reasonable notice to the members of the Board. The meetings held allow the Directors to fulfill their duties as Directors and devote sufficient time and attention to the Company.
During the year ended 30 June 2013, 16 Board meetings were held. Attendance by the Directors at Board and Board Committee meetings is disclosed in the Directors’ report. The Chief Financial Officer and senior management personnel are invited to attend the Board meetings to present key operational and financial information.
1.14. Company SecretaryMr Cohen was appointed as Company Secretary on 11 November 2010. The Company Secretary facilitates the Board in fulfilling its roles by ensuring Board procedures are complied with and advises on corporate governance matters.
1.15. Review, Re-election and RenewalIn accordance with the constitution of the Company, the Directors (other than the Managing Director) must offer themselves for re-election by shareholders at least every three years. The Board does not specify the maximum term for which a director can hold office.
2. BOARD COMMITTEESThe Board has established Board Committees to assist it in delegating its authority to effectively carry out its corporate governance objectives.
The Board of SAFM has the following Board Committees:
■ Remuneration Committee
■ Audit Committee
■ Risk Management Committee
The Board has not established a Nomination Committee at this time. Until such time as the Board determines that it is appropriate to establish a Nomination Committee, the function of the Nomination Committee as set out in the Board Charter will be performed by the Board.
2.1. Remuneration CommitteeThe Remuneration Committee was established to perform the following principle functions:
■ To review and recommend to the Board the overall strategies in relation to executive remuneration policies;
■ To review and make recommendations to the Board in respect of the compensation arrangements for the executive management and Non-Executive Directors;
■ To review the effectiveness of performance incentive plans; and
■ To review and make recommendations to the Board in respect of all equity based remuneration plans.
In consultation with the Managing Director, the Committee will formulate policies surrounding the Company’s general approach to remuneration and will oversee the implementation of these policies.
The Remuneration Committee members are:
Wayne Kernaghan (Chairman)Terence WillsteedStephen Fabian (appointed 26 July 2013)Stephen Turner (resigned 26 July 2013)
A total of 4 Remuneration Committee meeting was held during the year.
2.2. Audit CommitteeThe primary function of the Audit Committee is to assist the Board in fulfilling its responsibilities relating to the accounting and reporting practices of the Company.
The Committee will:
■ Oversee, co-ordinate and appraise the quality of the audits conducted by the Company’s external auditors;
■ Determine the independence and effectiveness of the external auditors;
■ Maintain open lines of communications among the Board and the external auditors to exchange views and information, as well as confirm their respective authority and responsibilities;
For
per
sona
l use
onl
y

FOCUSED ON EXPANSION
19
■ Serve as an independent and objective party to review the financial information submitted by Management to the Board for issue to shareholders, regulatory authorities and the general public; and
■ Review the adequacy of the reporting and accounting controls of the Company.
The Audit Committee members are:
Wayne Kernaghan (Chairman)Terence WillsteedStephen Fabian (appointed 26 July 2013)Stephen Turner (resigned 26 July 2013)
The majority of the Committee members are independent and the Chairman of the audit committee, Mr Kernaghan, is not the Chairman of the Board.
Ernst & Young, the Company’s auditors, did not perform any other services other than their statutory audit duties.
A total of 3 Audit Committee meetings were held during the year and attended by all members of the Committee at the time of the meeting.
2.3. Risk Management CommitteeThe Board has nominated a Risk Management Committee. The Risk Management Committee members are:
Stephen Fabian (Chairman)Stephen TurnerTerence WillsteedAlan Doyle (appointed 26 July 2013)Rogério Caporali (appointed 1 August 2013)
The Risk Management Committee determines the Company’s risk profile and is responsible for overseeing and approving the risk management strategy and policies, internal compliance and internal control. The Company’s process of risk management, internal compliance and control includes:
■ Establishing the Company’s goals and objectives, and implementing and monitoring strategies and policies to achieve these goals and objectives;
■ Continuously identifying and reacting to risks that might impact upon the achievement of the Company’s goals and objectives, and monitoring the environment for emerging factors and trends that affect these risks;
■ Formulating risk management strategies to manage identified risks and designing and implementing appropriate risk management policies and internal controls; and
■ Monitoring the performance of, and continuously improving the effectiveness of, risk management systems and internal compliance and controls, including an ongoing assessment of the effectiveness of risk management and internal compliance and control.
To mitigate these risks, the Company has developed a range of risk management policies and procedures including monthly board meetings, weekly reports setting out operational and financial updates that are circulated to the Board, periodic audits, and a rigorous appraisal and approval process of projects performed by the Management and the Board.
It is the responsibility of both the Managing Director and the Chief Financial Officer to provide written assurances to the Board that in all material respects:
■ The financial reports submitted to the Board represent a true and fair view of the Company’s financial condition and operational results; and
■ The Company’s risk management and internal compliance and control system is operating efficiently and effectively.
There were 2 Risk Management Committee meetings were held during the year.
3. CODE OF CONDUCTThe Company has approved a Code of Conduct policy that is part of its Board Charter. The policy aims to encourage the appropriate standards of conduct and behaviour of the directors, officers, employees and contractors (collectively called the employees) of the Company.
The General principles of the Code ensure:
■ Employees have a duty to use due care and diligence in fulfilling the functions of their position and exercising the powers attached to their employment;
■ Employees must recognise that their primary responsibility is to the Company’s shareholders as a whole;
■ Employees must not take advantage of their position for personal gain, or the gain of their associates;
■ Directors have an obligation to be independent in their judgments;
■ Confidential information received by employees in the course of the exercise of their duties remains the property of the Company. Confidential information can only be released or used with specific permission from the Company; and
■ Employees have an obligation, to comply with the spirit as well as the letter, of the law and with the principles of the Code of Conduct;
Employees who breach the policies outlined in the Code may be subject to disciplinary action, including, in the case of serious breaches, dismissal.
The Company is committed to conducting all its operations in a manner which:
■ Protects the health and safety of all employees, contractors and community members;
■ Recognises, values and rewards the individual contribution of each employee;
■ Achieves a balance between economic development, maintenance of the environment and social responsibility;
■ Maintains good relationships with suppliers and the local community; and
■ Is honest, lawful and moral.
All employees (including Directors) are expected to act with the utmost integrity and objectivity, striving at all times to enhance the reputation and performance of the Company.
This policy is reviewed annually.
For
per
sona
l use
onl
y

CORPORATE GOVERNANCE STATEMENT (CONTINUED)
SAFM ANNUAL REPORT 201320
4. MARKET DISCLOSURESThe Company recognises the value of providing current and relevant information to its shareholders.
A Continuous Disclosure Policy is in place, which outlines the disclosure obligations of the Company as required under the Corporations Act 2001 and the ASX listing rules. The policy ensures that procedures are in place so that the stock market in which the Company’s securities are listed is properly informed of price sensitive matters.
The Managing Director and Company Secretary have been appointed as the Company’s disclosure officers responsible for implementing and administering the Continuous Disclosure Policy and have the primary responsibility for communication with shareholders.
Information is communicated to shareholders through:
■ Continuous disclosure to the relevant security exchanges of all material information;
■ Periodic disclosure through the annual report, interim financial report and quarterly reporting of exploration, production and corporate activities;
■ Notices of meetings and explanatory material;
■ Operational updates and progress reports;
■ The annual general meeting; and
■ The Company’s website.
The Company is committed to the promotion of investor confidence by ensuring that trading in the Company’s securities takes place in an efficient, competitive and informed market.
Electronic Communication
The Company believes that communicating with shareholders by electronic means, particularly through its website, is an efficient way of distributing information in a timely and convenient manner. The website contains the annual, half yearly and quarterly reports, ASX announcements and Company presentations. All website information will be continuously reviewed and updated to ensure that information is current, or appropriately dated and archived.
Written Communication and the Annual Report
Shareholders have been given the opportunity to elect to receive a printed or electronic copy of the annual report from the Company. In addition, the Company publishes its annual report on the Company’s website and notifies all shareholders of the web address where they can access the annual report.
Annual General Meetings
The Company recognises the rights of shareholders and encourages the effective exercise of those rights through the following means:
■ Notices of meetings are distributed to shareholders in accordance with the provisions of the Corporations Act 2001;
■ Notices of meeting and other meeting material are drafted in concise and clear language;
■ Shareholders are encouraged to use their attendance at meetings to ask questions on any relevant matter, with time being specifically set aside for shareholder questions;
■ Notices of meetings encourage participation in voting on proposed resolutions by lodgement of proxies, if shareholders are unable to attend the meeting;
■ It is general practice for a presentation on the Company’s activities to be made to shareholders at each annual general meeting; and
■ It is both the Company’s policy and the policy of the Company’s auditor for the lead engagement partner to be present at the annual general meeting and to answer any questions regarding the conduct of the audit and the preparation and content of the auditors’ report.
5. DIVERSITYThe Board of SAFM believe that diversity in the Board and Senior Management is necessary to achieve the Company’s objectives. The Board is currently assessing its current practices to account for diversity of key management personnel. In line with the recent ASX corporate governance proposals and depending on the results of the assessment, the Board will amend current policies to formalise diversity considerations into a plan to take into account diversity criteria including race, gender and geographic location.
As at 30 June 2013, 22% of the workforce was female with 1 female at senior management level.
6. CONFORMANCE WITH CORPORATE GOVERNANCE STANDARDSSAFM’s compliance with the governance standards imposed by the Corporations Act 2001 and the ASX Listing Rules and the recommendations provided by the Australian Securities Investments Commission (ASIC) policy and the ASX Corporate Governance Council’s Corporate Governance Principles and recommendations are summarised in this Corporate Governance Statement, the remuneration report, the directors’ report and the financial statements.
The listing Rules of the ASX require Australian listed Companies to report on the extent to which they meet the Corporate Governance principles and recommendations published by the ASX Corporate Governance Council and explain the reasons for non-compliance. The Board is required to consider the application of the relevant corporate governance principles, while recognising the departures from those principles, where appropriate in some circumstances. Compliance and any deviations from the Corporate Governance Standards and Recommendations have been disclosed in this Corporate Governance Statement, the remuneration report, the directors’ report and the financial statements.
Further information relating to the Company’s corporate governance practices and policies have been made publicly available on the Company’s website at www.safml.com/corporate-governance.php.
For
per
sona
l use
onl
y

FOCUSED ON EXPANSION
21
DIRECTORS’REPORT
The Directors present their report on the results of the Consolidated Entity, SAFM, for the year ended 30 June 2013.
DIRECTORSThe names of the Company’s Directors of the Group in office during the financial year and up until the date of this report are:
Name Current Position Date of appointment to Board Date of resignation
Terence Willsteed Non-Executive Chairman 11 November 2010 –
Stephen Turner Managing DirectorNon-Executive Director
1 March 2013 11 November 2010 – 28 February 2013 –
Stephen Fabian Non-Executive Director 11 November 2010 –
Alan Doyle Projects DirectorNon-Executive Director
1 March 20131 June 2011 – 28 February 2013 –
Wayne Kernaghan Non-Executive Director 26 June 2012 –
Rogério Caporali Non-Executive Director 1 August 2013 –
Phillip Hopkins Former Chief Executive Officer 16 November 2011 5 March 2013
PRINCIPAL ACTIVITIESSouth American Ferro Metals Limited owns 100% of the mineral rights and property of the Ponto Verde Iron Ore Project in Brazil. Ponto Verde is located in the heart of the Iron Ore Quadrilateral, 55 kilometres from the town of Belo Horizonte in the state of Minas Gerais. The Iron Ore Quadrilateral is a prolific iron ore mining area, and the Project is located proximate to established mining operations, iron and steel plants and existing infrastructure.
SAFM currently sells three iron ore products from its Ponto Verde mine to local steel producers in Brazil. The Company is currently completing its Bankable Feasibility Study (“BFS”) to expand Ponto Verde to a capacity of 8 Mtpa ROM throughput, from its current 1.5 Mtpa licenced capacity.
SAFM has a JORC Resource at Ponto Verde of 301.06 million tonnes at 40.65% Fe, including Measured Resources of 72.76 Mt at 41.06% Fe, Indicated Resources of 101.96 Mt at 40.68% and Inferred Resources of 126.3 Mt at 40.45% Fe.
REVIEW AND RESULTS OF OPERATIONSSet out below is a review of significant activities within SAFM for the year ended 30 June 2013:
JORC ResourceOn 24 April 2013, SAFM announced that the Ponto Verde JORC resource had increased to 301.06 Mt, broken down as follows:
Ponto Verde Iron Ore ProjectJORC Grade x Tonnage Table Cut-off Grade Applied: 20% Fe
Mineral Resources – Block Model: 50, 25, 10 (25,12.5, 5)
Resource ClassTonnes
(Mt) Fe (%) SiO2 (%) AI2O3 (%) Mn (%) P (%) LoI (%) FeO (%)
Measured 72.76 41.06 32.86 2.18 1.530 0.075 3.72 1.157
Indicated 101.96 40.68 31.27 3.24 1.748 0.064 4.10 1.381
Measured & Indicated 174.72 40.84 31.93 2.80 1.657 0.069 3.94 1.288
Inferred 126.34 40.45 31.64 3.64 1.564 0.063 4.10 2.325
Total Resource 301.06 40.65 31.79 3.22 1.611 0.066 4.02 1.807
The updated resource has been calculated based on drilling results to an average depth of 70 metres below the surface. However, exploration drilling at depth has highlighted that mineralisation extends to over 320 metres depth. Based on this, SAFM is currently planning a Phase III exploration program that would target the core of the deposit at depth.
For
per
sona
l use
onl
y

DIRECTORS’ REPORT (CONTINUED)
SAFM ANNUAL REPORT 201322
Expansion ProjectSAFM has signed an agreement with Logicamms Consultants Pty Ltd for the final scope of work of its BFS. LogiCamms Pty Limited are engaged to design a plant with ROM capacity of 8 Mtpa (dry tonnes) to produce high grade iron ore Concentrate (65.5% Fe) for the export market. The plant is being designed to produce a final Concentrate product measuring -0.6 mm at a grade of 65.5% Fe. The Company has commenced the first stage of the program, including the geotechnical and mining studies.
Design work is currently in progress on the following processes:
■ Primary crushing;
■ Scalping, secondary crushing and wet screening;
■ Rod mill;
■ WHIMS (4 roughers, 3 cleaners and 2 re-cleaners);
■ Concentrate thickening and filtration, stocking and loading; and
■ Tailings management.
Doubling production to a feed rate of 16 Mtpa throughput will be considered at a later stage and should be achievable by duplication of the current proposed plant. The process flow sheets are being developed from the knowledge of the ore body derived from the recently updated resource study process test work and the Company’s current production experience.
Resignation and Appointment of Chief Executive OfficerOn 28 October 2012, Mr Hopkins resigned from his position as SAFM’s CEO and resigned as a Director of the Company effective 5 March 2013. Mr Hopkins is succeeded by Mr Stephen Turner, who assumed the role of Managing Director effective from 1 March 2013.
Memorandum of Understanding Executed with Rail Corporation, MRS Logistica SAOn 1 March 2013, SAFM has entered into a memorandum of understanding with MRS to develop a logistics solution for the rail transportation of iron ore from SAFM’s Ponto Verde mine to the port terminals at Baia de Sepitiba in the state of Rio de Janeiro, approximately 400 km from Ponte Verde mine.
The Ponto Verde mine is located 15 km west of the Andaime branch line of the MRS system, which transports production from the Minas Itabaritos mines adjoining Ponto Verde.
MRS is one of the largest railway companies in Brazil. MRS operates the South-eastern Federal Railroad Network, which connects the states of Minas Gerais, Rio de Janeiro, and São Paulo to three of the most important seaports of Brazil, being Rio de Janeiro, Itaguaí and Santos.
SAFM plans to introduce its iron ore product to the export market upon the development of the haulage infrastructure to deliver its production to the rail system and the completion of its 8 Mpta
expansion program, anticipated in 2015. The rail transportation of the product will utilise existing MRS infrastructure for the rail and unloading of iron ore products, as well as incorporating the development of a new loading terminal.
Completion of On-site LaboratoryOn 16 April 2013, SAFM completed the construction of its on-site laboratory. The laboratory enables SAFM shorter turnaround of assay results ensuring the quality controls for product are maintained and improving mine planning.
Completion of Second Stage ConcentratorOn 26 April 2013, SAFM successfully completed construction of its second Concentrator within budget. The second Concentrator is designed to process the fines material that is currently being discharged from the existing beneficiation and medium intensity magnetic separation Concentrator plant. The grade is similar to that of the current Concentrate product and will be mixed with the current Concentrate (One) product and sold as a single product. SAFM’s Concentrate product has met strong demand in the market.
Financing Agreement with Deutsche BankOn 26 June 2013, SAFM entered into financing agreements with Deutsche Bank for a two year loan of US$15 million. The loan was fully drawn down on 25 July 2013 and there are no scheduled capital repayments until the date of maturity which is 25 July 2015.
FINANCIAL REVIEWSummary of income statement
30 June 2013
30 June 2012
Beneficiated production (tonnes) 626,134 506,632
Sales volumes (tonnes) * 598,202 523,378
$’000 $’000
Sales revenue 19,591 17,693
Cost of goods sold (12,274) (9,329)
Gross profit 7,317 8,364
Other (expenses)/income (4,841) (4,574)
Net finance income/(costs) 8 (2)
Profit before tax 2,484 3,788
Income tax (expense) (802) (1,479)
Net profit after tax 1,682 2,309
Net operating cash flow 2,242 3,814
EPS (cents per share) 0.41 0.68
* Sales revenue represents sales of beneficiated product and includes the sale of 7,734 tonnes of Concentrator Fines (2012: 279,861 tonnes of Concentrator Fines, Waste and Run of Mine).
For
per
sona
l use
onl
y

FOCUSED ON EXPANSION
23
Results of OperationSAFM has reported a net profit before tax of $2.48 million for the year ended 30 June 2013 (2012: profit: $3.79 million), on a Turnover of $19.59 million (2012: $17.69 million).
Production of beneficiated product experienced unexpected set backs between April 2013 and June 2013 which negatively impacted the financial results for the year. These difficulties were caused by a combination of factors including a late, prolonged and heavy rainy season that resulted in water reticulation problems, as well as poor water quality that impacted the performance of the Cone crusher. The operations also experienced longer than expected impediments to output of Concentrate 1 during commissioning of the Concentrator 2 plant.
SAFM has implemented effective and sustainable water management improvements and has installed additional maintenance programmes. Production has steadily improved after year end, with record monthly beneficiated production achieved in August 2013 and it is expected to continue to increase in the coming months.
The Group’s balance sheet remains strong with shareholder equity of $22.4 million. In July 2013, SAFM raised a two year loan of US$15 million from Deutsche Bank which was fully drawn down after year end. The loan facility, together with forecast cash to be generated from operations is expected to provide SAFM with the necessary funds to complete its Bankable Feasibility Study (“BFS”) for the proposed expansion to 8 million ROM tonnes during the current financial year.
SIGNIFICANT CHANGES IN THE STATE OF AFFAIRSOther than as noted above, there were no other significant changes in the state of affairs of the Group for the year ended 30 June 2013.
DIVIDENDSNo dividends were paid during the financial year and no recommendation is made as to payment of dividends.
AFTER REPORTING DATE EVENTSOn 25 July 2013, the Company secured a US$15 million two year loan facility with Deutsche Bank. The terms and conditions of this loan include:
■ Maturity date of 25 July 2015;
■ No capital repayments during the term of the loan;
■ 3% upfront fee;
■ Interest of 11% per annum payable quarterly in arrears; and
■ Fixed and floating security charges over assets of SAFM Limited, SAFM BVI and SAFM Mineracao Limitada.
As part of this facility, SAFM has issued Deutsche Bank 20.4 million 5 year options, representing 5% of its issued share capital at an exercise price of 7.3 cents per share.
Other than SAFM drawing down the finance loan facility with Deutsche Bank as outlined above, there were no other material
matters or circumstances that have arisen since 30 June 2013 which have significantly affected or may significantly affect:
■ the Company’s operations in future financial years; or
■ the result of those operations in future financial years; or
■ the Company’s state of affairs in future financial years.
FUTURE DEVELOPMENTS, PROSPECTS AND BUSINESS STRATEGIESOther than the above mentioned projects, the Group continues to focus on areas of production system improvements at the Ponto Verde mine, as well as expanding its customer base whilst maintaining strict management of its costs.
The Company has, and continues to assess, various acquisition opportunities and carefully evaluates these against its ability to add value to the potential asset, its cost of capital, as well as the strategic vision.
ENVIRONMENTAL ISSUESSAFM is committed to the responsible management of the environment in and around Ponto Verde and sustainable iron ore production. This includes compliance with the government ministerial agreement governing the site, and site-based operational activities. SAFM has employed a full-time public environmental officer at Ponto Verde who oversees and monitors compliance with the ministerial agreement. As part of that agreement SAFM has commenced construction of a park fence next to the Ponto Verde site. The Company is also monitoring closely the progress of government talks on the rehabilitation work of caves and ruins in the Aredes Park. Also in line with our government compliance commitment, on-ground rehabilitation work has commenced and will be completed in 2013.
Recent site-based environmental work has been focused on: plant discharge management and control; dust suppression on the road during the dry season; working conditions (noise, dust and vibration); management of erosion associated with through-property traffic; flora and fauna management; and joint governmental studies. Material progress has been made in each of these areas with formal planning and procedures being developed in a number of specific areas in order to ensure long-term sustainability.
COMPETENT PERSONSInformation in this statement that relates to the JORC resource at Ponto Verde is based on information compiled by Mr Bernardo Hurta de C Viana (Phase I) and Mr Porfirio Cabaleiro (Phase II) both of Coffey Mining (Brazil). Both are Members of the Australasian Institute of Mining and Metallurgy. Mr Viana and Mr Cabaleiro have sufficient experience which is relevant to the style of mineralisation and type of deposit under consideration and to the activity which they have each undertaken to qualify as a “Competent Person” as defined in the 2004 Edition of the Australasian Code for Reporting of Exploration Results, Mineral Resources and Ore reserves (the JORC Code). Mr Viana and Mr Cabaleiro have consented to the inclusion in this report, based on their information in the form and context in which they appear.
For
per
sona
l use
onl
y

DIRECTORS’ REPORT (CONTINUED)
SAFM ANNUAL REPORT 201324
DIRECTORS’ QUALIFICATIONS AND EXPERIENCEThe Directors’ qualifications and experience are set out below. The details of their specific responsibilities in the Company are outlined in the Corporate Governance Statement.
Non-Executive Directors
Terence WillsteedNon-Executive Chairman
Mr Willsteed holds a Bachelor of Engineering (Mining) with Honours and a Bachelor of Arts. He is a Fellow of the Australasian Institute of Mining and Metallurgy, a Registered Member of the Society of Mining Engineers and a Member of the Australian Institute of Company Directors. Since 1973 he has been the principal of consulting mining engineers, Terence Willsteed & Associates.
Mr Willsteed’s 50 year career in the mining industry has included senior operational and engineering management positions with Zinc Corporation, Mt Isa Mines Limited and Consolidated Goldfields Australia Limited. His recent public directorships include Niuminco Group Limited, International Ferro Metals Limited, Takoradi Limited, Vantage Goldfields Limited and Goldsearch Limited. In his consulting experience, Mr Willsteed has been involved in the assessment and development of a wide range of mineral, coal and oil shale projects, and has participated in the management of developing and operating mineral projects both in Australia and internationally.
Stephen FabianNon-Executive Director
Mr Fabian is the founder of SAFM Brazil, and is a qualified mining engineer with over 25 years of experience in the mining finance sector. His career spans across the mining and finance industries and includes past positions with County NatWest in Australia and London and Rock Capital Partners in the United Kingdom.
Mr Fabian was instrumental in the founding of Ferrous Resources Limited, a company developing iron ore properties in Brazil. He is an advisor to the Baker Steel Resource Trust (“BSRT”), which is listed on the London Stock Exchange. BSRT presently holds an investment in SAFM. He is a Non-Executive Director of Kincora Copper Limited, REB Gold and Ironstone Resources.
Wayne KernaghanNon-Executive Director
Mr Kernaghan is a member of the Institute of Chartered Accountants in Australia, a Fellow of the Australian Institute of Company Directors, and member of the Institute of Chartered Secretaries and Administrators.
Mr Kernaghan brings to SAFM more than 25 years’ experience in the mining industry as a Director and Company Secretary with a number of resources companies listed on the Australian Securities Exchange and London Stock Exchange. During the past three years Mr Kernaghan has held and is currently a director of Cullen Resources Limited, Gulf Industrials Limited and Farmworks Australia Limited (from 19 February 2010 to 24 August 2011).
Rogério CaporaliNon-Executive Director (appointed 1 August 2013)
Mr Caporali is a Graduate in Physics and Mining Engineering from the Universidade Federal de Minas Gerais (“UFMG”). He has completed graduate specialization studies for Technical and Economic Assessment for Mineral Projects as well as graduating from Executive Development Program at Fundação Dom Cabral in Belo Horizonte. Mr Caporali completed a Columbia Business Executive Program in the United States in 2002.
Mr Caporali has extensive experience in the management of large mines in Brazil, and has held numerous senior management positions with Vale Group. In 2004, Mr Caporali was invited by Companhia Siderúrgica Nacional (“CSN”) to join its mining expansion team, where he held the position of Director of CSN mines, CEO at Companhia de Fomento Mineral e Participações (“CFM”) and COO at Nacional Minérios (“NAMISA”).
Executive Directors
Stephen TurnerManaging Director (from 1 March 2013)
Non-Executive Director (up to 28 February 2013)
Mr Turner is a Chartered Accountant. He was the Chief Executive Officer of International Ferro Metals Limited for seven years. International Ferro Metals Limited is a South African based integrated mining and smelting company which produces over 3% of global ferrochrome supply and is listed on the London Stock Exchange. Mr Turner is now its Non-Executive Deputy Chairman.
Mr Turner is the Non-Executive Chairman of Vantage Goldfields Limited, an Australian gold company operating in South Africa, and a Non-Executive Director of Iluka Resources Limited, the world’s largest producer of zircon. Mr Turner has delivered resource projects in Australia, Southern Africa, Fiji, New Caledonia and the Solomon Islands. He was a founding director of the Australian subsidiary of PSG Investment Bank, then South Africa’s fifth largest investment bank.
For
per
sona
l use
onl
y

FOCUSED ON EXPANSION
25
Alan DoyleExecutive Director (appointed 1 March 2013)
Non-Executive Director (to 28 February 2013)
Mr Doyle graduated as a geologist in 1979 and worked as a field geologist before entering the financial services industry in 1984. In the early 1990’s, Mr Doyle founded Turnbull Doyle Resources, a private equity and investment banking company that took positions in emerging resource companies. During his time at Turnbull Doyle Resources, Mr Doyle identified and managed these assets prior to either a trade sale or float on international stock exchanges. Several of these early assets in West Africa, Australia and Russia have become significant mines and projects. More recently, Mr Doyle’s company, Africa Pacific Capital, has founded and funded a number of early stage mining ventures principally in South Africa and South America which have also grown into significant mining companies.
Phillip HopkinsChief Executive Officer (resigned 5 March 2013)
Mr Hopkins holds a Bachelor of Engineering (Mining) and is a graduate of the Banff School of Advance Management. Mr Hopkins is a registered professional engineer. Mr Hopkins’ 30 years in the mining industry has included experience in technical, projects, operations and corporate arenas. His career has included work with Cominco Limited, Falconbridge Limited, Placer Dome Limited, BHP Billiton Limited and St Barbara Limited and has included international postings in Canada, Papua New Guinea, South Africa and Australia. Mr Hopkins’ experience includes both underground and open pit mining and covers the commodities of Copper, Nickel, Gold and Iron Ore. He resigned as director and CEO of the Company on 5 March 2013.
Senior Management
Dion CohenChief Financial Officer and Company Secretary
After qualifying as a Chartered Accountant at Ernst & Young in 1995, Mr Cohen was involved in corporate finance and private equity. His experience ranges from mergers and acquisition structuring, to capital raisings and management of mining companies in private equity ownership. Mr Cohen held the position of Chief Financial Officer of International Ferro Metals Limited; a company listed on the Main Board of the London Stock Exchange and has held board positions in both listed and unlisted companies.
Jairo LealChief Operating Officer (appointed 3 December 2012)
Mr Leal is a qualified geologist and has specialising in geostatistics. He has completed a MBA and has over 25 years’ experience in the mining industry in Brazil. Mr Leal has worked with Namisa (COO), Kinross Gold (VP and General Manager) and Vale (General Manager Mining). He has extensive experience in operations, community relations, mine logistics and processing.
Helvécio José Veloso PiresChief Operating Officer (resigned on 7 September 2012)
Mr Pires holds a degree in mining engineering and a postgraduate degree in environmental engineering from the University of Minas Gerais. He has also completed an MBA in Business Management from the Dom Cabraol Foundation. Mr Pires has more than 23 years’ experience in mine planning, operations and environmental management, working most recently in resources and reserves certification at Runge/Pincock, an Australian based mining consulting company. Over his career, Mr Pires has worked with some of the largest iron ore producers in Brazil, including Vale, MMX, Caemi and MBR.
José Márcio PaixãoChief Development Officer
Mr Paixão holds a degree in Mining engineering from the University of Minas Gerais. He has an MSC in chemical engineering and a PhD in Metallurgy/Electrochemistry from Paris VI University in France. He has worked in mining and metallurgy for more than 26 years, including spending more than a decade with Vale, the world’s biggest iron ore producer. Most recently, he worked as Chief Operating Officer for Vancouver-based Earth XM Mining Corp.
Eduardo FreitasChief Commercial Officer
Mr Freitas holds a Bachelor of Economics degree from the University of Sao Joao del Rei. He worked at Companhia Siderugica Nacional (“CSN”), a major steel-maker in Brazil for over 8 years in the area of iron ore exportation. In 2009 he took on a role as economic specialist for NAMISA, a jointly controlled company of CSN.
For
per
sona
l use
onl
y
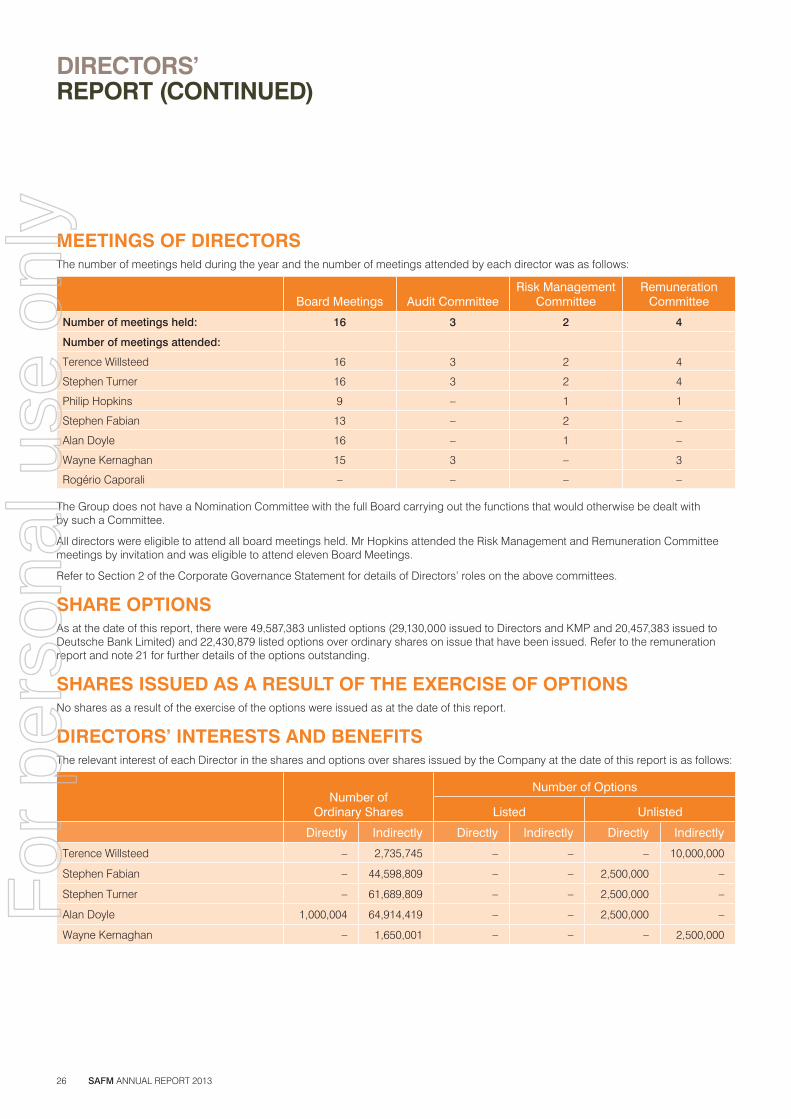
DIRECTORS’ REPORT (CONTINUED)
SAFM ANNUAL REPORT 201326
MEETINGS OF DIRECTORSThe number of meetings held during the year and the number of meetings attended by each director was as follows:
Board Meetings Audit CommitteeRisk Management
CommitteeRemuneration
Committee
Number of meetings held: 16 3 2 4
Number of meetings attended:
Terence Willsteed 16 3 2 4
Stephen Turner 16 3 2 4
Philip Hopkins 9 – 1 1
Stephen Fabian 13 – 2 –
Alan Doyle 16 – 1 –
Wayne Kernaghan 15 3 – 3
Rogério Caporali – – – –
The Group does not have a Nomination Committee with the full Board carrying out the functions that would otherwise be dealt with by such a Committee.
All directors were eligible to attend all board meetings held. Mr Hopkins attended the Risk Management and Remuneration Committee meetings by invitation and was eligible to attend eleven Board Meetings.
Refer to Section 2 of the Corporate Governance Statement for details of Directors’ roles on the above committees.
SHARE OPTIONSAs at the date of this report, there were 49,587,383 unlisted options (29,130,000 issued to Directors and KMP and 20,457,383 issued to Deutsche Bank Limited) and 22,430,879 listed options over ordinary shares on issue that have been issued. Refer to the remuneration report and note 21 for further details of the options outstanding.
SHARES ISSUED AS A RESULT OF THE EXERCISE OF OPTIONSNo shares as a result of the exercise of the options were issued as at the date of this report.
DIRECTORS’ INTERESTS AND BENEFITSThe relevant interest of each Director in the shares and options over shares issued by the Company at the date of this report is as follows:
Number of Ordinary Shares
Number of Options
Listed Unlisted
Directly Indirectly Directly Indirectly Directly Indirectly
Terence Willsteed – 2,735,745 – – – 10,000,000
Stephen Fabian – 44,598,809 – – 2,500,000 –
Stephen Turner – 61,689,809 – – 2,500,000 –
Alan Doyle 1,000,004 64,914,419 – – 2,500,000 –
Wayne Kernaghan – 1,650,001 – – – 2,500,000
For
per
sona
l use
onl
y
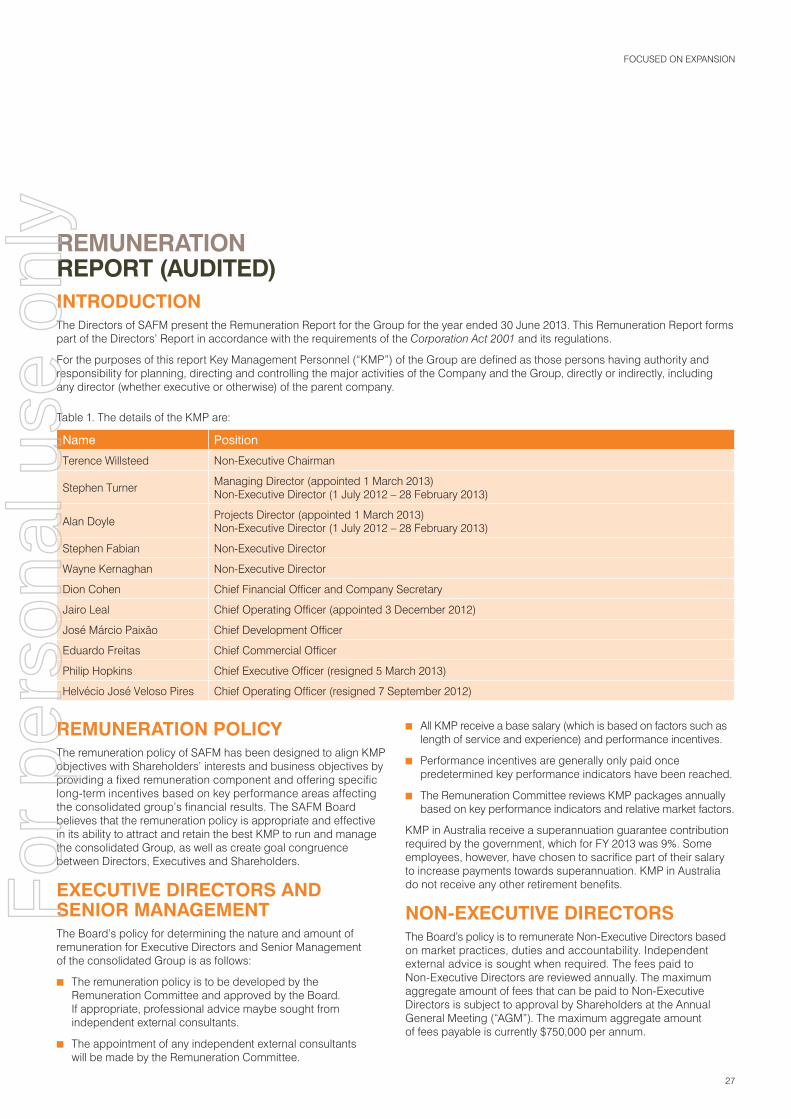
FOCUSED ON EXPANSION
27
REMUNERATIONREPORT (AUDITED)INTRODUCTIONThe Directors of SAFM present the Remuneration Report for the Group for the year ended 30 June 2013. This Remuneration Report forms part of the Directors’ Report in accordance with the requirements of the Corporation Act 2001 and its regulations.
For the purposes of this report Key Management Personnel (“KMP”) of the Group are defined as those persons having authority and responsibility for planning, directing and controlling the major activities of the Company and the Group, directly or indirectly, including any director (whether executive or otherwise) of the parent company.
Table 1. The details of the KMP are:
Name Position
Terence Willsteed Non-Executive Chairman
Stephen Turner Managing Director (appointed 1 March 2013)Non-Executive Director (1 July 2012 – 28 February 2013)
Alan Doyle Projects Director (appointed 1 March 2013)Non-Executive Director (1 July 2012 – 28 February 2013)
Stephen Fabian Non-Executive Director
Wayne Kernaghan Non-Executive Director
Dion Cohen Chief Financial Officer and Company Secretary
Jairo Leal Chief Operating Officer (appointed 3 December 2012)
José Márcio Paixão Chief Development Officer
Eduardo Freitas Chief Commercial Officer
Philip Hopkins Chief Executive Officer (resigned 5 March 2013)
Helvécio José Veloso Pires Chief Operating Officer (resigned 7 September 2012)
REMUNERATION POLICYThe remuneration policy of SAFM has been designed to align KMP objectives with Shareholders’ interests and business objectives by providing a fixed remuneration component and offering specific long-term incentives based on key performance areas affecting the consolidated group’s financial results. The SAFM Board believes that the remuneration policy is appropriate and effective in its ability to attract and retain the best KMP to run and manage the consolidated Group, as well as create goal congruence between Directors, Executives and Shareholders.
EXECUTIVE DIRECTORS AND SENIOR MANAGEMENTThe Board’s policy for determining the nature and amount of remuneration for Executive Directors and Senior Management of the consolidated Group is as follows:
■ The remuneration policy is to be developed by the Remuneration Committee and approved by the Board. If appropriate, professional advice maybe sought from independent external consultants.
■ The appointment of any independent external consultants will be made by the Remuneration Committee.
■ All KMP receive a base salary (which is based on factors such as length of service and experience) and performance incentives.
■ Performance incentives are generally only paid once predetermined key performance indicators have been reached.
■ The Remuneration Committee reviews KMP packages annually based on key performance indicators and relative market factors.
KMP in Australia receive a superannuation guarantee contribution required by the government, which for FY 2013 was 9%. Some employees, however, have chosen to sacrifice part of their salary to increase payments towards superannuation. KMP in Australia do not receive any other retirement benefits.
NON-EXECUTIVE DIRECTORSThe Board’s policy is to remunerate Non-Executive Directors based on market practices, duties and accountability. Independent external advice is sought when required. The fees paid to Non-Executive Directors are reviewed annually. The maximum aggregate amount of fees that can be paid to Non-Executive Directors is subject to approval by Shareholders at the Annual General Meeting (“AGM”). The maximum aggregate amount of fees payable is currently $750,000 per annum.
For
per
sona
l use
onl
y

DIRECTORS’ REPORT (CONTINUED)
SAFM ANNUAL REPORT 201328
LONG TERM INCENTIVES (“LTI”)The Company has an Incentive Option Scheme (“Scheme”) as a long -term incentive scheme to attract, retain and motivate eligible employees by offering eligible participants the opportunity to Share in the Company’s future performance through awards to acquire ordinary shares in the Company.
Incentives offered in the form of options or rights are intended to align the interests of the KMP and the Company with those of the Shareholders. In this regard, KMP are prohibited from limiting risk attached to those instruments by use of derivatives or other means.
Under the Scheme, the Board may offer options to full or part-time employees, Directors and consultants of the Company or an associate body corporate of the Company, which the Board determines, should be entitled to participate in the Scheme.
Each option exercised entitles the holder to subscribe for one Share. The shares issued upon exercise of the options will rank parri passu and carry the same rights and entitlements as the ordinary shares on issue.
On 16 November 2012, Shareholders approved the grant of 10 million options to the Directors of the Company to subscribe for up to a total of 10 million ordinary shares in the Company, in accordance with the Scheme rules. In addition, Share options to subscribe for 2.5 million ordinary shares were granted to Mr Cohen on 20 December 2012.
Section C sets out the vesting terms and exercise conditions of these unlisted options.
SHORT TERM INCENTIVES (“STI”) AND BENEFITSThe Board is responsible for assessing short term incentives for KMP. Individual key performance indicators are set for each executive at the commencement of each financial year under the STI.
The current incentive STI allows for incentive payments of up to 40% of annual base salary on the specific achievement against key performance indicators set for each executive. The key performance indicators have been chosen to drive overall performance in the current year, including both financial performance and delivery against measures that impact the long-term sustainability of the Group.
The incentive payment is discretionary, subject to individual performance targets being reached and contingent to the executive remaining an employee with the company.
A total of $58,677 was awarded as short term incentives in the year ended 30 June 2013. (2012: $125,898).
USE OF REMUNERATION CONSULTANTSTo ensure the Remuneration Committee is fully informed when making remuneration decisions, it may seek external remuneration advice. The Board did not require external remuneration advice during the year ended 30 June 2013.
REMUNERATION REPORT APPROVAL AT 2012 AGMThe remuneration report for the year ended 30 June 2012 was approved by shareholders at the Company’s AGM which was held on 16 November 2012.
SHARE TRADING AND MARGIN LOANS BY DIRECTORS AND EXECUTIVESDirectors, executives and employees are prohibited from:
a) Short term trading: trading in securities (or an interest in securities) on a short-term trading basis other than when a director, employee or executive exercises employee options or performance rights to acquire shares at the specified exercise price. Short-term trading includes buying and selling securities within a 3 month period, and entering into other short-term dealings (e.g. forward contracts);
b) Hedging unvested awards: trading in securities which operate to limit the economic risk of an employee’s holdings of unvested securities granted under an employee incentive plan; or
c) Short positions: trading in securities which enable an employee to profit from or limit the economic risk of a decrease in the market price of shares.
KMP may not include their securities in a margin loan portfolio or otherwise trade in securities pursuant to a margin lending arrangement without first obtaining the consent of the Chairman. Such dealing would include:
a) Entering into a margin lending arrangement in respect of securities;
b) Transferring securities into an existing margin loan account; and
c) Selling securities to satisfy a call pursuant to a margin loan except where they have no control over such sale.
The Company may, at its discretion, make any consent granted in accordance with the above paragraph conditional upon such terms and conditions as the Company sees fit (for example, in regards to the circumstances in which the securities may be sold to satisfy a margin call).
For
per
sona
l use
onl
y

FOCUSED ON EXPANSION
29
A. DETAILS OF REMUNERATIONTable 2: Details of remuneration of the Directors and KMP of the Group (as defined by AASB 124 Related Party Disclosures) and specified executives are set out below:
Fixed STI LTI TotalProportion of Remuneration
Year
Salary, fees and
leave$
Other Fees1
$
Superan- nuation2
$
Incentive payments
$
Fair value of Option
Rights (equity
settled)3
$ $Fixed
%STI
%LTI%
Non-Executive Directors
Terence Willsteed 2013 2012
230,000 130,000
– –
– –
– –
75,468 70,628
305,468 200,628
75 65
– –
25 35
Stephen Fabian 2013 2012
65,000 65,000
– –
– –
– –
– 35,314
65,000 100,314
100 65
– –
– 35
Stephen Turner 2013 2012
39,759 59,635
– –
3,577 5,365
– –
– 35,314
43,336 100,314
100 65
– –
– 35
Alan Doyle 2013 2012
43,328 65,000
85,000 49,500
– –
– –
12,578 –
140,906 114,500
91 100
– –
9 –
Wayne Kernaghan 2013 2012
59,633 623
– –
5,367 56
– –
37,734 –
102,734 679
63 100
– –
37 –
Philip Re 2013 2012
– 59,583
– –
– –
– –
– 49,440
– 109,023
– 55
– –
– 45
Paul Lloyd 2013 2012
– 59,583
– –
– –
– –
– 49,440
– 109,023
– 55
– –
– 45
Total Non-Executive Directors
2013 2012
437,720 439,424
85,000 49,500
8,944 5,421
– –
125,780 240,136
657,444 734,481
Executive Directors
Stephen Turner 2013 2012
128,457 –
– –
10,733 –
– –
– –
139,191 –
100 –
– –
– –
Alan Doyle 2013 2012
129,996 –
– –
– –
– –
25,156 –
155,152 –
84 –
– –
16 –
Phillip Hopkins 2013 2012
307,582 431,856
– –
30,963 50,000
– 56,250
(16,561) 105,546
321,984 643,652
100 75
– 9
– 16
Total Executive Directors
2013 2012
566,035 431,856
– –
41,696 50,000
– 56,250
8,595 105,546
616,326 643,652
Mr Re and Mr Lloyd resigned on 28 May 2012.Mr Turner was appointed Managing Director of the Company from 1 March 2013.Mr Doyle was appointed an Executive Director of the Company from 1 March 2013.Mr Hopkins resigned as Director of the Company on 5 March 2013.
1. These amounts represent additional work undertaken for the Company, including accounting, administration and management services charged.
2. Includes superannuation payment in Australia and any voluntary fee sacrifice to superannuation.
3. The Share-Based Payments comprise of options over ordinary shares in the Company and have been valued based on the Binomial options pricing model using a Monte Carlo simulation analysis.
For
per
sona
l use
onl
y

DIRECTORS’ REPORT (CONTINUED)
SAFM ANNUAL REPORT 201330
A. DETAILS OF REMUNERATION (CONTINUED)Table 2: Details of remuneration of the Directors and KMP of the Group (as defined by AASB 124 Related Party Disclosures) and specified executives are set out below (continued):
Fixed STI LTI TotalProportion of Remuneration
Year
Salary, fees and
leave$
Other Fees1
$
Superan- nuation2
$
Incentive payments
$
Fair value of Option
Rights (equity
settled)3
$ $Fixed
%STI
%LTI%
Senior Management
Dion Cohen 20132012
184,864175,000
––
18,063–
11,88110,938
37,73435,314
252,542221,252
8079
55
1516
Jairo Leal4 20132012
153,755–
––
––
15,376–
––
169,131–
91–
9–
––
José Paixão4 20132012
194,152155,211
––
––
20,05525,597
––
214,207180,808
9186
914
––
Eduardo Freitas4 20132012
187,707142,846
––
– 8,02220,168
––
195,729163,014
9688
412
––
Helvécio Pires4 20132012
43,419153,033
––
––
3,34312,945
––
46,762165,978
9392
78
––
Rodrigo Branco4 20132012
–37,033
––
––
––
––
–37,033
–100
––
––
Glauco Mol4 20132012
–77,006
––
––
––
––
–77,006
–100
––
––
Total Senior Management
20132012
763,897740,129
––
18,063–
58,67769,648
37,73435,314
878,401838,091
Total Remuneration
20132012
1,767,6521,611,409
85,00049,500
68,70355,421
58,677125,898
172,109380,996
2,152,1412,223,224
Mr Branco resigned on 31 July 2011, but continued to offer consulting services to the Company to 30 September 2011.Mr Mol’s contract was terminated on 30 September 2011.
1. These amounts represent additional work undertaken for the Company, including accounting, administration and management services charged.
2. Includes superannuation payment in Australia and any voluntary fee sacrifice to superannuation.
3. The Share-Based Payments comprise of options over ordinary shares in the Company and have been valued based on the Binomial options pricing model using a Monte Carlo simulation analysis.
4. The remuneration in Brazil has been converted at an exchange rate for the year ended of 30 June 2013 of R$/$:0.4775 at 30 June 2013, being R$:1,310,699 ($625,859).The remuneration in Brazil has been converted at an exchange rate for the year ended of 30 June 2012 of R$/$:0.5446 at 30 June 2012, being R$:1,145,500 ($623,839).
For
per
sona
l use
onl
y

FOCUSED ON EXPANSION
31
B. SERVICE AGREEMENTSThe following should be read with reference to the STI, LTI structure and Table 2 above.
Mr Terence WillsteedNon-Executive Chairman
The Company entered into a service agreement on 11 November 2010 with Patermat Pty Limited, a company of which Mr Willsteed is a director and Shareholder. Under the terms of the present contract:
■ Mr Willsteed is paid a service fee, in his current role as Chairman, of $230,000 per annum. Additional consulting work for the Company undertaken by Mr Willsteed for more than four days in any month is paid at the rate of $450 per hour.
■ Patermat Pty Limited was granted 5,000,000 unlisted equity settled Share options through the Company’s Incentive Option Scheme during the year ended 30 June 2013, as approved by shareholders. The terms of the options are set out in section C of this remuneration report.
■ The service agreement may be terminated at any time by Mr Willsteed giving the Company not less than three month’s written notice. The Company may terminate the agreement without cause by providing not less than three months written notice or by making a lump sum payment in lieu of any such period of notice. In the event of a material breach of any of the terms of the agreement or serious misconduct, the Company can terminate Mr Willsteed’s employment at any time without any compensation payable.
Mr Philip HopkinsChief Executive Officer (resigned 5 March 2013)
The Company entered into a service agreement with Mr Hopkins on 9 May 2011. Mr Hopkins tendered his resignation with the Company on 5 November 2012 and his employment with the Company terminated on 30 April 2013. Mr Hopkins resigned as Executive Director and CEO of the Company on 5 March 2013.
■ Mr Hopkins was paid a salary of $450,000 (incl superannuation) per annum.
■ Mr Hopkins was not granted any options during the year ended 30 June 2013.
■ As part of Mr Hopkins termination agreement, he was entitled to the first and second tranche of options in terms of the Employee Share Option Scheme. These options vested on 23 December 2011. Mr Hopkins had until 30 June 2013 to exercise any rights in terms of these options and the scheme, which he did not exercise and therefore the options lapsed. The terms of the options are set out in section C of this remuneration report.
■ The service agreement was able to be terminated at any time by Mr Hopkins giving the Company not less than six month’s written notice. The Company was able to terminate the agreement without cause by providing not less than six months written notice or by making a lump sum payment in lieu of any such period of notice. In the event of a material breach of any of the terms of the agreement or serious misconduct, the Company was able to terminate Mr Hopkins’ employment at any time without any compensation payable.
Mr Stephen FabianNon-Executive Director
Mr Fabian led SAFM through its listing on the ASX in November 2010. Mr Fabian continues to serve as a Non-Executive Director with effect from 1 July 2011. Under the terms of the present contract as Non-Executive Director:
■ Mr Fabian is paid a service fee of $65,000 per annum.
■ Mr Fabian will provide his services as director for two days per month.
■ Mr Fabian was not granted any options during the year ended 30 June 2013.
■ The service agreement may be terminated at any time by Mr Fabian giving the Company not less than three month’s written notice. The Company may terminate the agreement without cause by providing not less than three months written notice or by making a lump sum payment in lieu of any such period of notice. In the event of a material breach of any of the terms of the agreement or serious misconduct, the Company can terminate Mr Fabian’s employment at any time without any compensation payable.
Mr Stephen TurnerManaging Director (commenced from 1 March 2013)
Non-Executive Director (11 November 2010 to 28 February 2013)
The Company entered into a service agreement with Mr Turner with effect from 1 March 2013. Under the terms of the present contract:
■ Mr Turner is paid a salary, in his current role as Managing Director, of $390,000 per annum (inclusive of superannuation) from 1 March 2013.
■ Mr Turner was paid a service fee as Non-Executive Director of the Company of $65,000 per annum to 28 February 2013.
■ Mr Turner was not granted any options during the year ended 30 June 2013.
■ The service agreement may be terminated at any time by Mr Turner giving the Company not less than three month’s written notice. The Company may terminate the agreement without cause by providing not less than six months written notice or by making a lump sum payment, including any bonuses, in lieu of any such period of notice. In the event of a material breach of any of the terms of the agreement or serious misconduct, the Company can terminate Mr Turner’s employment at any time without any compensation payable.F
or p
erso
nal u
se o
nly

DIRECTORS’ REPORT (CONTINUED)
SAFM ANNUAL REPORT 201332
Mr Alan DoyleExecutive Director (commenced from 1 March 2013)
Non-Executive Director (1 June 2011 to 28 February 2013)
The Company entered into a service agreement with Mr Doyle with effect from 1 March 2013. Under the terms of the present contract:
■ Mr Doyle is paid a salary, in his current role as Executive Director, of $390,000 per annum from 1 March 2013.
■ Mr Doyle was paid a service fee of $65,000 per annum to 28 February 2013.
■ Mr Doyle was granted 2,500,000 unlisted equity settled Share options through the Company’s Incentive Option Scheme during the year ended 30 June 2013. The terms of the options are set out in section C of this remuneration report.
■ The service agreement may be terminated at any time by Mr Doyle giving the Company not less than three month’s written notice. The Company may terminate the agreement without cause by providing not less than six months written notice or by making a lump sum payment, including any bonuses, in lieu of any such period of notice. In the event of a material breach of any of the terms of the agreement or serious misconduct, the Company can terminate Mr Doyle’s employment at any time without any compensation payable.
Mr Wayne KernaghanNon-Executive Director
The Company entered into a service agreement with Mr Kernaghan on 26 June 2012. Under the terms of the present contract:
■ Mr Kernaghan is paid a salary of $65,000 per annum inclusive of superannuation.
■ Mr Kernaghan will provide his services as director for two days per month.
■ Mr Kernaghan was granted 2,500,000 unlisted equity settled Share options through the Company’s Incentive Option Scheme during the year ended 30 June 2013. The terms of the options are set out in section C of this remuneration report.
■ The service agreement may be terminated at any time by Mr Kernaghan giving the Company not less than three month’s written notice. The Company may terminate the agreement without cause by providing not less than three months written notice or by making a lump sum payment in lieu of any such period of notice. In the event of a material breach of any of the terms of the agreement or serious misconduct, the Company can terminate Mr Kernaghan’s employment at any time without any compensation payable.
Mr Dion CohenChief Financial Officer and Company Secretary
The Company entered into a service agreement with effect from 1 October 2012. Mr Cohen previously held a consultancy agreement with the Company. Under the terms of the present contract:
■ Mr Cohen is paid salary of $148,000 per annum for his services as Chief Financial Officer and $50,000 per annum for his services as Company Secretary. Both these amounts are inclusive of superannuation.
■ In respect of Mr Cohen’s service, an incentive payment of $11,881 was accrued at 30 June 2013. The incentive payment was based on certain performance targets being met.
■ Mr Cohen was granted 2,500,000 unlisted equity settled Share options through the Company’s Incentive Option Scheme during the year ended 30 June 2013. The terms of the options are set out in section C of this remuneration report.
■ The service agreement may be terminated at any time by Mr Cohen giving the Company not less than six month’s written notice. The Company may terminate the agreement without cause by providing not less than twelve months written notice or by making a lump sum payment in lieu of any such period of notice. In the event of a material breach of any of the terms of the agreement or serious misconduct, the Company can terminate Mr Cohen employment at any time without any compensation payable.
Mr Jairo LealChief Operating Officer (appointed 3 December 2012)
The Company entered into a fixed term contract with Mr Leal on 3 December 2012. The employment term was for 12 months, subject to termination provisions. After lapsing of the 12 month period, the contract may be extended for an additional period of 12 months. Under the terms of the contract:
■ Mr Leal was paid a service fee of R$552,000 ($263,580) per annum for his services as Chief Operating Officer.
■ In respect of Mr Leal’s service, an incentive payment of R$32,200 ($15,376) was accrued at 30 June 2013. The incentive payment was based on certain performance targets being met.
■ The service contract may be terminated by Mr Leal by giving the Company not less than three months written notice. The Company may terminate the agreement without cause by providing not less than three months written notice or by making a lump sum payment in lieu of any such period of notice. SAFM is able to terminate the service contract without notice if Mr Leal is in breach of the service contract without making any compensation payable.
For
per
sona
l use
onl
y

FOCUSED ON EXPANSION
33
Mr Helvécio PiresChief Operating Officer (resigned 7 September 2012)
The Company entered into a fixed term contract with Mr Pires on 17 August 2011. The employment term was for 12 months, subject to termination provisions. Mr Pires resigned on 7 September 2012. Under the terms of his contract he was paid:
■ Mr Pires was paid a consulting fee of R$281,000 ($153,033) per annum for his services as Chief Operating Officer.
■ In respect of Mr Pires’ service, an incentive payment of R$7,000 ($3,343) was paid. The incentive payment was based on certain performance targets being met.
■ The service contract was able to be terminated by SAFM giving ninety days’ notice in writing, or by SAFM paying Mr Pires six months’ equivalent of the aggregate service fee payable from the end of the month in which such termination were to become effective. SAFM was also able to terminate the service contract without notice if Mr Pires is in breach of the service contract without making any termination payment.
Mr José Márcio PaixãoChief Development Officer
The Company entered into a fixed term contract with Mr Paixão on 17 August 2011. The employment term is for 12 months, subject to termination provisions. After lapsing of the 12 month period, the contract may be extended for an additional period of 12 months. Under the terms of the contract:
■ Mr Paixão is paid a service fee of R$420,000 ($200,550) per annum for his services as Chief Development Officer.
■ In respect of Mr Paixão’s service, an incentive payment of R$42,000 ($20,055) was accrued at 30 June 2013. The incentive payment was based on certain performance targets being met.
■ The service contract may be terminated by Mr Paixão by giving ninety days’ notice in writing. The Company may terminate the agreement without cause by paying Mr Paixão six months’ equivalent of the aggregate service fee payable from the end of the month in which such termination becomes effective. SAFM may also terminate the service contract without notice if Mr Paixão is in breach of the service contract without making any termination payment.
Mr Eduardo FreitasChief Commercial Officer
The Company entered into a fixed term employment agreement with Mr Freitas on 1 February 2013. The employment term is for 12 months, subject to termination provisions. After lapsing of the 12 month period, the contract may be extended for an additional period of 12 months. Under the terms of the present agreement:
■ Mr Freitas is paid a service fee of R$420,000 ($200,550) per annum for his services as Chief Commercial Officer.
■ In respect of Mr Freitas’ service, an incentive payment of R$16,800 ($8,022) was accrued at 30 June 2013. The incentive payment was based on certain performance targets being met.
■ The service contract may be terminated by giving ninety days’ notice in writing by either party. SAFM may also terminate the service contract without notice if Mr Freitas is in breach of the service contract without making any termination payment.
For
per
sona
l use
onl
y

DIRECTORS’ REPORT (CONTINUED)
SAFM ANNUAL REPORT 201334
C. SHARE BASED PAYMENTS
Unlisted Share Options Granted and Vested for 30 June 2013The following table sets out the details of unlisted share options granted and vested as of 30 June 2013.
No unlisted share options were exercised during the year ended 30 June 2013.
TrancheGranted number
of options Grant date
Fair value per Option at grant date (note 21)
Exercise price per Option
Non-Executive DirectorsTerence Willsteed 1 1,666,667 24/2/2011 $0.050 $0.36
2 1,666,667 24/2/2011 $0.030 $0.363 1,666,666 24/2/2011 $0.020 $0.361 1,666,667 20/12/2012 $0.048 $0.122 1,666,667 20/12/2012 $0.048 $0.123 1,666,666 20/12/2012 $0.048 $0.12
Stephen Fabian 1 833,333 24/2/2011 $0.050 $0.362 833,333 24/2/2011 $0.030 $0.363 833,334 24/2/2011 $0.020 $0.36
Wayne Kernaghan 1 833,333 20/12/2012 $0.048 $0.122 833,333 20/12/2012 $0.048 $0.123 833,334 20/12/2012 $0.048 $0.12
ExecutivesStephen Turner 1 833,333 24/2/2011 $0.050 $0.36
2 833,333 24/2/2011 $0.030 $0.363 833,334 24/2/2011 $0.020 $0.36
Alan Doyle 1 833,333 20/12/2012 $0.048 $0.122 833,333 20/12/2012 $0.048 $0.123 833,334 20/12/2012 $0.048 $0.12
Philip Hopkins 1 3,333,334 9/5/2011 $0.020 $0.362 3,333,333 9/5/2011 $0.010 $0.363 3,333,333 9/5/2011 $0.010 $0.36
KMPDion Cohen 1 833,333 24/2/2011 $0.050 $0.36
2 833,333 24/2/2011 $0.030 $0.363 833,334 24/2/2011 $0.030 $0.361 833,333 20/12/2012 $0.048 $0.122 833,333 20/12/2012 $0.048 $0.123 833,334 20/12/2012 $0.048 $0.12
Total 35,000,000
Terms of the options issued are detailed below:
a) These options were granted under the Incentive Option Scheme (approved by Shareholders on 18 February 2011) to Directors and management and were subject to the following vesting conditions:
■ One third of the options vested upon the Company’s achievement of the production run rate over a continuous three month period of at least 800,000 tonnes per annum.
■ A further one third of the options vested upon the Company identifying a JORC compliant resource of iron ore reaching or exceeding 50,000,000 tonnes.
■ The final one third of the options vested upon the Company achieving a production run rate over a continuous twelve month period of at least 800,000 tonnes per annum.
In addition to the vesting conditions set out above, the Exercise Condition that must be satisfied before the options can be exercised, is that the volume weighted average price of the Company’s shares traded on the ASX during the five days prior to exercise of the options is at least $0.50 per Share.
For
per
sona
l use
onl
y

FOCUSED ON EXPANSION
35
Expiry dateNumber of
options lapsedFirst exercise
dateLast exercise
dateNumber of
options vested % vested
31/12/2015 – 28/2/2011 (a) 31/12/2015 1,666,667 100%31/12/2015 – 23/12/2011 (a) 31/12/2015 1,666,667 100%31/12/2015 – 23/12/2011 (a) 31/12/2015 1,666,666 100%15/11/2017 – 31/12/2013 (c) 15/11/2017 – –15/11/2017 – 31/12/2014 (c) 15/11/2017 – –15/11/2017 – 31/12/2015 (c) 15/11/2017 – –31/12/2015 – 28/02/2011 (a) 31/12/2015 833,333 100%31/12/2015 – 23/12/2011 (a) 31/12/2015 833,333 100%31/12/2015 – 23/12/2011 (a) 31/12/2015 833,334 100%15/11/2017 – 31/12/2013 (c) 15/11/2017 – –15/11/2017 – 31/12/2014 (c) 15/11/2017 – –15/11/2017 – 31/12/2015 (c) 15/11/2017 – –
31/12/2015 – 28/02/2011 (a) 31/12/2015 833,333 100%31/12/2015 – 23/12/2011 (a) 31/12/2015 833,333 100%31/12/2015 – 23/12/2011 (a) 31/12/2015 833,334 100%15/11/2017 – 31/12/2013 (c) 15/11/2017 – –15/11/2017 – 31/12/2014 (c) 15/11/2017 – –15/11/2017 – 31/12/2015 (c) 15/11/2017 – –31/12/2015 (3,333,334) 23/12/2011 (b) 30/6/2013 3,333,334 100%31/12/2015 (3,333,333) 23/12/2011 (b) 30/6/2013 3,333,333 100%31/12/2015 (3,333,333) – (b) 30/4/2013 – –
31/12/2015 – 28/02/2011 (a) 31/12/2015 833,333 100%31/12/2015 – 23/12/2011 (a) 31/12/2015 833,333 100%31/12/2015 – 23/12/2011 (a) 31/12/2015 833,334 100%15/11/2017 – 31/12/2013 (c) 15/11/2017 – –15/11/2017 – 31/12/2014 (c) 15/11/2017 – –15/11/2017 – 31/12/2015 (c) 15/11/2017 – –
(10,000,000) 19,166,667
b) These options were subject to the following vesting conditions:
■ One third of the options vested upon the Company identifying a JORC compliant resource of iron ore reaching or exceeding 50,000,000 tonnes.
■ A further one third of the options vested upon the Company achieving a production run rate over a continuous twelve month period of at least 800,000 tonnes per annum.
■ The final one third of the options vesting upon the achievement of a production run rate of or exceeding 1.5mtpa ROM for the year ending 31 December 2013 and eligible participant remaining as an executive employee of the Company on 31 December 2013. This performance condition was not met during the financial year 30 June 2013 and hence this tranche did not vest and was subsequently cancelled.
c) These options were subject to the following vesting conditions:
■ One third of the options will vest if employed by the Company on 31 December 2013 (approved by shareholders on 16 November 2012), a further one third will vest if employed by the Company on 31 December 2014 and the final one third will vest if employed by the Company on 31 December 2015.
In addition to the vesting conditions set out above, the Exercise Condition that must be satisfied before the options can be exercised, is that the volume weighted average price of the Company’s shares traded on the ASX during the five days prior to exercise of the options is at least $0.50 per Share.
For
per
sona
l use
onl
y

DIRECTORS’ REPORT (CONTINUED)
SAFM ANNUAL REPORT 201336
C. SHARE BASED PAYMENTS (CONTINUED)
Unlisted Share Options Granted and Vested for 30 June 2012The following table sets out the details of unlisted share options granted and vested as of 30 June 2012.
No unlisted share options were exercised during the year ended 30 June 2012.
TrancheGranted number
of options Grant date
Fair value per Option at grant date (note 21)
Exercise price per Option
Non-Executive DirectorsTerence Willsteed 1 1,666,667 24/2/2011 $0.05 $0.36
2 1,666,667 24/2/2011 $0.03 $0.363 1,666,666 24/2/2011 $0.02 $0.36
Stephen Turner 1 833,333 24/2/2011 $0.05 $0.362 833,333 24/2/2011 $0.03 $0.363 833,334 24/2/2011 $0.02 $0.36
Stephen Fabian 1 833,333 24/2/2011 $0.05 $0.362 833,333 24/2/2011 $0.03 $0.363 833,334 24/2/2011 $0.02 $0.36
Philip Re 1 1,166,667 24/2/2011 $0.05 $0.362 1,166,667 24/2/2011 $0.03 $0.363 1,166,666 24/2/2011 $0.02 $0.36
Paul Lloyd 1 1,166,667 24/2/2011 $0.05 $0.362 1,166,667 24/2/2011 $0.03 $0.363 1,166,666 24/2/2011 $0.02 $0.36
KMPPhilip Hopkins 1 3,333,334 9/5/2011 $0.02 $0.36
2 3,333,333 9/5/2011 $0.01 $0.363 3,333,333 9/5/2011 $0.01 $0.36
Dion Cohen 1 833,333 24/2/2011 $0.05 $0.362 833,333 24/2/2011 $0.03 $0.363 833,334 24/2/2011 $0.03 $0.36
Total 29,500,000
Terms of the options issued are detailed below:
a) These options were granted under the Incentive Option Scheme (approved by Shareholders on 18 February 2011) to Directors and management and were subject to the following vesting conditions:
■ One third of the options vested upon the Company’s achievement of the production run rate over a continuous three month period of at least 800,000 tonnes per annum.
■ A further one third of the options vested upon the Company identifying a JORC compliant resource of iron ore reaching or exceeding 50,000,000 tonnes.
■ The final one third of the options vested upon the Company achieving a production run rate over a continuous twelve month period of at least 800,000 tonnes per annum.
In addition to the vesting conditions set out above, the Exercise Condition that must be satisfied before the options can be exercised, is that the volume weighted average price of the Company’s shares traded on the ASX during the five days prior to exercise of the options is at least $0.50 per Share.F
or p
erso
nal u
se o
nly

FOCUSED ON EXPANSION
37
Expiry dateNumber of
options lapsedFirst exercise
dateLast exercise
dateNumber of
options vested % vested
31/12/2015 – 28/2/2011 (a) 31/12/2015 1,666,667 100%31/12/2015 – 23/12/2011 (a) 31/12/2015 1,666,667 100%31/12/2015 – 23/12/2011 (a) 31/12/2015 1,666,666 100%31/12/2015 – 28/02/2011 (a) 31/12/2015 833,333 100%31/12/2015 – 23/12/2011 (a) 31/12/2015 833,333 100%31/12/2015 – 23/12/2011 (a) 31/12/2015 833,334 100%31/12/2015 – 28/02/2011 (a) 31/12/2015 833,333 100%31/12/2015 – 23/12/2011 (a) 31/12/2015 833,333 100%31/12/2015 – 23/12/2011 (a) 31/12/2015 833,334 100%31/12/2015 (956,667) 28/02/2011 (a) 31/12/2015 210,000 100%31/12/2015 (956,667) 23/12/2011 (a) 31/12/2015 210,000 100%31/12/2015 (956,666) 23/12/2011 (a) 31/12/2015 210,000 100%31/12/2015 – 28/02/2011 (a) 31/12/2015 1,166,667 100%31/12/2015 – 23/12/2011 (a) 31/12/2015 1,166,667 100%31/12/2015 – 23/12/2011 (a) 31/12/2015 1,166,666 100%
31/12/2015 – 23/12/2011 (b) 31/12/2015 3,333,334 100%31/12/2015 – 23/12/2011 (b) 31/12/2015 3,333,333 100%31/12/2015 – – (b) 31/12/2015 – –31/12/2015 – 28/02/2011 (a) 31/12/2015 833,333 100%31/12/2015 – 23/12/2011 (a) 31/12/2015 833,333 100%31/12/2015 – 23/12/2011 (a) 31/12/2015 833,334 100%
(2,870,000) 23,296,667
b) These options were subject to the following vesting conditions:
■ One third of the options vested upon the Company identifying a JORC compliant resource of iron ore reaching or exceeding 50,000,000 tonnes.
■ A further one third of the options vested upon the Company achieving a production run rate over a continuous twelve month period of at least 800,000 tonnes per annum.
■ The final one third of the options vesting upon the achievement of a production run rate of or exceeding 1.5mtpa ROM for the year ending 31 December 2013 and eligible participant remaining as an executive employee of the Company on 31 December 2013.
In addition to the vesting conditions set out above, the Exercise Condition that must be satisfied before the options can be exercised, is that the volume weighted average price of the Company’s shares traded on the ASX during the five days prior to exercise of the options is at least $0.50 per Share.
End of Audited Remuneration ReportFor
per
sona
l use
onl
y

DIRECTORS’ REPORT (CONTINUED)
SAFM ANNUAL REPORT 201338
INSURANCE OF DIRECTORS, OFFICERS AND AUDITORDuring the year, SAFM paid a premium to insure directors and officers of the Group.
The liabilities insured are legal costs that may be incurred in defending civil or criminal proceedings that may be brought against the directors and officers in their capacity as officers of the Group, and any other payments arising from liabilities incurred by the directors and officers in connection with such proceedings, other than where such liabilities arise out of conduct involving a wilful breach of duty by the directors and officers or the improper use by the directors and officers of their position or of information to gain advantage for themselves or someone else to cause detriment to the Group.
The details of the premium paid in respect of the insurance policies are not disclosed as such disclosure is prohibited under the terms of the contract.
The Group has, to the extent permitted by law, indemnified current directors and officers of the Group against a liability incurred as such by a directors and officer.
No premiums have been paid to indemnify the auditors.
GOING CONCERNAfter making enquiries, the directors have a reasonable expectation that the Company has adequate resources to continue in operational existence for the foreseeable future. For this reason, we continue to adopt the going concern basis in preparing the accounts.
PROCEEDINGS OF BEHALF OF THE COMPANYNo person has applied to the Court under section 237 of the Corporations Act 2001 for leave to bring proceedings on behalf of the Company, or to intervene in any proceedings to which the Company is a party, for the purpose of taking responsibility on behalf of the Company for all or part of those proceedings.
AUDITOR’S INDEPENDENCE DECLARATIONA copy of the auditor’s independence declaration as required under s307C of the Corporations Act 2001 is included on page 39 of this financial report and forms part of this Directors’ Report.
NON-AUDIT SERVICESEY, the Company’s auditors, did not perform any other services other than their statutory audit duties.
ROUNDINGThe consolidated Group has applied the relief available to it in ASIC 9l report and the Directors’ report have been rounded off to the nearest $1,000.
Signed in accordance with a resolution of the Directors.
Stephen TurnerManaging Director
Sydney5 September 2013
For
per
sona
l use
onl
y

39
AUDITOR’S INDEPENDENCE DECLARATION TO THE DIRECTORS OF SOUTH AMERICAN FERRO METALS LIMITEDIn relation to our audit of the financial report of South American Ferro Metals Limited for the financial year ended 30 June 2013, to the best of my knowledge and belief, there have been no contraventions of the auditor independence requirements of the Corporations Act 2001 or any applicable code of professional conduct.
Ernst & Young
Anton IvanyiPartnerSydney5 September 2013
Ernst & Young 680 George Street Sydney NSW 2000 Australia GPO Box 2646 Sydney NSW 2001
Tel: +61 2 9248 5555 Fax: +61 2 9248 5959 ey.com/au
For
per
sona
l use
onl
y

FINANCIALSTATEMENTS
41 Consolidated
Income Statement
41 ConsolidatedStatement of
Comprehensive Income
42 ConsolidatedStatement of
Financial Position
43 ConsolidatedStatement of
Changes in Equity
44 ConsolidatedStatement of Cash Flows
45 Notes to the
Financial Statements
80 Directors’
Declaration
83 Additional Information
for Listed Public Companies
SAFM ANNUAL REPORT 201340
For
per
sona
l use
onl
y

FOCUSED ON EXPANSION
41
CONSOLIDATEDINCOME STATEMENTFOR THE YEAR ENDED 30 JUNE 2013
Note30 June 2013
$’00030 June 2012
$’000
From continuing operations
Sales revenue 3 19,591 17,693
Cost of goods sold (12,274) (9,329)
Gross profit 7,317 8,364
OTHER INCOME/(EXPENSES)
Other income 137 16
Finance income 55 419
Administrative and other expenses 4 (4,748) (4,628)
Foreign exchange gain (58) –
Share-based payment expense 5 (172) (381)
Finance costs (47) (2)
Profit before tax 2,484 3,788
Income tax expense 6 (802) (1,479)
Profit after tax for the year attributable to members of the parent entity 1,682 2,309
Earnings per share (cents per share)
– Basic earnings per share 9 0.41 0.68
– Diluted earnings per share 9 0.38 0.62
These financial statements should be read in conjunction with the accompanying notes.
CONSOLIDATEDSTATEMENT OF COMPREHENSIVE INCOMEFOR THE YEAR ENDED 30 JUNE 2013
30 June 2013$’000
30 June 2012$’000
Profit after tax for the year attributable to members of the parent entity 1,682 2,309
Other Comprehensive Income which cannot be reclassified through the Income Statement – –
Other Comprehensive Income which can be reclassified through the Income Statement
Exchange differences on translating foreign controlled entities 709 (3,679)
Total comprehensive income/(loss) for the year, net of tax 2,391 (1,370)
Attributable to:
Members of the parent entity 2,391 (1,370)
These financial statements should be read in conjunction with the accompanying notes.
For
per
sona
l use
onl
y

SAFM ANNUAL REPORT 201342
CONSOLIDATEDSTATEMENT OF FINANCIAL POSITIONAT 30 JUNE 2013
Note30 June 2013
$’00030 June 2012
$’000
ASSETS
Current assets
Cash and cash equivalents 10 411 5,403
Trade and other receivables 11 1,254 1,863
Prepayments 12 217 16
Inventories 13 3,941 831
Total current assets 5,823 8,113
Non-current assets
Exploration and evaluation assets 14 4,300 2,617
Mining properties 15 7,628 9,765
Property, plant & equipment 16 13,384 4,946
Deferred tax asset 6 261 253
Other non-current assets 17 834 372
Total non-current assets 26,407 17,953
Total assets 32,230 26,066
LIABILITIES
Current liabilities
Trade and other payables 18 2,969 1,110
Taxation owing 6 657 460
Interest-bearing loans and borrowings 19 271 8
Provisions 20 995 458
Total current liabilities 4,892 2,036
Non-current liabilities
Provisions 20 4,943 4,198
Total non-current liabilities 4,943 4,198
Total liabilities 9,835 6,234
Net assets 22,395 19,832
SHAREHOLDERS’ EQUITY
Contributed equity 21 48,312 48,312
Share-based payment reserve 22 1,550 1,378
Foreign currency translation reserve 23 (4,888) (5,597)
Accumulated losses 24 (22,579) (24,261)
Total shareholders’ equity 22,395 19,832
These financial statements should be read in conjunction with the accompanying notes.
For
per
sona
l use
onl
y

FOCUSED ON EXPANSION
43
CONSOLIDATEDSTATEMENT OF CHANGES IN EQUITYFOR THE YEAR ENDED 30 JUNE 2013
Contributed Equity$’000
Share Based payment
reserve$’000
Foreign currency
translation reserve
$’000
Accumu-lated losses
$’000Total Equity
$’000
At 1 July 2011 48,312 997 (1,918) (26,570) 20,821
Profit for the Period – – – 2,309 2,309
Other Comprehensive Income – – (3,679) – (3,679)
Total Comprehensive loss for the year – – (3,679) 2,309 (1,370)
Equity Transactions with Owners
Share options expensed – 381 – – 381
At 30 June 2012 48,312 1,378 (5,597) (24,261) 19,832
At 1 July 2012 48,312 1,378 (5,597) (24,261) 19,832
Profit for the Period – – – 1,682 1,682
Other Comprehensive Income – – 709 – 709
Total Comprehensive profit for the year – – 709 1,682 2,391
Equity Transactions with Owners
Share options expensed – 172 – – 172
At 30 June 2013 48,312 1,550 (4,888) (22,579) 22,395
These financial statements should be read in conjunction with the accompanying notes.
For
per
sona
l use
onl
y

SAFM ANNUAL REPORT 201344
CONSOLIDATEDSTATEMENT OF CASH FLOWSFOR THE YEAR ENDED 30 JUNE 2013
Note30 June 2013
$’00030 June 2012
$’000
Cash flows from operating activities
Receipts from customers 20,205 17,908
Payments for restricted cash (463) (285)
Payments and advances to suppliers and employees
(exclusive of GST and other Brazilian taxes payable) (16,862) (12,226)
Taxation and other social taxes paid (591) (1,581)
Interest paid (47) (2)
Net cash flows from in operating activities 26 2,242 3,814
Cash flows from investing activities
Interest received 55 419
Payments for property, plant & equipment (5,970) (3,127)
Payments for exploration and evaluation assets (1,609) (2,141)
Net cash flows used in investing activities (7,524) (4,849)
Cash flows from financing activities
Proceeds from borrowings 856 4
Repayment of borrowings (592) –
Net cash flows from financing activities 264 4
Net decrease in cash held (5,018) (1,031)
Cash at the beginning of the financial period 5,403 7,582
Effects of exchange rates on cash holdings in foreign currencies 26 (1,148)
Cash and cash equivalents at the end of the year 10 411 5,403
These financial statements should be read in conjunction with the accompanying notes.
For
per
sona
l use
onl
y

FOCUSED ON EXPANSION
45
Material accounting policies adopted in the preparation of this annual financial report are presented below and have been consistently applied unless otherwise stated.
a) Basis of ConsolidationThe consolidated financial statements incorporate the assets and liabilities of all entities controlled by SAFM Limited at the end of the reporting period. A controlled entity is any entity over which SAFM Limited has the power to govern the financial and operating policies so as to obtain benefits from the entity’s activities. Control will generally exist when the parent owns, directly or indirectly through subsidiaries more than half of the voting power of the entity. In assessing the power to govern, the existence and effect of holdings of actual and potential voting rights are considered.
The Company and its controlled entities together are referred to as the Group. The effects of all transactions between entities in the Group are eliminated in full.
Where control of an entity is obtained during a financial year, its results are included in the consolidated income statement from the date on which control commences. Where control of an entity ceases during a financial year its results are included for that part of the year during which control existed.
The financial statements of subsidiaries are prepared for the same reporting period as the parent company, using consistent accounting policies.
Business Combinations and Goodwill
Business combinations are accounted for using the acquisition method. The consideration transferred in a business combination is measured at the fair value at the acquisition date and the amount of any non-controlling interest in the acquiree. For each business combination, the acquirer measures the non-controlling interest in the acquiree either at fair value or at the proportionate share of the acquiree’s identifiable net assets. Acquisition costs incurred are expensed. Goodwill is stated after separate recognition of identifiable intangible assets. It is calculated as the excess of the sum of a) fair value of consideration transferred, b) the recognised amount of any non-controlling interest in the acquiree and c) acquisition-date fair value of any existing equity interest in the acquiree, over the acquisition-date fair values of identifiable net assets. If the fair values of identifiable net assets exceed the sum calculated above, the excess amount (ie gain on a bargain purchase) is recognised in profit or loss immediately.
b) Foreign Currency TranslationThe consolidated financial statements are presented in Australian dollars (AUD), which is also the functional currency of the parent company.
Foreign currency transactions are translated into the functional currency of the respective Group entity, using the exchange rates prevailing at the dates of the transactions (spot exchange rate). Foreign exchange gains and losses resulting from the settlement of such transactions and from the re-measurement of monetary items at year end exchange rates are recognised in profit or loss.
Non-monetary items measured at historical cost are translated using the exchange rates at the date of the transaction (not retranslated). Non-monetary items measured at fair value are translated using the exchange rates at the date when fair value was determined.
1. CORPORATE INFORMATIONThis annual report covers South American Ferro Metals Limited (“SAFM Limited” or the “Company”) and the entities it controlled at the end of, or during, the year ended 30 June 2013 (“SAFM” or the “Group”). The presentation currency of the Group is Australian Dollars (“$”).
South American Ferro Metals Limited owns 100% of the mineral rights and property of the Ponto Verde Iron Ore Project in Brazil. Ponto Verde is located in the heart of the Iron Ore Quadrilateral, 55 kilometres from the town of Belo Horizonte in the state of Minas Gerais. The Iron Ore Quadrilateral is a prolific iron ore mining area, and the Project is located proximate to established mining operations, iron and steel plants and existing infrastructure.
A description of the Group’s operations is included in the review and results of operations in the Directors’ report. The Directors’ report is not part of the financial statements.
The Company is a for-profit entity and limited by shares incorporated in Australia whose shares and listed options are traded on the ASX under the codes “SFZ” and “SFZO”.
2. ACCOUNTING POLICIESBasis of Preparation
The consolidated general purpose financial statements of the Group have been prepared in accordance with the requirements of the Corporations Act 2001, Australian Accounting Standards and other authoritative pronouncements of the Australian Accounting Standards Board. Compliance with Australian Accounting Standards results in full compliance with the International Financial Reporting Standards (IFRS) as issued by the International Accounting Standards Board (IASB).
It is recommended that the annual financial report be considered together with any public announcements made by SAFM Limited during the year ended 30 June 2013 and up to the issue date of this report, which SAFM has made in accordance with its continuous disclosure obligations arising under the Corporations Act 2001.
Rounding of Amounts
The annual financial report and directors’ report are presented in Australian Dollars and all values are rounded to the nearest thousand Dollar ($’000) unless otherwise stated under the relief available to the Company under ASIC Class Order 98/100.
In the application of IFRS, management is required to make judgements, estimates, and assumptions about carrying values of assets and liabilities that are not readily apparent from other sources. The estimates and associated assumptions are based on historical experience and various other factors that are believed to be reasonable under the circumstances, the results of which form the basis of making judgements. Actual results may differ from estimates.
The estimates and underlying assumptions are reviewed on an ongoing basis. Revisions to accounting estimates are recognised in the period in which the estimate is revised, if the revision affects only that period or in the period of the revision and future periods, if the revision affects both current and future periods.
Judgements made by management in the application of IFRS that have significant effects on the financial statements and estimates with a significant risk of material adjustments in the next year are disclosed, where applicable in the relevant notes to the financial statements, and note 2 (w).
NOTES TO THEFINANCIAL STATEMENTSFOR THE YEAR ENDED 30 JUNE 2013
For
per
sona
l use
onl
y

SAFM ANNUAL REPORT 201346
NOTES TO THE FINANCIAL STATEMENTS (CONTINUED)FOR THE YEAR ENDED 30 JUNE 2013
The depreciation rates per annum for each class of fixed asset are as follows:
Property & buildings: 4%Plant and equipment: between 10% – 15%Furniture & fittings: 10%Computer equipment: 20%Motor vehicles: 20%Decommissioning asset: Production rate
Subsequent expenditure relating to an item of property, plant and equipment, that has already been recognised, is added to the carrying amount of the asset if the recognition criteria are met.
All assets are depreciated over their anticipated useful lives up to their residual values using a straight-line depreciation basis. These useful lives are determined on the day of capitalisation and are re-assessed annually by Management.
The decommissioning asset is amortised over the expected remaining life of mine being 24 years, using the unit of production method based on proven and probable ore reserves. Land is not depreciated.
Major Maintenance and Repairs
Expenditure on major maintenance re-builds or repairs comprise the cost of replacement assets or parts of assets and overhaul costs. Where an asset or part of an asset that was separately depreciated and is now written off is replaced and it is probable that future economic benefits associated with the item will flow to the Group through an extended life, the expenditure is capitalised.
Where part of the asset was not separately considered as a component, the replacement value is used to estimate the carrying amount of the replaced asset which is immediately written off. All other day to day maintenance costs are part of production cost.
Impairment
The carrying values of plant and equipment are reviewed for impairment when events or changes in circumstances indicate the carrying value may not be recoverable or at least on an annual basis.
For an asset that does not generate largely independent cash inflows, the recoverable amount is determined for the cash-generating unit to which the asset belongs. If any such indication exists and where the carrying values exceed the estimated recoverable amounts, the assets or cash-generating units are written down to their recoverable amount.
Decommissioning Asset
The Group provides for decommissioning and restoration which include any cost to dismantle and removal of certain items of plant and equipment. The cost of an item includes the initial estimate of the costs of dismantling and removing the item and restoring the site on which it is located, the obligation for which an entity incurs when an item is acquired or as a consequence of having used the item during that period. This asset is depreciated on the basis of the current estimate of the useful life of the asset.
In accordance with AASB 137 Provisions, Contingent Liabilities and Contingent Assets an entity is also required to recognise as a provision the best estimate of the present value of expenditure required to settle the obligation. The present value of estimated future cash flows is measured using a current market discount rate.
2. ACCOUNTING POLICIES (CONTINUED)
b) Foreign Currency Translation (continued)In the Group’s financial statements, all assets, liabilities and transactions of Group entities with a functional currency other than the AUD (the Group’s presentation currency) are translated into AUD upon consolidation. The functional currency of the entities in the Group has remained unchanged during the reporting period.
On consolidation, assets and liabilities have been translated into AUD at the closing rate at the reporting date. Income and expenses have been translated into the Group’s presentation currency at the average rate over the reporting period. Exchange differences are charged/credited to other comprehensive income and recognised in the currency translation reserve in equity. On disposal of a foreign operation the cumulative translation differences recognised in equity are reclassified to profit or loss and recognised as part of the gain or loss on disposal. Goodwill and fair value adjustments arising on the acquisition of a foreign entity have been treated as assets and liabilities of the foreign entity and translated into AUD at the closing rate.
c) Cash and Cash EquivalentsCash and cash equivalents include cash on hand and in the bank, and other short-term deposits with an original maturity of three months or less. Bank overdrafts are shown separately in current liabilities on the Statement of Financial Position. For the purposes of the Statement of Cash Flows, cash and cash equivalents consist of cash and cash equivalents as defined above, net of outstanding bank overdrafts.
d) Trade and Other ReceivablesTrade receivables, which are due for settlement no more than 30 days from the date of the final invoice, are recognised initially at fair value and subsequently measured at amortised cost using the effective interest method, less an allowance for uncollectible amounts. The final invoice is issued once the product is received and final specification agreed by the customer. Collectibles of trade receivables are reviewed on an ongoing basis and a provision for non-recovery is made accordingly. Debts which are known to be uncollectible are written off. The difference between the carrying value of receivables and present value of the expected future cash flows are accounted for against the carrying value of receivables and as an interest charge. Fair value adjustments from commodity price sensitive sales are accounted for against the relevant receivables.
e) Property, Plant and EquipmentProperty, plant and equipment are recorded at historical cost less accumulated depreciation and any impairment. The carrying value of assets is reviewed for impairment at the reporting date. An asset is immediately written down to its recoverable amount if the carrying value of the asset exceeds its estimated recoverable amount.
For
per
sona
l use
onl
y

FOCUSED ON EXPANSION
47
Net realisable value is the estimated selling price in the ordinary course of business, less estimated costs of selling the product.
Cost is determined by the weighted average method and comprises direct purchase costs and an appropriate portion of fixed and variable overhead costs, including depreciation and amortisation, incurred in converting materials into finished goods. The cost of production is allocated to joint products using a production ratio. Separately identifiable costs of conversion of each product are specifically allocated.
Materials and stores supplies are valued at the lower of cost or net realisable value. Any provision for obsolescence is determined by reference to specific items of stock. A regular review is undertaken to determine the extent of any provision for obsolescence.
i) Employee Benefits
Equity Settled Compensation:
The Group provides benefits to employees (including Directors) of the Group and other service providers or strategic equity partners in the form of share-based payment transactions, whereby employees or other parties render services or provide goods in exchange for shares or rights over shares (“equity-settled transactions”).
The cost of these equity-settled transactions with employees is measured by reference to the fair value at the date at which they are granted. The fair value is determined using an option pricing method as well as a Monte Carlo simulation analysis is applied, if required, and taking into account vesting and probability conditions.
In valuing equity-settled transactions, no account is taken of any vesting conditions, other than conditions linked to the price of the shares of SAFM (“market conditions”).
The cost of equity-settled transactions is recognised in the statement of comprehensive income, together with a corresponding increase in equity, over the period in which the performance and/or service conditions are fulfilled, ending on the date on which the relevant employees become fully entitled to the award (“vesting date”).
The cumulative expense recognised for equity-settled transactions at each reporting date until the vesting date reflects:
i) the extent to which the vesting period has expired; and
ii) the number of awards that, in the opinion of the Directors of the Group, will ultimately vest. This opinion is formed based on the best available information at reporting date. No adjustment is made for the likelihood of market performance conditions being met as the effect of these conditions is included in the determination of fair value at grant date.
Where the terms of an equity-settled award are modified, as a minimum an expense is recognised as if the terms had not been modified. In addition, an expense is recognised for any increase in the value of the transaction as a result of the modification, as measured at the date of modification.
Where an equity-settled award is cancelled, it is treated as if it had vested on the date of cancellation, and any expense not yet recognised for the award is recognised immediately. No expense is recognised for awards that do not ultimately vest, except for awards where vesting is conditional upon a market condition.
However, if a new award is substituted for the cancelled award, and designated as a replacement award on the date that it is granted, the cancelled and new award are treated as if they were a modification of the original award, as described in the previous paragraph.
f) Mining PropertiesMining properties, comprising of mineral rights, are recorded at historical cost less accumulated amortisation and any impairment. The carrying value of the asset is reviewed for impairment at reporting date. An asset is immediately written down to its recoverable amount if the carrying value of the asset exceeds its estimated recoverable amount.
Mining properties that are being depleted are amortised over the expected remaining life of mine being 24 years, using the unit of production method based on proven and probable ore reserves.
Subsequent expenditure relating to mineral rights, that have already been recognised, is added to the carrying amount of the asset if the recognition criteria are met.
Impairment
The carrying values of mining properties are reviewed for impairment when events or changes in circumstances indicate the carrying value may not be recoverable or at least on an annual basis.
For an asset that does not generate largely independent cash inflows, the recoverable amount is determined for the cash-generating unit to which the asset belongs. If any such indication exists and where the carrying values exceed the estimated recoverable amounts, the assets or cash-generating units are written down to their recoverable amount.
g) Acquisition, Exploration, Evaluation and Development CostsExploration and evaluation expenditure incurred is accumulated in respect of each identifiable area of interest. These costs are only carried forward to the extent that they are expected to be recouped through the successful development of the area or where activities in the area have not yet reached a stage that permits reasonable assessment of the existence of economically recoverable reserves.
Accumulated costs in relation to an abandoned area are written off in full against profit or loss in the year in which the decision to abandon the area is made.
A regular review for impairment is undertaken of each area of interest to determine the appropriateness of continuing to carry forward costs in relation to that area of interest.
Costs of decommissioning and restoration are provided over the life of the facility from when exploration commences and are included in the costs of that stage. Site restoration costs include the dismantling and removal of mining plant, equipment and building structures, waste removal, and rehabilitation of the site in accordance with clauses of the mining permits. Such costs have been determined using estimates of future costs, current legal requirements and technology on a discounted basis.
Any changes in the estimates for the costs are accounted on a prospective basis. In determining the costs of site restoration, there is uncertainty regarding the nature and extent of the restoration due to community expectations and future legislation. Accordingly the costs have been determined on the basis that the restoration will be completed within one year of abandoning the site.
h) InventoriesRun of mine ore, concentrator feed and beneficiated ore (Sinter Feed, Small Lump and Concentrate) stockpiles are physically measured or estimated and valued at the lower of cost or net realisable value.
For
per
sona
l use
onl
y

SAFM ANNUAL REPORT 201348
NOTES TO THE FINANCIAL STATEMENTS (CONTINUED)FOR THE YEAR ENDED 30 JUNE 2013
Depreciation methods and useful lives for assets held under finance lease agreements correspond to those applied to comparable assets which are legally owned by the Group. The corresponding finance leasing liability is reduced by lease payments less finance charges, which are expensed as part of finance costs.
The interest element of leasing payments represents a constant proportion of the capital balance outstanding and is charged to profit or loss over the period of the lease.
All other leases are treated as operating leases. Payments on operating lease agreements are recognised as an expense on a straight-line basis over the lease term. Associated costs, such as maintenance and insurance, are expensed as incurred.
l) Financial Assets
Initial Recognition and Measurement
Financial assets are categorised as financial assets at fair value through profit and loss, loans and receivables, held-to-maturity investments, available for sale financial assets or as derivatives designated as hedging instruments in an effective hedge, as appropriate. The Group determines the categorisation of its financial assets at initial recognition. Categorisation is re-evaluated at each financial year end. When financial assets are recognised initially, they are measured at fair value plus transaction costs, except where the instrument is classified as “at fair value through profit or loss”, in which case transaction costs are expensed to profit and loss immediately.
Subsequent Measurement
Loans and receivables are non-derivative financial assets with fixed or determinable payments that are not quoted in an active market and are subsequently re-measured at amortised cost.
Loans and receivables are included in current assets, except for those which are not expected to mature in twelve months after the end of the period (all other loans and receivables are included as non-current assets).
De-recognition of Financial Assets
A financial asset (or, where applicable a part of a financial asset or part of a group of similar financial assets) is derecognised when:
■ the rights to receive cash flows from the asset have expired; or
■ the Group has transferred its rights to receive cash flows from the asset or has assumed an obligation to pay the received cash flows in full without material delay to a third party under a ‘pass-through’ arrangement; and either
a) the Group has transferred substantially all the risks and rewards of the asset, or
b) the Group has neither transferred nor retained substantially all the risks and rewards of the asset, but has transferred control of the asset.
2. ACCOUNTING POLICIES (CONTINUED)
i) Employee Benefits (continued)
Equity Settled Compensation: (continued)
Where shares are issued at a discount to fair value either by reference to the current market price or by virtue of the Group providing financing for the share purchase on favourable terms, the value of the discount is considered a share based payment.
The dilutive effect, if any, of outstanding options is reflected as additional share dilution in the computation of earnings per share.
j) ProvisionsProvisions are recognised when the Group has a present obligation (legal or constructive) as a result of a past event, if it is probable that an outflow of resources embodying economic benefits will be required to settle the obligation and a reliable estimate can be made of the amount of the obligation. If the effect of the time value of money is material, provisions are discounted using a current pre-tax rate that reflects the risks specific to the liability.
When discounting is used, the increase in the provision due to the passage of time is recognised as a finance cost.
Rehabilitation Provision
In accordance with the Group’s environmental policy and applicable legal requirements, a provision for site decommissioning and restoration in respect of contaminated land, is recognised when the land is contaminated.
The provision is the best estimate of the represent value of the expenditure required to settle the restoration obligation at the reporting date, based on current legal requirements and technology. Future restoration costs are reviewed annually and any changes are reflected in the present value of the decommissioning and restoration provision at the end of the reporting period.
The amount of the decommissioning and provision for future restoration costs is capitalised and is depreciated in accordance with the policy set out in note 2(j). The unwinding of the effect of discounting on the provision is recognised as a finance cost.
k) Leased AssetsIn accordance with AASB 117 Leases, the economic ownership of a leased asset is transferred to the lessee if the lessee bears substantially all the risks and rewards related to the ownership of the leased asset. The related asset is then recognised at the inception of the lease at the fair value of the leased asset or, if lower, the present value of the lease payments plus incidental payments, if any. A corresponding amount is recognised as a finance leasing liability, irrespective of whether some of these lease payments are payable up-front at the date of inception of the lease. Leases of land and buildings are classified separately and are split into a land and a building element, in accordance with the relative fair values of the leasehold interests at the date the asset is recognised initially.
For
per
sona
l use
onl
y

FOCUSED ON EXPANSION
49
m) Financial liabilities
Initial Recognition
Financial liabilities within the scope of AASB139 are classified as financial liabilities at fair value through profit or loss, loans and borrowings, or as derivatives designated as hedging instruments in an effective hedge, as appropriate. The Group determines the classification of its financial liabilities at initial recognition.
Financial liabilities are recognized initially at fair value and in the case of loans and borrowings, directly attributable transaction costs. The Group’s financial liabilities include trade and other payables, bank overdraft, loans and borrowings and derivative financial instruments.
Subsequent Measurement
The measurement of financial liabilities depends on their classification as follows:
i) At Fair Value Through Profit & Loss
Financial liabilities at fair value through profit or loss includes financial liabilities held for trading and financial liabilities designated upon initial recognition as at fair value through profit or loss. Financial liabilities are classified as held for trading if they are acquired for the purpose of selling in the near term. This category includes derivative financial instruments entered into by the Group that are not designated as hedging instruments in hedge relationships as defined by AASB 39. Separate embedded derivatives are also classified as held for trading unless they are designated as effective hedging instruments.
Gains or losses on liabilities held for trading are recognised in the income statement.
The Group has not designated any financial liabilities upon initial recognition as at fair value through profit or loss.
Options granted that are not part of a continuing share based payment relationship (i.e. there is no ongoing provision of goods and/or services and are denominated in a currency other than the entity’s functional currency) are accounted for as derivative liabilities in accordance with AASB 139: “Financial Instruments: Recognition and Measurement” and IFRIC guidelines. Such options are recorded on the balance sheet at fair value with movements in fair value between being recorded in the income statement. In respect of the derivative liability, the change in the fair value of the derivative liability, during the period and cumulatively, is not attributable to changes in the credit risk of that liability.
In addition, contractual arrangements whereby the Company agrees to issue a variable number of shares are accounted for as a liability. To the extent that these contractual arrangements meet the definition of a derivative, the value of the contractual arrangement is recorded on the balance sheet at fair value with movements in fair value being recorded in the income statement.
ii) Loans and Borrowings
All loans and borrowings are initially recognised at the fair value of the considerations received less directly attributable transaction cost. After initial recognition loans and borrowings are subsequently measured at amortised cost using the effective interest rate method. Gains and losses are recognised in the income statement when the liabilities are derecognised as well as through the effective interest rate method amortisation process.
Impairment of Financial Assets
The Group assesses at each reporting date whether there is any objective evidence that a financial asset or a group of financial assets is impaired. A financial asset or a group of financial assets is deemed to be impaired if, and only if, there is objective evidence of impairment as a result of one or more events that have occurred after the initial recognition of the asset (an incurred ‘loss event’) and that loss event has an impact on the estimated future cash flows of the financial asset or the group of financial assets that can be reliably estimated. Evidence of impairment may include indications that the debtors or a group of debtors is experiencing significant financial difficulty, default or delinquency in interest or principal payments, the probability that they will enter bankruptcy or other financial reorganisation and where observable data indicate that there is a measurable decrease in the estimated future cash flows, such as changes in arrears or economic conditions that correlate with defaults.
Financial Assets Carried at Amortised Cost
For financial assets carried at amortised cost, the Group first assesses individually whether objective evidence of impairment exists individually for financial assets that are individually significant, or collectively for financial assets that are not individually significant. If the Group determines that no objective evidence of impairment exists for an individually assessed financial asset, whether significant or not, it includes the asset in a group of financial assets with similar credit risk characteristics and collectively assesses them for impairment.
Assets that are individually assessed for impairment and for which an impairment loss is, or continues to be, recognised are not included in a collective assessment of impairment. If there is objective evidence that an impairment loss has incurred, the amount of the loss is measured as the difference between the asset’s carrying amount and the present value of estimated future cash flows excluding assets that are individually assessed for impairment and for which an impairment loss is, or continues to be, recognised are not included in a collective assessment of impairment. If there is objective evidence that an impairment loss has incurred, the amount of the loss is measured as the difference between the asset’s carrying amount and the present value of estimated future cash flows (excluding future expected credit losses that have not yet been incurred).
The carrying amount of the asset is reduced through the use of an allowance account and the amount of the loss is recognised in the income statement. Interest income continues to be accrued on the reduced carrying amount and is accrued using the rate of interest used to discount the future cash flows for the purpose of measuring the impairment loss. The interest income is recorded as part of finance income in the income statement. Loans together with the associated allowance are written off when there is no realistic prospect of future recovery and all collateral has been realised or has been transferred to the Group. If, in a subsequent year, the amount of the estimated impairment loss increases or decreases because of an event occurring after the impairment was recognised, the previously recognised impairment loss is increased or reduced by adjusting the allowance account. If a future write-off is later recovered, the recovery is credited to finance costs in the income statement.
The present value of the estimated future cash flows is discounted at the financial asset’s original effective interest rate. If a loan has a variable interest rate, the discount rate for measuring any impairment loss is the current effective interest rate.
For
per
sona
l use
onl
y

SAFM ANNUAL REPORT 201350
NOTES TO THE FINANCIAL STATEMENTS (CONTINUED)FOR THE YEAR ENDED 30 JUNE 2013
The diluted earnings per share is calculated as net profit or loss attributable to members of the parent divided by the weighted average number of ordinary shares and dilutive potential ordinary shares, adjusted for any bonus element. The weighted average number of shares was based on the consolidated weighted average number of shares in the reporting period.
The net profit or loss attributable to members of the parent is adjusted for:
■ costs of servicing equity (other than dividends) and preference share dividends;
■ the after tax effect of dividends and interest associated with dilutive potential ordinary shares that have been recognised as expenses; and
■ other non-discretionary changes in revenues or expenses during the period that would result from the dilution of potential ordinary shares.
r) Income TaxCurrent income tax assets and liabilities for the current and prior periods are measured at the amount expected to be recovered from or paid to the taxation authorities. The tax rates and tax laws used to compute the amount are those that are enacted or substantively enacted by the reporting date.
Deferred income tax is provided on all temporary differences at the reporting date between the tax bases of assets and liabilities and their carrying amounts for financial reporting purposes.
Deferred income tax assets and liabilities are recognised for all taxable temporary differences:
■ except where the deferred income tax liability arises from the initial recognition of an asset or liability in a transaction that is not a business combination and at the time of the transaction affects neither the accounting profit nor taxable profit or loss; and
■ in respect of taxable temporary differences associated with investments in subsidiaries, associates and interests in joint ventures, except where the timing of the reversal of the temporary differences can be controlled and it is probable that the temporary differences will not reverse in the foreseeable future.
The carrying amount of deferred income tax assets is reviewed at each reporting date and reduced to the extent that it is no longer probable that sufficient taxable profit will be available to allow all or part of the deferred income tax asset to be utilised.
Unrecognised deferred income tax assets are reassessed at each reporting date and are recognised to the extent that it has become probable that future taxable profit will allow the deferred income tax to be recovered.
Deferred income tax assets and liabilities are measured at the tax rates that are expected to apply to the year when the asset is realised or the liability is settled, based on tax rates (and tax laws) that have been enacted or substantively enacted at the reporting date. Income taxes relating to items recognised directly in equity are recognised in equity and not in profit or loss.
Deferred tax assets and deferred tax liabilities are offset only if a legally enforceable right exists to set off current tax assets against current tax liabilities and the deferred tax assets and liabilities relate to the same taxable entity and the same taxation authority.
2. ACCOUNTING POLICIES (CONTINUED)
m) Financial Liabilities (continued)
Derecognition
A financial liability is derecognised when the obligation under the liability is discharged or cancelled or expires.
When an existing financial liability is replaced by another from the same lender or substantially different terms, or the terms of an existing liability are substantially modified, such an exchange or modification is treated as a derecognition of the original liability and the recognition of a new liability, and the difference in the respective carrying amounts is recognized in the income statement.
n) Trade and Other PayablesTrade and other payables amounts represent liabilities for goods and services provided to the entity prior to the end of the financial year and which are unpaid. The amounts are unsecured and are usually paid within 30 days of invoice.
o) Interest Bearing Loans and BorrowingsAll loans and borrowings are initially recognised at cost, being the fair value of the consideration received net of issue costs associated with the borrowing.
After initial recognition, interest-bearing loans and borrowings are subsequently measured at amortised cost using the effective interest method. Amortised cost is calculated by taking into account any issue costs, and any discount or premium on settlement.
Gains and losses are recognised in the income statement when the liabilities are derecognised, as well as through the amortisation process.
p) Equity, Reserves and Dividend PaymentsShare capital represents the nominal value of shares that have been issued. Any transaction costs associated with the issuing of shares are deducted from share capital, net of any related income tax benefits.
Foreign currency translation differences arising on the translation of the Group’s foreign entities are included in the translation reserve (see note 2 (b)).
Retained earnings include all current and prior period retained profits.
Dividend distributions payable to equity shareholders are included in ‘other liabilities’ when the dividends have been approved in a general meeting prior to the reporting date.
All transactions with owners of the parent are recorded separately within equity.
q) Earnings Per ShareBasic earnings per share is calculated as net profit attributable to members of the parent, adjusted to exclude any costs of servicing equity (other than dividends), divided by the weighted average number of ordinary shares, adjusted for any bonus element.
For
per
sona
l use
onl
y

FOCUSED ON EXPANSION
51
u) Operating SegmentsOperating segments are identified based on the internal reports that are regularly reviewed by the Board of Director’s, the entities’ Chief Operating Decision Maker, for the purpose of allocating resources and assessing performance. The adoption of this “management approach” has resulted in the identification of reportable segments. The operating segments have been reviewed annually for impairment.
v) Significant Management Judgement in Applying Accounting Policies and Estimate UncertaintyWhen preparing the financial statements management undertakes a number of judgements, estimates and assumptions about recognition and measurement of assets, liabilities, income and expenses.
The actual results may differ from the judgements, estimates and assumptions made by management, and will seldom equal the estimated results.
Information about significant judgements, estimates and assumptions that have the most significant effect on recognition and measurement of assets, liabilities, income and expenses is provided below.
Deferred Tax
The assessment of the probability of future taxable income in which deferred tax assets can be utilised is based on the Group’s latest approved budget forecast, which is adjusted for significant non-taxable income and expenses and specific limits to the use of any unused tax loss or credit. The tax rules in the jurisdictions in which the Group operates are also carefully taken into consideration. If a positive forecast of taxable income indicates the probable use of a deferred tax asset, especially when it can be utilised without a time limit, that deferred tax asset is usually recognised in full. The recognition of deferred tax assets that are subject to certain legal or economic limits or uncertainties is assessed individually by management based on the specific facts and circumstances.
Decommissioning and Restoration Provision
The Group’s mining and exploration activities are subject to various laws and regulations governing the protection of the environment. The Group recognises management’s best estimate for assets retirement obligations in the period in which they are incurred. Actual costs incurred in the future periods could differ materially from the estimates. Additionally, future changes to environmental laws and regulations, life of mine estimates and discount rates could affect the carrying amount of this provision.
Units of Production Depreciation
Estimated mineable tonnes over the life of mine are used in determining the depreciation and/or amortisation of mine specific assets. This results in a depreciation/amortisation charge proportional to the depletion of the anticipated remaining life of mine production. Each item’s life, which is assessed annually, has regard to both its physical life limitations and to present assessments of mineable tonnes. These calculations require the use of estimates and assumptions, including the amount of mineable tonnes and estimates of future capital expenditure.
s) Goods and Services and Sales Tax
Australia
Revenues, expenses and assets are recognised net of the amount of Goods and Services Tax (GST) except:
■ where the amount of GST incurred is not recoverable from the taxation authority, it is recognised as part of the cost of the asset or as part of an item of expense; or
■ for receivables and payables which are recognised inclusive of GST.
The net amount of GST recoverable from, or payable to, the taxation authority is included as part of receivables or payables.
Brazil
Revenues, expenses and assets are recognised net of the amount of Tax on the Circulation of Goods, Interstate and Intercity Transportation and Communication Services (ICMS), Social Integration Program and Contribution for Financing of Social Security tax (PIS/COFINS) and Brazilian Royalty tax on Mineral Exploration (CFEM) except:
■ where the amount of ICMS or PIS/COFINS incurred is not recoverable from the taxation authority, it is recognised as part of the cost of the asset or as part of an item of expense; or
■ for receivables and payables which are recognised inclusive of ICMS or PIS/COFINS.
■ the net amount of ICMS or PIS/COFINS recoverable from, or payable to, the taxation authority is included as part of receivables or payables.
t) RevenueRevenue is recognised and measured at the fair value of consideration received or receivable to the extent that it is probable that the economic benefits will flow to the entity and the revenue can be reliably measured. The following specific recognition criteria must also be met before revenue is recognised:
Sale of Goods
Revenue is recognised when the significant risks and rewards of ownership of the goods have passed to the buyer and can be measured reliably.
Interest
Revenue is recognised as interest accrues using the effective interest method. This is a method of calculating the amortised cost of a financial asset and allocating the interest income over the relevant period using the effective interest rate, which is the rate that exactly discounts estimated future cash receipts through the expected life of the financial asset to the net carrying amount of the financial asset.
Dividends
Revenue is recognised when the shareholder’s right to receive the payment is established.
For
per
sona
l use
onl
y

SAFM ANNUAL REPORT 201352
NOTES TO THE FINANCIAL STATEMENTS (CONTINUED)FOR THE YEAR ENDED 30 JUNE 2013
The deferral policy requires management to make certain estimates and assumptions about future events or circumstances, in particular whether an economically viable extraction operation can be established. Estimates and assumptions made may change if new information becomes available.
Inventories
Costs incurred in or benefits of the productive process are accumulated as stockpiles. Net realisable value tests are performed at least annually and represent the estimated future sales price of the product based on prevailing spot metals prices at the reporting date, less estimated costs to complete production and bring the product to sale.
Stockpiles are measured by estimating the number of tonnes added and removed from the stockpile. Stockpile tonnages are verified by periodic surveys.
Valuation of Share Based Payments
The key estimates and assumptions used in the valuation of share based payment plans are set out in note 2 (i) and note 23.
2. ACCOUNTING POLICIES (CONTINUED)
v) Significant Management Judgement in Applying Accounting Policies and Estimate Uncertainty (continued)
Exploration and Evaluation Expenditure
The application of the Group’s accounting policy for exploration and evaluation expenditure requires judgment in determining whether it is likely that future economic benefits are likely either from future exploitation or sale or where activities have not reached a stage which permits a reasonable assessment of the existence of reserves. The determination of a Joint Ore Reserves Committee (JORC) resource is itself an estimation process that requires varying degrees of uncertainty depending on sub-classification and these estimates directly impact the point of deferral of exploration and evaluation expenditure.
w) New Accounting Standards and InterpretationsThe accounting policies adopted are consistent with IFRS, Australian Accounting Standards and AASB interpretations. The Company has adopted all new and amended Australian Accounting Standards and AASB interpretations as at 1 July 2012.
Reference Title
Application date of standard*
Impact on Group financial report
Application date for Group*
AASB 2010–8
Amendments to Australian Accounting Standards – Deferred Tax: Recovery of Underlying Assets AASB 112
These amendments address the determination of deferred tax on investment property measured at fair value and introduce a rebuttable presumption that deferred tax on investment property measured at fair value should be determined on the basis that the carrying amount will be recoverable through sale. The amendments also incorporate SIC–21 Income Taxes – Recovery of Revalued Non-Depreciable Assets into AASB 112.
1 Jan 2012 No material impact
1 July 2012
AASB 2011–9
Amendments to Australian Accounting Standards – Presentation of Other Comprehensive IncomeAASB 1, 5, 7, 101, 112, 120, 121, 132, 133, 134, 1039 & 1049 3
This standard requires entities to group items presented in other comprehensive income on the basis of whether they might be reclassified subsequently to profit or loss and those that will not.
1 July 2012 No material impact
1 July 2012
For
per
sona
l use
onl
y
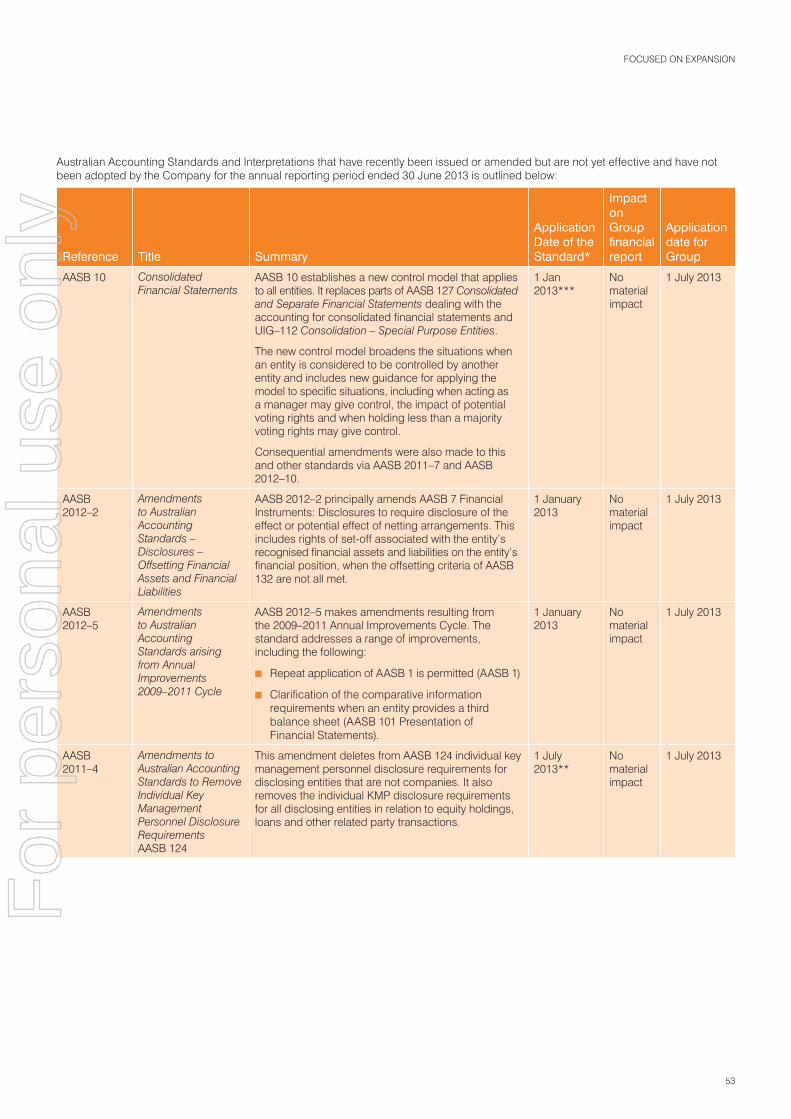
FOCUSED ON EXPANSION
53
Australian Accounting Standards and Interpretations that have recently been issued or amended but are not yet effective and have not been adopted by the Company for the annual reporting period ended 30 June 2013 is outlined below:
Reference Title Summary
Application Date of the Standard*
Impact on Group financial report
Application date for Group
AASB 10 Consolidated Financial Statements
AASB 10 establishes a new control model that applies to all entities. It replaces parts of AASB 127 Consolidated and Separate Financial Statements dealing with the accounting for consolidated financial statements and UIG–112 Consolidation – Special Purpose Entities.
The new control model broadens the situations when an entity is considered to be controlled by another entity and includes new guidance for applying the model to specific situations, including when acting as a manager may give control, the impact of potential voting rights and when holding less than a majority voting rights may give control.
Consequential amendments were also made to this and other standards via AASB 2011–7 and AASB 2012–10.
1 Jan 2013***
No material impact
1 July 2013
AASB 2012–2
Amendments to Australian Accounting Standards – Disclosures – Offsetting Financial Assets and Financial Liabilities
AASB 2012–2 principally amends AASB 7 Financial Instruments: Disclosures to require disclosure of the effect or potential effect of netting arrangements. This includes rights of set-off associated with the entity’s recognised financial assets and liabilities on the entity’s financial position, when the offsetting criteria of AASB 132 are not all met.
1 January 2013
No material impact
1 July 2013
AASB 2012–5
Amendments to Australian Accounting Standards arising from Annual Improvements 2009–2011 Cycle
AASB 2012–5 makes amendments resulting from the 2009–2011 Annual Improvements Cycle. The standard addresses a range of improvements, including the following:
■ Repeat application of AASB 1 is permitted (AASB 1)
■ Clarification of the comparative information requirements when an entity provides a third balance sheet (AASB 101 Presentation of Financial Statements).
1 January 2013
No material impact
1 July 2013
AASB 2011–4
Amendments to Australian Accounting Standards to Remove Individual Key Management Personnel Disclosure Requirements AASB 124
This amendment deletes from AASB 124 individual key management personnel disclosure requirements for disclosing entities that are not companies. It also removes the individual KMP disclosure requirements for all disclosing entities in relation to equity holdings, loans and other related party transactions.
1 July 2013**
No material impact
1 July 2013
For
per
sona
l use
onl
y

SAFM ANNUAL REPORT 201354
NOTES TO THE FINANCIAL STATEMENTS (CONTINUED)FOR THE YEAR ENDED 30 JUNE 2013
2. ACCOUNTING POLICIES (CONTINUED)
w) New Accounting Standards and Interpretations (continued)
Reference Title Summary
Application Date of the Standard*
Impact on Group financial report
Application date for Group
AASB 1053 Application of Tiers of Australian Accounting Standards
This standard establishes a differential financial reporting framework consisting of two tiers of reporting requirements for preparing general purpose financial statements:
(a) Tier 1: Australian Accounting Standards
(b) Tier 2: Australian Accounting Standards – Reduced Disclosure Requirements
Tier 2 comprises the recognition, measurement and presentation requirements of Tier 1 and substantially reduced disclosures corresponding to those requirements.
The following entities apply Tier 1 requirements in preparing general purpose financial statements:
(a) For-profit entities in the private sector that have public accountability (as defined in this standard)
(b) The Australian Government and State, Territory and Local governments
The following entities apply either Tier 2 or Tier 1 requirements in preparing general purpose financial statements:
(a) For-profit private sector entities that do not have public accountability
(b) All not-for-profit private sector entities
1 July 2013 No material impact
1 July 2013
ASB 2012–3 Amendments to Australian Accounting Standards – Offsetting Financial Assets and Financial Liabilities
AASB 2012–3 adds application guidance to AASB 132 Financial Instruments: Presentation to address inconsistencies identified in applying some of the offsetting criteria of AASB 132, including clarifying the meaning of “currently has a legally enforceable right of set-off” and that some gross settlement systems may be considered equivalent to net settlement.
1 January 2014
No material impact
1 July 2014
AASB 9 Financial Instruments AASB 9 includes requirements for the classification and measurement of financial assets. It was further amended by AASB 2010–7 to reflect amendments to the accounting for financial liabilities.
These requirements improve and simplify the approach for classification and measurement of financial assets compared with the requirements of AASB 139. The main changes are described below.
(a) Financial assets that are debt instruments will be classified based on (1) the objective of the entity’s business model for managing the financial assets; (2) the characteristics of the contractual cash flows.
1 Jan 2015 No material impact
1 July 2015
For
per
sona
l use
onl
y

FOCUSED ON EXPANSION
55
Reference Title Summary
Application Date of the Standard*
Impact on Group financial report
Application date for Group
AASB 9(continued)
Financial Instruments (b) Allows an irrevocable election on initial recognition to present gains and losses on investments in equity instruments that are not held for trading in other comprehensive income. Dividends in respect of these investments that are a return on investment can be recognised in profit or loss and there is no impairment or recycling on disposal of the instrument.
(c) Financial assets can be designated and measured at fair value through profit or loss at initial recognition if doing so eliminates or significantly reduces a measurement or recognition inconsistency that would arise from measuring assets or liabilities, or recognising the gains and losses on them, on different bases.
(d) Where the fair value option is used for financial liabilities the change in fair value is to be accounted for as follows:
■ The change attributable to changes in credit risk are presented in other comprehensive income (OCI)
■ The remaining change is presented in profit or loss
If this approach creates or enlarges an accounting mismatch in the profit or loss, the effect of the changes in credit risk are also presented in profit or loss.
Further amendments were made by AASB 2012–6 which amends the mandatory effective date to annual reporting periods beginning on or after 1 January 2015. AASB 2012–6 also modifies the relief from restating prior periods by amending AASB 7 to require additional disclosures on transition to AASB 9 in some circumstances.
Consequential amendments were also made to other standards as a result of AASB 9, introduced by AASB 2009–11 and superseded by AASB 2010–7 and 2010–10.
1 Jan 2015 No material impact
1 July 2015
AASB 13 Fair Value Measurement
AASB 13 establishes a single source of guidance for determining the fair value of assets and liabilities. AASB 13 does not change when an entity is required to use fair value, but rather, provides guidance on how to determine fair value when fair value is required or permitted. Application of this definition may result in different fair values being determined for the relevant assets.
AASB 13 also expands the disclosure requirements for all assets or liabilities carried at fair value. This includes information about the assumptions made and the qualitative impact of those assumptions on the fair value determined.
Consequential amendments were also made to other standards via AASB 2011–8.
1 January 2013
No material impact
1 July 2013
For
per
sona
l use
onl
y
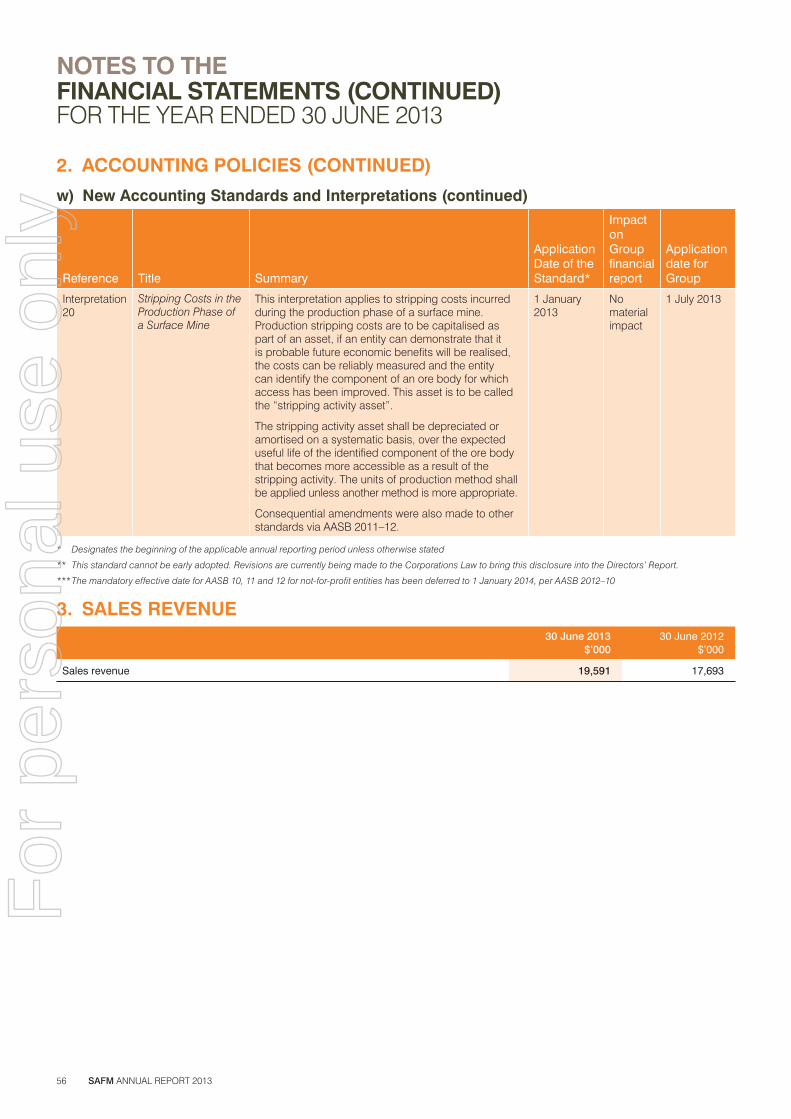
SAFM ANNUAL REPORT 201356
NOTES TO THE FINANCIAL STATEMENTS (CONTINUED)FOR THE YEAR ENDED 30 JUNE 2013
2. ACCOUNTING POLICIES (CONTINUED)
w) New Accounting Standards and Interpretations (continued)
Reference Title Summary
Application Date of the Standard*
Impact on Group financial report
Application date for Group
Interpretation 20
Stripping Costs in the Production Phase of a Surface Mine
This interpretation applies to stripping costs incurred during the production phase of a surface mine. Production stripping costs are to be capitalised as part of an asset, if an entity can demonstrate that it is probable future economic benefits will be realised, the costs can be reliably measured and the entity can identify the component of an ore body for which access has been improved. This asset is to be called the “stripping activity asset”.
The stripping activity asset shall be depreciated or amortised on a systematic basis, over the expected useful life of the identified component of the ore body that becomes more accessible as a result of the stripping activity. The units of production method shall be applied unless another method is more appropriate.
Consequential amendments were also made to other standards via AASB 2011–12.
1 January 2013
No material impact
1 July 2013
* Designates the beginning of the applicable annual reporting period unless otherwise stated
** This standard cannot be early adopted. Revisions are currently being made to the Corporations Law to bring this disclosure into the Directors’ Report.
*** The mandatory effective date for AASB 10, 11 and 12 for not-for-profit entities has been deferred to 1 January 2014, per AASB 2012–10
3. SALES REVENUE30 June 2013
$’00030 June 2012
$’000
Sales revenue 19,591 17,693
For
per
sona
l use
onl
y

FOCUSED ON EXPANSION
57
4. ADMINISTRATIVE AND OTHER EXPENSES30 June 2013
$’00030 June 2012
$’000
Accounting fees 260 243
Auditors’ remuneration (note 8) 93 122
Consulting fees 75 86
Depreciation not included cost of goods sold 6 4
Directors and Key Management Personnel remuneration and fees, excluding share based payments (note 7)
1,550 1,609
Rent 227 203
Legal fees 139 62
Travel and accommodation 930 531
Employee costs – Brazil Office 348 333
Write Off of Exploration asset (a) – 705
Bad Debt Provision 87 –
Other administrative expenses 1,033 730
4,748 4,628
a) Write off of Exploration asset relates to the Three Sisters Project. The Board of Directors assessed the development of the Three Sisters Project and resolved to relinquish the tenements on 19 December 2011. The relinquishment of the Project resulted in a write off of the Project totalling $689,909. Additional consulting and legal fees of $15,339 were paid in relation to the two licenses during the surrender process.
5. SHARE-BASED PAYMENT EXPENSE30 June 2013
$’00030 June 2012
$’000
Directors and KMP 172 381
Refer to note 21 for details on the valuation of share options.
For
per
sona
l use
onl
y
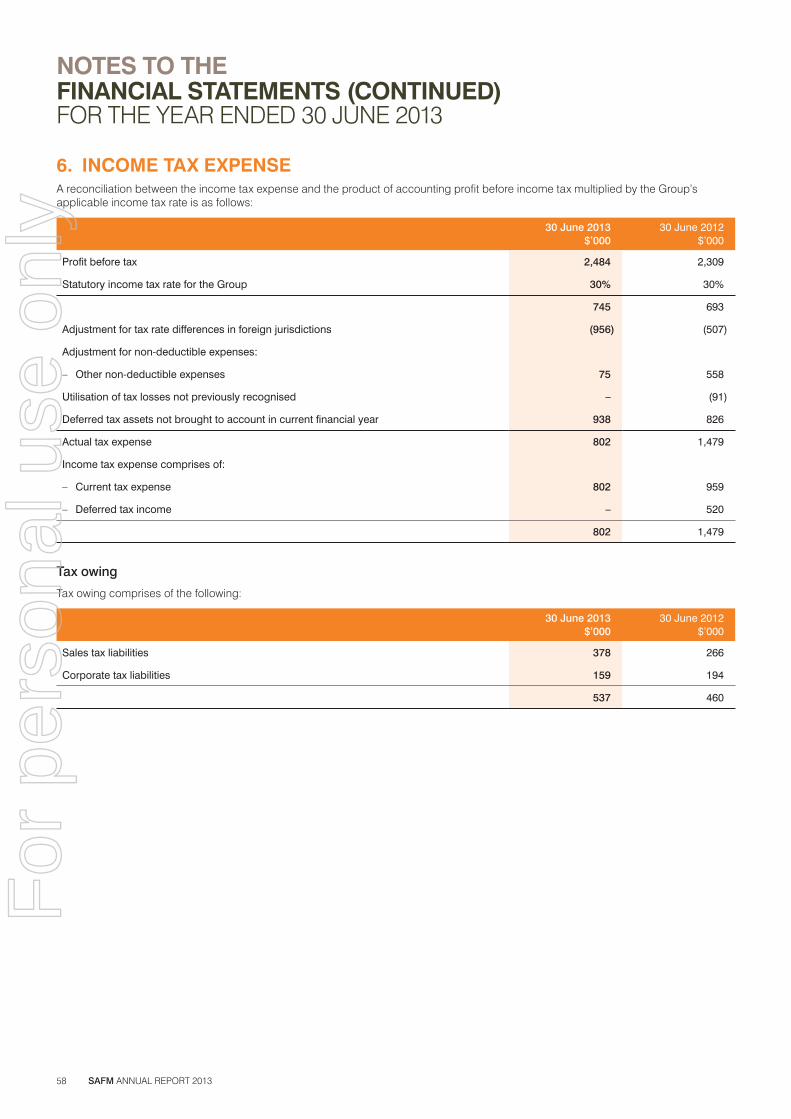
SAFM ANNUAL REPORT 201358
NOTES TO THE FINANCIAL STATEMENTS (CONTINUED)FOR THE YEAR ENDED 30 JUNE 2013
6. INCOME TAX EXPENSEA reconciliation between the income tax expense and the product of accounting profit before income tax multiplied by the Group’s applicable income tax rate is as follows:
30 June 2013$’000
30 June 2012$’000
Profit before tax 2,484 2,309
Statutory income tax rate for the Group 30% 30%
745 693
Adjustment for tax rate differences in foreign jurisdictions (956) (507)
Adjustment for non-deductible expenses:
– Other non-deductible expenses 75 558
Utilisation of tax losses not previously recognised – (91)
Deferred tax assets not brought to account in current financial year 938 826
Actual tax expense 802 1,479
Income tax expense comprises of:
– Current tax expense 802 959
– Deferred tax income – 520
802 1,479
Tax owing
Tax owing comprises of the following:
30 June 2013$’000
30 June 2012$’000
Sales tax liabilities 378 266
Corporate tax liabilities 159 194
537 460
For
per
sona
l use
onl
y

FOCUSED ON EXPANSION
59
Deferred Tax Asset
Deferred tax asset that arise from temporary timing differences and unused tax losses can be summarised as follows:
Balance at beginning of year
$’000
Recognised in profit and loss
$’000
Balance at end of year
$’000
30 June 2013
Temporary timing differences 208 – 215
Unused tax losses 167 – 172
Foreign Currency Translation Reserve (122) – (126)
Recognised as:
Deferred tax asset 253 – 261
30 June 2012
Temporary timing differences 169 39 208
Unused tax losses 726 (559) 167
Foreign Currency Translation Reserve – (122) (122)
Recognised as:
Deferred tax asset 895 (642) 253
7. INTERESTS OF DIRECTORS AND KEY MANAGEMENT PERSONNELThe remuneration paid to Directors and KMP of the Group during the year comprises the following:
30 June 2013$’000
30 June 2012$’000
Short-term employee benefits 1,768 1,611
Post-employment benefits 69 55
Incentive payments 59 126
Other fees (Refer to Section A of the remuneration report) 85 50
Less amounts included in cost of inventory (431) (233)
1,550 1,609
Share based payment expenses 172 381
1,722 1,990
For further details, please refer to the audited Remuneration Report which is included as part of the Directors’ report.
For
per
sona
l use
onl
y

SAFM ANNUAL REPORT 201360
NOTES TO THE FINANCIAL STATEMENTS (CONTINUED)FOR THE YEAR ENDED 30 JUNE 2013
7. INTERESTS OF DIRECTORS AND KEY MANAGEMENT PERSONNEL (CONTINUED)
Directors and KMP Options and Rights of Holdings
The number of unlisted options over ordinary shares held by each Director and KMP of the Group during the financial year is as follows:
30 June 2013
Balance at beginning of
year’000
Granted as remun- eration
’000Exercised
’000
Number of options lapsed/
forfeited’000
Balance at end of year
’000
Vested during the
year’000
Vested and exercisable
’000
Vested and unexer- cisable
’000
Terence Willsteed 5,000 5,000 – – 10,000 – – 5,000
Philip Hopkins 10,000 – – (10,000) – – – –
Stephen Fabian 2,500 – – – 2,500 – – 2,500
Stephen Turner 2,500 – – – 2,500 – – 2,500
Alan Doyle – 2,500 – – 2,500 – – –
Wayne Kernaghan – 2,500 – – 2,500 – – –
Dion Cohen 2,500 2,500 – – 5,000 – – 2,500
Jairo Leal – – – – – – – –
José Paixão – – – – – – – –
Eduardo Freitas – – – – – – – –
22,500 12,500 – (10,000) 25,000 – – 12,500
Please refer to Table 1 of the remuneration report for details of the KMP position.
Mr Lloyd and Mr Re are no longer considered KMP.
For
per
sona
l use
onl
y

FOCUSED ON EXPANSION
61
Listed options details are set out on page 26 in the Director’s Report, no movement occurred in relation to listed options during the year ended 30 June 2013.
30 June 2012
Balance at beginning
of year’000
Granted as remun- eration
’000Exercised
’000
Number of options lapsed/
forfeited’000
Balance at end of year
’000
Vested during the
year’000
Vested and exercisable
’000
Vested and unexer- cisable
’000
Terence Willsteed 5,000 – – – 5,000 3,333 – 5,000
Philip Hopkins 10,000 – – – 10,000 6,667 – 6,667
Stephen Fabian 2,500 – – – 2,500 1,667 – 2,500
Stephen Turner 2,500 – – – 2,500 1,667 – 2,500
Alan Doyle – – – – – – – –
Wayne Kernaghan – – – – – – – –
Philip Re 3,500 – – (2,870) 630 422 – 630
Paul Lloyd 3,500 – – – 3,500 2,333 – 3,500
Dion Cohen 2,500 – – – 2,500 1,667 – 2,500
Helvécio Pires – – – – – – – –
José Paixão – – – – – – – –
Eduardo Freitas – – – – – – – –
Rodrigo Branco – – – – – – – –
Glauco Mol – – – – – – – –
29,500 – – (2,870) 26,630 17,756 – 23,297
The number of ordinary shares in SAFM Limited held directly or indirectly by each Director and KMP of the Group at 30 June 2013 and 30 June 2012 are as follows:
30 June 2013SAFM Limited
Balance at beginning of
year’000
Issued on exercise of
options during the
year’000
Ordinary Shares
Purchased’000
Balance at end of year
’000
Terence Willsteed 2,736 – – 2,736
Philip Hopkins – – – –
Stephen Fabian 44,599 – – 44,599
Stephen Turner 61,690 – – 61,690
Alan Doyle 64,914 – 1,000 65,914
Wayne Kernaghan 903 – 747 1,650
Dion Cohen 400 – 77 477
Jairo Leal – – – –
José Paixão – – – –
Eduardo Freitas – – – –
175,242 – 1,824 177,066
For
per
sona
l use
onl
y
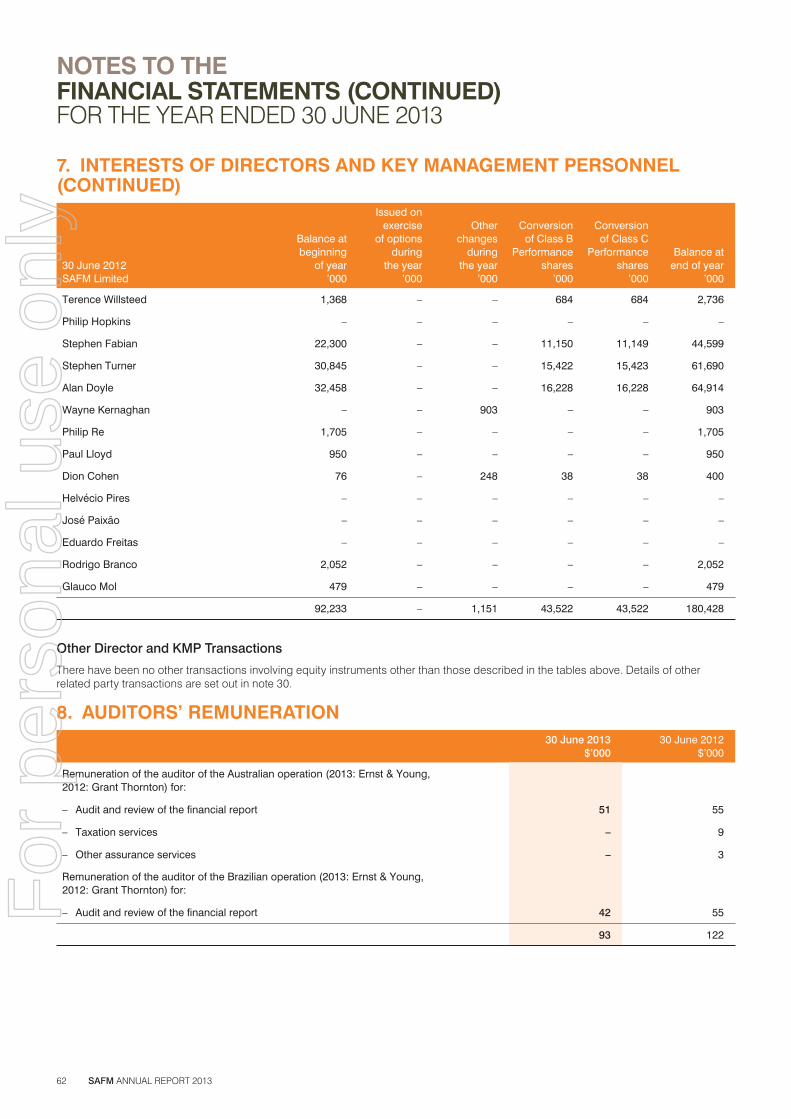
SAFM ANNUAL REPORT 201362
NOTES TO THE FINANCIAL STATEMENTS (CONTINUED)FOR THE YEAR ENDED 30 JUNE 2013
7. INTERESTS OF DIRECTORS AND KEY MANAGEMENT PERSONNEL (CONTINUED)
30 June 2012SAFM Limited
Balance at beginning
of year’000
Issued on exercise
of options during
the year’000
Other changes
during the year
’000
Conversion of Class B
Performance shares
’000
Conversion of Class C
Performance shares
’000
Balance at end of year
’000
Terence Willsteed 1,368 – – 684 684 2,736
Philip Hopkins – – – – – –
Stephen Fabian 22,300 – – 11,150 11,149 44,599
Stephen Turner 30,845 – – 15,422 15,423 61,690
Alan Doyle 32,458 – – 16,228 16,228 64,914
Wayne Kernaghan – – 903 – – 903
Philip Re 1,705 – – – – 1,705
Paul Lloyd 950 – – – – 950
Dion Cohen 76 – 248 38 38 400
Helvécio Pires – – – – – –
José Paixão – – – – – –
Eduardo Freitas – – – – – –
Rodrigo Branco 2,052 – – – – 2,052
Glauco Mol 479 – – – – 479
92,233 – 1,151 43,522 43,522 180,428
Other Director and KMP Transactions
There have been no other transactions involving equity instruments other than those described in the tables above. Details of other related party transactions are set out in note 30.
8. AUDITORS’ REMUNERATION30 June 2013
$’00030 June 2012
$’000
Remuneration of the auditor of the Australian operation (2013: Ernst & Young, 2012: Grant Thornton) for:
– Audit and review of the financial report 51 55
– Taxation services – 9
– Other assurance services – 3
Remuneration of the auditor of the Brazilian operation (2013: Ernst & Young, 2012: Grant Thornton) for:
– Audit and review of the financial report 42 55
93 122
For
per
sona
l use
onl
y

FOCUSED ON EXPANSION
63
9. EARNINGS PER SHAREThe following reflects the earnings and number of shares used in the calculation of the basic and diluted earnings per share:
30 June 2013$’000
30 June 2012$
Basic earnings per share (cents per share) 0.41 0.68
Diluted earnings per share (cents per share) 0.38 0.62
Net profit attributable to ordinary shareholders ($’000) 1,682 2,309
Shares Shares
Weighted average number of ordinary shares used in the calculation of basic earnings 409,147,659 340,584,825
Share Options 29,130,000 31,630,000
Weighted average number of ordinary shares used in the calculation of diluted earnings 438,277,659 372,214,825
10. CASH AND CASH EQUIVALENTS30 June 2013
$’00030 June 2012
$’000
Cash at bank 411 5,403
Cash at hand earns interest at 1.44% per annum on the daily balance.
11. TRADE AND OTHER RECEIVABLES30 June 2013
$’00030 June 2012
$’000
Trade debtors (a) 1,219 1,821
Provision for doubtful debt (a) (89) –
Tax refunds (b) 86 42
Other Receivables 38 –
1,254 1,863
a) Trade debtors relate to the outstanding receipts from sales. Payment terms are either cash on delivery or for a maximum of 30 days for approved customers. A provision for doubtful debt of $89,178 has been provided at 30 June 2013 (2012: nil).
b) Tax refunds due relating to the relevant Goods and Services Tax paid in Australia and Brazil.
12. PREPAYMENTS30 June 2013
$’00030 June 2012
$’000
Prepayments 217 16
Prepayments relate to $200,311 prepaid finance costs for legal services provided in relation to the Deutsche Bank loan facility (refer to Note 29: Events after the end of reporting period) and $16,933 relating to expenditure paid in advance for insurance.
For
per
sona
l use
onl
y

SAFM ANNUAL REPORT 201364
NOTES TO THE FINANCIAL STATEMENTS (CONTINUED)FOR THE YEAR ENDED 30 JUNE 2013
13. INVENTORIES30 June 2013
$’00030 June 2012
$’000
Raw material (a) 590 15
Concentrator Feed (b) 306 650
Consumable Stock (c) 666 –
Finished goods (d) 2,379 166
3,941 831
a) Raw Material is valued at Cost at 30 June 2012 and 2013.
b) Concentrate Feed is valued at Net Realisable Value at 30 June 2012 and 2013.
c) Consumable Stock is valued at Cost at 30 June 2012 and 2013.
d) Finished Stock is valued at Cost at 30 June 2012 and at Net Realisable Value at 30 June 2013.
During 2013 $458,108 (2012: Nil) was recognised as an expense for inventories carried at Net Realisable Value. This is recognised in Cost of Sale.
14. EXPLORATION AND EVALUATION ASSETS30 June 2013
$’00030 June 2012
$’000
Opening Balance 2,617 1,187
Exploration expenditure capitalised
– Exploration and evaluation phases 999 1,873
– Resource drilling program 611 268
Less –
– Amortisation (14) (6)
– Write Off (a) – (705)
– Foreign exchange movement 87 –
4,300 2,617
The recoverability of the carrying amount of the exploration and evaluation assets is dependent upon the successful development of the area or where activities in the area have not yet reached that stage it permits reasonable assessment of the existence of economically recoverable reserves.a) Write off relates to the surrender of gold mining exploration permits on 19 December 2011 – EPM 14588 and EPM 15517, which are located 250km south
of Charters Towers, Queensland, Australia and collectively referred to as “The Three Sisters Project”.
For
per
sona
l use
onl
y

FOCUSED ON EXPANSION
65
15. MINING PROPERTIES
30 June 2013Cost
$’000
Accumulated Amortisation
$’000Carrying Value
$’000
Mineral rights 7,831 (203) 7,628
7,831 (203) 7,628
30 June 2013
Carrying Value$’000
Foreign currency
translation reserve
$’000Additions
$’000
Reversal (note 27)
$’000Amortisation
$’000
Carrying Value$’000
Surface rights (a) 2,317 – – (2,317) – –
Mineral rights 7,448 248 – – (68) 7,628
9,765 248 – (2,139) (246) 7,628
30 June 2012Cost
$’000
Accumulated Amortisation
$’000Carrying Value
$’000
Surface rights (a) 2,359 (42) 2,317
Mineral rights 7,584 (136) 7,448
9,943 (178) 9,765
30 June 2012
Carrying Value$’000
Foreign currency
translation reserve
$’000Additions
$’000Reversal
$’000Amortisation
$’000
Carrying Value$’000
Surface rights (a) 2,970 (628) – – (25) 2,317
Mineral rights 9,549 (2,022) – – (79) 7,448
12,519 (2,650) – – (104) 9,765
a) In 2013, SAFM reverse the asset relating to the surface rights due to an on-going judicial process. Refer to Note: 27 Capital Commitment and Contingencies.
For
per
sona
l use
onl
y
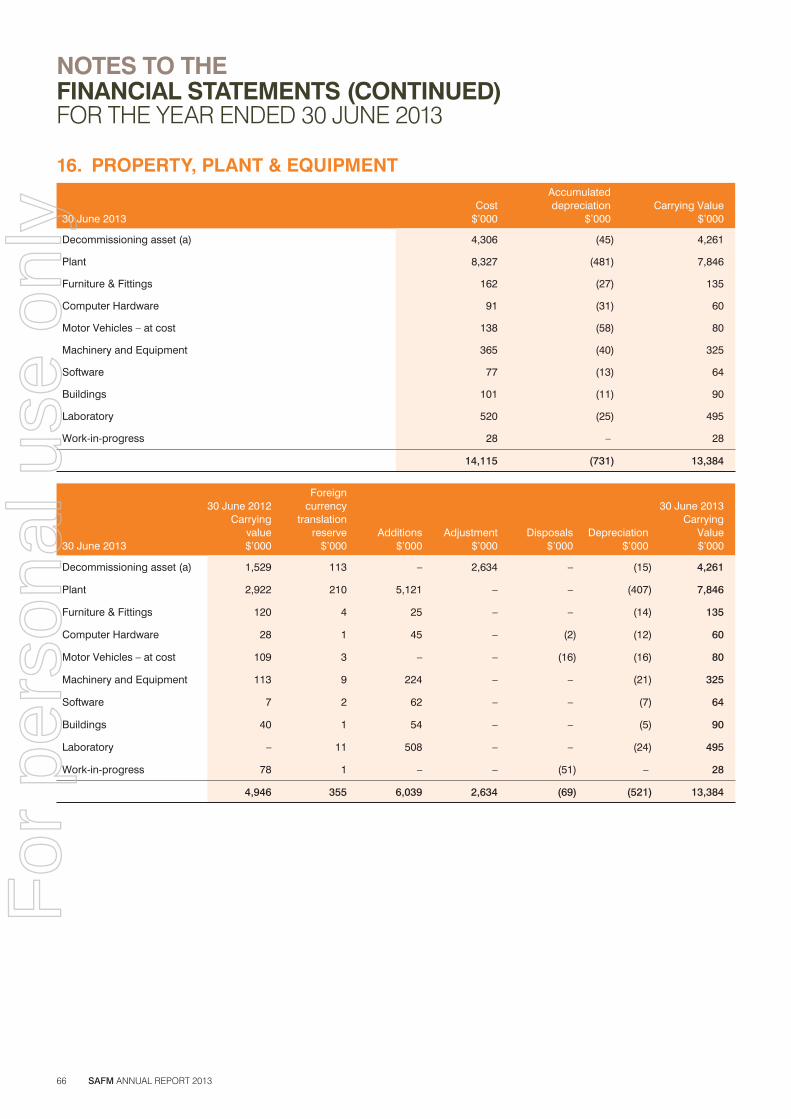
SAFM ANNUAL REPORT 201366
NOTES TO THE FINANCIAL STATEMENTS (CONTINUED)FOR THE YEAR ENDED 30 JUNE 2013
16. PROPERTY, PLANT & EQUIPMENT
30 June 2013Cost
$’000
Accumulated depreciation
$’000Carrying Value
$’000
Decommissioning asset (a) 4,306 (45) 4,261
Plant 8,327 (481) 7,846
Furniture & Fittings 162 (27) 135
Computer Hardware 91 (31) 60
Motor Vehicles – at cost 138 (58) 80
Machinery and Equipment 365 (40) 325
Software 77 (13) 64
Buildings 101 (11) 90
Laboratory 520 (25) 495
Work-in-progress 28 – 28
14,115 (731) 13,384
30 June 2013
30 June 2012Carrying
value$’000
Foreign currency
translation reserve
$’000Additions
$’000Adjustment
$’000Disposals
$’000Depreciation
$’000
30 June 2013Carrying
Value$’000
Decommissioning asset (a) 1,529 113 – 2,634 – (15) 4,261
Plant 2,922 210 5,121 – – (407) 7,846
Furniture & Fittings 120 4 25 – – (14) 135
Computer Hardware 28 1 45 – (2) (12) 60
Motor Vehicles – at cost 109 3 – – (16) (16) 80
Machinery and Equipment 113 9 224 – – (21) 325
Software 7 2 62 – – (7) 64
Buildings 40 1 54 – – (5) 90
Laboratory – 11 508 – – (24) 495
Work-in-progress 78 1 – – (51) – 28
4,946 355 6,039 2,634 (69) (521) 13,384
For
per
sona
l use
onl
y
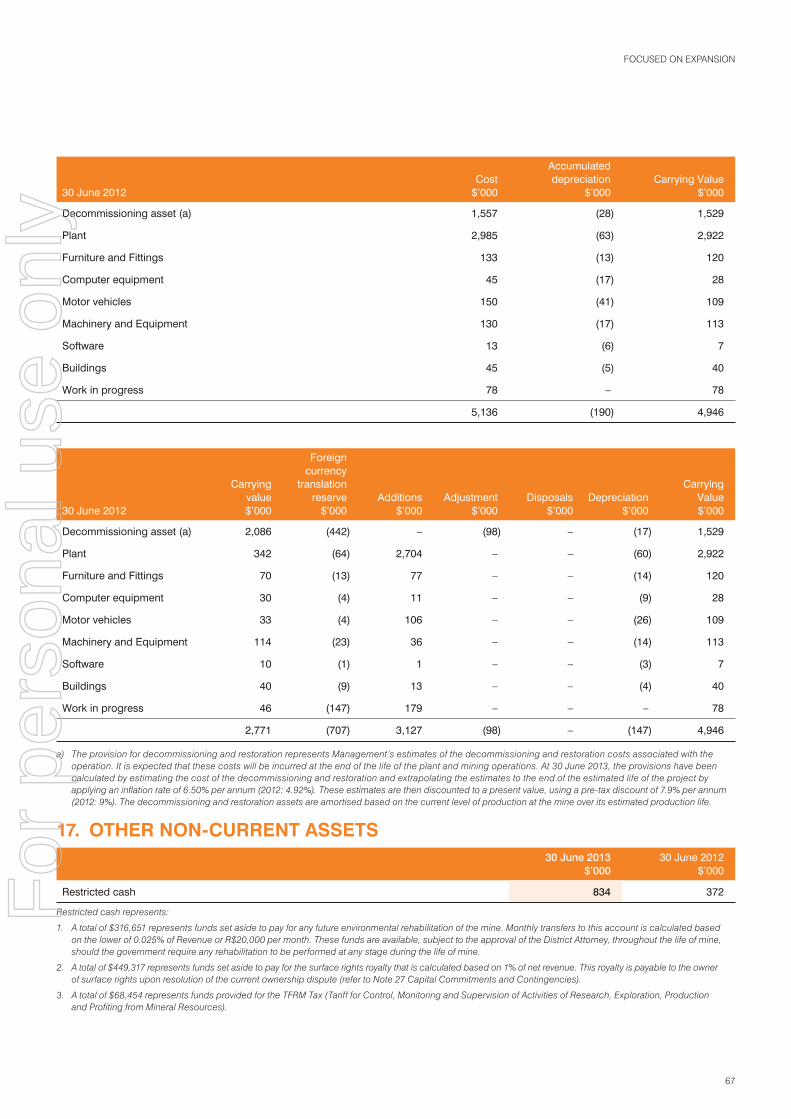
FOCUSED ON EXPANSION
67
30 June 2012Cost
$’000
Accumulated depreciation
$’000Carrying Value
$’000
Decommissioning asset (a) 1,557 (28) 1,529
Plant 2,985 (63) 2,922
Furniture and Fittings 133 (13) 120
Computer equipment 45 (17) 28
Motor vehicles 150 (41) 109
Machinery and Equipment 130 (17) 113
Software 13 (6) 7
Buildings 45 (5) 40
Work in progress 78 – 78
5,136 (190) 4,946
30 June 2012
Carrying value$’000
Foreign currency
translation reserve
$’000Additions
$’000Adjustment
$’000Disposals
$’000Depreciation
$’000
Carrying Value$’000
Decommissioning asset (a) 2,086 (442) – (98) – (17) 1,529
Plant 342 (64) 2,704 – – (60) 2,922
Furniture and Fittings 70 (13) 77 – – (14) 120
Computer equipment 30 (4) 11 – – (9) 28
Motor vehicles 33 (4) 106 – – (26) 109
Machinery and Equipment 114 (23) 36 – – (14) 113
Software 10 (1) 1 – – (3) 7
Buildings 40 (9) 13 – – (4) 40
Work in progress 46 (147) 179 – – – 78
2,771 (707) 3,127 (98) – (147) 4,946
a) The provision for decommissioning and restoration represents Management’s estimates of the decommissioning and restoration costs associated with the operation. It is expected that these costs will be incurred at the end of the life of the plant and mining operations. At 30 June 2013, the provisions have been calculated by estimating the cost of the decommissioning and restoration and extrapolating the estimates to the end of the estimated life of the project by applying an inflation rate of 6.50% per annum (2012: 4.92%). These estimates are then discounted to a present value, using a pre-tax discount of 7.9% per annum (2012: 9%). The decommissioning and restoration assets are amortised based on the current level of production at the mine over its estimated production life.
17. OTHER NON-CURRENT ASSETS30 June 2013
$’00030 June 2012
$’000
Restricted cash 834 372
Restricted cash represents:
1. A total of $316,651 represents funds set aside to pay for any future environmental rehabilitation of the mine. Monthly transfers to this account is calculated based on the lower of 0.025% of Revenue or R$20,000 per month. These funds are available, subject to the approval of the District Attorney, throughout the life of mine, should the government require any rehabilitation to be performed at any stage during the life of mine.
2. A total of $449,317 represents funds set aside to pay for the surface rights royalty that is calculated based on 1% of net revenue. This royalty is payable to the owner of surface rights upon resolution of the current ownership dispute (refer to Note 27 Capital Commitments and Contingencies).
3. A total of $68,454 represents funds provided for the TFRM Tax (Tariff for Control, Monitoring and Supervision of Activities of Research, Exploration, Production and Profiting from Mineral Resources).
For
per
sona
l use
onl
y

SAFM ANNUAL REPORT 201368
NOTES TO THE FINANCIAL STATEMENTS (CONTINUED)FOR THE YEAR ENDED 30 JUNE 2013
18. TRADE AND OTHER PAYABLES30 June 2013
$’00030 June 2012
$’000
Sundry creditors and accruals 458 113
Trade creditors 2,511 997
2,969 1,110
Due to the short-term nature of these payables, the carrying values are assumed to approximate their fair values.
19. INTEREST-BEARING LOANS AND BORROWINGS30 June 2013
$’00030 June 2012
$’000
Bank debt (a) 271 –
Short term portion of lease liability (b) – 8
271 8
a) On 25 February 2013, SAFM obtained a loan with Itau Bank for $396,547 at 16.32% of which $271,417 remained outstanding at 30 June 2013. This loan is payable in full by 25 February 2014.
b) On 18 October 2011, SAFM Brazil purchased a vehicle for $44,992 (R$95,000) of which half was paid in cash and the remaining value of $22,496 (R$47,500) was placed on a finance lease. At 30 June 2013 this amount was settled.
20. PROVISIONS30 June 2013
$’00030 June 2012
$’000
Current provisions
Employee benefits (a) 502 416
Environmental provision (b) – 42
Audit Fee provision (c) 12 –
Tax Provision (d) 356 –
Other provisions (e) 125 –
995 458
Non-current provisions
Surface right payment provision (f) – 2,359
Rehabilitation provision (g) 4,524 1,633
Royalty payment provision (h) 419 206
4,943 4,198
a) The Employee Benefits provision represents accrued annual leave and 13th cheque payable to SAFM all Brazil employees.
b) The Environmental provision represents the estimated costs for environmental works required as part of SAFM’s mining license.
c) The Audit fee provision relates to assurance services provided by EY for the period ended 30 June 2013.
d) Tax Provision represents TFRM (Taxa Estadual de Recursos Minerais) tax payable to the Brazilian Revenue Office.
e) Other Provisions relate to travel expenses incurred in June 2013.
f) The Surface right payment provision represents the outstanding amount that is payable upon registration of the surface rights. This provision has been reclassified as a contingent liability (Note 27).
g) The provision for rehabilitation provision represents Management’s estimates of the decommissioning and restoration costs associated with the operation. It is expected that these costs will be incurred at the end of the life of the plant and mining operations. At 30 June 2013, the provisions have been calculated by estimating the cost of the decommissioning and restoration and extrapolating the estimates to the end of the estimated life of the project by applying an inflation rate of 6.50% per annum (2012: 4.92%). These estimates are then discounted to a present value, using a pre-tax discount of 7.9% per annum (2012: 9%). The decommissioning and restoration assets are amortised based on the current level of production at the mine over its estimated production life.
h) The Royalty payments provision represents a surface rights royalty that is calculated based on 1% of net revenue. This royalty is payable to the owner of surface rights upon resolution of the current ownership dispute (note 29).
For
per
sona
l use
onl
y

FOCUSED ON EXPANSION
69
The current provisions comprise the following:
30 June 2013$’000
30 June 2012$’000
Employee benefits
Opening balance 416 108
Foreign exchange movement 8 (46)
Provision recognised during the year 924 670
Provision utilised during the year (846) (316)
Closing balance 502 416
Environmental provision
Opening balance 42 308
Foreign exchange movement – (66)
Provision recognised during the year 9 25
Provision utilised during the year (51) (225)
Closing balance – 42
Tax Provision
Opening balance – –
Foreign exchange movement 8 –
Provision recognised during the year 415 –
Provision utilised during the year (67) –
Closing balance 356 –
The non-current provisions comprise the following:
30 June 2013$’000
30 June 2012$’000
Surface right payment provision
Opening balance 2,359 2,996
Provision recognised during the year – –
Foreign exchange movement in provision 77 (637)
Provision utilised during the year – –
Adjustment (note 27) 2,436 –
Closing balance – 2,359
Rehabilitation provision
Opening balance 1,633 2,292
Foreign exchange movement 121 (477)
Provision recognised during the year – –
Unwinding of the discount 136 (84)
Provision utilised during the year – –
Provision adjustment 2,634 (98)
Closing balance 4,524 1,633
For
per
sona
l use
onl
y

SAFM ANNUAL REPORT 201370
NOTES TO THE FINANCIAL STATEMENTS (CONTINUED)FOR THE YEAR ENDED 30 JUNE 2013
20. PROVISIONS (CONTINUED)30 June 2013
$’00030 June 2012
$’000
Royalty payment provision
Opening balance 206 37
Foreign exchange movement 12 (8)
Provision recognised during the year 234 180
Provision utilised during the year (33) (3)
Closing balance 419 206
21. CONTRIBUTED EQUITYThere were no movements in contributed equity for the year:
30 June 2013$’000
30 June 2012$’000
Contributed Equity 48,312 48,312
The issued shares above rank pari-passu in all respects with existing ordinary shares.
Ordinary Shares
Ordinary shares have no par value. Ordinary shares have the right to receive dividends as declared and, in the event of the winding up of the Company, to participate in the proceeds from the sale of all surplus assets in proportion to the number of and amounts paid up on shares held. Ordinary shares entitle their holder to one vote, either in person or by proxy, at a meeting of the Company.
Listed Options
The following table sets out the listed options issued over ordinary shares granted and exercised during each year:
30 June 2013$’000
30 June 2012(’000)
Opening balance 22,431 22,431
Options exercised – –
Options granted – –
Closing balance 22,431 22,431
Unlisted Options
The following table sets out the unlisted options issued over ordinary shares granted and exercised during each year:
2013(’000)
2013Weighted average
fair value per option ($)
2012(’000)
2012Weighted average
fair value per option ($)
Opening balance 31,630 0.04 34,500 0.04
Options granted to Directors and KMP (a) 12,500 0.05 – –
Options exercised – – – –
Options forfeited (b) (15,000) 0.04 (2,870) 0.04
Closing balance 29,130 0.04 31,630 0.04
For
per
sona
l use
onl
y

FOCUSED ON EXPANSION
71
Capital Management
Management controls the capital of the Group in order to maintain a capital structure that will ensure the lowest cost of capital available to the Group. Management’s objective is to ensure the Group continues as a going concern as well as to maintain optimal returns to shareholders. Capital Management is monitored through monthly Treasury reports, as well as detailed quarterly budgets that are prepared and presented to the Board.
The Group’s debt and capital includes ordinary share capital and financial liabilities, supported by financial assets.
As the market is constantly changing, management may change the amount of dividends to be paid to shareholders, return capital to shareholders or issue new shares to reduce debt. Should a strategic acquisition be pursued, management may issue further shares on the market.
There are no externally imposed capital requirements.
a) Options Granted to Directors and KMPOn 20 December 2012, options were issued to Directors and KMP. These options vest in three equal tranches based on performance milestones and exercise condition being reached. Refer to the remuneration report for further details on and vesting and exercise conditions.
The options were valued using the Binomial options pricing model using a Monte Carlo simulation analysis to take into account the vesting and exercise conditions. The following assumptions were used in the determining the fair value of the options:
Grant date 20/12/2012
Exercise price at grant date $0.12
Expiry date 15/11/2017
Share price at date of grant $0.11
Volatility 65%
Option life (years) 5
Dividend yield –
Risk free investment rate 2.73%
Weighted average fair value at grant date * $0.048
These options have been expensed within share based payments in the Income Statement.
b) Options ForfeitedUpon resignation of Mr Re, 2,870,000 options with an exercise price of $0.36 per share and an expiry date of 31 December 2015 were forfeited.
Upon resignation of Mr Hopkins, 10,000,000 options with an exercise price of $0.36 per share and an expiry date of 31 December 2015 were forfeited.
On 30 June 2013 5,000,000 unlisted options expired. The options were issued on 16 March 2011 to Veritas for the provision of corporate advisory services during FY2011.
22. SHARE-BASED PAYMENT RESERVE30 June 2013
$’00030 June 2012
$’000
Opening balance 1,378 997
Share-based payment expense 172 381
Closing balance 1,550 1,378For
per
sona
l use
onl
y

SAFM ANNUAL REPORT 201372
NOTES TO THE FINANCIAL STATEMENTS (CONTINUED)FOR THE YEAR ENDED 30 JUNE 2013
23. FOREIGN CURRENCY TRANSLATION RESERVE30 June 2013
$’00030 June 2012
$’000
Opening balance (5,597) (1,918)
Exchange differences on translating foreign controlled entities 709 (3,679)
Closing balance (4,888) (5,597)
The foreign currency translation reserve records exchange differences arising on the translation of foreign controlled subsidiaries.
24. ACCUMULATED LOSSES30 June 2013
$’00030 June 2012
$’000
Opening balance (24,261) (26,570)
Profit after tax attributable to the equity holders of the parent during the year 1,682 2,309
Closing balance (22,579) (24,261)
25. OPERATING SEGMENTSThe Group has determined operating segments based on the information provided to the Board of Directors (Chief Operating Decision Maker).
The Group operates predominately in one business segment, being the mining, processing and sale of iron ore in Brazil. There is no material difference between the financial information presented to the Chief Operating Decision Maker and the financial information presented in this report.
26. RECONCILIATION OF CASHFLOWS FROM OPERATING ACTIVITIES30 June 2013
$’00030 June 2012
$’000
Profit before income tax 2,484 3,788
Adjusted for:
Non-cash items:
Depreciation, amortisation and impairment 615 257
Unwinding of the discount in the rehabilitation provision 136 (84)
Inventory net realisable write down 447 –
Share based payment expense 172 381
Provision for bad debt 87 –
Exploration expenses written off – 705
Net interest and dividends received (55) (419)
Change in inventories (3,434) 442
Change in trade and other receivables 561 163
Change in prepayments (201) 16
Change in trade and other payables 1,957 374
Change in provisions 527 57
Add back restricted cash payments (462) (285)
Add back taxation paid (592) (1,581)
Net cash from operating activities 2,242 3,814
For
per
sona
l use
onl
y

FOCUSED ON EXPANSION
73
27. CAPITAL COMMITMENTS AND CONTINGENCIESSAFM Brazil
30 June 2013$’000
30 June 2012$’000
Contracted for 431 1,934
Authorised but not contracted for – 1,098
431 3,032
Capital Commitments relate mainly to Definitive Feasibility Programme including $1.1 million to Logicamms for engineering study for potential rail and port access.
Finance Lease Commitment
The minimum lease payments under finance lease arrangements are set out in the following table:
30 June 2013$’000
30 June 2012$’000
Within 1 year – 8
Between 1 and 5 years – –
Greater than 5 years – –
Total future lease payments – –
Less: future finance charges – –
Lease liability – 8
Represented by:
Current lease liability – 8
Non-current lease liability – –
Lease liability – 8
Operating Lease Commitment
The minimum lease payments under finance lease arrangements are set out in the following table:
30 June 2013$’000
30 June 2012$’000
Within 1 year 101 139
Between 1 and 5 years – 23
Greater than 5 years – –
Total future lease payments 101 162
For
per
sona
l use
onl
y

SAFM ANNUAL REPORT 201374
NOTES TO THE FINANCIAL STATEMENTS (CONTINUED)FOR THE YEAR ENDED 30 JUNE 2013
27. CAPITAL COMMITMENTS AND CONTINGENCIES (CONTINUED)
Contingent Asset & Liability
On 28 January 2008, SAFM purchased the surface rights from the vendor of the Mineral rights. At the date of the purchase, the vendor testified that he was the owner of surface rights, and was entitled to receive a consideration of US$2,791,250 (“the Surface Rights Instalment”), subject to the transfer of the surface rights into SAFM’s name.
At this time a liability was recognised for the Surface Rights Instalment, and a corresponding asset, on the basis that it was believed that the transfer of the surface rights would be executed imminently and SAFM had the right of use and enjoyment of the surface rights. However his name did not appear on the property register (nº 8797 of 16 December of 1991) and this payment was not effected. The vendor is currently following a judicial process through the Brazilian Courts to ascertain the legal owner of these rights. SAFM is not a party to this process.
Under Brazilian law, SAFM has full surface right access to the property, being the holder of the Mineral rights. However, it is the Company’s view that no liability exists for the Surface Rights Instalment until the owner of the surface rights has been established and title is transferred to SAFM. As such, the surface rights asset and liability have been reversed in 2013.
In the event that the vendor is awarded the surface rights, SAFM will settle the surface rights instalment and record the surface rights as a fixed asset in its books. In the meantime, SAFM is required to pay a royalty of 1% on net revenues until the title to the surface rights have been transferred. As the owner of the surface rights has not yet been established, SAFM currently deposits this amount into a restricted escrow account on a monthly basis (refer note 17).
28. PARENT COMPANY INFORMATION
SAFM Holdings Limited
30 June 2013$’000
30 June 2012$’000
Current assets 1,507 13
Total assets 44,889 46,349
Current liabilities 1,504 324
Total liabilities 2,004 324
Contributed equity 52,158 52,158
Accumulated losses (10,890) (7,511)
Foreign currency translation reserve 67 –
Share based payment reserve 1,550 1,378
Total shareholders’ equity 42,885 46,024
Loss of the parent entity (3,378) (3,509)
Total comprehensive loss of the parent entity (3,378) (3,509)
Guarantees entered into by the parent entity in relation to the debts of its subsidiaries – –
Capital Commitments – refer to note 27 for further details – –
For
per
sona
l use
onl
y
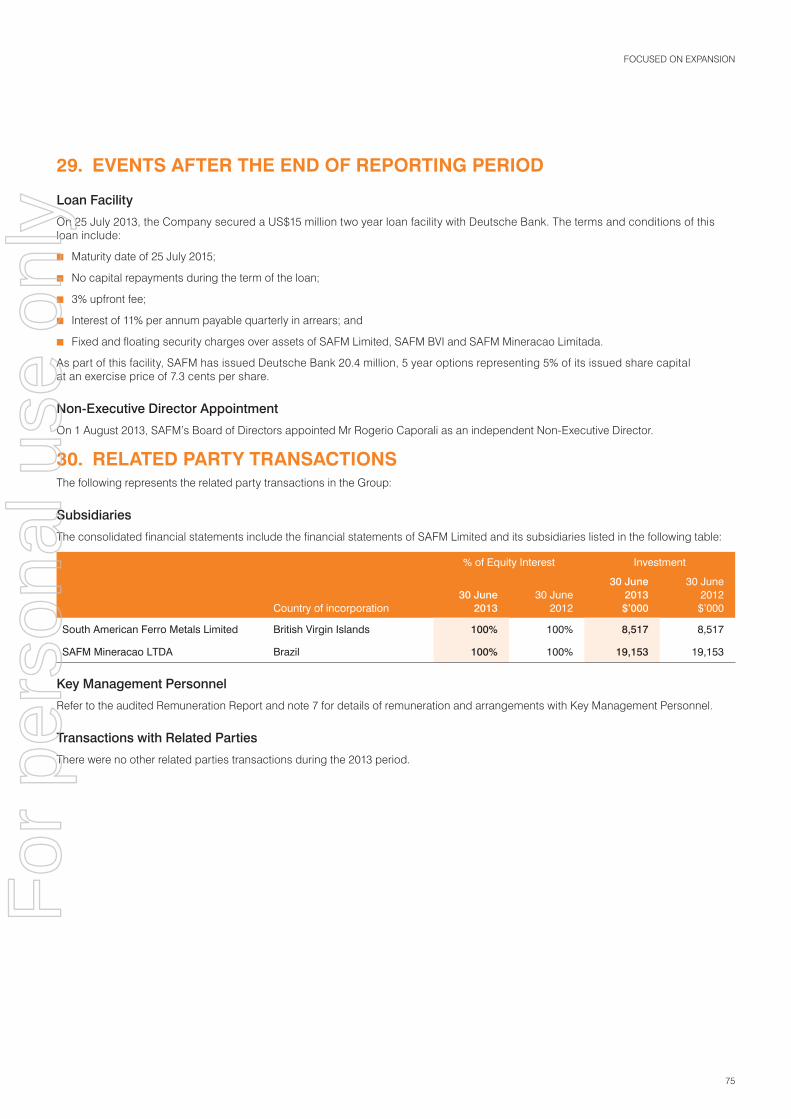
FOCUSED ON EXPANSION
75
29. EVENTS AFTER THE END OF REPORTING PERIOD
Loan Facility
On 25 July 2013, the Company secured a US$15 million two year loan facility with Deutsche Bank. The terms and conditions of this loan include:
■ Maturity date of 25 July 2015;
■ No capital repayments during the term of the loan;
■ 3% upfront fee;
■ Interest of 11% per annum payable quarterly in arrears; and
■ Fixed and floating security charges over assets of SAFM Limited, SAFM BVI and SAFM Mineracao Limitada.
As part of this facility, SAFM has issued Deutsche Bank 20.4 million, 5 year options representing 5% of its issued share capital at an exercise price of 7.3 cents per share.
Non-Executive Director Appointment
On 1 August 2013, SAFM’s Board of Directors appointed Mr Rogerio Caporali as an independent Non-Executive Director.
30. RELATED PARTY TRANSACTIONSThe following represents the related party transactions in the Group:
Subsidiaries
The consolidated financial statements include the financial statements of SAFM Limited and its subsidiaries listed in the following table:
% of Equity Interest Investment
Country of incorporation30 June
201330 June
2012
30 June 2013$’000
30 June 2012$’000
South American Ferro Metals Limited British Virgin Islands 100% 100% 8,517 8,517
SAFM Mineracao LTDA Brazil 100% 100% 19,153 19,153
Key Management Personnel
Refer to the audited Remuneration Report and note 7 for details of remuneration and arrangements with Key Management Personnel.
Transactions with Related Parties
There were no other related parties transactions during the 2013 period.
For
per
sona
l use
onl
y

SAFM ANNUAL REPORT 201376
NOTES TO THE FINANCIAL STATEMENTS (CONTINUED)FOR THE YEAR ENDED 30 JUNE 2013
31. FINANCIAL RISK MANAGEMENTThe Group’s overall financial risk management strategy is to ensure that the Group is able to fund its business operations and expansion plans.
Exposure to credit risk, liquidity risk, foreign currency risk, interest rate risk and commodity price risk arises in the normal course of the Group’s business. The Group’s risk management strategy is set by and performed in the close co-operation with the Board and focuses on actively securing the Group’s short to medium-term cash flows by limiting credit risk of customers, regular review of its working capital and minimising the exposure to financial markets.
The Group does not actively engage in the trading of financial assets for speculative purposes nor does it write options. The most significant financial risks to which the Group is exposed are described below.
Financial Assets and Liabilities
The financial assets and liabilities for financial years 2012 and 2013 are reflected at amortised cost, and are not fair valued through the Statement of comprehensive income.
For all feasibility assessments including expansion planning, raising of debt funding, evaluation of acquisition opportunities and corporate strategy, the Group uses various methods to measure the types of risk to which it is exposed. These methods include cash flow forecasting, sensitivity and breakeven analysis.
Specific Financial Risk Exposures and Management
The main risks the Group is exposed to through its financial instruments are credit risk, liquidity risk and market risk, including in interest rates, foreign currency, commodity and equity prices.
a) Credit Risk
Credit risk arises from the financial assets of the Group, which comprise cash and cash equivalents and trade and other receivables.
Exposure to credit risk relating to financial assets arises from the potential non-performance by counterparties of contractual obligations that could lead to a financial loss to the Group.
Credit risk is managed through the maintenance of credit assessment and monitoring procedures and it is the Group’s policy that all customers who wish to trade on credit terms are subject to credit verification procedures.
The Group only trades with recognised, credit-worthy third parties and such collateral is not requested nor is it the Group’s policy to securitise its trade and other receivables. In addition, receivable balances are monitored on an on-going basis with the result that the Group’s exposure to bad debts is not significant. A provision for doubtful debts is made when there is objective evidence that the Company will not be able to collect the debts. Doubtful debts are written off to the income statement. To date the Group has not been required to write off any significant debts.
Trade Receivables
All sales to local steel mills and pig iron producers are either settled in full at date of delivery or within 30 days for approved customers.
Trade and other receivables that fall into the category past due, not impaired are considered to be of high credit quality. The trade and other receivables are regularly assessed for impairment. A provision for doubtful debt of $89,178 has been provided at 30 June 2013 (2012: nil).
Cash and Restricted Cash
The credit risk policy aims to ensure that the Group is adequately protected against settlement risk for cash, investments and derivatives by transacting with reputable financial institutions with a minimum Fitch Ratings International long term credit rating of A (or equivalent S&P or Moody’s rating) and where applicable, within stated limits. It is noted that the Group is not envisaged to hold large cash balances for extended periods of time. At the reporting date, cash deposits were spread amongst a number of financial institutions to minimise the risk of default by counterparties.
Other Receivables
Other balances within trade and other receivables do not contain impaired assets and are not past due. It is expected that these other balances will be received when due.F
or p
erso
nal u
se o
nly

FOCUSED ON EXPANSION
77
The following table sets out the financial assets that are exposed to credit risk:
30 June 2013$’000
30 June 2012$’000
Financial assets
Cash and cash equivalents 411 5,403
Trade and other Receivables 1,130 1,863
Restricted cash 834 372
Total 2,375 7,638
Set out below is an ageing analysis on the Group’s trade receivables:
Total$’000
0–30 days$’000
31–60 days PDNI*$’000
61–90 days PDNI*$’000
91–120 days PDNI*$’000
Over 120 days
PDNI*$’000
Over 120 days
$’000 Impaired^
Total receivables 30 June 2013 1,130 1,198 0 0 3 18 (89)
Total receivables 30 June 2012 1,821 1,804 4 1 3 9 –
* Past due not impaired (“PDNI”).
^ A provision for doubtful debt of $89,178 has been provided at 30 June 2013 (2012: nil).
Debtors’ sales are recognised, in accordance with AASB 118 “Revenue”, when risks and rewards transfer. Sales are recognised on “Free On Truck”.
a) Liquidity Risk
Liquidity risk is the risk that there will be inadequate funds available to meet financial commitments as they fall due. The Group recognises the on-going requirement to have committed funds in place to cover both existing business cash flows and provide reasonable headroom for cyclical debt fluctuations and capital expenditure programmes. The key funding objective is to ensure the availability of flexible and competitively priced funding from alternative sources to meet the Group’s current and future requirements. The Group utilises a detailed cash flow model to manage its liquidity risk. This analysis shows that available sources of funds are expected to be sufficient over the lookout period. The Group attempts to accurately project the sources and uses of funds which provide an effective framework for decision making and budgeting.
The table below summarises the maturity profile of the Company’s contractual cash flow financial liabilities at 30 June 2013 based on contractual undiscounted repayment obligations. Repayments, which are subject to notice, are treated as if notice were to be given immediately.
Consolidated30 days
$’0001–3 months
$’0003–12 months
$’0001 to 5 years
$’000Over 5 years
$’000Total$’000
As at 30 June 2013
Trade and other payables 2,969 – – – – 2,969
Tax owing 657 – – – – 657
Loans and Borrowings 32 66 173 – – 271
Total liabilities 3,658 66 173 – – 3,897
As at 30 June 2012
Trade and other payables 1,110 – – – – 1,110
Tax owing 460 – – – – 460
Finance leases 8 – – – – 8
Total liabilities 1,578 – – – – 1,578
For
per
sona
l use
onl
y

SAFM ANNUAL REPORT 201378
NOTES TO THE FINANCIAL STATEMENTS (CONTINUED)FOR THE YEAR ENDED 30 JUNE 2013
31. FINANCIAL RISK MANAGEMENT (CONTINUED)b) Foreign Currency Risk
The following table represents the financial assets and liabilities denominated in foreign currencies that are different to the functional currency of the respective group entities:
Consolidated Foreign currency amount Amount in $ Rates of exchange
2013$’000
2012$’000
2013$’000
2012$’000
2013 2012
Financial assets
Cash and cash equivalents
– US Dollar 55 39 59 39 $/US$ 1.09 $/US$ 0.98
Financial liabilities
Trade and other payables
– US Dollar 4 – 4 – $/US$ 1.09 $/US$ 0.98
The following table demonstrates the estimated sensitivity to a 10% increase and decrease in the different exchange rates the Group is exposed to, with all other variables held constant, on a pre-tax basis. Contributed equity is not affected by changes in foreign currency exchange rates.
Effect on profit before tax30 June 2013
$’00030 June 2012
$’000
$/US$ + 10% 2 4
$/US$ – 10% (2) (4)
c) Interest Rate Risk
Interest rate risk is the risk that the fair value of future cash flows of a financial instrument will fluctuate because of changes in market interest rate. The Group is exposed to interest rate movement through interest bearing investments of surplus funds. The Group has borrowing facilities of R$555,046 ($271,417) at year end (30 June 2012: Nil).
The following table sets out the variable interest bearing and fixed interest bearing financial instruments of the Group:
Variable interest$’000
Fixed interest$’000
2013
Financial assets
Cash and cash equivalents 411 –
Restricted cash 834 –
Financial liabilities
Interest-bearing loans and borrowings – 271
Total 1,245 271
2012
Financial assets
Cash and cash equivalents 5,403 –
Restricted cash 372 –
Financial liabilities
Interest-bearing loans and borrowings – 8
Total 5,775 8
For
per
sona
l use
onl
y

FOCUSED ON EXPANSION
79
The following table illustrates the estimated sensitivity to a 1% increase and decrease to interest rate movements.
Impact on pre-tax profit30 June 2013
$’00030 June 2012
$’000
Interest rates + 1% 12 58
Interest rates – 1% (12) (58)
d) Commodity Price Risk
The Group is exposed to the risk of fluctuations in prevailing market commodity prices of Iron ore. The price of Iron ore is affected by numerous factors beyond the Group’s control including international, economic and political trends, expectations of inflation, currency exchange fluctuations, interest rates, global or regional consumptive patterns and speculative activities. The effect of these factors on the price of iron ore, and therefore the financial performance of the Group cannot accurately be predicted.
The Group’s sensitivity to commodity price risk cannot be reliability determined due to the factors described above. The Group’s detailed cashflow models assist in performing sensitivity analysis and monitoring this risk.
The Group is exposed to commodity price risk through the movement in contract iron ore prices that are based on an international iron ore index. SAFM has not entered into any forward commodity price contracts as at 30 June 2013 and is currently fully exposed to commodity price risk.
32. COMPANY DETAILSThe registered office of the Company is:Level 11, 151 Macquarie StreetSydney, NSW, Australia, 2000
The principal places of business are:
Australia OfficeLevel 11, 151 Macquarie StreetSydney, NSW, Australia, 2000
Brazil OfficeAv Afonso Pena 3130SL903 – Parte Cruzeiro30130–009Belo Horizonte MGBrazil
For
per
sona
l use
onl
y

SAFM ANNUAL REPORT 201380
DIRECTORS’DECLARATION
The Directors of South American Ferro Metals Limited declare that:
1. the consolidated financial statements and notes, as set out on pages 40 to 79 are in accordance with the Corporations Act 2001, and:
a) comply with Australian Accounting Standards (including the Australian Accounting Interpretations and the Corporations Regulations 2001); and
b) give a true and fair view of the financial position as at 30 June 2013 and of its performance for the financial year ended on that date;
2. the Managing Director and Chief Financial Officer have each declared that:
a) the financial records of the Company for the financial year have been properly maintained in accordance with s286 of the Corporations Act 2001;
b) the financial statements and notes for the financial year comply with the Accounting Standards; and
c) the financial statements and notes for the financial year give a true and fair view;
3. In the Directors’ opinion there are reasonable grounds to believe that South American Ferro Metals Limited will be able to pay its debts as and when they become due and payable.
4. The consolidated financial statements comply with International Reporting Standards.
5. This declaration is made in accordance with a resolution of the Board of Directors.
On behalf of the Board
Stephen Turner5 September 2013
For
per
sona
l use
onl
y
81
Ernst & Young 680 George Street Sydney NSW 2000 Australia GPO Box 2646 Sydney NSW 2001
Tel: +61 2 9248 5555 Fax: +61 2 9248 5959 ey.com/au
INDEPENDENT AUDITOR’S REPORT TO THE MEMBERS OF SOUTH AMERICAN FERRO METALS LIMITED
Report on the financial reportWe have audited the accompanying financial report of South American Ferro Metals Limited, which comprises the consolidated statement of financial position as at 30 June 2013, the consolidated statement of income, the consolidated statement of comprehensive income, the consolidated statement of changes in equity and the consolidated statement of cash flows for the year then ended, notes comprising a summary of significant accounting policies and other explanatory information, and the directors’ declaration of the consolidated entity comprising the company and the entities it controlled at the year’s end or from time to time during the financial year.
Directors’ responsibility for the financial report
The directors of the company are responsible for the preparation of the financial report that gives a true and fair view in accordance with Australian Accounting Standards and the Corporations Act 2001 and for such internal controls as the directors determine are necessary to enable the preparation of the financial report that is free from material misstatement, whether due to fraud or error. In Note 2, the directors also state, in accordance with Accounting Standard AASB 101 Presentation of Financial Statements, that the financial statements comply with International Financial Reporting Standards.
Auditor’s responsibility
Our responsibility is to express an opinion on the financial report based on our audit. We conducted our audit in accordance with Australian Auditing Standards. Those standards require that we comply with relevant ethical requirements relating to audit engagements and plan and perform the audit to obtain reasonable assurance about whether the financial report is free from material misstatement.
An audit involves performing procedures to obtain audit evidence about the amounts and disclosures in the financial report. The procedures selected depend on the auditor’s judgment, including the assessment of the risks of material misstatement of the financial report, whether due to fraud or error. In making those risk assessments, the auditor considers internal controls relevant to the entity’s preparation and fair presentation of the financial report in order to design audit procedures that are appropriate in the circumstances, but not for the purpose of expressing an opinion on the effectiveness of the entity’s internal controls. An audit also includes evaluating the appropriateness of accounting policies used and the reasonableness of accounting estimates made by the directors, as well as evaluating the overall presentation of the financial report.
We believe that the audit evidence we have obtained is sufficient and appropriate to provide a basis for our audit opinion.
Independence
In conducting our audit we have complied with the independence requirements of the Corporations Act 2001. We have given to the directors of the company a written Auditor’s Independence Declaration, a copy of which is included in the directors’ report.
For
per
sona
l use
onl
y

SAFM ANNUAL REPORT 201382
Opinion
In our opinion:
a. the financial report of South American Ferro Metals Limited is in accordance with the Corporations Act 2001, including:
i giving a true and fair view of the consolidated entity’s financial position as at 30 June 2013 and of its performance for the year ended on that date; and
ii complying with Australian Accounting Standards and the Corporations Regulations 2001; and
b. the financial report also complies with International Financial Reporting Standards as disclosed in Note 2.
Report on the remuneration reportWe have audited the Remuneration Report included in pages 20 to 32 of the directors’ report for the year ended 30 June 2013. The directors of the company are responsible for the preparation and presentation of the Remuneration Report in accordance with section 300A of the Corporations Act 2001. Our responsibility is to express an opinion on the Remuneration Report, based on our audit conducted in accordance with Australian Auditing Standards.
Opinion
In our opinion, the Remuneration Report of South American Ferro Metals Limited for the year ended 30 June 2013, complies with section 300A of the Corporations Act 2001.
Ernst & Young
Anton IvanyiPartnerSydney5th September 2013
For
per
sona
l use
onl
y

FOCUSED ON EXPANSION
83
ADDITIONAL INFORMATIONFOR LISTED PUBLIC COMPANIES
Additional information required by the Australian Securities Exchange Ltd and not shown elsewhere in this report is as follows. The information is current as at 3 September 2013.
A. SUBSTANTIAL SHAREHOLDERSThe names of substantial shareholders who have notified the Company in accordance with section 671B of the Corporations Act 2001 are:
Shareholder Number of shares % Holding
MASSIF LIMITED C/O ALLIANCE INVESTMENTS 44,598,804 10.90
TOPIX MANAGEMENT LTD 43,836,748 10.71
TIN ZONE HOLDINGS LTD 40,612,140 9.93
SUN WING GROUP LTD 31,838,565 7.78
HSBC CUSTODY NOMINEES (AUSTRALIA) LTD 27,402,866 6.70
BNP PARIBAS NOMINEES PTY LTD 16,164,173 3.95
B. DISTRIBUTION OF SHARESCategory (size of holding) Total Holders Units % of Issued Capital
1 – 1,000 22 2,745 0.001
1,001 – 5,000 34 94,865 0.023
5,001 – 10,000 79 492,794 0.120
10,001 – 1,000,000 713 74,584,462 18.229
1,000,001 – max 41 333,972,793 81.627
Total 889 409,147,659 100
The number of shareholdings held in less than marketable parcels is 2,745.
C. UNLISTED OPTIONSThe total number of unlisted options in issue is 29.13 million which are issued to Directors and KMP.
D. VOTING RIGHTSAll shares carry one vote per unit without restriction.
For
per
sona
l use
onl
y

SAFM ANNUAL REPORT 201384
ADDITIONAL INFORMATION FOR LISTED PUBLIC COMPANIES (CONTINUED)
TWENTY LARGEST SHAREHOLDERSThe names of the twenty largest shareholders are:
ShareholdersNumber of
shares held % Holding
1 MASSIF LIMITED 44,598,804 10.90
2 TOPIX MANAGEMENT LTD 43,836,748 10.71
3 TIN ZONE HOLDINGS LTD 40,612,140 9.93
4 SUN WING GROUP LTD 31,838,565 7.78
5 HSBC CUSTODY NOMINEES 27,402,866 6.70
6 BNP PARIBAS NOMS PTY LTD 16,164,173 3.95
7 AFRO PACIFIC CAPITAL PTY LTD 11,729,992 2.87
8 PERSHING AUSTRALIA NOMINEES 10,000,000 2.44
9 ARGONAUT SECURITIES PTY 10,000,000 2.44
10 NATIONAL NOMINEES LIMITED 9,579,230 2.34
11 GEORGE EDWARD SILVANUS 8,754,384 2.14
12 ASD SERVICES LIMITED 8,500,000 2.08
13 PACIFIC RESOURCES SECURITIES 5,471,492 1.34
14 ABN AMRO CLEARING SYDNEY 5,160,368 1.26
15 CHIFLEY PORTFOLIOS PTY LTD 5,000,000 1.22
16 RODRIGO BRANCO 4,103,620 1.00
17 KERRIBEE PTY LTD 4,026,384 0.98
18 MARGARET JANE HUBBARD 3,830,044 0.94
19 MR IAIN DONALD PRATT 3,282,896 0.80
20 VALLIANT RESOURCES LIMITED 3,187,148 0.78
Stock Exchange Listing – Quotation has been granted for all the ordinary shares of the Company on all Member Exchanges of the Australian Stock Exchange Limited.
For
per
sona
l use
onl
y

85
ABN 27 128 806 977
DirectorsTerence Willsteed (Chairman)Stephen Turner (Managing Director)Stephen FabianAlan DoyleWayne KernaghanRogério Caporali
Company SecretaryDion Cohen
Registered OfficeLevel 11,151 Macquarie StreetSydney, NSW,Australia, 2000Telephone: +61 2 8298 2000Facsimile: +61 2 8298 2020
Brazil OfficeAv Afonso Pena 3130Sl903 – Parte Cruzeiro30130–009Belo Horizonte MG BrazilTelephone: + 55 31 3281 8777Facsimile: + 55 31 3281 8997
SolicitorsBaker & McKenzie Level 27, AMP Centre50 Bridge StreetSydney, NSW,Australia, 2000
Commercial BankersNational Australia BankLevel 36, 100 Miller StreetNorth Sydney, NSW,Australia, 2060
Investment BankersDeutsche Bank AG Australia & New Zealand Level 16, Deutsche Bank Place, Phillip & Hunter StreetsSydney, NSW,Australia, 2000
AuditorsErnst & Young680 George StreetSydney, NSW, Australia, 2000
Share RegistryAdvanced Share RegistryLevel 6225 Clarence StreetSydney, NSW, Australia, 2000Telephone: +61 2 8096 3502
CORPORATE DIRECTORY
www.colliercreative.com.au #SAF0002
FOCUSED ON EXPANSIONF
or p
erso
nal u
se o
nly

South American Ferro Metals Ltd ACN 128 806 977
For
per
sona
l use
onl
y