Managing Customer Satisfaction Week 3 Customer Expectations & Satisfaction.

Executive Insight Report
Safety Shutoffs and the Impact on Customer Satisfaction
November 2021

© 2021 J.D. Power. All Rights Reserved. CONFIDENTIAL & PROPRIETARY 2© 2021 J.D. Power. All Rights Reserved. CONFIDENTIAL & PROPRIETARY
Welcome
Mark Spalinger
DirectorUtilities [email protected]
This report is a follow-up from the 2020 Executive Insight Report by Andrew Heath titled “California Public Safety Power Shutoffs and the Impact on Customer Satisfaction”. The data in this report is based on the J.D. Power 2021 Electric Utility Residential Customer Satisfaction Study and the 2020 Electric Utility Residential Customer Satisfaction Study. These studies focus on understanding the key areas that drive customer satisfaction within the electric utility industry.
For this report, J.D. Power analyzed the feedback from more than 170,000 electric residential customers who are serviced by electric utilities across the nation; and more specifically, over 12,000 residential customers in California.
The objectives of this special report are to:
• Provide an updated overview on Safety Shutoffs
• Understand residential customer experiences and satisfaction impact when safety shutoff events occur
• Identify lessons learned to help all electric utilities manage safety shutoff events
• Investigate changes since the initial surge of 2019 shutoffs reported in the prior insights report
Please feel free to contact the J.D. Power Utility Intelligence team with any questions.
Mark Spalinger

© 2021 J.D. Power. All Rights Reserved. CONFIDENTIAL & PROPRIETARY 3© 2021 J.D. Power. All Rights Reserved. CONFIDENTIAL & PROPRIETARY
Safety Shutoff Overview
Customer Experiences
Impact on Satisfaction
Lessons Learned
Contents
This Executive Insight
Report describes the 2020
and 2021 safety shutoffs,
what customers
experienced, how this
impacted customer
satisfaction, and the
lessons learned both in
California and beyond

© 2021 J.D. Power. All Rights Reserved. CONFIDENTIAL & PROPRIETARY 4
Fire season continues to start earlier
and end later each year creating
significant risks for utilities, especially
those in states that are increasingly
impacted by severe fire conditions.
According to the EPA, there are
many states across the nation that
are experiencing increases in the
number and severity of fires annually.
Western states are seeing increases
in acreage burned compared to
Eastern states with notable increases
year over year. It is becoming
increasingly evident that utilities in
fire-prone states need to intervene
more to manage their power systems
to ensure customer safety.
In some cases, this will result in a
safety shutoff where the transmission
and distribution systems are
proactively deenergized to prevent
starting or escalating a wildfire.
Since the beginning of the 2019 fire
season, utilities in the West have
done a better job of managing safety
shutoffs. Customers are reporting
declines in both the frequency and
length of these types of outages over
time. Moreover, customers are
reporting less dissatisfaction in areas
like California where multiple safety
shutoffs have occurred.
Executive SummaryThe impact on customer satisfaction of safety shutoff events
Proactive outreach has improved during
safety shutoffs. There is a 28% increase in
customers receiving a utility call, email, or text
message during an outage in the West compared
to 2019.
Utilities, especially in California, are
beginning to effectively manage
safety shutoff events through
increased proactive communications
and by addressing vegetation
management year-round to ensure
the education and safety of their
customers and to prevent starting or
escalating wildfires.
Ultimately, customers want to be
informed. When provided with any
information about an outage, or safety
shutoff, satisfaction increases. By
proactively communicating outage
information through a call, email, or
text message, utilities deliver
improved levels of satisfaction.
Continuing to proactively
communicate to customers about
outage risks and providing advanced
warnings about safety shutoff events
helps maintain higher levels of
satisfaction. There is still an
opportunity for utilities to increase
proactive contacts while looking to
improve less satisfying more
traditional channels such as TV, and
radio.
Satisfaction for customers of
California utilities was not significantly
impacted during the 2020 and 2021
fire seasons—and since a low in Q4
2019 when the earliest shutoff events
occurred—all large investor-owned
California utilities have improved in
satisfaction. This is in part due to the
increased management of safety
shutoffs as well as keeping the
customer informed.
As utilities throughout the nation
wrestle with issues associated with a
changing climate, they need to learn
lessons from the recent
improvements achieved by the
California utilities.
© 2021 J.D. Power. All Rights Reserved. CONFIDENTIAL & PROPRIETARY 5© 2021 J.D. Power. All Rights Reserved. CONFIDENTIAL & PROPRIETARY
Fire Season Changes
Fire seasons are
becoming longer
and increasingly
more devastating
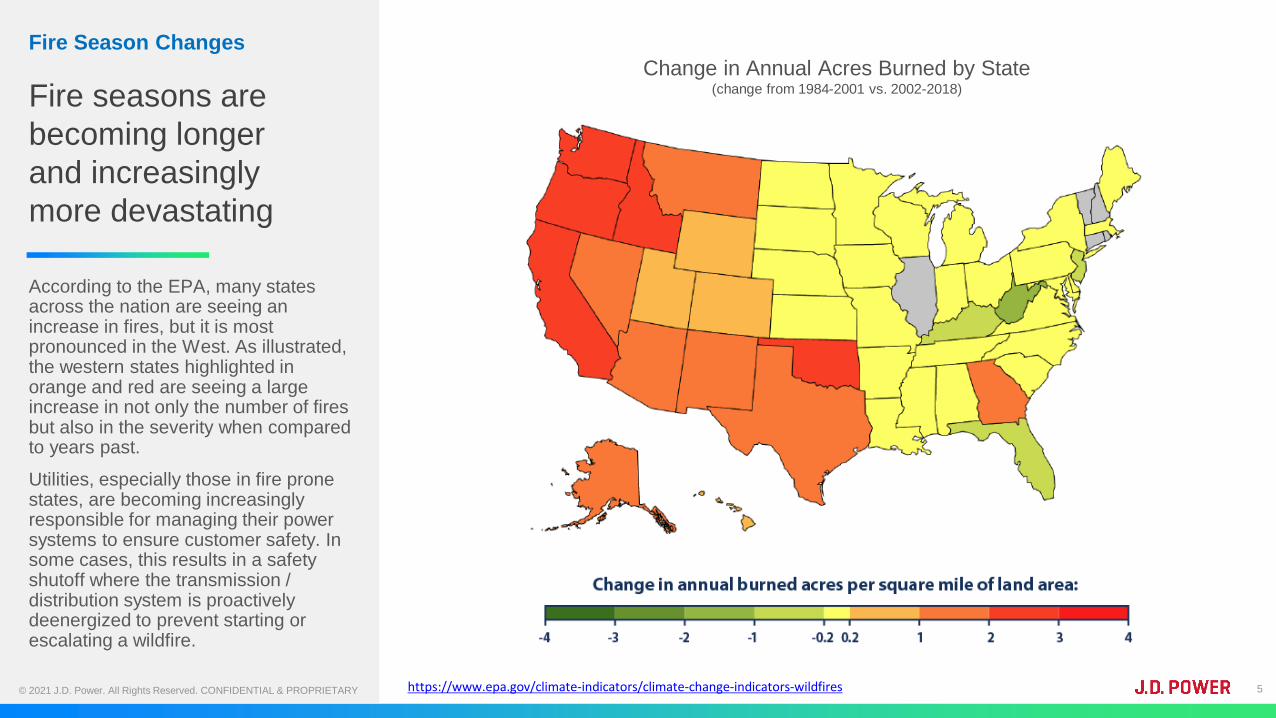
According to the EPA, many states across the nation are seeing an increase in fires, but it is most pronounced in the West. As illustrated, the western states highlighted in orange and red are seeing a large increase in not only the number of fires but also in the severity when compared to years past.
Utilities, especially those in fire prone states, are becoming increasingly responsible for managing their power systems to ensure customer safety. In some cases, this results in a safety shutoff where the transmission / distribution system is proactively deenergized to prevent starting or escalating a wildfire.
https://www.epa.gov/climate-indicators/climate-change-indicators-wildfires
Change in Annual Acres Burned by State (change from 1984-2001 vs. 2002-2018)

© 2021 J.D. Power. All Rights Reserved. CONFIDENTIAL & PROPRIETARY 6© 2021 J.D. Power. All Rights Reserved. CONFIDENTIAL & PROPRIETARY
Safety Shutoffs by Region
West region customers
are most impacted by
safety shutoffs
Customers in the West report more shutoff events in 2021 compared to the rest of the nation, 8%. However, this is down from a peak of 15%.
A shutoff event is becoming increasingly necessary to manage the integrity of the power system and the safety of customers.
When given the option, customers in other regions are also selecting fire or safety shutoff as the cause of longest outage but at a lesser percent than customers in the West. Formal public safety power shutoffs (PSPS) are mostly in California but given the choice some customers still select this option as the cause of their outage in other regions.
15%
8%
5%4%
Q1 20 Q2 20 Q3 20 Q4 20 Q1 21 Q2 21 Q3 21
West Industry Average
Cause of Longest Outage by Region
East Midwest South West
Fire/safety shutoff 3% 3% 3% 8%
Thunderstorm 18% 18% 23% 7%
Wind or tornado 12% 9% 6% 10%
Scheduled utility work/infrastructure improvements 4% 4% 4% 9%
Hurricane 1% 0% 3% 0%
Ice or snowstorm 7% 7% 7% 4%
Percentage of Customers Reporting a Safety Shutoff

© 2021 J.D. Power. All Rights Reserved. CONFIDENTIAL & PROPRIETARY 7© 2021 J.D. Power. All Rights Reserved. CONFIDENTIAL & PROPRIETARY
Outage Durations Declining
Customers in the
West report shorter
safety shutoffs
Down from 51 hours on average in Q1 2020 to 17 hours on average in Q3 2021, the West is doing a better job managing shutoff events. Other regions remain relatively stable in the events attributed to safety shutoffs.
One area of improvement in the West is proactive outreach during an outage. There is a 27% increase in customers receiving a utility call, email, or text message during an outage in the West from 2019 when some of the earliest safety shutoffs started.
Additionally, the West is showing the largest increase from 2019 for the attribute keeping you informed about an outage.
50.9
17.4
31.4 32.2
Q1 20 Q2 20 Q3 20 Q4 20 Q1 21 Q2 21 Q3 21
West Other Regions
Length of Longest Outage During a Safety Shutoff Event
+0.35
+0.27
+0.26
+0.26
+0.20
West
Industry
Midwest
South
East
Attribute Rating Improvement 2019-2021 –
Keeping you informed about outage
19%
46%
19Q1
19Q2
19Q3
19Q4
20Q1
20Q2
20Q3
20Q4
21Q1
21Q2
21Q3
West Source of Outage Trend
– Proactive utility contact
© 2021 J.D. Power. All Rights Reserved. CONFIDENTIAL & PROPRIETARY 8© 2021 J.D. Power. All Rights Reserved. CONFIDENTIAL & PROPRIETARY
State Performance
California continues to
have the majority of
customer reported
safety shutoffs
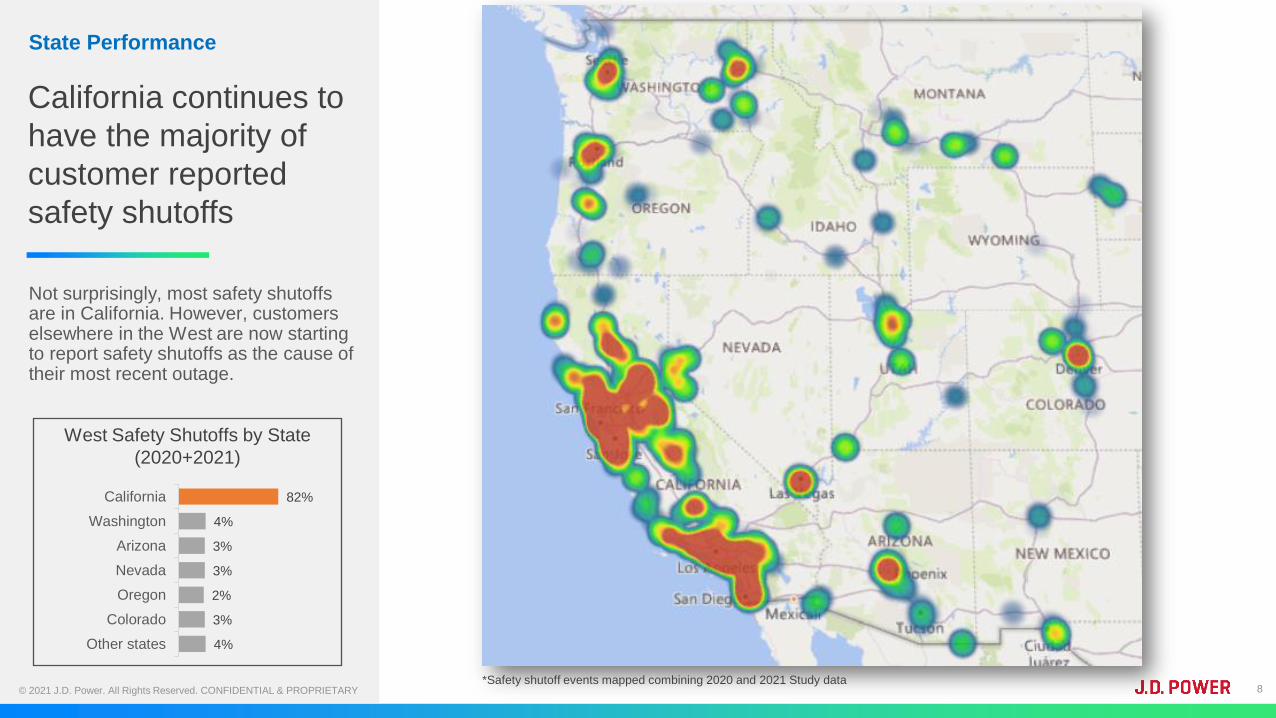
Not surprisingly, most safety shutoffs are in California. However, customers elsewhere in the West are now starting to report safety shutoffs as the cause of their most recent outage.
*Safety shutoff events mapped combining 2020 and 2021 Study data
West Safety Shutoffs by State
(2020+2021)
82%
4%
3%
3%
2%
3%
4%
California
Washington
Arizona
Nevada
Oregon
Colorado
Other states
© 2021 J.D. Power. All Rights Reserved. CONFIDENTIAL & PROPRIETARY 9© 2021 J.D. Power. All Rights Reserved. CONFIDENTIAL & PROPRIETARY
Safety Shutoffs California Overview
California utilities
improve efforts in
managing safety
shutoffs
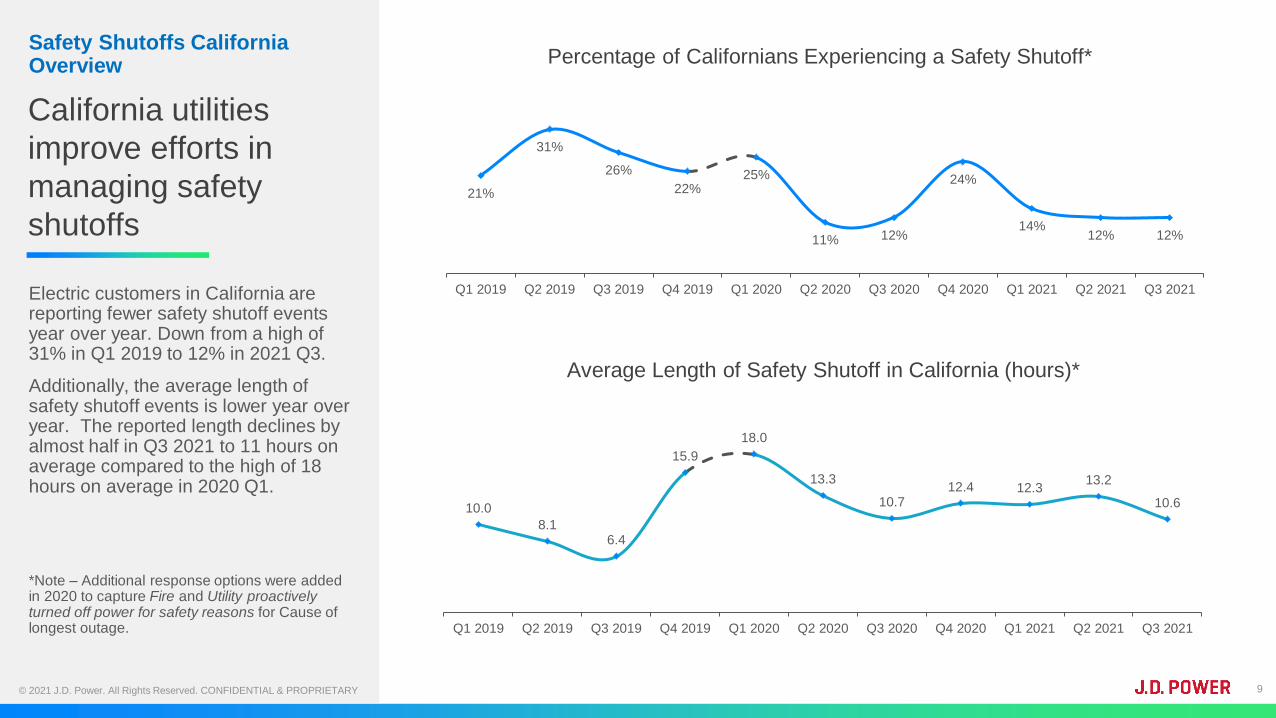
Electric customers in California are reporting fewer safety shutoff events year over year. Down from a high of 31% in Q1 2019 to 12% in 2021 Q3.
Additionally, the average length of safety shutoff events is lower year over year. The reported length declines by almost half in Q3 2021 to 11 hours on average compared to the high of 18 hours on average in 2020 Q1.
*Note – Additional response options were added in 2020 to capture Fire and Utility proactively turned off power for safety reasons for Cause of longest outage.
Percentage of Californians Experiencing a Safety Shutoff*
Average Length of Safety Shutoff in California (hours)*
21%
31%
26%
22%25%
11% 12%
24%
14%12% 12%
0%
5%
10%
15%
20%
25%
30%
35%
Q1 2019 Q2 2019 Q3 2019 Q4 2019 Q1 2020 Q2 2020 Q3 2020 Q4 2020 Q1 2021 Q2 2021 Q3 2021
10.0
8.16.4
15.9
18.0
13.3
10.712.4 12.3
13.2
10.6
Q1 2019 Q2 2019 Q3 2019 Q4 2019 Q1 2020 Q2 2020 Q3 2020 Q4 2020 Q1 2021 Q2 2021 Q3 2021

© 2021 J.D. Power. All Rights Reserved. CONFIDENTIAL & PROPRIETARY 10© 2021 J.D. Power. All Rights Reserved. CONFIDENTIAL & PROPRIETARY
West Satisfaction Impact of Safety Shutoffs
Satisfaction for
customers in the West
experiencing a safety
shutoff improves
In 2021, the gap between customers having perfect power (no brief or lengthy outage) has narrowed: Down from -103 index points in 2020 to -58 index points in 2021.
Customers in the West experiencing a safety shutoff report lower Power Quality & Reliability satisfaction compared to all other outages.
Utility equipment failure remains the most dissatisfying form of an outage for customers in the West, 9 index points lower than a safety shutoff and -57 index points lower than all other outages.
709718
766
680696
753
Utility Equipment failure Safety Shutoff All other outages
West California
Safety Shutoff Power Quality & Reliability Satisfaction Comparison
Safety Shutoff Satisfaction Gap to Perfect Power – West
-117-103
-54
-110
-58 -53
-150.00
-130.00
-110.00
-90.00
-70.00
-50.00
-30.00
-10.00
Utility equipment failure Safety shutoff All other Outages
2020 2021

© 2021 J.D. Power. All Rights Reserved. CONFIDENTIAL & PROPRIETARY 11© 2021 J.D. Power. All Rights Reserved. CONFIDENTIAL & PROPRIETARY
West Source of Outage Information
Proactive outage
information is highly
satisfying during a
safety shutoff
During a safety shutoff, most customers receive information from their utility proactively through a utility text, utility call, or utility email. This is also the most satisfying form of contact when safety shutoffs occur.
Providing proactive information about the shutoff to customers continues to be important in order to maintain higher levels of satisfaction.
Furthermore, customers who have personal contact or contact through digital channels report increased satisfaction compared to customers relying on traditional methods like TV, radio, or a neighbor.
741
782
747
701
760
742
728
711
Proactive utility contact(text, phone, email)
Personal contact(work crew, called utility,
emailed utility)
Electronic channels(website, mobile app,
social media)
Traditional(TV, radio, neighbor)
2020 Final 2021 YTD
Source of Outage Information Power Quality & Reliability Satisfaction by
Source of Information
72%
39%
58%
37%
73%
47%
58%
34%
Proactive utility contact(text, phone, email)
Personal contact(work crew, called utility,
emailed utility)
Electronic channels(website, mobile app,
social media)
Traditional(TV, radio, neighbor)
2020 Final 2021 YTD
© 2021 J.D. Power. All Rights Reserved. CONFIDENTIAL & PROPRIETARY 12© 2021 J.D. Power. All Rights Reserved. CONFIDENTIAL & PROPRIETARY
Customer Satisfaction Impact of Safety Shutoffs
National satisfaction
remains stable over
the last 7 quarters of
fielding
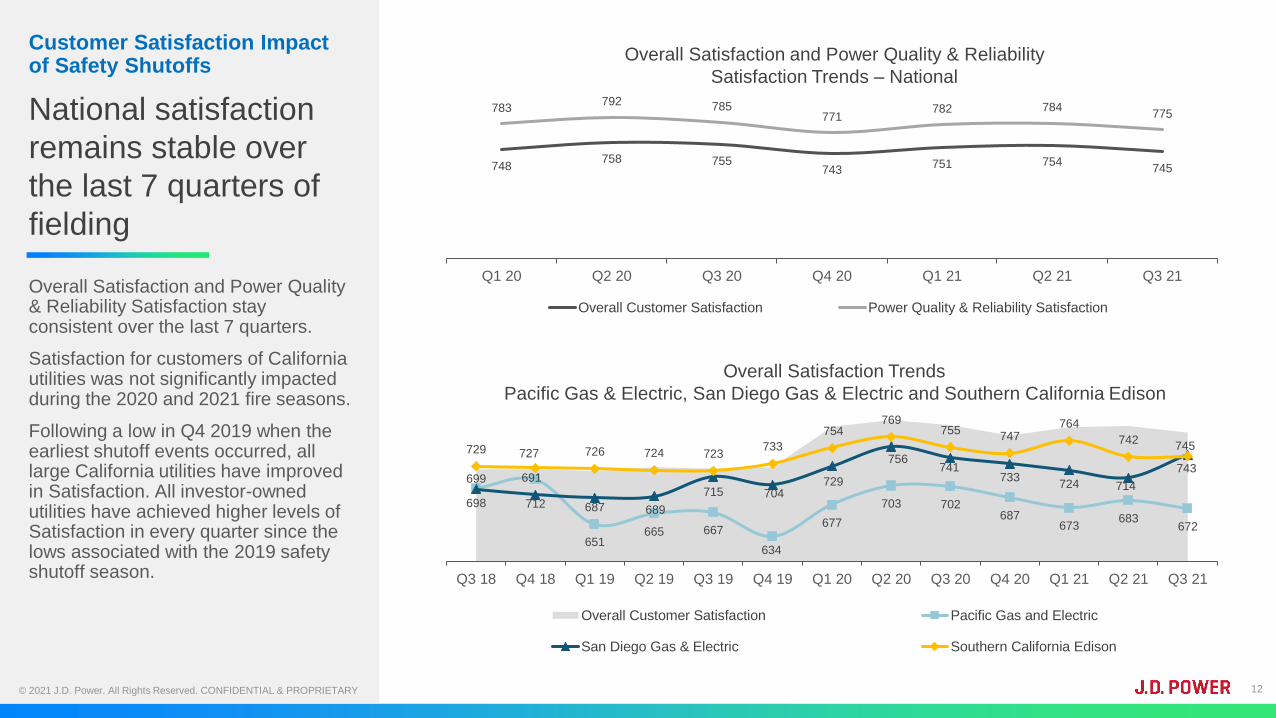
Overall Satisfaction and Power Quality & Reliability Satisfaction stay consistent over the last 7 quarters.
Satisfaction for customers of California utilities was not significantly impacted during the 2020 and 2021 fire seasons.
Following a low in Q4 2019 when the earliest shutoff events occurred, all large California utilities have improved in Satisfaction. All investor-owned utilities have achieved higher levels of Satisfaction in every quarter since the lows associated with the 2019 safety shutoff season.
748758 755
743751 754
745
783792 785
771782 784
775
Q1 20 Q2 20 Q3 20 Q4 20 Q1 21 Q2 21 Q3 21
Overall Customer Satisfaction Power Quality & Reliability Satisfaction
Overall Satisfaction and Power Quality & Reliability
Satisfaction Trends – National
699
712
651665 667
634
677
703 702687
673683
672
698
691
687 689
715 704729
756741
733724 714
745729 727 726 724 723733
754769
755747
764
742
743
Q3 18 Q4 18 Q1 19 Q2 19 Q3 19 Q4 19 Q1 20 Q2 20 Q3 20 Q4 20 Q1 21 Q2 21 Q3 21
Overall Customer Satisfaction Pacific Gas and Electric
San Diego Gas & Electric Southern California Edison
Overall Satisfaction Trends
Pacific Gas & Electric, San Diego Gas & Electric and Southern California Edison

© 2021 J.D. Power. All Rights Reserved. CONFIDENTIAL & PROPRIETARY 13
Lessons Learned
Only when necessary. Mitigate the impact on the customer and ultimately
increase satisfaction by striving for shorter and less frequent outage events.01
02
03
04
Communicate. Communicate. Communicate. Customers are more
satisfied when provided with advanced notice and reason for the outage.
Especially when the outage is for preventative maintenance or upgrades,
customers are more understanding.
Maintain the system. Maintain the electric system through upgrades and
vegetation management to minimize fire risks and safety shutoffs.
Be Proactive. Proactively communicate to customers about risks, outages, and
provide as much information and advance warning as possible about safety shutoff
events.
Considering all
fires this year, they
did an excellent job
to keep electricity
flowing
Good service and
keeping us
informed of any
repair outages and
PSPS that are
possible
Provides reliable
power and notifies me
when an outage is
necessary due to
upgrade work or fire
danger.
They keep the
community safe
and informed
about problems
and different
situations
They alert me to
dangers I am not
even aware of, such
as increased brush
fire risks.
My electricity is almost
always on, and they
communicate about
outages that they know
of ahead of time.

© 2021 J.D. Power. All Rights Reserved. CONFIDENTIAL & PROPRIETARY 14
Global OfficesContributors
Andrew Heath
Mark Spalinger
AMERICAS ASIA PACIFIC EUROPE
HeadquartersTroy, Michigan320 E. Big Beaver RoadSuite 500Troy, MI 48083Phone 1 (248) 680-6200Toll Free 1 (888) 274-5372
Westlake Village, California30870 Russell Ranch RoadSuite 300Westlake Village, CA 91362Phone 1 (805) 418-8000Toll Free 1 (800) 274-5372Fax 1 (805) 418-8900
Hinsdale, Illinois330 W. ChestnutSuite 2-WHinsdale, IL 60521Toll Free 1 (800) 274-5372
Troy, Michigan3310 W. Big Beaver RoadSuite 300Troy, MI 48084Toll Free 1 (800) 361-1812
Minneapolis, Minnesota7900 Xerxes Avenue S. Suite 600Minneapolis, MN 55431Toll Free 1 (800) 293-2056
New York136 Madison Ave 5th FloorNew York, NY 10016 Toll Free 1 (800) 274-5372
Portland, Oregon700 NE Multnomah St.15th FloorPortland, OR 97232Toll Free 1 (800) 936-8906
Calgary, Alberta421 7th Ave. SW.30th FloorCalgary, AB T2P 4K9Phone 587-390-8599 Ex 8641
Toronto, Canada161 Bay Street, 27th FloorToronto, ON M5J 2S1, CanadaPhone 1 (647) 946-3453
Mexico City, MexicoJ.D. Power de MéxicoPrado Sur 150, Planta Baja Col. Lomas de Chapultepec, Del. Miguel Hidalgo, Ciudad de México, 11000Phone (52) 55 5081 4400
London, Ontario100 Dundas StreetSuite 500London, ON N6A 5B6Toll Free 1 (800) 263-2384
Tokyo, JapanMetro City Kamiyacho5-1-5 ToranomonMinato-ku, Tokyo, Japan 105-0001Phone 81 3 4550 8080
Shanghai, ChinaSuite 1601, Shanghai Kerry Centre1515 Nanjing West RoadJingAn DistrictShanghai 200040 ChinaPhone 86 21 2208 0818
Beijing, ChinaSuite 2101, 21/F Tower D, Beijing CITCA6, Jian Guo Men Wai Avenue Beijing100022, ChinaPhone 86 106569 2704Fax 86 106569 2960
München, GermanyLeopoldstraße 8-10 80802 München, Germany+49 89 288 0366 0

© 2021 J.D. Power. All Rights Reserved. CONFIDENTIAL & PROPRIETARY 15
J.D. Power does not guarantee the accuracy, adequacy, or completeness of any information contained in this publication and is not responsible for any errors or omissions or for the results obtained from use of such information. Advertising claims cannot be based on information published in this publication. Repro duction of any material contained in this publication, including photocopying in part or in whole, is prohibited without the express written permission of J.D. Power. Any material quoted fro m this publication must be attributed to J.D. Power.
© 2021 J.D. Power. All Rights Reserved.
jdpower.com/business/industry/utilitiesFor more information, please visit: