Safety of the navigation in congested maritime area. The ... · European Transport \ Trasporti...
19
European Transport \ Trasporti Europei n. 42 (2009): 83-101 83 Safety of the navigation in congested maritime area. The case of the Messina strait Domenico Gattuso 1* , Salvatore Napoli 2** , A. Gabriella Meduri 3*** 1 DIMET (Department of Computer Science, Mathematics, Electronic and Transport ) Mediterranea University,Reggio Calabria, Italy Abstract In the last decade a relevant expansion of traffic by sea occurred, not only on the long distances, but also on the middle-short distances; on coastline urban areas and particularly on neighboring urban areas, but separated by the sea, the increase of the flows often involves greater risks of accident for the navigation (Lewison, 1978; Merrick et al., 2001; van Dorp et al., 2001). The risk of maritime accident results particularly high for the ro-ro ships. This papers clarify some aspects concerning the concept of risk and safety at sea dealing with some literature models. An application is proposed to the Messina Strait context that is the crossroad of elevated flows of traffic along two directions. The navigation safety in the Messina Strait has been analyzed with the support of a micro-simulation approach. Keywords: Risk; Safety; Micro-simulation. 1. Introduction In the last decade a relevant expansion of the traffic by sea occurred, not only on the long distances, but also on the middle-short distances; on coastline urban areas and particularly on neighboring urban areas, but separated by the sea, the increase of the flows often involves greater risks of accident for the navigation (Lewison, 1978; Merrick et al., 2001; van Dorp et al., 2001). An accident can be defined as an undesirable event that provokes damages to humans, to goods and to the environment; the main factors that can determine an accident are: * Corresponding author: Domenico Gattuso ([email protected]) ** Corresponding author: Salvaore Napoli ([email protected]) *** Corresponding author: A. Gabriella Maduri ([email protected])
Transcript of Safety of the navigation in congested maritime area. The ... · European Transport \ Trasporti...

European Transport \ Trasporti Europei n. 42 (2009): 83-101
83
Safety of the navigation in congested maritime area.
The case of the Messina strait
Domenico Gattuso 1∗∗∗∗, Salvatore Napoli
2∗∗∗∗∗∗∗∗, A. Gabriella Meduri 3∗∗∗∗∗∗∗∗∗∗∗∗
1 DIMET (Department of Computer Science, Mathematics, Electronic and Transport ) Mediterranea
University,Reggio Calabria, Italy
Abstract
In the last decade a relevant expansion of traffic by sea occurred, not only on the long distances, but
also on the middle-short distances; on coastline urban areas and particularly on neighboring urban areas,
but separated by the sea, the increase of the flows often involves greater risks of accident for the
navigation (Lewison, 1978; Merrick et al., 2001; van Dorp et al., 2001). The risk of maritime accident
results particularly high for the ro-ro ships. This papers clarify some aspects concerning the concept of
risk and safety at sea dealing with some literature models. An application is proposed to the Messina
Strait context that is the crossroad of elevated flows of traffic along two directions. The navigation safety
in the Messina Strait has been analyzed with the support of a micro-simulation approach.
Keywords: Risk; Safety; Micro-simulation.
1. Introduction
In the last decade a relevant expansion of the traffic by sea occurred, not only on the
long distances, but also on the middle-short distances; on coastline urban areas and
particularly on neighboring urban areas, but separated by the sea, the increase of the
flows often involves greater risks of accident for the navigation (Lewison, 1978;
Merrick et al., 2001; van Dorp et al., 2001).
An accident can be defined as an undesirable event that provokes damages to humans,
to goods and to the environment; the main factors that can determine an accident are:
* Corresponding author: Domenico Gattuso ([email protected])
** Corresponding author: Salvaore Napoli ([email protected])
*** Corresponding author: A. Gabriella Maduri ([email protected])

European Transport \ Trasporti Europei n. 42 (2009): 83-101
84
- external conditions, namely conditions of rough sea or conditions of reduced
visibility;
- functional breakdown, as malfunction of technical equipments;
- errors of navigation, namely errors of manoeuvres, inadequate understanding of
the situation, negligence, violation or deviation from the procedures, from the
rules and from the instructions;
- errors committed by other ships.
The risk of maritime accident results particularly high for the ro-ro ships; they have an
inclination to the accident, because they operate in congested navigable waters, adjacent
to the coast, moving at medium-high speed.
The first part of the paper is meant to clarify some aspects concerning the concept of
risk, underlining how the management of the maritime traffic through the navigation
rules and advanced control systems can contribute to enhance safety in the sea.
In the second section of the work, the attention is addressed to some literature models
for the analysis of safety in the sea, quoting the most common cases of accident
(stranding, collision). The main models analyzed for safety analysis are Inoue (2000),
Kristiansen (2005) and Yip (2008). The preferred model for our study context is
Kristiansen (2005) because the Messina Straits should be considered as a large maritime
area with long permanent routes; whereas Inoue and Yip consider restricted area as port
waters. An application is proposed to the Messina Straits context that is the crossroad of
elevated flows of traffic along two directions (Calabria-Sicily and Ionian-Tyrrhenian
seas). The navigation safety in the Messina Straits has been analyzed with the support of
a micro-simulation approach. The whole matter describes an interesting scheme for the
evaluation of safety, also related for scenarios with more intense future traffic.
2. Safety analysis approach
The hazard in active form is connected with any transport activities taking place in
the territory, when from such activities can derive dangers for the safety of transport
users and not users and damages to the integrity of the environment. The defence
towards this type of risk can be practiced by undertaking one of the followings actions:
- planning of long term interventions on the transport systems (construction of new
safer transport structures, use of modern monitoring equipments, policies
supporting less dangerous transport modalities, etc.);
- prevention: short-term or in “real time” control management of transport in order
to avoid, in every condition, the overcoming of a maximum threshold of
admissible risk;
- emergency: actions meant to know with timeliness the characteristics of the
accident, the helping needs, and other necessary actions suitable for limiting the
damages to people and things and to overcome the phase of danger.
The hazard is a condition in which exists a potential cause of damage. There is a
hazard when a system (or an activity), under certain conditions, can provoke unwanted
consequences. Safety denotes a situation in which the level of risk is low and acceptable,
European Transport \ Trasporti Europei n. 42 (2009): 83-101
85
both economically and socially. Analytically, the literature of the sector induces to
assume the risk equal to the product among the vulnerability V of the area involved in
the risk, its exposure N and the probability P that the risky event could happen:
R V N P M P= ⋅ ⋅ = ⋅ (1)
in which M is the measure of the magnitude, given by the product of vulnerability and
exposure.
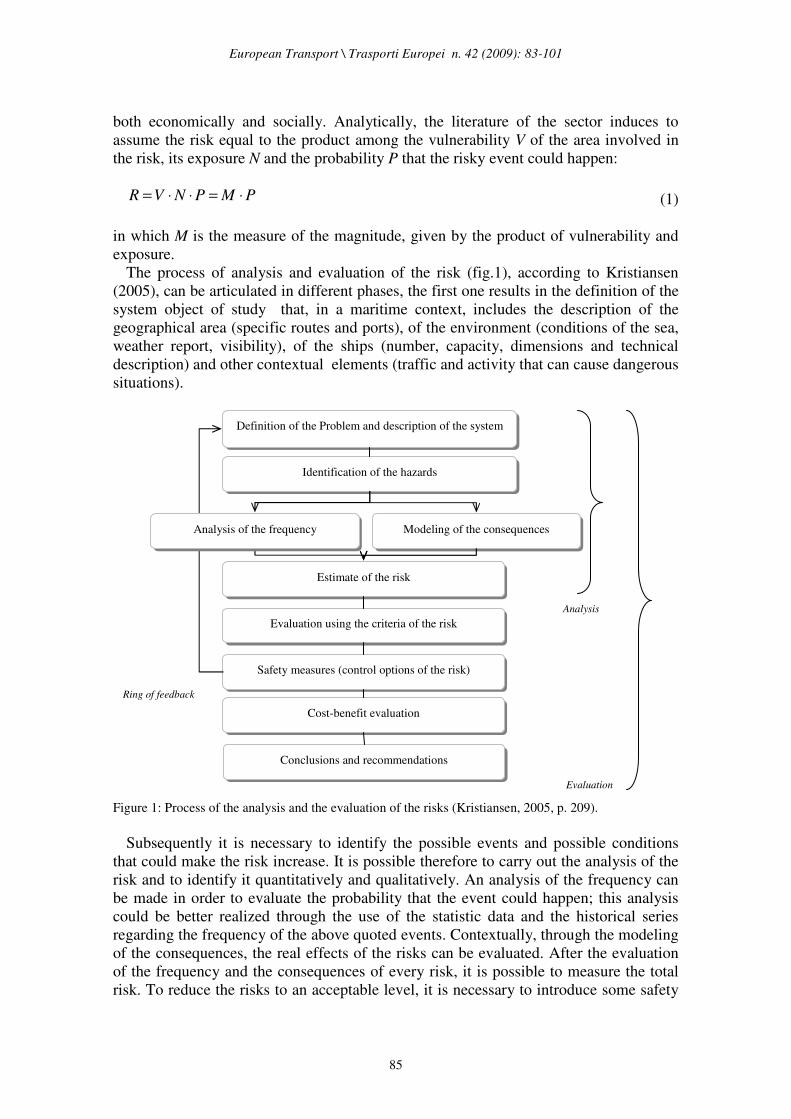
The process of analysis and evaluation of the risk (fig.1), according to Kristiansen
(2005), can be articulated in different phases, the first one results in the definition of the
system object of study that, in a maritime context, includes the description of the
geographical area (specific routes and ports), of the environment (conditions of the sea,
weather report, visibility), of the ships (number, capacity, dimensions and technical
description) and other contextual elements (traffic and activity that can cause dangerous
situations).
Figure 1: Process of the analysis and the evaluation of the risks (Kristiansen, 2005, p. 209).
Subsequently it is necessary to identify the possible events and possible conditions
that could make the risk increase. It is possible therefore to carry out the analysis of the
risk and to identify it quantitatively and qualitatively. An analysis of the frequency can
be made in order to evaluate the probability that the event could happen; this analysis
could be better realized through the use of the statistic data and the historical series
regarding the frequency of the above quoted events. Contextually, through the modeling
of the consequences, the real effects of the risks can be evaluated. After the evaluation
of the frequency and the consequences of every risk, it is possible to measure the total
risk. To reduce the risks to an acceptable level, it is necessary to introduce some safety
Definition of the Problem and description of the system
Identification of the hazards
Estimate of the risk
Evaluation using the criteria of the risk
Safety measures (control options of the risk)
Cost-benefit evaluation
Modeling of the consequences
Conclusions and recommendations
Ring of feedback
Analysis
Evaluation
Analysis of the frequency
European Transport \ Trasporti Europei n. 42 (2009): 83-101
86
measures in the system (e.g. the realization of a system of evacuation on board). The
analysis is concluded with the cost-benefit evaluation, in order to analyze if the benefits
following the adoption of some safety measures are compatible with the costs connected
to their realization.
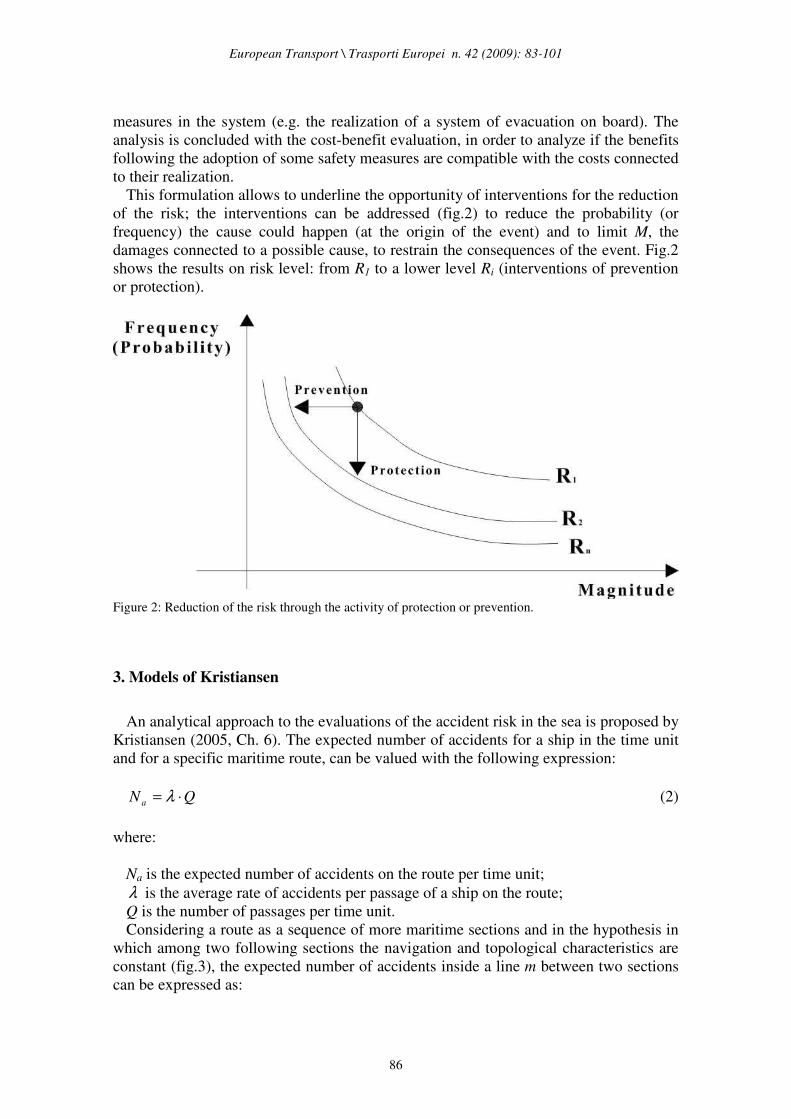
This formulation allows to underline the opportunity of interventions for the reduction
of the risk; the interventions can be addressed (fig.2) to reduce the probability (or
frequency) the cause could happen (at the origin of the event) and to limit M, the
damages connected to a possible cause, to restrain the consequences of the event. Fig.2
shows the results on risk level: from R1 to a lower level Ri (interventions of prevention
or protection).
Figure 2: Reduction of the risk through the activity of protection or prevention.
3. Models of Kristiansen
An analytical approach to the evaluations of the accident risk in the sea is proposed by
Kristiansen (2005, Ch. 6). The expected number of accidents for a ship in the time unit
and for a specific maritime route, can be valued with the following expression:
QN a ⋅= λ (2)
where:
Na is the expected number of accidents on the route per time unit;
λ is the average rate of accidents per passage of a ship on the route;
Q is the number of passages per time unit.
Considering a route as a sequence of more maritime sections and in the hypothesis in
which among two following sections the navigation and topological characteristics are
constant (fig.3), the expected number of accidents inside a line m between two sections
can be expressed as:

European Transport \ Trasporti Europei n. 42 (2009): 83-101
87
mammmam QPQN ⋅=⋅= λ (3)
where:
Nam is the expected number of accidents in the time unit inside the line m;
Pam is the probability that an accident happens in correspondence of the line m.
Figure 3: Example of subdivision of a route in homogeneous sections.
If u stands for the type of accident, the expected number of the u type accidents in the
line m can be expressed as:
QPNumauam ⋅=
,, (4)
where:
Nam,u is the expected number of u type accidents in the time unit inside the line m;
Pam,u is the probability that a type u accident happens in correspondence of the line m.
The total number of accidents for time unit for the whole trip, can be express as:
m
m u
uamT QPN ⋅=∑∑ , (5)
Therefore the problem is the definition of the probability Pam.
The model proposed for the evaluation of the accident probability is based on the
assumption that the ship is in movement (and therefore potentially connected to a
possible situation of danger), that is unexpectedly involved in a risky event that causes
the loss of control, and that it is not possible to intervene readily, provoking an
accident/collision.
The probability of an accidental event considering such assumptions, is expressed
through the product of two probabilities that reflect the transition from the state of
normal functioning to the accident:
)/()()( CIPCPAP ⋅= (6)
Line A (Line with double direction) Line B (Crossing) Line C (Line with obstacle)
European Transport \ Trasporti Europei n. 42 (2009): 83-101
88
where:
P(A) is the probability of an accidental event per passage;
P(C) is the probability to lose the control of the ship per passage;
P(I/C) is the conditional probability to have an accident after loss of the ship control.
An alternative form is:
ica PPP ⋅= (7)
where the subscripts denote accident (a), loss of control (c) and impact (i).
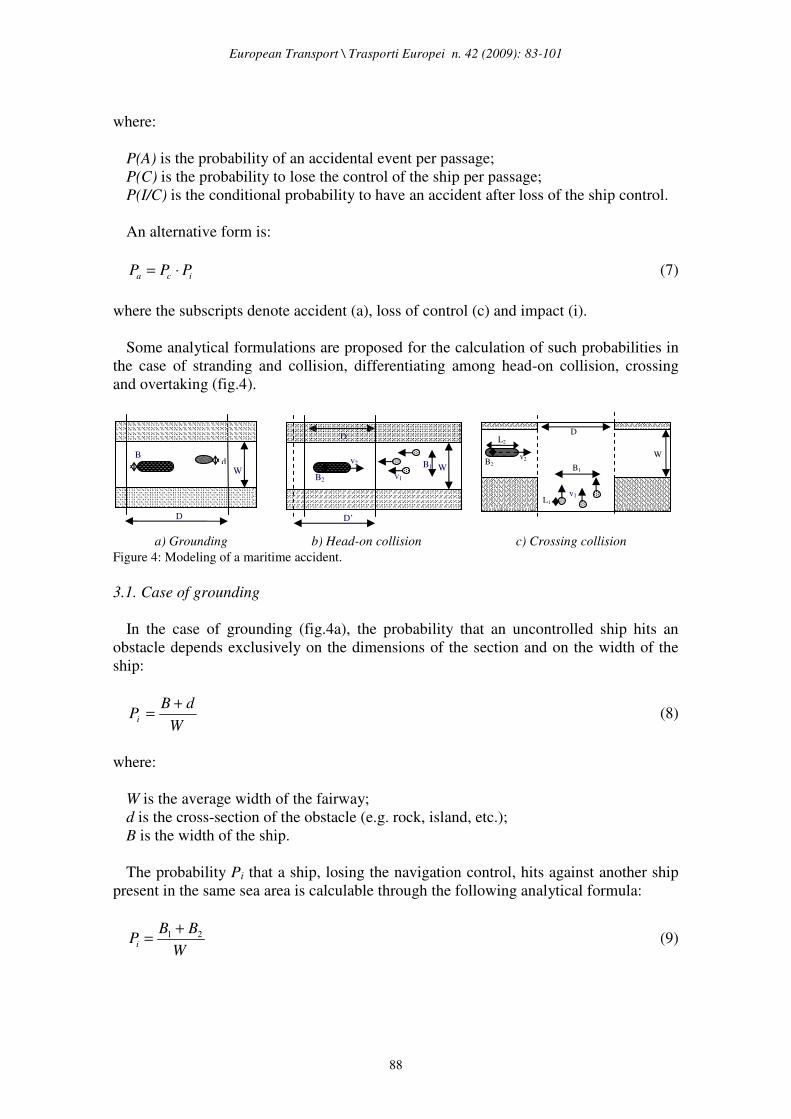
Some analytical formulations are proposed for the calculation of such probabilities in
the case of stranding and collision, differentiating among head-on collision, crossing
and overtaking (fig.4).
a) Grounding b) Head-on collision c) Crossing collision
Figure 4: Modeling of a maritime accident.
3.1. Case of grounding
In the case of grounding (fig.4a), the probability that an uncontrolled ship hits an
obstacle depends exclusively on the dimensions of the section and on the width of the
ship:
W
dBPi
+= (8)
where:
W is the average width of the fairway;
d is the cross-section of the obstacle (e.g. rock, island, etc.);
B is the width of the ship.
The probability Pi that a ship, losing the navigation control, hits against another ship
present in the same sea area is calculable through the following analytical formula:
W
BBPi
21 += (9)
B2 v1
D’
W
D
v2 B1 B
D
W d
W
D
v2
B1
L2
B2
L1 v1

European Transport \ Trasporti Europei n. 42 (2009): 83-101
89
in which B1 and B2 are the widths of the two ships simultaneously present in the sea
area.
In a seaway with a number of obstacles the conditional probability Pi is given by the
union of the cross-sections of the obstacles; in this case:
dDW
BPi ⋅⋅+= ρ (10)
where ρ is obstacles density (obstacles/area-unit) and D is the length of the fairway. If
the ships’ width is small relative to the fairway width W, it is possible to assume:
dDPi ⋅⋅= ρ (11)
The probability of losing the navigation control Pc can be estimated on the basis of
observation of traffic, counting of accidents and estimating Pi for a specific fairway. For
example, on the basis of a number of ships accidents and of a number of passages
detected in a time period, it is possible to evaluate:
Q
NP a
a = (12)
Assuming Pi =1, it is possible to derive Pc through the following expression:
i
a
cP
PP = (13)
In alternative, if is known the accident frequency for distance unit µc, it is possible to
estimate Pc as:
DP cc ⋅= µ (14)
3.2. Case of collision
Contrary to the grounding, the collision represents an impact among two moving
objects; therefore, it is possible to distinguish different types of collision (head-on
collision, transversal collision or collision due to an overtaking manoeuvre).
The probability of head-on collision (fig.4b) for a single ship in the considered sea
area in the observation time, considering the probability of losing the control Pc, is:
cia PPP ⋅= (15)
Pi is the impact probability for incoming traffic, obtained by the product of the stated
sea area for the traffic density:
12121 /)()( vDvvBBdDAPi ⋅+⋅+⋅=⋅⋅=⋅= ρρρ (16)

European Transport \ Trasporti Europei n. 42 (2009): 83-101
90
where B1, B2, v1 and v2 are respectively width and speed of the two ships, D is the length
of the section and ρ is the traffic density (average number of ships entering the fairway
within a time period), equal to:
( ) Wv
Q
WTv
TQ
⋅=
⋅⋅
⋅=
1
1
1
1ρ (17)
Q1 is the arrival frequency of meeting ships and T is an arbitrary time unit of reference.
The probability of losing the navigation control Pc can be estimated on the basis of
observation of traffic as the grounding case. Some Japanese investigations (Fujii, 1982)
give Pc = 2·10-4
(1/passage).
In the case of ships passing through a maritime intersection (fig.4c), the impact
probability among two groups of ships is:
( ) ( ) DLBv
vDLBAAPPP mmmmiii ⋅+⋅+⋅⋅+⋅=⋅+⋅=+= 12
2
1212121 ρρρρ (18)
( ) ( )[ ]212121
21
1 vLBvLBvv
QPi ⋅++⋅+⋅
⋅= (19)
where ρm is the density of the crossing ship, A the exposed area, B1, B2, L1, L2, v1 and v2
are respectively widths, lengths and speeds of the two groups of ships, Q1 is the
frequency of the group 1 ships arrival to the intersection. Assuming that the two groups
of ships have identical characteristics, the expression is greatly simplified:
v
QLBPi
1)(2 ⋅+⋅= (20)
As in the case of head-on collision, the probability of impact Pa and the number of
collisions Na can be calculated through the following expressions:
cia PPP ⋅= (21)
QPN aa ⋅= (22)
The case of the overtaking, finally, concerns two ships moving to the same direction
but with different speeds. It is similar to the case of head-on collision except for the
relative speed formulation. If it is assumed that a ship is exposed to a uniformly
distributed traffic moving to the same direction, the impact probability is obtained by:
( ) ( )1
21
2121 QDvv
vv
W
BBPi ⋅⋅
⋅
−⋅
+= (23)

European Transport \ Trasporti Europei n. 42 (2009): 83-101
91
4. Analysis of the navigation safety in the Messina straits
The analysis of the navigation safety in the Messina Straits has been made at first on
the base of historical series referring to the accidents happened in the last years in the
examined area; then it has been calculated the potential risk assuming the models
adopted in the previous section.
4.1. Statistic analysis on historical bases
The Messina Straits has been a context of numerous accidents in the years. During
the last 50 years there have been 44 collisions, some of them have had serious
consequences.
From a statistic point of view, this means that every year, in the area of Messina
Straits the average of 0,84 accidents take place (Securmed, 2007). If we analyze the last
22 years (1986-2007), characterized by conditions of traffic more similar to the present
ones, we obtain an average of 0,32 accidents/year.
Furthermore, knowing that within one year, in the Messina Straits there are about
120.450 in transit ships and that the average number of annual accidents happened is
equal to 1 (approximate for excess), the estimated probability of accident Pa
is 0,83 *10-5
.
For the estimation of the reliability and the analysis of the risk connected to a system,
it is often applied the Poisson probability distribution. If assumed that a standardized
interval t (time or space) is divided into n under-intervals whose value is ∆τ = t/n, when
the number n of under-intervals increase, that is ∆τ getting to zero, the probability to
observe X events in the period t can be calculated with the variable of Poisson whose
function of probability is:
( ) λλ −⋅== ex
xXPx
! (24)
If assumed that the number of accidents per year is defined according to a Poisson
distribution with an average λ=0,32, the probability to have an accident per year is equal
to 0,23; in other words, assuming that the risk doesn't change in the years, it is therefore
sorted out that the probability to have an accident is equal to 23,2%, that denotes a
significant risk. It can be observed that P(X=2)=0,03; P(X=3)=0,003.
4.2. Application of the Kristiansen models
The risk of collision in the Messina Straits has been estimated beginning from the
models of Kristiansen proposed in the previous section. It has been carried out the
representation of that model developing a representative network of the study area, with
5 nodes, located in correspondence with Reggio Calabria, Villa St. Giovanni, Messina,
Rada S. Francesco and Tremestieri ports, and 24 network nodes, situated in
correspondence with the intersection points among the different routes (fig.5). As
concerns the representation of the services of maritime transport, it has been referred to
the morning rush hour (07.30-08.30) of a working weekday, considering the number of
departures from every port towards the various destinations and calculating therefore

European Transport \ Trasporti Europei n. 42 (2009): 83-101
92
the risk in this condition. Such value has been extended then to the whole day through a
coefficient α obtained by the relationship between the number of runs affected in the
rush hour and those effected within the whole day, getting a value of α equal to 12,05.
Figure 5: Network of Messina Straits.
The accident risk analysis has been handled for different scenarios:
- present situation;
- scenario 1: hypothesis of fully working Vessel Traffic Service (VTS);
- scenario 2: hypothesis of increase the transport demand in the Straits;
- scenario 3: composition of the scenarios 1 and 2.

European Transport \ Trasporti Europei n. 42 (2009): 83-101
93
Present situation
The risk of accident is connected to the mutual position of the ships; in particular
dangerous situations are to be recognized as head-on collision, crossing and overtaking.
The total number of accidents per time unit for the whole trip Na, can be expressed as
the product of the probability that an accident type could happen at the passage from the
section m and the number of passages of the ships in the time (Q) added for all accidents
types and for all maritime sections in the study area.
The risk of head-on collision characterizes the connection among the ports of Messina
Straits in relationship with to the frequency of the runs: the greater is the number of the
ships coming from the direction (Q) opposite the examined ship, the greater is the risk
of collision.
The probability to lose the control Pc, comparing the available values in literature
(Kristiansen, 2005) has been assumed equal to be 2*10-4
; in the case of some of the
busiest routes (Messina-Reggio Calabria and Messina-Villa S. Giovanni) this value has
been subsequently reduced (1*10-5
), since in the case of Messina Straits, the attention of
the ship master is greater because of the reduced capacity of movements, due to the
elevated traffic density.
From the application of the proposed theoretical models, it has been found out that the
traffic density is higher along the Messina-Villa S. Giovanni route (0,09 ships/km²), with an expected number of collisions per passage equal to 1,00*10
-2; the lowest value
has been recorded in correspondence with the Tremestieri-Reggio Calabria route
(2,12*10-3
), because the number of ships coming from the opposite direction is lower. In
conclusion, the expected number of head-on collisions in one year is equal to 0,036.
The situation of the crossing point represents the risk that a ship collides with one
moving to a perpendicular direction. Assuming the loss of control Pc equal to 1*10-4
, on
the base of some literature studies (Kristiansen, 2005), it has been calculated a risk due
to the intersection between the navigation routes equal to 0,031 collisions/year on the
Messina-Reggio Calabria route, 0,024 collisions/year on the Messina-Villa S. Giovanni
route, 0,0075 collisions/year on the route of Rada S. Francesco-Villa S. Giovanni,
0,0079 collisions/year on the Tremestieri-Reggio Calabria route, 0,048 collisions/year
on the Tremestieri-Villa S. Giovanni route and 0,012 collisions/year on the route of
Messina-Salerno; the potential risk due to the intersection among the merchant ships
along the Ionian-Tyrrhenian direction and the ships crossing Messina Straits is higher
and equal to 0,089 collisions/year per direction. In conclusion the expected value of
accidents per crossing point is estimated equal to 0,312 collisions/year.
The condition of overtaking takes place when the ships are navigating along the same
direction but with different speed. Assuming the probability to lose the control Pc equal
to 2*10-4
, as suggested in some literature studies (Kristiansen 2005, p. 144), it has been
calculated a greater probability of risk along the Ionian-Tyrrhenian route (0,004
collisions/year for direction), followed by the Messina-Reggio Calabria route (0,0029
collisions/year). The expected number of accidents estimated for overtaking in the
Sicily/Calabria way is 0,0049 collisions/year and in the whole area of the Straits is equal
to 0,0129 collisions/year.
The total risk of accidents in the area of the Straits is finally obtained by the sum of
the risks for the three typologies of accident for all the examined routes; it has been
obtained a value equal to 0,36 collisions/year, very similar to the average value of 0,32
collisions/year really found out with reference to the last 22 years.

European Transport \ Trasporti Europei n. 42 (2009): 83-101
94
Scenarios analysis
Scenario 1 hypothesized that the VTS, a monitoring and traffic control system
designed to improve the safety and efficiency of navigation, safety of life at sea and the
protection of the marine environment, is fully working. The variable influenced by the
hypothesis of functioning of the VTS system is the loss of control Pc. In the simulation,
in fact, it has been reduced of 50% on every route, because, since the traffic has been
constantly monitored by radars and communication units, the possibility to lose the
control should be reduced to the least.
In this hypothesis, the expected value of head-on collisions is equal to 0,018
collisions/year, a value of 0,156 refers to accidents due to intersection among the routes
and 0,004 collisions/year are due to overtaking, for a total of 0,18 collisions/year, that
represents the halved value compared with the risk of collisions obtained for the present
situation.
In a second scenario the hypothesis was about an increase of the 30% of the maritime
traffic between Calabria and Sicily, considering the increasing integration level between
the cities of Reggio Calabria and Messina, and of 50% in the direction Ionian-
Tyrrhenian, in virtue of the important role of the Mediterranean and the straits area, in
particular the role of the port of Gioia Tauro, center of commercial exchanges with the
European Countries and transit for the goods coming from the Asian Countries.
In the considered case, the parameter that differs in comparison with the present
situation is Q, the number of ships per time unit. From the analysis, it was derived that
the expected number of head-on collisions is equal to 0,061 collisions/year, the
accidents due to the intersection of the navigation routes are equal to 0,561
collisions/year and overtaking events are equal to 0,012 collisions/year; in total it has
been calculated a risk of 0,634 collisions/year, almost double in comparison with the
present situation.
The third scenario is an overlap of the previous two; it is contextually hypothesized
that the VTS system is operative and the increase of the transport demand. It has been
calculated a risk of frontal collision equal to 0,030 collisions/year, 0,281 collisions/year
due to intersection among the routes and 0,006 collisions/year due to overtaking, for a
total of 0,317 collisions/year.
4.3. Comparative framework
In the application of the Kristiansen models to the Messina Straits it has been stated
that the total functionality of the VTS system has a great influence on safety; in fact
the possibility of the considerable decreasing of the loss of control Pc of a ship during
the navigation, implies a consequent reduction of the potential number of annual
collisions.
The difference in the number of annual collisions between the present scenario and
the scenario with VTS system is underlined in the fig.6. In comparison with the
probability of the risk estimated for the present condition, it has been observed a
variation of the risk equal to -50% in the scenario 1, +77% in the scenario 2 and -11% in
the scenario 3. In the last hypothesis, the introduction of the VTS system compensates
the increase of the maritime traffic in the Strait and the risk is however lower than the
one estimated in the present situation.

European Transport \ Trasporti Europei n. 42 (2009): 83-101
95
It is important to notice that the component of greater risk is that connected to the
numerous crossing points; therefore a strategy to reduce the risks of accidents can be
that of reducing the number of routes in the Straits area.
Figure 6: Comparison among scenarios.
5. Simulation of the maritime transport system in the area of Messina straits
The analysis of the mobility phenomena on a maritime network is possible with the
aid of simulation instruments (Cascetta, 2001; Gattuso and Rinelli, 2004). These are
very important because they allow to obtain various indicators of transport system
performance, but also to analyze the effects produced on such indicators by alternative
system configurations (project scenarios).
Using the model as a study tool and the results of the investigation on the mobility
(calculations, O/D investigation) as a database, it is possible to evaluate consequential
effects of planning interventions, as the variation of the flows on the single lines, the
variations of the route times for the different connections, the impacts on the costs
supported by the community, also in terms of externality.
As concerns the simulation of the maritime transport system in the area of the
Messina Straits it has been resorted to a micro-simulation approach. After the
construction of the network it has been implemented a specific model that allows to
simulate the flow of the ships and the mutual interactions in the area of the Straits,
beginning from behavioral hypothesis on the single vectors and on the navigation rules.
For the construction of the network 6 basic port nodes (3 on the Calabrian coast, 3 on
Sicilian coast) have been individuated plus other two representing the directions of the
North-South flows. The lines correspond to segments of the routes followed by the ships
that operate in the Straits (fig.7). The network is made up of 17 nodes and 43 lines with
162 km of lines in total.
European Transport \ Trasporti Europei n. 42 (2009): 83-101
96
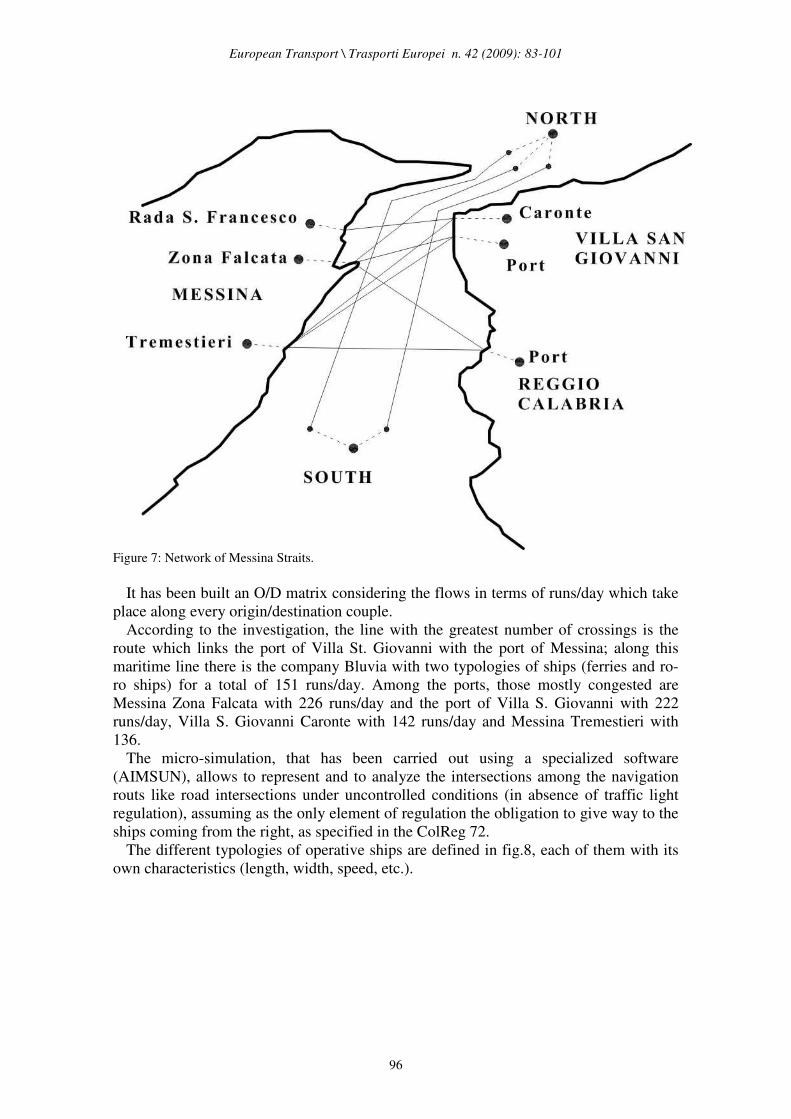
Figure 7: Network of Messina Straits.
It has been built an O/D matrix considering the flows in terms of runs/day which take
place along every origin/destination couple.
According to the investigation, the line with the greatest number of crossings is the
route which links the port of Villa St. Giovanni with the port of Messina; along this
maritime line there is the company Bluvia with two typologies of ships (ferries and ro-
ro ships) for a total of 151 runs/day. Among the ports, those mostly congested are
Messina Zona Falcata with 226 runs/day and the port of Villa S. Giovanni with 222
runs/day, Villa S. Giovanni Caronte with 142 runs/day and Messina Tremestieri with
136.
The micro-simulation, that has been carried out using a specialized software
(AIMSUN), allows to represent and to analyze the intersections among the navigation
routs like road intersections under uncontrolled conditions (in absence of traffic light
regulation), assuming as the only element of regulation the obligation to give way to the
ships coming from the right, as specified in the ColReg 72.
The different typologies of operative ships are defined in fig.8, each of them with its
own characteristics (length, width, speed, etc.).

European Transport \ Trasporti Europei n. 42 (2009): 83-101
97
Figure 8:– Characteristics for ships.
For the present scenario it has been considered the official timetable (period: May
2007) given by the navigation companies which operate on the Messina Straits.
The simulation produced different performance indicators as flow, density, speed, trip
time, total trip time, total distance and delay experienced by the fleet. These results
offer some interesting data in order to evaluate the performance of the maritime services
in the Messina Straits.
Considering the increasing trend of traffic between Sicily and Calabria, threes future
scenarios and their consequent results have been recognized and simulated. The
assumed scenarios correspond to an increase of 30%, 50% and 100% of traffic between
Sicily and Calabria.
Figure 9: Interactive simulation
From the video simulation it is possible to notice how the increasing traffic during the
day creates a considerable number of interactions among the ships and this influences
the safety factor. Fig.9 shows the situation that would occur in the rush hour (7:00-
European Transport \ Trasporti Europei n. 42 (2009): 83-101
98
8:00) considering the hypothesis of doubling the flows between the two regions. At 8
o’clock in the morning it has been recorded the contemporary presence of 21 ships on
the network.
The density of the ships in the Straits area is a very important parameter that can
modify different factors such as the level of control (Pc) and the visibility. To quantify
the vehicular density it has been considered a particular area, that is the same as in the
simulated network, equal to about 80 km². During the simulation it has been calculated
the average density in the rush hour (7:00-8:00) for the different four scenarios; the
density increasing is in direct proportion with the increasing of the flows (respectively
0,100, 0,125, 0,150, 0,300 ships/km2).
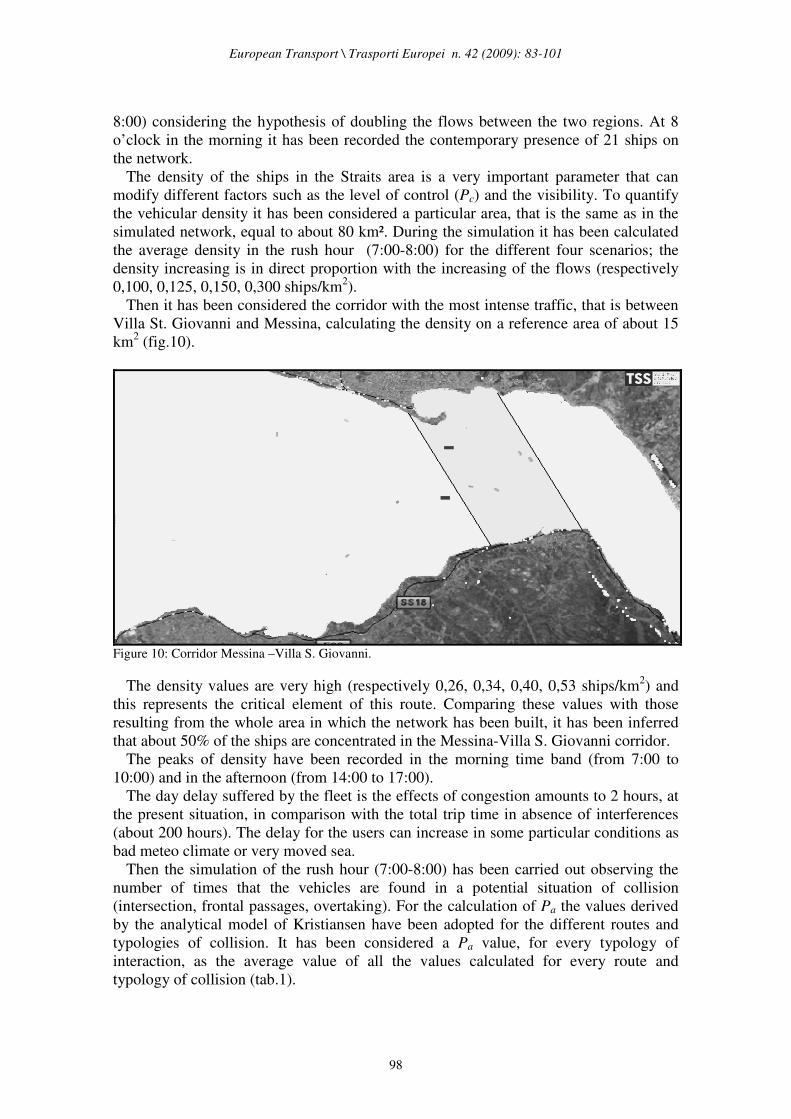
Then it has been considered the corridor with the most intense traffic, that is between
Villa St. Giovanni and Messina, calculating the density on a reference area of about 15
km2 (fig.10).
Figure 10: Corridor Messina –Villa S. Giovanni.
The density values are very high (respectively 0,26, 0,34, 0,40, 0,53 ships/km2) and
this represents the critical element of this route. Comparing these values with those
resulting from the whole area in which the network has been built, it has been inferred
that about 50% of the ships are concentrated in the Messina-Villa S. Giovanni corridor.
The peaks of density have been recorded in the morning time band (from 7:00 to
10:00) and in the afternoon (from 14:00 to 17:00).
The day delay suffered by the fleet is the effects of congestion amounts to 2 hours, at
the present situation, in comparison with the total trip time in absence of interferences
(about 200 hours). The delay for the users can increase in some particular conditions as
bad meteo climate or very moved sea.
Then the simulation of the rush hour (7:00-8:00) has been carried out observing the
number of times that the vehicles are found in a potential situation of collision
(intersection, frontal passages, overtaking). For the calculation of Pa the values derived
by the analytical model of Kristiansen have been adopted for the different routes and
typologies of collision. It has been considered a Pa value, for every typology of
interaction, as the average value of all the values calculated for every route and
typology of collision (tab.1).
European Transport \ Trasporti Europei n. 42 (2009): 83-101
99
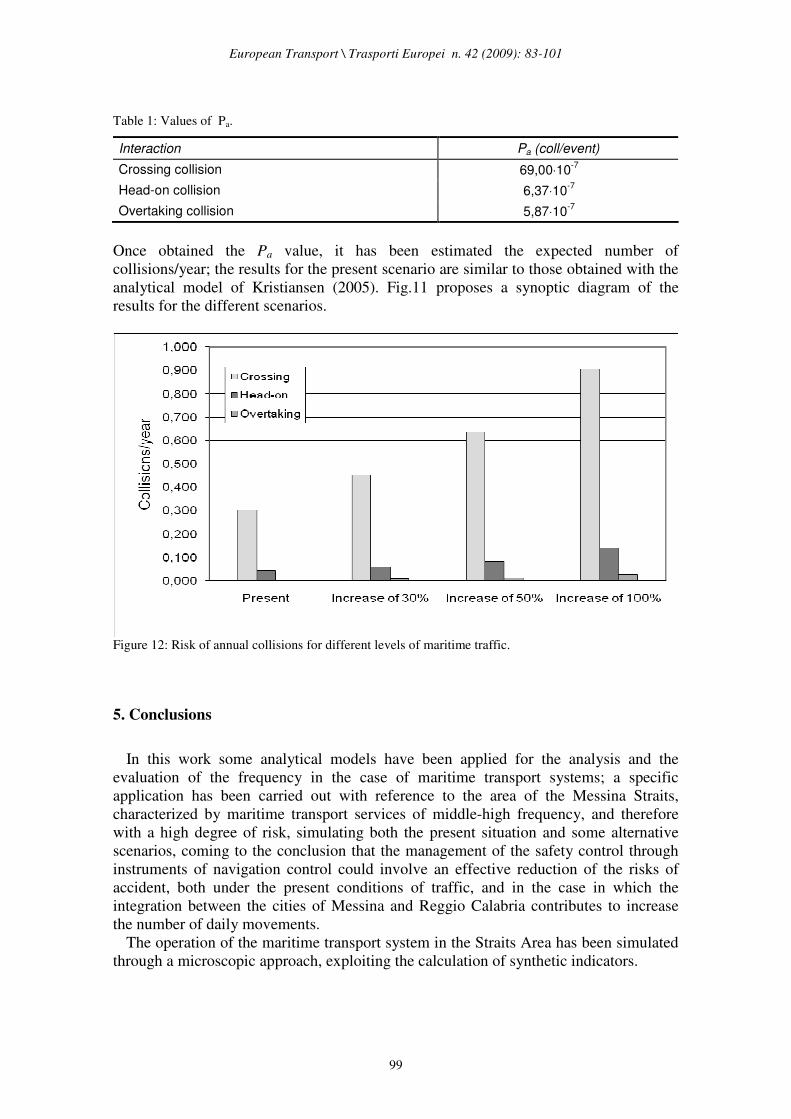
Table 1: Values of Pa.
Interaction Pa (coll/event)
Crossing collision 69,00⋅10-7
Head-on collision 6,37⋅10-7
Overtaking collision 5,87⋅10-7
Once obtained the Pa value, it has been estimated the expected number of
collisions/year; the results for the present scenario are similar to those obtained with the
analytical model of Kristiansen (2005). Fig.11 proposes a synoptic diagram of the
results for the different scenarios.
Figure 12: Risk of annual collisions for different levels of maritime traffic.
5. Conclusions
In this work some analytical models have been applied for the analysis and the
evaluation of the frequency in the case of maritime transport systems; a specific
application has been carried out with reference to the area of the Messina Straits,
characterized by maritime transport services of middle-high frequency, and therefore
with a high degree of risk, simulating both the present situation and some alternative
scenarios, coming to the conclusion that the management of the safety control through
instruments of navigation control could involve an effective reduction of the risks of
accident, both under the present conditions of traffic, and in the case in which the
integration between the cities of Messina and Reggio Calabria contributes to increase
the number of daily movements.
The operation of the maritime transport system in the Straits Area has been simulated
through a microscopic approach, exploiting the calculation of synthetic indicators.

European Transport \ Trasporti Europei n. 42 (2009): 83-101
100
The study shows that, from the safety point of view, the conditions of the maritime
transport services in the Straits area, do not have an optimal configuration;
unfortunately this is mainly due to the numerous intersections among the various routes
followed by the ships; in fact many points of intersection in limited areas like the one of
Messina Straits imply elevated collision risks. By analyzing the connections between
Calabria and Sicily it has been recognized the area corresponding to the corridor
between Messina Zona Falcata and Villa S. Giovanni as the area with the highest risk.
The use of a fully working VTS system could affect meaningfully safety aspect; in
fact by decreasing in a consistent way the possibility of control loss of a ship during the
navigation, it has consequent reduction of the risk of collision. A reduction of the risk of
accidents could be obtained through the simplification of the net too, or through a
reduction of the number of routes in conflict.

European Transport \ Trasporti Europei n. 42 (2009): 83-101
101
References
Cascetta, E. (2001) Transportation Systems engineering: theory and methods, Kluwer A.P., Dordrecht
(NL).
ColReg 72 (1972) Convention on the International Regulations for Preventing Collisions at Sea
(COLREG72).
Fujii, Y. (1982) “Recent trends in traffic accidents in Japanese waters”, Journal of Navigation, Vol. 35
(1): 90-99.
Gattuso, D. and Rinelli, S. (2004) Models and packages of traffic simulation on private transport
networks, Ed. Laruffa, Reggio Calabria.
Gattuso, D., Meduri, G. and Cardinale, G. (2007) Securmed. Interregional and Transnational Approach
about maritime safety and defense of Mediterranean western area, Project INTERREG III B.
C.I.Su.T., Reggio Calabria.
Inoue, K. (2000) “Evaluation method of ship-handling difficulty for navigation in restricted and
congested waterways”, Journal of Navigation 53(1): 167-180.
Kristiansen, S. (2005) Maritime transportation. Safety management and risk analysis, Elsevier.
Lewison, G.R.G. (1978) “The risk of encounter leading to a collision”, Journal of Navigation, Vol. 31
(3): 384-407.
Merrick, W., van Dorp, J.R., Mazzuchi, A. and Harrald, R. (2001) “Modeling Risk in the dynamic
environment of Maritime Transportation”, Proceedings of 2001 Winter Simulation Conference, (Peters,
B.A., Smith, J.S., Medeiros, D.J. and Roher, M.W. Eds.): 1090-1098. van Dorp, J.R., Merrick, J., Harrald, J., Mazzuchi, T. and Grabowski, M. (2001) “A risk management
procedure for the Washington State Ferries”, Risk Analysis, Vol. 21, No.1: 127-142.
Yip, T.L. (2008) “Port traffic risk. A study of accidents in Hong Kong waters”, Transportation Research
Part E, 44(5): 921-931.


![Infrastructural Voids in congested cities [New York]_Photography](https://static.fdocuments.in/doc/165x107/568bdcbd1a28ab2034b349bc/infrastructural-voids-in-congested-cities-new-yorkphotography.jpg)