
Safety of Navigation - Intertanko of Navigation and... · Typical Day in the VTSA - 2016 5 ... OSV...
41
Safety of Navigation and Traffic Management INTERTANKO Steve Nerheim Director -- VTS Houston-Galveston 26 th May 2017
Transcript of Safety of Navigation - Intertanko of Navigation and... · Typical Day in the VTSA - 2016 5 ... OSV...

Safety of Navigation and
Traffic Management
INTERTANKO
Steve Nerheim Director -- VTS Houston-Galveston
26th May 2017

2
U.S. Port Rankings – 2015
1 South Louisiana, LA, Port of 259.1 -3.07% 15 Texas City, TX 42.9 -10.25%
2 Houston, TX 240.9 +2.8% 16 Huntington-Tristate 42.7 -7.97%
3 New York, NY and NJ 126.6 +0.40% 17 Baltimore, MD 39.4 +6.20%
4 New Orleans, LA 87.8 +4.03% 18 Tampa, FL 35.9 +2.28%
5 Beaumont, TX 87.1 -0.11% 19 Port Arthur, TX 35.7 -2.46%
6 Corpus Christi, TX 85.6 +0.82% 20 Savannah, GA 35.2 +2.62%
7 Long Beach, CA 78.1 -8.12% 21 St Louis, MO and IL 34.9 -10.05%
8 Baton Rouge, LA 68.7 -0.58% 22 Duluth-Superior, MN and WI 33.3 -10.72%
9 Los Angeles, CA 60.1 +0.16% 23 Richmond CA 28.5 +9.62%
10 Mobile, AL 58.5 -8.88% 24 Valdez, AK 26.7 +0.75%
11 Virginia, VA Port of 57.7 +0.0% 25 Pascagoula, MS 26.5 -4.68%
12 Lake Charles, LA 56.6 -0.35% ----------------------------------------------------------------------
13 Plaquemines, LA Port of 53.5 -3.43% 32 Freeport, TX 21.1 -5.38%
14 Cincinnati-Northern, KY Ports of 44.9 -10.02% 51 Galveston, TX 10.3 -2.83%
(Millions of short tons and % of change from 2014 to 2015.)


VTS Movements - 2016
4
Tug/Tow 139,271 0.81%
Ships 22,354 -3.42%
Other 5,229 -23.03%
Public 2,384 17.94%
Total Users 169,708 -7.07%
Ferries 107,967
Total 277,205

Typical Day in the VTSA - 2016
5
Average High
39 Tanker Transits 56
23 Freighter Transits 51
2 Cruise Ship Transits 8
378 Tow Transits 493
7 Public Vessel Transits 30
298 Ferry Transits 489
18 79
OSV / Other Transits Ships in Port
49 111

Transit Demographics – 2016
6


VTS Houston-Galveston Vessel Traffic Service Area (VTSA)
• Gulf of Mexico
• Galveston Channel
• GICW
• Texas City Channel
• Bayport Channel
• Houston Ship Channel

VTS History and Mission • 33CFR161
Berwick Bay Houston-Galveston LA/Long Beach Louisville Lower Mississippi River New York Port Arthur Prince William Sound Puget Sound San Francisco St. Mary’s River Tampa
• VTS Houston-Galveston Operational since 1975
• Ports and Waterways Safety Act (PWSA) of 1972 established traffic management system to address maritime safety
• After September 2001 Terror Attacks, MTSA 2002 expanded requirements of traffic management mission to support heightened security – Situational awareness is a by-product of VTS Operations.

Watch Team Sectors
• Sail Plans/Check-in (05A)
• Sector I 1B to 33/34 (12)
• Sector II 33/34 to 122 (11)
• Sector III Lt 122 to Turning Basin (21A)
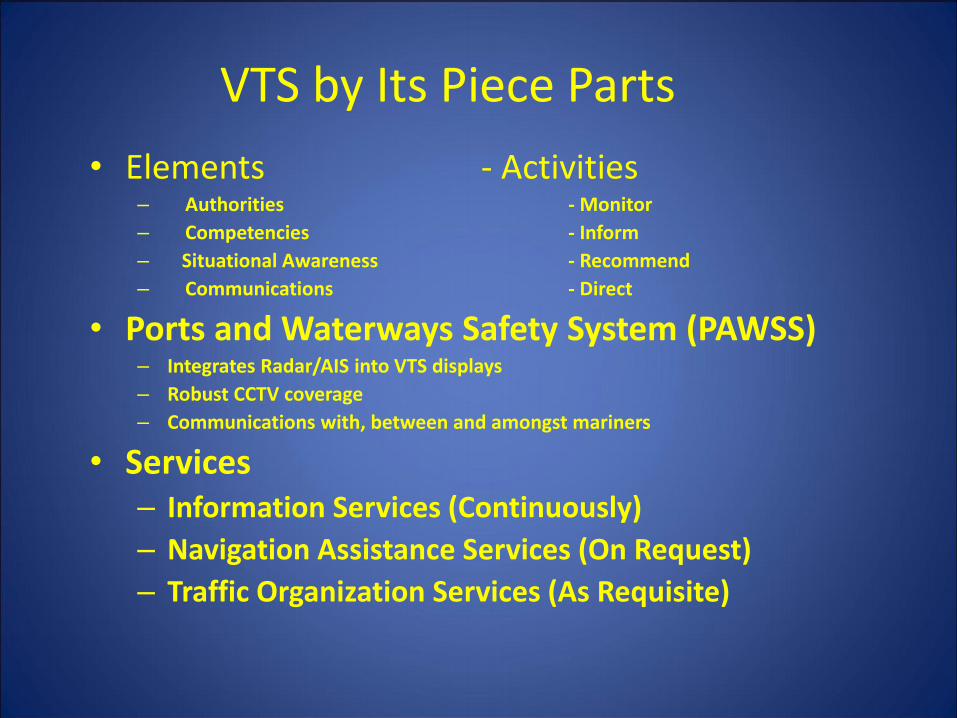
VTS by Its Piece Parts
• Elements - Activities – Authorities - Monitor
– Competencies - Inform
– Situational Awareness - Recommend
– Communications - Direct
• Ports and Waterways Safety System (PAWSS) – Integrates Radar/AIS into VTS displays
– Robust CCTV coverage
– Communications with, between and amongst mariners
• Services – Information Services (Continuously)
– Navigation Assistance Services (On Request)
– Traffic Organization Services (As Requisite)

VTS Customers
• Pilots Associations
• Towing Industry
• Shipping Agents
• Coast Guard (Prevention/Response/Plans/SCC, ATON)
• Interagency/Intergovernmental Partners
• Area Maritime Security Committee
• Local Port Authorities
• Marine Exchanges
• Harbor Safety Committee
• Port Coordination Team

Using available surveillance and communications systems,
conduct active monitoring of assigned waterways and provide
information related to safe navigation to participating VMRS
Users. The VTS may control, supervise, or otherwise manage
traffic by specifying times of entry, movement, or departure to, from, or within the VTS Area. This, combined with mariners’ participation, their compliance with regulations, and the
ordinary practices of seamen enhances the safe routing of
vessels.
Mission Statement
Concept of Operations

Mariners’ Contribution
Maintain continuous All-Stations Broadcast on AIS
Sail Plan 15 minutes prior to entering VTSA
Maintain Listening Watch on VTS Frequency
Respond when Hailed on VTS Frequency
Check in with VTS Sector Operator when entering Sector
(May Waive Vessel Traffic portion of VTS Advisory)

2002 – 2016 Transit Trends
15
Trend line represents 5 year moving average.

125000
130000
135000
140000
145000
150000
155000
160000
165000
170000
175000
20
02
20
03
20
04
20
05
20
06
20
07
20
08
20
09
20
10
20
11
20
12
20
13
20
14
20
15
20
16
Total Transits per Year
2002 – 2016 Transit Trends
16
Trend line represents 5 year moving average.

Vessel Casualties - Year to Year
17
153 Total Vessel Casualties
85 Ship
56 Tow
12 Other
0
0.2
0.4
0.6
0.8
1
1.2
1.4
1.6
20
05
20
06
20
07
20
08
20
09
20
10
20
11
20
12
20
13
20
14
20
15
20
16
Vessel Casualties per 1000 Transits

18
2016 High Water Events
MARCH, APRIL, MAY 2016
HEAVY RAINS - HIGH WATER
STRONG CURRENTS
TRAFFIC MANAGEMENT SCHEMES
- IMPLEMENTED
- REFINED
VTS HIGH WATER ACTION PLAN
WWM WATERWAYS ACTION PLAN

Channel Closure Hours
19
2010 2011 2012 2013 2014 2015 2016
Fog 265 351.5 389.55 319.96 384.1 680.2 379
Dredge Ops 39.5 70.5 94.15 57.36 48.33 99.2 137.26
Incident 152.5 157.2 5.5 26 83.88 91.5 221.75
Heavy Wx 104.5 36.8 28.1 33.1 20 75.5 88.6
Other 0 17.5 111.35 33.83 59.26 70.5 84.25
Anc Vsls 25.75
0
100
200
300
400
500
600
700
Fog
Dredge Ops
Incident
Heavy Wx
Other
Anc Vsls
Vessels anchored in the channel due to reduced visibility.

Why A PCT?
No one of us is as smart as all of us.


Why a Port Coordination team (PCT)? • To Advise and Inform COTP
• Representatives of core constituencies consolidate information required for COTP to make informed risk-management decisions.
• Focus on port operational and infrastructure needs. – Establish shipping priorities
– Implement protocols
– Manage flow of vessel movements
– Preserve safety and security.
• Four generic scenarios: – Storm
– Fog
– Environmental Incident
– MARSEC III

How Does It Work?

Information Flow Entity responsibility varies with rationale. - Hurricane - Reports readiness for HURCON. - Accounts for ships alongside or at mooring - Develops post-passage reconstitution plan - MARSEC II / III - Implements requirements when ordered/reports attainment. PCC - Communicates with PCT. - Relays orders, directions, and requirements to facilities. - Coordinates data flow to PCT. - Articulates problems and concerns for PCT resolution. PCT - Develops recommendations to COTP on: - Draft management - Channel hazards - AtoN restoration priority - Prioritization of waterborne traffic to meet facility needs - Coordination with OFA’s for post-hurricane surveys
- Provides direction and tasking to PCCs

Convene Functionally Representatives of Constituencies
Port of Houston Authority Dredging & Marine Construction Houston Area Terminals Port of Texas City Port of Galveston Port of Freeport Offshore Port Gulf Intracoastal Canal Assn. Labor, Stevedores, Agents Houston Pilots Assoc. Galveston-Texas City Pilots Assoc. Oil Refiners Oil Terminals Chemical Carriers Non-VTS Users Chemical Facilities Galveston RR Bridge Harbor Tugs NOAA Navigation Services Customs and Border Protection NOAA National Weather Service Army Corps of Engineers Sector Commander/COTP MSU Texas City VTS Houston Galveston VTS Port Arthur Sector WWM Local Law Enforcement
--------------------------------------------- - Scheduled Conference Calls. - Information exchanged between and among representatives.

Sector Commander’s Game Plan
The Four Phases
• Get ready to “Hunker Down”
• Emergency Response / Search and Rescue
• “Assess the Mess”
• Prioritize and “Go to Work”

PCT Lines of Operation
The Four Phases
I – Empty the Port
II – Secure the Port
III - Validate the Port
IV - Re-open the Port

Ramp Up to Storm Arrival Hurricane
Condition
Five
Hurricane
Condition
Four
Hurricane
Condition
Three
Hurricane
Condition
Two
Hurricane
Condition
One
Hurricane
Condition
Five
01June –
30 Nov
< 72 hrs < 48 hrs < 24 hrs < 12 hrs Reset
Seasonal
Alert
Port Con
Whiskey
Port Con
Xray
Port Con
Yankee
Port Con
Zulu
Recovery
>34 kts/72 hrs >34 kts/48 hrs >34 kts/24 hrs >34 kts/12 hrs
Report Intent
to remain in
port
Cease
Off-shore
lightering
Remain
In port
process
Closed to
Inbound
Shipping
Final Mooring
Arrangements
Closed
Internal Moves
Until > 64 kts
< 12 hrs
Timings based upon arrival of gale force winds

Battle Rhythm
Part of a larger system for local/regional
emergency management.

Sequencing
• 2100 – Sector SITREP to D8 IMT
• 2300 – D8 SITREP to LANTAREA
• 0100 – LANT Area SITREP to Comdt
• 0200 – Commandant’s IMT Summary to DHS
• 0800 – Waterway Restoration Conf Call
• 0900 – PCT Conference Call
• 1000 – D8 IMT-Sectors Conference Call
• 1800 – Sector Units SITREP to Sector Cdr
• 2100 – Sector SITREP to D8 IMT

PCT Internal Battle Rhythm
• Roll Call of Participants
• Weather
• State of the Waterway
• Requirements of Industry
• Pilot/Towing Industry/USCG Coordination
• The Way Ahead – COTP Intent for next 24-48 hrs
• Issues for COTP Resolution

PCT Questions/Outcomes 1. What do we have to work with? 2. What do we have to do? 3. How are we going to do it?

PCT Questions/Outcomes 1. What do we have to work with? (Means) 2. What do we have to do? (Ends) 3. How are we going to do it? (Ways)


INDUSTRY ENGAGEMENT LSHSC SUBCOMMITTEES
NAVIGATION OPERATIONS WATERWAY SAFETY AND UTILIZATION DREDGING AND MARINE CONSTRUCTION EDUCATION, TRAINING, AND OUTREACH PLACES OF REFUGE
WORKING GROUPS BARGE MOORING, FLEETING, PUSH-IN DISCUSSIONS
CAUSALITY MENHADEN AWARENESS CHEMICAL TANKER SCHEDULING OPTIMIZATION GREATER HOUSTON PORT BUREAU TRAFFIC EFFICIENCY COMMITTEE PCT / NRT-TJHRT / GIWW JOINT HURRICANE PROTOCOLS VTS ADVISORY ANCHORAGE WORKING GROUP

COLLABORATIVE OUTCOMES Anchorage Working Group Barge Lanes Barge Fleeting, Mooring, Push-In Discussions Bayport Turning Basin (Tow – Container Ship) Coordination Bluewater - Brownwater Interaction Engagements Bolivar Roads Inbound Alternate Route Brownwater University Cat I / Cat II Channel Obstruction Requests & Non-VTSA Obstruction Requests Dredge and Marine Construction Coordination GHPB Traffic Efficiency Working Group (Downs Committee) Harbor of Safe Refuge Handbook Places of Refuge Gantry Crane Awareness No Meeting/Overtaking in Bolivar Buoy Line Port Coordination Team San Jacinto River Mud Banks Push-in Enforcement Slack Line Reporting “Sharing Our Bay” Publication Special Traffic Management (Awkward Ships – Longer/Wider Tows Upper HSC) “Using the Houston Ship Channel” Publication Tank Vessel Efficiency Working Group (Pontikos Committee) VTS Advisory Working Group VTSA Expansion Proposals VTSA Redesign VTS Restricted Moorings Policy VTS Townhall and other Outreach

VTS Movements - 2016
37
Tug/Tow 139,271 0.81%
Ships 22,354 -3.42%
Other 5,229 -23.03%
Public 2,384 17.94%
Total Users 169,708 -7.07%
Ferries 107,967
Total 277,205


![OSv - Guest Operating System intermediate version · OSv improved the performance of certain applications (e.g., the slides [10] accompanying the OSv paper [9] reported a 34% throughput](https://static.fdocuments.in/doc/165x107/5fc779f96da10f4f56115496/osv-guest-operating-system-intermediate-version-osv-improved-the-performance-of.jpg)


