Safety Impacts of Pavement Edge Drop-offs
73
607 14th Street, NW Suite 201 Washington, DC 20005 800-993-7222 www.aaafoundation.org July 2006 Prepared by Shauna L. Hallmark David Veneziano Tom McDonald Center for Transportation Research and Education, Iowa State University Jerry Graham Karin M. Bauer Midwest Research Institute Rushi Patel Lendis Corporation Forrest M. Council Highway Safety Research Center University of North Carolina, Chapel Hill Prepared for Safety Impacts of Pavement Edge Drop-offs In cooperation with
Transcript of Safety Impacts of Pavement Edge Drop-offs

607 14th Street, NWSuite 201
Washington, DC 20005800-993-7222
www.aaafoundation.org
July 2006
Prepared by
Shauna L. HallmarkDavid VenezianoTom McDonaldCenter for Transportation Research and Education, Iowa State University
Jerry GrahamKarin M. BauerMidwest Research Institute
Rushi PatelLendis Corporation
Forrest M. CouncilHighway Safety Research CenterUniversity of North Carolina, Chapel Hill
Prepared for
Safety Impacts ofPavement Edge Drop-offs
In cooperation with
2 3
ABOUT THE SPONSOR
This study was initiated and primarily funded by the AAA Foundation for Traffic Safety in Washington, D.C., in cooperation with FHWA, an agency of the U.S. Department of Transportation. Founded in 1947, the AAA Foun-dation is a not-for-profit, publicly supported charitable research and education organization dedicated to saving lives by preventing traffic crashes and reducing injuries when crashes occur. Funding for this report was provided by voluntary contributions from AAA/CAA and their affiliated motor clubs, from individual members, from AAA-af-filiated insurance companies, as well as from other organizations and sources.
The AAA Foundation for Traffic Safety distributes this publication at no charge, as a public service. It may not be resold or used for commercial purposes without the explicit permission of the Foundation. It may, however, be copied in whole or in part and distributed for free via any medium, provided the AAA Foundation is given appropri-ate credit as the source of the material.
The authors of this report conducted this project with the active involvement of a panel of key experts and stake-holders. The opinions, findings, conclusions, and recommendations expressed in this publication represent the consensus of the authors of this report and the project panel; however, they do not necessarily represent the views of any organization or agency by which or with which any panel member is employed or affiliated. The AAA Foundation for Traffic Safety assumes no liability for the use or misuse of any information, opinions, findings, conclusions, or recommendations contained in this report.
If trade or manufacturers’ names are mentioned, it is only because they are considered essential to the object of this report, and their mention should not be construed as an endorsement. The AAA Foundation for Traffic Safety does not endorse products or manufacturers.
©2006, AAA Foundation for Traffic Safety
ContentsNOTICE
This document is disseminated in cooperation with the U.S. Department of Transportation in the interest of information exchange. The U.S. government assumes no liability for its contents or use thereof. This report does not constitute a standard, specification, or regulation. The U.S. government does not endorse products or manufacturers. Trade and manufacturers’ names appear in this report only because they are considered essential to the object of the document.
QUALITY ASSURANCE STATEMENT
FHWA provides high-quality information to serve government, industry, and the public in a manner that promotes public understanding. Standards and policies are used to ensure and maximize the quality, objectivity, utility, and integrity of its information. FHWA periodically reviews quality issues and adjusts its programs and processes to ensure continuous quality improvement.
AUDIENCE
The target audience for this report includes management-level professionals who build, operate, and maintain roads; traffic safety researchers and advocates; and highway safety policymakers. Organiza-tions expected to be most interested in this report include the American Association of State Highway and Transportation Officials, state departments of transportation, the Federal Highway Administration, and the National Association of County Engineers.
List of Tables and Figures ◗ 5
Acknowledgements ◗ 7
Preface ◗ 9
Executive summary ◗ 11
1. Background. . . . . . . . . . . . . . . . . . . . . . . . . .112. National Guidance in Addressing Pavement Edge Drop-off . . . . . . . . . . . . . . .123. State and Provincial Practice and Guidelines for Collection, Prevention, and Maintenance of Edge Drop-off . . . . . . .134. Sampling of Drop-off in Two States . . . . . . .135. Relationship Between Edge Drop-off and Road Characteristics . . . . . . . . . . . . . . .146. Frequency and Characteristics of Pavement Edge Drop-off Crashes . . . . . . . .147. Relationship of Crashes to Edge Drop-off Characteristics . . . . . . . . . . . . . . . .158. Drop-off Educational Message . . . . . . . . . .159. Panel Recommendations . . . . . . . . . . . . . . .16
Introduction ◗ 17
1.1. Safety Impacts . . . . . . . . . . . . . . . . . . . . . . .171.2. Drop-off Magnitude and Geometry . . . . . . .211.3. Scope of Work . . . . . . . . . . . . . . . . . . . . . . .27
Existing National Guidance ◗ 29
2.1. Transportation Research Board . . . . . . . . .292.2. Roadside Design Guide, 2002 Edition . . . .29
2.3. Manual on Uniform Traffic Control Devices . . . . . . . . . . . . . . . . . . . . . . . . . . . .302.4. AASHTO Green Book. . . . . . . . . . . . . . . . .312.5. National Cooperative Highway Research Program . . . . . . . . . . . . . . . . . . .322.6. Federal Highway Administration. . . . . . . . .332.7. American Public Works Association. . . . . .342.8. Institute of Traffic Engineers . . . . . . . . . . . .342.9. AAA Foundation for Traffic Safety . . . . . . .34
State and Provincial Practice and Guidelines for Collection, Prevention,
and Maintenance of Edge Drop-off ◗ 37
3.1. Design Guidelines. . . . . . . . . . . . . . . . . . . .38
3.2. Construction Guidelines . . . . . . . . . . . . . . .41
3.3. Maintenance Guidelines and Practices . . .42
3.4. Reconstruction Guidelines and Practices 47
3.5. Additional Safety Practices . . . . . . . . . . . . .49
Sampling of Pavement Edge Drop-off in two States ◗ 51
4.1. Methodology . . . . . . . . . . . . . . . . . . . . . . . .514.2. Findings . . . . . . . . . . . . . . . . . . . . . . . . . . . .58
Relationship Between Edge Drop-off and Road Characteristics ◗ 65
5.1. Description of Methodology . . . . . . . . . . . .665.2. Results. . . . . . . . . . . . . . . . . . . . . . . . . . . . .685.3. Mailboxes . . . . . . . . . . . . . . . . . . . . . . . . . .695.4. Discussion . . . . . . . . . . . . . . . . . . . . . . . . . .69

4 5
List of Tables and Figures
TABLES
1-1. Relationship between drop-off height, lane width, and speed to maintain a five-degree window of safety . . . . . . . . . . 233-1. State and provincial guidelines for design considerations . . . . . . . . . . . . . . . . 393-2. State and provincial construction guidelines and practices . . . . . . . . . . . . . . 403-3. State and provincial practices for drop- off measurement . . . . . . . . . . . . . . . . . . . . 423-4. State and provincial use of sampling to identify edge drop-off . . . . . . . . . . . . . . . . 443-5. State and provincial practices for drop- off maintenance . . . . . . . . . . . . . . . . . . . . . 453-6. Additional state and provincial guidelines for edge drop-off maintenance . . . . . . . . . 463-7. State and provincial reconstruction guidelines and practices . . . . . . . . . . . . . . 483-8. State and provincial crash analysis practices . . . . . . . . . . . . . . . . . . . . . . . . . . 504-1. Segments by county . . . . . . . . . . . . . . . . . 584-2. Shoulder width by segment for Iowa . . . . . 594-3. Lane width by segment for Iowa . . . . . . . . 594-4. Magnitude of sampled edge drop-off for Iowa . . . . . . . . . . . . . . . . . . . . . . . . . . . 604-5. Sample total edge drop-off interval . . . . . . 604-6. Data collected by county for Missouri . . . . 624-7. Shoulder width by segment for Missouri . . 624-8. Lane width by sections for Missouri . . . . . 634-9. Magnitude of sampled edge drop-off for Missouri . . . . . . . . . . . . . . . . . . . . . . . . 635-1. Range of explanatory variables evaluated for Iowa . . . . . . . . . . . . . . . . . . . 675-2. Range of explanatory variables evaluated for Missouri . . . . . . . . . . . . . . . . 676-1. Summary of crash record evaluation for 2002–2004 for Iowa . . . . . . . . . . . . . . . . . 906-2. Summary of scrubbing conditions for probable and possible edge drop-off- related crashes for 2002 to 2004 for Iowa . . . . . . . . . . . . . . . . . . . . . . . . . . . . . . 926-3. “Probable” and “Possible” edge drop- off-related crashes by crash description in Iowa . . . . . . . . . . . . . . . . . . . . . . . . . . . . 946-4. Summary of crash record evaluation for 2002 to 2004 for Missouri . . . . . . . . . . 95
6-5. Summary of scrubbing conditions for probable and possible edge drop-off related crashes for 2002 to 2004 for Missouri . . . . . . . . . . . . . . . . . . . . . . . . 976-6. Comparison of results for four states . . . 1007-1. Range of values used in regression model for Iowa . . . . . . . . . . . . . . . . . . . . . 1077-2. Range of values used in regression model for Missouri . . . . . . . . . . . . . . . . . . 107
FIGURES
1-1. Common causes of pavement edge drop-off . . . . . . . . . . . . . . . . . . . . . . . . . . . 181-2. Possible outcomes when a vehicle encounters pavement edge drop-off . . . . . 202-1. MUTCD warning signs for edge drop-off . . . . . . . . . . . . . . . . . . . . . . . . . . . 312-2. Drawing of FHWA’s Safety Edge . . . . . . . 333-1. Geographical breakdown of states surveyed . . . . . . . . . . . . . . . . . . . . . . . . . . 384-1. Collection of roadway characteristics and edge drop-off along segments . . . . . . 544-2. Measurement of edge drop-off height . . . 554-3. Definition of edge drop-off shape . . . . . . . 564-4. Typical Shape A . . . . . . . . . . . . . . . . . . . . 564-5. Typical Shape B . . . . . . . . . . . . . . . . . . . . 574-6. Percentage of sampled drop-off above indicated threshold for Iowa . . . . . . . . . . . . 614-7. Percentage of drop-off equal to or greater than indicated threshold for Missouri . . . . . . . . . . . . . . . . . . . . . . . . . . . 645-1. Drop-off on a significant grade due to erosion . . . . . . . . . . . . . . . . . . . . . . . . . . 666-1. Crash diagram indicating potential tire scrubbing . . . . . . . . . . . . . . . . . . . . . . . . . . 756-2. Relative frequency of injury outcomes for North Carolina . . . . . . . . . . . . . . . . . . . 876-3. Relative frequency of injury outcomes for Illinois . . . . . . . . . . . . . . . . . . . . . . . . . . 896-4. Relative frequency of injury outcomes for Iowa . . . . . . . . . . . . . . . . . . . . . . . . . . . 946-5. Relative frequency of injury outcomes for Missouri . . . . . . . . . . . . . . . . . . . . . . . . 988-1. Message from the Tennessee Drivers’ Manual . . . . . . . . . . . . . . . . . . . . . . . . . . . 116
Frequency and Characteristics of Pavement Edge Drop-off Crashes ◗ 71
6.1. Tort Liability . . . . . . . . . . . . . . . . . . . . . . . . .72
6.2. Evaluating Crash Forms to Assess the
Frequency and Severity of Rural Pave-
ment Edge Drop-off-Related Crashes . . . .72
Relationship of Crashes to Roadway and Edge Drop-off
Characteristics ◗ 105
7.1. Data . . . . . . . . . . . . . . . . . . . . . . . . . . . . . 105
7.2. Methodology . . . . . . . . . . . . . . . . . . . . . . 108
7.3. Iowa Results . . . . . . . . . . . . . . . . . . . . . . 109
7.4. Missouri Results . . . . . . . . . . . . . . . . . . . .111
7.5. Summary of Regression Analysis. . . . . . .113
Drop-off Educational Message ◗ 115
8.1. Review of State Drivers’ Manuals. . . . . . .1158.2. Review of Driver Education Texts and Other Educational Information . . . . . .1178.3. Discussions with Project Panel. . . . . . . . .1188.4. Conclusions Concerning Existing Educational Messages . . . . . . . . . . . . . . .1198.5. Recommended Educational Messages . . . . . . . . . . . . . . . . . . . . . . . . 120
Conclusions and Recommendations ◗ 123
9.1. Benefits of Research. . . . . . . . . . . . . . . . 124
9.2. Recommendations for Addressing Pavement Edge Drop-off . . . . . . . . . . . . 124
References ◗ 129
Appendix A. Questions for States and Provinces. . . . 133
Appendix B. Data Collection Form . . . . . . . . . . . . . . . 135
Appendix C. Selection Criteria for Edge Drop-off Crashes . . . . . . . . . . . . . . . . . . . . . . . . . . 137

6 7
Acknowledgements
The research team wishes to acknowledge the numerous people without whom this study would not have been possible. We would like to thank the AAA Foundation for Traffic Safety for sponsoring this project, the Iowa Department of Transportation and the Missouri Department of Transportation for their cooperation in providing data, and the numerous counties and districts in Iowa and Missouri that allowed us to collect data. Additionally, we would like to thank the members of our project panel who provided valuable assistance in completing this project.
Panel members (in alphabetical order):Roy Anderson, President, TranSafety, Inc.Greg Billings, Sergeant, Missouri State Highway PatrolKim Conroy, Director of Operations and Maintenance, Gwinnett County, GeorgiaMike Cool, Sergeant, Missouri State Highway PatrolForrest Council, Ph.D., University of North Carolina Highway Safety Research CenterMartin Hargrave, Federal Highway Administration, Turner-Fairbank Highway Research CenterDon Hillis, Director of Operations, Missouri Department of TransportationDon Ivey, Professor Emeritus of Civil Engineering, Texas A&M UniversityTroy Jerman, Iowa Department of Transportation, Office of Traffic and SafetyFrank Julian, Safety Edge Representative, Federal Highway AdministrationWilliam Lawson, Deputy Director, Murdough Center, Texas Tech UniversityRichard Retting, Senior Transportation Engineer, Insurance Institute for High-way SafetyMike Right, Vice President Public Affairs, AAA MissouriDennis Weinrich, Assistant Chief of Construction and Maintenance, Kansas Department of Transportation
Iowa Department of Transportation staff:Michael Pawlovich, for his help in deciphering crash forms and for his insight in completing the crash form analysisMary Stalhut and the Iowa Safety Management System, for reviewing the educational messageTom Welch, for his assistance, support, and advice
Lendis Corporation (Federal Highway Administration Contractor):Rushi Patel, for his assistance in developing the decision tree for the crash form analysis
•••••
•
••••••
••
•
•
•
•

8 9
Preface
In 1998, the American Association of State Highway Officials (AASHTO) approved its Strategic Highway Safety Plan. This plan was developed with the assistance of the Federal Highway Administration (FHWA), the National Highway Traffic Safety Administration (NHTSA), and the Transportation Research Board (TRB). The goal of this plan is to reduce highway fatalities on our nation’s road-ways by 5,000 to 7,000 each year to 1.0 per 100 million vehicle miles traveled. This will be accomplished by the application of low-cost, proven countermea-sures that, when implemented, will lead to a reduction in the number of motor vehicle crashes each year.
To provide a structure for executing this plan, a 22-volume implementa-tion guide has been developed under the direction and guidance of the National Cooperative Highway Research Program (NCHRP). NCHRP is an agency of TRB. The guide, NCHRP Report 500: Guidance for Implementation of the AASHTO Strategic Highway Safety Plan, addresses a specific type of collision in each volume. Examples include: Aggressive Driving Collisions, Collisions caused by Drivers with Suspended or Revoked Licenses, Collisions with Trees in Hazardous Locations, Head-On Collisions, Unsignalized Intersection Colli-sions, and Run-Off-Road Collisions. Each volume also gives guidance for the implementation of low-cost countermeasures proven to mitigate the specific collision addressed.
For example, Volume 6: A Guide for Addressing Run-Off-Road Colli-sions, addresses countermeasures for mitigating the number and the severity of collisions caused by vehicles leaving the roadway. In this volume, one specific type of run-off-road collision addressed is a collision caused by a pavement edge drop-off. The research described in this report, Safety Impacts of Pave-ment Edge Drop-offs, focuses on the magnitude and severity of such collisions, evaluates federal and state guidance regarding when edge drop-offs should be addressed, and provides measures for the quantity and depth of edge drop-offs on representative rural two-lane roadways in the United States. This information is necessary and required for states and counties to determine the

10 11
economic benefits from addressing pavement edge drop-offs, to understand the importance of this aspect of the AASHTO Strategic Highway Safety Plan, and to subsequently focus the limited maintenance resources necessary to mitigate this roadway problem.
This report, and the preceding study — Humphreys, J.B., and J.A. Par-ham. (1994). The elimination or mitigation of hazards associated with pavement edge drop-offs during roadway resurfacing. Washington, D.C.: AAA Foundation for Traffic Safety — was initiated and primarily funded by the AAA Foundation for Traffic Safety (AAAFTS) to reduce the injuries and loss of life annually occur-ring on our nation’s roadways. It contains, in Chapter 6, research initiated and funded by FHWA in support of the nation’s goals to improve traffic safety. This joint report is an important addition to the knowledge base necessary to quantify the safety and economic benefits derived from implementing a portion of the AASHTO Highway Strategic Plan – namely a reduction in crashes precipitated by pavement edge drop-offs.
Executive summary
1. Background
A vehicle may leave its travel lane for a number of reasons, such as driver
error, poor surface conditions, or avoidance of a collision with another vehicle in the
travel lane. When a vehicle leaves the travel lane, pavement edge drop-off poses
a potential safety hazard because significant vertical differences between sur-
faces can affect vehicle stability and reduce a driver’s ability to handle the vehicle.
Numerous controlled studies have tested driver response to encounter-
ing drop-offs under various conditions, including different speeds, vehicle types,
drop-off height and shape, and tire scrubbing versus non-scrubbing conditions.
The studies evaluated the drivers’ ability to return to and recover within their
own travel lane after leaving the roadway and encountering a drop-off. Many
of these studies, however, have used professional drivers as test subjects, so
results may not always apply to the population of average drivers. Furthermore,
test subjects are always briefed on what generally is to be expected and how
to respond; thus, the sense of surprise that a truly naïve driver may experience
upon realizing that one or two of his or her tires have just dropped off the edge
of the pavement, is very likely diminished. Additionally, the studies were carried
out under controlled conditions.
The actual impact of pavement edge drop-off on drivers’ ability to recover
safely once they leave the roadway, however, is not well understood under actual
driving conditions. Additionally, little information is available that quantifies the
number or severity of crashes that occur where pavement edge drop-off may
have been a contributing factor.
oopsomer
Note
Accepted set by oopsomer
oopsomer
Note
Completed set by oopsomer
oopsomer
Note
Accepted set by oopsomer
12 13
Without sufficient information about the frequency of edge drop-off-related
crashes, agencies are not fully able to measure the economic benefits of invest-
ment decisions, evaluate the effectiveness of different treatments to mitigate
edge drop-off, or focus maintenance resources. To address these issues, this
report details research to quantify the contribution of pavement edge drop-off
to crash frequency and severity. Additionally, the study evaluated federal and
state guidance in sampling and addressing pavement edge drop-off and quanti-
fied the extent of pavement edge drop-off in two states. This study focused on
rural two-lane paved roadways with unpaved shoulders, since they are often
high speed facilities (55+ mph), have varying levels of maintenance, and are
likely to be characterized by adverse roadway conditions such as narrow lanes
or no shoulders.
2. National Guidance in Addressing Pavement Edge Drop-off
Chapter 2 summarizes national guidance and recommendations for ad-
dressing pavement edge drop-off. Although several agencies at the national level
provide guidance and recommendations related to edge drop-off for highway
design, construction, and maintenance, no national standards exist that indicate
the level at which pavement edge drop-off should be addressed. Numerous stud-
ies list a threshold drop-off height where some action should be taken; however,
none of the national guidance discusses edge drop-off shape nor agrees on a
specific level of drop-off that constitutes a potential hazard.
The Federal Highway Administration (FHWA) has instituted its Safety Edge
program to address edge drop-off. The program encourages agencies to use a
30 – 35° asphalt fillet along each side of the roadway in all resurfacing projects.
Chapter 2 discusses national guidance from numerous sources, including
the Manual on Uniform Traffic Control Devices, FHWA, American Association
of State Highway and Transportation Officials, National Cooperative Highway
Research Program, Institute of Transportation Engineers, and a previous AAA
Foundation for Traffic Safety study.
3. State and Provincial Practice and Guidelines for Collection, Prevention, and Maintenance of Edge Drop-off
Numerous U.S. states and Canadian provinces were contacted to
document their guidelines for prevention and mitigation of edge drop-off dur-
ing design, construction, and maintenance. Practices from 14 U.S. states and
2 Canadian provinces were obtained after contacting a number of agencies.
Chapter 3 summarizes state and province practices for design, construction,
and maintenance.
4. Sampling of Drop-off in Two States
One of the main goals of this research was to quantify the magnitude of
edge drop-off on rural two-lane paved roadways. As discussed in Chapter 4, 21
counties in Iowa and 2 districts in Missouri were selected to provide a represen-
tative sampling of the magnitude and amount of edge drop-off present in each
state. Pavement edge drop-off height and the shape of the drop-off, as well as
other road characteristics such as lane width, shoulder type, and shoulder width,
were documented along 150 segments in Iowa and 71 segments in Missouri on
rural two-lane paved roadways with unpaved shoulders. Data were collected
at a randomly selected 0.1-mile section for each mile of segment. Segments
were 2 miles or longer. Although both states are in the Midwest, rural two-lane
paved roadways vary significantly in maintenance guidelines, topography, soil
conditions, and paved shoulder policies.
Results indicate that a very small percentage of drop-off sampled in Iowa
was 5.0 inches in height (< 0.1%), less than 1% was equal to or greater than 4.0
inches, roughly 1% was equal to or greater than 3.0 inches, and slightly more than
12% was equal to or greater than 2.0 inches. In Missouri, a very small percent-
age of drop-off sampled was greater than or equal to 5.0 inches (0.11%), less
than 1% was equal to or greater than 4.0 inches, 3.0% was equal to or greater
than 3.0 inches, and 18.6% was equal to or greater than 2.0 inches.

14 15
5. Relationship Between Edge Drop-off and Road Characteristics
In Chapter 5, the relationship between drop-off and roadway charac-teristics was evaluated for Iowa and Missouri to determine where drop-off was more likely to occur, since edge drop-off was more likely expected to be pres-ent along roadways with certain characteristics. A relationship between drop-off amount and roadway characteristics was analyzed using hierarchical tree-based regression (HTBR) analysis.
6. Frequency and Characteristics of Pavement Edge Drop-off Crashes
A primary goal of the research was to quantify the frequency of edge drop-off-related crashes. Council and Patel (2004) developed and used a method to evaluate the number of pavement edge drop-off related crashes that occurred in North Carolina and Illinois as part of a previous research study that FHWA initiated and funded. The analysis for these two states was carried out on state system rural roads with narrow paved or unpaved shoulders.
Their methods were adapted for this research on Iowa and Missouri roads. The frequency and characteristics of pavement edge drop-off-related crashes in Iowa and Missouri were assessed by evaluating crash reports. A sample of crashes that were likely to be edge drop-off related were selected, and officer narratives and crash diagrams from crash reports were evaluated to determine whether edge drop-off was likely to have contributed to each crash. Chapter 6 presents the results of this analysis. The Iowa and Missouri analysis included both county and state rural paved roads with unpaved shoulders.
FHWA collaborated with AAAFTS in publishing this report. The methods and results for all four states are presented in Chapter 6. In all cases, crashes that were probably (“Probable”) or possibly (“Possible”) edge drop-off related and involved tire scrubbing comprised less than 2% of rural crashes on similar roads. Crashes that were “Probable” or “Possible” edge drop-off related, with-out considering scrubbing, comprised less than 3% of rural crashes on similar roads. Scrubbing occurs when the tire sidewall is forced into the pavement edge,
resulting in friction between the tire and pavement.
The severity of edge drop-off-related crashes is also discussed. Crashes
determined to be “Probable” or “Possible” edge drop-off related were much more
likely than other crashes on similar roadways to result in a fatality or serious injury.
The number of edge drop-off-related crashes is relatively small compared
to other crash types; however, even though small, the numbers are still large
enough to warrant attention and treatment.
7. Relationship of Crashes to Edge Drop-off Characteristics
Chapter 7 assesses the relationship between the crash rates of roadway
segments and the fraction of drop-off of specified depth along those segments.
A relationship between potential edge drop-off-related crashes and roadway
characteristics was explored for Iowa and Missouri using negative binomial
regression analysis. The frequency of edge drop-off-related crashes was the
predictor variable, and roadway characteristics, including drop-off, were the
explanatory variables.
The regression analysis of Iowa crashes indicates a relationship between
potential edge drop-off crashes and the amount of edge drop-off along a seg-
ment that was 2.5 inches or more. This agrees well with current maintenance
thresholds, which numerous states have set at 2.0 inches.
8. Drop-off Educational Message
Chapter 8 reviews drivers’ manuals from numerous states, information
in drivers’ education textbooks, input from the project panel, and conclusions
concerning available educational materials to identify and evaluate existing
educational materials and advise road users about the hazards and avoidance
of pavement edge drop-offs. Two educational messages to assist drivers in
negotiating drop-off are presented.
16 17
9. Panel Recommendations
The panel for this project met after reviewing the final project results and agreed on a set of recommendations for addressing pavement edge drop-off. Recommendations are summarized by the agency to which they are directed and are presented in Chapter 9.
Introduction
Pavement edge drop-off is a vertical elevation difference between two adjacent roadway surfaces. Edge drop-offs are potential safety hazards because significant vertical differences between surfaces can reduce vehicle stability and impede a driver’s ability to handle a vehicle. Drop-offs can occur between (a) a paved travel way and a paved shoulder, (b) a paved travel way and an unpaved shoulder, (c) between two paved travel lanes, or (d) between a paved shoulder and an adjacent surface (Ivey et al. 1984).
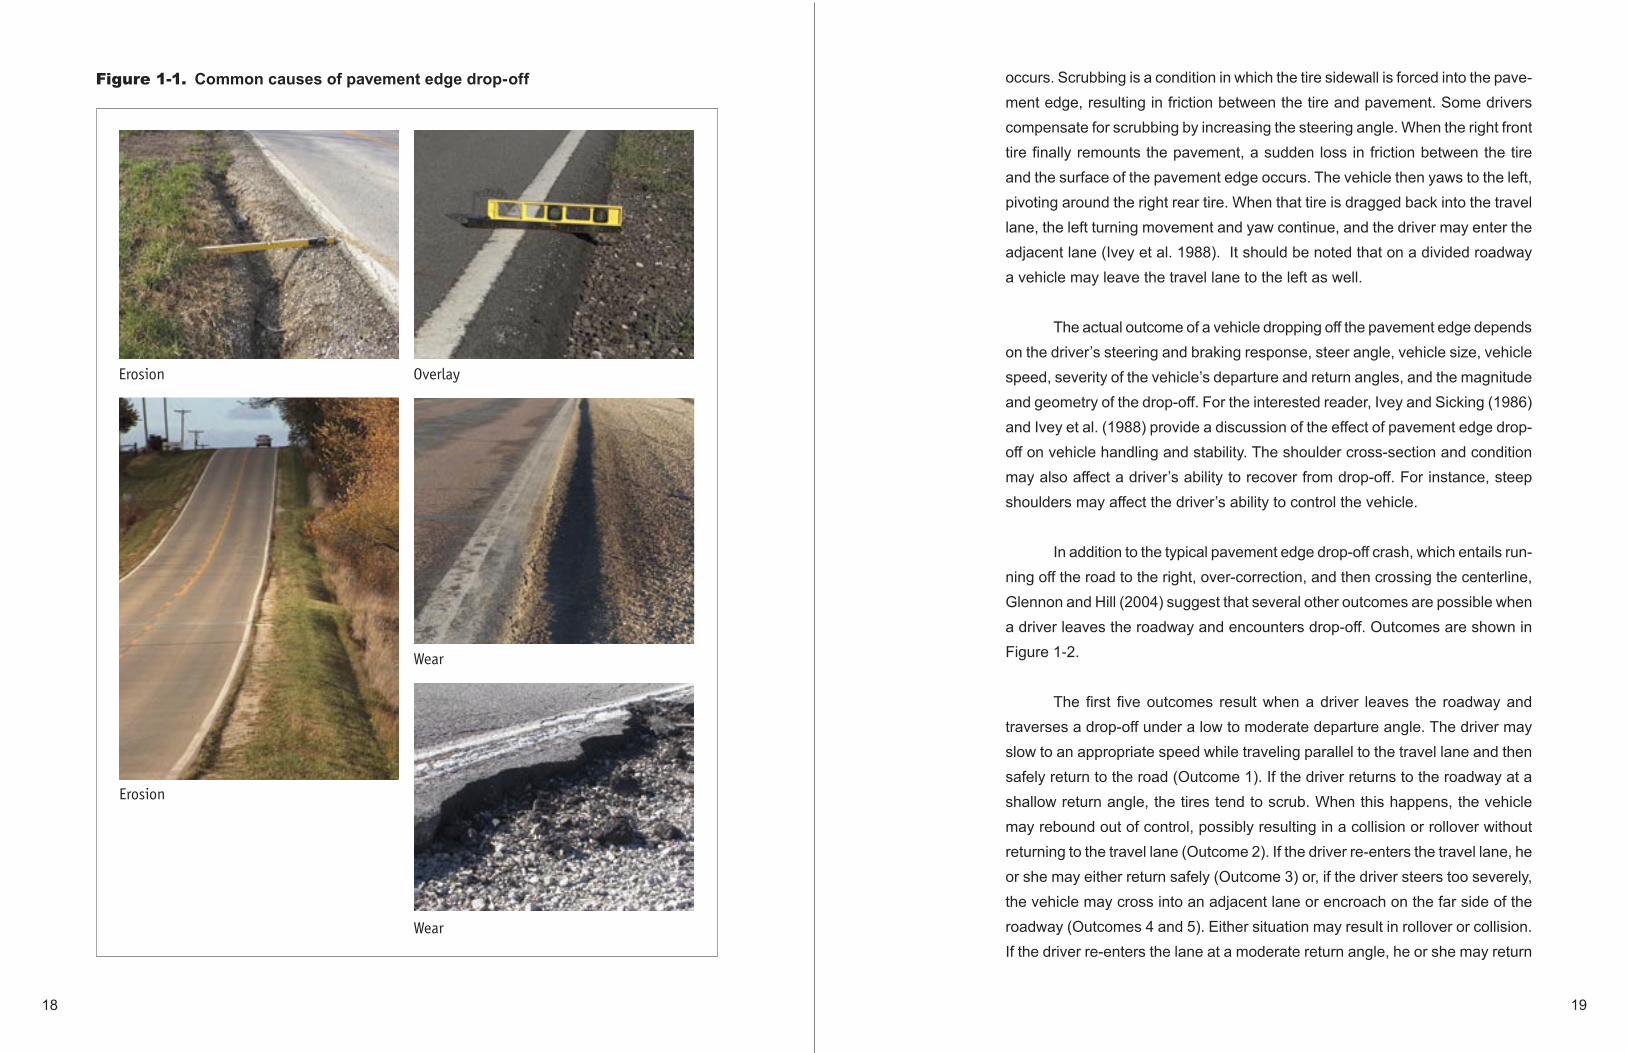
Drop-off between two paved surfaces typically results from either resur-facing or settling between the pavement surfaces. Drop-off between a paved travel lane and unpaved shoulder can result when the maintenance of unpaved shoulders is untimely or when roadways are resurfaced without providing a proper transition to the shoulder, resulting in a vertical elevation difference (AASHTO 1997). Excessive wear and erosion can also result in the migration of shoulder material away from the pavement edge. Different causes of drop-off between a paved roadway and unpaved shoulder, which are the focus of this report, are illustrated in Figure 1-1.
1.1. Safety Impacts
A vehicle may leave its travel lane for a number of reasons, such as driver error or distraction, poor surface conditions, or avoidance of a collision with an-other vehicle in the travel lane. When a vehicle leaves the travel lane, pavement edge drop-off poses a potential safety problem. When a vehicle leaves the travel lane and the right wheels drop off the edge of the roadway, the driver may be surprised by the abrupt change in elevation and attempt to return to the travel lane (Ivey et al. 1984). A typical pavement edge drop-off-related crash occurs when the driver attempts an immediate return to the roadway and tire scrubbing
18 19
Figure 1-1. Common causes of pavement edge drop-off
OverlayErosion
Wear
Wear
Erosion
occurs. Scrubbing is a condition in which the tire sidewall is forced into the pave-ment edge, resulting in friction between the tire and pavement. Some drivers compensate for scrubbing by increasing the steering angle. When the right front tire finally remounts the pavement, a sudden loss in friction between the tire and the surface of the pavement edge occurs. The vehicle then yaws to the left, pivoting around the right rear tire. When that tire is dragged back into the travel lane, the left turning movement and yaw continue, and the driver may enter the adjacent lane (Ivey et al. 1988). It should be noted that on a divided roadway a vehicle may leave the travel lane to the left as well.
The actual outcome of a vehicle dropping off the pavement edge depends on the driver’s steering and braking response, steer angle, vehicle size, vehicle speed, severity of the vehicle’s departure and return angles, and the magnitude and geometry of the drop-off. For the interested reader, Ivey and Sicking (1986) and Ivey et al. (1988) provide a discussion of the effect of pavement edge drop-off on vehicle handling and stability. The shoulder cross-section and condition may also affect a driver’s ability to recover from drop-off. For instance, steep shoulders may affect the driver’s ability to control the vehicle.
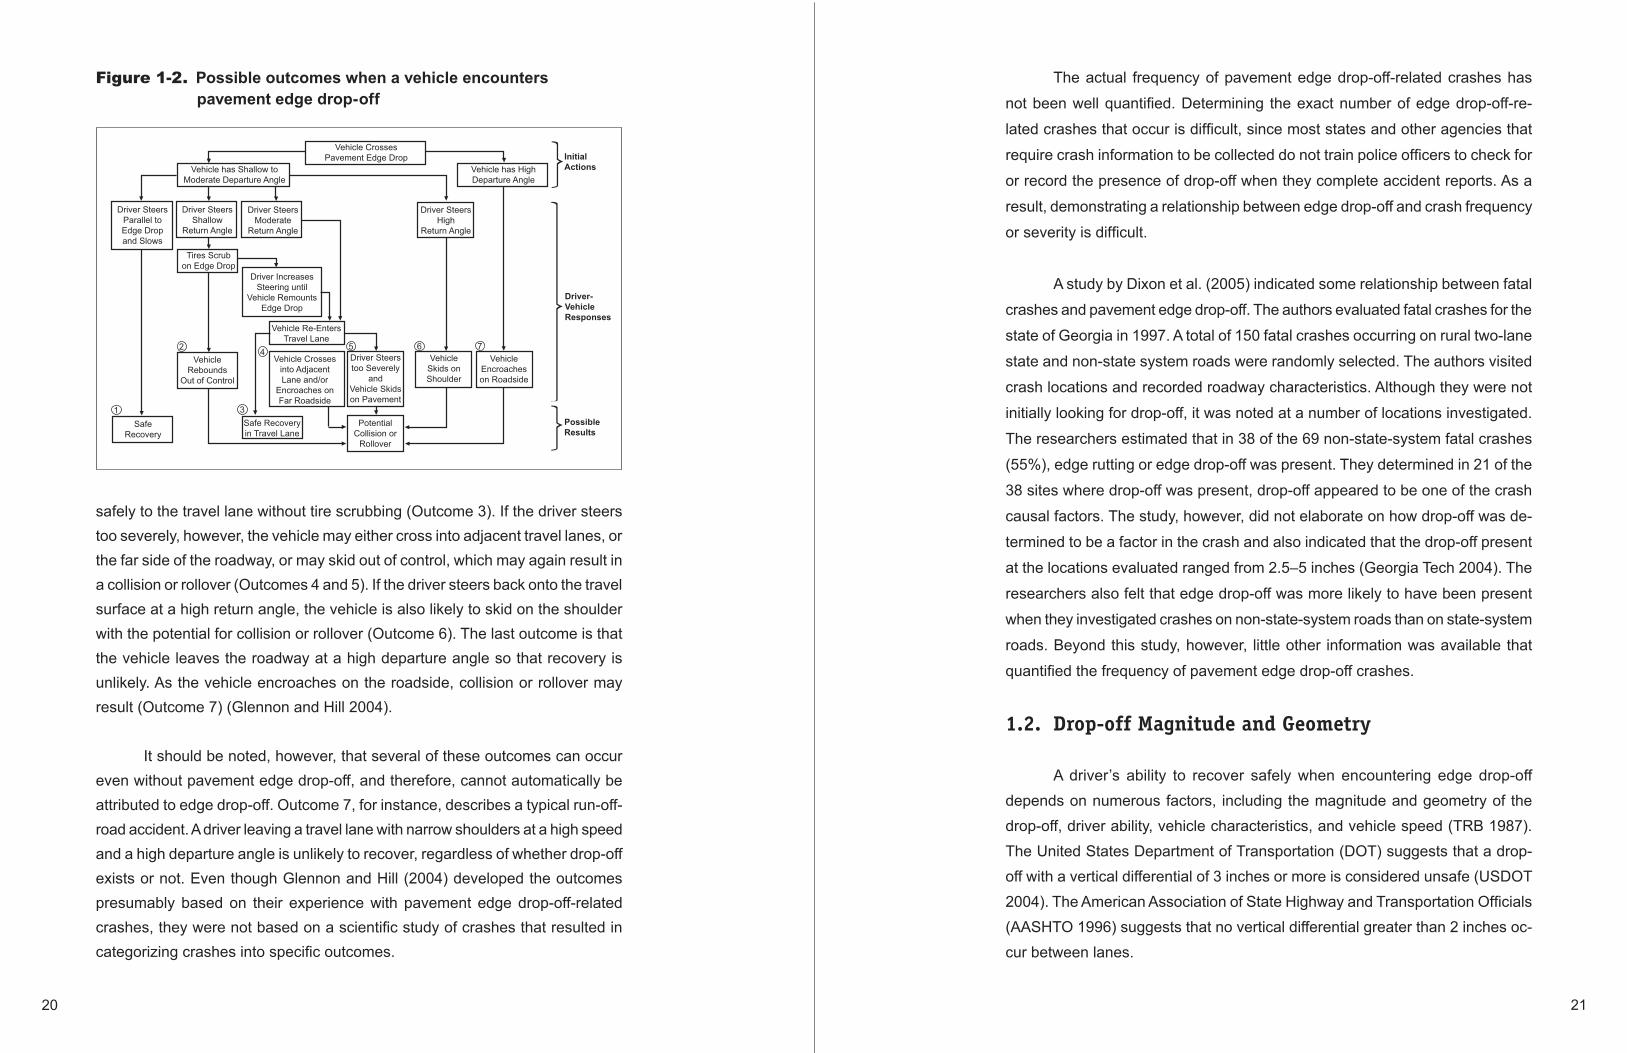
In addition to the typical pavement edge drop-off crash, which entails run-ning off the road to the right, over-correction, and then crossing the centerline, Glennon and Hill (2004) suggest that several other outcomes are possible when a driver leaves the roadway and encounters drop-off. Outcomes are shown in Figure 1-2.
The first five outcomes result when a driver leaves the roadway and traverses a drop-off under a low to moderate departure angle. The driver may slow to an appropriate speed while traveling parallel to the travel lane and then safely return to the road (Outcome 1). If the driver returns to the roadway at a shallow return angle, the tires tend to scrub. When this happens, the vehicle may rebound out of control, possibly resulting in a collision or rollover without returning to the travel lane (Outcome 2). If the driver re-enters the travel lane, he or she may either return safely (Outcome 3) or, if the driver steers too severely, the vehicle may cross into an adjacent lane or encroach on the far side of the roadway (Outcomes 4 and 5). Either situation may result in rollover or collision. If the driver re-enters the lane at a moderate return angle, he or she may return
oopsomer
Note
Accepted set by oopsomer
20 21
Figure 1-2. Possible outcomes when a vehicle encounters pavement edge drop-off
Vehicle has Shallow to Moderate Departure Angle
Vehicle Crosses Pavement Edge Drop
Vehicle has High Departure Angle
Driver Steers Parallel to Edge Drop and Slows
Driver Steers Shallow
Return Angle
Tires Scrub on Edge Drop
Vehicle Re-Enters Travel Lane
Vehicle Crosses into Adjacent Lane and/or
Encroaches on Far Roadside
Driver Steers Moderate
Return Angle
Driver Steers High
Return Angle
Initial Actions
Driver-Vehicle Responses
Possible Results
Driver Steers too Severely
and Vehicle Skids on Pavement
Vehicle Rebounds
Out of Control
Vehicle Skids on Shoulder
Vehicle Encroaches on Roadside
Potential Collision or
Rollover
Safe Recovery
Safe Recovery in Travel Lane
Driver Increases Steering until
Vehicle Remounts Edge Drop
1
2 4
3
5 6 7
safely to the travel lane without tire scrubbing (Outcome 3). If the driver steers too severely, however, the vehicle may either cross into adjacent travel lanes, or the far side of the roadway, or may skid out of control, which may again result in a collision or rollover (Outcomes 4 and 5). If the driver steers back onto the travel surface at a high return angle, the vehicle is also likely to skid on the shoulder with the potential for collision or rollover (Outcome 6). The last outcome is that the vehicle leaves the roadway at a high departure angle so that recovery is unlikely. As the vehicle encroaches on the roadside, collision or rollover may result (Outcome 7) (Glennon and Hill 2004).
It should be noted, however, that several of these outcomes can occur even without pavement edge drop-off, and therefore, cannot automatically be attributed to edge drop-off. Outcome 7, for instance, describes a typical run-off- road accident. A driver leaving a travel lane with narrow shoulders at a high speed and a high departure angle is unlikely to recover, regardless of whether drop-off exists or not. Even though Glennon and Hill (2004) developed the outcomes presumably based on their experience with pavement edge drop-off-related crashes, they were not based on a scientific study of crashes that resulted in categorizing crashes into specific outcomes.
The actual frequency of pavement edge drop-off-related crashes has
not been well quantified. Determining the exact number of edge drop-off-re-
lated crashes that occur is difficult, since most states and other agencies that
require crash information to be collected do not train police officers to check for
or record the presence of drop-off when they complete accident reports. As a
result, demonstrating a relationship between edge drop-off and crash frequency
or severity is difficult.
A study by Dixon et al. (2005) indicated some relationship between fatal
crashes and pavement edge drop-off. The authors evaluated fatal crashes for the
state of Georgia in 1997. A total of 150 fatal crashes occurring on rural two-lane
state and non-state system roads were randomly selected. The authors visited
crash locations and recorded roadway characteristics. Although they were not
initially looking for drop-off, it was noted at a number of locations investigated.
The researchers estimated that in 38 of the 69 non-state-system fatal crashes
(55%), edge rutting or edge drop-off was present. They determined in 21 of the
38 sites where drop-off was present, drop-off appeared to be one of the crash
causal factors. The study, however, did not elaborate on how drop-off was de-
termined to be a factor in the crash and also indicated that the drop-off present
at the locations evaluated ranged from 2.5–5 inches (Georgia Tech 2004). The
researchers also felt that edge drop-off was more likely to have been present
when they investigated crashes on non-state-system roads than on state-system
roads. Beyond this study, however, little other information was available that
quantified the frequency of pavement edge drop-off crashes.
1.2. Drop-off Magnitude and Geometry
A driver’s ability to recover safely when encountering edge drop-off depends on numerous factors, including the magnitude and geometry of the drop-off, driver ability, vehicle characteristics, and vehicle speed (TRB 1987). The United States Department of Transportation (DOT) suggests that a drop-off with a vertical differential of 3 inches or more is considered unsafe (USDOT 2004). The American Association of State Highway and Transportation Officials (AASHTO 1996) suggests that no vertical differential greater than 2 inches oc-cur between lanes.

22 23
Numerous studies have been conducted to determine the relationship between drop-off and a driver’s ability to recover. Several have used test drivers in field situations, and others employed theoretical methods to evaluate the likeli-hood that a vehicle encroaching onto the shoulder can traverse edge drop-offs of different heights and shapes at different speeds and recover safely.
Klein et al. (1977) conducted both field and simulation tests to evaluate driver ability to recover from drop-off. Vehicles were tested on a closed-loop course using 22 non-professional drivers in the field test. The drivers were aware of the nature of the test, so the element of surprise was not a factor. A 4.5-inch drop-off with a vertical face was tested using 3 different passenger cars at con-stant speeds of 44, 30, and 32 mph. A total of 73 runs were conducted. Scrub-bing did not occur in 34 of the trials, and drivers were able to recover within their 12-foot lane after they returned to the roadway. Scrubbing occurred in 39 of the test runs, and in 22 of those runs, the driver exceeded the lane boundary while returning to the travel lane. The researchers found the likelihood that the lane boundary would be exceeded when scrubbing occurred was strongly related to vehicle speed. They also indicated each vehicle had a unique speed when this occurred. They empirically determined the maximum drop-off height that can be climbed in scrubbing is 5 inches. They also developed a set of curves that describe the relationship between edge drop-off heights, the speed necessary to remount the pavement, and vehicle return angle.
Stoughton et al. (1979) evaluated the effect of pavement edge drop-off on vehicle stability, using professional drivers in small-, medium-, and large-sized automobiles and pick-up trucks. The authors tested 1.5-, 3.5-, and 4.5-inch drop-offs at 60 mph. Drivers were able to recover safely within their 12-foot lane under all situations. The authors noted “a significant jolt and accompanying noise associated with driving off and mounting [the 3.5- and 4.5-inch drop-offs].” Limitations to the study are that edge shape was not indicated, no element of surprise was present, and no indication of whether scrubbing had occurred was present. Additionally, the ability of professional drivers to negotiate drop-off suc-cessfully, as described in this study, does not necessarily represent the ability of ordinary, non-professional drivers to do the same.
Zimmer and Ivey (1982) also conducted a study that evaluated drop-off
depths of 1.5, 3.0, and 4.5 inches from an asphalt pavement to a soil shoulder. Three edge shapes were evaluated, including a vertical edge, a fully rounded edge, and a 45° wedge at 35, 45, and 55 mph using four test vehicles. A profes-sional driver, semi-professional driver, and a male and female non-professional driver were used. Only the professional driver completed the entire series of tests. Both scrubbing and non-scrubbing conditions were evaluated. When scrubbing occurred, vehicle speed and edge drop-off height affected recovery. The researchers found pronounced differences in the drivers’ ability to recover with different shapes of edge drop-off. They also found the 45° wedge was always safer than the vertical edge, and was also safer than the rounded edge in a 3.0- or 4.5-inch drop-off.
Graham and Glennon (1984) evaluated drop-off height for construc-tion zones. They reviewed existing studies, conducted simulation tests, and developed relationships between different characteristics, such as speed and re-entry approach angles for vertical edge drop-offs with no rounding or taper-ing. The authors developed windows of safety that demonstrated the range of conditions under which a vehicle could safely recover without encroaching into an adjacent lane. The drop-off heights where traffic control is suggested for a 5° window of safety are shown in Table 1-1. The window of safety is the range of vehicle speed and reentry approach degrees that will allow a vehicle safely to remount a drop-off and recover without encroachment on adjacent lanes. The threshold heights of drop-off at which traffic control is suggested are also provided in Table 1-1.
Table 1-1. Relationship between drop-off height, lane width, and speed to maintain a five-degree window of safety
Speed (mph)
Drop-off height (inches) warranting traf-fic control for various lane widths (feet)
12 11 10 9
30 4 4 3 2
35 4 3 2 1
40 3 2 1 1
45 2 1 1 1
≥ 50 1 1 1 1

24 25
As shown, a 4-inch vertical drop-off can only be negotiated safely up to 30–35 mph; after that speed, Graham and Glennon (1984) suggest using traf-fic control. A 3-inch vertical drop-off can only be safely negotiated from 30–40 mph. Only very low vertical drop-offs can be negotiated at higher speeds. The authors concluded that drop-offs greater than 4 inches constitute a hazard and that traffic exposure should be minimized using barriers.
Ivey and Sicking (1986) further evaluated the relationship between drop-off height and the driver’s ability to recover, using simulation and analytical relationships to determine the steer angle necessary to remount a drop-off with different heights and edge shapes at 50 mph. Their results reinforced earlier find-ings that edge shape influences the driver’s ability to recover. A 4-inch vertical edge resulted in loss of vehicle control. As the edge shape became flatter, less effect was noted. The authors evaluated a 2-inch, 4-inch, and 6-inch drop-off with a 45° wedge and found that even with a drop-off depth of 6 inches, recovery within the 12-foot lane was possible.
Olson et al. (1986) evaluated a vertical drop-off and 45° wedge drop-off with hard and soft shoulder surfaces, different passenger vehicle sizes, and front- versus rear-wheel drive vehicles. Fifty non-professional drivers were used to complete 185 test runs. Speeds of 20, 30, and 40 mph were tested for a 4.5-inch vertical face drop-off; 30, 40, and 50 mph for a 3-inch vertical face drop-off; and various speeds up to 55 mph for a 3- and 4.5-inch drop-off with a 45° beveled edge. Results indicated none of the non-professional drivers could negotiate a vertical drop-off of 4.5 inches or deeper at any speed. They found that vehicle size was relevant and that vertical edge drop-offs around 3 inches could be negotiated at speeds of 30 mph in large passenger cars. They believed, however, that smaller cars would need lower speeds to accomplish this. For the 45° beveled edge, drivers were always able to recover within their own lane with speeds up to 55 mph. The authors also evaluated test runs on soft shoulders with a professional driver and concluded the height of the drop-off, not shoulder material, was the determining factor in being able to recover safely.
More recently, Delaigue (2005) modeled vehicle recovery for different edge drop-off heights and slopes using computer-based simulation. This was the only study reviewed that investigated the impact of different edge wedge
angles. A vehicle’s ability to return to the roadway safely was evaluated using different drop-off heights, edge wedge angles, vehicle types, load configura-tions, and driver reaction times. A light-subcompact car, a midsize car, a pickup truck, and a tractor semi-trailer, were modeled. Delaigue simulated attempts to return to the travel lane after dropping the right front tire off the pavement edge. An attempt was considered unsuccessful if the vehicle failed to return to the pavement, encroached into the adjacent lane upon returning, “spun out,” or ran off the road. Drop-off heights ranging from 4–12 inches were simulated using different slope angles. An initial speed of 60 mph was used.
Delaigue reported the slope of the wedge was critical for all vehicles, with a flatter wedge always being safer than a steeper wedge for any given drop-off height. The tractor semi-trailer was the vehicle most sensitive to the drop-off, and the pickup truck was the least. The three passenger vehicles recovered from a drop-off of up to 5 inches, provided a pavement wedge of 45º or flatter was present; however, only a 30º edge wedge allowed all four vehicles to return to the travel lane successfully, as a 4-inch drop-off with a 45º wedge presented too severe of a condition for the tractor semi-trailer.
Using the simulation results, Delaigue defined the “design requirement” shown in the following equation:
D = H α3
Where D = safety design requirement H = edge drop-off height (inches) α = edge slope angle (radians)
(1-1)
Note that the slope angle α is the complement of the angle traditionally used to define the edge wedge (i.e., α = 60º for what is discussed elsewhere as a “30º wedge”).
Delaigue determined the critical value of D for each of the four vehicles, and suggested that D-values should not exceed 3.5 in/rad3 for roads open to
26 27
all vehicle types. A 4-inch drop-off requires a pavement wedge of 30° or flatter
in order for its associated D-value to remain below 3.5.
In summary, the metric used by all studies reviewed to indicate whether
drop-off was problematic was the ability of test drivers or simulated vehicles to
return to their original travel lane (usually a 12-foot lane) after dropping partially
off the pavement. Differences between recovery when scrubbing did or did not
occur were also considered. All the studies that evaluated scrubbing agreed
that it presented a hazardous situation and affected a driver’s ability to recover.
Scrubbing appears to be the most significant safety concern for the conditions
evaluated. Some studies also noted driver surprise as a potential concern when
dropping off the pavement. Most studies agree the ability to negotiate a drop-off
is related to vehicle speed, reentry angle, and vehicle size.
A vertical pavement edge and a 45º degree edge wedge were the shapes
most commonly evaluated. The vertical edge presents the most severe condition.
Several studies agree that drop-offs with a vertical edge greater than 4 inches
could not be negotiated safely at any speed tested, and therefore, constituted
a hazard. The study by Klein et al. (1977) indicated this point to be 5 inches.
Evaluating the relationships derived by Glennon (1985), Graham and Glennon
(1984), and Olson et al. (1986) vary, but suggest that an edge drop-off with a
vertical face of 3 inches can only be negotiated safely up to 30 or 40 mph, with
the specific speed depending on the study. The same relationships suggest a
vertical drop-off of 2 inches can only be negotiated up to 40 or 45 mph. A rounded
shape appears to present a less severe condition, but was only evaluated by
Zimmer and Ivey (1982) and Ivey and Sicking (1986). Ivey and Sicking (1986)
indicated recovery was possible even at 6 inches with the 45º wedge. Olson
et al. (1986) found that drivers were able to recover within their own lane up to
55 mph at 4.5 inches with a 45º wedge. Delaigue (2005) was the only study to
evaluate different slopes of edge wedges, and did so using computer-based
simulation. Delaigue’s simulation suggested that a passenger vehicle would be
able to recover from up to a 5.0-inch drop-off at 60 mph with an edge wedge
45° or flatter, concurring reasonably well with Olson et al. (1986) and Zimmer
and Ivey (1982).
1.3. Scope of Work
As discussed previously, numerous studies tested driver response to encountering drop-off under various conditions, including different speeds, ve-hicle types, drop-off heights and shapes, and scrubbing versus non-scrubbing conditions. The studies evaluated test drivers’ ability to return to and recover within their own travel lane after leaving the roadway and encountering drop-off. The actual effect of encountering drop-off by naïve drivers, however, has not been evaluated, and consequently, driver surprise and the subsequent ability to react properly has not been studied. As a result, the types of responses and series of events occurring as drivers encounter drop-off under regular driving conditions are not fully understood.
Additionally, the actual impact of pavement edge drop-off is not well un-derstood, and little information is available that quantifies the number or sever-ity of crashes in which pavement edge drop-off may have been a contributing factor. One study, discussed in Section 1.1, evaluated fatal crashes in Georgia on rural two-lane non-state-system roadways and estimated drop-off may have contributed to 30% of the 69 fatal crashes evaluated. Few other studies exist, however, and without sufficient information about the actual frequency of edge drop-off-related crashes, agencies are not able to measure fully the economic benefits of investment decisions, evaluate the effectiveness of different treat-ments to mitigate edge drop-off, or focus maintenance resources. With limited budgets and numerous competing demands for maintenance resources, agen-cies may have limited interest in addressing problems where only speculative evidence exists.
This study attempts to understand the extent to which pavement edge drop-off contributes to crash frequency and severity. Additionally, this study evaluates federal and state guidance in sampling and addressing pavement edge drop-off and quantifies the extent of it in two states.
This study generally focused on the safety impacts of pavement edge
drop-off on rural two-lane paved roadways, which make up a significant portion of a state’s roadway inventory. In Iowa, for instance, counties are responsible for approximately 89,900 miles (80%–90%) of rural paved and unpaved two-lane
28 29
roadways. Pavement edge drop-off can be particularly problematic on two-lane paved rural roadways, since they are often high-speed facilities (55 mph or more), have varying levels of maintenance, and are likely to be characterized by adverse roadway conditions such as narrow lanes or no shoulders.
Existing National Guidance
This section summarizes federal guidelines for addressing pavement edge drop-off. Several agencies at the national level provide guidance and recommendations related to pavement edge drop-off for highway design, construction, and maintenance. The following summarizes that guidance and those recommendations. No national standards exist relative to pavement edge drop-off; however, the FHWA has instituted an aggressive Safety Edge program, described in Section 2.6, to address edge drop-off. The program encourages agencies to use an asphalt fillet along each side of the roadway in all resurfacing projects. Numerous studies list a threshold drop-off height at which point some action should be taken, but none discuss edge drop-off shape, nor do they agree on a specific level of drop-off that constitutes a potential hazard.
2.1. Transportation Research Board
The Influence of Roadway Surface Discontinuities on Safety by Ivey et al. (1984), published by the Transportation Research Board (TRB), summarized the results of numerous studies on the influence of pavement edge drop-off on vehicle safety. This work has been used as the basis for other federal guidance, including the Roadside Design Guide and the Manual on Uniform Traffic Control Devices. Additional research on pavement edge drop-off was reported in TRB Special Report 214, Designing Safer Roads: Practices for Resurfacing, Restora-tion, and Rehabilitation, much of which was summarized in Chapter 1.
2.2. Roadside Design Guide, 2002 Edition
The American Association of State Highway and Transportation Officials (AASHTO) produces The Roadside Design Guide (AASHTO 2002), which pro-vides current information and operating practices on roadside safety. Chapter 9

30 31
of the guide, which discusses traffic barriers, control devices, and other safety
features for work zones, briefly discusses drop-off. Specifically, the guide states,
“Desirably, no vertical drop-off greater than 50 mm (approximately 2 inches)
should occur.” It further states that pavement edge drop-off greater than 75 mm
(approximately 3 inches) should not be left overnight. In such cases, measures
to mitigate the hazard should be taken, including:
Placing a temporary wedge of material along the face of the drop-off
Placing channelizing devices along the traffic side of the drop-off to maintain a 3-foot (one-meter) buffer
Installing portable barriers to create a buffer
Placing steel plates over trenches or excavations (AASHTO 2002, pp. 9–42)
The basis of the 75 mm value for a maximum allowable drop-off stems from the Ivey et al. (1984) report pertaining to vehicle tests involving safe re-covery from edge drop-offs of various heights.
2.3. Manual on Uniform Traffic Control Devices
The Manual on Uniform Traffic Control Devices (MUTCD) defines
nationwide standards for installing and maintaining traffic control devices on
streets and highways. Guidance specific to pavement edge drop-offs is found
in Chapter 2C, “Warning Signs,” and Chapter 6F, “Temporary Traffic Control
Zone Devices.” The guidance that the manual provides pertains to the signage
required where drop-offs exist, either short-term (during construction) or as an
existing condition.
Chapter 2C of the MUTCD provides warning signs used to call attention
to unexpected conditions on or adjacent to a highway or street. For shoulder
locations where an elevational difference of less than 3 inches between the
shoulder and the travel lane exists, sign type W8-9, shown in Figure 2-1, may
be used.
•
•
•
•
Figure 2-1. MUTCD warning signs for edge drop-off
Warning W8-9 Warning W8-9a Work Zone W8-9 Work Zone W8-9a
Use of this sign is stated as an option, which indicates it is a permissive condition and carries no requirement or recommendation. When an elevational difference between an unprotected shoulder drop-off adjacent to the travel lanes exceeds 3 inches, this sign type should be used when the drop-off continues for a significant length, based on engineering judgment. This is stated as guidance, indicating a recommended practice in typical situations with deviations allowed if engineering judgment or studies indicate that deviations are appropriate. Chap-ter 6 of the MUTCD gives details about temporary traffic control in work zones, providing for the reasonably safe and efficient movement of road users through or around such zones while protecting workers, responders to traffic incidents, and equipment. Signage discussed in Section 6F.42, “Shoulder Signs,” pertains to drop-off conditions in work zones. The options that the manual provides are identical to those for shoulder conditions existing outside of work zones. Where drop-offs are less than 3 inches, sign type W8-9 in Figure 2-1 may be used as an option. When drop-offs are greater than 3 inches for a continuous length of roadway, the MUTCD states that this sign type should be used, based on engi-neering judgment, and this is stated as guidance (AASHTO 2004).
2.4. AASHTO Green Book
While A Policy on Geometric Design of Highways and Streets (AASHTO 2001), commonly known as AASHTO’s Green Book, does not provide guidance on a maximum allowable drop-off height, it stresses that regular maintenance is necessary to provide a shoulder that is flush with the pavement surface. The Green Book states, “Unstabilized shoulders generally undergo consolidation with time, and the elevation of the shoulder at the traveled way edge tends to

32 33
become lower than the traveled way” (AASHTO 2001). The statement continues by informing the reader that such a drop-off adversely affects driver control when driving onto the shoulder at any appreciable speed.
2.5. National Cooperative Highway Research Program
Report 223, “Maintenance Levels-of-Service Guidelines” (1980) from
the National Cooperative Highway Research Program (NCHRP), provides a
procedure that allows for different levels of service to be established for various
maintenance conditions, road classifications, and local values (Kulkarni et al.
1980). The purpose of the procedure was to optimize the expenditure of main-
tenance resources for all elements of the highway, such as pavement surface,
shoulder, vegetation, signs, structure, and drainage ditches. The procedure was
demonstrated in two states, Pennsylvania and Louisiana, for pavement edge
drop-offs. Results for each state indicated that repairing edge drop-offs was
optimal when they reached 1 inch in height based on budgetary, rehabilitation,
and safety inputs and concerns.
NCHRP Report 500, Volume 6, A Guide for Addressing Run-Off-Road
Collisions, provides a general description about specific types of highway
crashes, such as run-off-road and head-on, or contributing factors, such as ag-
gressive driving, the strategies/countermeasures to address these problems,
and a model implementation process to correct them (NCHRP 2003). Eliminating
shoulder drop-off conditions is one of the short-term strategies cited to eradicate
vehicle encroachment on roadsides.
One objective focuses on shoulder treatments that provide for a safe
recovery, including shoulder widening, paving, and reducing edge drop-offs
(NCHRP 2003). While no specific guidance is provided with regard to accept-
able drop-off heights, shoulder treatment strategies are provided. The strategy
recommended for drop-offs is the addition of a 45º beveled wedge during pav-
ing operations. The report indicates that wedges and other edge drop-off treat-
ments have not been evaluated extensively; however, such treatments would
not present significant difficulties to drivers unless using them resulted in less
maintenance of unpaved shoulders (NCHRP 2003).
2.6. Federal Highway Administration
“Standard Specifications for Construction of Roads and Bridges on Fed-eral Highway Projects” from the FHWA (1985) offers guidance on edge drop-off conditions that may exist in work zones for federal highway projects. According to the document, where shoulder drop-offs exceed 1.97 inches, “Low Shoulder” warning signs should be placed during construction. For shoulder drop-offs in excess of 3.94 inches, a 1:3 fillet with “Low Shoulder” warning signs should be provided.
The FHWA, in cooperation with the Georgia DOT, is currently working on a demonstration project of the safety edge, which is an asphalt fillet that provides a tapered transition from the edge of the paved roadway surface to the unpaved shoulder, as illustrated in Figure 2-2.
Figure 2-2. Drawing of FHWA’s Safety Edge
Existing UnpavedShoulder
Existing Pavement
Asphalt Overlay
For a 30˚ Safety Edge, = 30˚
The demonstration project focuses on gaining experience in construct-ing the safety edge with various types of equipment under various construction conditions (FHWA 2004). For this project, the Georgia DOT constructed a 30° safety edge along a 13.3-mile segment of a rural 2-lane undivided highway.
Wagner and Kim (2005) analyzed the safety edge’s construction using two different devices, one proprietary and another fabricated by the Georgia DOT. They reported that both devices were able to create the desired pavement edge

34 35
“with no impact to production and at less than one percent additional material costs,” and concluded that the safety edge “shows promise as a low cost means to mitigate shoulder dropoff” (Wagner and Kim 2005). This study did not include analysis of impacts on crashes; however, many studies cited herein suggest using such a pavement wedge should be beneficial.
2.7. American Public Works Association
Although pavement edge drop-off does not commonly occur in munici-pal areas, the American Public Works Association (APWA), whose members are mostly municipalities, acknowledges the topic of edge drop-off. The 1985 Street & Highway Maintenance Manual states that shoulders “should be level with the pavement edge, free of ruts, and sufficiently stable” (APWA 1985). Such guidance addresses the condition of shoulders from a pavement maintenance perspective; no mention is made of safety issues arising from drop-offs, nor are recommendations made for the maximum allowable drop-off height. The guid-ance provided, however, would suggest that, while pavement maintenance is the concern being addressed, the recommended treatment also addresses the safety concerns arising from edge drop-offs.
2.8. Institute of Traffic Engineers
As part of its Traffic Control Devices Handbook, 2001, the Institute of Transportation Engineers (ITE) discusses shoulder drop-off conditions from a work zone perspective. While the handbook does not provide a specific height for acceptable drop-off conditions, it cites the five safety drop-off condition definitions based on Zimmer and Ivey’s work. The handbook notes these definitions only apply to standard automobiles; the safety impacts of drop-offs on other vehicle types, such as trucks and motorcycles, will vary (ITE 2001).
2.9. AAA Foundation for Traffic Safety
The Elimination of Hazards Associated with Pavement Edge Drop-offs During Roadway Resurfacing, an AAA Foundation for Traffic Safety (AAAFTS) study, sought to determine the extent of drop-offs and recommend changes in contract scope or performance to eliminate drop-offs during resurfacing projects
(Humphreys and Parham 1994). The study recommended that shoulder work be included in resurfacing contracts. When it is not, the authors recommended, as a minimum, one or more of the following: (1) Shoulder materials should be pulled up to the new surface as a non-pay item; (2) Appropriate signage should remain installed to inform the traveling public about low shoulders; or (3) A 45° wedge of asphalt should be installed during resurfacing.
36 37
State and Provincial Practice and Guidelines for Collection, Prevention, and
Maintenance of Edge Drop-off
This chapter summarizes state practices and guidelines for addressing edge drop-off. Numerous states and provinces were contacted to determine the state of the practice and summarize guidelines for preventing and mitigating edge drop-off during design, construction, and maintenance. This information is provided so that agencies can compare their practices with other agencies, or adopt or update guidelines and practices.
Questions were developed to determine state and provincial practices in edge drop-off data collection, prevention, and maintenance. The primary goal of this sampling was to obtain a representative cross-section of agen-cies throughout the United States and Canadian provinces. Information was gathered from numerous states and provinces by telephone interviews, email, and reviews of published documents, such as design or construction manuals. A list of the information sought from each agency is presented in Appendix A. Responses were obtained from 14 states and 2 Canadian provinces, three of which asked not to be identified by name for liability reasons and are labeled as States X, Y, and Z. States surveyed were grouped into seven geographical regions, as shown in Figure 3-1. The following list shows the number of states surveyed from each region:
Northeast: 2
Southeast: 3
Mid-Atlantic: 2
Midwest: 3
Northwest: 2
Southwest: 1
West: 1
•
•
•
•
•
•
•

38 39
Figure 3-1. Geographical breakdown of states surveyed
NortheastMid-atlanticSoutheastSouthwestWestNorthwestMidwest
A summary of state and provincial practices is provided in the following sections. When a particular piece of information was not available for a state, that state was omitted from the corresponding table.
3.1. Design Guidelines
State and provincial practice guidelines for preventing edge drop-off during the design phase were divided into three areas. First was the policy for designing shoulders on new roads and, more specifically, whether paved shoul-ders were incorporated into new projects. Second, was the design standards for pavement and shoulder widths and types. The third area sought to determine whether design guidance exists for addressing edge drop-off.
Table 3-1 presents the results for the agencies surveyed with regard to design practices.
As shown, design guidelines for shoulder type vary by agency. State and provincial design guidelines typically vary by roadway facility. Higher use
Table 3-1. State and provincial guidelines for design considerations
State Shoulder design policy on new roads
Design standards for pavement and shoulder type and width
Design guidance for drop-offs
IA Paved shoulders should be included in projects on all NHS and non-NHS highways with a current year ADT of 3,000 or more
Lane width: depends on project (11–12 ft.);Shoulders: 4 ft., unless a deci-sion is made not to include paved shoulders on a non-NHS route; 2-ft. pavement widening likely
None
MO Depends on pavement type and ADT: Use earth where minimal use of shoulder expected; use aggregate or pave in other areas
Lane width: 12 ft.;Shoulder width varies
None
TX Shoulder surfacing not required but desirable, even if only partial-width; type depends on function-al class, design speed, and ADT
Lane width: 10–12 ft.;Shoulder width: 2–10 ft.;Both vary by functional class, design speeds, and ADT
Treatment during construction depends on drop-off type and depth
WA Shoulders of highways with high or intermediate pavement types should be paved; type varies
Lane width: 11–12 ft.;Shoulder width: 2–8 ft.
None
OH Shoulder type based on functional classification and traffic or locale
Pavement and shoulder type vary based on volume and fleet mix;Shoulder width: 4–10 ft.
None
TN Varies by design speed and ADT;when shoulders 4 ft. or less, designer determines whether stone and double bituminous surface treatment or paved
Lane and shoulder width vary by design speed and ADT;Shoulder width: 4–10 ft.
During construction:0–2 in.; warning signs 2–18 in.: separation by drums, barricades, approved devices;18+ in.: separation by barrier rail
ID Varies by project Lane width: 9 to 12 ft.;Shoulders width: 2–6 ft.;Both vary based on volume, speed, and % trucks
Requires shoe on the paver edge for tapered edge on asphalt pavements
RI Try to provide paved shoulders on all projects
Follow Green Book standards Design for positive drain-age to prevent erosion
AL Paved shoulders based on traffic and route type as well as funding
Follow Green Book standards 1/2-in. drop-offacceptable
ND Projects designed/ constructed according to AASHTO standards
Lane width: 11–12 ft.;Shoulder width: 2–10 ft.
None
B.C.Canada
Varies by project Lane width: 11.8 & 12 ft.; Shoulder width: 1.6 & 9.8 m.;Both vary by volume and design speed
None
State X Paved shoulders on new facilities
Lane width: 12 ft.;Shoulder: 5–7.8 ft., depending on class
None
State Y Non-freeway shoulders fully or partially paved
Lane width: 11–12 ft.; Shoulder width: 4–7.8 ft.; Both vary by speed and ADT
None
State Z None
40 41
Ta
ble
3-2
. St
ate
and
prov
inci
al c
onst
ruct
ion
guid
elin
es a
nd p
ract
ices
Stat
eA
llow
able
dro
p-of
f du
r. co
nstr
uctio
n Si
gnin
g fo
r dro
p-of
f A
dditi
onal
con
stru
ctio
n gu
idan
ce
Oth
er m
easu
res
for d
rop-
off i
n w
ork
zone
s
IAFo
llow
MU
TCD
N
one
Wed
ges;
bar
ricad
es; fi
llets
(rep
avin
g); p
ositi
ve
sepa
ratio
n
MO
≤ 2
in.:
low
sho
ulde
r sig
n;>
2 in
. with
wed
ge: s
houl
der d
rop-
off s
ign;
If no
wed
ge u
sed:
pos
. sep
arat
ion
Pav
emen
t wed
ge u
sed
whe
n dr
op-o
ff is
with
in 1
2 fe
et o
f the
tra
vele
d la
ne
Wed
ges;
bar
ricad
es; p
ositi
ve s
epar
atio
n
GA
MU
TCD
leve
ls fo
r dr
op-o
ffA
ppro
pria
te tr
affic
con
trol p
ract
ices
; M
UTC
D P
art V
I N
one
Sig
nage
; bar
ricad
es; p
ositi
ve s
epar
atio
n
TXVa
ries
App
endi
x B
of t
he T
xDO
T R
oadw
ay D
esig
n M
anua
l ad
dres
ses
drop
-off
treat
men
ts
in w
orkz
ones
Trea
tmen
t may
be
eith
er o
r bot
h w
arni
ng d
evic
es o
r pr
otec
tive
barr
iers
; als
o us
e si
gnag
e an
d po
sitiv
e se
para
tion
WA
≥ 2.
4 in
. con
side
red
haza
rdou
s≥
2.4
in.:
appr
opria
te w
arni
ng s
igns
≥
6 in
. req
uire
s w
arni
ng s
igns
and
a m
ater
ial w
edge
, ch
anne
lizin
g de
vice
s or
bar
riers
; als
o us
e po
sitiv
e se
para
tion
OH
≤ 3
in.
Non
eS
igna
ge, p
orta
ble
barr
iers
, pos
itive
sep
arat
ion
TN≥
0.75
in. w
arra
nts
sign
age
and/
or
treat
men
ts
0.75
–2 in
.: w
arni
ng s
igns
≥
18 in
.: co
ntra
ctor
lim
its o
pera
-tio
ns to
1 w
ork
zone
not
exc
eed-
ing
1 m
ile lo
ng, u
nles
s no
ted
on
plan
s or
app
rove
d by
eng
inee
r
2–18
in.:
sepa
ratio
n;
≥18
in.:
sepa
ratio
n pr
ovid
ed b
y th
e us
e of
por
tabl
e ba
rrie
r rai
l; al
so u
se p
ositi
ve s
epar
atio
n
IDA
ny d
rop-
off
cons
ider
ed h
azar
dous
≥ 3
in. r
equi
res
sign
age
Abr
upt l
ane
edge
sig
n fo
r un
even
sur
face
s be
twee
n la
nes
Sig
nage
; bar
ricad
es; m
arke
rs; o
r pos
itive
sep
arat
ion
RI
≥ 3
in. c
onsi
dere
d ha
zard
ous
N
one
≤ 35
mph
: 3–5
in. t
aper
ed to
a m
axim
um;
4-to
-1 h
oriz
onta
l-to-
verti
cal s
lope
;>
35 m
ph: l
ongi
tudi
nal d
rop-
offs
not
per
mitt
ed w
ithin
2
feet
of t
rave
l lan
e;A
lso
use
tape
rs a
nd p
ositi
ve s
epar
atio
n
ND
Varie
s by
rout
e/
loca
tion;
ge
nera
lly ≤
2 in
.
Non
eTi
me
limits
whe
n dr
op-o
ff ca
n be
pre
sent
are
spe
cifie
d;
wed
ge p
lace
d if
time
limit
will
be
exce
eded
; als
o us
e dr
ums,
bar
ricad
es, a
nd p
ositi
ve s
epar
atio
n
Sta
te X
0.15
–0.2
5 ft.
: low
sho
ulde
r sig
n;
> 0.
25 ft
. and
< 2
.5 ft
.: Ty
pe II
or T
ype
III
barr
icad
es s
et in
tren
ch;
> 2.
5 ft.
: use
eng
. jud
gmen
t bas
ed o
n ex
perie
nce
or s
tudy
Non
eS
igna
ge; b
arric
ades
; pos
itive
sep
arat
ion
Sta
te Y
50 m
mFo
llow
MU
TCD
gui
danc
eS
igna
ge; b
arric
ades
; pos
itive
sep
arat
ion
roadways have higher design standards. Several agencies encourage paved shoulders on all new facilities. In many cases, the shoulder material used de-pended on the project being undertaken. With regard to the width and type of pavements used on the facility being designed, agency practices were similar. Pavement widths were found to be essentially uniform (11–12 feet), while shoul-der types and widths varied among states. In general, shoulder types depended on project-specific details in many cases, while guidelines for shoulder widths varied from 2–10 feet, with most guidance for shoulder widths falling into the middle of that range. States provided little to no additional design guidance with regard to edge drop-off. The guidance provided was specific to the drop-off that might occur during construction activities. This lack of guidance is to be expected, however, because shoulders are specified to be flush with the pavement surface in the design stage.
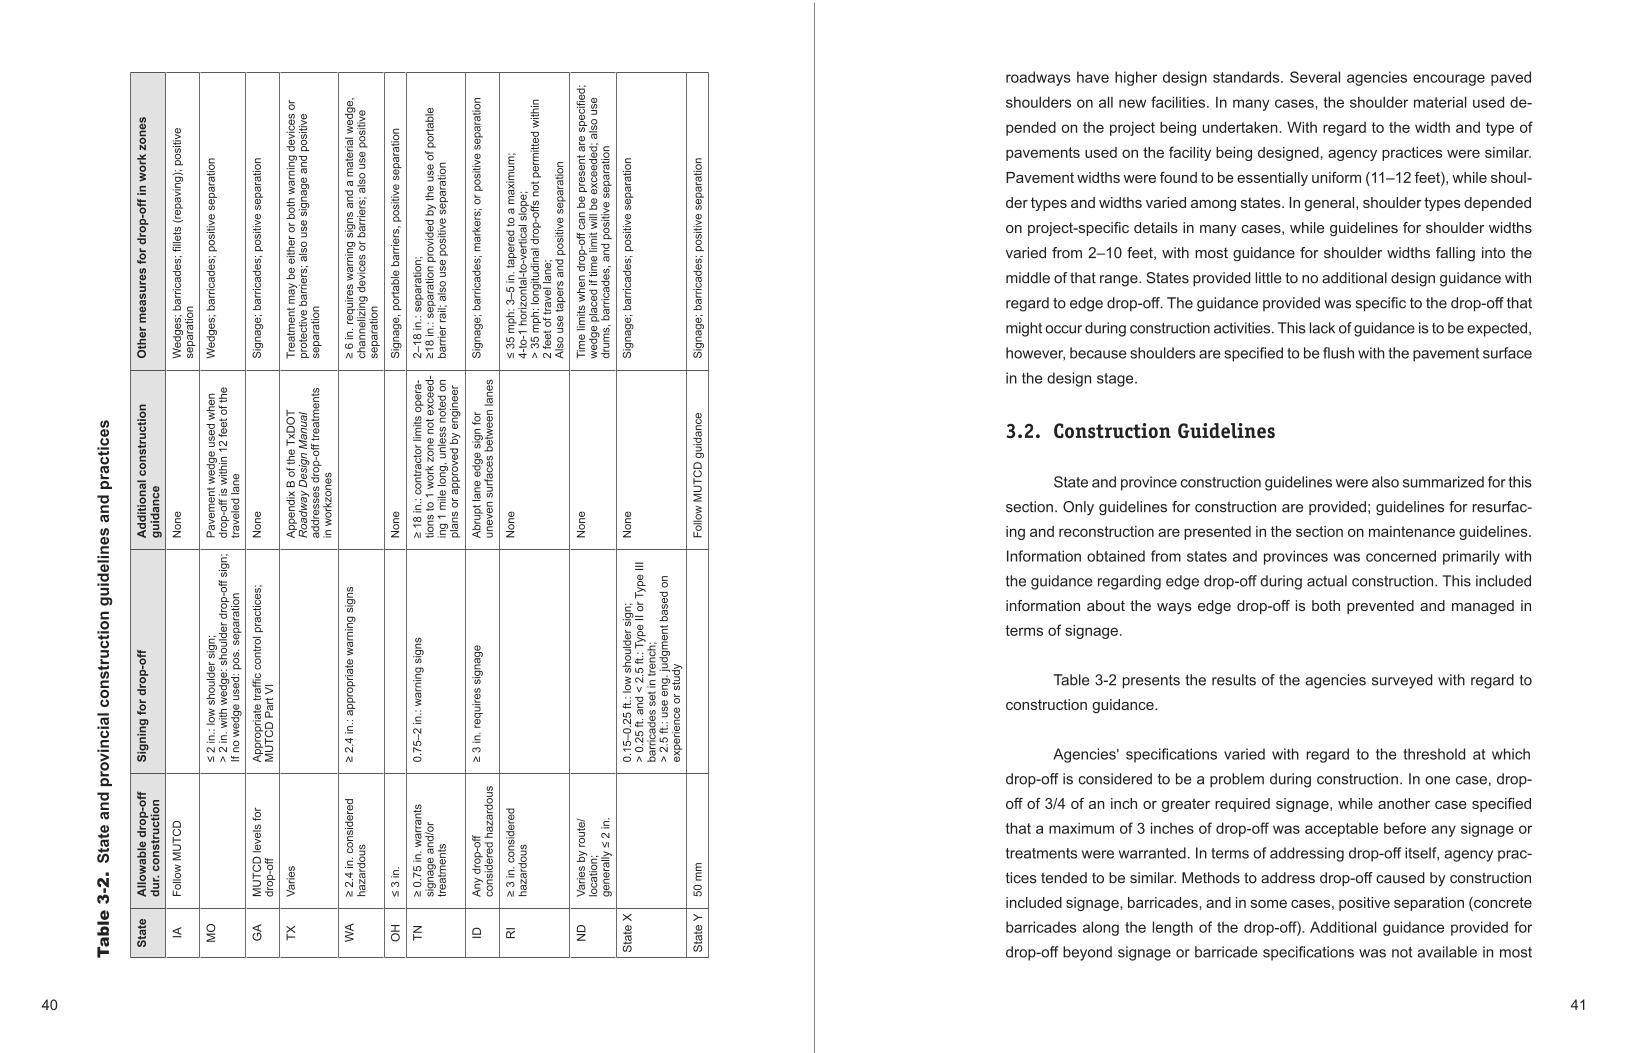
3.2. Construction Guidelines
State and province construction guidelines were also summarized for this section. Only guidelines for construction are provided; guidelines for resurfac-ing and reconstruction are presented in the section on maintenance guidelines. Information obtained from states and provinces was concerned primarily with the guidance regarding edge drop-off during actual construction. This included information about the ways edge drop-off is both prevented and managed in terms of signage.
Table 3-2 presents the results of the agencies surveyed with regard to construction guidance.
Agencies' specifications varied with regard to the threshold at which drop-off is considered to be a problem during construction. In one case, drop-off of 3/4 of an inch or greater required signage, while another case specified that a maximum of 3 inches of drop-off was acceptable before any signage or treatments were warranted. In terms of addressing drop-off itself, agency prac-tices tended to be similar. Methods to address drop-off caused by construction included signage, barricades, and in some cases, positive separation (concrete barricades along the length of the drop-off). Additional guidance provided for drop-off beyond signage or barricade specifications was not available in most
42 43
cases. In terms of avoiding drop-offs in construction areas, it was generally ac-cepted that drop-offs are bound to exist in work zones; the most effective way to avoid drop-offs was to provide signage, barricades, and similar devices to warn the traveling public.
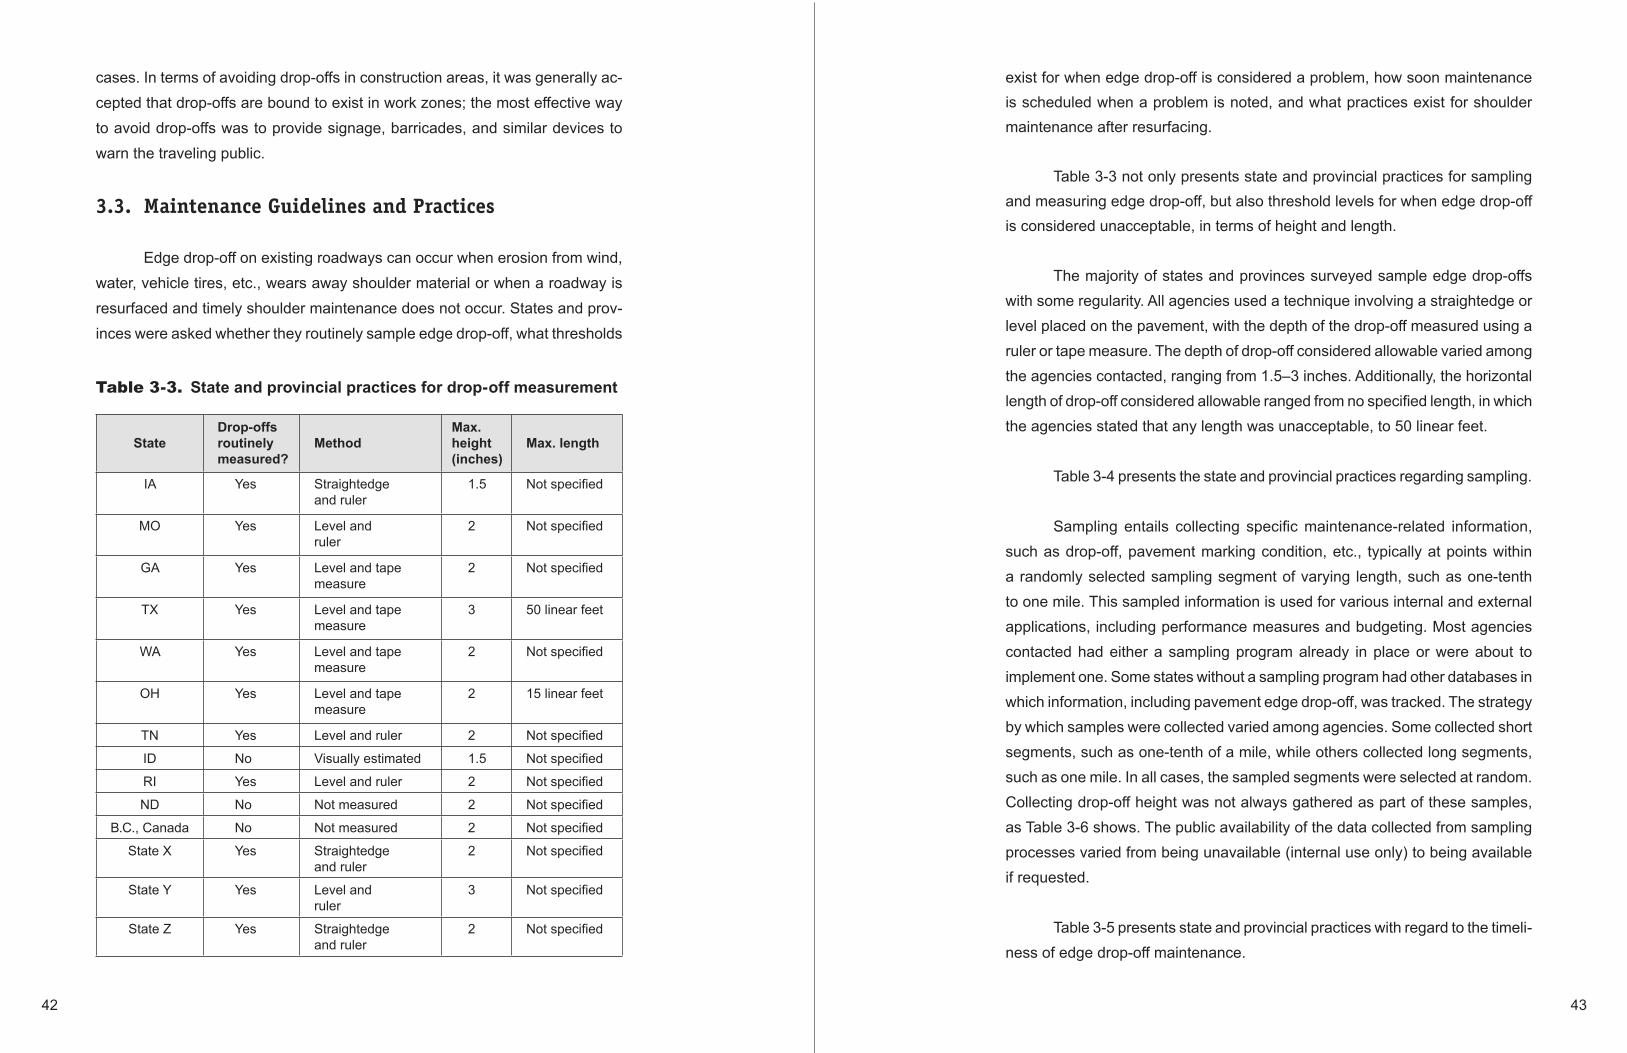
3.3. Maintenance Guidelines and Practices
Edge drop-off on existing roadways can occur when erosion from wind, water, vehicle tires, etc., wears away shoulder material or when a roadway is resurfaced and timely shoulder maintenance does not occur. States and prov-inces were asked whether they routinely sample edge drop-off, what thresholds
Table 3-3. State and provincial practices for drop-off measurement
StateDrop-offs routinely measured?
MethodMax. height (inches)
Max. length
IA Yes Straightedge and ruler
1.5 Not specified
MO Yes Level and ruler
2 Not specified
GA Yes Level and tape measure
2 Not specified
TX Yes Level and tape measure
3 50 linear feet
WA Yes Level and tape measure
2 Not specified
OH Yes Level and tape measure
2 15 linear feet
TN Yes Level and ruler 2 Not specified
ID No Visually estimated 1.5 Not specified
RI Yes Level and ruler 2 Not specified
ND No Not measured 2 Not specified
B.C., Canada No Not measured 2 Not specified
State X Yes Straightedge and ruler
2 Not specified
State Y Yes Level and ruler
3 Not specified
State Z Yes Straightedge and ruler
2 Not specified
exist for when edge drop-off is considered a problem, how soon maintenance is scheduled when a problem is noted, and what practices exist for shoulder maintenance after resurfacing.
Table 3-3 not only presents state and provincial practices for sampling and measuring edge drop-off, but also threshold levels for when edge drop-off is considered unacceptable, in terms of height and length.
The majority of states and provinces surveyed sample edge drop-offs with some regularity. All agencies used a technique involving a straightedge or level placed on the pavement, with the depth of the drop-off measured using a ruler or tape measure. The depth of drop-off considered allowable varied among the agencies contacted, ranging from 1.5–3 inches. Additionally, the horizontal length of drop-off considered allowable ranged from no specified length, in which the agencies stated that any length was unacceptable, to 50 linear feet.
Table 3-4 presents the state and provincial practices regarding sampling.
Sampling entails collecting specific maintenance-related information, such as drop-off, pavement marking condition, etc., typically at points within a randomly selected sampling segment of varying length, such as one-tenth to one mile. This sampled information is used for various internal and external applications, including performance measures and budgeting. Most agencies contacted had either a sampling program already in place or were about to implement one. Some states without a sampling program had other databases in which information, including pavement edge drop-off, was tracked. The strategy by which samples were collected varied among agencies. Some collected short segments, such as one-tenth of a mile, while others collected long segments, such as one mile. In all cases, the sampled segments were selected at random. Collecting drop-off height was not always gathered as part of these samples, as Table 3-6 shows. The public availability of the data collected from sampling processes varied from being unavailable (internal use only) to being available if requested.
Table 3-5 presents state and provincial practices with regard to the timeli-ness of edge drop-off maintenance.
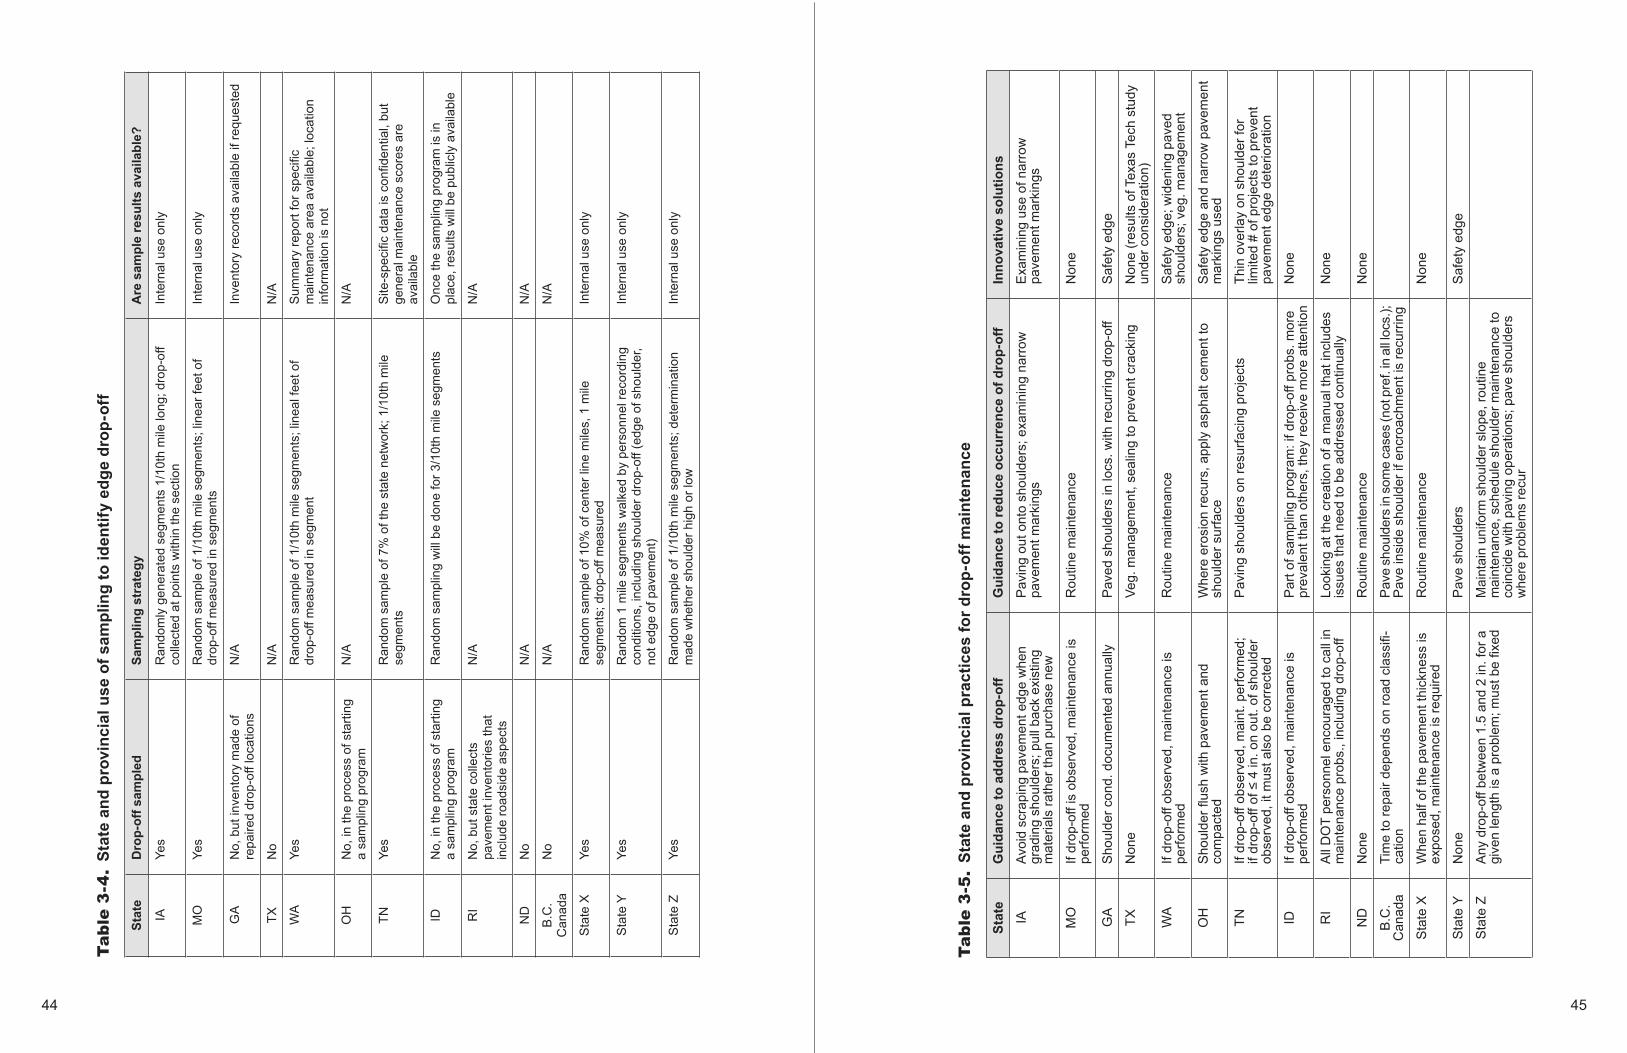
44 45
Ta
ble
3-4
. St
ate
and
prov
inci
al u
se o
f sam
plin
g to
iden
tify
edge
dro
p-of
f
Stat
eD
rop-
off s
ampl
edSa
mpl
ing
stra
tegy
Are
sam
ple
resu
lts a
vaila
ble?
IAYe
sR
ando
mly
gen
erat
ed s
egm
ents
1/1
0th
mile
long
; dro
p-of
f co
llect
ed a
t poi
nts
with
in th
e se
ctio
n In
tern
al u
se o
nly
MO
Yes
Ran
dom
sam
ple
of 1
/10t
h m
ile s
egm
ents
; lin
ear f
eet o
f dr
op-o
ff m
easu
red
in s
egm
ents
Inte
rnal
use
onl
y
GA
No,
but
inve
ntor
y m
ade
of
repa
ired
drop
-off
loca
tions
N
/AIn
vent
ory
reco
rds
avai
labl
e if
requ
este
d
TXN
oN
/AN
/A
WA
Yes
Ran
dom
sam
ple
of 1
/10t
h m
ile s
egm
ents
; lin
eal f
eet o
f dr
op-o
ff m
easu
red
in s
egm
ent
Sum
mar
y re
port
for s
peci
fic
mai
nten
ance
are
a av
aila
ble;
loca
tion
info
rmat
ion
is n
ot
OH
No,
in th
e pr
oces
s of
sta
rting
a
sam
plin
g pr
ogra
mN
/AN
/A
TNYe
sR
ando
m s
ampl
e of
7%
of t
he s
tate
net
wor
k; 1
/10t
h m
ile
segm
ents
S
ite-s
peci
fic d
ata
is c
onfid
entia
l, bu
t ge
nera
l mai
nten
ance
sco
res
are
avai
labl
e
IDN
o, in
the
proc
ess
of s
tarti
ng
a sa
mpl
ing
prog
ram
Ran
dom
sam
plin
g w
ill b
e do
ne fo
r 3/1
0th
mile
seg
men
tsO
nce
the
sam
plin
g pr
ogra
m is
in
plac
e, re
sults
will
be
publ
icly
ava
ilabl
e
RI
No,
but
sta
te c
olle
cts
pave
men
t inv
ento
ries
that
in
clud
e ro
adsi
de a
spec
ts
N/A
N/A
ND
No
N/A
N/A
B.C
.C
anad
aN
oN
/AN
/A
Sta
te X
Yes
Ran
dom
sam
ple
of 1
0% o
f cen
ter l
ine
mile
s, 1
mile
se
gmen
ts; d
rop-
off m
easu
red
Inte
rnal
use
onl
y
Sta
te Y
Yes
Ran
dom
1 m
ile s
egm
ents
wal
ked
by p
erso
nnel
reco
rdin
g co
nditi
ons,
incl
udin
g sh
ould
er d
rop-
off (
edge
of s
houl
der,
not e
dge
of p
avem
ent)
Inte
rnal
use
onl
y
Sta
te Z
Yes
Ran
dom
sam
ple
of 1
/10t
h m
ile s
egm
ents
; det
erm
inat
ion
mad
e w
heth
er s
houl
der h
igh
or lo
wIn
tern
al u
se o
nly
Ta
ble
3-5
. St
ate
and
prov
inci
al p
ract
ices
for d
rop-
off m
aint
enan
ce
Stat
eG
uida
nce
to a
ddre
ss d
rop-
off
Gui
danc
e to
redu
ce o
ccur
renc
e of
dro
p-of
fIn
nova
tive
solu
tions
IAAv
oid
scra
ping
pav
emen
t edg
e w
hen
grad
ing
shou
lder
s; p
ull b
ack
exis
ting
mat
eria
ls ra
ther
than
pur
chas
e ne
w
Pav
ing
out o
nto
shou
lder
s; e
xam
inin
g na
rrow
pa
vem
ent m
arki
ngs
Exa
min
ing
use
of n
arro
w
pave
men
t mar
king
s
MO
If dr
op-o
ff is
obs
erve
d, m
aint
enan
ce is
pe
rform
edR
outin
e m
aint
enan
ceN
one
GA
Sho
ulde
r con
d. d
ocum
ente
d an
nual
lyP
aved
sho
ulde
rs in
locs
. with
recu
rrin
g dr
op-o
ffS
afet
y ed
ge
TXN
one
Veg.
man
agem
ent,
seal
ing
to p
reve
nt c
rack
ing
Non
e (r
esul
ts o
f Tex
as T
ech
stud
y un
der c
onsi
dera
tion)
WA
If dr
op-o
ff ob
serv
ed, m
aint
enan
ce is
pe
rform
edR
outin
e m
aint
enan
ceS
afet
y ed
ge; w
iden
ing
pave
d sh
ould
ers;
veg
. man
agem
ent
OH
Sho
ulde
r flus
h w
ith p
avem
ent a
nd
com
pact
edW
here
ero
sion
recu
rs, a
pply
asp
halt
cem
ent t
o sh
ould
er s
urfa
ceS
afet
y ed
ge a
nd n
arro
w p
avem
ent
mar
king
s us
ed
TNIf
drop
-off
obse
rved
, mai
nt. p
erfo
rmed
; if
drop
-off
of ≤
4 in
. on
out.
of s
houl
der
obse
rved
, it m
ust a
lso
be c
orre
cted
Pav
ing
shou
lder
s on
resu
rfaci
ng p
roje
cts
Thin
ove
rlay
on s
houl
der f
or
limite
d #
of p
roje
cts
to p
reve
nt
pave
men
t edg
e de
terio
ratio
n
IDIf
drop
-off
obse
rved
, mai
nten
ance
is
perfo
rmed
Par
t of s
ampl
ing
prog
ram
: if d
rop-
off p
robs
. mor
e pr
eval
ent t
han
othe
rs, t
hey
rece
ive
mor
e at
tent
ion
Non
e
RI
All
DO
T pe
rson
nel e
ncou
rage
d to
cal
l in
mai
nten
ance
pro
bs.,
incl
udin
g dr
op-o
ffLo
okin
g at
the
crea
tion
of a
man
ual t
hat i
nclu
des
issu
es th
at n
eed
to b
e ad
dres
sed
cont
inua
llyN
one
ND
Non
eR
outin
e m
aint
enan
ceN
one
B.C
.C
anad
aTi
me
to re
pair
depe
nds
on ro
ad c
lass
ifi-
catio
nPa
ve s
houl
ders
in s
ome
case
s (n
ot p
ref.
in a
ll loc
s.);
Pav
e in
side
sho
ulde
r if e
ncro
achm
ent i
s re
curr
ing
Sta
te X
Whe
n ha
lf of
the
pave
men
t thi
ckne
ss is
ex
pose
d, m
aint
enan
ce is
requ
ired
Rou
tine
mai
nten
ance
Non
e
Sta
te Y
Non
eP
ave
shou
lder
sS
afet
y ed
ge
Sta
te Z
Any
dro
p-of
f bet
wee
n 1.
5 an
d 2
in. f
or a
gi
ven
leng
th is
a p
robl
em; m
ust b
e fix
edM
aint
ain
unifo
rm s
houl
der s
lope
, rou
tine
mai
nten
ance
, sch
edul
e sh
ould
er m
aint
enan
ce to
co
inci
de w
ith p
avin
g op
erat
ions
; pav
e sh
ould
ers
whe
re p
robl
ems
recu
r

46 47
Table 3-6. Additional state and provincial guidelines for edge drop- off maintenance
State Guidance for addressing drop-off during resurfacing
Guidelines for max. shoulder slope
Traffic control reqs.for locations with existing drop-off?
IA Contractor responsible for bringing shoulders up; Maintenance wants projects to have ≤ 2 ft. paved shoulder included, or asphalt or rock filled
4% to 8% on granular shoulders; 6% to 12% on earthen shoulders
None
MO Contractor responsible for bringing shoulders up;On low volume roads with 1-in. overlays, maintenance pulls shoulder up
Maintain as-built Signage if operation left overnight
GA Contractor responsible for bringing shoulders up
4:1 slope or flatter None
TX Contractor responsible for bringing shoulders up
No specific guidelines; depends on location
None
WA Contractor responsible for bringing shoulders up
No specific guidelines; depends on location
Depends on location
OH Contractor responsible for bringing shoulders up
Depends on location; maintained as-is
Follow Ohio MUTCD and ODOT Traffic Engineering Manual
TN Contractor responsible for bringing shoulders up; Most resurfacing lifts are less than 2 in. and do not create a drop-off problem
0.02 feet/feet, but can vary based on location
Place signs if drop-off cannot be addressed immediately
ID Contract specifies the allowable level of drop-off, and contractor is required to bring the shoulders back up
Depends on location; maintained as-is
Cones or hazard markers placed if drop-off is not fixed in the short term
RI Contractors must add taper to pave-ment edges if drop-off remains overnight; taper removed next day; ≥ 2 in. protected with hard barrier
Depends on location; 3:1, 4:1, or 5:1 preferred
Signs or boards placed if drop-off cannot be fixed in a reasonable time
ND Contractor responsible for bringing shoulders up
6% cross-slope None specified
B.C.Canada
Contractor responsible for bringing shoulders up
4% cross-slope Only in construction and maint. opera-tions (low shoulder)
State X Contractor responsible for bringing shoulders up
Maintain as-built None
State Y Contractor responsible for bringing shoulders up;Maintenance brings shoulders up for projects conducted by the state
Maintain as-built Low shoulder signs placed after reconstruction
State Z Contractors mainly bring up shoul-ders, but maintenance performs task in some cases; shoulder is pulled back within 24–48 hours
1 inch per foot, unless design varies
None, unless paving operation; then low shoulder signs placed
As shown, the responses obtained from each agency varied consider-ably. In terms of guidance given with regard to drop-off, the most common response was that maintenance is performed as soon as possible when a loca-tion with drop-off is observed. In terms of preventing the recurrence of drop-off, responses again varied. Routine maintenance was a common reply; however, other attempts to reduce drop-off included moving to paved shoulders, control-ling roadside vegetation, maintaining shoulder slopes, and applying an asphalt binder to granular material. Agencies were also asked whether they had tried any innovative solutions to eliminate edge drop-off. Using the FHWA’s Safety Edge was the most common response given, although two agencies were also considering narrowing existing lanes by restriping the edgeline to provide some paved shoulder.
Table 3-6 presents guidance for addressing edge drop-offs during resurfacing.
In terms of maintenance practices for resurfacing projects, nearly all agencies contacted stated it was the contractor’s responsibility to restore the shoulders upon completing the project. In only a limited number of cases were the agency’s maintenance forces responsible for restoring the shoulder. Beyond this requirement, additional guidance varied among agencies, with some specifying the maximum duration to which the drop-off could remain after reconstruction, some requiring signage, and some providing temporary protection. In terms of shoulder slope maintenance, the most common response received was that shoulders were maintained as designed or built, and the slope was maintained depending on location. Traffic control requirements for locations with existing or recurring drop-off ranged from none to temporary (if a maintenance operation creating drop-off was to remain overnight). In no case did a contacted agency place signage, such as “Low Shoulder,” in locations that had been historically prone to drop-off.
3.4. Reconstruction Guidelines and Practices
Determining state and provincial guidelines for the “3Rs,” reconstruction and resurfacing, restoration, and rehabilitation, focused on two aspects. The first determined the guidance concerning drop-off during reconstruction activities. The second determined 3R practices for upgrading shoulders during overlay projects.

48 49
Table 3-7. State and provincial reconstruction guidelines and practices
State Guidance for addressing pavement edge drop-off during reconstruction
What are the 3R practices with regard to shoulders?
IA Depends on project Project must consider what improvements are feasible
MO Depends on project Recent projects have 14 foot wide lanes
GA 2–4 foot paved strip for shoulder to prevent rutting (for the last 5–6 years); now on all state routes
None beyond 2–4 foot paved strip
TX For collectors, shoulders fully surfaced for 1,500 or more ADT; shoulder surfacing not required but desirable, even if partial width for collectors with lower volumes and all local roads
AASHTO design standards apply to 3R projects
WA 2.4 in.: may remain exposed with appropriate warning signs; 6 in. to 2 ft.: protected with warning signs and a material wedge, channelizing devices, or barriers; > 6 in. tare protected by warning signs and a material wedge or barriers
Some safety improvements normally included in 3R projects: upgrade of existing substandard road design elements
OH Paved shoulders installed for some state projects using federal funds
Unless funding available, typically no changes made to cross-section
TN Paved shoulders are mandatory Shoulders upgraded on all projects
AL Depends on ADT of roadway Depends on ADT of roadway
ND Paved shoulders installed for some state projects using federal funds
Unless funding available, typically no changes made to cross-section
State X Unpaved driveways, public road intersections, and private road intersections paved to prevent edge drops from developing; areas to be selectively paved evaluated on a location-by-location basis
Consideration should be given to adding shoulder backing or reconstructing the embankment on overlay projects because edge drops often develop over time.
State Y Non-freeway shoulders fully or partially paved
The full design shoulder width should be paved unless facility is a historic parkway, in which case at least 1.2 m. of the shoulder should be paved
State Z Depends on project Drop-off eliminated or mitigated with one or more of the following: Paving full top width between shoul-der breaks; paving shoulders at points where vehicle encroachments are likely (inside of hor. curves); constructing beveled or taperedpave. edge; reconstructing shoulders
Table 3-7 presents an overview of these questions.
As shown, the practices for addressing drop-off occurring in reconstruction work zones mirror the recommendations for construction-related drop-offs. This is not surprising, as both activities create similar drop-off conditions. Preliminary evidence suggests that upgrading shoulders as part of 3R projects from aggre-gate to paved surfaces is considered on a project-to-project basis.
On a related note, a county engineer in one of the states surveyed commented, outside the survey, that his county typically does not add paved shoulders to roads during resurfacing projects. As a reason for this, he cited environmental regulations that would require adding retention ponds to mitigate storm water runoff if more than a prescribed amount of pavement is added. This additional work increases the time and cost for completing the project.
3.5. Additional Safety Practices
States and provinces were also asked whether they had conducted safety studies to evaluate the impact or magnitude of edge drop-off. Four questions regarding safety were posed, and the responses are presented in Table 3-8.
The first question asked whether any information was available on the impact of edge drop-off on the severity or frequency of crashes in that state or province. Most agencies contacted said no such information was available. Ohio examines run-off-road crashes to determine whether edge drop-off plays a part, but did not have information to quantify this. The second question asked whether any analyses of drop-off-related crashes had been performed. Again, most responses obtained indicated no such analyses had been performed, though Ohio, again, has attempted to examine run-off-road crashes to ascertain whether drop-off was a cause.
The third question asked whether impacts of resurfacing had been ana-lyzed. This question received more varied responses than the previous ques-tions, as some agencies had analyzed the impacts of resurfacing on crashes, while others had not. The final question asked about the level of priority given to reducing drop-off crashes. Answers varied among agencies, with many placing
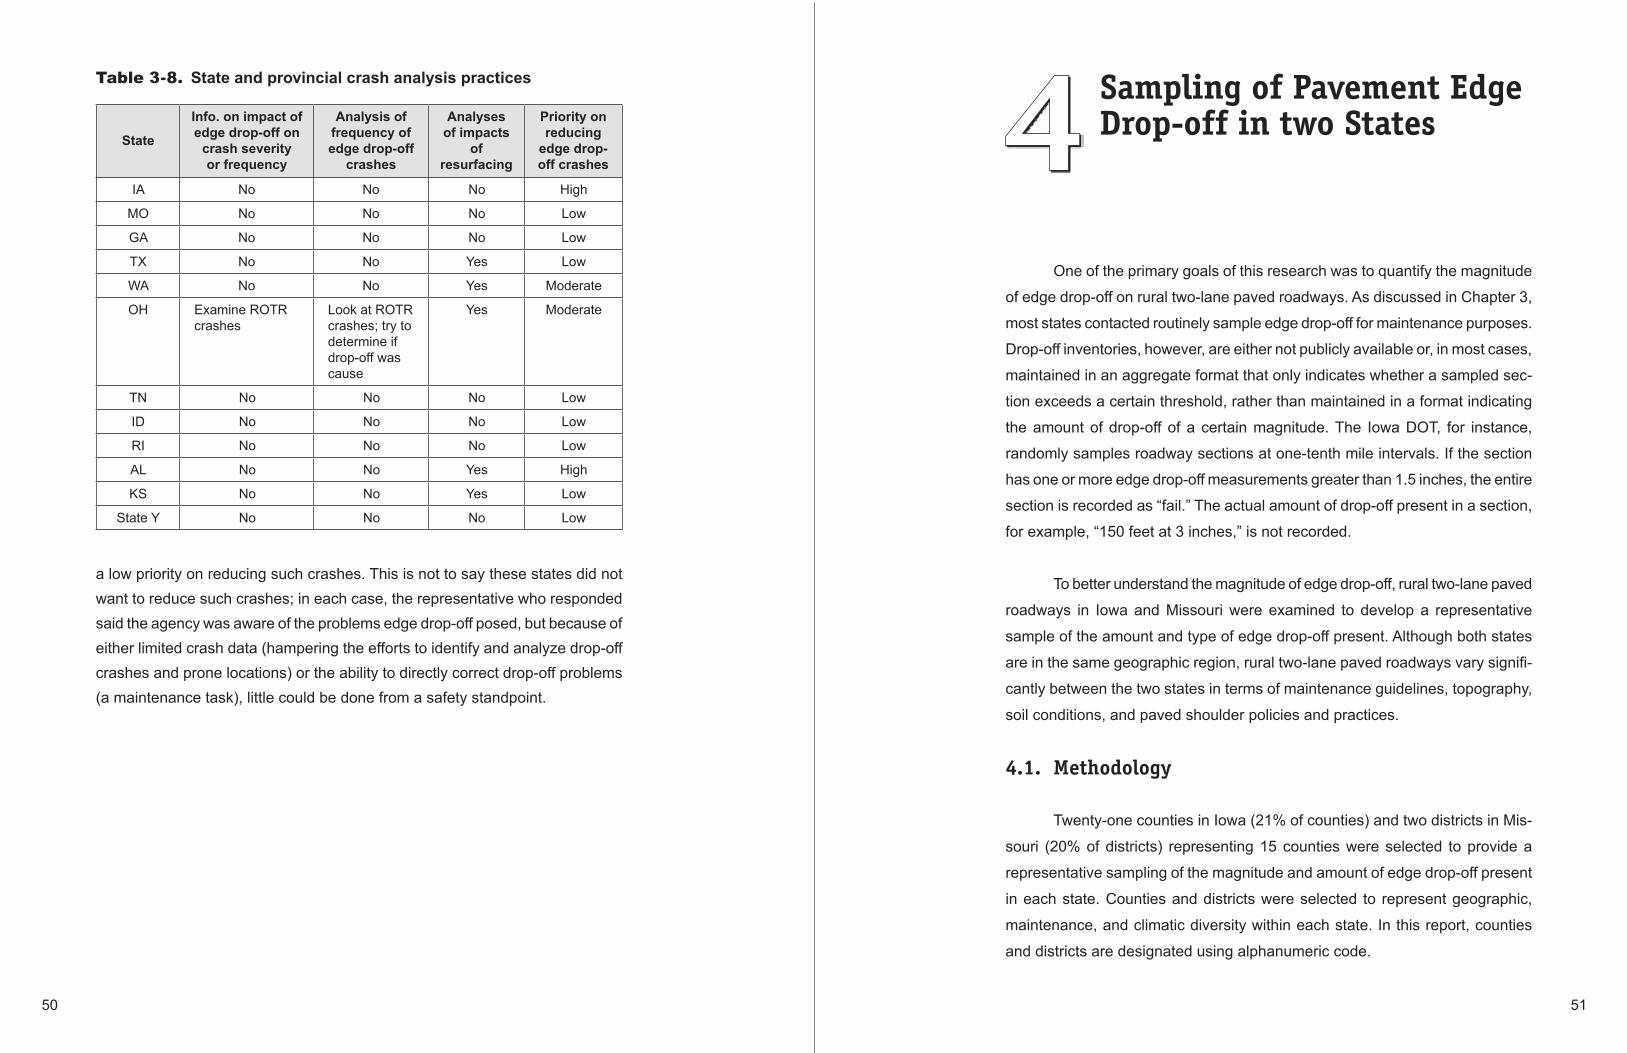
50 51
Table 3-8. State and provincial crash analysis practices
State
Info. on impact of edge drop-off on
crash severity or frequency
Analysis of frequency of edge drop-off
crashes
Analysesof impacts
ofresurfacing
Priority on reducing
edge drop-off crashes
IA No No No High
MO No No No Low
GA No No No Low
TX No No Yes Low
WA No No Yes Moderate
OH Examine ROTR crashes
Look at ROTR crashes; try to determine if drop-off was cause
Yes Moderate
TN No No No Low
ID No No No Low
RI No No No Low
AL No No Yes High
KS No No Yes Low
State Y No No No Low
a low priority on reducing such crashes. This is not to say these states did not want to reduce such crashes; in each case, the representative who responded said the agency was aware of the problems edge drop-off posed, but because of either limited crash data (hampering the efforts to identify and analyze drop-off crashes and prone locations) or the ability to directly correct drop-off problems (a maintenance task), little could be done from a safety standpoint.
Sampling of Pavement Edge Drop-off in two States
One of the primary goals of this research was to quantify the magnitude
of edge drop-off on rural two-lane paved roadways. As discussed in Chapter 3,
most states contacted routinely sample edge drop-off for maintenance purposes.
Drop-off inventories, however, are either not publicly available or, in most cases,
maintained in an aggregate format that only indicates whether a sampled sec-
tion exceeds a certain threshold, rather than maintained in a format indicating
the amount of drop-off of a certain magnitude. The Iowa DOT, for instance,
randomly samples roadway sections at one-tenth mile intervals. If the section
has one or more edge drop-off measurements greater than 1.5 inches, the entire
section is recorded as “fail.” The actual amount of drop-off present in a section,
for example, “150 feet at 3 inches,” is not recorded.
To better understand the magnitude of edge drop-off, rural two-lane paved
roadways in Iowa and Missouri were examined to develop a representative
sample of the amount and type of edge drop-off present. Although both states
are in the same geographic region, rural two-lane paved roadways vary signifi-
cantly between the two states in terms of maintenance guidelines, topography,
soil conditions, and paved shoulder policies and practices.
4.1. Methodology
Twenty-one counties in Iowa (21% of counties) and two districts in Mis-
souri (20% of districts) representing 15 counties were selected to provide a
representative sampling of the magnitude and amount of edge drop-off present
in each state. Counties and districts were selected to represent geographic,
maintenance, and climatic diversity within each state. In this report, counties
and districts are designated using alphanumeric code.

52 53
Within each county or district, roadway segments were selected to rep-resent a variety of roadway characteristics, including:
Lane width
Type of surface material (asphalt versus pavement)
Shoulder width
Shoulder material
Grade
Presence of horizontal curve
Previous research indicated that edge drop-off may be more likely to occur in areas around mailboxes, the inside of horizontal curves, and vertical grades (Dixon et al. 2005; Cumby et al. 2003). As a result, an attempt was made to include sections that contained all three areas. Additionally, numerous sections around mailboxes were collected separately.
Road characteristic databases were consulted for each county or district prior to data collection in the field. Segments were randomly selected to represent the range of characteristics discussed previously. Data were collected on rural two-lane paved roadways with paved shoulders of width less than or equal to 2 feet. Segments were classified as “rural” if they were at least 1,000 feet outside of an incorporated area. Only segments with average daily traffic (ADT) greater than or equal to 400 vehicles per day (vpd) were sampled. This threshold was chosen because low-volume roads are often not maintained at the same stan-dard as high-volume roads, and agencies are not likely to program additional resources toward very low-volume facilities. Additionally, selecting locations that could be used in the crash analysis was necessary, and low-volume roads typically had a low number of crashes overall.
Physical characteristics of the roadway were collected during field visits. Additional information, such as ADT and literal descriptions of roadways, were extracted from road characteristics databases provided by the departments of transportation of both states.
•
•
•
•
•
•
A segment, for the purpose of this study, was defined as a length of roadway with uniform characteristics. Data were collected for at least 2 miles of the segment, which was terminated when roadway features, such as ADT or geometric characteristics, changed significantly. Data were collected along segments in 0.1-mile sections, which is the distance used by most departments of transportation contacted. In most cases, a single 0.1-mile section was col-lected per mile.
Additionally, an analysis of edge drop-off variability along a single one-mile segment was conducted. For that segment, edge drop-off data were collected every 100 feet. This information was evaluated to determine how much edge drop-off depth varied along the segment and how many 0.1-mile intervals would need to be collected per mile. Edge drop-off data from a separate project con-ducted by the Midwest Research Institute (MRI) was evaluated for variability.
Based on evaluating both pieces of information, it was decided that a single 0.1-mile interval per mile provided sufficient representation of edge drop-off variability. Data collectors, however, collected additional 0.1-mile sections if edge drop-off conditions varied significantly in the field. That judgment was based on a determination made in the drop-off readings taken within the section. In each section, between 6 and 11 measurements were made on each side of the road. If more than 4 of these measurements exceeded all other measurements made in the section by 1.0 inches, an additional 0.1-mile section was collected.
The following roadway characteristics were collected at the beginning of each 0.1-mile section:
Pavement type
Shoulder type
Pavement edge drop-off shape
Shoulder grade
Shoulder width
Lane cross-slope
•
•
•
•
•
•

54 55
Lane width
Pavement width (usually corresponded to lane width)
Grade
Shoulder cross-section, recorded if shoulder width was less than 4 feet
Pavement edge drop-off height was recorded to the nearest 1/8 inch at
104- or 52-foot intervals. If a drop-off measurement was less than 1.5 inches,
the next measurement was collected at a 104-foot interval. If a drop-off mea-
surement was 1.5 inches or greater, the next measurement was collected at a
52-foot interval. The threshold of 1.5 inches is the value Iowa used to determine
acceptable edge drop-off for maintenance purposes.
Drop-off was collected along both sides of the roadway for each 0.1-mile
section by placing a level across the top of the pavement surface and then plac-
ing a straightedge 4 inches from the base of the pavement. Figure 4-1 shows the
collection of roadway characteristics and edge drop-off data along segments.
Figure 4-2 shows the measurement of edge drop-off height.
Figure 4-1. Collection of roadway characteristics and edge drop-off along segments
•
•
•
•
Figure 4-2. Measurement of edge drop-off height
All raw data were entered into spreadsheets, one created for each county.
In addition, a worksheet that recorded the raw data from the data collection sheet
used in the field was created for each segment. A database was then created
from the individual segment worksheets.
The data collection form is provided in Appendix B. A description of the dif-
ferent roadway characteristics recorded is provided in the following sections.
4.1.2. Shoulder Type
Shoulder type was recorded as paved, gravel, or earth. In some cases, a mixture of material was recorded along the shoulder.
4.1.3. Drop-off Shape
A carpenter’s gauge was used to evaluate shape at numerous locations
in the field, as shown in Figure 4-3. Most shapes, however, corresponded to
Shapes A, B, or C defined by Zimmer and Ivey (1982) and illustrated in Figures
4-3, 4-4, and 4-5.

56 57
Figure 4-3. Definition of edge drop-off shape
Figure 4-4. Typical Shape A
Figure 4-5. Typical Shape B
Shape A corresponds to the typical vertical face present with concrete pavement and also occurs when asphalt pavement breaks, as shown in Figure 4-4. Shape B is the most common for asphalt pavement and occurs from typical overlay, as shown in Figure 4-5.
Shape C is a wedge, approximately 45°, and appears to be intention-ally shaped. An additional shape defined as “squashed wedge” was recorded several times in the field. This shape defines a pavement edge where the slope was significantly flatter than 45°.
4.1.4. Shoulder Grade and Shape
Shoulder width was recorded by measuring from the pavement edge to the point where the grade differential between the shoulder and ditch began. Grade was measured at the beginning of the 0.1-mile segment.

58 59
4.1.5. Lane Width and Pavement Width
When no paved shoulders were present, pavement width was measured from edge of pavement to edge of pavement, and lane width was recorded as one-half of the pavement width. For segments with paved shoulders, lane width was measured from the center line to the edge line marking, and pavement width was measured from edge of pavement to edge of pavement.
4.2. Findings
Physical roadway characteristics and the amount of drop-off present varied significantly among segments. Each state is discussed individually in the following sections.
4.2.1. Iowa
A total of 150 segments were sampled in Iowa. Table 4-1 shows the number of segments collected by county. Shoulder and lane width were col-lected for each 0.1-mile section, and a summary is provided in Tables 4-2 and 4-3, respectively. Shoulder widths varied from 2.0–15.0 feet, and lane widths varied from 8.5–14.0 feet.
Table 4-1. Segments by county
Code Segments Code Segments
A-1 7 A-13 11
A-2 10 A-14 1
A-3 1 A-15 2
A-4 2 A-16 2
A-5 9 A-17 13
A-6 16 A-18 7
A-7 8 A-19 7
A-8 14 A-20 2
A-9 1 A-21 3
A-10 5 A-22 9
A-11 12 A-23 2
A-12 12
Total 156
Table 4-2. Shoulder width by segment for Iowa
Shoulder width(feet)
Number of segments
Shoulder width(feet)
Number of segments
2.0 5 8.0 9
3.0 17 8.5 1
3.5 3 9.0 3
4.0 16 9.5 3
4.5 22 10.0 2
5.0 19 10.5 1
5.5 15 11.0 2
6.0 12 11.5 2
6.5 8 12.0 2
7.0 6 12.0+ 3
7.5 5
Total 156
Table 4-3. Lane width by segment for Iowa
Lane width (feet) Number of segments
8.5 to < 9.0 1
9.0 to < 9.5 1
9.5 to < 10.0 0
10.0 to < 10.5 1
10.5 to < 11.0 6
11.0 to < 11.5 67
11.5 to < 12.0 15
12.0 to < 12.5 59
12.5 to < 13.0 1
13.0 to < 13.5 2
13.5 to < 14.0 1
14.0 to < 14.5 2
Total 156

60 61
The maximum edge drop-off recorded for Iowa was 5.0 inches. The magnitude of sampled edge drop-off is shown in Table 4-4.
Table 4-4. Magnitude of sampled edge drop-off for Iowa
Edge drop-off (inches)
Amount by category
Edge drop-off (inches)
Amount by category
< 0.75 7.6% 3.00 to < 3.25 0.6%
0.75 to < 1.00 14.0% 3.25 to < 3.50 0.1%
1.00 to < 1.25 20.6% 3.50 to < 3.75 0.1%
1.25 to < 1.50 19.7% 3.75 to < 4.00 0.1%
1.50 to < 1.75 15.3% 4.00 to < 4.25 < 0.1%
1.75 to < 2.00 10.7% 4.25 to < 4.50 < 0.1%
2.00 to < 2.25 5.9% 4.50 to < 4.75 < 0.1%
2.25 to < 2.50 2.9% 4.75 to < 5.00 < 0.1%
2.50 to < 2.75 1.3% 5.00 to < 5.25 < 0.1%
2.75 to < 3.00 1.0%
The total edge drop-off by interval was determined by summarizing the
amount of edge drop-off measured for each 0.1-mile section. If the following
edge drop-off measurements, for example, were recorded at 104-foot intervals
for the south side of a 0.1-mile section: 1.0, 1.25, 1.0, 1.35, 1.5, and 1.75 inches,
the following (Table 4-5) would have been recorded in the final database for the
south side of that section:
Table 4-5. Sample total edge drop-off interval
Percentage of measurements Drop-off interval (inches)
33.33% ≥ 1.0 and < 1.25
33.33% ≥ 1.25 and < 1.5
16.67% ≥ 1.5 and < 1.75
16.67% ≥ 1.75 and < 2.0
Table 4-4 indicates the total amount of sampled drop-off within the in-dicated intervals for the 156 segments. As shown, almost 6% of the drop-off
recorded was greater than or equal to 2.0 inches and less than 2.25 inches. Nearly 1% was greater than or equal to 2.75 and less than 3.0 inches.
Figure 4-6 indicates the cumulative percentage of drop-off above the indicated threshold for Iowa. As shown, more than 12% of the drop-off sampled was 2.0 inches or greater, 1.0% was 3.0 inches or greater, and less than 1.0% was 4.0 inches or greater.
Figure 4-6. Percentage of sampled drop-off above indicated threshold for Iowa
0.00%
2.00%
4.00%
6.00%
8.00%
10.00%
12.00%
14.00%
16.00%
18.00%
20.00%
>= 2.0 >= 3.0 >= 4.0 >= 5.0 Inches

62 63
4.2.2. Missouri
A total of 71 segments were sampled in Missouri. Table 4-6 presents the number of segments collected by county. Shoulder widths varied from 1.0–9.5 feet. Lane widths varied from 8.9–14.3 feet. Shoulder and lane widths were collected for each 0.1-mile section, and summaries of each by segment are provided in Tables 4-7 and 4-8, respectively.
Table 4-6. Data collected by county for Missouri
Code Segments Code SegmentsB-1 3 B-10 11
B-2 3 B-11 3
B-3 10 B-12 10
B-4 1 B-13 3
B-5 6 B-14 3
B-6 3 B-15 5
B-7 1 B-16 13
B-8 3 B-17 10
B-9 5 B-18 8
Total 101
Table 4-7. Shoulder width by segment for Missouri
Shoulder width (feet) Segments1.5 4
2.0 24
2.5 6
3.0 18
3.5 2
4.0 7
4.5 2
5.0 9
6.0 7
6.5 5
7.0 3
8.0 5
8.5 2
9.0+ 2
Total 101
Table 4-8. Lane width by sections for Missouri
Lane width (feet) Sections
≥ 9.0 & < 9.5 2
≥ 9.5 & < 10.0 5
≥ 10.0 & < 10.5 25
≥ 10.5 & < 11.0 27
≥ 11.0 & < 11.5 25
≥ 11.5 & < 12.0 3
≥ 12.0 & < 12.5 11
12.0+ 3
Total 101
The maximum drop-off recorded for Missouri was 6.5 inches. The mag-
nitude of edge drop-off by height interval is shown in Table 4-9. As shown, more
than 7% of the sampled drop-off was greater than or equal to 2 inches and less
than 2.25 inches.
Table 4-9. Magnitude of sampled edge drop-off for Missouri
Edge drop-off (inches)
Amount by interval
Edge drop-off (inches)
Amount by interval
< 0.75 17.67% 3.25 to < 3.50 0.48%
0.75 to < 1.00 12.87% 3.50 to < 3.75 0.48%
1.00 to < 1.25 14.94% 3.75 to < 4.00 0.19%
1.25 to < 1.50 14.48% 4.00 to < 4.25 0.17%
1.50 to < 1.75 12.11% 4.25 to < 4.50 0.20%
1.75 to < 2.00 9.35% 4.50 to < 4.75 0.08%
2.00 to < 2.25 7.18% 4.75 to < 5.00 0.06%
2.25 to < 2.50 4.38% 5.00 to < 5.25 0.04%
2.50 to < 2.75 2.54% 5.25 to < 5.50 0.00%
2.75 to < 3.00 1.49% 5.50 to < 6.00 0.02%
3.00 to < 3.25 1.22% ≥ 6.00 0.05%
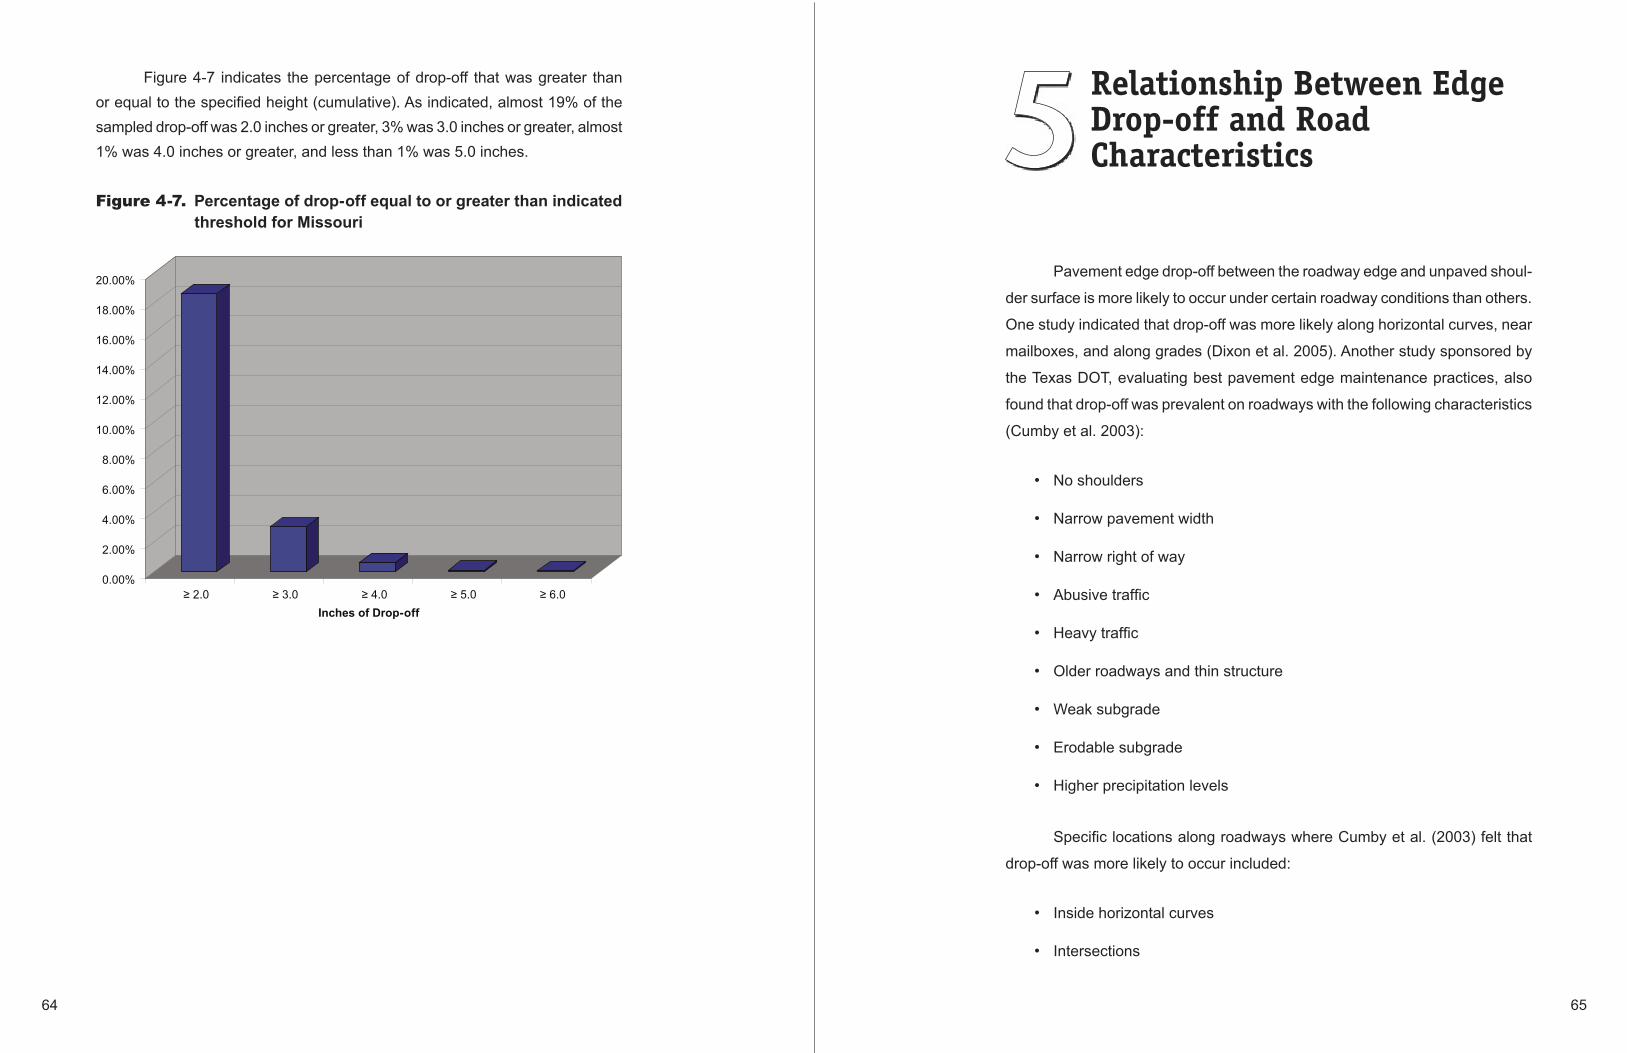
64 65
Figure 4-7 indicates the percentage of drop-off that was greater than or equal to the specified height (cumulative). As indicated, almost 19% of the sampled drop-off was 2.0 inches or greater, 3% was 3.0 inches or greater, almost 1% was 4.0 inches or greater, and less than 1% was 5.0 inches.
Figure 4-7. Percentage of drop-off equal to or greater than indicated threshold for Missouri
0.00%
2.00%
4.00%
6.00%
8.00%
10.00%
12.00%
14.00%
16.00%
18.00%
20.00%
≥ 2.0 ≥ 3.0 ≥ 4.0 ≥ 5.0 ≥ 6.0
Inches of Drop-off
Relationship Between Edge Drop-off and Road Characteristics
Pavement edge drop-off between the roadway edge and unpaved shoul-
der surface is more likely to occur under certain roadway conditions than others.
One study indicated that drop-off was more likely along horizontal curves, near
mailboxes, and along grades (Dixon et al. 2005). Another study sponsored by
the Texas DOT, evaluating best pavement edge maintenance practices, also
found that drop-off was prevalent on roadways with the following characteristics
(Cumby et al. 2003):
No shoulders
Narrow pavement width
Narrow right of way
Abusive traffic
Heavy traffic
Older roadways and thin structure
Weak subgrade
Erodable subgrade
Higher precipitation levels
Specific locations along roadways where Cumby et al. (2003) felt that
drop-off was more likely to occur included:
Inside horizontal curves
Intersections
•
•
•
•
•
•
•
•
•
•
•
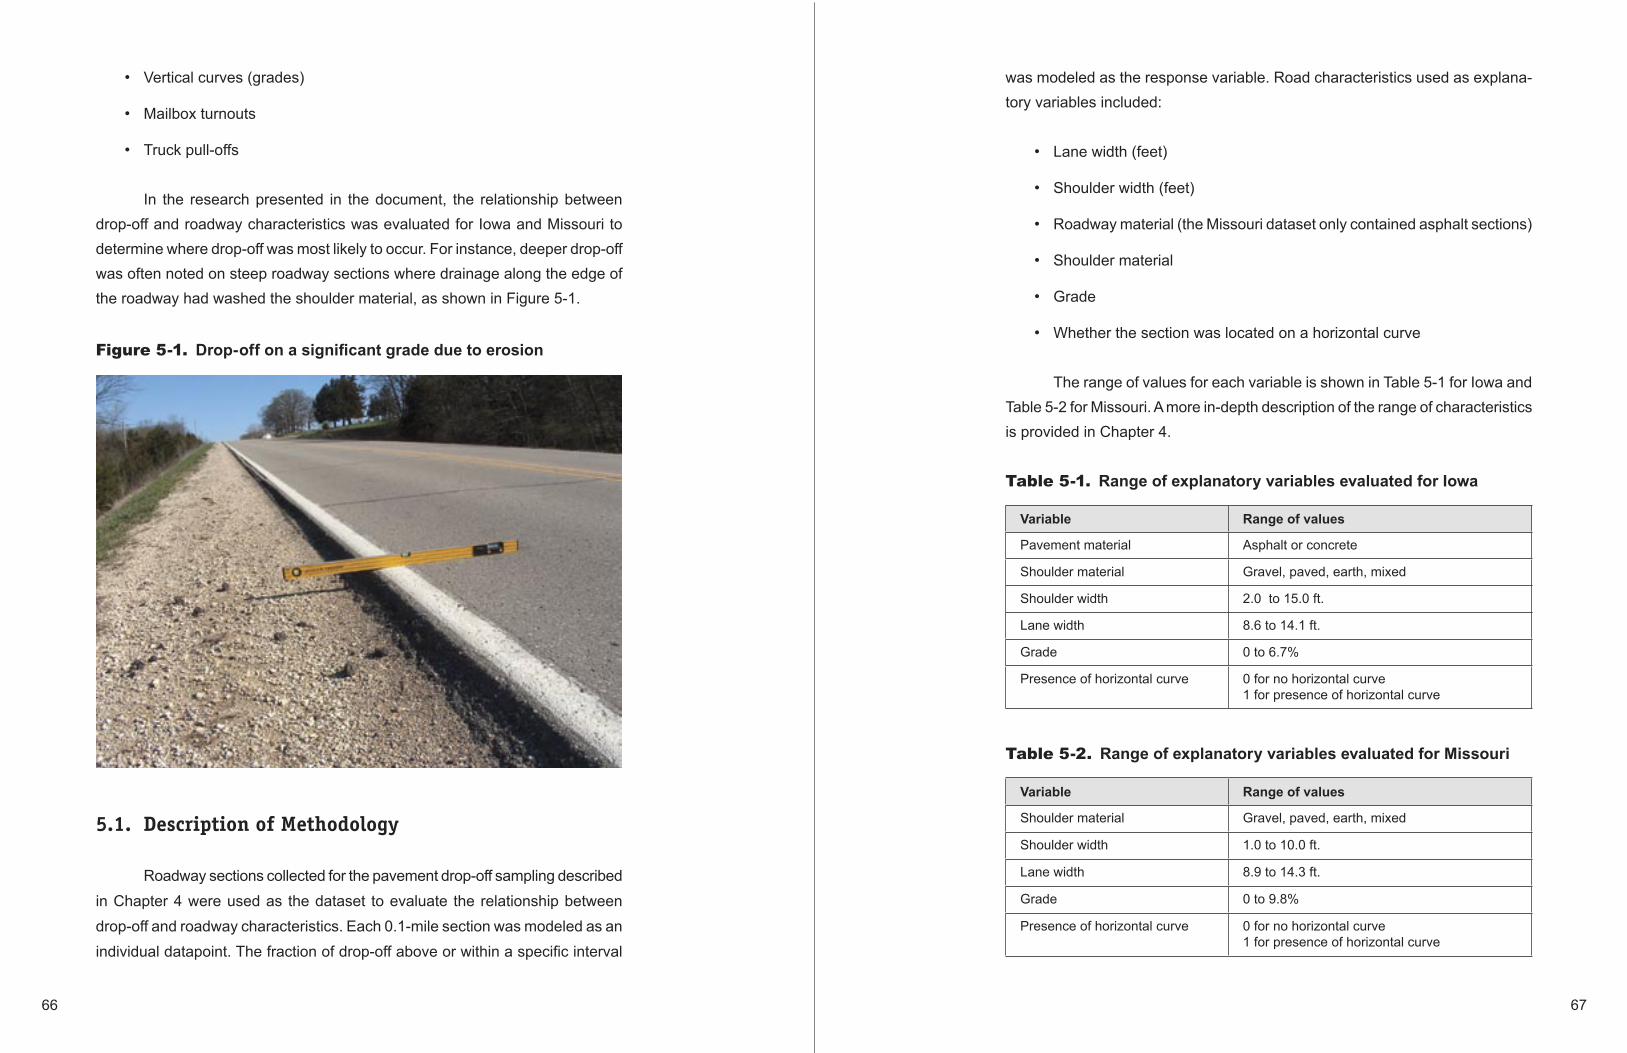
66 67
Vertical curves (grades)
Mailbox turnouts
Truck pull-offs
In the research presented in the document, the relationship between drop-off and roadway characteristics was evaluated for Iowa and Missouri to determine where drop-off was most likely to occur. For instance, deeper drop-off was often noted on steep roadway sections where drainage along the edge of the roadway had washed the shoulder material, as shown in Figure 5-1.
Figure 5-1. Drop-off on a significant grade due to erosion
5.1. Description of Methodology
Roadway sections collected for the pavement drop-off sampling described in Chapter 4 were used as the dataset to evaluate the relationship between drop-off and roadway characteristics. Each 0.1-mile section was modeled as an individual datapoint. The fraction of drop-off above or within a specific interval
•
•
•
was modeled as the response variable. Road characteristics used as explana-tory variables included:
Lane width (feet)
Shoulder width (feet)
Roadway material (the Missouri dataset only contained asphalt sections)
Shoulder material
Grade
Whether the section was located on a horizontal curve
The range of values for each variable is shown in Table 5-1 for Iowa and Table 5-2 for Missouri. A more in-depth description of the range of characteristics is provided in Chapter 4.
Table 5-1. Range of explanatory variables evaluated for Iowa
Variable Range of values
Pavement material Asphalt or concrete
Shoulder material Gravel, paved, earth, mixed
Shoulder width 2.0 to 15.0 ft.
Lane width 8.6 to 14.1 ft.
Grade 0 to 6.7%
Presence of horizontal curve 0 for no horizontal curve1 for presence of horizontal curve
Table 5-2. Range of explanatory variables evaluated for Missouri
Variable Range of values
Shoulder material Gravel, paved, earth, mixed
Shoulder width 1.0 to 10.0 ft.
Lane width 8.9 to 14.3 ft.
Grade 0 to 9.8%
Presence of horizontal curve 0 for no horizontal curve1 for presence of horizontal curve
•
•
•
•
•
•

68 69
Data were analyzed using hierarchical tree-based regression (HTBR) analysis, which divides the sample data recursively into a number of groups to generate a tree structure. The groups are selected to maximize some measure of difference in the response variable in the resulting groups. One advantage of regression tree analysis over traditional regression analysis is that HTBR is a non-parametric method, which does not require any distribution assumptions of the response variable and is more resistant to the effects of outliers (Roberts 1999).
5.2. Results
The fraction of drop-off 2.5 inches and greater and 3.0 inches and greater were modeled as response variables for both Iowa and Missouri. Higher intervals of drop-off, such as 3.5 inches and greater, were initially evaluated, but due to small sample sizes, a meaningful analysis could not be carried out. Drop-offs of 2.5 inches and greater and 3.0 inches and greater occurred on a wide variety of road structures, including wide shoulders, wide lanes, and flat grades. The results of HTBR provide a sense of where these drop-offs were more likely to occur, but should not be interpreted to mean that agencies should only focus resources on these types of roadways.
Results for Iowa indicated an increased amount of drop-off 2.5 inches and greater occurred on sections with shoulder widths less than 3.0 feet. On sections with shoulder widths from 3.0–7.25 feet, drop-off was more likely to oc-cur when the grade was greater than 4.8%. Increases in the amount of drop-off 3.0 inches and greater were associated with narrow lanes (less than 11.6 feet) and a grade greater than 4.8%.
Results for Missouri suggested drop-offs greater than 2.5 inches were more likely on narrow roadways (less than 11.6 feet) with gravel shoulders. On roadways with earth or mixed shoulders, drop-off was more likely when shoulders were less than 6.5 feet. The results for the fraction of drop-off greater than or equal to 3.0 inches indicated drop-off was more prevalent on narrow roadways (less than 11.1 feet) with gravel shoulders, and roadways greater than 11.1 feet wide with narrow shoulders (less than 2.1 feet).
Only pavement material was evaluated in Iowa and was not found to be
a statistically significant variable. Lane width and type of shoulder material was not statistically significant for either state. Additionally, whether the segment was located on a horizontal curve was not a significant variable in the analysis for either state.
5.3. Mailboxes
On selected roadway segments where drop-off was sampled as described in Chapter 4, separate drop-off measurements were also recorded around mail-boxes every 10 feet, on the same side of the road as the mailbox, for a distance of roughly 30–55 feet before and after the mailbox. Drop-off measurements were recorded in the vicinity of 8 mailboxes in Iowa and 11 in Missouri. Measurements were collected separately from the 0.1-mile sections so that drop-off around mailboxes could be compared to drop-off at locations without mailboxes on the same roadway segment.
Each of the eight mailboxes in Iowa was located on a different roadway segment. Drop-off depth greater than or equal to 2.0 inches was recorded near a mailbox in four of the eight segments, and on five of the eight non-mailbox segments. Drop-off greater than or equal to 3.0 inches was recorded near a mailbox in one segment, and on two of the non-mailbox segments. Drop-off equal to or greater than 4.0 inches was not recorded near any mailboxes but was recorded on one non-mailbox segment.
Each of the 11 mailboxes in Missouri was located on a different roadway segment. Drop-off depth greater than or equal to 2.0 inches was recorded near a mailbox in eight of the eleven segments, and eight of the eleven non-mailbox segments. Drop-off greater than or equal to 3.0 inches was recorded near a mailbox in three segments, and on six non-mailbox segments. Drop-off equal to or greater than 4.0 inches was recorded near a mailbox in one segment, and on three non-mailbox segments.
5.4. Discussion
As discussed, several studies indicated drop-off was likely to occur around mailboxes and along horizontal curves, although this information was based on
70 71
subjective analyses. This study did not find evidence that either location was more likely to have higher proportions of drop-off than locations where horizon-tal curves or mailboxes were not present along the same segment. Mailboxes and horizontal curves were not found to be problematic locations in Iowa and Missouri, which may have been because engineers are already aware of these problems and pay more attention to maintenance. Seeing fresh material placed around the edges on horizontal curves during field visits and lane widening around horizontal curves were common. Maintenance personnel in Iowa also tend to apply higher-level treatments, such as a 1-foot paved shoulder addition, in locations with recurring drop-off.
Frequency and Characteristics of Pavement Edge Drop-off Crashes
A primary goal of this research was to quantify the frequency of pavement
edge drop-off-related crashes. A significant number of studies have evaluated
drivers’ ability to negotiate edge drop-off, as discussed in Chapter 1. Little infor-
mation is available, however, that quantifies the number or severity of crashes
related to edge drop-off. Without information about the actual frequency of edge
drop-off-related crashes, agencies are not able to assess the economic costs
and benefits of investment decisions, evaluate the effectiveness of different treat-
ments to mitigate edge drop-off, or focus resources. With limited budgets and
numerous competing demands for maintenance resources, agencies may have
limited interest in addressing problems where only speculative evidence exists.
To address this shortcoming and provide agencies with information they
can use to assess the magnitude and severity of the problem, the frequency
and characteristics of pavement edge drop-off-related crashes were addressed
using two different methods. First, tort liability cases in Iowa were evaluated to
determine the number of claims filed. Second, crash forms were evaluated in
four different states to determine the number of crashes on rural two-lane (and
in some cases, rural multi-lane) roadways in which pavement edge drop-off may
have contributed to the crash. Each method is discussed in detail in this chapter.
The analysis of edge drop-off crashes in North Carolina and Illinois was
carried out by Patel and Council (2004) and funded by FHWA under the Highway
Safety Information System (HSIS) program. Researchers Hallmark, Veneziano,
and McDonald at the Center for Transportation Research and Education (CTRE)
at Iowa State University, and Graham at Midwest Research Institute (MRI) car-
ried out the analysis of Iowa and Missouri crashes. The AAAFTS, the primary
sponsor of this research, funded the Iowa and Missouri analyses.
72 73
6.1. Tort Liability
Litigation against state agencies in which edge drop-off is cited as a ma-jor factor contributing to a crash is one of the major tort liability suits filed. Tort claims filed since 2000 in Iowa, for example, where “pavement/shoulder edge” or “shoulder conditions” is the major factor are the highest-ranking tort liability claims in terms of total dollar value filed. In fiscal years 2000–2003, these claims accounted for 38% of the total dollar value of claims filed against the DOT.
Since 2000, 23 pavement edge drop-off-related tort liability claims have been filed against Iowa. Of those, however, compensation was awarded to the plaintiff in only two cases. The DOT believes Iowa’s demonstrably strong main-tenance policy has contributed to the state’s success in defending against tort liability claims related to pavement edge drop-off. Claims are still burdensome, however, and use resources to investigate and defend. When states and other highway agencies are not able to defend themselves successfully, edge drop-off can result in significant liability.
6.2. Evaluating Crash Forms to Assess the Frequency and Severity of Rural Pavement Edge Drop-off- Related Crashes
Determining the exact number of edge drop-off-related crashes that occur is difficult, since most states and other agencies that require crash information to be collected do not train police officers to check for or record the presence of drop-off when they complete accident reports. Even though several states have a data element on their crash report form that allows an officer to record roadway-contributing circumstances of the crash, shoulder condition is often included in a generic form, such as “presence of low/soft/high shoulders” or “shoulder: ruts, holes.” Additionally, determining whether edge drop-off was the actual cause of a crash would require evaluating the scene immediately follow-ing the crash to determine the presence and amount of drop-off and to check the vehicle tires for evidence of scrubbing.
Although investigating individual crash scenes is not practical without commissioning a special study, Patel and Council (2004) proposed a method
that estimates the number of crashes to which edge drop-off may have contrib-uted. Their method evaluated the officer narrative sections of crash diagrams in crash reports to assess whether events leading up to a crash were likely to have been influenced by pavement edge drop-off. Their initial study was con-ducted in North Carolina and Illinois to determine the number of potential edge drop-off-related crashes that occurred in those states. As indicated previously, their research was sponsored as part of a previous research project by FHWA and through a joint agreement with FHWA, their methodology and results are presented here.
Their methodology was adapted for Iowa and Missouri, for the research sponsored by the AAA Foundation. Since North Carolina and Illinois data were analyzed independently of Iowa and Missouri, some differences exist in the amount of detail and way results are presented. The basic methodology and results for all four states are detailed in the following sections.
6.2.1. Methodology
Crashes with characteristics similar to those likely to occur when edge drop-off is a contributing factor were selected for rural paved roadways in each state. In their original methodology, Patel and Council (2004) hypothesized that certain types of crashes were likely to be edge drop-off related. They identified five categories of crash types that may indicate pavement edge drop-off con-tributed to the crash:
Category A: Run-off-road right, cross centerline/median, hit vehicle in opposite direction (head-on or sideswipe).
Category B: Run-off-road right, sideswipe vehicle in the same direction.
Category C: Run-off-road right, rollover. No control on where the rollover occurs. It could be in-road or out-of-road.
Category D: Run-off-road right, then run-off-road left.
Category E: Single vehicle run-off-road right.
The five categories are mutually exclusive.
•
•
•
•
•

74 75
Corresponding crash data from each state were assigned to these five categories based on computerized crash characteristics, such as sequence of events and first harmful event. A random sample of crashes was then se-lected from each category, and the officer narrative and crash diagrams from the original crash reports were evaluated to determine whether edge drop-off was likely to have contributed to the crash. For some categories, the number of potential edge drop-off-related crashes was so small that all crashes falling into the category were reviewed.
The method developed by Patel and Council (2004) included a filter requiring that some indication of scrubbing to exist for a crash to be considered edge drop-off related. (Note: as described in more detail herein, Iowa and Mis-souri data were examined both with and without this scrubbing filter.) Scrubbing is described further in Section 1.1.
Each crash report was evaluated to determine whether scrubbing was likely to have occurred. The crash diagram or crash narrative for each crash sam-pled was evaluated to determine if any of the following conditions occurred:
The angle of the vehicle’s initial departure from the road was less than approximately 20°, and the diagram shows at least one tire would have been close to the pavement edge.
The angle of the vehicle’s reentry to the road was less than approximately 20°, and the diagram shows at least one tire would have been close to the pavement edge.
Departure and reentry angles were greater than approximately 20°, but a subsequent event shows the vehicle with one or more wheels near and approximately parallel (20º or less) to the pavement edge.
The wording in the crash narrative clearly indicates scrubbing likely oc-curred; for instance, in one crash record, the driver indicated the vehicle’s tire slid along the pavement edge, and, as the vehicle returned to the pavement, control was lost.
If one or more of the previous conditions were met, the crash was coded
•
•
•
•
as “Potential Scrubbing.” If none of the conditions were met, the crash was coded as “Not Scrubbing.” If a crash diagram was not available or the events that took place could not be determined, the crash was coded as “Unknown Scrubbing.”
A typical crash diagram indicating that scrubbing occurred is shown in Figure 6-1. This diagram indicates the right wheels of Vehicle 1 barely left the pavement and were close to the edge as indicated by the reporting officer. As the vehicle returned to the pavement, loss of control occurred, and Vehicle 1 crossed into the adjacent lane and struck Vehicle 2.
Figure 6-1. Crash diagram indicating potential tire scrubbing
1
1
1
1
1 2
2
2
2
One shortcoming to this method is crash diagrams are often not to scale, and in some cases the series of events leading up to the crash are based on witness descriptions rather than an officer’s observations in the field. Every at-tempt was made to account for the myriad of factors influencing the information provided on a crash report.
In Patel and Council’s (2004) North Carolina and Illinois analysis, the filter to assess whether scrubbing had occurred was applied first. If scrubbing potentially occurred, the crash report was further assessed according to a second filter, discussed in the following paragraphs. A crash coded as “Not Scrubbing” or “Unknown Scrubbing” was not assessed further and coded as “Not” edge drop-off related, since the authors only considered crashes where scrubbing potentially occurred.
The second filter determined whether a crash was a “Probable” or “Pos-sible” edge drop-off-related crash and assessed whether a shoulder condition

76 77
problem was indicated on the crash report. In summary, after reviewing the officer narrative and diagrams, along with any additional information such as driver or witness narrative, each crash was coded into one of the following five categories:
Probable edge drop-off crash (coded as “Probable”)
Possible edge drop-off crash (coded as “Possible”)
Crash not likely to have been edge drop-off-related (coded as “Not”)
Soft shoulders were more likely to have contributed than edge drop-off (coded as “Soft”)
Unknown (coded as “Unknown”)
A “Probable” or “Possible” edge drop-off-related crash was one in which the narrative suggested a sequence of events typical of an edge drop-off crash. When roadway conditions were wet, snowy, or icy, the crash was only coded as “Probable” or “Possible” if initial or subsequent loss of control may have been due to the shoulder and not solely to roadway surface conditions. Crashes in which the driver was intoxicated, under the influence of drugs, experiencing a serious medical condition, traveling at excessive speeds, or engaging in reckless driving were only coded as “Probable” or “Possible” if the narrative suggested loss of control was more likely to have been caused by shoulder condition than the driver’s condition or behavior. Similarly, a crash where a defective vehicle was noted was only coded as “Probable” or “Possible” if it was more likely to have been exacerbated by shoulder condition than vehicle condition.
The difference between “Probable” and “Possible” edge drop-off-related crashes was primarily based on the officer, driver, witness, or crash diagram indicating one of the following conditions occurred in which case the crash was coded as “Probable”:
Drop-off or edge rut was present
Vehicle dropped off onto a low shoulder
1.
2.
3.
4.
5.
•
•
Wheels were caught on the shoulder, pavement, or roadway edge, or lip of roadway or pavement
Vehicle attempted to remount the pavement more than once or was un-able to remount
Driver indicated resistance to returning to the roadway
The following sample narratives suggest a “Probable” edge drop-off-related crash:
Vehicle 1 dropped off right shoulder; 3- to 4-inch drop present, driver steered to correct, went 360 degrees into road, skidded into right ditch, gouged ditch, vehicle rolled over.
Driver indicated he left the roadway and encountered drop-off from high-way to shoulder, tried to pull back, vehicle rolled, went right, then left into center divider curb, rolled over.
Vehicle 1 southbound, passenger side tires dropped off onto low shoul-der, driver overcorrected, steered to the left, swerved back to right to avoid oncoming vehicle, entered ditch, then went back onto roadway, overturned in roadway.
Vehicle 1 southbound, right front tire went off roadway and dropped approximately 4 inches onto shoulder of road, driver attempted to bring vehicle back to pavement, oversteered, crossed both lanes and started to slide and rolled over in median.
A “Possible” edge drop-off-related crash was one in which the crash nar-
ratives or diagrams suggested a sequence of events typical of an edge drop-off
crash, but presence of drop-off was not specifically indicated. A crash was coded
as “Possible” if the vehicle ran off the road and a subsequent event indicated
that loss of control occurred in one of the following situations:
On the shoulder itself
•
•
•
•

78 79
As the vehicle returned to the travel lane
When the vehicle had returned to the travel lane, but the loss of control was likely due to actions that occurred on the shoulder
Loss of control may be have been indicated by wording such as “lost control,” “overcorrected,” “attempted to return to travel lane,” “shot across road,” or “slid.” The following sample narratives indicate a “Possible” edge drop-off-related crash:
Swerved to miss deer, ran-off-road to the right, overcorrected, returned to roadway, crossed centerline, ran-off-road to the right, overturned. Driver 1 felt the wheel go off on shoulder to right, tried to correct, overcor-rected, reentered lane in a critical skid, ran-off-road to the left.
Dropped rear tire off roadway, lost control, overturned.
Crashes coded as “Soft” shoulders were those in which the officer or wit-nesses indicated the vehicle left the roadway and encountered soft shoulders. The officer or witnesses may have indicated the driver encountered soft, muddy, or wet shoulders or the vehicle slid in gravel. The following sample narratives indicate a crash fell into the category of “Soft”:
Ran-off-road to the right, traveled in ditch and rolled; driver indicated he went off onto a soft shoulder.
Ran-off-road to the right, lost control in loose gravel, returned to roadway, began skidding, and ran-off-road to the left.
A crash was coded as “Unknown” if the crash report was either inconclu-sive or no information was available. In the majority of crashes coded as “Un-known,” the reporting officer had simply not filled in a crash narrative or diagram and no other information, such as personal crash narratives, was available.
Crashes indicated as “Not” edge drop-off related did not fit into the
•
•
previous categories and were those where loss of control occurred on the roadway itself, the vehicle left the roadway but the shoulder did not appear to contribute to the crash, or other unrelated events occurred.
As previously noted, research conducted in Illinois and North Carolina was carried out by Council and Patel as a separate research project funded by the FHWA. The research in Iowa and Missouri was conducted as a separate project for the AAAFTS following the same method. To ensure that the meth-ods for determining a “Potential Scrubbing” versus “Not Scrubbing” crash or for determining that a crash was a “Probable” or “Possible” edge drop-off-related crash was followed in the Iowa and Missouri study, a decision tree was devel-oped that reflected to the greatest extent possible the decision making process used in the Illinois and North Carolina study. The decision tree, presented in Appendix C, had one component to assess whether scrubbing was likely to have occurred (first filter) and a separate component to assess whether a crash was a “Probable” or “Possible” edge drop-off-related crash (second filter). The FHWA team members evaluated the decision tree to ensure it reflected their thinking as closely as possible. Since assessing crash reports requires subjective judg-ment beyond that which could be incorporated into a decision tree, researchers from the CTRE/ISU and MRI team also consulted experts from both national and state departments of transportation to ensure consistent and expert judgment was applied to the process.
Although the research team is confident the methodology application for the four states was consistent, project goals were different for the two research efforts, and differences exist in the ways the data are analyzed and presented. Additionally, results for Illinois and North Carolina are presented in much less detail since they were not part of this original study. The interested reader is referred to the original study by Patel and Council (2004) for a more in-depth discussion of the Illinois and North Carolina study. Differences also exist in the ways crashes and roadway data are reported, stored, and used.
One main difference between the two studies is that in the initial Patel and Council (2004) analyses, only crashes in which some indication of whether scrubbing had occurred were further evaluated as “Probable” and “Possible” edge drop-off-related crashes. In the later Iowa and Missouri analyses, the
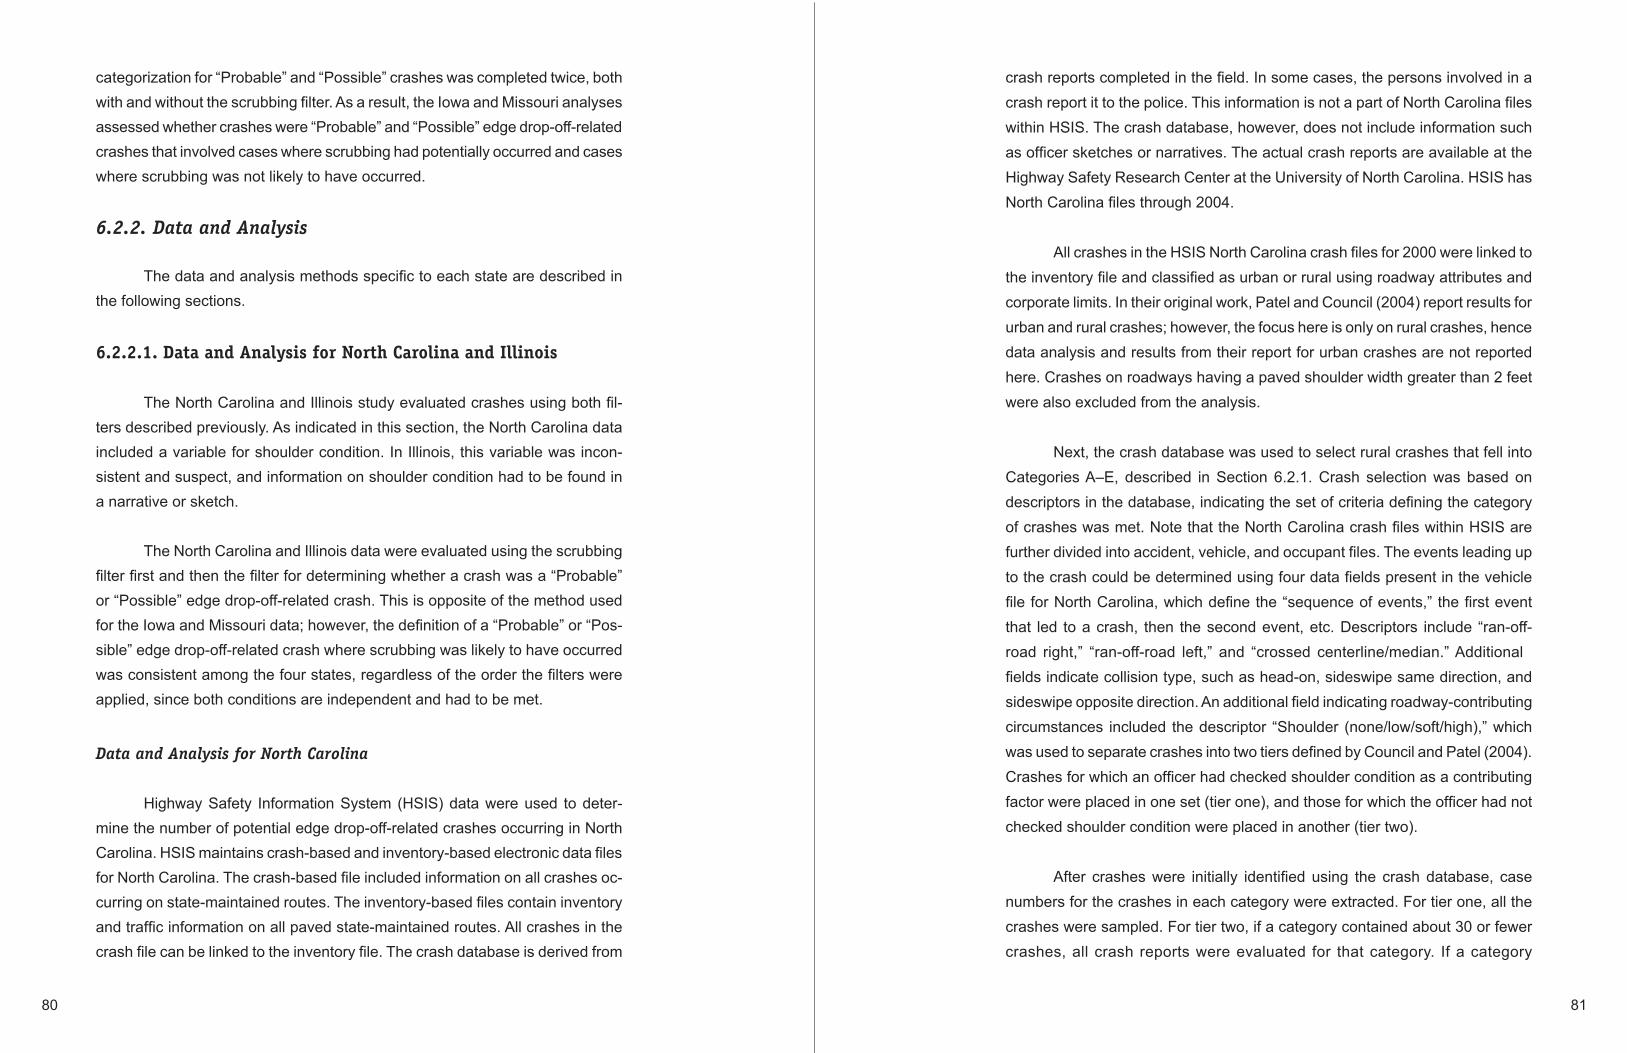
80 81
categorization for “Probable” and “Possible” crashes was completed twice, both with and without the scrubbing filter. As a result, the Iowa and Missouri analyses assessed whether crashes were “Probable” and “Possible” edge drop-off-related crashes that involved cases where scrubbing had potentially occurred and cases where scrubbing was not likely to have occurred.
6.2.2. Data and Analysis
The data and analysis methods specific to each state are described in the following sections.
6.2.2.1. Data and Analysis for North Carolina and Illinois
The North Carolina and Illinois study evaluated crashes using both fil-ters described previously. As indicated in this section, the North Carolina data included a variable for shoulder condition. In Illinois, this variable was incon-sistent and suspect, and information on shoulder condition had to be found in a narrative or sketch.
The North Carolina and Illinois data were evaluated using the scrubbing filter first and then the filter for determining whether a crash was a “Probable” or “Possible” edge drop-off-related crash. This is opposite of the method used for the Iowa and Missouri data; however, the definition of a “Probable” or “Pos-sible” edge drop-off-related crash where scrubbing was likely to have occurred was consistent among the four states, regardless of the order the filters were applied, since both conditions are independent and had to be met.
Data and Analysis for North Carolina
Highway Safety Information System (HSIS) data were used to deter-mine the number of potential edge drop-off-related crashes occurring in North Carolina. HSIS maintains crash-based and inventory-based electronic data files for North Carolina. The crash-based file included information on all crashes oc-curring on state-maintained routes. The inventory-based files contain inventory and traffic information on all paved state-maintained routes. All crashes in the crash file can be linked to the inventory file. The crash database is derived from
crash reports completed in the field. In some cases, the persons involved in a crash report it to the police. This information is not a part of North Carolina files within HSIS. The crash database, however, does not include information such as officer sketches or narratives. The actual crash reports are available at the Highway Safety Research Center at the University of North Carolina. HSIS has North Carolina files through 2004.
All crashes in the HSIS North Carolina crash files for 2000 were linked to the inventory file and classified as urban or rural using roadway attributes and corporate limits. In their original work, Patel and Council (2004) report results for urban and rural crashes; however, the focus here is only on rural crashes, hence data analysis and results from their report for urban crashes are not reported here. Crashes on roadways having a paved shoulder width greater than 2 feet were also excluded from the analysis.
Next, the crash database was used to select rural crashes that fell into Categories A–E, described in Section 6.2.1. Crash selection was based on descriptors in the database, indicating the set of criteria defining the category of crashes was met. Note that the North Carolina crash files within HSIS are further divided into accident, vehicle, and occupant files. The events leading up to the crash could be determined using four data fields present in the vehicle file for North Carolina, which define the “sequence of events,” the first event that led to a crash, then the second event, etc. Descriptors include “ran-off-road right,” “ran-off-road left,” and “crossed centerline/median.” Additional fields indicate collision type, such as head-on, sideswipe same direction, and sideswipe opposite direction. An additional field indicating roadway-contributing circumstances included the descriptor “Shoulder (none/low/soft/high),” which was used to separate crashes into two tiers defined by Council and Patel (2004). Crashes for which an officer had checked shoulder condition as a contributing factor were placed in one set (tier one), and those for which the officer had not checked shoulder condition were placed in another (tier two).
After crashes were initially identified using the crash database, case
numbers for the crashes in each category were extracted. For tier one, all the crashes were sampled. For tier two, if a category contained about 30 or fewer crashes, all crash reports were evaluated for that category. If a category

82 83
contained more than 30 crashes but fewer than 100, a random subset of about 50% was selected and evaluated. For categories containing 100 or more crashes, a random sample of about 1% to 5% were selected and evaluated. A total of 436 crash reports were evaluated for North Carolina. A total of 10,612 crashes fell into Categories A–E.
A summary of the crash narrative and any pertinent information from the crash diagram was recorded for each crash, in case questions arose in the future. The North Carolina data were evaluated using the scrubbing filter first and then the filter for determining whether each crash was a “Probable” or “Possible” edge drop-off related crash, was caused by “Soft” shoulder, was “Not” edge drop-off-related, or was “Unknown” based on the crash diagram and the crash narrative.
Data and Analysis for Illinois
HSIS also has Illinois crash- and inventory-based files, which include all state-maintained routes and crashes on these routes. HSIS doesn’t have actual crash reports, however. The Illinois DOT provided the crash reports for the identified sample. Similar to the North Carolina research, only crashes on roads having unpaved or narrow paved shoulders (less than 2 feet wide) were included in this analysis.
Next, the crash database was used to select rural crashes falling into Categories A–E, described in Section 6.2.1. As in the North Carolina research, Patel and Council (2004) used data for the year 2000. Selection of crashes was based on descriptors in the crash database that indicated the set of criteria de-fining the category of crashes were met. The available categories for the crash descriptors for Illinois did not allow Category B to be defined; therefore, these crashes were included in Category A. As with the North Carolina research, the Illinois crash database within HSIS is further divided into accident, vehicle, and occupant files. The events leading up to the crash could be determined using the involvement and location of involvement data fields in the vehicle file for Illinois, which define the sequence and location of events, respectively. Descrip-tors include “ran-off-road right,” “ran-off-road left,” and “crossed centerline/me-dian.” Additional fields indicate type of collision, such as head-on, sideswipe
same direction, and sideswipe opposite direction. Though the Illinois database had a shoulder quality descriptor, Patel and Council (2004) found the quality of the coding for that variable was questionable. Hence, unlike North Carolina crashes, Illinois crashes were not separated into tiers based on indication of shoulder quality.
After crashes were initially identified using the crash database, the numbers of crashes in each category were extracted. All crash reports were evaluated for categories containing approximately 100 or fewer crashes. If a category contained more than 100 crashes, a random subset of about 1% to 10% was evaluated. In all, 428 crash report forms were reviewed for Illinois. A total of 1,821 crashes fell into Categories A–E.
A summary of the crash narrative and any pertinent information from the crash diagram was recorded for each crash, in case questions arose in the future. Based on this information, each crash was categorized as a “Prob-able” or “Possible” edge drop-off-related crash, “Not” edge drop-off related, or “Unknown.” Then, as in North Carolina, the Illinois data were evaluated using the scrubbing filter first and then the filter for determining whether each crash was a “Probable” or “Possible” edge drop-off-related crash, caused by a “Soft” shoulder, “Not” edge drop-off related, or “Unknown.”
6.2.2.2. Data and Analysis for Iowa
The CTRE research team examined three existing datasets used to estimate the number of potential edge drop-off-related crashes occurring in Iowa. The Iowa DOT maintains an electronic crash database that contains a summary of crash characteristics. All reported crashes occurring in the state on all roadway types are included and spatially located. The crash database is derived from crash reports filled out in the field, but does not include informa-tion such as officer sketches or narratives. At the time of the analysis reported here, the database contained crash data through 2004. The Iowa DOT also maintains electronic copies of crash reports, which provide information, such as officer narratives and diagrams. In some cases, persons involved in a crash also submit personal crash reports. This information is attached to the officer crash reports and is also available. The Iowa DOT also maintains a spatial road

84 85
database, which allows crashes to be spatially located to the nearest roadway. This database allows roadway information, such as roadway surface material or number of lanes, to be determined for each crash in the crash database.
All crashes in the state of Iowa for a three-year study period (2002, 2003, and 2004) were located to the nearest roadway and classified as urban or rural using roadway attributes and a separate file containing corporate limits. Urban crashes were excluded from the analysis. Crashes that occurred on roadways with surfaces other than concrete or asphalt, such as dirt, gravel, and unimproved roads, and crashes on roadways with paved shoulders were also excluded. Al-though the study’s initial focus was rural two-lane roadways, all rural roadways with unpaved shoulders were included to increase the comparability between this study and that of Patel and Council (2004).
Next, the crash database was used to select rural crashes that fell into Categories A–E, described in Section 6.2.1. Selection of crashes was based on descriptors in the crash database that indicated the set of criteria defining the category of crashes were met. Events leading up to the crash were determined using four data fields in the Iowa crash database defining sequence of events, such as the first event that led to a crash, then the second event, etc. Descriptors include “ran-off-road right,” “ran-off-road left,” and “crossed centerline/median.” Additional fields indicate type of collision, such as head-on, sideswipe same direction, and sideswipe opposite direction; location of the first harmful event; and driver-contributing circumstances.
The Iowa crash report also includes a data element allowing the officer to check a box that indicates shoulder conditions as “none/low/soft/high.” The data element, however, does not allow differentiation between the four possible conditions. Crashes for which the officer had checked shoulder condition as a contributing factor were placed in one set (tier one), and those for which the officer had not checked shoulder condition were placed in another (tier two). Council and Patel (2004) also separated their data by a shoulder condition ele-ment and referred to the two sets as tiers.
A total of 4,310 crashes fell into Categories A–E. All categories in tier one and Categories A, B, and D in tier two contained 253 or fewer crashes.
Categories C and E in tier two contained 1,884 or more crashes. As a result, it was determine that this was a good breaking point. If a category has 253 or fewer crashes, all crashes in that category were evaluated. If a category had more than 253 crashes, a random subset of 20% was selected and evaluated. A total of 1,293 crash reports were evaluated for Iowa.
A summary of the crash narrative and any pertinent information from the crash diagram was recorded for each crash, in case questions arose in the future. Each crash was first evaluated using the filter to determine whether the crash was a “Probable” or “Possible” edge drop-off-related crash, “Soft,” “Not” edge drop-off-related, or “Unknown.” Crashes determined to be “Possible” or “Probable” edge drop-off related were further evaluated using the filter for determining whether scrubbing was likely to have occurred: “Potential Scrub-bing,” “Not Scrubbing,” or “Unknown Scrubbing.” The North Carolina and Illinois data were evaluated using the scrubbing filter first and the filter for determining whether the crash was a “Probable” or “Possible” edge drop-off-related crash second. Even though this method is the opposite of that used for the Iowa and Missouri data, the definition of a crash categorized as a “Probable” or “Possible” edge drop-off-related crash where scrubbing was likely to have occurred was consistent among the four states, regardless of the order the filters were applied, since both conditions are independent and had to be met.
6.2.2.3. Data and Analysis for Missouri
The electronic crash database available for Missouri has roadway charac-teristics fields, which were used to select urban versus rural crashes. Only rural crashes on paved roadways with unpaved shoulders were selected. The Missouri crash records also have descriptors allowing up to seven sequences of events to be recorded for each vehicle, such as “ran-off-road right,” “skidding/sliding,” “overturn/rollover,” and “crossover centerline.” The location and type of crash is also indicated. Using this information, rural crashes on paved roadways with unpaved shoulders that fit into each of the five categories were selected. Both two- and four-lane roadways were included. Unlike the crash forms in Illinois, Iowa, and North Carolina, the Missouri crash form does not include a data ele-ment indicating shoulder condition. Thus, Missouri crashes could not be divided into tiers according to whether shoulder condition was indicated.

86 87
Identifiers for crashes in each category were used to extract crash re-ports from the Missouri DOT for the same years as the Iowa analysis: 2002, 2003, and 2004. A total of 2,359 crashes fell into Categories A–E. Categories A to C contained 374 or fewer crashes, and Categories D and E contained 683 or more. This provided a natural breaking point, so all crashes were evaluated for Categories A, B, and C, and a random sample of 20% of the crashes for Categories D and E were extracted and evaluated. A total of 885 crash reports were evaluated for Missouri for all categories.
Each crash was first evaluated using the filter for determining whether the crash was a “Probable” or “Possible” edge drop-off-related crash, “Soft,” “Not” edge drop-off-related, or “Unknown.” Crashes determined to be “Pos-sible” or “Probable” edge drop-off-related crashes were further evaluated using the filter for scrubbing: “Potential Scrubbing,” “Not Scrubbing,” or “Unknown Scrubbing.”
6.2.3. Results
Results for each state are provided in the following sections. As noted, North Carolina and Illinois were evaluated as part of a separate project. As a result, some differences exist in the types of information and amount of detail presented for the four states.
6.2.3.1. Results for North Carolina
Note that the detailed results related to specific numbers of potential cases in each category, the number of cases reviewed, and the number of edge drop-off-related crashes found in the samples reviewed are not presented here (as they will be presented below for Iowa and Missouri). Those details can be obtained from Patel and Council (2004). Instead, presented here are the ex-trapolated results based on this sampling/review methodology. Patel and Council (2004) also present results for urban crashes.
After reviewing the North Carolina sample and extrapolating percentages to the population of potential edge drop-off-related crashes, Patel and Council estimated 28 of the approximately 10,600 crashes in Categories A–E (0.26%),
were probably caused by edge drop-off (“Probable”), and approximately 711 (6.70%) were possibly (“Possible”) caused by edge drop-off.
Finally, to parallel the Illinois estimate of edge drop-off-related crashes as a percentage of total single vehicle (SV) run-off-road crashes (including those SV crashes in which a wider paved shoulder eliminated the possibility of an edge drop-off crash), Patel and Council again used the Category E sample. Based on this sample reviewed, approximately 25 of the 17,777 rural SV run-off-road crashes (0.14%) were “Probable” edge drop-off-related crashes where scrubbing was likely to have occurred, and approximately 460 (2.58%) were “Possible” edge drop-off related where scrubbing was likely to have occurred.
In addition to the above analyses related to crash frequency, an attempt was made to examine the crash severity of edge drop-off crashes and compare it to crash severity distributions for all rural North Carolina crashes in the HSIS system, that is, all crashes on mileposted rural state system roads, as shown in Figure 6-2.
Figure 6-2. Relative frequency of injury outcomes for North Carolina
0.0%
10.0%
20.0%
30.0%
40.0%
50.0%
60.0%
Fatal MajorInjury
MinorInjury
Possible/ Unknown
PropertyDamage
Only
All Rural Crashes
EDO Rural Crashes

88 89
Note in this comparison, distributions for edge drop-off crashes were obtained from the distribution of crashes reviewed and categorized as “Pos-sible” or “Probable” crashes where scrubbing was likely to have occurred. The sample of “Probable” edge drop-off-related crashes is too small for meaningful analysis and was, therefore, combined with “Possible” for this assessment. As indicated, edge drop-off-related crashes were more likely than average to result in fatalities or serious injuries, relative to all rural crashes.
Note that the designation “edge drop-off rural crashes” includes “Prob-able” and “Possible” edge drop-off-related crashes where scrubbing was likely to have occurred. Also note that small sample sizes were present in all cases, so severity distributions shown for edge drop-off-related crashes should be interpreted with caution.
6.2.3.2. Results for Illinois
Again, note that the following results represent the extrapolated results based on the sampling/review methodology used for Illinois and North Carolina. Of the 1,821 crashes in Categories A–E evaluated for Illinois, Patel and Council estimated that two (0.11%) were “Probable” and 114 (6.26%) were “Possible” edge drop-off-related crashes. Based on the Category E sample, for total SV run-off-road crashes, including those in which a wider paved shoulder eliminated the possibility of an edge drop-off crash, about 86 of the 4,543 total SV run-off-road rural crashes (0.89%) were possibly edge drop-off-related. Note that no “Probable” edge drop-off SV run-off-road crashes were found. Clearly, the estimate of “zero” in this category could be due to sampling.
A comparison of crash severity for the edge drop-off-related crashes to total rural and SV run-off-road crashes was also performed for Illinois. Figure 6.3 compares the severity distribution of edge drop-off-related crashes to all rural crashes on similar roadways.
Again, both “Probable” and “Possible” edge drop-off-related crashes were combined due to the small sample sizes for the former category. The designation “edge drop-off rural crashes” includes “Probable” and “Possible” edge drop-off-related crashes where scrubbing was likely to have occurred.
Figure 6-3. Relative frequency of injury outcomes for Illinois
0.0%
10.0%
20.0%
30.0%
40.0%
50.0%
60.0%
70.0%
All Rural Crashes
EDO Rural Crashes
Fatal MajorInjury
MinorInjury
Possible/ Unknown
PropertyDamage
Only
While the small numbers of edge drop-off crashes in both North Carolina
and Illinois indicate caution is necessary in drawing firm conclusions, results
for both states indicate the edge drop-off-related crashes indeed appear to be
more severe than either all rural crashes on similar roadways or all SV run-off-
road crashes.
6.2.3.3. Results for Iowa
Frequency of Edge Drop-off-Related Crashes in Iowa
The results of the crash report analysis for Iowa are provided in Table
6-1. Results are presented for tier one and tier two separately, and then the
combined results are shown at the bottom of the table.

90 91
Table 6-1. Summary of crash record evaluation for 2002–2004 for Iowa
Tier 1 (shoulder condition field marked)
Category Probable Possible Soft Not Unknown Total
A 2 1 0 1 0 4
B 0 1 0 0 0 1
C 12 13 10 10 0 45
D 3 3 1 1 0 8
E 7 9 8 9 1 34
Tier 2 (shoulder condition field not marked)
Category Probable Possible Soft Not Unknown Total
A 5 33 0 77 3 118
B 0 8 1 53 1 63
C 29e
(6 to 53)6*
501e
(417 to 585)101*
20e
(0 to 39)4*
1,261e
(1,170 to 1,350)254*
89e
(49 to 130)18*
1,901(383*
sampled)
D 4 138 6 102 3 253
E20e
(0 to 39)4*
284e
(217 to 352)58*
34e
(9 to 59)7*
1,541e
(1,467 to 1,612)314*
5e
(0 to 15)1*
1,884(384*
sampled)
Total tiers 1 and 2, all categories
Total
Probable Possible Soft Not Unknown Total
82e [1.9%]
991e [23.0%]
80e [1.9%]
3,055e
[70.9%]102e
[2.4%]4,310
Total crashes on rural paved roadways with unpaved shoulders 35,487
Run-off-road crashes on rural paved roads with unpaved shoulders 6,096
“Probable” and “Possible” percentage of rural crashes on similar roadways 24.9%
“Probable” and “Possible” percentage of rural run-off-road crashes on similar roadways
17.7%
e : estimated value() : 95% confidence interval for estimated value* : number of crashes sampled
Tier one indicates shoulder condition was noted in the corresponding crash report field. All crashes in the categories in tier one and Categories A, B, and D in tier two were evaluated. Approximately 20% of crashes in Categories C and E in tier two were evaluated, as discussed previously, and those results were extrapolated to estimate crash types for all crashes in that category using a multinomial distribution (Mendenhall and Sincich 1988). In Table 6-1, the results for tier two, Categories C and E, show the estimated number of crashes, the 95% confidence interval for that estimation, and finally the actual number of crashes
sampled. In Category C in tier two, for example, 383 out of 1,091 crashes were evaluated. Of those, 101 were determined to be “Possible” edge drop-off-related crashes. The total number of “Possible” crashes was extrapolated to 501 out of 1,091 total crashes. The 95% confidence interval for “Possible” crashes was 417 to 585 crashes.
The total number of crashes for each category was summarized by type and presented at the bottom of the table. A total of 4,310 crashes fell into Categories A–E in both tier one and tier two. As shown, 82 rural crashes from 2002–2004 were highly likely to have been edge drop-off related (“Probable”). Another 991 crashes were “Possible” edge drop-off-related crashes. “Probable” edge drop-off-related crashes comprised 1.9% of the 4,310 crashes evaluated, and “Possible” comprised 23%.
A total of 35,487 rural crashes occurred in Iowa on paved asphalt or con-crete roadways with unpaved shoulders for 2002–2004. Dividing the number of “Probable” and “Possible” crashes by the total number of rural crashes indicates that 0.23% of rural crashes on similar roadways are “Probable,” and 2.79% are “Possible” edge drop-off-related crashes.
Edge drop-off-related crashes are run-off-road crashes. The contribution of edge drop-off to run-off-road crashes was also calculated. In Iowa, a total of 6,096 crashes occurred from 2002–2004 on similar roadways in which the first sequence of events was coded as “run-off-road right” or “run-off-road left.” “Prob-able” crashes accounted for 1.46% of these, and “Possible” made up 16.26% of all rural run-off-road crashes on similar roadways.
Crashes determined to be “Probable” and “Possible” edge drop-off-re-lated crashes were further evaluated to determine whether scrubbing was likely to have occurred using the filter described in Section 6.2.1. Results are shown in Table 6-2. Totals are shown separately for tiers one and two. As shown, the number of crashes where scrubbing was likely to have occurred was extrapo-lated for Categories C and E in tier two. In addition, a total of 42 “Probable” and 375 “Possible” crashes were identified for which scrubbing was likely to have occurred. This represents 1.0% and 8.7% of crashes in Categories A–E and 0.12% and 1.04%, respectively, of total rural crashes on paved roadways with unpaved shoulders in Iowa.
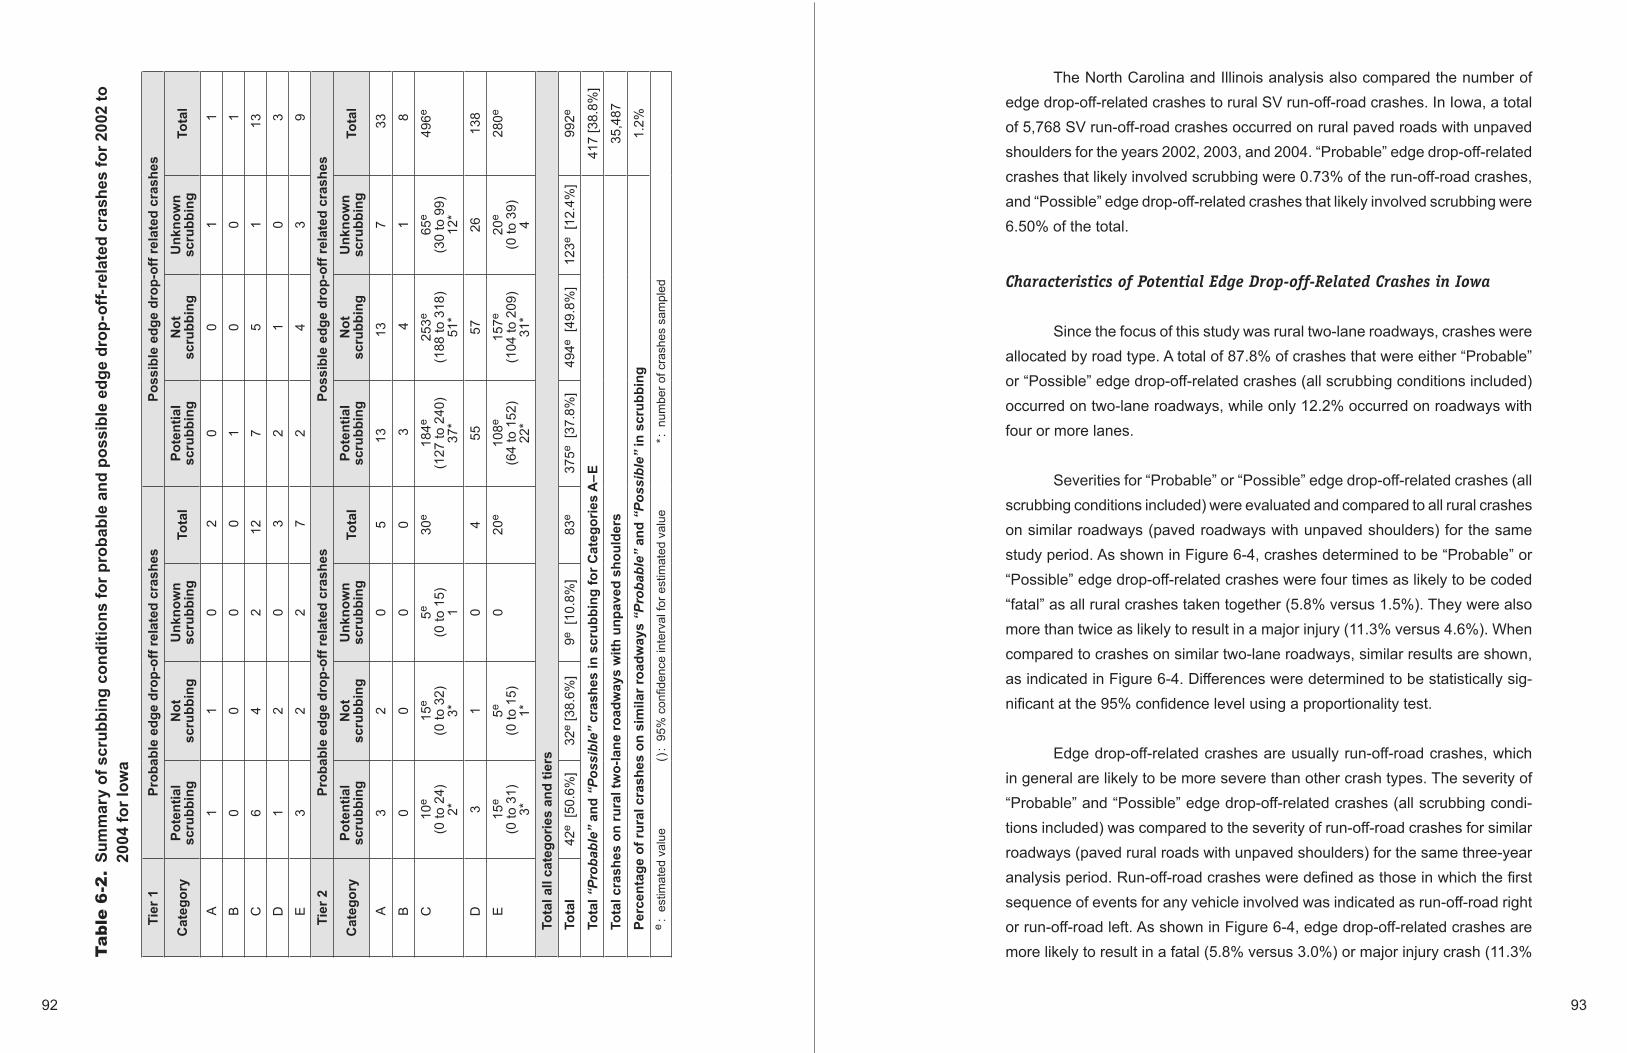
92 93
Ta
ble
6-2
. Su
mm
ary
of s
crub
bing
con
ditio
ns fo
r pro
babl
e an
d po
ssib
le e
dge
drop
-off-
rela
ted
cras
hes
for 2
002
to
20
04 fo
r Iow
a
Tier
1Pr
obab
le e
dge
drop
-off
rela
ted
cras
hes
Poss
ible
edg
e dr
op-o
ff re
late
d cr
ashe
s
Cat
egor
yPo
tent
ial
scru
bbin
gN
ot
scru
bbin
gU
nkno
wn
scru
bbin
gTo
tal
Pote
ntia
lsc
rubb
ing
Not
sc
rubb
ing
Unk
now
nsc
rubb
ing
Tota
l
A1
10
20
01
1
B0
00
01
00
1
C6
42
127
51
13
D1
20
32
10
3
E3
22
72
43
9
Tier
2Pr
obab
le e
dge
drop
-off
rela
ted
cras
hes
Poss
ible
edg
e dr
op-o
ff re
late
d cr
ashe
s
Cat
egor
yPo
tent
ial
scru
bbin
gN
ot
scru
bbin
gU
nkno
wn
scru
bbin
gTo
tal
Pote
ntia
lsc
rubb
ing
Not
sc
rubb
ing
Unk
now
nsc
rubb
ing
Tota
l
A3
20
513
137
33
B0
00
03
41
8
C10
e(0
to 2
4)2*
15e
(0 to
32)
3*
5e(0
to 1
5)1
30e
184e
(127
to 2
40)
37*
253e
(188
to 3
18)
51*
65e
(30
to 9
9)12
*
496e
D3
10
455
5726
138
E15
e(0
to 3
1)3*
5e(0
to 1
5)1*
020
e10
8e(6
4 to
152
)22
*
157e
(104
to 2
09)
31*
20e
(0 to
39)
4
280e
Tota
l all
cate
gorie
s an
d tie
rsTo
tal
42e
[50.
6%]
32e
[38.
6%]
9e [
10.8
%]
83e
375e
[37
.8%
]49
4e [
49.8
%]
123e
[12
.4%
]99
2e
Tota
l “Prob
able”
and “Possible”
cra
shes
in s
crub
bing
for C
ateg
orie
s A
–E41
7 [3
8.8%
]
Tota
l cra
shes
on
rura
l tw
o-la
ne ro
adw
ays
with
unp
aved
sho
ulde
rs35
,487
Perc
enta
ge o
f rur
al c
rash
es o
n si
mila
r roa
dway
s “Probable”
and
“Po
ssible”
in s
crub
bing
1.2%
e :
estim
ated
val
ue
(
) : 9
5% c
onfid
ence
inte
rval
for e
stim
ated
val
ue
*
: n
umbe
r of c
rash
es s
ampl
ed
The North Carolina and Illinois analysis also compared the number of edge drop-off-related crashes to rural SV run-off-road crashes. In Iowa, a total of 5,768 SV run-off-road crashes occurred on rural paved roads with unpaved shoulders for the years 2002, 2003, and 2004. “Probable” edge drop-off-related crashes that likely involved scrubbing were 0.73% of the run-off-road crashes, and “Possible” edge drop-off-related crashes that likely involved scrubbing were 6.50% of the total.
Characteristics of Potential Edge Drop-off-Related Crashes in Iowa
Since the focus of this study was rural two-lane roadways, crashes were allocated by road type. A total of 87.8% of crashes that were either “Probable” or “Possible” edge drop-off-related crashes (all scrubbing conditions included) occurred on two-lane roadways, while only 12.2% occurred on roadways with four or more lanes.
Severities for “Probable” or “Possible” edge drop-off-related crashes (all scrubbing conditions included) were evaluated and compared to all rural crashes on similar roadways (paved roadways with unpaved shoulders) for the same study period. As shown in Figure 6-4, crashes determined to be “Probable” or “Possible” edge drop-off-related crashes were four times as likely to be coded “fatal” as all rural crashes taken together (5.8% versus 1.5%). They were also more than twice as likely to result in a major injury (11.3% versus 4.6%). When compared to crashes on similar two-lane roadways, similar results are shown, as indicated in Figure 6-4. Differences were determined to be statistically sig-nificant at the 95% confidence level using a proportionality test.
Edge drop-off-related crashes are usually run-off-road crashes, which in general are likely to be more severe than other crash types. The severity of “Probable” and “Possible” edge drop-off-related crashes (all scrubbing condi-tions included) was compared to the severity of run-off-road crashes for similar roadways (paved rural roads with unpaved shoulders) for the same three-year analysis period. Run-off-road crashes were defined as those in which the first sequence of events for any vehicle involved was indicated as run-off-road right or run-off-road left. As shown in Figure 6-4, edge drop-off-related crashes are more likely to result in a fatal (5.8% versus 3.0%) or major injury crash (11.3%

94 95
Figure 6-4. Relative frequency of injury outcomes for Iowa
0.0%
10.0%
20.0%
30.0%
40.0%
50.0%
60.0%
70.0%
Fatal Major Injury Minor Injury Possible/Unknown Property DamageOnly
All RuralAll Rural 2-laneAll Rural RORProbable/Possible
versus 9.6%) than other run-off-road crashes. Differences were statistically significant at the 95% confidence level for fatal crashes, but not for major injury crashes, using a test of proportionality. It should be noted that fatal crashes are rare and comprise only a small proportion of any crash type. As a result, some caution is necessary in drawing firm conclusions.
Table 6-3. “Probable” and “Possible” edge drop-off-related crashes by crash description in Iowa
Type
Run-off-road right; cross centerline; run-off-road left 49.8%
Run-off-road right; lost control on shoulder 25.4%
Run-off-road right; cross centerline; sideswipe opposite direction 7.1%
Run-off-road right; return to road; run-off-road right 7.1%
Run-off-road right; cross centerline; head-on 4.4%
Run-off-road right; cross centerline; rolled in opposite lane 3.0%
Run-off-road right; sideswipe same direction 2.0%
Run-off-road right; run-off-road left; run-off-road right 0.5%
Run-off-road right; cross centerline; rear end 0.5%
Unknown 0.2%
The sequence of actions leading to each “Probable” or “Possible” edge drop-off-related crash (all scrubbing conditions included) was also evaluated. A total of 64.3% of “Probable” and “Possible” crashes were classified as what is typically thought of as an edge drop-off crash, in which the vehicle runs off the road to the right, the driver overcorrects, the vehicle crosses the centerline, and then some other action occurs, such as a head-on collision, sideswipe same direction, or run-off-road left. Crashes were summarized by sequence of actions leading to the crash, as shown in Table 6-3.
6.2.3.4. Results for Missouri
Frequency of Edge Drop-off-Related Crashes in Missouri
The results of the Missouri crash report analysis are provided in Table 6-4.
Table 6-4. Summary of crash record evaluation for 2002 to 2004 for Missouri
Category Probable Possible Soft Not Unknown Total
A 2 42 3 16 0 63
B 0 8 1 17 2 28
C 9 192 20 153 0 374
D 9e (0 to 21)ci
2*
437e (385 to 488)ci
101*
43e (17 to 69)ci
10*
195e (147 to 243)ci
45*
0 683
E 50e (21 to 80)ci
11*
231e (173 to 288)ci
50*
51e
(21 to 80)ci
11*
864e
(798 to 931)ci
187*
14e
(0 to 30)ci
3*
1,211
Total 70e [3.0%]
910e [38.6%]
118e [5.0%]
1,245e [52.8%]
16e [0.7%]
2,359
Total crashes on rural paved roadways with unpaved shoulders 55,012
Run-off-road crashes on rural paved roads with unpaved shoulders 3,966
“Probable” and “Possible” percentage of rural crashes on similar roadways 1.78%
“Probable” and “Possible” percentage of rural run-off-road crashes on similar roadways
24.71%
e : estimated ci : 95% confidence interval * : sampled
All crash records were evaluated for Categories A, B, and C. A random sample of approximately 20% were evaluated for Categories D and E. Results from the random sample for a category were extrapolated to estimate types of
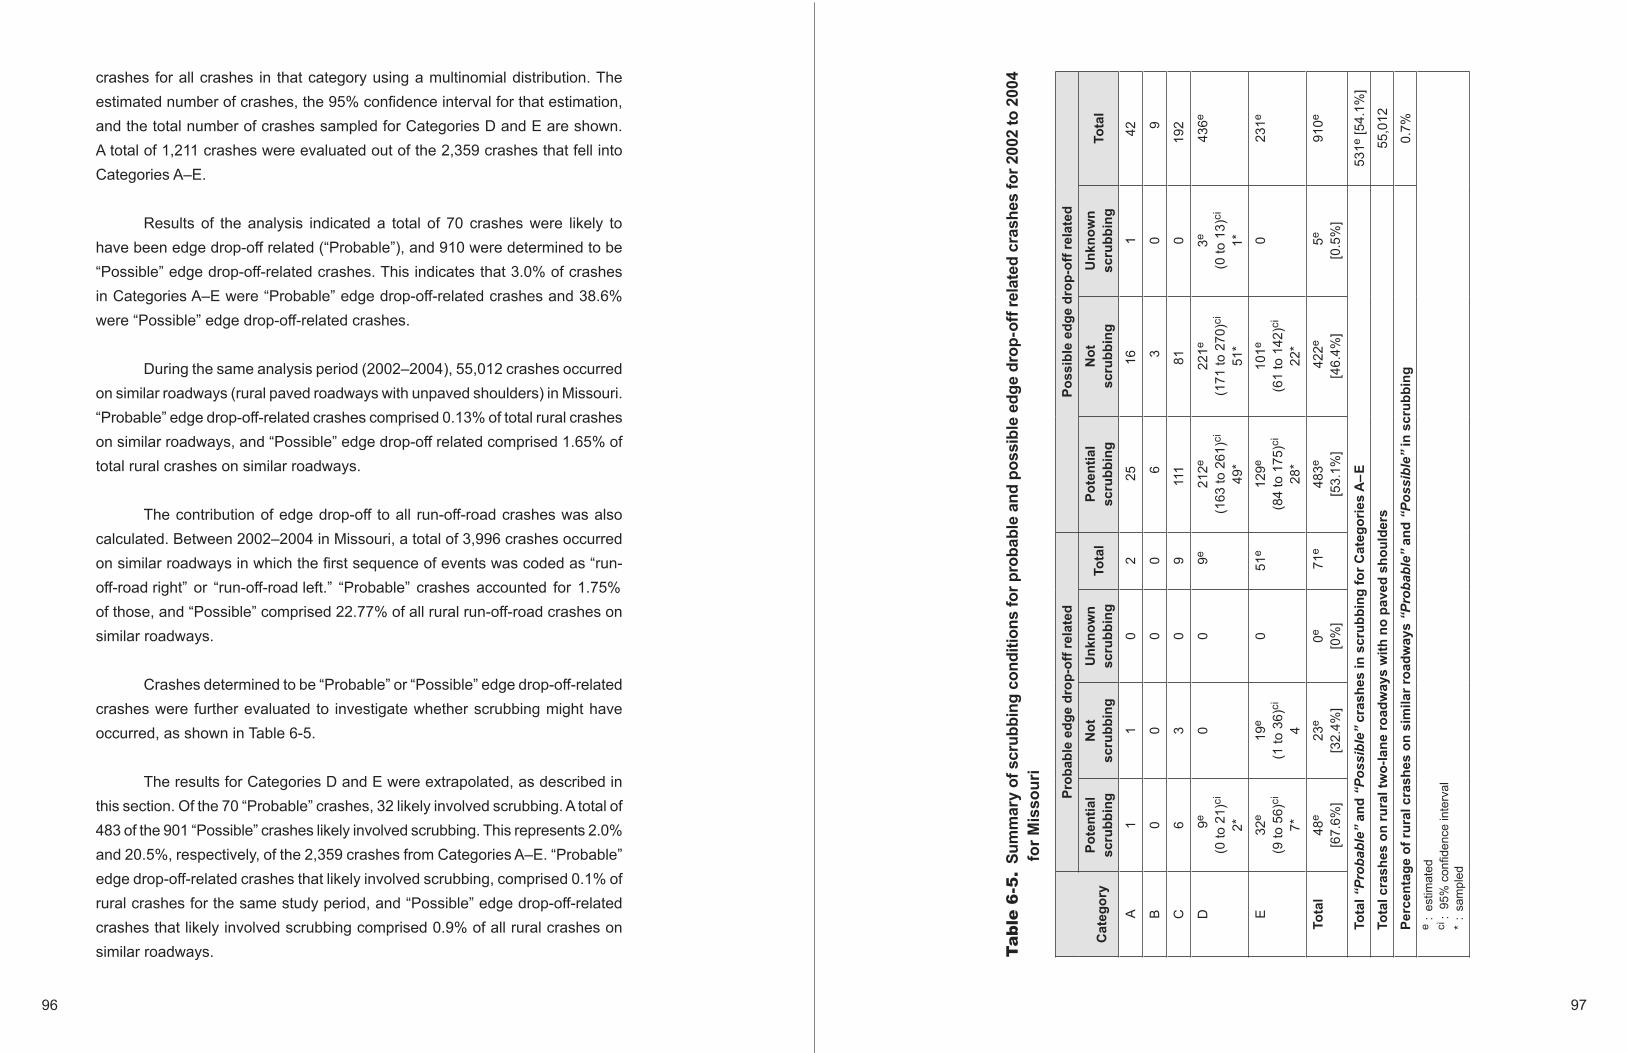
96 97
crashes for all crashes in that category using a multinomial distribution. The estimated number of crashes, the 95% confidence interval for that estimation, and the total number of crashes sampled for Categories D and E are shown. A total of 1,211 crashes were evaluated out of the 2,359 crashes that fell into Categories A–E.
Results of the analysis indicated a total of 70 crashes were likely to have been edge drop-off related (“Probable”), and 910 were determined to be “Possible” edge drop-off-related crashes. This indicates that 3.0% of crashes in Categories A–E were “Probable” edge drop-off-related crashes and 38.6% were “Possible” edge drop-off-related crashes.
During the same analysis period (2002–2004), 55,012 crashes occurred on similar roadways (rural paved roadways with unpaved shoulders) in Missouri. “Probable” edge drop-off-related crashes comprised 0.13% of total rural crashes on similar roadways, and “Possible” edge drop-off related comprised 1.65% of total rural crashes on similar roadways.
The contribution of edge drop-off to all run-off-road crashes was also calculated. Between 2002–2004 in Missouri, a total of 3,996 crashes occurred on similar roadways in which the first sequence of events was coded as “run-off-road right” or “run-off-road left.” “Probable” crashes accounted for 1.75% of those, and “Possible” comprised 22.77% of all rural run-off-road crashes on similar roadways.
Crashes determined to be “Probable” or “Possible” edge drop-off-related crashes were further evaluated to investigate whether scrubbing might have occurred, as shown in Table 6-5.
The results for Categories D and E were extrapolated, as described in this section. Of the 70 “Probable” crashes, 32 likely involved scrubbing. A total of 483 of the 901 “Possible” crashes likely involved scrubbing. This represents 2.0% and 20.5%, respectively, of the 2,359 crashes from Categories A–E. “Probable” edge drop-off-related crashes that likely involved scrubbing, comprised 0.1% of rural crashes for the same study period, and “Possible” edge drop-off-related crashes that likely involved scrubbing comprised 0.9% of all rural crashes on similar roadways. T
able
6-5
. Su
mm
ary
of s
crub
bing
con
ditio
ns fo
r pro
babl
e an
d po
ssib
le e
dge
drop
-off
rela
ted
cras
hes
for 2
002
to 2
004
fo
r Mis
sour
i
Cat
egor
y
Prob
able
edg
e dr
op-o
ff re
late
dPo
ssib
le e
dge
drop
-off
rela
ted
Pote
ntia
l sc
rubb
ing
Not
sc
rubb
ing
Unk
now
n sc
rubb
ing
Tota
lPo
tent
ial
scru
bbin
gN
ot
scru
bbin
gU
nkno
wn
scru
bbin
gTo
tal
A1
10
225
161
42
B0
00
06
30
9
C6
30
911
181
019
2
D9e
(0 to
21)
ci
2*
00
9e21
2e(1
63 to
261
)ci
49*
221e
(171
to 2
70)c
i
51*
3e(0
to 1
3)ci
1*
436e
E32
e
(9 to
56)
ci
7*
19e
(1 to
36)
ci
4
051
e12
9e(8
4 to
175
)ci
28*
101e
(61
to 1
42)c
i
22*
023
1e
Tota
l48
e
[67.
6%]
23e
[32.
4%]
0e
[0%
] 7
1e48
3e[5
3.1%
] 4
22e
[46.
4%]
5e
[0.5
%]
910e
Tota
l “Prob
able”
and “Possible”
cra
shes
in s
crub
bing
for C
ateg
orie
s A
–E53
1e [5
4.1%
]
Tota
l cra
shes
on
rura
l tw
o-la
ne ro
adw
ays
with
no
pave
d sh
ould
ers
55,0
12
Perc
enta
ge o
f rur
al c
rash
es o
n si
mila
r roa
dway
s “Probable”
and
“Po
ssible”
in s
crub
bing
0.7%
e :
estim
ated
ci :
95%
con
fiden
ce in
terv
al
* :
sam
pled

98 99
The North Carolina and Illinois analysis also compared the number of edge drop-off-related crashes to rural SV run-off-road crashes. In Missouri, a total of 3,884 SV run-off-road crashes occurred on rural paved roads with unpaved shoulders for the years 2002, 2003, and 2004. “Probable” edge drop-off-related crashes that likely involved scrubbing were 1.24% of the total, and “Possible” edge drop-off-related crashes that likely involved scrubbing were 12.44% when compared to SV run-off-road crashes.
Characteristics of Potential Edge Drop-off-Related Crashes in Missouri
Only 3.1% of the crashes determined to be “Probable” or “Possible” edge drop-off-related crashes (all scrubbing conditions included) in Missouri occurred on four-lane roadways; 96.9% occurred on two-lane roads.
Fatal crashes comprised 4.0% of the crashes determined to be “Probable” or “Possible” edge drop-off-related crashes (all scrubbing conditions included), and injury crashes accounted for 54.5%. The Missouri data did not distinguish between injury crash types. This figure is compared against crash severity for all rural crash-es on similar roadways (rural paved roads with unpaved shoulders) in Figure 6-5.
Figure 6-5. Relative frequency of injury outcomes for Missouri
-5.0%
5.0%
15.0%
25.0%
35.0%
45.0%
55.0%
65.0%
75.0%
Fatal Injury PDO
All RuralAll Rural 2-laneAll Rural RORProbable/Possible
Crashes determined to be “Probable” or “Possible” edge drop-off-related crashes were more than twice as likely to result in a fatal crash as a typical crash on similar roadways (4.0% versus 1.9%) and somewhat more likely to result in an injury crash (54.5% versus 37.3%). When limiting the analysis to crashes occur-ring on rural two-lane roads with unpaved shoulders, similar results were found. All of these differences were statistically significant at the 95% confidence level.
Since edge drop-off crashes are run-off-road crashes, which are more likely to be severe, fatal and injury crashes for “Probable” and “Possible” edge drop-off-related crashes (all scrubbing conditions included) were compared to all run-off-road crashes on similar roadways in Missouri. Run-off-road crashes were defined as those in which the first event for any vehicle involved in the crash was coded as “run-off-road right” or “run-off-road left.” The percentage of fatal “Probable” and “Possible” edge drop-off-related crashes was slightly greater than the percentage of all fatal run-off-road crashes on rural paved roadways with unpaved shoulders (4.0% versus 3.7%). This difference, however, was not statistically significant at the 95% confidence level. A slightly greater percentage of “Probable” and “Possible” edge drop-off-related crashes resulted in an injury than for all run-off-road crashes on rural paved roadways with unpaved shoulders (55.5% versus 54.5%), but this difference was not statistically significant.
6.2.4. Summary and Discussion of Crash Report Analysis
These analyses produced estimates of edge drop-off-related crashes for four different states. In all states, even though the numbers of such crashes are rel-atively smaller than other crash types, they are still large enough to warrant atten-tion and treatment. The following sections compare the results from the four states.
6.2.4.1. Summary of Frequency of Edge Drop-off-Related Crashes
Comparisons between the four states cannot be based on the actual edge drop-off frequencies estimated or on the percentages of the sampled popula-tions because differences existed between variables on the crash forms, the numbers of cases in each category, and the numbers of cases reviewed in the different studies. A better comparison is the estimated percentages of total edge drop-off-related rural crashes in each state and the percentages of total SV run-off-road crashes that are edge drop-off related. Table 6-6 presents both results for the sampled populations in each state and results for the total rural crashes.

100 101
Ta
ble
6-6
. C
ompa
rison
of r
esul
ts fo
r fou
r sta
tes
N
C ru
ral
cras
hes
IL ru
ral
cras
hes
IA ru
ral
cras
hes
MO
rura
lcr
ashe
s
Tota
l cra
shes
on
sim
ilar r
oads
58,0
00(s
tate
-sys
tem
)20
,000
(sta
te-s
yste
m)
35,4
87(a
ll ru
ral)
55,0
12(a
ll ru
ral)
Sam
ple
popu
latio
n of
tota
l cra
shes
in C
ateg
orie
s A
–E
10,6
121,
821
4,31
02,
359
“Pro
babl
e” E
DO
rela
ted
(pot
entia
l scr
ubbi
ng)e
of s
ampl
e po
pula
tion
0.26
%0.
11%
0.97
%2.
03%
“Pos
sibl
e” E
DO
rela
ted
(pot
entia
l scr
ubbi
ng)e
of s
ampl
e po
pula
tion
6.78
%6.
26%
8.70
%20
.47%
“Pro
babl
e” E
DO
rela
ted
(pot
entia
l scr
ubbi
ng)e
of t
otal
rura
l cra
shes
on
sim
ilar r
oadw
ays
0.05
%(s
tate
sys
tem
)0.
01%
(sta
te s
yste
m)
0.12
%0.
09%
“Pos
sibl
e” E
DO
rela
ted
(pot
entia
l scr
ubbi
ng)e
of t
otal
rura
l cra
shes
on
sim
ilar r
oadw
ays
1.24
%(s
tate
sys
tem
)0.
57%
(sta
te s
yste
m)
1.06
%(a
ll ru
ral)
0.88
%(a
ll ru
ral)
“Pro
babl
e” E
DO
rela
ted
(all
scru
bbin
g co
nditi
ons
incl
uded
)e o
f tot
al
rura
l cra
shes
on
sim
ilar r
oadw
ays
NA
NA
0.23
%(a
ll ru
ral)
0.13
%(a
ll ru
ral)
“Pos
sibl
e” E
DO
rela
ted
(all
scru
bbin
g co
nditi
ons
incl
uded
)e o
f tot
al
rura
l cra
shes
on
sim
ilar r
oadw
ays
NA
NA
2.79
%(a
ll ru
ral)
1.65
%(a
ll ru
ral)
“Pro
babl
e” E
DO
rela
ted
(pot
entia
l scr
ubbi
ng)e
of t
otal
SV
RO
R
cras
hes
on s
imila
r roa
dway
s*0.
14%
(sta
te s
yste
m)
0%(s
tate
sys
tem
)0.
7%(a
ll ru
ral)
1.24
%(a
ll ru
ral)
“Pos
sibl
e” E
DO
rela
ted
(pot
entia
l scr
ubbi
ng)e
of t
otal
SV
RO
R
cras
hes
on s
imila
r roa
dway
s*2.
58%
(sta
te s
yste
m)
1.89
%(s
tate
sys
tem
)6.
5%(a
ll ru
ral)
12.4
4%(a
ll ru
ral)
“Pro
babl
e” E
DO
rela
ted
(all
scru
bbin
g co
nditi
ons
incl
uded
)e o
f tot
al
rura
l RO
R c
rash
es o
n si
mila
r roa
dway
sN
AN
A1.
46%
(all
rura
l) 1.
75%
(a
ll ru
ral)
“Pos
sibl
e” E
DO
rela
ted
(all
scru
bbin
g co
nditi
ons
incl
uded
)e o
f tot
al
rura
l cra
shes
on
sim
ilar r
oadw
ays
NA
NA
16.2
6%(a
ll ru
ral)
22.7
7%(a
ll ru
ral)
e :
estim
ated
val
ue
N
A:
not c
alcu
late
d
S
VR
OR
: si
ngle
veh
icle
run-
off-r
oad
RO
R:
all r
un-o
ff-ro
ad*n
ote
that
this
val
ue is
exp
ress
ed a
s a
perc
enta
ge o
f all S
VR
OR
cra
shes
that
occ
urre
d on
sim
ilar r
oadw
ays;
ED
O c
rash
es w
ere
both
sin
gle
and
mul
tiple
veh
icle
cra
shes
As noted, the North Carolina and Illinois analyses were performed on rural state system paved roads with narrow or no paved shoulders, while the Iowa and Missouri analyses included all rural paved roads with unpaved shoulders (both state and non-state system roads).
As expected, analyses in all four states produced relatively low edge drop-off-related percentages of total crashes. “Probable” edge drop-off-related crashes likely to involve scrubbing comprised less than 1%, and “Possible” edge drop-off-related crashes likely to involve scrubbing comprised less than 1.5% of rural crashes on similar roadways. Differences existed, however, between the estimates for the four states. As demonstrated, both Iowa and Missouri had a higher percentage of both “Probable” edge drop-off-related crashes likely to involve scrubbing as a percentage of rural crashes on similar roads than either North Carolina or Illinois. North Carolina had the highest number of “Possible” edge drop-off-related crashes, followed by Iowa. Differences in the percentages of “Probable” crashes as a function of all rural crashes were statistically different at the 95% confidence level in all states, except between Iowa and Missouri, and differences for “Possible” crashes were statistically different at the 95% confidence level in all states.
In comparing the percentage of SV run-off-road crashes that were edge drop-off related, percentages for “Probable” edge drop-off crashes were highest in Iowa, followed by Missouri. Differences between the corresponding percent-ages in each state were statistically significant at the 95% confidence level in all cases. Percentages for “Possible” edge drop-off crashes were highest in Missouri, followed by Iowa. Differences in this percentage were not statistically significant at the 95% confidence level when comparing North Carolina and Iowa or when comparing Iowa and Missouri; all others were statistically significant.
When compared within rural categories, North Carolina estimates of the percentages of total HSIS crashes and percentages of total SV run-off-road crashes were much higher than Illinois estimates. The “Probable” and ”Possible” edge drop-off percentage of total rural crashes, for example, was 0.01% and 0.57%, compared to the similar North Carolina estimates of 0.05% and 1.24%, which were three to five times higher than the Illinois percentages. While the SV run-off-road estimated percentages were more similar for the two states,
102 103
the North Carolina estimates were again higher. Clearly, this difference was not just the result of different percentages of rural crashes in the HSIS files for the two states. The different percentages would appear either to represent that the potential for edge drop-off crashes in the two states was different or that the reporting by police was different. Also, the lower estimates in Illinois could be because, in making the judgment on edge drop-off-related crashes, Patel and Council had no information on whether a possible shoulder defect was present. This was not the case in North Carolina and could have affected the judgment made. (Again, note these large relative differences were for very small percent-ages, 1% or less.)
“Possible” and “Probable” crashes without considering whether scrub-bing had occurred were also analyzed and presented for Iowa and Missouri. Iowa has a much higher and statistically significant percentage of crashes (95% confidence interval) as a function of all rural crashes on similar roads than Mis-souri for both categories.
Since edge drop-off-related crashes are run-off-road crashes, which in general are more severe than other crash types, the percentages of all run-off-road crashes on similar roadways that were edge drop-off-related were also cal-culated and are presented for Iowa and Missouri. “Probable” crashes comprised 1.46% of all rural run-off-road crashes on similar roads for Iowa and 1.75% for Missouri (differences are not statistically different at the 95% confidence level). “Possible” crashes comprised 16.26% of all run-off-road crashes on similar roads in Iowa and 22.77% in Missouri, and the differences are statistically significant at the 95% confidence level.
6.2.4.2. Discussion of Differences Among States
Differences among estimates provided in the previous section may have resulted from the way crashes were evaluated in this study compared with the North Carolina and Illinois study. Differences also result from the ways differ-ent states report crashes and train officers, which can even vary by jurisdiction within states. Every attempt was made to extract similar data from each state and ensure that use of terms and data queries were consistent. Differences do exist, however, in road and crashes databases.
Differences in number of drop-off related crashes may also be attrib-uted to different design and maintenance policies. Iowa, for example, did not have a paved shoulder policy for major non-interstate roads until recently. As a result, most rural roadways, even on expressways, have unpaved shoulders. This practice differs from most states, which require paved shoulders to dif-fering levels on higher classification and higher volume roadways. In addition, the North Carolina and Illinois study only evaluated crashes on the state road system. The Iowa and Missouri analyses evaluated crashes for all rural paved roads, including both county and state roads. County roads are typically lower volume roads that may be designed and maintained at different levels than higher volume roads. The designation of the roads included in the state system also varies from state to state.
Dixon et al. (2005) evaluated fatal crashes for Georgia for 1997. The authors randomly selected 150 two-lane rural fatal crashes on state and non-state system roads. They estimated in 38 of the 69 (55%) non-state system fatal crashes, edge rutting or edge drop-off was present. They also determined that of the 38 sites where drop-off was present, edge drop-off appeared to be one of the crash causal factors for 21 of the sites. The study indicated that drop-off was from 2.5 to 5 inches on the rural highway edges (Georgia Tech 2004). The results also indicated that edge drop-off was more likely to be present on non-state system roads. As a result, differences in evaluating state and non-state system roads were expected.
6.2.4.3. Severity of Edge Drop-off-Related Crashes
Severity for “Probable” and “Possible” edge drop-off crashes was evalu-ated and compared to all rural crashes on similar roadways (paved roadways with unpaved shoulders) for the four states. North Carolina and Illinois crashes represented only those likely to involve scrubbing, while crash severity in Iowa and Missouri was calculated without filtering for scrubbing. Additionally, as noted, Illinois and North Carolina crashes were on state system roads with narrow paved or unpaved shoulders, while Iowa and Missouri crashes were evaluated for all rural paved roadways with unpaved shoulders. In all cases, crashes determined to be “Probable” or “Possible” edge drop-off-related crashes were more likely to be coded as fatal than all rural crashes on similar roadways. The proportion of “Probable” and “Possible” injury crashes were also higher for all states.

104 105
Edge drop-off-related crashes are usually run-off-road crashes, which in general are more likely to be severe than other crash types. The severity of “Probable” and “Possible” edge drop-off-related crashes (all scrubbing condi-tions included) was compared to the severity of run-off-road crashes for similar roadways in Iowa and Missouri. “Probable” and “Possible” edge drop-off-related crashes were again more likely to result in a fatal crash than other run-off-road crashes. Differences were statistically significant at the 95% confidence level in Iowa but not in Missouri. Additionally, edge drop-off-related crashes in Iowa were slightly more likely to be fatal in Iowa than in Missouri (5.8% versus 4.0%), and this difference was statistically significant at the 95% confidence level.
Relationship of Crashes to Roadway and Edge Drop-off Characteristics
This chapter assesses the relationship between roadway characteristics,
including the amount and type of drop-off, and the number of crashes character-
istic of pavement edge drop-off-related crashes for Iowa and Missouri. Negative
binomial regression was used to develop the relationship. The frequency of
potential edge drop-off-related crashes was the predictor variable, and roadway
characteristics were explanatory variables.
As a point of clarification for the entire report, the analysis discussed in
Chapter 7 differs from the analysis of crash forms presented in Section 6.2. The
crashes used in the analysis described in this section included any crashes from
2002–2004 that had the characteristics of a pavement edge drop-off crash as
defined by Categories A–E. The crash reports for individual crashes used in the
regression analysis were not evaluated to determine whether edge drop-off was
a contributing factor based on officer narratives, as was done for the analysis
in Section 6.2.
7.1. Data
The roadway segments examined during the sampling process in Chapter
4 were used as study segments for the regression analysis. Several original
segments were omitted when data were missing or crashes could not be at-
tributed to that segment. A total of 140 segments were available for Iowa and a
total of 54 were evaluated for Missouri. Road segments were at least 2.0 miles
long in Iowa. In Missouri, two segments were less than 1.0 mile and two seg-
ments were 1.5 miles. All other segments were at least 2.0 miles. For segments
researched during data collection, road characteristics used as explanatory
variables included the following:

106 107
Annual average daily traffic (AADT)
Edge type (as a categorical variable) in the Iowa analysis. This variable was not used in the Missouri analysis because all pavement segments were asphalt with edge shape B.
Fraction of drop-off measurements above a given height:
– For Iowa, this included ≥ 2.0 inches; ≥ 2.25 inches; ≥ 2.5 inches; ≥ 3.0 inches; and ≥ 3.5 inches.
– For Missouri, this included ≥ 2.0 inches; ≥ 2.5 inches; and ≥ 3.0 inches
Fraction of drop-off measurements within a given height interval: 2.0 to < 2.5 inches, and 2.5 to < 3.0 inches
Shoulder width (feet)
Lane width (feet)
Segment length (miles), used as an offset value to account for segments of differing length
All roadways were two-lane paved roadways with unpaved shoulders. The speed limit on most of the roads was 55 to 60 mph. The range of values for each variable is shown in Table 7-1 for Iowa and in Table 7-2 for Missouri. A more in-depth discussion of the collection of roadway characteristics is provided in Chapter 4.
The frequency of potential edge drop-off-related crashes was the predic-tor variable. A potential edge drop-off-related crash falls into Categories A–E based on the analysis methodology by Patel and Council (2004), described in Section 6.2. Categories A–E describe crashes with sequences of events in which pavement edge drop-off is a factor. All crashes that fit the criteria of one of the categories were included as crashes that were potentially pavement edge drop-off related. The sequence of events included in each of the Categories A–E are as follows:
•
•
•
•
•
•
•
Table 7-1. Range of values used in regression model for Iowa
Variable Description Min. value Max. value
AADT Annual average daily traffic (vehicles per day) 220 5,300
EdgeType Shape of drop-off face A, B, and squashed wedge as described in section 4.1
Inches2 Fraction of drop-off along segment ≥ 2 in. 0 0.89
Inches2_5 Fraction of drop-off along segment ≥ 2.5 in. 0 0.45
Inches3 Fraction of drop-off along segment ≥ 3 in. 0 0.16
Inches3_5 Fraction of drop-off along segment ≥ 3.5 in. 0 0.07
Just2 Fraction of drop-off along segment ≥ 2 and < 2.5 in. 0 0.52
Just2_5 Fraction of drop-off along segment ≥ 2.5 and < 3 in. 0 0.30
Just3 Fraction of drop-off along segment ≥ 3 and < 3.5 in. 0 0.14
ShdrWidth Shoulder width (ft.) 2 15LaneWidth Lane width (ft.) 8.5 14
Table 7-2. Range of values used in regression model for Missouri
Variable Description Min. value Max. value
AADT Annual average daily traffic (vehicles per day) 72 9,147
EdgeType Shape of drop-off face A, B, and squashed wedge as described in section 4.1
Inches2 Fraction of drop-off along segment ≥ 2 in. 0 0.81
Inches2_5 Fraction of drop-off along segment ≥ 2.5 in. 0 0.41
Inches3 Fraction of drop-off along segment ≥ 3 in. 0 0.20
Inches3_5 Fraction of drop-off along segment ≥ 3.5 in. 0 0.14
Just2 Fraction of drop-off along segment ≥ 2 and < 2.5 in. 0 0.55
Just2_5 Fraction of drop-off along segment ≥ 2.5 and < 3 in. 0 0.51
Just3 Fraction of drop-off along segment ≥ 3 and < 3.5 in. 0 0.36
ShdrWidth Shoulder width (ft.) 1.7 9.50LaneWidth Lane width (ft.) 9.0 14.20

108 109
Category A: Run-off-road right, cross centerline/median, hit vehicle in opposite direction (head-on or sideswipe).
Category B: Run-off-road right, sideswipe vehicle in the same direction for multilane roads.
Category C: Run-off-road right, rollover. No control on where the rollover occurs. It could be in-road or out-of-road.
Category D: Run-off-road right, then run-off-road left.
Category E: Single vehicle run-off-road right.
The crash database for Iowa is spatially located for all roadway types. Crashes were mapped to the corresponding roadway in the state database, and the crashes for each segment selected. The number of potential edge drop-off-related crashes from 2002–2004 for each segment were used as the predictor variable. A total of 97 crashes met these criteria in Iowa for the 140 segments.
The crash database for Missouri is located by milepost for all roadway types, so crashes can be mapped to the nearest roadway segment. A three-year study period from 2002–2004 was used. The most recently available dataset was for 2004. Crashes involving a series of events circumscribed in Categories A–E were extracted for study years 2002–2004. Each potential edge drop-off-related crash was located to the corresponding roadway segment by milepost, and the number of potential pavement edge drop-off-related crashes for each study segment were selected and summarized. A total of 74 crashes met the criteria for the 54 segments.
7.2. Methodology
A negative binomial distribution of accident frequencies was assumed for all models. The GENMOD procedure of SAS (2004) was used to estimate the model coefficients and how well the models fit the data, as expressed by the likelihood ratio R2-coefficient (R2LR). The total number of crashes potentially pavement edge drop-off related in the three-year period was the dependent variable modeled. Segment length times three was used as an offset in each
•
•
•
•
•
model to account for varying segment lengths, and the three-year crash analysis period to estimate accidents/year/mile effectively. Numerous models were esti-mated using various combinations of different predictor variables. The models evaluated include the following:
AADT, edge type, shoulder width, lane width, and a specific fraction of drop-off measurements above a given height or within a given height interval
AADT, edge type, and a specific fraction of drop-off measurements above a given height or within a given height interval
AADT and a specific fraction of drop-off measurements above a given height or within a given height interval
A generic form of the models evaluated is as follows:
Crashes/yr/mi = exp[a0 + a1 × ln(AADT) + a2 × Inches + a3 × EdgeType + a4 × ShdrWidth + a5 × LaneWidth]
(7-1)
7.3. Iowa Results
The Iowa and Missouri datasets were analyzed separately. For Iowa, the
best fit models indicated that lane width, shoulder width, and edge type were not
statistically significant factors. The amount of drop-off within a specific interval
(≥ 2.0 inches to < 2.5 inches; ≥ 2.5 inches to < 3.0 inches; and ≥ 3.0 inches to
<3.5 inches) was not statistically significant at any level. AADT was a statistically
significant factor in all of the best-fit models evaluated (5% significance level).
The total amount of drop-off measurements above a certain threshold
was also evaluated. The fraction of drop-off ≥ 2.0 inches and ≥ 2.25 inches was
not a significant factor (model p-value of 0.21). The amount of drop-off ≥ 2.5
inches, ≥ 3.0 inches, and ≥ 3.5 inches was statistically significant at or near the
5% significance level. The following best-fit models resulted from the analysis.
1.
2.
3.

110 111
Iowa model 1: When the fraction of drop-off 2.5 inches and higher was con-sidered (model statistics: p-value of 0.04; R2
LR = 6.6%):
Crashes/yr/mi = exp[-6.1635 + 0.4806 × ln(AADT) + 2.5379 Inches2_5] (7-2)
Iowa model 2: When the fraction of drop-off 3 inches and higher was considered (model statistics: p-value of 0.06; R2
LR = 6.1%):
Crashes/yr/mi = exp[-5.9490 + 0.4550 × ln(AADT) + 6.6485 × Inches3] (7-3)
Iowa model 3: When the fraction of drop-off 3.5 inches and higher was consid-ered (model statistics: p-value of 0.01; R2
LR = 7.7%):
Crashes/yr/mi = exp[-5.5981 + 0.4074 × ln(AADT) + 19.3083 × Inches3_5] (7-4)
Where (for all models):
Crashes/yr/mi = expected crash rate for crashes potentially related to pavement edge drop-off, in crashes per year per mile
AADT = annual average daily traffic for segment
Inches 2_5 = fraction of drop-off measurements 2.5 inches and higher for segment
Inches 3 = fraction of drop-off measurements 3 inches and higher for segment
Inches 3_5 = fraction of drop-off measurements 3.5 inches and higher for segment
As indicated in the models, drop-off appears to become problematic at
2.5 inches. These models, although statistically significant, explain only a small
portion of the variance in the crash frequencies modeled (highest R2 value is
7.7%). In other words, only a weak relationship exists between the predictor
variables and crash frequency; thus, these models should be used with cau-
tion. They do provide, however, a comparison of the effects of various drop-off
heights on crash frequency based on the data analyzed.
The crash rate varies by traffic volume (AADT); the effect of drop-off can be compared using the previous equations at a specific AADT. The expected crash rate, for example, (for potentially edge drop-off-related crashes) for a roadway segment that has an AADT of 1,000 vehicles per day (vpd) and has a fraction of drop-off measurements of 0.3 (30%) that are greater than or equal to 2.5 inches is:
exp[-6.1635 + 0.4806 × ln(1,000) + 2.5379(0.3)] = 0.0193 crashes/yr/mi
The expected crash rate for a similar segment with an AADT of 1,000 and no drop-off measurements along the segment greater than or equal to 2.5 inches is:
exp[-6.1635 + 0.4806 ln(1,000) + 2.5379 (0)] = 0.009 crashes/yr/mi
Thus, the rate of crashes potentially related to pavement edge drop-off, at 1,000 vpd, is predicted to more than double when the amount of measured drop-off greater than or equal to 2.5 inches exceeds 30%, relative to the expected crash rate when no measured drop-off exists as deep as 2.5 inches.
7.4. Missouri Results
The best-fit models for Missouri indicated the fraction of drop-off mea-surements above a specific threshold (amount of drop-off ≥ 2.0 inches; ≥ 2.5 inches; and ≥ 3.0 inches) was not a statistically significant factor. The amount of drop-off measurements within a specific interval (≥ 2.0 to <2.25 inches; ≥ 2.25 to < 2.5 inches; ≥ 2.5 to < 3.0 inches; and ≥ 3.0 to < 3.5 inches) was also not statistically significant at any level. AADT was statistically significant in all of the best-fit models evaluated (10% significance level) and explained about 20% of the variation in the model. Shoulder and lane width were statistically significant factors when considered individually in the model, but not when they were con-sidered together. Additionally, both variables were evaluated as categorical, to quantify the effect of specific width intervals, and were statistically significant. The following best-fit models resulted from the analysis:
Missouri model 1: When shoulder width was considered as a continuous vari-able (model statistics: p-value of 0.007; R2
LR = 30.6%):

112 113
Crashes/yr/mi = exp[-10.0605 + 1.1715 × ln(AADT) + -0.3958 × ShdrWidth] (7-5)
Missouri model 2: When shoulder width was considered as a categorical vari-able (model statistics: p-value of 0.09; R2
LR = 29.8%):
Crashes/yr/mi = exp[-14.2082 + 1.1923 × ln(AADT) + a × ShdrWidthCat] (7-6)
Where a=2.96 for 2 ft or less, 2.32 for 4 ft, 2.0 for 6 ft, and 0 for 8 ft or more
Missouri model 3: When lane width was considered a continuous variable (model statistics: p-value of 0.019; R2
LR = 28.5%):
Crashes/yr/mi = exp[-2.6150 + 1.1977 × ln(AADT) + -0.8436 × LaneWidth] (7-7)
Missouri model 4: When lane width was considered a categorical variable (model statistics: p-value of 0.07; R2
LR = 28.4%):
Crashes/yr/mi = exp[-12.0438 + 1.0789 × ln(AADT) + a × LaneWidthCat] (7-8)
Where a =1.62 for 10 ft or less, 1.29 for 11 ft, and 0 for 12 ft or more
Where (for all models):
Crashes/yr/mi = expected crash rate for crashes that were potentially pavement edge drop-off related in crashes per year per mile
AADT = annual average daily traffic for segment
ShdrWidth = shoulder width measurement in feet for segment
LaneWidth = lane width measurement in feet for segment
7.5. Summary of Regression Analysis
The regression analysis for Iowa indicates a relationship between the frequency of potential edge drop-off-related crashes and the amount of measured drop-off along a segment greater than or equal to 2.5 inches. When the lower thresholds of 2.0 inches and 2.25 inches were investigated, no statistically sig-nificant relationship to the segment’s crash rate was found. Thus, these results suggest drop-off becomes problematic at a depth between 2.25 inches and 2.5 inches. This agrees well with past research and with current maintenance thresholds, which numerous states have set at 2.0 inches. Evidence from the current study suggests that a maintenance threshold of 2.0 inches is an appro-priate threshold, which allows for a small margin of safety. A relationship may exist between the presence of pavement edge drop-off and crash rates at lower drop-off depths; however, no such relationship was detected in this study.
The Missouri analysis did not indicate that drop-off was a statistically significant variable. A much smaller sample size, however, was used in Missouri than in Iowa, and the drop-off proportions did not vary much in Missouri.
Most roads included in these analyses had posted speed limits of 55 mph or 60 mph. Thus, these results are not applicable to roads with speed limits outside this range. Higher speeds may increase the danger associated with a given depth of edge drop-off.
The previously discussed maintenance threshold is intended to apply only to the pavement edge and not for use for uneven surfaces between driving lanes or a lane and a paved shoulder.

114 115
Drop-off Educational Message
The objective was to identify and evaluate existing educational materi-als and make recommendations for advising road users about the hazards and avoidance of pavement edge drop-offs.
This chapter reviews drivers’ manuals from each state, information in drivers’ education textbooks, input from the project panel, and conclusions concerning available educational materials. Two educational messages are presented at the end of this chapter. The first is a brief “tip,” and the second is a full message recommended for use when all nuances are to be discussed.
8.1. Review of State Drivers’ Manuals
An internet search of drivers’ manuals from the 50 states and the District of Columbia was undertaken to assess the typical advice given to drivers about traversing a pavement edge drop-off.
Of these 51 agencies, manuals were reviewed for 49. Of these, 32 manu-als contained some advice about how to react when wheels leave the pavement. Advice was similar for most agencies reviewed and can be summarized as fol-lows: 1. Do not panic; 2. Grip steering wheel tightly; 3. Slow down, but do not brake hard; and 4. Return to the pavement sharply at a slow speed. All but two of the messages were very brief, including one or two sentences or three or four bullet points as described here. The drivers’ manuals of Tennessee and Alaska included a picture to help describe the points. Figure 8-1 shows the message from the Tennessee Drivers’ Manual.
Some variance exists in the adverb used to advise drivers about return-ing to the pavement. While the Tennessee manual says to turn back onto the
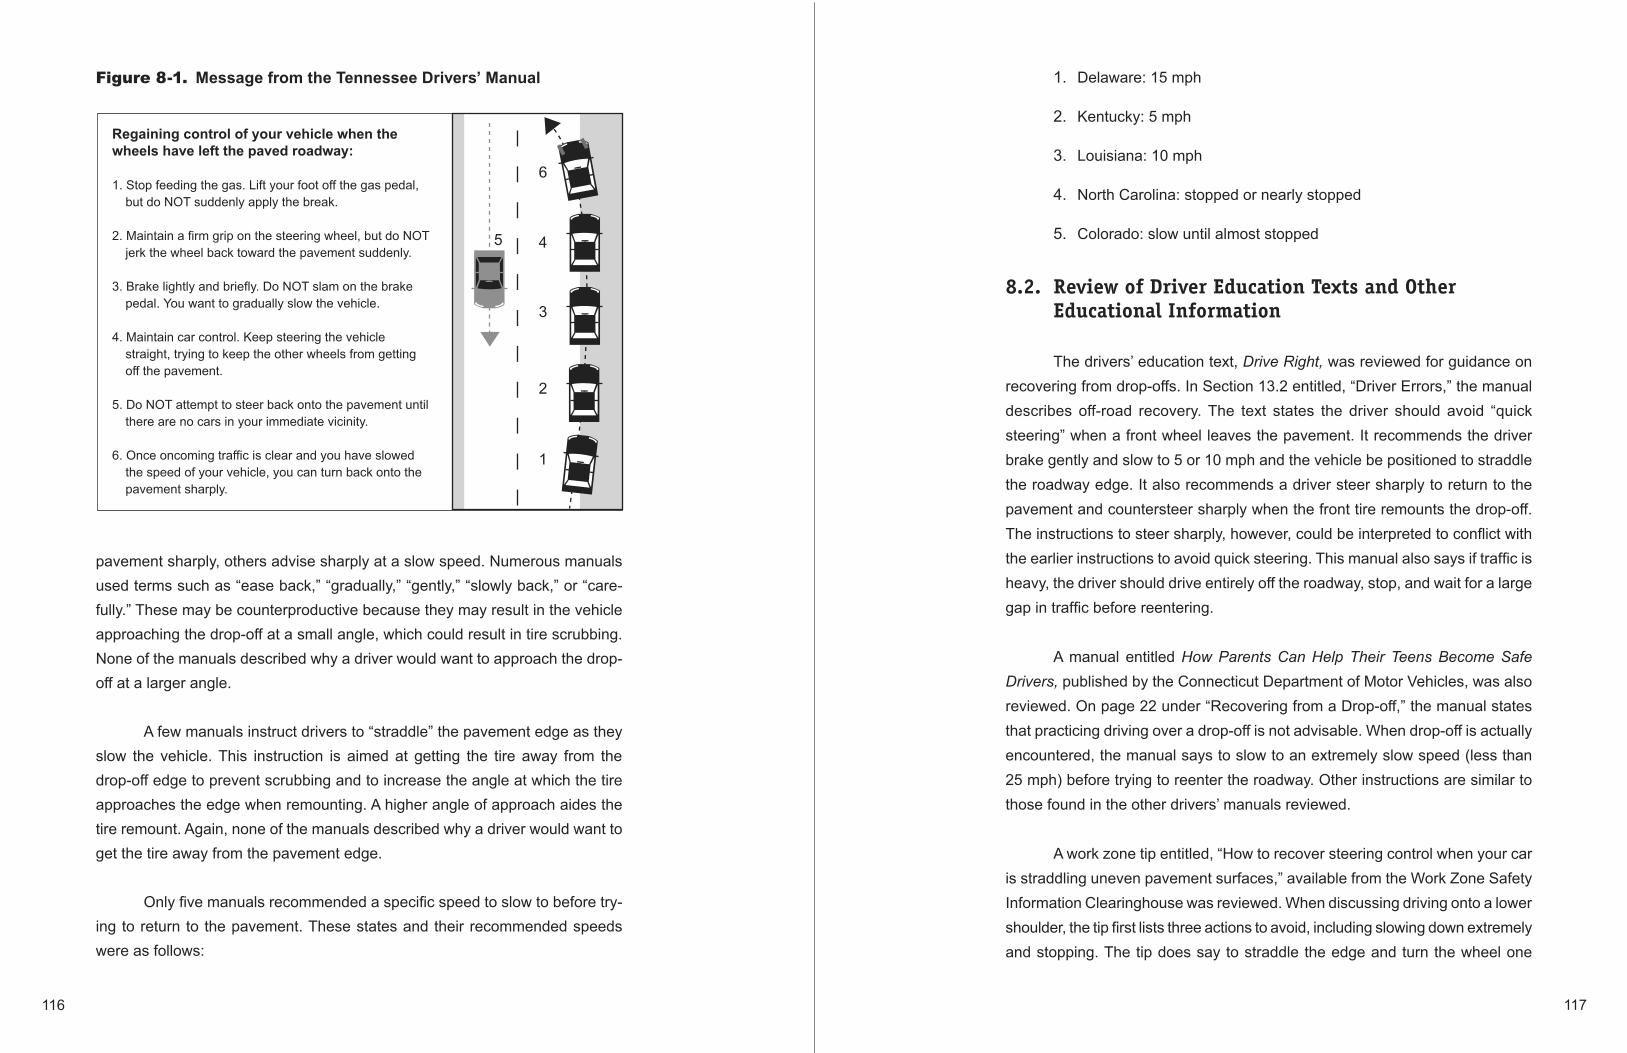
116 117
Figure 8-1. Message from the Tennessee Drivers’ Manual
Regaining control of your vehicle when the wheels have left the paved roadway:
1. Stop feeding the gas. Lift your foot off the gas pedal, but do NOT suddenly apply the break.
2. Maintain a firm grip on the steering wheel, but do NOT jerk the wheel back toward the pavement suddenly.
3. Brake lightly and briefly. Do NOT slam on the brake pedal. You want to gradually slow the vehicle.
4. Maintain car control. Keep steering the vehicle straight, trying to keep the other wheels from getting off the pavement.
5. Do NOT attempt to steer back onto the pavement until there are no cars in your immediate vicinity.
6. Once oncoming traffic is clear and you have slowed the speed of your vehicle, you can turn back onto the pavement sharply.
pavement sharply, others advise sharply at a slow speed. Numerous manuals used terms such as “ease back,” “gradually,” “gently,” “slowly back,” or “care-fully.” These may be counterproductive because they may result in the vehicle approaching the drop-off at a small angle, which could result in tire scrubbing. None of the manuals described why a driver would want to approach the drop-off at a larger angle.
A few manuals instruct drivers to “straddle” the pavement edge as they slow the vehicle. This instruction is aimed at getting the tire away from the drop-off edge to prevent scrubbing and to increase the angle at which the tire approaches the edge when remounting. A higher angle of approach aides the tire remount. Again, none of the manuals described why a driver would want to get the tire away from the pavement edge.
Only five manuals recommended a specific speed to slow to before try-ing to return to the pavement. These states and their recommended speeds were as follows:
Delaware: 15 mph
Kentucky: 5 mph
Louisiana: 10 mph
North Carolina: stopped or nearly stopped
Colorado: slow until almost stopped
8.2. Review of Driver Education Texts and Other Educational Information
The drivers’ education text, Drive Right, was reviewed for guidance on recovering from drop-offs. In Section 13.2 entitled, “Driver Errors,” the manual describes off-road recovery. The text states the driver should avoid “quick steering” when a front wheel leaves the pavement. It recommends the driver brake gently and slow to 5 or 10 mph and the vehicle be positioned to straddle the roadway edge. It also recommends a driver steer sharply to return to the pavement and countersteer sharply when the front tire remounts the drop-off. The instructions to steer sharply, however, could be interpreted to conflict with the earlier instructions to avoid quick steering. This manual also says if traffic is heavy, the driver should drive entirely off the roadway, stop, and wait for a large gap in traffic before reentering.
A manual entitled How Parents Can Help Their Teens Become Safe Drivers, published by the Connecticut Department of Motor Vehicles, was also reviewed. On page 22 under “Recovering from a Drop-off,” the manual states that practicing driving over a drop-off is not advisable. When drop-off is actually encountered, the manual says to slow to an extremely slow speed (less than 25 mph) before trying to reenter the roadway. Other instructions are similar to those found in the other drivers’ manuals reviewed.
A work zone tip entitled, “How to recover steering control when your car is straddling uneven pavement surfaces,” available from the Work Zone Safety Information Clearinghouse was reviewed. When discussing driving onto a lower shoulder, the tip first lists three actions to avoid, including slowing down extremely and stopping. The tip does say to straddle the edge and turn the wheel one
1.
2.
3.
4.
5.

118 119
quarter-turn to the left. The tip then says that if the shoulder is several inches below the pavement, the driver may not be able to remount on the first try and instead must slow down and try to remount the pavement edge again.
8.3. Discussions with Project Panel
The project panel was asked to comment on the proper educational message for the AAA Foundation for Traffic Safety’s interactive training tool, Driver-ZED. Driver-ZED can be obtained from the AAAFTS web site, http://www.aaafoundation.org, or from the Driver-ZED web site, http://www.driverzed.org. The discussions continued through the first panel conference call and at the panel meeting in Washington, D.C.
During the panel conference call, the question was posed as to whether parents should practice driving over a drop-off. The panel rejected the idea and felt this maneuver could be hazardous at any speed (depending on the drop-off height) and also might contribute to pavement and shoulder deterioration.
The panel reviewed several messages, including the one in the Driver-ZED section about edge drop-off emergencies. The review included guidance messages from the U.S. Army, an insurance company, and the parents’ manual from the Connecticut Department of Motor Vehicles, mentioned earlier. One panel member also recommended a message. Several of these messages, along with the one in the AAA video, “Getting Safely Past the Orange Barrels,” were sent to the panel prior to the meeting in Washington, D.C. The panel discussed these messages and watched the video sequence from the interactive Driver-ZED DVD, which includes numerous driving scenarios assessing teen drivers’ ability to identify and deal with various risks. “Getting Safely Past the Orange Barrels” can be obtained from: http://www.aaafoundation.org/products/.
The panel recommended additional references such as drivers’ manu-als and drivers’ education textbooks also be reviewed. The panel also recom-mended drivers be instructed to check for oncoming traffic prior to attempting to remount the drop-off.
The panel felt that pictures should be shown of the vehicle’s wheels as
it recovers from the drop-off, and that the possible scenario involving the wrong response should also be shown. Dr. William Van Tassel of AAA, the former lead instructor for the Driver Skill Enhancement Program at Texas A&M University, also provided additional advice.
Additional discussions and communications produced the recommended message at the end of this chapter.
8.4. Conclusions Concerning Existing Educational Messages
The review of educational materials and discussions with the project panel revealed a great deal of available advice, and in some instances the advice was contradictory or questionable. Most advice given in drivers’ manuals was very brief and did not explain why it was safer to follow the instructions. The following conclusions were drawn from the review and are presented as a justification of the recommended message that follows:
The most important part of the message is not to panic and not to steer back onto the pavement immediately. This maneuver would lead to tire scrubbing in most instances and would cause a return to the pavement at a large steering angle that would not be controllable at highway speeds.
The maneuver to return to the pavement safely is complicated, and where possible more advice and reasons for driving in a certain manner should be explained at greater length than the advice contained in most drivers’ manuals.
Some messages contain verbiage such as, “If the shoulder is only slightly lower than the pavement…” or “If the front tire rubs against the side of the pavement….” Expecting a driver to know the depth or shape of a drop-off is unreasonable, and most drivers probably cannot determine whether a tire is rubbing on the edge of the pavement. Using these conditions as decision points, therefore, is not practical.
Instructions to return to the pavement that use words such as “gently,” “gradually,” “slowly back,” or “carefully” could be misleading, since
1.
2.
3.
4.

120 121
approaching the pavement edge at a small angle could put the tire into a scrubbing condition.
It is critical that the vehicle slow before reentering the roadway; however, how to slow and the best speed to slow to are debatable. Slowing to be-low 30 mph is necessary to remount a vertical 3-inch drop-off; however, slowing to 5 or 10 mph might lead to rear-end crashes, depending on traffic conditions.
Braking hard can cause loss of control when the skid resistance of the pavement and shoulder differ; however, braking will probably be neces-sary to slow to below 30 mph. Antilock braking systems also affect how drivers should react, since they make pumping the brakes unnecessary. The U.S. Army guidance is probably best, saying, “If braking is neces-sary, use a gentle squeeze braking application, which will enable you to control steering.”
It is easier to obtain the correct angle to remount the drop-off if the wheel is one or two feet from the pavement edge. Instructing drivers to “straddle” the pavement edge should help achieve this result. The reason for moving the tire away from the pavement edge can be explained in more complete messages.
An instruction to turn the steering wheel one quarter-turn toward the pave-ment was judged to be the best way to instruct drivers about remounting the pavement edge and offered more advice than to steer sharply at a slow speed. Some panel members were concerned that vehicles have different steering ratios and the countersteer after remounting the pave-ment was also critical.
In circumstances where there is a wide shoulder, pulling completely onto the shoulder and stopping may be preferable.
8.5. Recommended Educational Messages
The following are two educational messages, one full and one brief, designed to help drivers return to the pavement safely when encountering pave-ment edge drop-off.
5.
6.
7.
8.
9.
8.5.1. Full Educational Message Text
The following full message is recommended for drivers’ manuals and
other educational materials where space is available for additional text describ-
ing the instructions and where the message can include diagrams and pictures
of vehicles in a drop-off maneuver.
“Pavement shoulder drop-offs can cause serious crashes if drivers react
improperly. Avoid panic steering, in which you try to return to the pavement as
soon as your wheels leave the pavement. This maneuver can lead you to provide
too much steering input before you have a chance to slow down. If your tires are
next to the pavement edge, the rubbing of the tire’s sidewall on the pavement
drop-off (called “scrubbing”) will resist the tire’s remounting of the pavement edge.
When enough tire angle is cranked into the steering, the wheels will suddenly
remount the drop-off, and the severe angle will cause loss of control, rollover,
or slingshotting of the vehicle into adjacent lanes or off the opposite side of the
road. Too much countersteering may cause you to leave the right side of the
road a second time.
Slowing down will help you remount the drop-off without losing control.
When your wheels leave the pavement, ease off the gas to slow down. Do not
brake hard, as this can put your vehicle into a skid and make it difficult to steer.
Instead, use a gentle squeeze application of the brakes, which will allow you to
control steering. Steer straight ahead and slow to 25 mph or less.
Straddle the pavement edge, which will keep the inside edge of your
right tires from scrubbing. It will also help you to approach the edge at a high
angle, which helps the tire to remount the drop-off. When there is a gap in traffic
from all directions, turn the steering wheel about one quarter-turn to return to
the pavement. When you are back on the pavement, countersteer back to the
right to stay in your lane.
If traffic is heavy when you leave the road and the shoulder is wide,
drive entirely onto the shoulder and stop. Wait for a large gap in traffic before
you reenter.

122 123
If you can’t get back onto the pavement, pull as far from the road as possible and wait for help.”
8.5.2. Brief Educational Message
The following message was recommended for the Driver-ZED DVD and should be used where there is limited time or space for the full message.
“If for some reason one or two of your wheels suddenly drop off the edge of the road, keep calm. Too often drivers panic and steer abruptly to return to the road and then ‘slingshot’ across the other side of the road or into traffic. Instead, take your foot off the gas and slow down, but avoid hard braking if pos-sible. Position your vehicle so it straddles the roadway edge. Do not attempt to turn back onto the road until you slow to 25 mph or less. After you have slowed down, and when there is no traffic, turn the steering wheel one quarter-turn toward the roadway. This move permits the tire to climb the pavement edge and get back onto the pavement. Once on the pavement, counter-steer to travel straight down the road.
If traffic is heavy when you leave the road, and the shoulder is wide, drive entirely onto the shoulder. Stop and wait for a large gap in traffic before you reenter.”
Conclusions and Recommendations
This report details research to quantify the impact of pavement edge drop-off on crash frequency and severity. The study generally focused on rural two-lane paved roadways with unpaved shoulders, since these are often high-speed facilities (55+ mph), have varying levels of maintenance, and are likely to be characterized by adverse roadway conditions, such as narrow lanes or no shoulders.
In Chapter 2, the study summarized federal and state guidance for sampling and addressing pavement edge drop-off. Numerous U.S. states and Canadian provinces were surveyed, and their practices for addressing drop-off during design, construction, and maintenance are summarized in Chapter 3. As discussed in Chapter 4, 21 counties in Iowa and 2 districts in Missouri were se-lected to provide a representative sample of the magnitude and amount of edge drop-off present in each state. Pavement edge drop-off height and shape, as well as other road characteristics such as lane width, shoulder type, and shoulder width, were collected and the results presented. The relationship between drop-off and roadway characteristics was also explored using hierarchical tree-based regression. Next, the frequency and characteristics of pavement edge drop-off-related crashes were assessed by evaluating crash reports. A sample of crashes likely to be edge drop-off related were selected, and the officer narratives and crash diagrams from the crash reports were evaluated to determine whether edge drop-off was likely to have contributed to the crash. Results are presented for four states in Chapter 6. Chapter 7 assesses the relationship between the amount of drop-off (i.e., percentage of drop-off along a segment that was 2.5 inches or more) and number of crashes. A relationship between potential edge drop-off-related crashes and roadway characteristics was explored for Iowa and Missouri using negative binomial regression analysis. Chapter 8 offers a method for educating drivers about edge drop-off.
124 125
9.1. Benefits of Research
The statistical analysis in Chapter 7 will result in a better understanding of pavement edge drop-off-related crashes. Understanding the relationship be-tween the characteristics of drop-offs, such as height and crash frequency, will allow agencies to better determine whether current guidelines and practices are adequate. This information can also allow agencies to determine where critical locations for pavement edge drop-off may exist so that needed maintenance and improvements can be more efficiently scheduled and resources targeted to locations most likely to benefit, resulting in fewer crashes. This information will also provide a tool that states or other agencies can use to assess the magnitude of the problem, allowing them to determine the most effective method.
9.2. Recommendations for Addressing Pavement Edge Drop-off
The panel for this project met after reviewing final project results and proposed the following recommendations to address pavement edge drop-off. Recommendations are summarized by the agency to which they are directed.
For state and local agencies:
All transportation agencies should provide specific training on the poten-tial hazards of pavement edge drop-off. Training should be directed to maintenance and construction staff, including private contractors. Local Technical Assistance Program (LTAP) and FHWA offices in each state would be excellent resources for this training.
Agencies should adopt a policy for shoulder maintenance that includes routine comprehensive sampling procedures and requires prompt reme-diation of any edge drop-off that meets or exceeds a prescribed threshold. That threshold should be no higher than 2.0 inches. Pass/fail sampling can be used as a benchmark for prioritizing and analyzing the effective-ness of maintenance practices.
Agencies should establish a paved shoulder policy, with a minimum width of 2 feet, considering:
1.
2.
3.
a. Roadway classification b. Traffic volumes c. Funding priorities d. Other potential roadway users, such as bicyclists
Where paving shoulders is not practical, some agencies have considered painting the edgeline at an 11-foot width on a 12-foot paved lane for similar benefits. Although not practical in all situations, some agencies feel this provides a benefit in keeping vehicles away from the roadway edge.
For roadway improvements such as asphalt overlays, agencies should include a beveled edge design, providing a tapered transition away from the roadway surface. The FHWA’s Safety Edge is a 30–35° pavement wedge that provides a tapered transition away from the roadway surface at the edge of the pavement. Information on the Safety Edge can be found at http://safety.fhwa.dot.gov/roadway_dept/docs/sa05003.htm.
Where possible, agencies should review crash databases to assess possible pavement edge drop-off contribution to crashes. To ensure more accurate data, law enforcement officers should be instructed in the value of drop-off data in certain crash types and be encouraged to gather and enter that information on crash investigation forms properly and fully. To facilitate the recording of such data, agencies should adopt the Model Minimum Uniform Crash Criteria (MMUCC) data element C15 (Contributing Factors, Road) and the corresponding attributes on their crash report forms. This data element is defined as the “apparent condition of the road which may have contributed to the crash.” MMUCC also prescribes specific attributes for C15, which include ruts, holes, bumps, and shoulders (none, low, soft, high) (MMUCC 2005). Crash report forms used in Iowa make use of the shoulder condition portion of C15, whereas Missouri does not. During the course of the analysis of crash forms from these two states, officers in Iowa noted the existence of potential roadway-related contributing factors in a greater percentage of crashes evaluated than was the case in Missouri.
Agencies should conduct additional research on pavement edge drop-off occurrence and hazard exposure specifically on local rural roads. Crash
4.
5.
6.

126 127
analysis in these locations should include assessment of edge drop-off-related crash frequency and severity. Unique best, low-cost maintenance practices for these lower volume roads should also be investigated and reported.
For the FHWA and AASHTO:
A synthesis of best practices for addressing pavement edge drop-off should be conducted, including both construction and maintenance activi-ties. The synthesis would include specific treatments applied for various traffic levels and roadway types. Subsequently, a policy or guidelines should be adopted as a reference for agencies in mitigating pavement edge differential in problematic locations.
The FHWA should continue to encourage and support the development, validation, and use of mobile sensing equipment to measure and record pavement and shoulder conditions.
The FHWA should investigate motorist understanding of warning signs such as the “Low Shoulder” and “Shoulder Drop-Off” signs, to deter-mine which would be the appropriate message to communicate the road condition to motorists, both within and outside of work zones. This study should include consideration of the length and depth of drop-off that warrants signage, as well as other temporary traffic control devices, such as cones.
A national study should be conducted to assess the possible effect, if any, of environmental regulations on the implementation of safety improve-ments such as paved shoulders.
For other agencies:
The American Driver and Traffic Safety Education Association, National Highway Traffic Safety Administration (NHTSA), and other driver educa-tion advocates should encourage driving instructors to advise new driv-ers of the potential hazards of roadway edge drop-off, especially in rural
1.
2.
3.
4.
1.
areas, and provide in-class instruction on proper reactions for returning safely to the travel lane after leaving the roadway surface. The same guidelines should be included in driver instructor manuals.
The National Highway Traffic Safety Administration should use a full-mo-tion driving simulator to study the reactions of naïve, non-professional motorists to encountering and driving off of pavement edge drop-offs. At a minimum, the study should investigate the effects of driving speed, drop-off depth, and edge shape.
The American Association of Motor Vehicle Administrators and state motor vehicle departments should develop educational advice to be included in driving manuals that advises of the potential hazard of pavement edge drop-off and offers suggestions for returning safely to the travel lane.
A driver training video should be produced and distributed to illustrate proper and safe procedures for recovery to the travel lane after steering onto an unpaved shoulder.
2.
3.
4.

128 129
References
American Association of State Highway and Transportation Officials (AASHTO). 2002. A policy on geometric design of highways and streets—2001. Washington, D.C.: AASHTO.
American Association of State Highway and Transportation Officials (AASHTO). 2002. Roadside design guide, 2002. Washington, D.C.: AASHTO.
American Association of State Highway and Transportation Officials (AASHTO). 1987. AASHTO maintenance manual. Washington, D.C.: AASHTO.
American Public Works Association. 1985. Street & highway maintenance manual. Chicago: APWA.
Chandra, R. 2004. The influence of pavement edge drop-offs on highway safety. Mis-souriVITE Journal 45 (2): 6–10.
Council, F., and R. Patel. 2004. Series of Memos to FHWA. Cumby, T. K., W. D. Lawson, and M. S. Hossain. 2003. Best Practices for Pavement Edge Maintenance: TxDOT 0-4396. Paper presented at the 2003 Regional Training Workshop, Texas Department of Transportation.
Delaigue, P. Safety of Excessive Pavement Wedge Due to Overlays. 2005. Proceed-ings of the Annual Meeting of the Transportation Research Board. Washington, D.C.: Transportation Research Board.
Dixon, K. The pavement edge drop-off crash problem in Georgia. 2004. Paper presented at the Federal Highway Administration Workshop, February 11, 2004.
Georgia Tech. 2004. Accidents waiting to happen: Rural roads in southeast prove deadly to drivers. Georgia Tech Research News. http://gtresearchnews.gatech.edu/newsre-lease/rural-roads.htm 1. (accessed June 2005). Federal Highway Administration. 2001. Manual of uniform traffic control devices. U.S. DOT, Washington D.C.
Federal Highway Administration. 1996. Standard specifications for construction of roads and bridges on federal highway projects. Report FP-96. Washington D.C.: United States Department of Transportation.

130 131
Glennon, J. C., and P. F. Hill. 2004. Roadway safety and tort liability. 2nd Ed. Tucson, AZ: Lawyers and Judges Publishing Company, Inc.
Glennon, J. C. 1985. Effect of pavement/shoulder drop-offs on highway safety: A syn-thesis of prior research. Transportation Research Board.
Government Accounting Office. 2004. Highway safety: Federal and state efforts to ad-dress rural road safety challenges. GAO-04-663. Report to Congressional Committees. U.S. General Accounting Office.
Graham, J. L., and J. C. Glennon. 1984. Work zone design considerations for truck opera-tions and pavement/shoulder drop-offs. U.S. DOT, Federal Highway Administration.
Humphreys, J. B., and J. A. Parham. 1994. The elimination or mitigation of hazards as-sociated with pavement edge drop-offs during roadway resurfacing. Washington, D.C.: AAA Foundation for Traffic Safety.
Ivey, D. L., 2004. Summary of research, pavement edges, and highway safety: 1940–2004. Presented at workshop “Managing Shoulder Edge Drop-offs to Improve Safety.”
Ivey, D. L., K. K. Mak, H. D. Cooner, and M. A. Marek. 1988. Safety in construction zones where pavement edges and drop-offs exist. Journal of the Transportation Re-search Record 1163:43–62.
Ivey, D. L., and D. L. Sicking. 1986. Influence of pavement edge and shoulder char-acteristics on vehicle handling and stability. Journal of the Transportation Research Record 1084:30–39.
Ivey, D. L., W. A. Johnson, E. F. Nordlin, and R. A. Zimmer. 1984. Pavement Edges, in The Influence of Roadway Surface Discontinuities on Safety, 11–16. Washington, D.C.: Transportation Research Board, National Research Council.
Klein, R. H., W. A. Johnson, and H. T. Szostak. 1977. Influence of roadway disturbances on vehicle handling. DOT HS-802 210. National Highway Traffic Safety Administration.
Kulkarni, R., F. Finn, K. Golabi, R. Johnson, and E. Alviti. 1980. Maintenance levels-of-service guidelines. Report 223 from the National Cooperative Highway Research Program.
Mendenhall, W., and T. Sincich. 1988. Statistics for engineering and the sciences. 3rd Ed. San Francisco: Dellen Publishing.
Miaou, S. P., and H. Lum. 1993. Modeling vehicle accident and highway geometric design relationships. Accident Analysis & Prevention 25 (6): 689-709.
Model Minimum Uniform Crash Criteria. 2005. http://www.mmucc.us (accessed Janu-ary 2005).
Niemeier, D., L. Redmond, J. Morey, J. Hicks, P. Hendren, J. Lin, E. Foresman, and Y. Zheng. 2001. Redefining conventional wisdom: an exploration of auto ownership and travel behavior in the U.S., in TRB Transportation Research Circular E-C026, Personal Travel: The Long and Short of It, 207–219.
Neuman, T. R., R. Pfefer, K. L. Slack, K. K. Hardy, F. Council, H. McGee, L. Prothe, and K. Eccles. 2003. A guide for addressing run-off-road collisions. Report 500 from the National Cooperative Highway Research Program: Guidance for Implementation of the AASHTO Strategic Highway Safety Plan. Transportation Research Board, National Research Council.
Olson, P. L., R. Koppa, and V. Pezoldt. 1986. Pavement edge drop-off. UMTRI-86-33. The University of Michigan Transportation Research Institute.
Ott, L., and M. Longnecker. 2001. An introduction to statistical methods and data analy-sis. 5th Ed. California: Duxbury.
Rhodes, L. R., 2001. Temporary control devices, in Traffic Control Devices Handbook, 2001, Washington D.C.: Institute of Transportation Engineers.
R. L. Polk & Co. 2001. Polk study shows light trucks popular among baby boomers. http://www.polk.com/news/releases/2001_0119.asp (accessed September 27, 2001).
SAS Institute, Inc. 2004. SAS/STAT® 9.1 user’s guide. Cary, NC: SAS Institute, Inc.
Stoughton, R. L., D. M. Parks, J. R. Stoker, and E. F. Nordlin. 1979. Effect of longitudi-nal edge of paved surface drop-offs on vehicle stability. Journal of the Transportation Research Record 703:24–30.
Transportation Research Board. 1987. Designing safer roads: Practices for resurfacing, restoration, and rehabilitation. Special Report 214. Transportation Research Board, National Research Council.
U.S. Department of Transportation. 2004. The safety edge. U.S. Department of Trans-portation, Federal Highway Administration. http://safety.fhwa.dot.gov/media/pdf/safe-tyedge.pdf (accessed March 2004) and http://safety.fhwa.dot.gov/media/safetyedge.htm (accessed October 2005).
Wagner, C., and Y. S. Kim. 2005. Construction of a safe pavement edge: minimizing the effects of shoulder drop-off. Proceedings of the Annual Meeting of the Transportation Research Board. Washington, D.C.: Transportation Research Board.

132 133
Zimmer, R. A., and D. L. Ivey. 1983. Pavement edges and vehicle stability: a basis for maintenance guidelines. Journal of the Transportation Research Record 946:48–56.
Zimmer, R.A., and D.L. Ivey. 1982. Pavement edges and vehicle stability: A basis for maintenance guidelines. Research Report No. 328-1. Texas State Department of High-ways and Public Transportation and Federal Highway Administration.
Appendix A. Questions for States and Provinces
Design questions:
Policy for design of shoulders on new roads, 2-lane and 4-lane (e.g. for newly designed roads, are all new 4-lane facilities designed to have 4-foot paved shoulders? Do some receive gravel shoulders?)
What are the design standards for pavement and shoulder type and width by class of road?
Is there additional design guidance with regard to drop offs, if any?
Are there any innovative solutions to eliminating PEDOs, such as narrow pavement widening and safety wedges along resurfacing layers?
Maintenance questions:
How are drop-offs measured for maintenance activities?
What guidance exists for addressing drop-off as part of maintenance activi-ties? At what point, for instance, is drop-off considered a problem that needs to be addressed (e.g. a drop-off of 1.5 inches for more than 3 consecutive feet)?
Are there mandatory limits on the amount of pavement drop-off allowed before it must be addressed?
Is there any additional maintenance guidance with regard to drop-offs?
What guidance exists for addressing drop-off during resurfacing? Are any edge treatments mandatory?
What are the maintenance guidelines for maximum shoulder slope?
What are the traffic control requirements for locations with existing PEDO?
1.
2.
3.
4.
1.
2.
3.
4.
5.
6.
7.

134 135
Does the state inventory drop-offs? If so, are the results of their inventories available?
Are there any policies to reduce occurrence of PEDOs?
Are there any innovative solutions to eliminate PEDOs, such as narrow pavement widening and safety wedges along resurfacing layers?
Construction questions:
What guidance exists regarding drop-offs during construction activity? At what point are they considered a safety problem?
What is done to address safety problems created by drop-offs in work zones (sig-nage, addition of material wedge, positive separation via hard barriers, etc.)?
Are there additional construction guidance with regard to drop offs, if any?
What recommendations exist for avoiding PEDO in work zones?
Are there any policies to reduce occurrence of PEDOs?
Are there any innovative solutions to eliminate PEDOs, such as narrow pavement widening and safety wedges along resurfacing layers?
Reconstruction questions:
What guidance exists for addressing pavement edge drop-off during recon-struction? Are paved shoulders, for example, mandatory on reconstruction activities?
What are the 3R practices, such as are shoulders upgraded as part of the overlay project?
Crash experience:
Is there any information regarding the impact of pavement edge drop-off on frequency or severity of crashes?
Have any crash analyses of frequency of PEDO-related crashes been done?
Have any crash analyses of the impact of resurfacing been done?
What level of priority is given to reducing PEDO crashes?
8.
9.
10.
1.
2.
3.
4.
5.
6.
1.
2.
1.
2.
3.
4.
Appendix B. Data Collection FormPavement Edge Drop-off Data Collection—Iowa
Date: County:
Weather Condition: sunny overcast cloudy
Main St. (include gov. and local names):
Begin cross-street:
End cross-street:
Speed Limit: Orientation: N/S E/W
Pavement Type: Asphalt Concrete
Shoulder Type: Asphalt Concrete Gravel Earth Mixed
Circle pavement edge shape:
Sharp break-off or concrete
Overlay, may be more jagged Wedge in place Squashed
wedge Other (draw)
N/E S/W N/E S/W N/E S/W N/E S/W N/E S/W
Grade (%)(sh. if ≥ 5’)
Width (feet)
Cross-section shoulders < 5’ (in.)3’ 4.5’ 6’ 7’
N or E shoulder
S or W shoulderN or E laneS or W lanePavement (G if sig.)
Random start point (m) 0.1 0.2 0.3 0.4 0.5 0.6 0.7 0.8
Dist. from Start Pt. N/E S/W0 (ft.)52 (ft.)104 (ft.)156 (ft.)208 (ft.)260 (ft.)312 (ft.)364 (ft.)416 (ft.)468 (ft.)520 (ft.)

136 137
Appendix C. Selection Criteria for Edge Drop-off Crashes
Conditions A to G are applied to determine whether the crash was “Prob-able,” “Possible,” “Soft,” “Not,” or “Unknown” before scrubbing is evaluated. If crash is determined to be “Probable” or “Possible,” the crash is further evaluated to determine whether it was likely to have been in scrubbing mode or not using Conditions S1, S2, S3, and S4.
Narrative may refer to either the officer narrative or personal narrative if available. In most cases the narrative provides the information; the diagram should be consulted as well for additional information.
Condition A: Narrative may refer to either the officer narrative or personal narrative if available
Then code as “Probable”
Condition A: If the narrative indicates that:Drop-off was present, or
Edge or shoulder rut was present, or
Vehicle dropped off onto a low shoulder, or
Wheels caught on the shoulder, lip, or edge of pavement, or
Vehicle attempted to remount pavement more than once, or
Vehicle attempted to remount pavement but was not able to
do so
Driver indicates resistance to returning to roadway
•
•
•
•
•
•
•

138 139
Condition B: Narrative may refer to either the officer narrative or personal narrative if available Condition C: Narrative may refer to either the officer narrative or personal narrative if available
Then if:
No further action on shoulder
condition is noted
Then code as “Not”
Then code as “Possible”
Or if:
Subsequent actions do not indicate action on
shoulder lead to further loss of control; or vehicle
strikes fixed object with no indication that shoulder
condition was a factor; or if loss of control clearly
occurs after vehicle has returned to roadway
rather than as vehicle is returning; or vehicle leaves
roadway and subsequent event such as running into
ditch, overturning, etc., occurs with no indication of
loss of control on shoulder; or as attempt is made to
return to pavement
Condition B: If the narrative indicates that:
Vehicle leaves traveled portion of roadway in some manner (wording such as “leaves roadway,”
“enters shoulder,” “drifts onto shoulder,” “dropped onto shoulder,” “partially left roadway,” etc.) with
no indication of loss of control on the roadway itself before leaving the traveled way unless:
Driver is indicated as intoxicated, fell asleep, was driving recklessly, or had some other
physical condition, see Condition E
Roadway condition or shoulder condition is indicated as wet, icy, snow covered, loose
material, etc., see Condition D
Vehicle condition is noted, see Condition F
•
•
•
Then if:
Loss of control on shoulder is indicated as
vehicle enters or attempts to return to travel
lane and/or vehicle is unable to return to
travel lane (wording such as “lost control,”
“overcorrected,” “attempted to return to lane,”
“shot across road,” “crossed centerline,”
“swerved,” “slid,” etc.) and/or loss of control on
shoulder clearly appears to have been caused
by drop-off or shoulder condition
Then if:
Shoulder condition is not noted
Or if:
Shoulder condition is noted, such as “slid in gravel,” “slid
in mud,” “encountered soft shoulders” (words such as “fish-
tailed on shoulder,” “slid on shoulder,” etc., likely indicate
vehicle lost control due to encountering gravel shoulder)
Or if:
Further action due to shoulder is noted such as “over-
corrected attempting to return to pavement,” and loss
of control appears to be related to edge of roadway
rather than loss of control on shoulder
Then code as “Possible”Then code as “Soft”
Condition C: If the narrative indicates:
Vehicle first lost control on traveled portion of roadway (wording such as “lost control,” “swerved on
roadway,” “crossed centerline”) before the action of vehicle “runs-off-road right” occurs unless:
Driver is indicated as intoxicated, fell asleep, was driving recklessly, or had some other
physical condition, see Condition E
Roadway condition or shoulder condition is indicated as wet, icy, snow covered, loose
material, etc., see Condition D
Vehicle condition is noted, see Condition F
•
•
•
Then code as “Not”
Then if:
Loss of control on shoulder is indicated as vehicle enters or
attempts to return to travel lane and/or vehicle is unable
to return to travel lane (wording such as “lost control,”
“overcorrected,” “attempted to return to lane,” “shot across
road,” “crossed centerline,” “swerved,” “slid,” etc.) and/or loss
of control on shoulder clearly appears to have been caused
by drop-off or shoulder condition
Or if:
No additional loss of control
occurred on shoulder
Then if:
Shoulder condition is not noted
Or if:
Shoulder condition is noted, such as “slid in gravel,”
“slid in mud,” “encountered soft shoulders,” (words
such as “fishtailed on shoulder,” “slid on shoulder,”
etc., likely indicate vehicle lost control due to
encountering gravel shoulder)Then code as “Possible”
Then code as “Soft” Then code as “Possible”
Then if:
No further action on
shoulder condition is noted
Or if:
Further action due to shoulder
is noted such as “over-corrected
attempting to return to pavement”
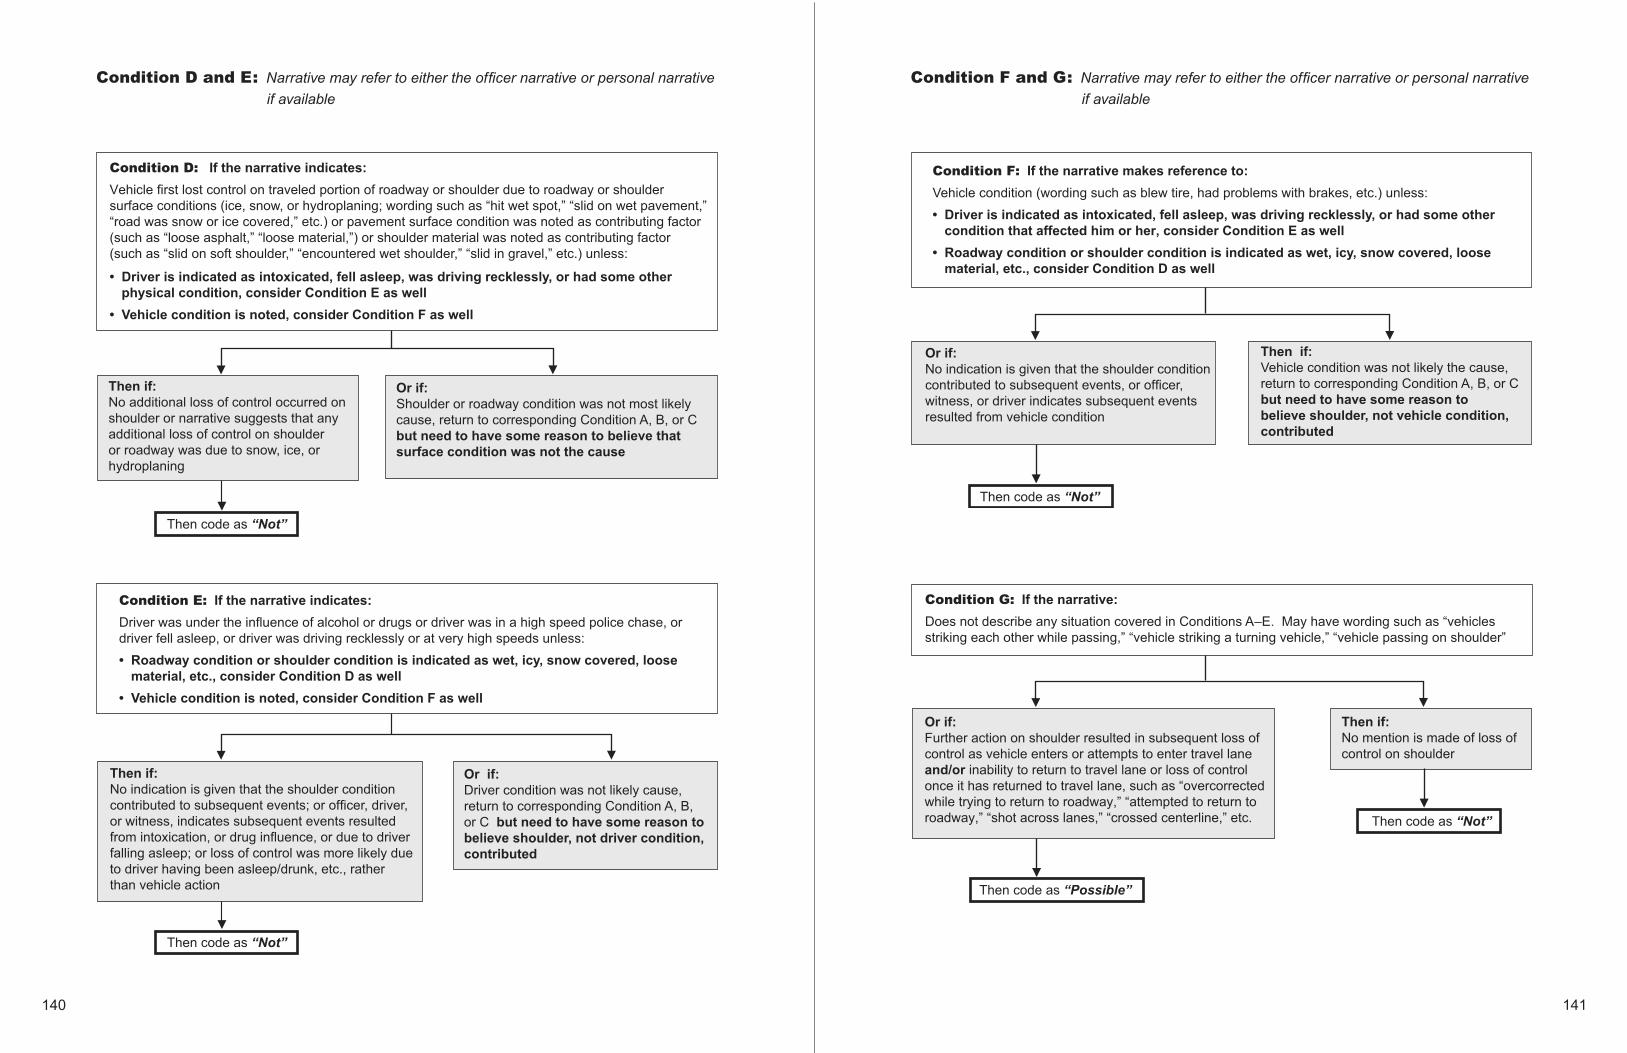
140 141
Condition D and E: Narrative may refer to either the officer narrative or personal narrative if available
Condition F and G: Narrative may refer to either the officer narrative or personal narrative if available
Then code as “Not”
Or if:
Shoulder or roadway condition was not most likely
cause, return to corresponding Condition A, B, or C
but need to have some reason to believe that
surface condition was not the cause
Then if:
No additional loss of control occurred on
shoulder or narrative suggests that any
additional loss of control on shoulder
or roadway was due to snow, ice, or
hydroplaning
Condition D: If the narrative indicates:
Vehicle first lost control on traveled portion of roadway or shoulder due to roadway or shoulder
surface conditions (ice, snow, or hydroplaning; wording such as “hit wet spot,” “slid on wet pavement,”
“road was snow or ice covered,” etc.) or pavement surface condition was noted as contributing factor
(such as “loose asphalt,” “loose material,”) or shoulder material was noted as contributing factor
(such as “slid on soft shoulder,” “encountered wet shoulder,” “slid in gravel,” etc.) unless:
Driver is indicated as intoxicated, fell asleep, was driving recklessly, or had some other
physical condition, consider Condition E as well
Vehicle condition is noted, consider Condition F as well
•
•
Then code as “Not”
Condition E: If the narrative indicates:
Driver was under the influence of alcohol or drugs or driver was in a high speed police chase, or
driver fell asleep, or driver was driving recklessly or at very high speeds unless:
Roadway condition or shoulder condition is indicated as wet, icy, snow covered, loose
material, etc., consider Condition D as well
Vehicle condition is noted, consider Condition F as well
•
•
Then if:
No indication is given that the shoulder condition
contributed to subsequent events; or officer, driver,
or witness, indicates subsequent events resulted
from intoxication, or drug influence, or due to driver
falling asleep; or loss of control was more likely due
to driver having been asleep/drunk, etc., rather
than vehicle action
Or if:
Driver condition was not likely cause,
return to corresponding Condition A, B,
or C but need to have some reason to
believe shoulder, not driver condition,
contributed
Then code as “Not”
Condition F: If the narrative makes reference to:
Vehicle condition (wording such as blew tire, had problems with brakes, etc.) unless:
Driver is indicated as intoxicated, fell asleep, was driving recklessly, or had some other
condition that affected him or her, consider Condition E as well
Roadway condition or shoulder condition is indicated as wet, icy, snow covered, loose
material, etc., consider Condition D as well
•
•
Or if:
No indication is given that the shoulder condition
contributed to subsequent events, or officer,
witness, or driver indicates subsequent events
resulted from vehicle condition
Then if:
Vehicle condition was not likely the cause,
return to corresponding Condition A, B, or C
but need to have some reason to
believe shoulder, not vehicle condition,
contributed
Then code as “Not”
Then code as “Possible”
Condition G: If the narrative:
Does not describe any situation covered in Conditions A–E. May have wording such as “vehicles
striking each other while passing,” “vehicle striking a turning vehicle,” “vehicle passing on shoulder”
Or if:
Further action on shoulder resulted in subsequent loss of
control as vehicle enters or attempts to enter travel lane
and/or inability to return to travel lane or loss of control
once it has returned to travel lane, such as “overcorrected
while trying to return to roadway,” “attempted to return to
roadway,” “shot across lanes,” “crossed centerline,” etc.
Then if:
No mention is made of loss of
control on shoulder
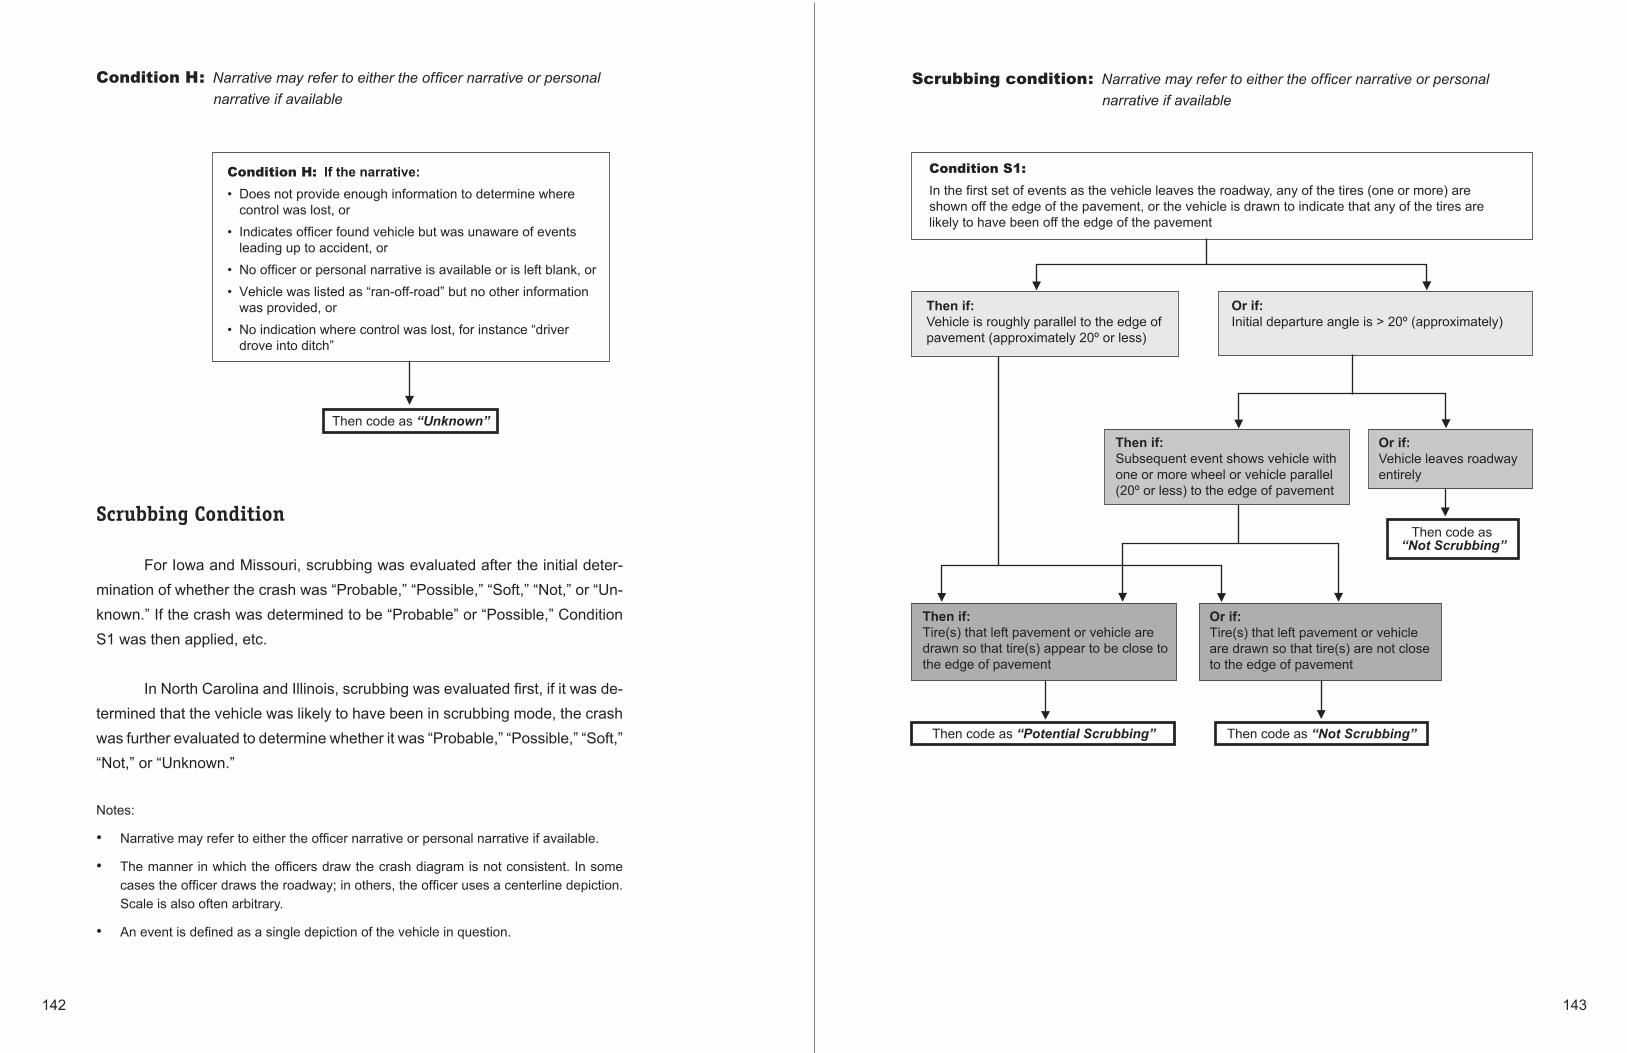
142 143
Condition H: Narrative may refer to either the officer narrative or personal narrative if available
Scrubbing Condition
For Iowa and Missouri, scrubbing was evaluated after the initial deter-mination of whether the crash was “Probable,” “Possible,” “Soft,” “Not,” or “Un-known.” If the crash was determined to be “Probable” or “Possible,” Condition S1 was then applied, etc.
In North Carolina and Illinois, scrubbing was evaluated first, if it was de-termined that the vehicle was likely to have been in scrubbing mode, the crash was further evaluated to determine whether it was “Probable,” “Possible,” “Soft,” “Not,” or “Unknown.”
Notes:
Narrative may refer to either the officer narrative or personal narrative if available.
The manner in which the officers draw the crash diagram is not consistent. In some cases the officer draws the roadway; in others, the officer uses a centerline depiction.Scale is also often arbitrary.
An event is defined as a single depiction of the vehicle in question.
•
•
•
Scrubbing condition: Narrative may refer to either the officer narrative or personal narrative if available
Then code as “Unknown”
Condition H: If the narrative:Does not provide enough information to determine where
control was lost, or
Indicates officer found vehicle but was unaware of events
leading up to accident, or
No officer or personal narrative is available or is left blank, or
Vehicle was listed as “ran-off-road” but no other information
was provided, or
No indication where control was lost, for instance “driver
drove into ditch”
•
•
•
•
•
Condition S1:
In the first set of events as the vehicle leaves the roadway, any of the tires (one or more) are
shown off the edge of the pavement, or the vehicle is drawn to indicate that any of the tires are
likely to have been off the edge of the pavement
Then if:
Vehicle is roughly parallel to the edge of
pavement (approximately 20º or less)
Or if:
Initial departure angle is > 20º (approximately)
Then if:
Subsequent event shows vehicle with
one or more wheel or vehicle parallel
(20º or less) to the edge of pavement
Or if:
Vehicle leaves roadway
entirely
Then if:
Tire(s) that left pavement or vehicle are
drawn so that tire(s) appear to be close to
the edge of pavement
Or if:
Tire(s) that left pavement or vehicle
are drawn so that tire(s) are not close
to the edge of pavement
Then code as“Not Scrubbing”
Then code as “Potential Scrubbing” Then code as “Not Scrubbing”
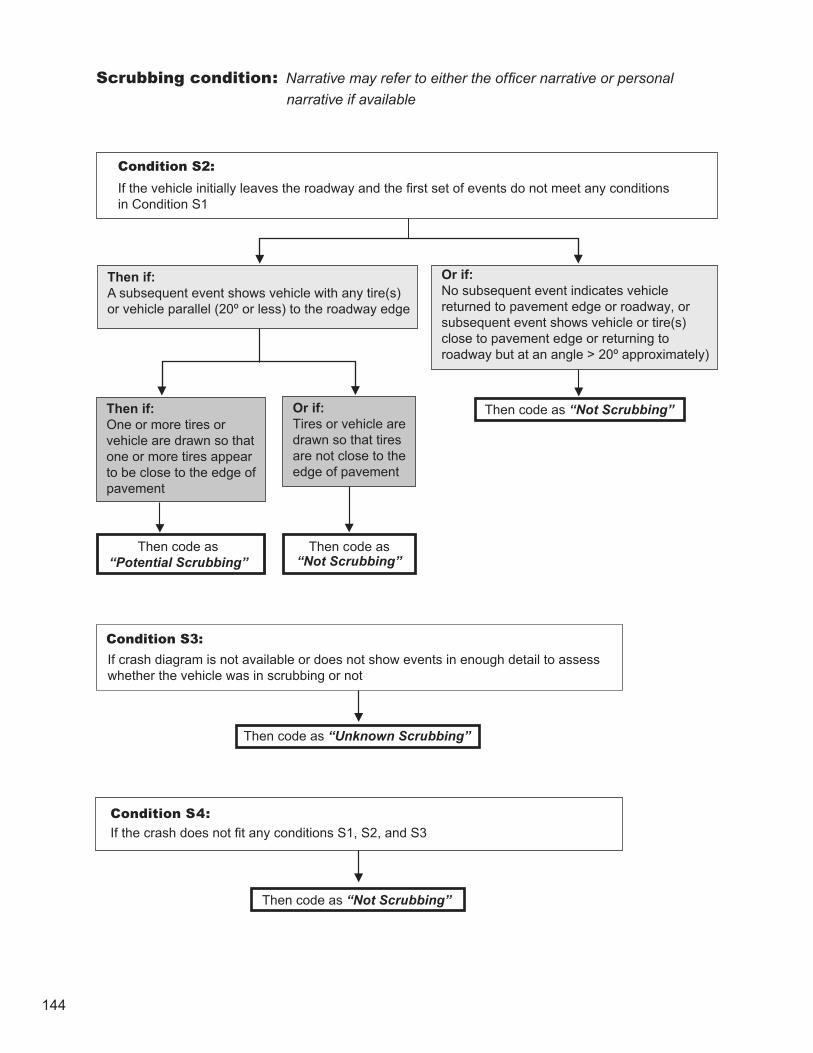
144
Scrubbing condition: Narrative may refer to either the officer narrative or personal narrative if available
Then code as “Not Scrubbing”
Then code as “Not Scrubbing”
Condition S2:
If the vehicle initially leaves the roadway and the first set of events do not meet any conditions
in Condition S1
Then if:
A subsequent event shows vehicle with any tire(s)
or vehicle parallel (20º or less) to the roadway edge
Or if:
No subsequent event indicates vehicle
returned to pavement edge or roadway, or
subsequent event shows vehicle or tire(s)
close to pavement edge or returning to
roadway but at an angle > 20º approximately)
Then if:
One or more tires or
vehicle are drawn so that
one or more tires appear
to be close to the edge of
pavement
Or if:
Tires or vehicle are
drawn so that tires
are not close to the
edge of pavement
Then code as
“Potential Scrubbing”
Then code as “Unknown Scrubbing”
Condition S3: If crash diagram is not available or does not show events in enough detail to assess
whether the vehicle was in scrubbing or not
Then code as “Not Scrubbing”
Condition S4:
If the crash does not fit any conditions S1, S2, and S3